My Account
My Slides
Search by Category
Templates
View All Templates
Download Template Slides
Leave Feedback
Login
Logout
Get Started
Browse all Slides
Browse all Slides
Create a FREE Account
Instant access to 1,000+ real slides from top companies like McKinsey, BCG, Goldman Sachs, Google and many more!
First Name
Last Name
Email
Password
I agree to all
Terms & Privacy Policy
Thank you! Your submission has been received!
Oops! Something went wrong while submitting the form.
Have an account?
Sign in
Instant access to the internet's best slides
Get access to 40+ advanced filters and more
Advanced Search and Filters
Access to
10,000+ slides
Access to Category Pages
Save/Bookmark Slides
PowerPoint Template Library (New)
Choose your plan
MONTHLY
$12/month
Billed every month, cancel anytime.
YEARLY
$9/month
Billed $108 annually, cancel anytime.
Checkout for $12/month
Checkout for $108/yr
Secured by Stripe | AES-256 bit encryption
Spark Your Next Big Idea with New Presentation Templates
VIEW ALL Templates
Welcome,
Welcome
Upgrade to SlideStart
Pro
Instant access to 15,000+ slides
Show Featured Only
Checkbox 8
Companies
Mckinsey
Bain
BCG
EY
Deloitte
Accenture
PwC/Strategy&
JP Morgan
Goldman Sachs
Morgan Stanley
Citigroup
Deutsche Bank
Barclays
LEK
Kearney
Oliver Wyman
Booz Allen Hamilton
Gartner
IPSOS
Nielsen
Slide type
Header Horizontal
Framework
Vertical Flow
Single Chart
Single Chart
Text Only
Mixed Chart
Header Vertical
Graphic
Pillar
Multiple Chart
Agenda
Title
Table
Linear Flow
Upgrade to SlideStart
Pro
Instant access to 40+ advanced filters
Industry
Upgrade to SlideStart
Pro
Instant access to 40+ advanced filters
Technology
Healthcare
Financial Services
Consumer Goods
Energy & Utilities
Manufacturing
Retail
E-commerce
Logistics
Telecommunications
Real Estate
Professional Services
Education
Media
Entertainment
Hospitatlity
Tourism
Agriculture
Food Production
Government & Public Sector
Environmental
Sustainability
Use Case
Upgrade to SlideStart
Pro
Instant access to 40+ advanced filters
Sales and Business Development
Mergers and Acquisitions
Corporate Finance and Valuation
Performance Metrics and KPIs
Client Case Studies
Competitive Landscape
Product and Service Analysis
Customer and Market Segmentation
Organizational Structure
Human Resources and Talent Management
Industry Overview
Regulatory and Compliance
Risk Assessment and Management
Agriculture & Food Production
Hospitality and Tourism
Government
Environmental
Sustainability
Clear all
Thank you! Your submission has been received!
Oops! Something went wrong while submitting the form.
Show Featured Only
Checkbox 8
Companies
Mckinsey
Bain
BCG
EY
Deloitte
Accenture
PwC/Strategy&
JP Morgan
Goldman Sachs
Morgan Stanley
Citigroup
Deutsche Bank
Barclays
LEK
Kearney
Oliver Wyman
Booz Allen Hamilton
Gartner
IPSOS
Nielsen
Slide type
Text Only
Linear Flow
Vertical Flow
Single Chart
Header Horizontal
Mixed Chart
Header Vertical
Pillar
Multiple Chart
Graphic
Agenda
Title
Table
Framework
Industry
Technology
Healthcare
Financial Services
Consumer Goods
Energy & Utilities
Manufacturing
Retail
E-commerce
Logistics
Telecommunications
Real Estate
Professional Services
Education
Media
Entertainment
Hospitatlity
Tourism
Agriculture
Food Production
Government & Public Sector
Environmental
Sustainability
Use Case
Sales and Business Development
Mergers and Acquisitions
Corporate Finance and Valuation
Performance Metrics and KPIs
Client Case Studies
Competitive Landscape
Product and Service Analysis
Customer and Market Segmentation
Organizational Structure
Human Resources and Talent Management
Industry Overview
Regulatory and Compliance
Risk Assessment and Management
Agriculture & Food Production
Hospitality and Tourism
Government
Environmental
Sustainability
Clear all
Thank you! Your submission has been received!
Oops! Something went wrong while submitting the form.
Tag
View slide
Column charts comparing financial ratios and targets over time. Simple and clean layout.
Financial Performance
Energy & Utilities
Analyzes the financial strength of the company, highlighting debt management and financial targets.
financial, strength, debt, targets, management
false
Financial Strength Prudent funding and balance sheet managementInvestment Community Presentation Barclays Energy Conference
Mixed Chart
Barclays
View slide
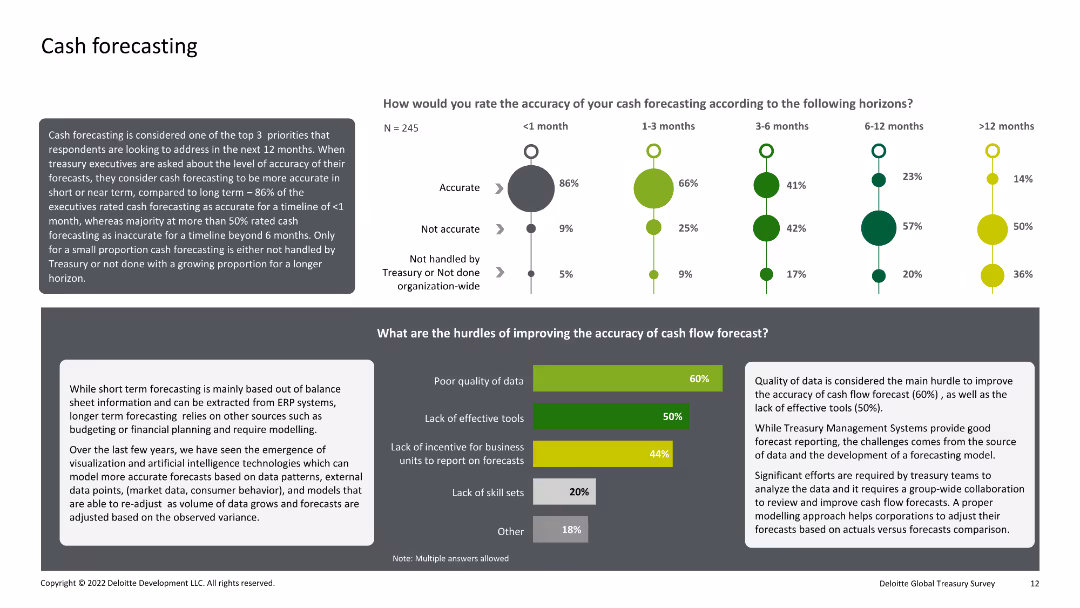
Combination of text, bar charts, and dot plots. The slide evaluates the accuracy of cash forecasting over different time horizons and identifies the main hurdles to improving forecasting accuracy.
Financial Performance
Financial Services
This slide analyzes the accuracy of cash forecasting within organizations over various time horizons and identifies key obstacles to improving this accuracy, such as poor data quality and lack of effective tools.
Cash, Forecasting, Accuracy, Hurdles, Improvement
false
Cash forecastingDeloitte Global Treasury Survey
Multiple Chart
Deloitte
View slide
The slide displays a complex bar chart categorizing employment by job role across different countries, accompanied by a text block for detailed explanation.
Market Analysis and Trends
Technology & Software
This slide analyzes job roles distribution by role cluster, using statistical analysis to predict the impact of intelligent technologies in various industries. It is useful for strategic workforce planning and analysis.
Employment, Job Roles, Intelligent Technologies, Workforce Planning, Analysis
false
Appendix 3Bridging the Skills Gap in the Future Workforce
Single Chart
Accenture
View slide
Bar charts on the slide show changes in the importance of constant access to a private vehicle post-crisis, segmented by age and gender.
Market Analysis and Trends
Transportation & Logistics
Discusses how the importance of access to private vehicles has changed among different demographics post-crisis.
private vehicles, access importance, demographics, crisis
false
Regular disinfection and spacial distancing are seen as the most effective measures to reduce risk of infectionCOVID-19 Auto & Mobility Consumer Insights
Multiple Chart
McKinsey
View slide
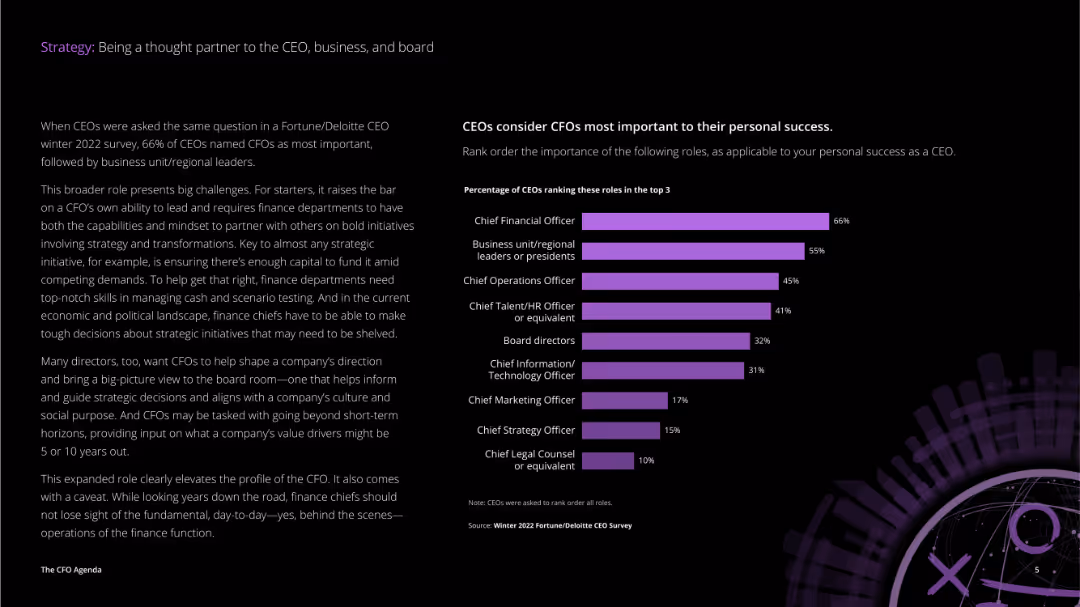
This slide includes a detailed text on the left explaining CFO roles and a column chart on the right showing the importance of different roles to CEOs' success.
Strategic Planning
Professional Services
The slide explains the critical roles CFOs play in business strategy and decision-making, emphasizing the importance of their relationships with CEOs and other business leaders to their success.
strategy, CFO, CEO, business, board, roles, success, importance, relationships, strategic partner
false
CEOs consider CFOs most important to their personal success.The CFO Agenda 2023
Mixed Chart
Deloitte
View slide
This content slide includes a mix of text, a photo of a worker with wind turbines, and a column chart displaying economic, energy, and emissions trends under three scenarios. The design is moderately dense with detailed information.
Market Analysis and Trends
Environmental Services & Sustainability
The slide outlines how green climate action can decouple GDP growth from emissions and energy consumption. It compares three scenarios for global economic growth and emissions trends up to 2050, showing the potential benefits of transitioning to renewable energy sources and improving energy efficiency.
Climate, Emissions, GDP, Energy, Sustainability
false
The great decoupling of emissions and growthThe green transition
Multiple Chart
EY
View slide
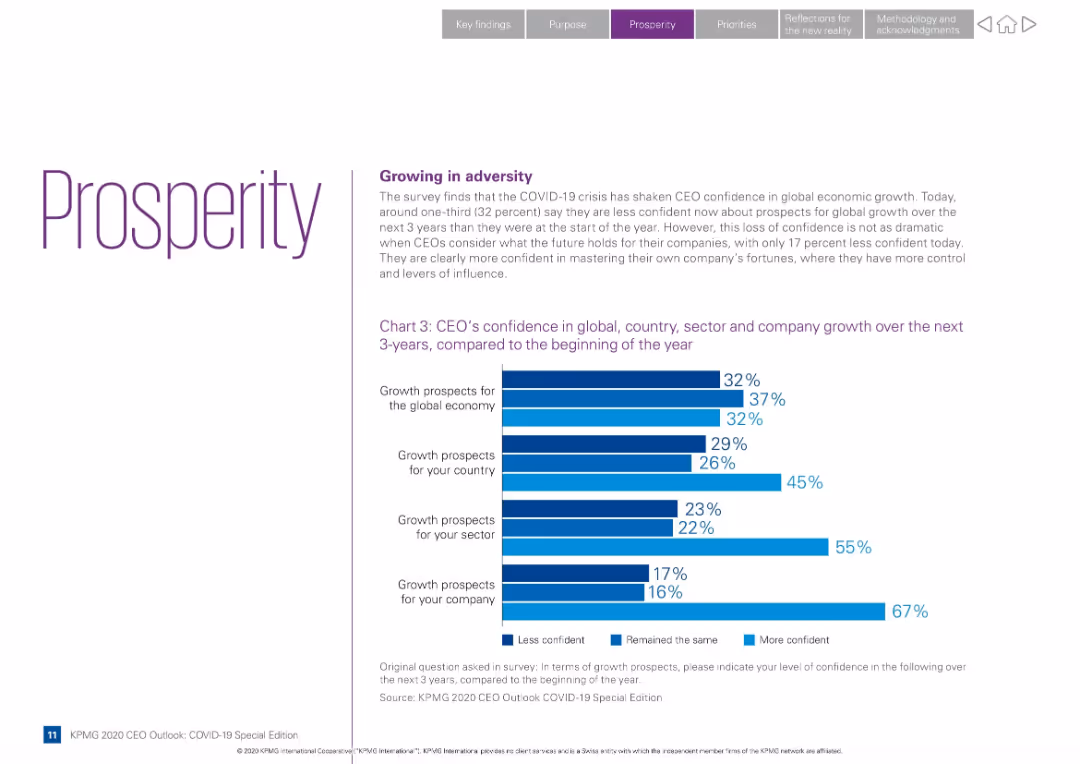
Minimalist design with purple branding; includes a bar chart comparing confidence levels in different growth areas
Strategic Planning
Professional Services
Examines how COVID-19 has affected CEO confidence in economic growth. Bar chart compares current confidence in global, country, sector, and company growth vs. start-of-year expectations.
economic outlook, CEO confidence, COVID-19, global growth, sector confidence, bar chart, future expectations, business prospects
false
Growing in adversityKPMG 2020 CEO Outlook: COVID-19 Special Edition
Mixed Chart
KPMG
View slide
Features percentage data with bar charts and icons to emphasize the increase in online shopping for essentials, particularly groceries, in Southeast Asia.
Market Analysis and Trends
Retail & E-commerce
Highlights the mainstream adoption of online shopping for essential goods, such as groceries, in Southeast Asia, underscoring the impact of digital adoption on consumer habits.
Online shopping, essentials, groceries, mainstream, Southeast Asia
false
Five years of digital transformation in a single yearDigital Consumers of Tomorrow, Here Today: A SYNC SOUTHEAST ASIA REPORT
Single Chart
Bain
View slide
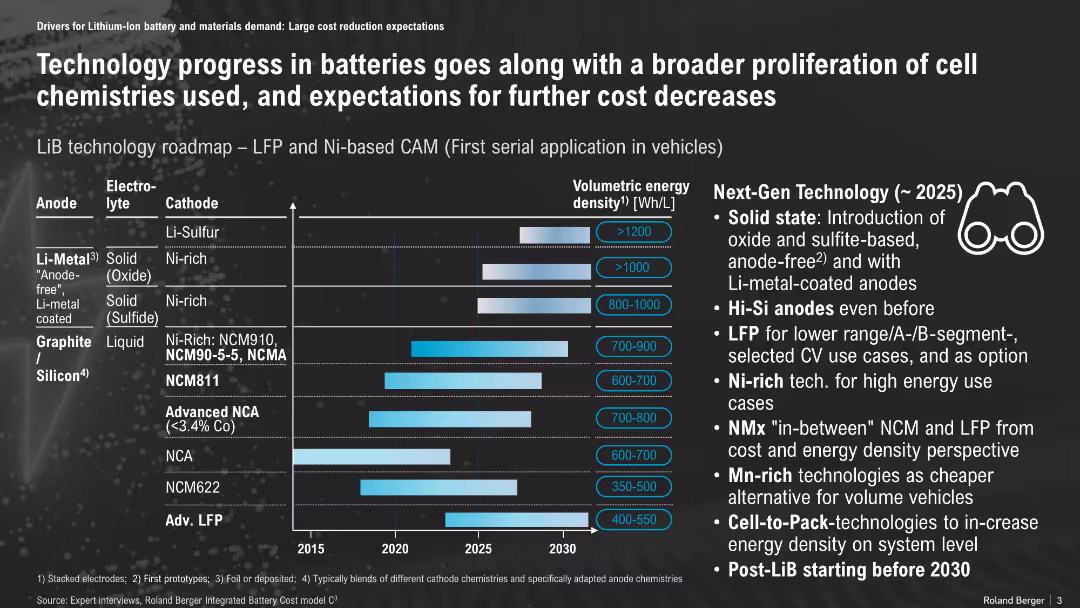
Horizontal timeline with bar chart, matrix of anode/electrolyte/cathode types and energy density projections; icons and callouts on the right
Technology and Digital Transformation
Energy & Utilities
The slide presents a roadmap of lithium-ion battery technologies, showing progress in energy density from different material combinations and their expected commercialization timeline. It emphasizes upcoming advancements like solid-state batteries, Hi-Si anodes, and LFP for specific vehicle segments.
Li-ion, battery roadmap, solid-state, energy density, LFP, NCM, anode, cathode, vehicle, cost reduction
false
Technology progress in batteries goes along with a broader proliferation of cell chemistries used, and expectations for further cost decreasesThe Lithium-Ion (EV) battery market and supply chain
Mixed Chart
Roland Berger
View slide
Horizontal bar chart by country. Teal (agree) values are low globally. Standardized layout with question and source text on left.
Market Analysis and Trends
Healthcare & Pharmaceuticals
The slide analyzes value alignment between the public and the pharmaceutical industry. Globally, agreement is low, with few countries above 40%. Only Saudi Arabia, China, and India show high congruence in values, while France and Belgium show the least.
value alignment, public trust, pharma, sentiment, healthcare, Ipsos data, personal values, ethics, perception, agreement
false
Pharmaceuticals – It shares my valuesIPSOS GLOBAL TRUSTWORTHINESS MONITOR January 2023
Mixed Chart
IPSOS
View slide
Features text with a line chart showing projected temperature anomalies under different emissions pathways from 2020 to 2100.
Strategic Planning
Environmental Services & Sustainability
Emphasizes the necessity of committing to net zero emissions to prevent climate damage, highlighting the significant impacts of inaction on future temperatures.
Net zero, climate change, emissions, temperature, projection, pathway, 2100, sustainability
false
There is no status quo optionEssential, expensive and evolving: The outlook for carbon credits and offsets
Mixed Chart
EY
View slide
Standard split: text left, chart with purple bars right showing survey responses.
Operational Efficiency
Industrial & Manufacturing
Defines physical copilots (robots, exoskeletons) that collaborate with humans. It features Sanctuary AI’s Phoenix robot as an example and shows how executives expect to leverage these robots, especially for dull or repetitive tasks.
Copilots, physical automation, Sanctuary AI, Phoenix robot, collaboration
false
Physical CopilotsAI: A Declaration of Autonomy
Mixed Chart
Accenture
View slide
Two column charts showing UK headline inflation breakdown and UK goods and services inflation from Jan '21 to Jan '24 and 1989 to 2024 respectively. Different colors represent core services, core goods, food, alcohol, tobacco, etc.
Market Analysis and Trends
Financial Services
This slide provides a detailed analysis of UK inflation trends, showing the breakdown of headline inflation by various components and comparing goods and services inflation over time. Used for inflation trend analysis and forecasting.
Inflation, UK, headline, goods, services, trends
false
UK headline inflation breakdownGuide to the Markets UK | Q2 2024
Multiple Chart
JP Morgan
View slide
Bar chart ranked by % point difference between perceived and actual values, with numeric deltas noted.
Market Analysis and Trends
Professional Services
This slide quantifies the disparity between public perception and reality by displaying the difference (in percentage points) between the guessed and actual wealth share of the top 1%. Countries are sorted from most overestimated to underestimated.
perception gap, wealth distribution, misperception, inequality, data gap, top 1%, global comparison, Ipsos, survey error
false
What percentage of your country's total household wealth do you think is owned by the top 1% of richest households?PERILS OF PERCEPTION
Mixed Chart
IPSOS
View slide
Features bar charts showing the difference in data and business intelligence maturity between leaders and laggards.
Operational Efficiency
Technology & Software
Discusses the integration of data sources and the use of analytics in making business decisions, highlighting gaps in daily practices.
data integration, analytics, business intelligence, decision-making, bar chart
false
While most firms tap into multiple data sources, leaders enable high-frequency integration and analysis which drives key business decisionsA DATA DRIVEN APPROACH TO IMPROVE CUSTOMER ENGAGEMENT
Multiple Chart
BCG
View slide
The slide uses a column chart to show the main barriers preventing EV purchases, such as charging duration, range, and battery lifetime. It includes regional comparisons indicated by colored bars for APAC, EMEA, and North America.
Market Analysis and Trends
Transportation & Logistics
This slide analyzes the key barriers to EV adoption, focusing on issues like charging duration, range, and battery lifetime. It provides regional data to show how these barriers vary across different areas.
EV barriers, column chart, charging duration, battery lifetime
false
Charging duration, range and battery lifetime are the key barriers stopping EV prospects from purchasing an EV4th edition eReadiness 2023
Single Chart
PwC/Strategy&
View slide
The slide features a mix of text and a column chart. The text discusses various constraints in risk management. The column chart quantifies responses related to constraints such as budget and relevant technology expertise.
Risk Assessment and Management
Financial Services
The slide provides insights into the challenges CROs face in advancing risk management, highlighting budget constraints, technology expertise, and change management. It is used to analyze the factors affecting digital transformation in risk management.
risk management, CROs, digital transformation, budget, technology expertise, change management
false
Figure 26. What are the top constraints your company will face in accelerating digital transformation of the second line of defense/ risk management?Risk management in a time of transformation
Mixed Chart
EY
View slide
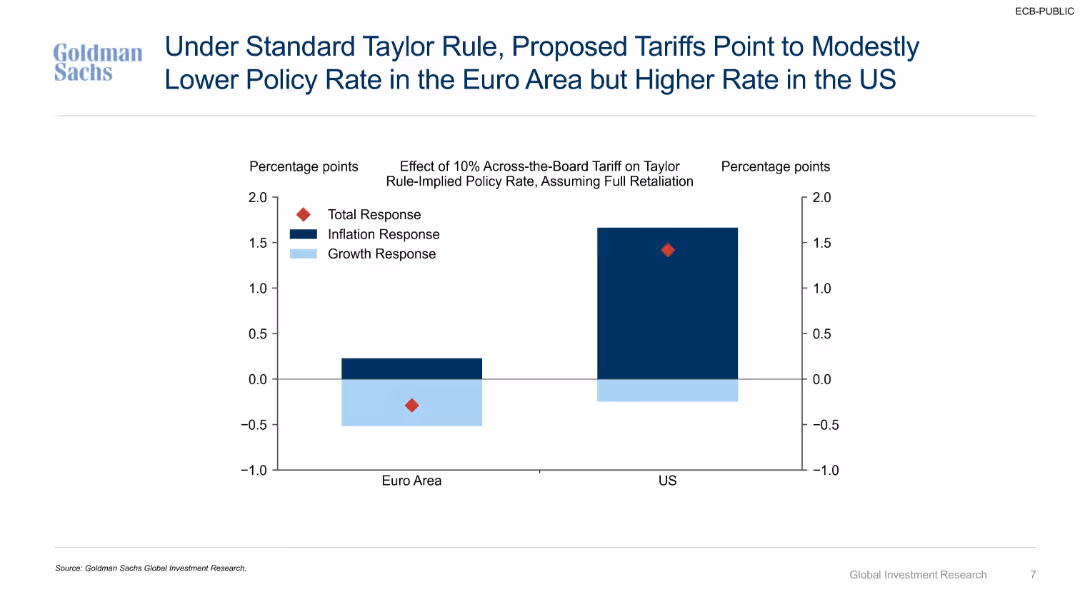
Two-bar comparative chart with color-coded segments (Inflation, Growth, Total response) for Euro Area and US. Branded by Goldman Sachs.
Investment Analysis
Financial Services
This slide shows the impact of a 10% tariff (with retaliation) on Taylor Rule-implied policy rates. It indicates that tariffs would lower rates in the Euro area while raising them in the US, due to differences in inflation and growth responses.
tariffs, Taylor Rule, interest rates, Euro Area, US policy, inflation, growth, Goldman Sachs, monetary policy
false
Under Standard Taylor Rule, Proposed Tariffs Point to Modestly Lower Policy Rate in the Euro Area but Higher Rate in the USImplications of Higher Tariffs for Euro Area and US Monetary Policy
Single Chart
Goldman Sachs
View slide
Contains multiple horizontal bar charts showing the percentage of respondents engaging in various business functions like Finance, HR, IT, and more. There is also a comparative analysis of these functions over the years 2019, 2021, and 2023.
Market Analysis and Trends
Professional Services
Presents a breakdown of key functions within GBS organizations, tracking changes in function focus and importance over time.
GBS, functions, finance, HR, IT, trend analysis
false
What functions are performed by GBS organizations?2023 Global Shared Services and Outsourcing Survey
Mixed Chart
Deloitte
View slide
Features a pie chart showing the percentage of people using Generative AI for work, with a bar chart for specific purposes like personal, work, and education.
Market Analysis and Trends
Technology & Software
Highlights the adoption of Generative AI tools in professional contexts, estimating the number of users and their application areas.
Generative AI, workplace adoption, professional use, technology impact, user statistics
false
Four million people in the UK have used Generative AI for workDigital Consumer Trends 2023
Mixed Chart
Deloitte
View slide
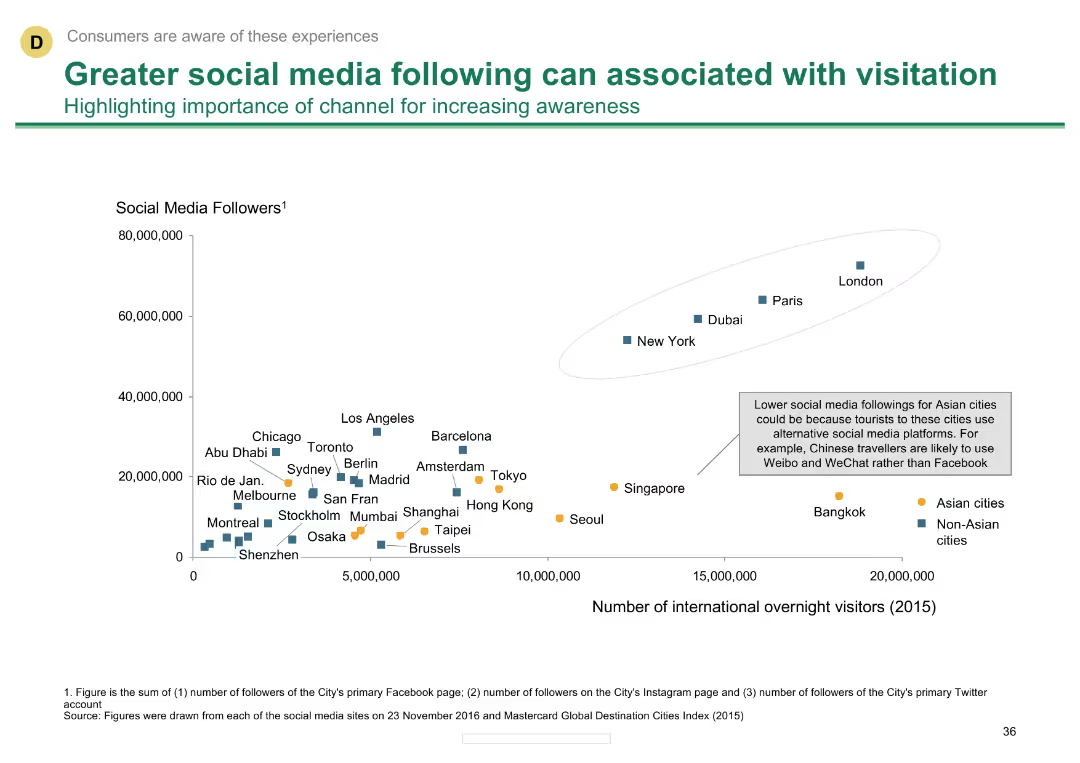
Scatter plot showing social media followers vs. number of international overnight visitors
Customer and Market Segmentation
Hospitality & Tourism
Highlights the correlation between a city's social media following and its number of international visitors.
Social media, visitation, correlation, international visitors, city comparison
false
Greater social media following can associated with visitationMelbourne as a Global Cultural Destination
Single Chart
BCG
View slide
A column chart showing total usage of the TV screen by various viewing activities in January 2021 and January 2022, with color-coded categories.
Market Analysis and Trends
Media & Entertainment
The slide highlights the increasing share of connected TV (CTV) and time-shifting in total TV screen usage, reflecting changes in viewing habits over the past year.
CTV, television, usage, viewing habits, trends
false
CTV continues to garner share of the television screen, among all viewersSpring 2022 National Client Meeting
Mixed Chart
Nielsen
View slide
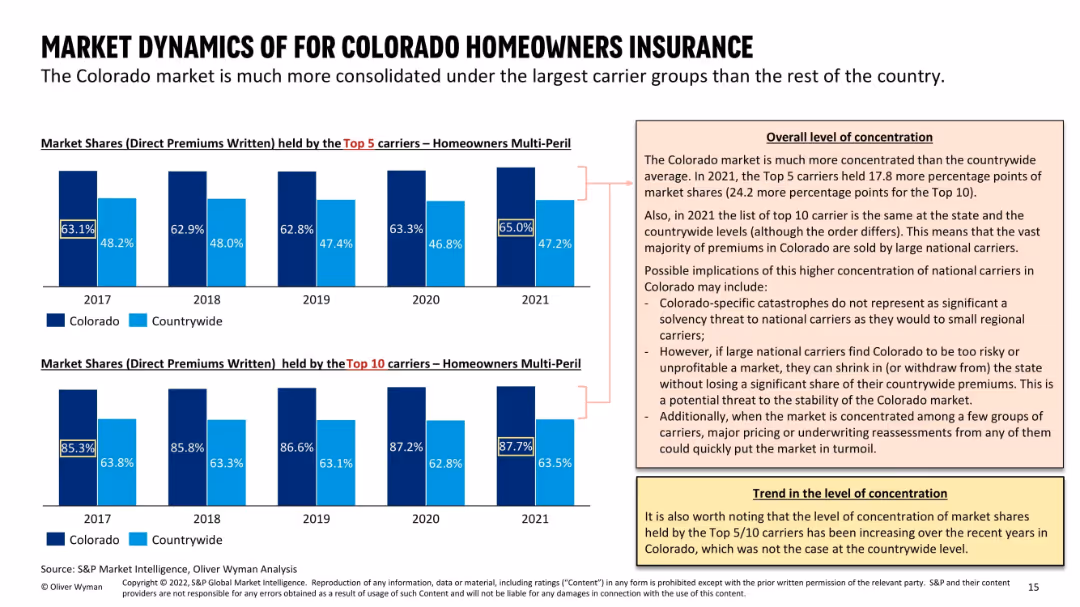
Dual bar charts comparing Colorado vs countrywide market share of top 5 and top 10 carriers (2017–2021); two callout boxes explain implications and trends; consistent dark/light blue coloring.
Market Analysis and Trends
Financial Services
The slide demonstrates a highly consolidated homeowners insurance market in Colorado, where top 5/10 carriers dominate more than the national average. This concentration raises potential volatility if major carriers shift their strategies. The analysis flags implications for market stability and strategic exposure for national carriers operating in the state.
market concentration, carrier share, homeowners insurance, Colorado, top 10 carriers, national vs state, volatility, strategic withdrawal
false
MARKET DYNAMICS OF FOR COLORADO HOMEOWNERS INSURANCEHomeowner availability study
Multiple Chart
Oliver Wyman
View slide
The slide shows a balance sheet summary with column chart for assets and liabilities, emphasizing different categories with color coding. Key highlights offer insights into the balance sheet management strategies.
Operational Efficiency
Financial Services
This slide outlines the structure of a conservatively managed balance sheet, highlighting key asset and liability segments and their implications for financial stability and growth strategies. It underscores the importance of conservative financial management practices.
balance sheet, assets, liabilities, financial, management
false
Conservatively managed balance sheet Net1 in € bn, as of September 30, 2023Q3 2023 Fixed Income Investor Conference Call
Multiple Chart
Deutsche Bank
View slide
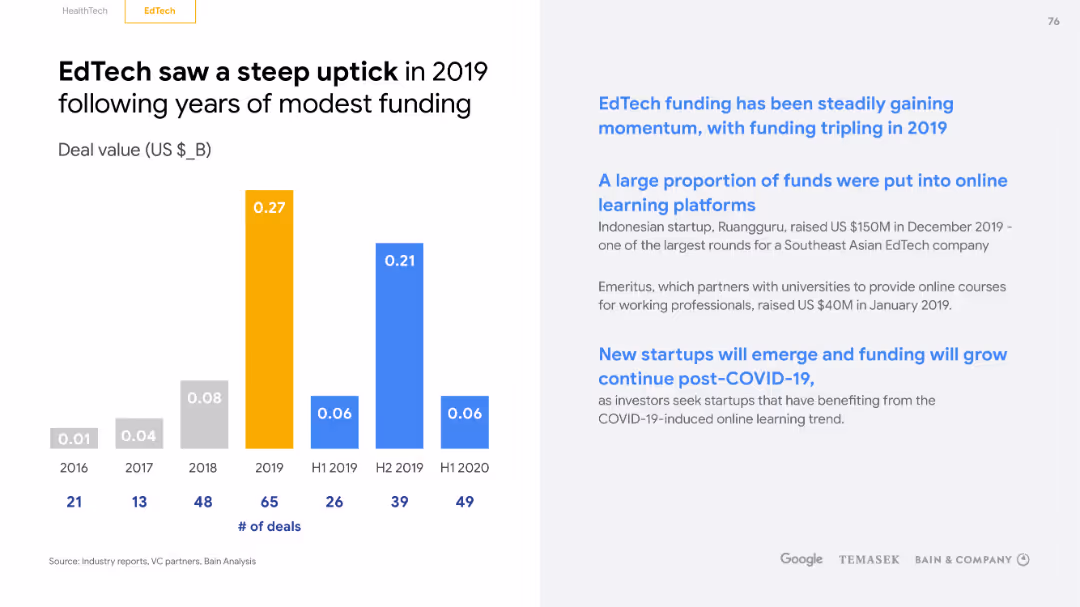
A dual-colored column chart displays EdTech funding over years with annotations. The layout includes a title at the top and a footnote, with a yellow and blue theme.
Investment Analysis
Education & Training
The slide highlights a significant increase in EdTech funding, particularly in 2019, and discusses the types of platforms that received investment, suggesting ongoing momentum and the potential for new startups in the post-COVID era.
EdTech, Funding, Increase, Investment, Startups, COVID-19, Platforms, Momentum, Growth, Potential
false
EdTech saw a steep uptick in 2019 following years of modest fundinge-Conomy SEA 2020 At full velocity: Resilient and racing ahead
Single Chart
Bain
View slide
Two-column layout with textual content on the left and a table comparing FY20 and FY21 guidance on the right. Shades of gray and blue are used for text and table elements respectively.
Financial Performance
Financial Services
Details fiscal updates, affirms segment profit guidance, and indicates an increase in NPAT guidance. It's a deep dive into financial adjustments, explaining changes in projections with a focus on integration and transition costs.
NPAT, Segment Profit, Guidance, ETR, ROIC
false
Segment Profit guidance affirmed. NPAT guidance increased by $14mGoldman Sachs emerging leaders conference
Mixed Chart
Goldman Sachs
View slide
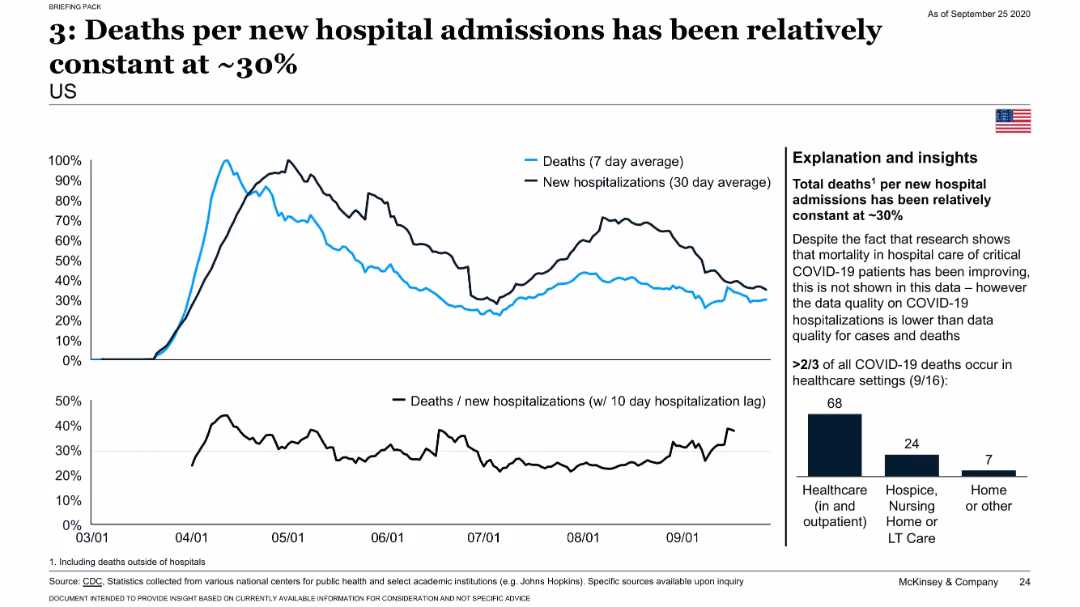
Line graphs showing trends in deaths and new hospitalizations; includes a smaller chart showing ratio of deaths to hospitalizations and a bar graph of death settings.
Risk Assessment and Management
Healthcare & Pharmaceuticals
Despite improvements in hospital care, the ratio of deaths to new hospital admissions has remained around 30%. The slide also reveals that two-thirds of COVID-19 deaths occurred in healthcare settings, emphasizing the strain on medical infrastructure.
hospitalizations, mortality rate, COVID-19, care quality, data quality
false
3: Deaths per new hospital admissions has been relatively constant at ~30%COVID-19: Briefing materials
Multiple Chart
McKinsey
View slide
Two donut charts comparing the types of ads in podcasting for 2017 and 2018 with annotations and color coding.
Market Analysis and Trends
Media & Entertainment
Details the types of podcast ads used over 2017 and 2018, showing a preference for host-read ads and a decline in announcer-read/pre-produced ads.
Podcast, Advertising, Host-Read, Announcer-Read, 2017, 2018
false
Revenue by Ad Type – 2017 to 2018IAB FY 2018 Podcast Ad Revenue Study
Multiple Chart
PwC/Strategy&
View slide
This slide has a dual-column format with bullet points. The left column lists customer and client experiences improvements under different bank divisions, while the right column highlights product and platform development initiatives. Each section includes relevant icons and a succinct description.
Strategic Planning
Technology & Software
This slide discusses a $4.1B investment across various business segments, aimed at enhancing customer experiences and driving returns through product development.
Investment, Client Experience, Product Development, Financial Services, Strategy, Banking Sectors, Innovation, Returns
false
Our $4.1B investment across the businesses will directly drive returnsGlobal Technology
Table
JP Morgan
View slide
Features a line chart showing investment projections over 20 years under low and high growth scenarios, with key projects listed. Visuals include icons and highlighted text boxes.
Investment Analysis
Energy & Utilities
Examines potential economic impacts of proposed oil and gas investments, detailing low and high growth scenarios and listing key projects in development.
Investment, Growth Scenarios, Economic Impact, Oil and Gas, Western Australia, Key Projects, Future Capacity
false
There are strong investment opportunities for Western Australia’s oil and gas industryThe economic contribution of Western Australia’s oil and gas industry
Mixed Chart
EY
View slide
This slide has three bar charts illustrating the expected impact of Generative AI on workforce productivity, cost savings, and productivity enhancements across front and back office functions. Additional details are provided below the charts.
Operational Efficiency
Financial Services
The slide discusses the expected workforce impacts and productivity enhancements from GenAI implementation. It presents data on front and back office impacts, including productivity gains and cost savings.
workforce, productivity, cost savings, GenAI, front office, back office, survey, financial services
false
Impacts to workforce, productivity enhancements and cost savings are expected to be larger across the back officeGenerative AI in wealth and asset management
Multiple Chart
EY
View slide
Highlights strategic decisions related to market exits in Asia and EMEA with financial impacts summarized in tabular and text form.
Strategic Planning
Financial Services
Discusses Citigroup's strategic exits from consumer banking in certain Asia and EMEA markets, including financial impacts and timelines.
Strategy, Banking, Asia, EMEA, Exits
false
Strategy Refresh – 13 Asia and EMEA Consumer Banking Exit UpdateFourth Quarter 2021 Earnings Results Presentation
Header Vertical
Citigroup
View slide
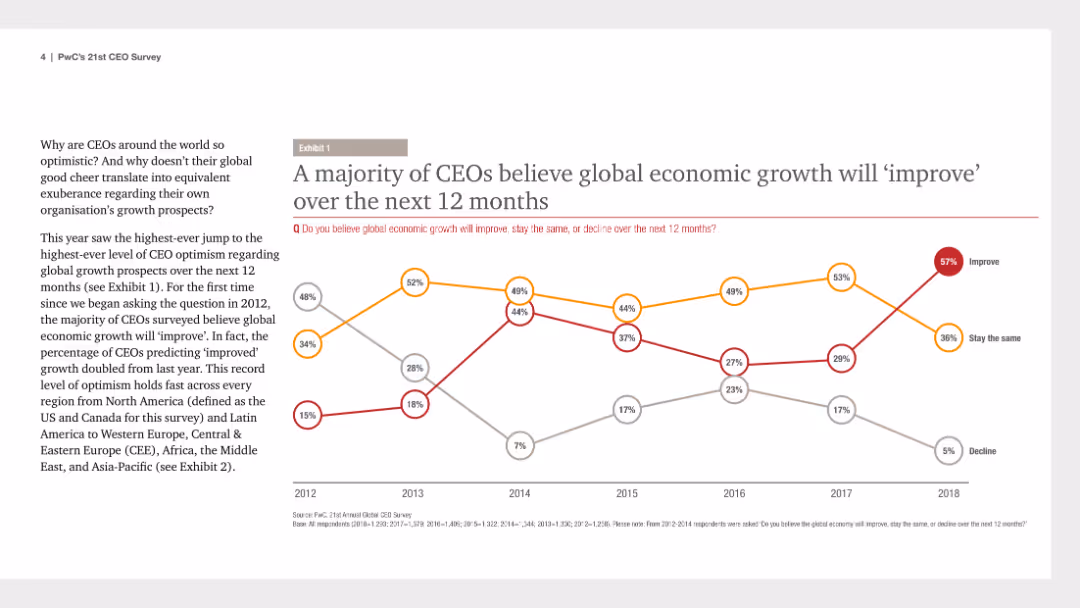
Line chart showing CEO survey results on expected global economic growth from 2012 to 2018, with lines representing different responses (improve, stay the same, decline).
Market Analysis and Trends
Financial Services
Survey results showing CEO optimism about global economic growth over the next year, based on responses from 2012 to 2018.
CEO survey, economic growth, 2012-2018, optimism
false
A majority of CEOs believe global economic growth will ‘improve’ over the next 12 months21st CEO Survey The Anxious Optimist in the Corner Office
Mixed Chart
PwC/Strategy&
View slide
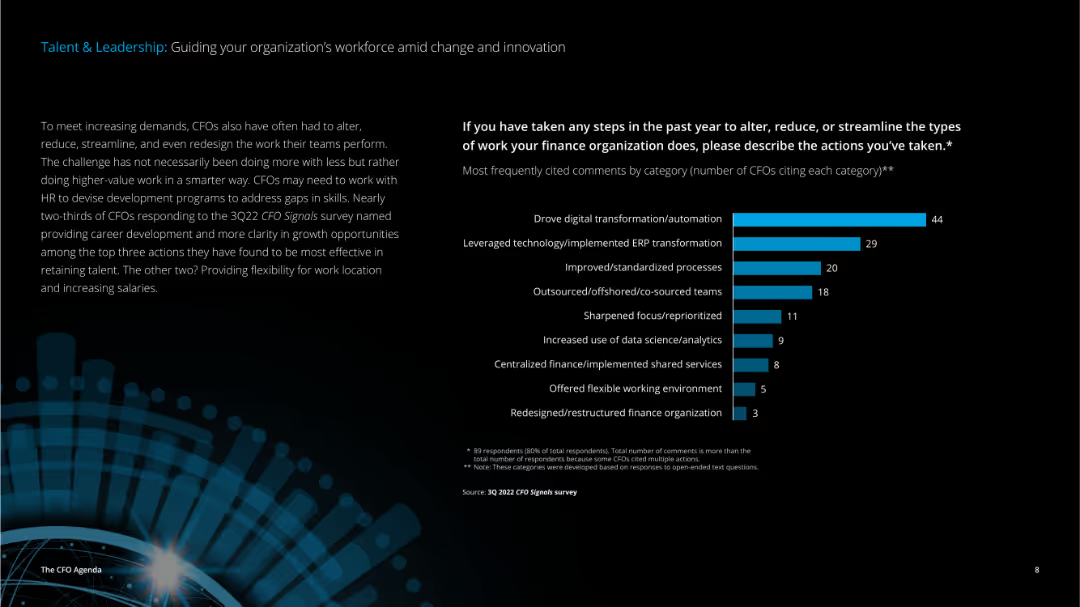
The slide has a detailed text on the left discussing CFO responsibilities and a vertical column chart on the right showing actions taken to streamline finance operations.
Human Resources and Talent Management
Professional Services
This slide outlines the steps CFOs have taken to improve finance operations, focusing on digital transformation, ERP implementation, and process improvements to better manage workforce changes and innovations.
talent, leadership, workforce, innovation, CFO, digital transformation, ERP, process improvement, finance operations
false
If you have taken any steps in the past year to alter, reduce, or streamline the types of work your finance organization does, please describe the actions you’ve taken.*The CFO Agenda 2023
Mixed Chart
Deloitte
View slide
The slide showcases a bar graph with strategies being adopted post-pandemic, ranging from enclosed to open workspaces. Darker bars indicate a greater number of spaces, lighter bars represent fewer spaces, and a yellow line signifies uncertainty.
Strategic Planning
Professional Services
Strategic workplace adaptations are outlined, suggesting a focus on collaboration and flexibility. The chart reflects corporate strategic planning in response to changing work patterns.
Work Models, Strategic Planning, Collaboration, Workplace Design, Pandemic Response
false
Leaders are becoming more strategic about working models.Future Workplace Index 2.0
Single Chart
EY
View slide
The slide presents a three-column layout with icons and bullet points on the left, a central section with four bar graphs, and a right column showing a list of financial data comparing 2022 to 2017.
Financial Performance
Financial Services
The slide highlights the business strengths, presence, and financial growth of a securities service provider, showing service delivery, client statistics, revenue, and market share among other financial data.
Services, Revenue, Clients, Markets, Growth
false
Securities Services is a leading provider, delivering strong financial performance and consistent market share growthInverstors Day 2023
Table
JP Morgan
View slide
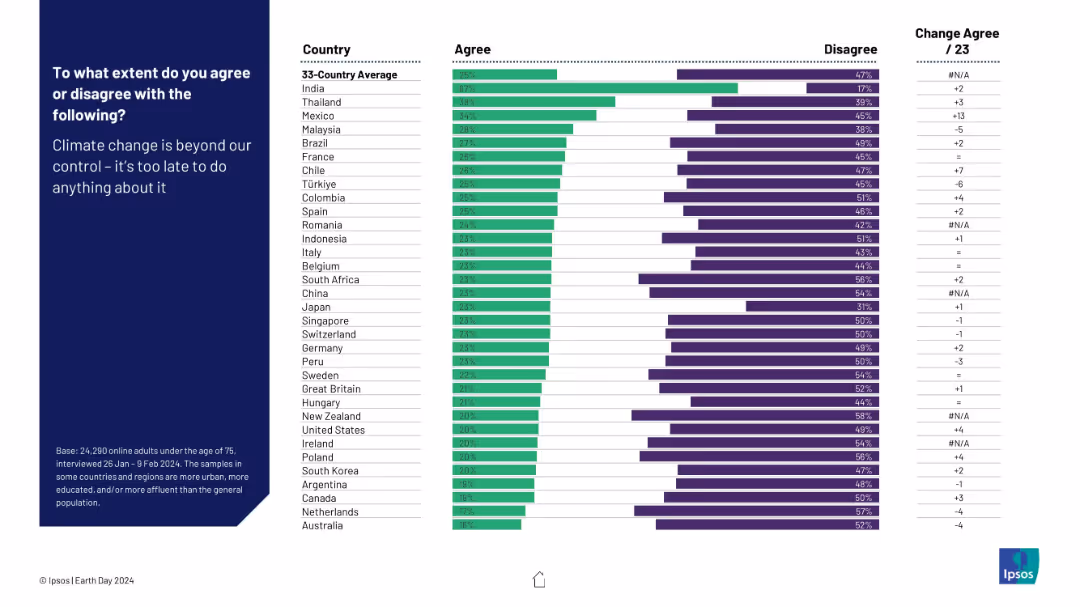
Horizontal bar chart of agreement by country on climate fatalism. Standard chart layout with bars, ranks, and text left-aligned.
Risk Assessment and Management
Environmental Services & Sustainability
This slide shows the level of climate fatalism—whether people think it's too late to stop climate change. Country responses range from resignation to optimism.
climate fatalism, urgency, climate control, belief systems, Ipsos, pessimism, public attitude
false
Climate change is beyond our control…EARTH DAY 2024
Mixed Chart
IPSOS
View slide
Features multiple small column charts detailing urbanization percentages in various countries by 2050, arranged by region.
Market Analysis and Trends
Government & Public Sector
Compares urbanization rates to highlight regional development and planning challenges.
urbanization, regional comparison, 2050, development
false
A closer look at selected countries reveals significant differences in the degree of urbanizationRoland Berger Trend Compendium 2030: Megatrend 1 People & Society
Multiple Chart
Roland Berger
View slide
Features comparative bar charts detailing net demand for workers by job category in 2030 under a midpoint automation scenario. It compares changes in job availability and wage impacts across different sectors, with specific focus on managers, technicians, service workers, administrative workers, and manual trades.
Human Resources and Talent Management
Industrial & Manufacturing
Highlighting the differential impacts of automation on various employment sectors, this slide forecasts both opportunities and challenges in the job market by 2030. It presents data on potential job surpluses or shortages, wage changes, and resulting shifts in income inequality, offering insights into the strategic planning necessary for labor force adaptation in an increasingly automated economy.
automation, jobs, wage impact, inequality, sectors
false
Automation could increase income inequality because of a divergence in labour demand and wagesFuture of Work Tripartite Forum: Evidence base on the Future of Work
Multiple Chart
McKinsey
View slide
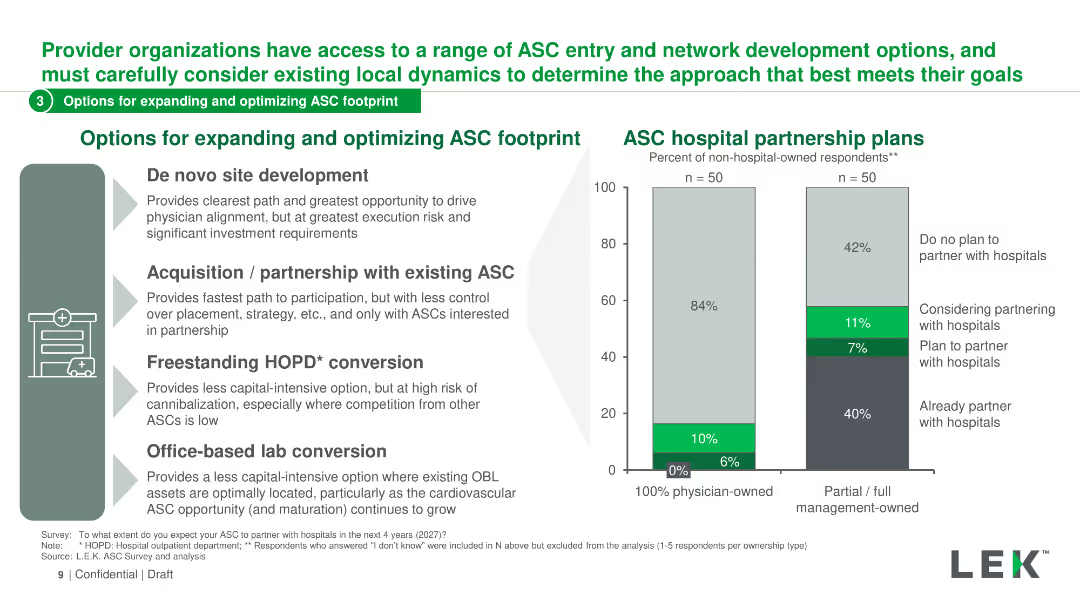
The slide features a mix of text and a column chart. The left side lists four options with icons, and the right side shows a column chart of ASC hospital partnership plans.
Strategic Planning
Healthcare & Pharmaceuticals
The slide discusses various options for expanding and optimizing the ASC footprint, including site development, partnerships, conversions, and lab conversions.
ASC, hospital, partnership, optimization, strategy
false
Provider organizations have access to a range of ASC entry and network development options, and must carefully consider existing local dynamics to determine the approach that best meets their goalsL.E.K.’s 2024 ASC Insights Study Key takeaways for provider organizations
Mixed Chart
LEK
View slide
The slide features a horizontal bar chart that displays the effectiveness of exception closure in meter point analytics. Each bar represents a different category, showing closure rates in red and green colors.
Operational Efficiency
Energy & Utilities
This slide evaluates the effectiveness of exception closures in meter point analytics, using a horizontal bar chart to compare closure rates across different categories, helping improve operational processes.
Meter Point, Analytics, Exception Closure, Effectiveness, Bar Chart
false
Additional Information Meter Point Analytics, Exception Closure Effectiveness*SAP Innovation Awards 2022 Entry Pitch Deck
Single Chart
EY
View slide
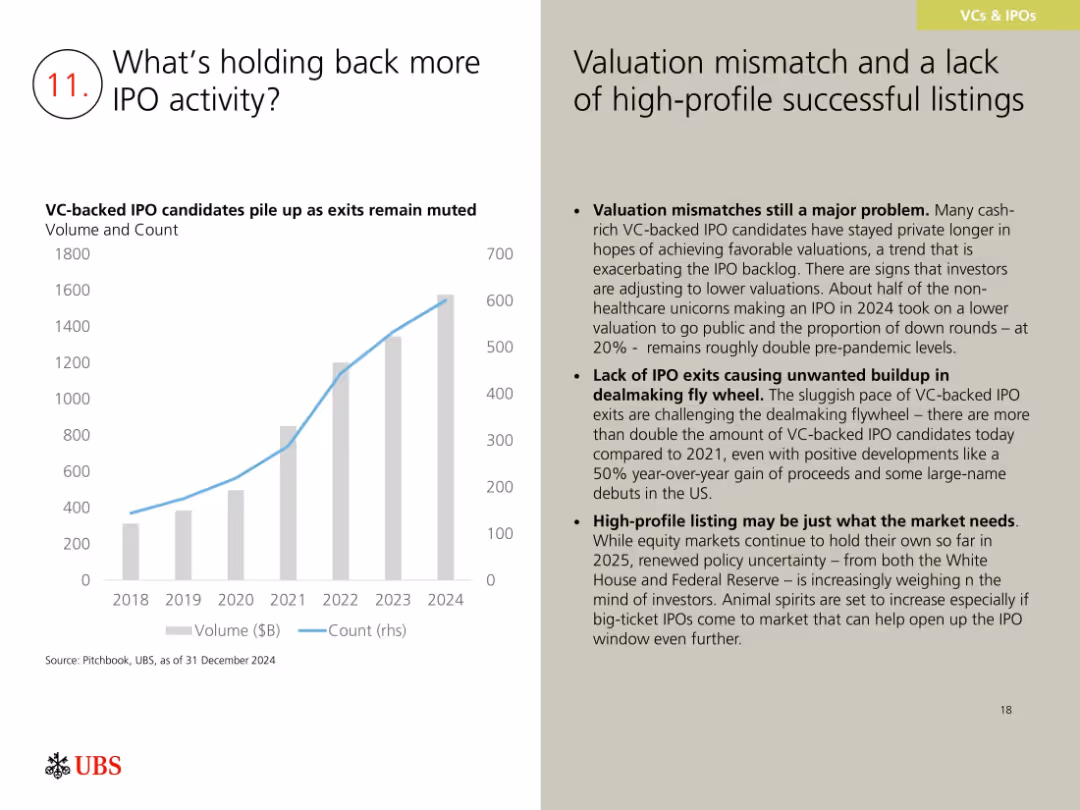
Bar and line chart showing VC-backed IPO candidate volume and count; right side has text on challenges and implications.
Market Analysis and Trends
Financial Services
This slide discusses reasons for a sluggish IPO market, citing valuation mismatches, lack of high-profile listings, and increased VC-backed company volume. While exits are slow, positive 2024 trends and investor anticipation may help re-open the IPO window in 2025.
IPO backlog, valuation mismatch, VC exits, dealmaking, 2024 outlook
false
What’s holding back more IPO activity?The CEO Macro Briefing Book
Mixed Chart
UBS
View slide
The slide includes a column chart displaying participants' views on the importance of crypto assets in the financial ecosystem, rated from 1 to 7.
Market Analysis and Trends
Financial Services
This slide assesses participants' opinions on the current significance of crypto assets within the financial ecosystem.
Financial ecosystem, crypto assets, significance, survey, participants
false
Current Role of Crypto Assets in the Financial EcosystemCRYPTO ASSET SURVEY
Mixed Chart
IPSOS
View slide
Includes column charts comparing the implementation of digital technologies like Cloud, BI, RPA, and Cognitive & AI across regions.
Operational Efficiency
Technology & Software
Discusses the lagging adoption of digital technologies in the Nordics for cost reduction compared to other regions, projected implementation over the next 24 months, and the success outcomes of these technologies.
Digital Adoption, Cost Reduction, Technology Implementation, Nordic
false
The role of digital enablersin reducingcostsStrategic Cost Transformation Grab’n Go session
Multiple Chart
Deloitte
View slide
Circular diagram in the center with surrounding logos of companies serving different market segments (Citizens, Consumers, Patients, Professionals).
Competitive Landscape
Professional Services
Illustrates Ipsos' comprehensive market understanding by showing its relationships with various segments in the US market through a central human insights diagram.
Market Understanding, US Market, Segments, Ipsos, Insights
false
IPSOS TOTAL UNDERSTANDING : A UNIQUE POSITION IN THE US MARKET , AS BOUNDARIES CONTINUE TO BLURIpsos 2025 Growth Plan: The Heart of Science and Data
Diagram
IPSOS
View slide
A line chart comparing sectors such as CGS, Auto/IE, LS/Pharma/Biotech, Retail, and Travel/Hospitality in terms of leadership behaviors related to I&D.
Strategic Planning
Retail & E-commerce
Analyzes retail sector's performance in managing talent pipelines and recognizing I&D efforts compared to other sectors.
retail, talent pipelines, I&D, sector comparison, leadership behavior, line chart, performance analysis
false
RETAIL LAGS OTHER SECTORS SIGNIFICANTLY WITH SENSITIVITY TRAININGInclusion and Diversity Survey MAKE IT MORE THAN A MANTRA
Mixed Chart
Accenture
View slide
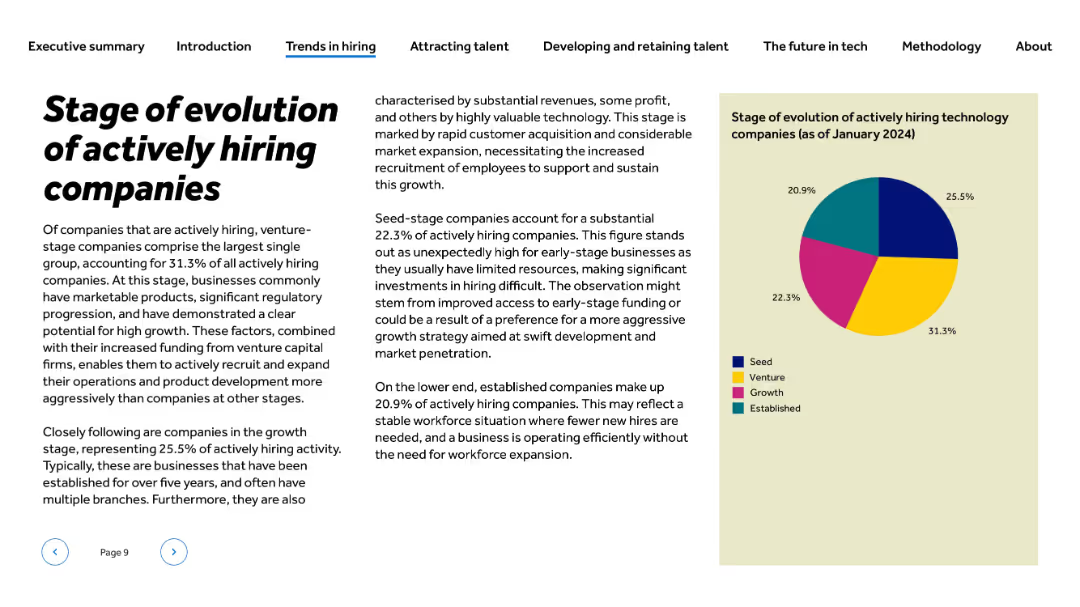
Left-aligned text; pie chart on right on beige background with color-coded legend for business stages
Strategic Planning
Technology & Software
The slide categorizes actively hiring tech firms by their growth stage. Venture-stage companies represent the largest share at 31.3%, followed by growth (25.5%), seed (22.3%), and established (20.9%). The content explains why venture-stage companies lead and notes the implications of early-stage firms actively recruiting despite resource limitations.
venture-stage, startup, seed, established companies, hiring stages, tech company evolution, recruitment phase, market penetration
false
Stage of evolution of actively hiring companiesUnlocking the UK’s tech talent potential
Mixed Chart
Barclays
View slide
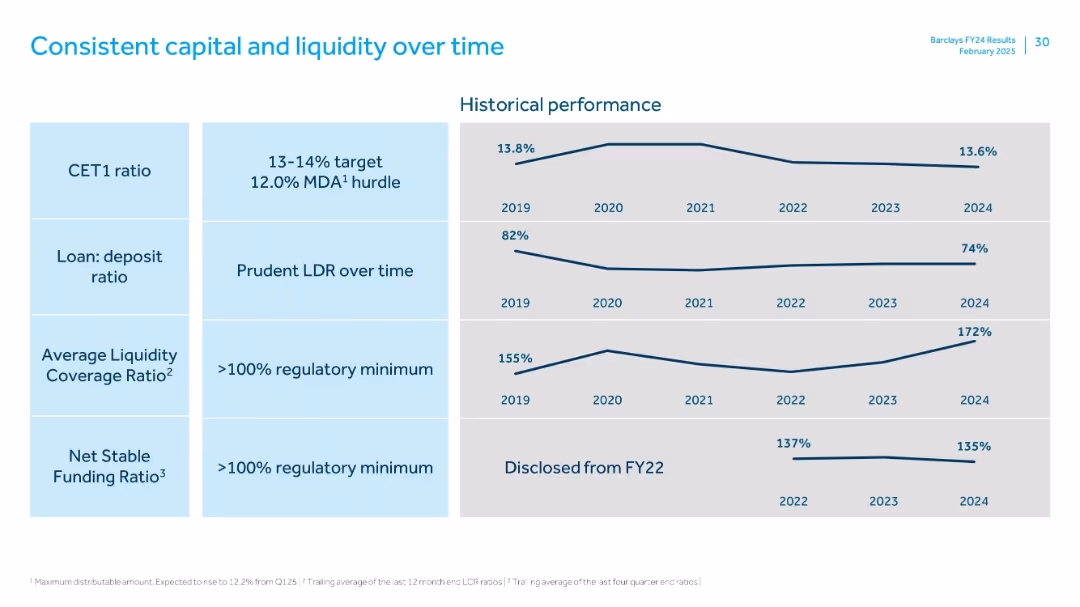
Grid layout with four metrics: CET1 ratio, loan:deposit ratio, liquidity coverage ratio, and funding ratio. Each metric has a trend line from 2019–2024.
Regulatory and Compliance
Financial Services
The slide highlights long-term stability in Barclays' capital and liquidity metrics. CET1 ratio stays within target range; LDR remains conservative; liquidity and funding ratios consistently exceed regulatory minimums.
CET1, LDR, LCR, NSFR, capital, liquidity, funding, 2024 trends
false
Consistent capital and liquidity over timeFY 2024 Results Presentation
Single Chart
Barclays
View slide
A radial bar chart illustrating the resurgence of procurement risk, alongside text detailing significant market risks.
Market Analysis and Trends
Professional Services
Analyzes procurement risk levels and significant market risks, offering insights into how these are managed.
procurement risk, market risks, analysis, management, trends
false
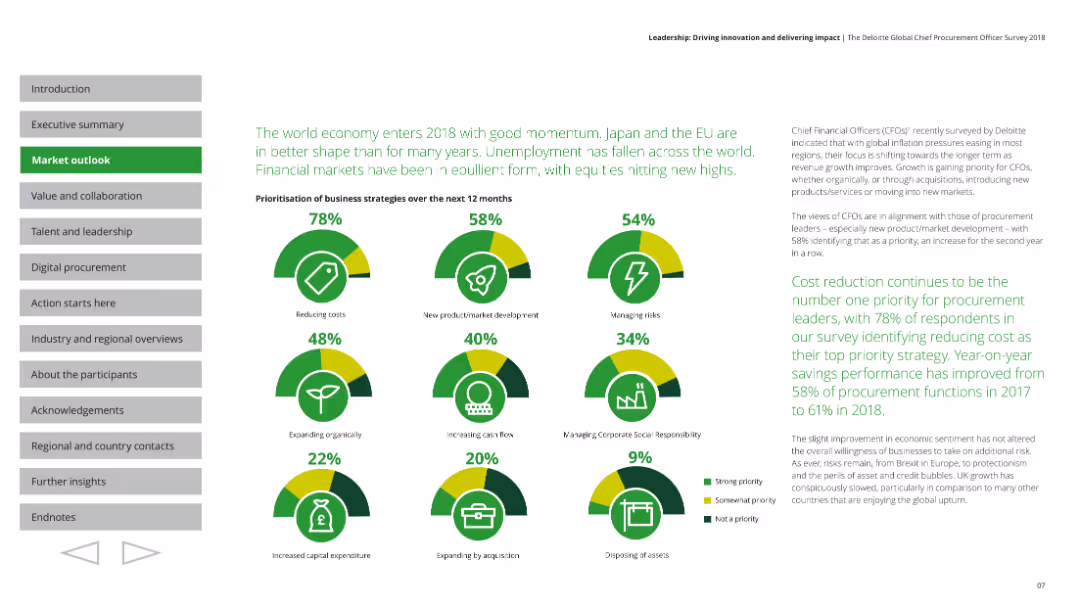
The world economy enters 2018 with good momentum.Leadership: Driving innovation and delivering impact The Deloitte Global Chief Procurement Officer Survey 2018
Multiple Chart
Deloitte
View slide
Slide includes a column chart showing funding channels for ESG projects, like internal cash flow and green bonds. The chart is vertical and color-coded to differentiate between 2022 and 2023, indicating shifts in funding preferences over time.
Financial Performance
Environmental Services & Sustainability
Focuses on the financing strategies companies are adopting for ESG projects, particularly the increasing reliance on internal funding in response to higher interest rates and tighter credit markets. This shift underscores the practical aspects of funding sustainable initiatives amid broader economic pressures.
ESG, funding, finance, green bonds, 2023
false
More companies rely on internal cash flow to fund ESG activities amid higher interest rates and a tighter credit marketAFF 2023 HKTDC and PwC’s Joint Pulse Survey
Single Chart
PwC/Strategy&
View slide
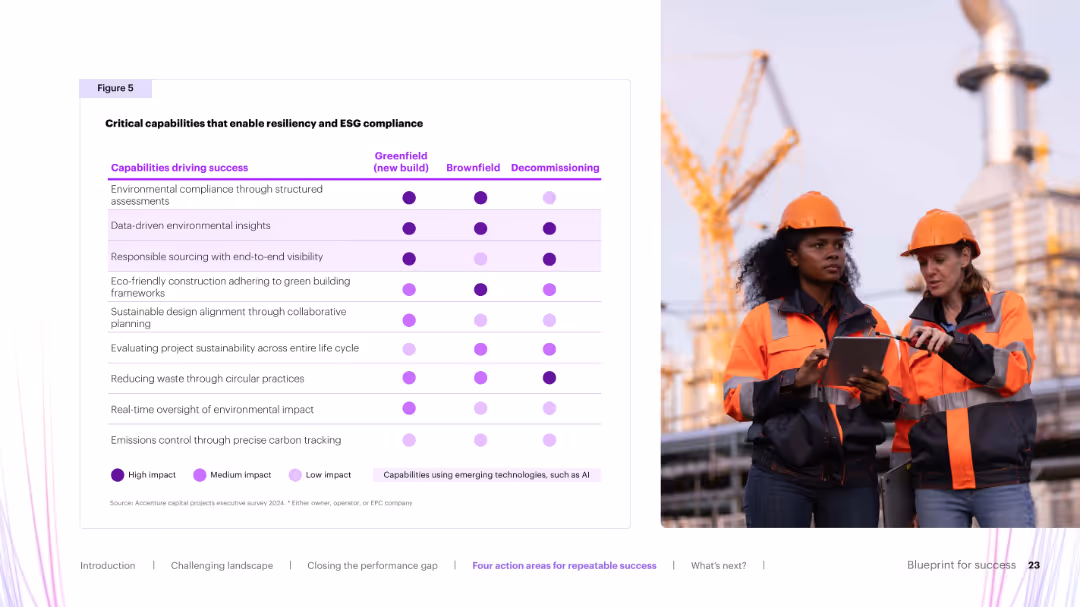
Matrix similar to previous slide but focused on ESG capabilities across project stages. Purple dots denote impact and emerging tech use.
Regulatory and Compliance
Environmental Services & Sustainability
Displays critical ESG-related capabilities and their relevance across project types. Emphasizes high-impact practices like environmental assessments, data-driven insights, and sustainable sourcing. Highlights emerging tech integration.
ESG, compliance, sustainability, data insights, green building
false
Critical capabilities that help manage stakeholdersBlueprint for success
Table
Accenture
View slide
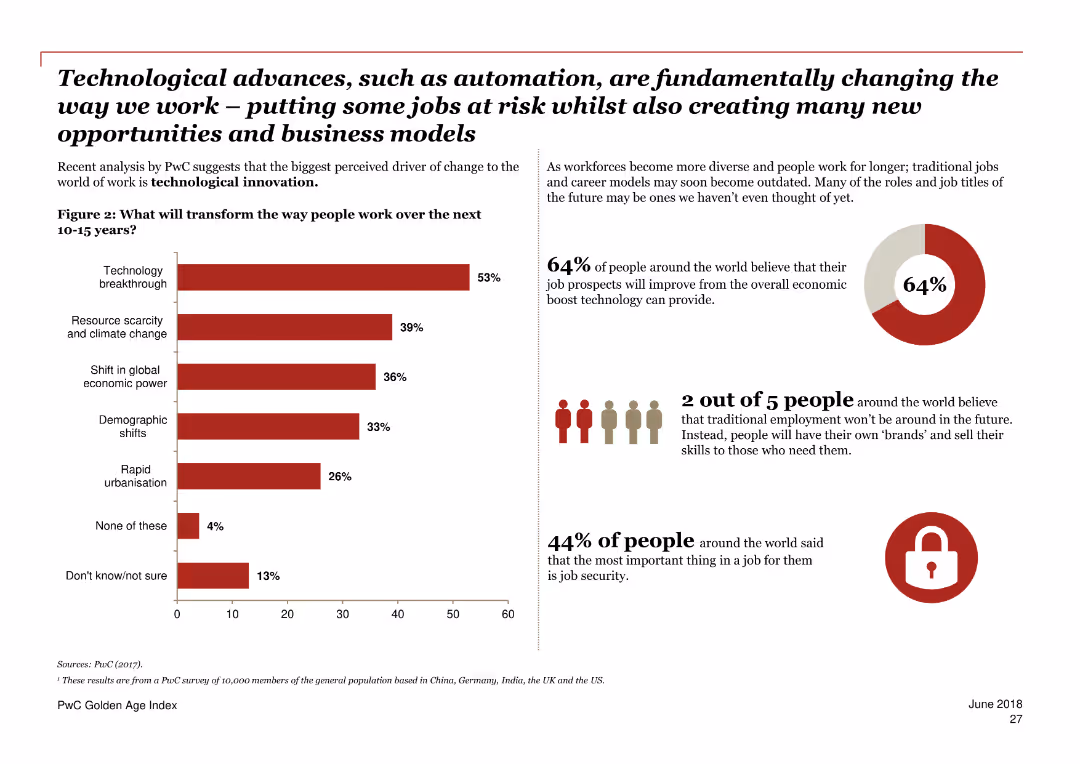
A mix of text and a bar chart, mainly in red and white.
Market Analysis and Trends
Government & Public Sector
Estimates the risk of job automation for older workers across various countries, emphasizing the importance of policy measures to reduce this risk.
automation, jobs, risk, older workers, policy measures, countries, trends, employment, economic analysis, future
false
Technological advances, such as automation, are fundamentally changing the way we workPwC Golden Age index Unlocking a potential $3.5 trillion prize from longer working lives
Multiple Chart
PwC/Strategy&
View slide
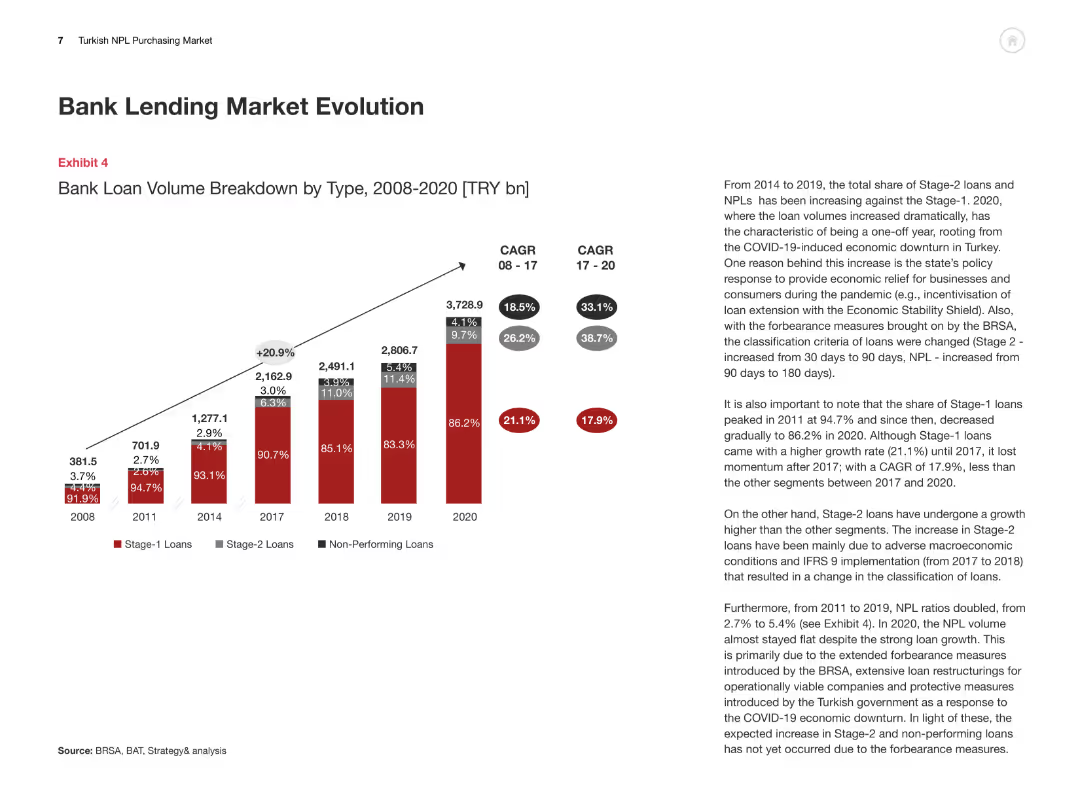
The slide includes a column chart showing the evolution of bank loan volumes by type from 2008 to 2020, with detailed textual analysis of the data trends and implications.
Market Analysis and Trends
Financial Services
This slide provides a comprehensive overview of the Turkish bank lending market evolution, highlighting the changes in loan volumes and types over a period of time.
Bank Lending, Market Evolution, Turkey, Loan Volumes, Data Trends
false
Bank Lending Market EvolutionTurkish NPL Purchasing Market Overview and the way forward
Mixed Chart
PwC/Strategy&
View slide
Slide with icons and bullet points, outlining the reasons for leadership to consider Web3 impacts.
Technology and Digital Transformation
Technology & Software
Discusses the implications of Web3 on business models, innovation, access and inclusion, and customer experience.
Web3 implications, leadership, business model disruption, innovation, inclusion
false
Why should leaders pay attention?McKinsey Technology Trends Outlook 2022 Web3
Pillar
McKinsey
View slide
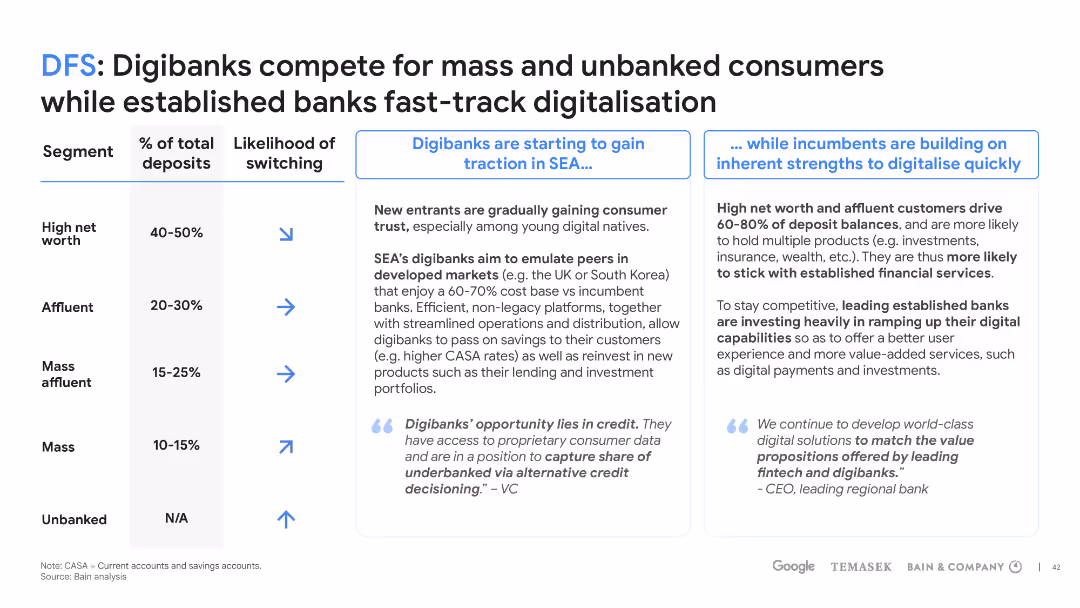
The slide includes a table with segments of net worth categories, percentages of deposits, likelihood of switching to digibanks, and two comparative analyses focusing on the traction of digibanks in SEA and established banks' digitalisation efforts. Symbols and color codes indicate trends or states for each segment.
Market Analysis and Trends
Financial Services
The slide compares the market strategies of digibanks and established banks, detailing the deposit percentages across different wealth segments, their propensity to switch to digital banking, and the differing approaches to capturing the mass and unbanked consumer markets.
digibanks, established banks, digitalisation, market strategy, consumer banking, SEA
false
DFS: Digibanks compete for mass and unbanked consumers while established banks fast-track digitalisatione-Conomy SEA 2022 Through the waves, towards a sea of opportunity
Table
Bain
View slide
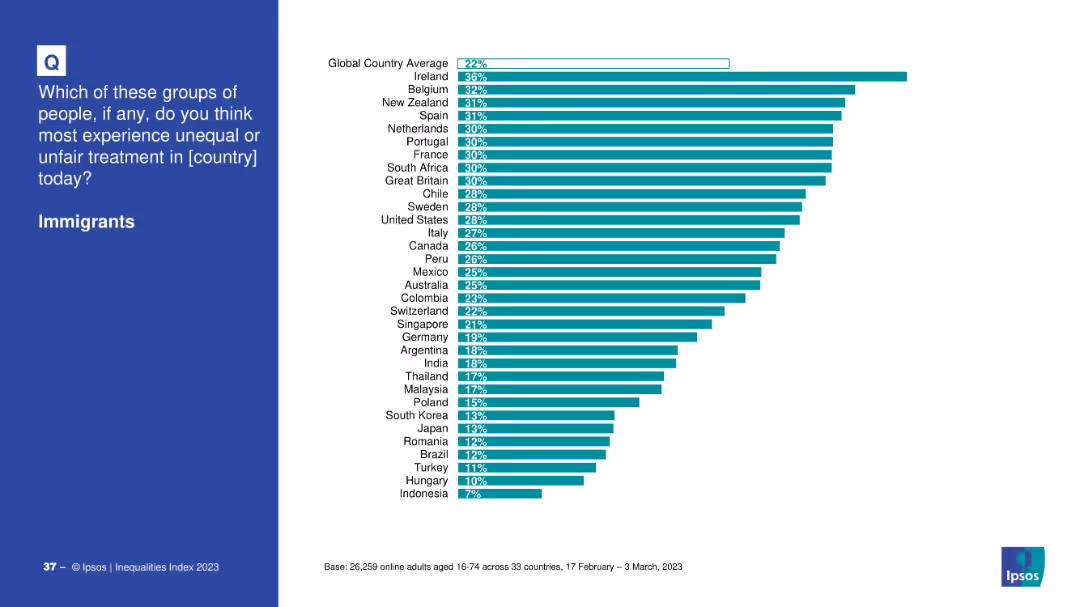
Blue left panel with the question; right side has a horizontal bar chart by country.
Market Analysis and Trends
Government & Public Sector
Depicts survey responses by country on the perceived unfair treatment of immigrants. Ireland, Belgium, and New Zealand rank highest, with a 22% global average.
immigration, inequality, countries, bar chart, discrimination, public opinion, Ipsos, 2023
false
ImmigrantsIPSOS EQUALITIES INDEX 2023
Mixed Chart
IPSOS
View slide
Features a line graph showing the relationship between broadband speed and GDP changes. Graph is color-coded to illustrate different time periods and predicted impacts, accompanied by a detailed legend and textual insights on the left.
Market Analysis and Trends
Technology & Software
Highlights statistical findings on broadband's effect on GDP from historical data and projected future trends. Compares these results to other international studies.
GDP, broadband, statistics, projections, line graph
false
Our model finds a positive, statistically significant relationship between increases in average broadband speeds and GDPThe economic and social impact of investment in the nbn network Key Insights Report
Mixed Chart
Accenture
View slide
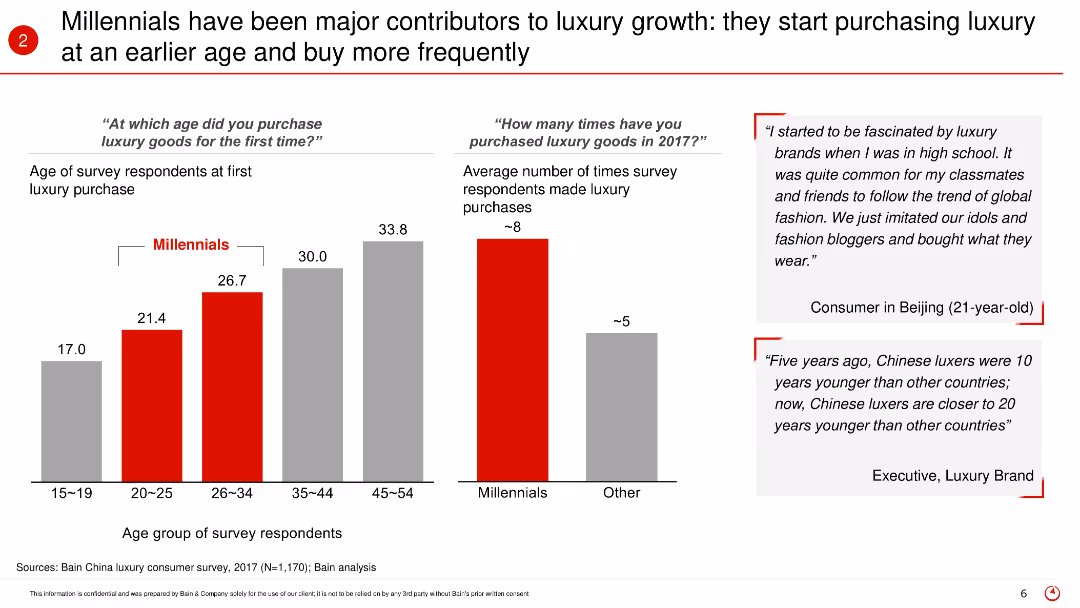
The slide includes bar charts showing the age at which Millennials first purchase luxury goods and the average number of luxury purchases made in 2017. It also features quotes from consumers and industry experts, highlighting the early adoption and frequent purchasing behavior of Millennials.
Market Analysis and Trends
Retail & E-commerce
The slide emphasizes the role of Millennials in driving luxury market growth by starting to purchase luxury goods at an earlier age and making frequent purchases. It provides data on the average age of first luxury purchase and the average number of purchases, supported by quotes from consumers and industry experts.
Millennials, luxury growth, early adoption, frequent purchasing, consumer behavior, age groups, 2017, market trends, luxury goods
false
Millennials have been major contributors to luxury growth: they start purchasing luxury at an earlier age and buy more frequently2017 China Luxury Market Study
Multiple Chart
Bain
View slide
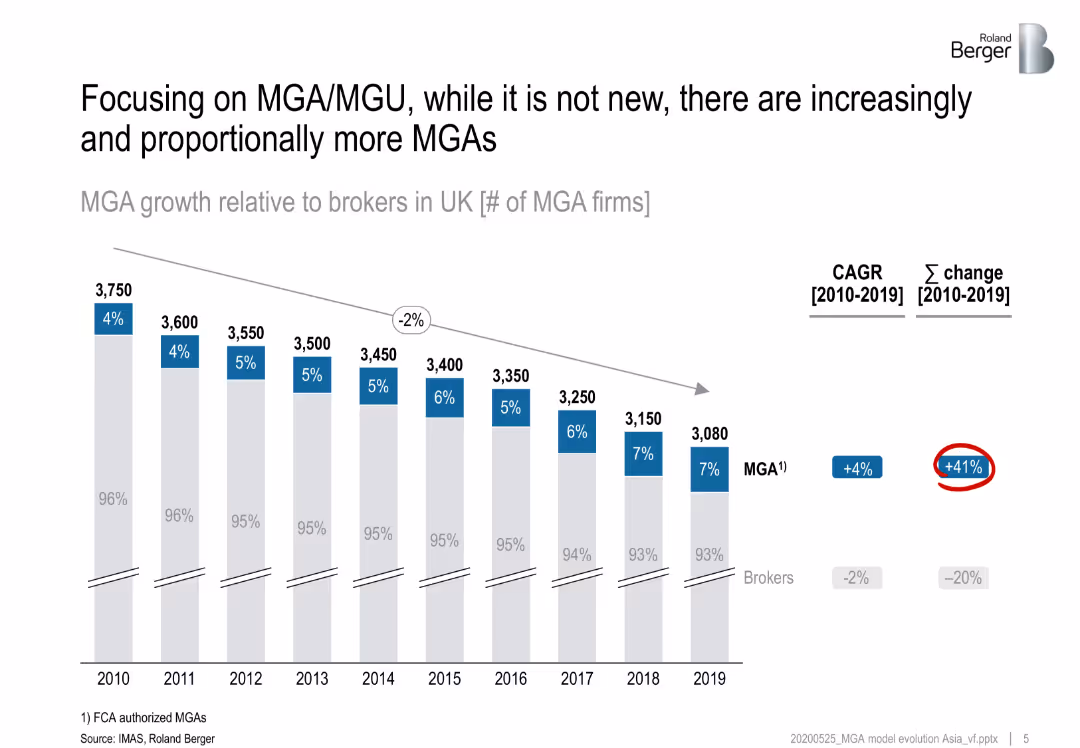
Matrix showing the involvement of different stakeholders in the health insurance value chain, highlighting trends in product development, sales, underwriting, and claims.
Market Analysis and Trends
Financial Services
Analyzes the evolving landscape of health insurance, detailing how various stakeholders are expanding their roles across the value chain to enhance their value propositions.
health insurance, value chain, stakeholders, trends
false
Focusing on MGA/ MGU , while it is not new, there are increasingly and proportionally more MGAsInsurance landscape evolution and emergence of MGA/ MGU model
Single Chart
Roland Berger
View slide
Grid-style layout with economic, social, and political factors influencing SEA’s green economy. Includes bar graphs, stats, and flag-based visuals.
Strategic Planning
Government & Public Sector
Details foundational economic and societal challenges Southeast Asia faces in transitioning to a green economy. Highlights low GDP, energy access, healthcare, workforce vulnerability, political instability, and manufacturing/export dependency. Uses data visualizations and flag indicators to illustrate governance effectiveness and regulatory quality.
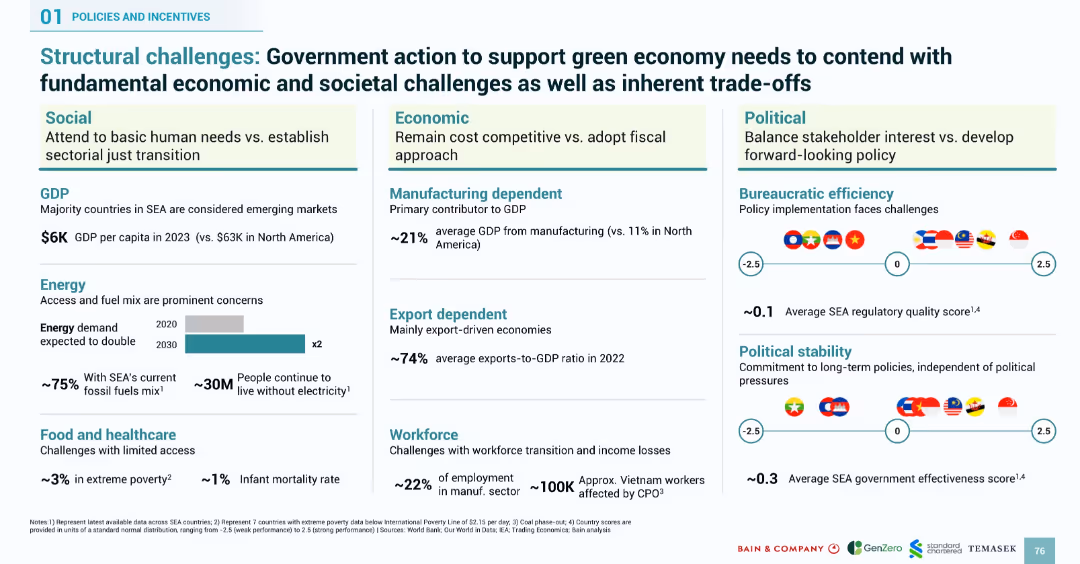
structural challenges, SEA, green economy, governance, GDP, energy demand, workforce, healthcare, policy
false
Structural challenges: Government action to support green economy needs to contend with fundamental economic and societal challenges as well as inherent trade-offsSOUTHEAST ASIA’S GREEN ECONOMY 2024
Mixed Chart
Bain
View slide
Horizontal bar chart ranking countries by concern over personal safety violations; Canada and U.S. highlighted.
Risk Assessment and Management
Government & Public Sector
The slide presents public perceptions of the threat to personal and family safety across countries. U.S. respondents show relatively high concern (65%), while Canada’s perception is lower (55%).
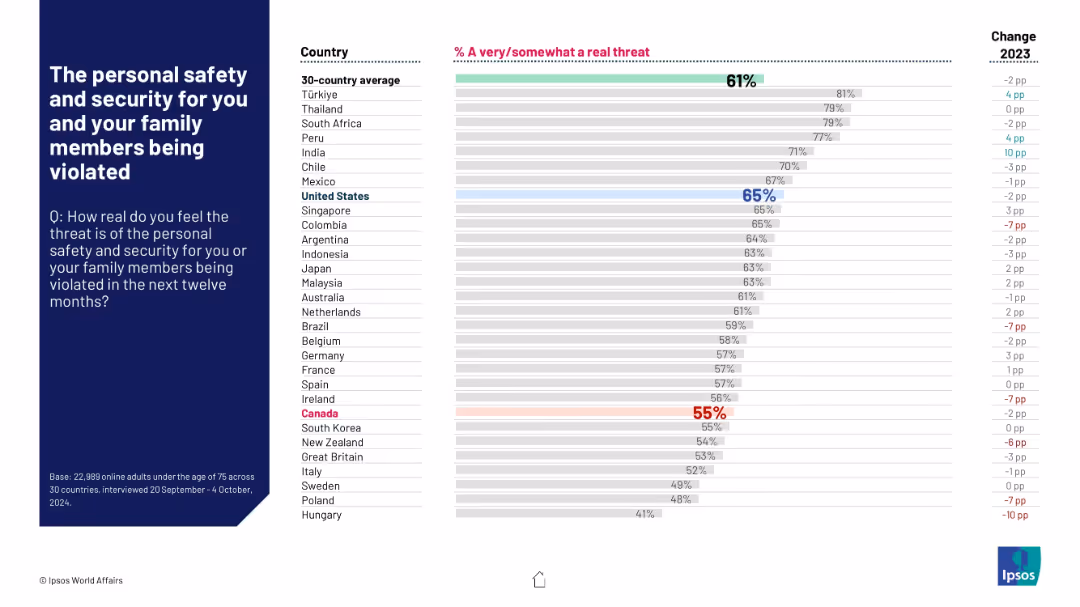
personal safety, threat, global perception, survey results, 2024, Canada, U.S., Ipsos, risk, family security
false
The personal safety and security for you and your family members being violatedWORLD AFFAIRS
Mixed Chart
IPSOS
View slide
Title, detailed bar charts illustrating potential impacts across sub-sectors like "Living Travel Experiences" and "Digital Enterprise".
Market Analysis and Trends
Transportation & Logistics
Analyzes the potential value unlocked by digitalization in the aviation, travel, and tourism sectors, discussing both business and societal impacts.
aviation, digitalization, travel, tourism, societal impact
false
AVIATION, TRAVEL AND TOURISM: UNLOCKING VALUEDigital Transformation Initiative In collaboration with Accenture
Mixed Chart
Accenture
View slide
Multiple sections, logos, screenshots, mixed layouts
Technology and Digital Transformation
Technology & Software
Outlines Deloitte's CAI solutions and partnerships
Deloitte, CAI, TrueServe, NVIDIA
false
Conversational AI Solution FrameworkTrends & AI in the Contact Center
Framework
Deloitte
View slide
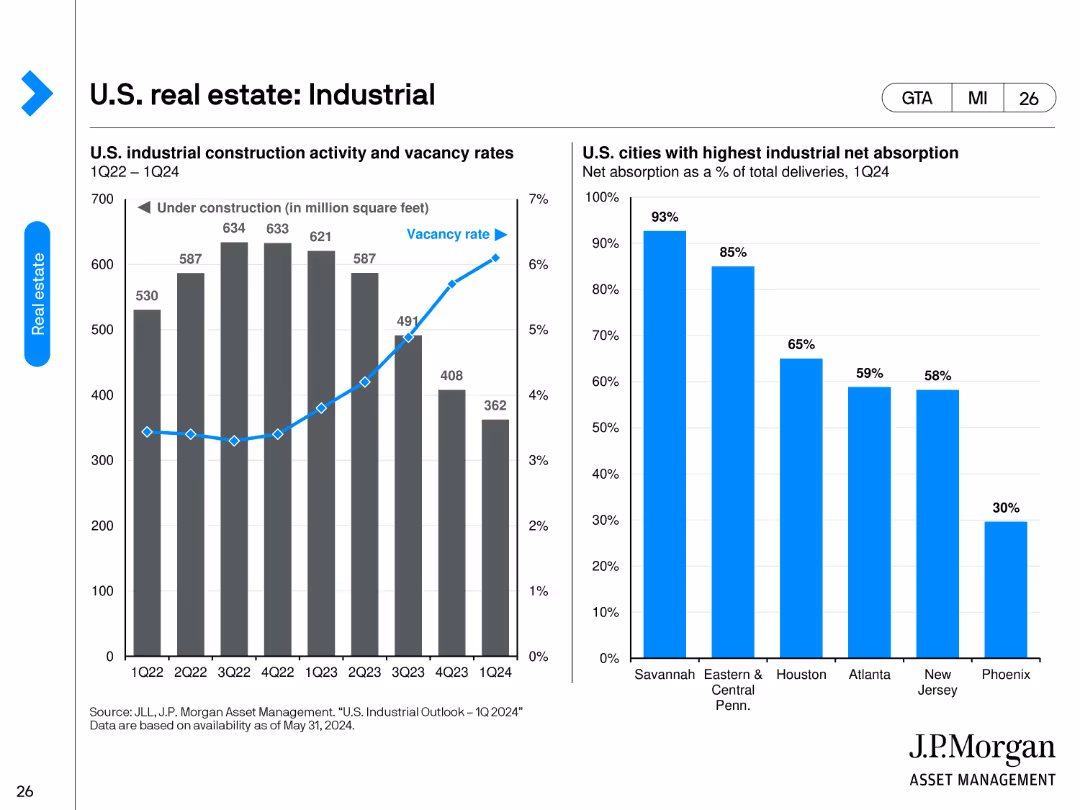
The slide features two charts. The left chart shows U.S. industrial construction activity and vacancy rates from 1Q22 to 1Q24. The right chart highlights the U.S. cities with the highest industrial net absorption as a percentage of total deliveries for 1Q24.
Market Analysis and Trends
Real Estate & Construction
This slide presents data on U.S. industrial construction activity, vacancy rates, and net absorption by city, providing insights into the industrial real estate market's performance and demand trends across major cities.
industrial construction, vacancy rates, net absorption, real estate market, city comparison
false
US. real estate: IndustrialGuide to Alternatives
Multiple Chart
JP Morgan
View slide
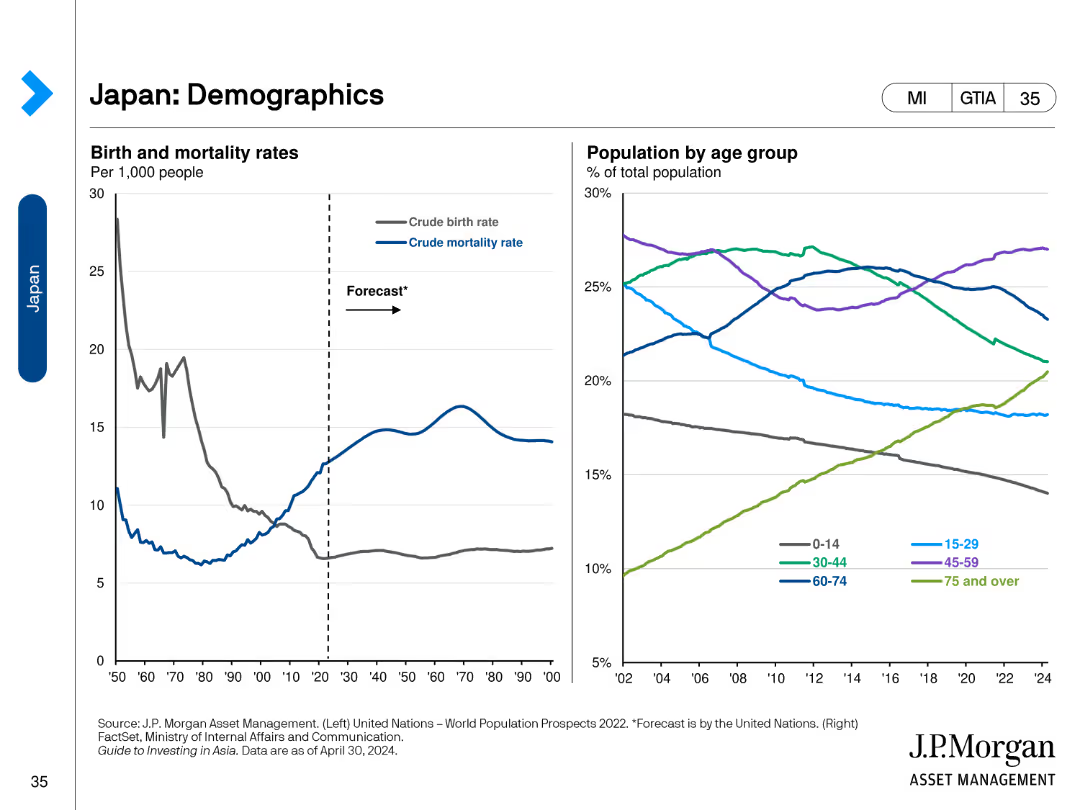
The slide includes two line charts. The left chart shows birth and mortality rates per 1,000 people. The right chart shows the population by age group.
Market Analysis and Trends
Healthcare & Pharmaceuticals
This slide reviews demographic trends in Japan, presenting data on birth and mortality rates and the population distribution by age group.
Demographics, Japan, Birth Rate, Mortality, Age
false
Japan: Demographics Birth and mortality rates Per 1,000 peopleGuide to Investing in Asia
Multiple Chart
JP Morgan
View slide
Textual content and comparative data visualizations with maps. Shows the number of unicorns in Asia Pacific countries and outlines the initiatives of China, India, South Korea, and Japan to fulfill digital imperatives.
Industry Overview
Government & Public Sector
Compares the progress of prominent Asian countries in developing their digital ecosystems. Discusses initiatives and policies implemented to push for a flourishing digital economy, useful for understanding competitive positioning and the race to achieve key digital imperatives.
Digital Ecosystem, Unicorns, Asia Pacific, China, India, South Korea, Japan, Policy, Digital Economy, Competitiveness
false
Prominent countries with flourishing digital ecosystem are pushing to achieve key imperatives.Unlocking the next wave of digital growth: beyond metropolitan Indonesia
Single Chart
Kearney
View slide
Slide with two doughnut charts comparing helicopter deliveries, two pie charts on revenue segmentation, and bullet points. Red and grey shades are utilized, with a clean layout.
Product and Service Analysis
Transportation & Logistics
Analysis of helicopter delivery numbers and revenue by customer segment for FY2020 and FY2021, highlighting changes and focusing on different helicopter models within the AW family.
helicopter deliveries, revenue segmentation, AW family, defense, civil, OE, CS&T
false
Helicopters DELIVERIES BY PROGRAMMEGoldman Sachs Investor Meeting
Multiple Chart
Goldman Sachs
View slide
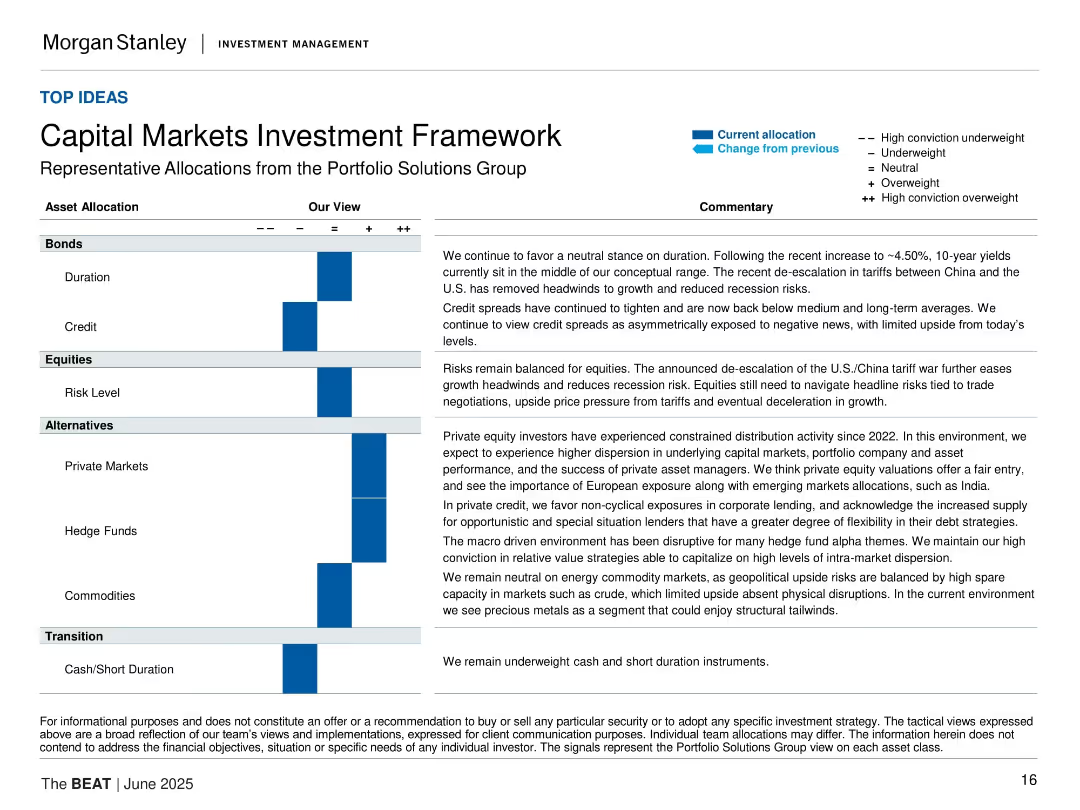
Matrix of asset allocation views with horizontal bars and textual commentary; structured, corporate layout.
Strategic Planning
Financial Services
The slide presents the Portfolio Solutions Group’s tactical asset allocation views across bonds, equities, alternatives, and cash. Commentary explains each allocation decision within a macroeconomic context.
capital markets, investment strategy, asset allocation, portfolio, tactical view, duration, credit, equities, alternatives
false
Capital Markets Investment FrameworkThe BEAT June 2025
Table
Morgan Stanley
View slide
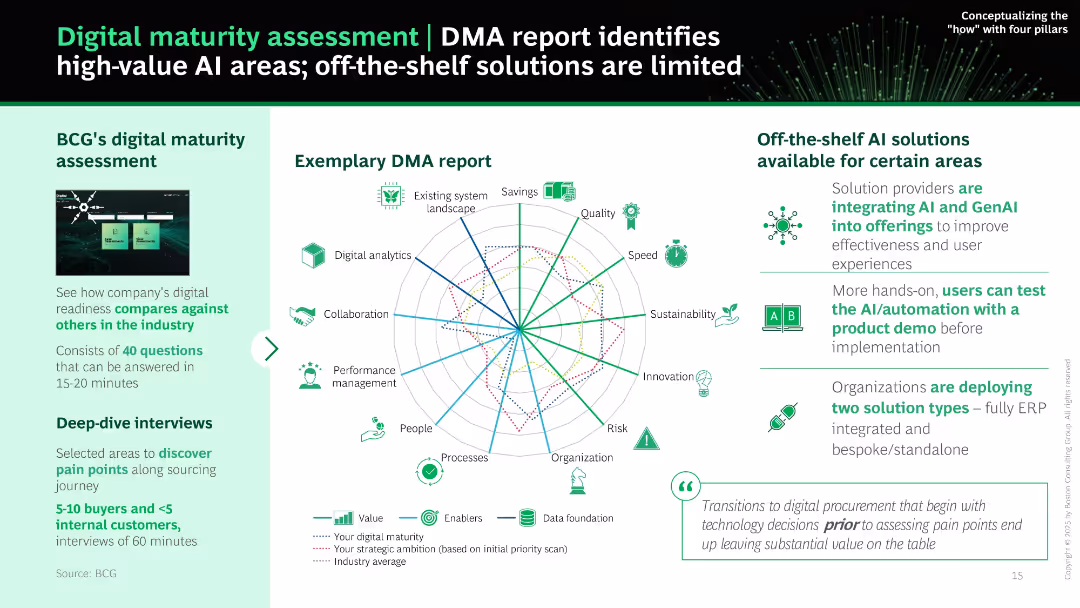
Radar chart at center with multiple axes and legend. Sidebars explain DMA assessment approach and available solutions. Balanced layout using green color palette.
Performance Metrics and KPIs
Technology & Software
Explains how BCG’s DMA report benchmarks an organization's digital maturity across procurement functions. Visual radar chart compares maturity with ambition and industry averages. Also discusses off-the-shelf AI tools and implementation insights.
digital maturity, DMA, assessment, AI, analytics, sourcing, procurement, benchmarking
false
Digital maturity assessment | DMA report identifies high-value AI areas; off-the-shelf solutions are limitedMaximizing Value Potential from AI in 2025
Mixed Chart
BCG
View slide
The slide contains several horizontal bar graphs displaying percentage ratings of different underwriting solutions. Color gradients from purple to pink are used.
Operational Efficiency
Financial Services
This slide evaluates various underwriting solutions used today in organizations to improve process efficiency.
underwriting, automation, efficiency, bar graph, solutions
false
USE OF SOLUTIONS TODAY2021 P&C Underwriting Survey
Single Chart
Accenture
View slide
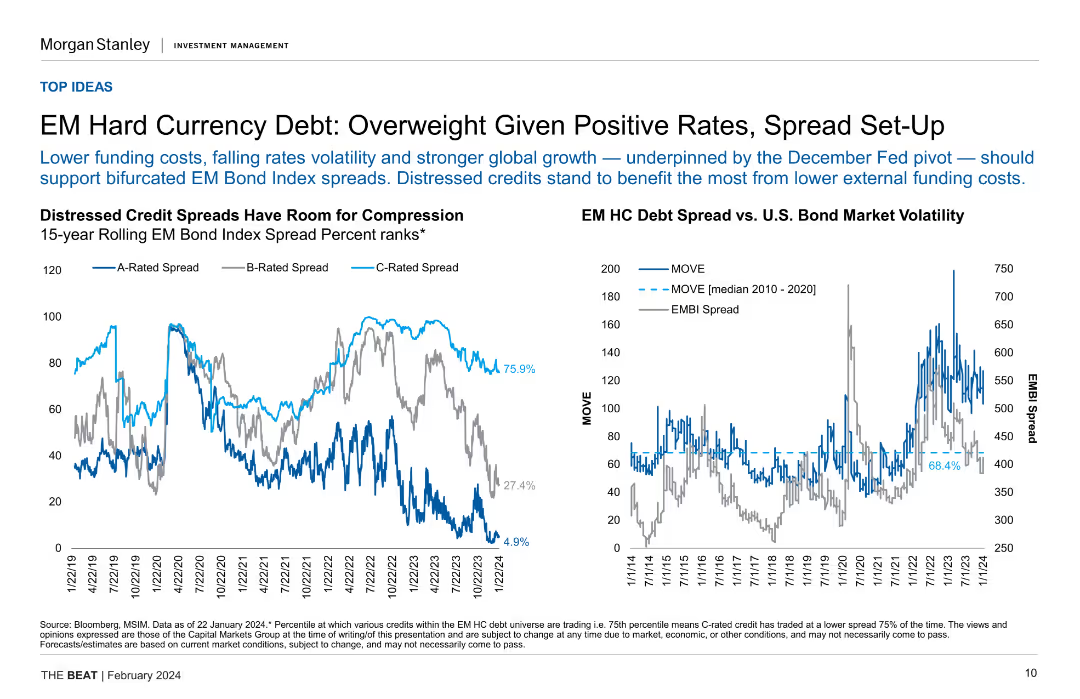
Two line charts displaying distressed credit spreads and EM hard currency debt spread vs. U.S. bond market volatility.
Investment Analysis
Financial Services
The slide supports an overweight recommendation for EM hard currency debt, citing positive rates, spread setup, and falling rate volatility.
EM debt, hard currency, distressed credit spreads, investment analysis, bond market volatility
false
EM Hard Currency Debt: Overweight Given Positive Rates, Spread Set-UpThe BEAT February 2024
Multiple Chart
Morgan Stanley
View slide
Contains tables and bullet points highlighting capital information, balance sheet data, and graphical representation of book value.
Regulatory and Compliance
Financial Services
Analyzes the company's capital and balance sheet positions, indicating regulatory compliance and financial health. Useful for stakeholders reviewing capital adequacy, asset allocations, and financial stability.
Capital, Balance Sheet, CET1 Capital, RWAs, Liquidity, Shareholders' Equity, Deposits, Financial Health, Regulatory Compliance, Book Value
false
Capital and Balance Sheet Capital3,4Full Year and Fourth Quarter 2019 Earnings Results Presentation
Table
Goldman Sachs
View slide
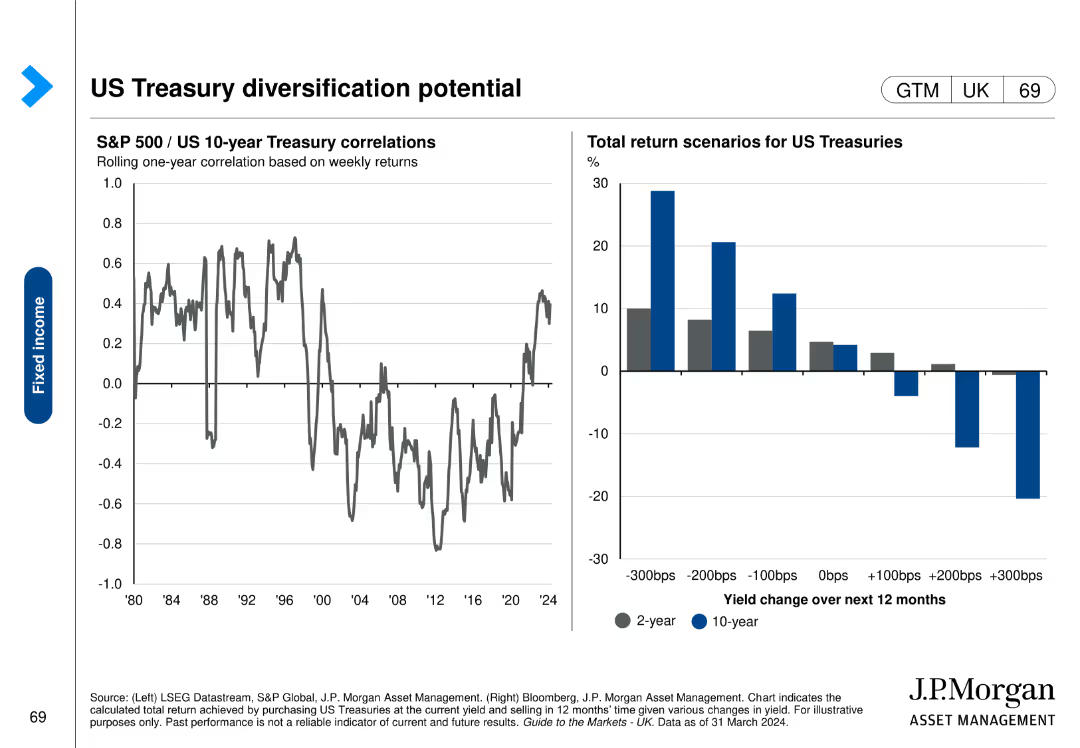
Contains a line chart on the left showing S&P 500/US 10-year Treasury correlations over time and a column chart on the right displaying total return scenarios for US Treasuries.
Investment Analysis
Financial Services
This slide analyzes the correlation between S&P 500 and US 10-year Treasury bonds, highlighting the potential diversification benefits. It includes return scenarios for different yield changes.
US Treasuries, diversification, correlations, return scenarios, S&P 500
false
US Treasury diversification potentialGuide to the Markets UK | Q2 2024
Multiple Chart
JP Morgan
View slide
Line graph illustrating the loss ratio progression for cargo accounts from 2014 to Q2 2018.
Market Analysis and Trends
Financial Services
Evaluates the impact of soft market conditions on Lloyd's reserve strength, specifically for cargo lines, detailing how optimism in business planning affects financial results.
Market, Conditions, Reserves, Impact, Cargo
false
Prior year reserve releases …..and “Soft Market” effects still impact a number of lines tooLloyd’s and Bermuda
Single Chart
PwC/Strategy&
View slide
Slide with multiple line graphs on a white background, comparing the projected demand and mine supply of nickel, lithium, and cobalt up to 2032.
Market Analysis and Trends
Industrial & Manufacturing
Analyzes the future trends in the mining of essential minerals for battery production, highlighting potential shortages and growth in demand. The focus shifts to nickel due to its significant role in battery technology.
mining, minerals, battery, nickel, lithium, cobalt
false
Battery mineral mining is at current pace to result in supply shortages towards the end of the decadeBattery materials demand and supply perspective
Multiple Chart
McKinsey
View slide
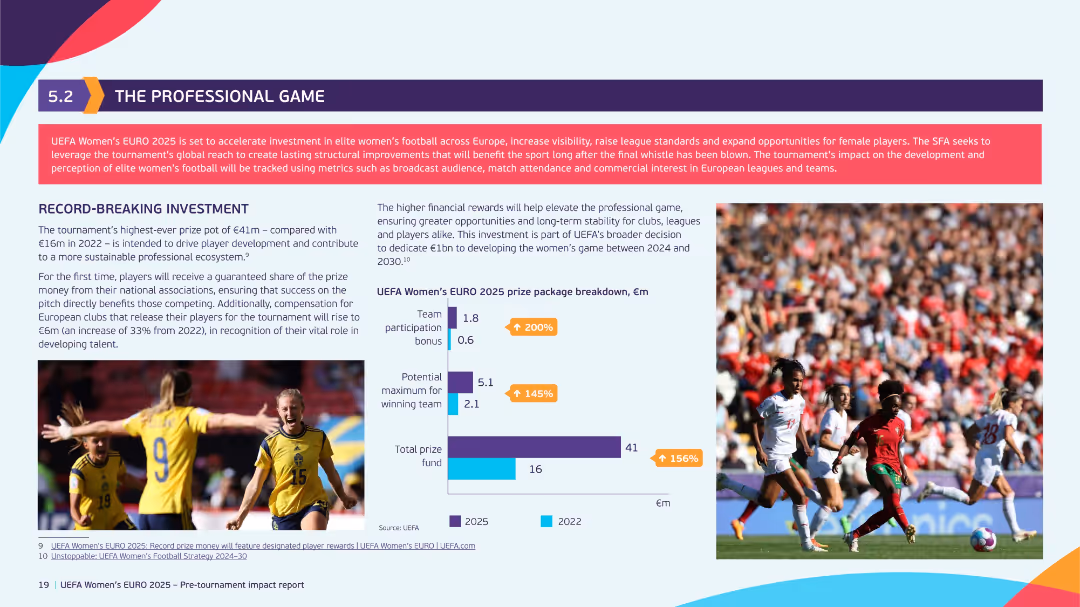
Split layout with bar graph of prize breakdown (2022 vs 2025), two images of players, and detailed explanation of record-breaking investments.
Investment Analysis
Hospitality & Tourism
The slide showcases UEFA’s increased prize fund for Women's EURO 2025 (€41m), reflecting a 156% increase from 2022. It discusses the intent to elevate the professional game, ensure financial sustainability, and drive player development through enhanced investment.
prize fund, women’s football, investment, professional game, UEFA, player development, sustainability
false
THE PROFESSIONAL GAMEAPPROACHING THE SUMMIT
Mixed Chart
EY
View slide
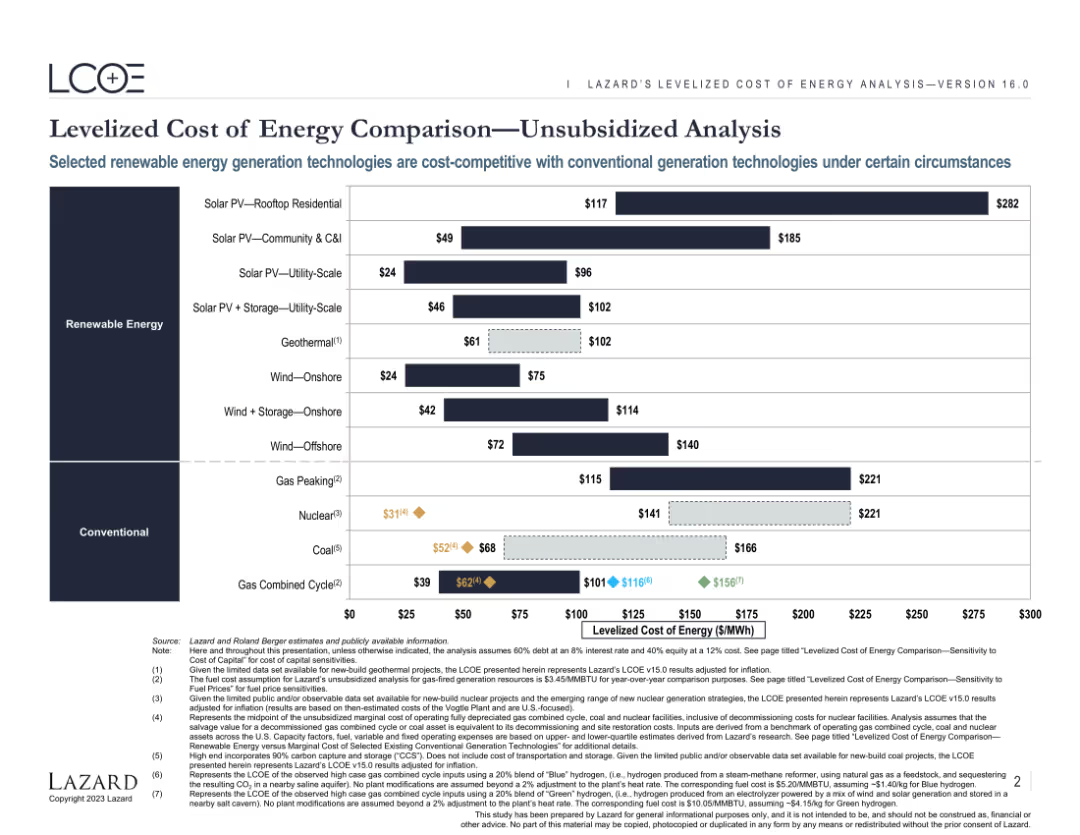
Features a comparative bar chart displaying the levelized cost of energy (LCOE) for various renewable and conventional energy sources. The chart includes both current and projected costs, highlighting the competitiveness of different technologies.
Market Analysis and Trends
Energy & Utilities
Provides an analysis of the levelized cost of energy for various renewable and conventional energy sources. Highlights the cost competitiveness and market potential of different energy generation technologies under specific conditions.
Energy, LCOE, Renewable, Conventional, Comparison
false
Levelized Cost of Energy Comparison—Unsubsidized AnalysisLazards Lcoeplus
Single Chart
Roland Berger
View slide
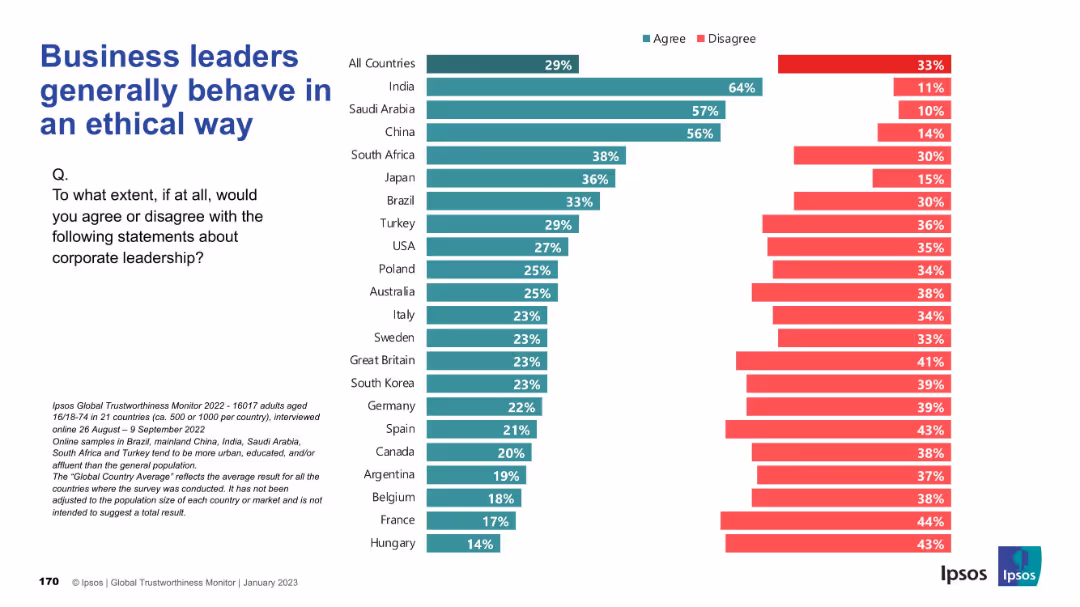
Familiar bar chart layout with agree/disagree metrics; countries displayed along the vertical axis; standard visual structure and color-coding.
Risk Assessment and Management
Professional Services
This slide examines global trust in business leaders’ ethics. India stands out positively while Western countries show skepticism, revealing a divide in corporate reputation and ethical perceptions.
ethics, corporate behavior, trust, leadership perception, global disparity, Ipsos, morality
false
Business leaders generally behave in an ethical wayIPSOS GLOBAL TRUSTWORTHINESS MONITOR January 2023
Mixed Chart
IPSOS
View slide
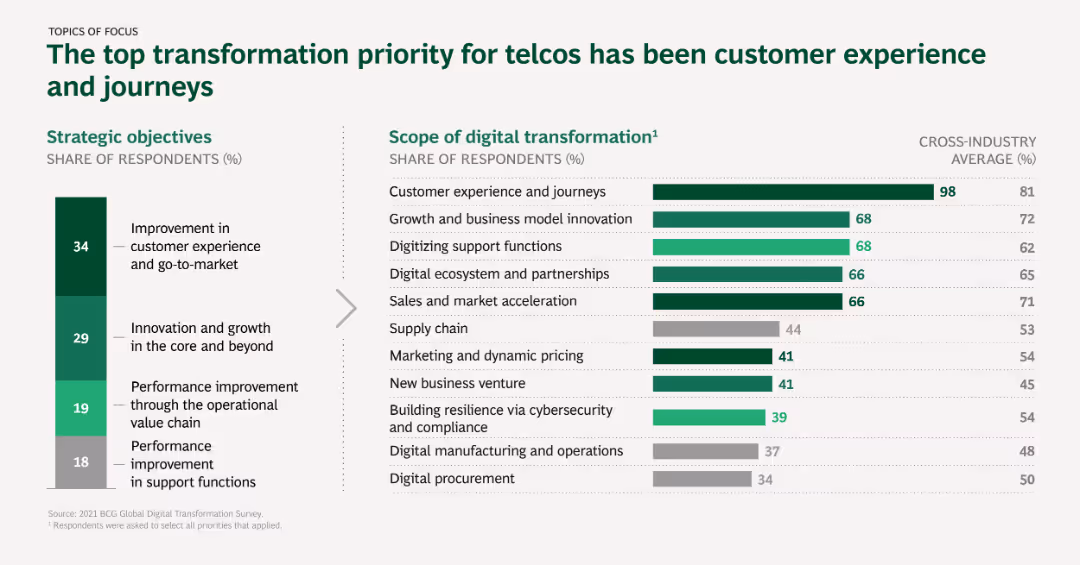
The slide contains a vertical bar chart showing the top strategic objectives and scope of digital transformation initiatives among telcos, with color coding for cross-industry comparison.
Strategic Planning
Telecommunications
This slide identifies the top priorities for digital transformation in the telco sector, emphasizing customer experience and journeys as the primary focus.
Transformation priorities, Telcos, Customer experience, Strategic objectives, Digital initiatives
false
The top transformation priority for telcos has been customer experience and journeysTELECOMMUNICATIONS The Rates of Success, Goals, and Future Priorities of Digital Transformations, by Sector
Multiple Chart
BCG
View slide
Scatter plot showing the 'Ability to Technically Automate' against 'Hourly Wage' with highlighted positions like 'File clerks' and 'Chief executives', indicating a wide range across wage levels.
Financial Performance
Industrial & Manufacturing
Discusses the correlation between the technical potential for automation and wage levels, highlighting how both high and low-wage jobs can be significantly automated.
Wages, Automation, Job Security, Income Levels, Analysis
false
Automation potential spans from high to low wage occupationsA FUTURE THAT WORKS: AI, AUTOMATION, EMPLOYMENT, AND PRODUCTIVITY
Single Chart
McKinsey
View slide
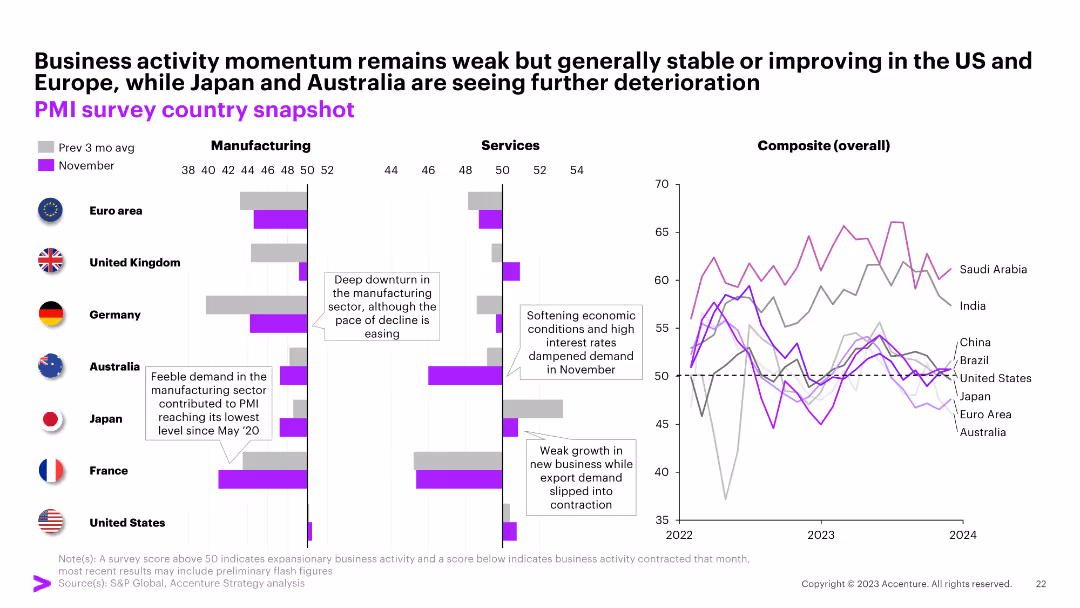
Multiple column charts showing PMI data for manufacturing and services across various countries. Includes a line chart with composite overall PMI data.
Market Analysis and Trends
Financial Services
The slide presents a snapshot of business activity momentum globally, comparing manufacturing and services PMI data across different countries, highlighting economic conditions.
PMI, manufacturing, services, global, economic
false
Business activity momentum remains weak but generally stable or improving in the US and Europe, while Japan and Australia are seeing further deteriorationYear-end Macro Brief Into the Fog of Winter
Multiple Chart
Accenture
View slide
Bar charts comparing initial management aspirations to what was implemented and the resulting value multiples.
Investment Analysis
Professional Services
Compares initial aspirations and actual outcomes in transformation projects to demonstrate value created.
transformation, value, management, outcomes, comparison
false
Normally well-executed transformations deliver more value than initial aspirationsThe Secret of Transformations
Multiple Chart
McKinsey
View slide
This slide outlines an integrated banking platform with product offerings across spending, borrowing, and saving. It includes a flowchart-like design with product names and related icons, with color coding to guide the viewer.
Technology and Digital Transformation
Financial Services
Highlighting the firm's approach to creating an integrated digital banking platform, this slide delineates the array of services provided, underlining the strategy for customer engagement across different financial needs.
integrated platform, digital banking, product offerings, customer engagement
false
Creating an Integrated PlatformGoldman Sachs Investor Day
Diagram
Goldman Sachs
View slide
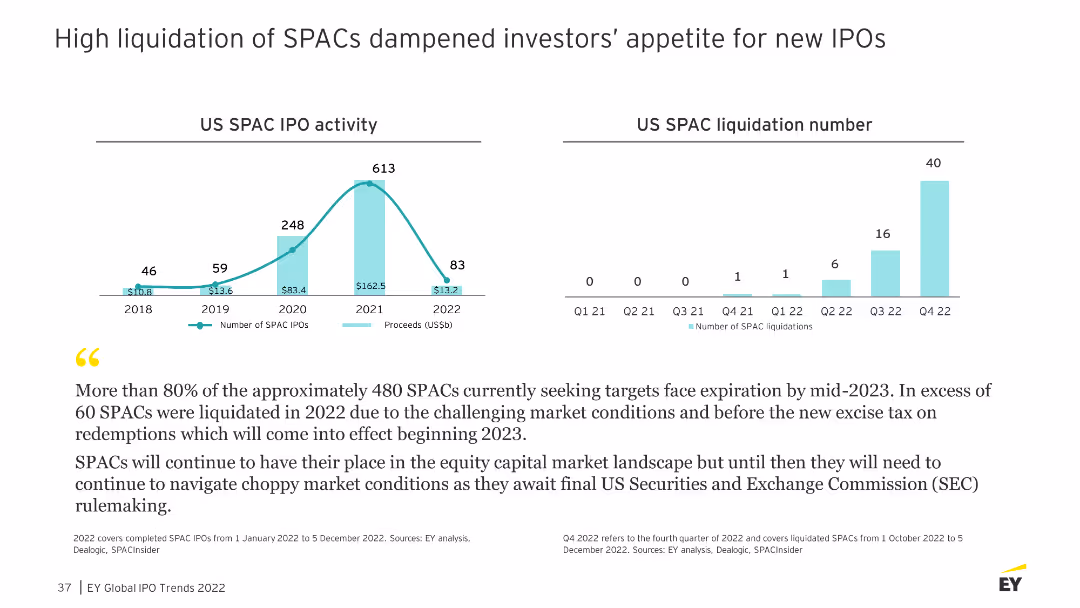
The slide presents two column charts depicting US SPAC IPO activity and SPAC liquidation numbers from 2018 to 2022, with a detailed narrative explaining the trends.
Risk Assessment and Management
Financial Services
Discusses the impact of high SPAC liquidations on investor sentiment and the challenging market conditions leading to these liquidations.
SPAC, liquidation, investor sentiment, trends
false
High liquidation of SPACs dampened investors’ appetite for new IPOsHow can you prepare to seize the right moment?
Multiple Chart
EY
View slide
Two pie charts: one showing the percentage of people who borrowed money to buy investments, and another showing if they did so based on advisor recommendations.
Financial Performance
Financial Services
Highlights the percentage of investors who borrowed money to buy investments before or during the pandemic, and the influence of financial advisors on this decision.
borrowed money, investments, advisor, pandemic
false
Borrowed Money to Buy InvestmentsINVESTING AND THE COVID-19 PANDEMIC
Multiple Chart
IPSOS
View slide
The slide illustrates a stacked column chart detailing the composition of the Indian advertising market from 2019 to 2024, showing resilience in digital advertising despite economic downturns. Each segment (Internet, TV, OOH, etc.) is color-coded, with annotations providing context on growth rates and market shifts.
Market Analysis and Trends
Media & Entertainment
Discusses the resilience of the Indian advertising market, particularly the robust performance of digital advertising amidst economic challenges. This slide is instrumental for media planners and advertisers in strategizing for market conditions, emphasizing the growth opportunities in digital advertising and the need for adaptation in traditional formats.
advertising resilience, digital media, market analysis
false
With 57.6mn monthly listeners*, India is the third largest podcast listening market in the world after China and the USGlobal Entertainment & Media Outlook: 2020-2024
Multiple Chart
PwC/Strategy&
View slide
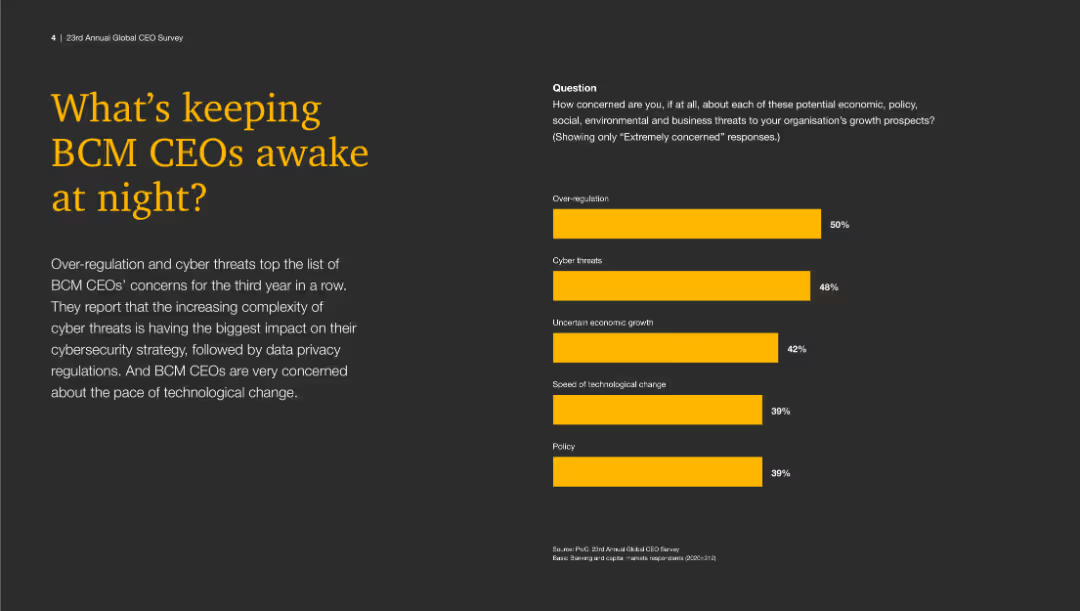
The slide uses a dark background with a large yellow title on the left. On the right, a column chart with yellow bars indicates different concerns for BCM CEOs.
Risk Assessment and Management
Financial Services
This slide shows the top concerns for BCM CEOs, including over-regulation, cyber threats, uncertain economic growth, speed of technological change, and policy concerns.
BCM, CEOs, risks, concerns, cybersecurity, regulation, growth, technology, policy
false
What’s keeping BCM CEOs awake at night?Banking and capital markets trends 2020: Laying the foundations for growth
Mixed Chart
PwC/Strategy&
View slide
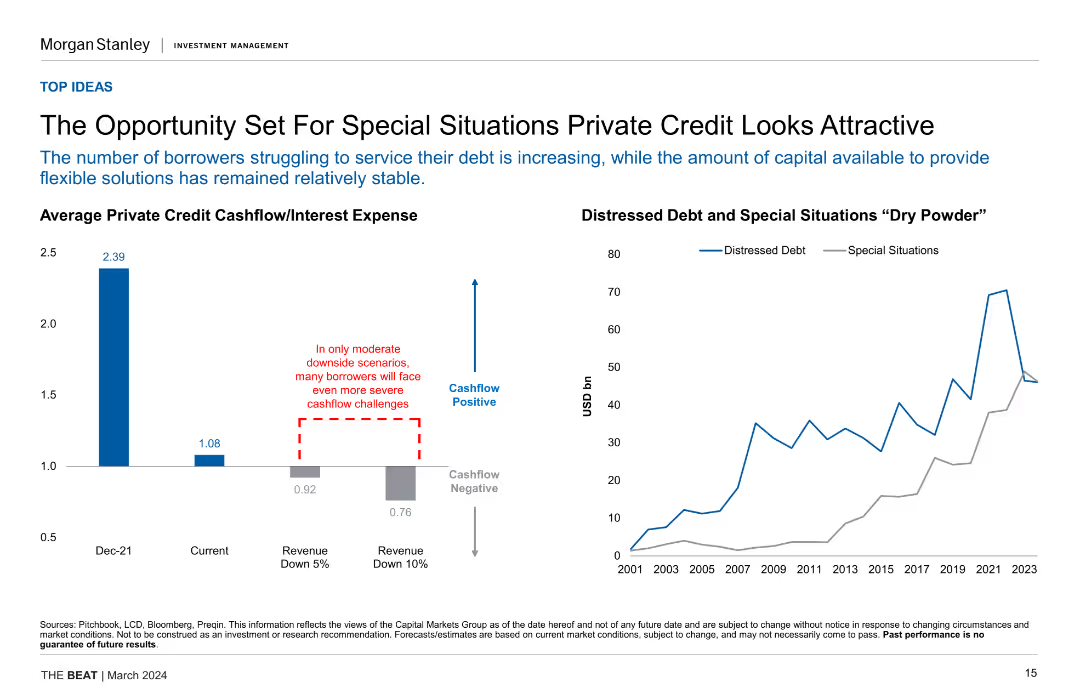
Column chart showing average private credit cashflow/interest expense and line chart of distressed debt vs. special situations "dry powder", highlighting cashflow challenges.
Investment Analysis
Financial Services
This slide discusses the attractiveness of special situations private credit due to increasing borrower struggles and stable capital availability for flexible solutions.
Special Situations, Private Credit, Cashflow, Distressed Debt, Investment Opportunities
false
The Opportunity Set For Special Situations Private Credit Looks AttractiveThe BEAT March 2024
Multiple Chart
Morgan Stanley
View slide
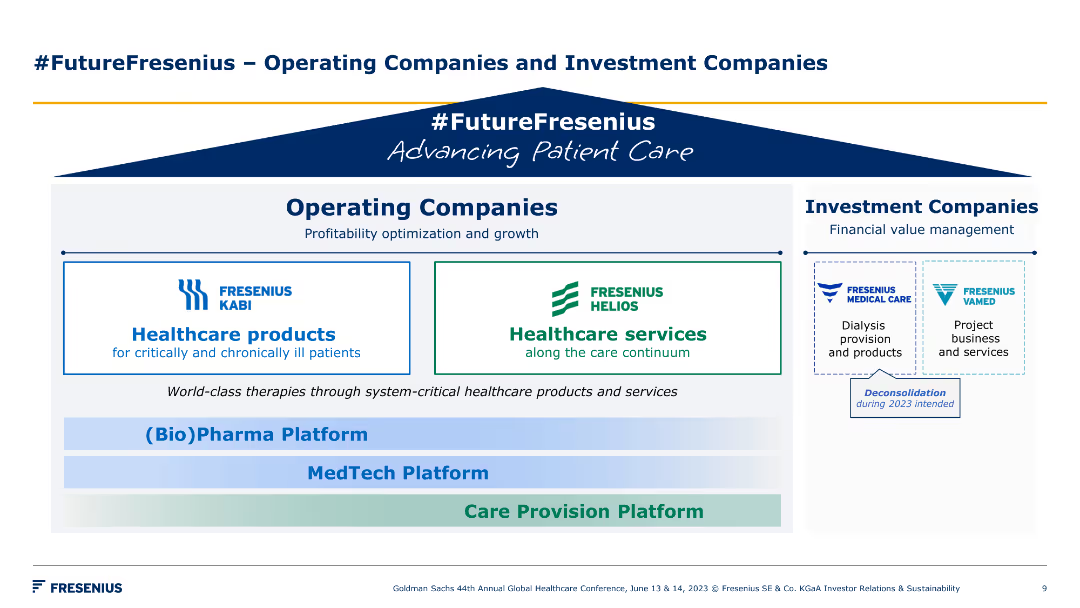
A structured diagram outlining Fresenius' operating companies and investment companies. Simple color coding distinguishes different business units and platforms.
Strategic Planning
Healthcare & Pharmaceuticals
This slide outlines the organizational structure of Fresenius, detailing the operating companies and investment platforms focused on patient care and financial management.
operating companies, investment, strategy, patient care, organizational structure, healthcare, Fresenius, platforms, growth, future
false
#FutureFresenius – Operating Companies and Investment CompaniesGoldman Sachs 44th Annual Global Healthcare Conference
Diagram
Goldman Sachs
View slide
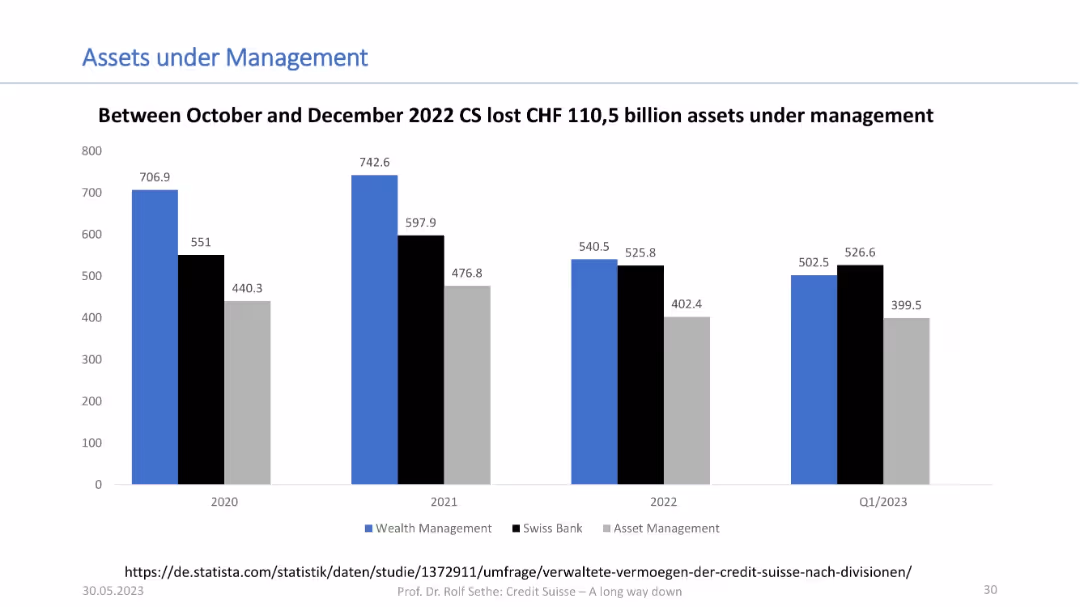
Bar chart comparing Wealth Management, Swiss Bank, and Asset Management from 2020 to Q1 2023; uses blue, black, and grey color scheme.
Financial Performance
Financial Services
This slide shows how Credit Suisse’s assets under management declined significantly between 2022 and Q1 2023, highlighting a CHF 110.5 billion drop following the October–December 2022 period. Values are broken down by business unit.
asset management, financial decline, Credit Suisse, portfolio, AUM
false
Assets under ManagementA LONG WAY DOWN
Single Chart
Credit Suisse
1
...
Next
Load More
Hold On!
We are searching in our database
If nothing, comes up, please try different filters!
Create a FREE account to continue browsing
Receive Instant Access to 1,000+ slides from companies like McKinsey, Google, and Goldman Sachs
First Name
Last Name
Email
Password
I agree to all
Terms & Privacy Policy
Thank you! Your submission has been received!
Oops! Something went wrong while submitting the form.
Have an account?
Sign in
Column Chart
Heatmap
Chevron
Org Chart
Infographic
Callouts
Timeline
List
Graphic
Picture
Process Flow
Diagram
Paragraph
Map
Table
Framework
Subtitle
Takeaway Box
Icon
Other Chart
Radar Chart
Waterfall Chart
Mekko Chart
Pie Chart
Scatter Plot
Line Chart
Bar chart
Bullet points