My Account
My Slides
Search by Category
Templates
View All Templates
Download Template Slides
Leave Feedback
Login
Logout
Get Started
Browse all Slides
Browse all Slides
Create a FREE Account
Instant access to 1,000+ real slides from top companies like McKinsey, BCG, Goldman Sachs, Google and many more!
First Name
Last Name
Email
Password
I agree to all
Terms & Privacy Policy
Thank you! Your submission has been received!
Oops! Something went wrong while submitting the form.
Have an account?
Sign in
Instant access to the internet's best slides
Get access to 40+ advanced filters and more
Advanced Search and Filters
Access to
10,000+ slides
Access to Category Pages
Save/Bookmark Slides
PowerPoint Template Library (New)
Choose your plan
MONTHLY
$12/month
Billed every month, cancel anytime.
YEARLY
$9/month
Billed $108 annually, cancel anytime.
Checkout for $12/month
Checkout for $108/yr
Secured by Stripe | AES-256 bit encryption
Spark Your Next Big Idea with New Presentation Templates
VIEW ALL Templates
Welcome,
Welcome
Upgrade to SlideStart
Pro
Instant access to 15,000+ slides
Show Featured Only
Checkbox 8
Companies
Mckinsey
Bain
BCG
EY
Deloitte
Accenture
PwC/Strategy&
JP Morgan
Goldman Sachs
Morgan Stanley
Citigroup
Deutsche Bank
Barclays
LEK
Kearney
Oliver Wyman
Booz Allen Hamilton
Gartner
IPSOS
Nielsen
Slide type
Header Horizontal
Framework
Vertical Flow
Single Chart
Single Chart
Text Only
Mixed Chart
Header Vertical
Graphic
Pillar
Multiple Chart
Agenda
Title
Table
Linear Flow
Upgrade to SlideStart
Pro
Instant access to 40+ advanced filters
Industry
Upgrade to SlideStart
Pro
Instant access to 40+ advanced filters
Technology
Healthcare
Financial Services
Consumer Goods
Energy & Utilities
Manufacturing
Retail
E-commerce
Logistics
Telecommunications
Real Estate
Professional Services
Education
Media
Entertainment
Hospitatlity
Tourism
Agriculture
Food Production
Government & Public Sector
Environmental
Sustainability
Use Case
Upgrade to SlideStart
Pro
Instant access to 40+ advanced filters
Sales and Business Development
Mergers and Acquisitions
Corporate Finance and Valuation
Performance Metrics and KPIs
Client Case Studies
Competitive Landscape
Product and Service Analysis
Customer and Market Segmentation
Organizational Structure
Human Resources and Talent Management
Industry Overview
Regulatory and Compliance
Risk Assessment and Management
Agriculture & Food Production
Hospitality and Tourism
Government
Environmental
Sustainability
Clear all
Thank you! Your submission has been received!
Oops! Something went wrong while submitting the form.
Show Featured Only
Checkbox 8
Companies
Mckinsey
Bain
BCG
EY
Deloitte
Accenture
PwC/Strategy&
JP Morgan
Goldman Sachs
Morgan Stanley
Citigroup
Deutsche Bank
Barclays
LEK
Kearney
Oliver Wyman
Booz Allen Hamilton
Gartner
IPSOS
Nielsen
Slide type
Text Only
Linear Flow
Vertical Flow
Single Chart
Header Horizontal
Mixed Chart
Header Vertical
Pillar
Multiple Chart
Graphic
Agenda
Title
Table
Framework
Industry
Technology
Healthcare
Financial Services
Consumer Goods
Energy & Utilities
Manufacturing
Retail
E-commerce
Logistics
Telecommunications
Real Estate
Professional Services
Education
Media
Entertainment
Hospitatlity
Tourism
Agriculture
Food Production
Government & Public Sector
Environmental
Sustainability
Use Case
Sales and Business Development
Mergers and Acquisitions
Corporate Finance and Valuation
Performance Metrics and KPIs
Client Case Studies
Competitive Landscape
Product and Service Analysis
Customer and Market Segmentation
Organizational Structure
Human Resources and Talent Management
Industry Overview
Regulatory and Compliance
Risk Assessment and Management
Agriculture & Food Production
Hospitality and Tourism
Government
Environmental
Sustainability
Clear all
Thank you! Your submission has been received!
Oops! Something went wrong while submitting the form.
Tag
View slide
Contains column charts comparing statutory RoTE across different bank divisions over several years.
Financial Performance
Financial Services
Demonstrates how different bank divisions contribute to overall growth and performance, emphasizing improvements and future targets.
RoTE, performance, divisions, growth, targets
false
Better returns: our divisions contribute through growth and performanceFY 2023 Results Announcement
Multiple Chart
Barclays
View slide
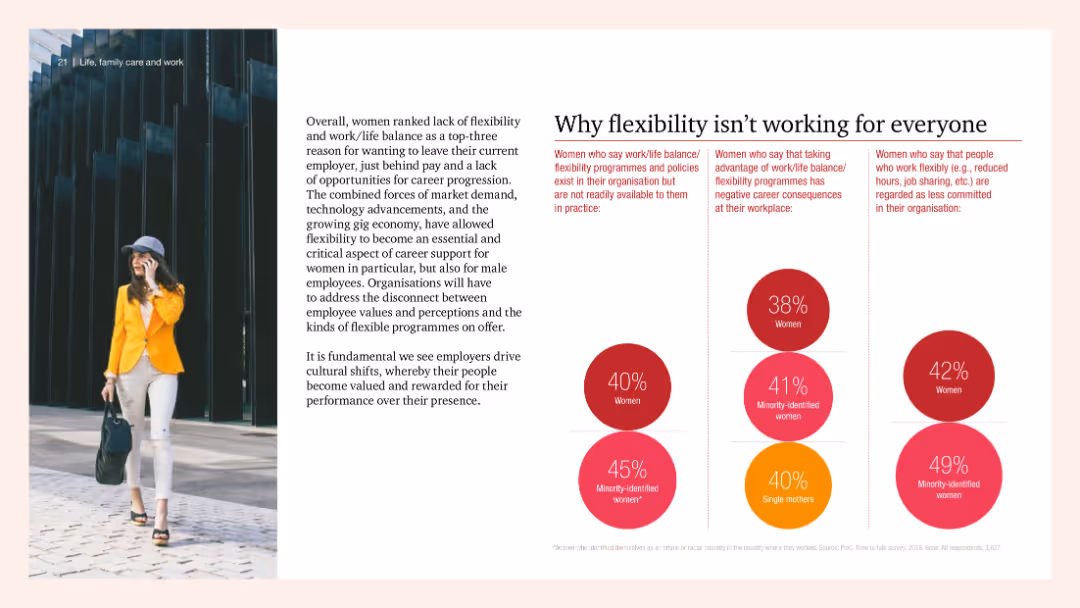
Combination of text and pie charts detailing women's dissatisfaction with work flexibility options and their perceived career impacts. Image of a professional woman on the left adds a visual context to the discussion.
Human Resources and Talent Management
Professional Services
The slide discusses why flexibility programs are not meeting the needs of women, highlighting statistics on dissatisfaction and negative career impacts for women taking advantage of flexible work options.
flexibility, women, career, dissatisfaction, work
false
Why flexibility isn’t working for everyoneTime to talk: What has to change for women at work
Multiple Chart
PwC/Strategy&
View slide
Features an individual making adjustments to machinery, symbolizing proactive engagement. Includes statistics about public DEI commitments and funding.
Regulatory and Compliance
Professional Services
Highlights recent trends in DEI commitments among multinational companies and the importance of integrating DEI into business practices.
DEI, commitments, funding, multinational companies, business practices, equity
false
Taking bold action for equitable outcomes The DEI conversation shifts from activities to outcomes The readiness gapDeloitte 2023 Global Human Capital Trends Report: New fundamentals for a boundaryless world
Multiple Chart
Deloitte
View slide
This slide features a line chart depicting the maturity curve of CO₂ separation and capture technologies. It includes different colored lines representing various industries and technologies.
Technology and Digital Transformation
Energy & Utilities
It illustrates the maturity stages of CO₂ separation and capture technologies from lab work to widely deployed stages, highlighting the capital requirements and technology risk involved.
CO₂ capture, maturity curve, separation technologies, capture technologies, energy, utilities, capital requirements
false
Maturity curve of CO2 separation and capture technologiesCarbon Capture Utilization and Storage
Single Chart
Kearney
View slide
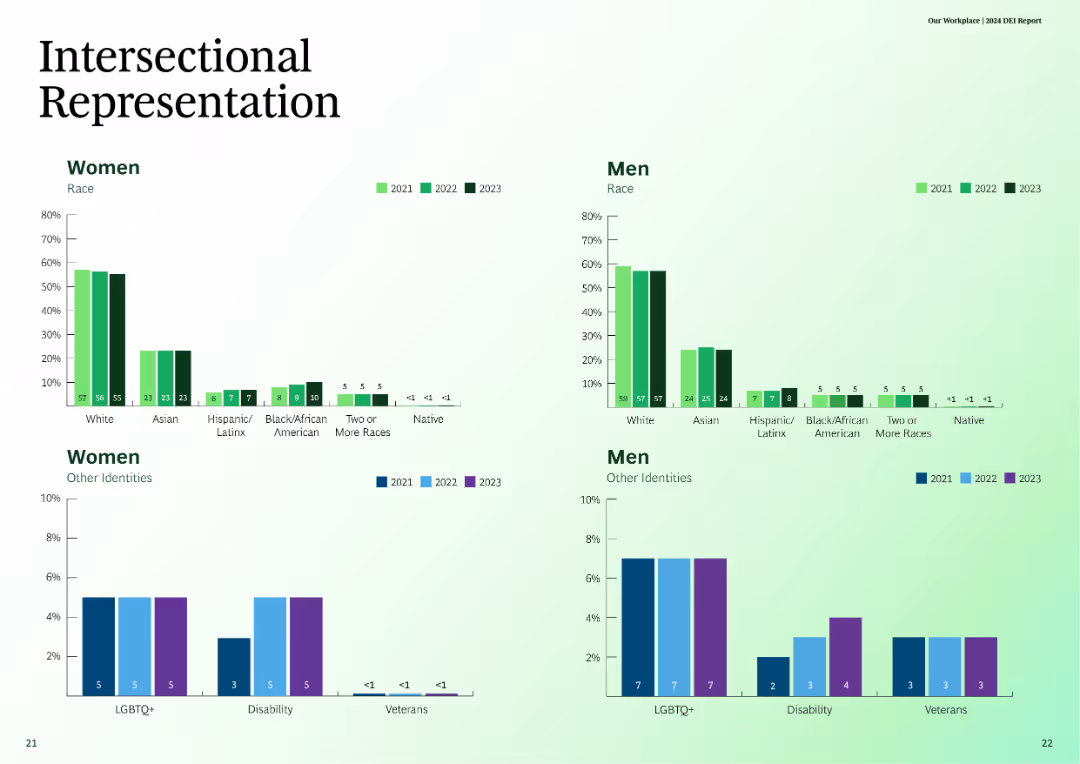
This slide uses column charts to show intersectional representation of different races and identities among men and women over three years.
Customer and Market Segmentation
Professional Services
The slide provides data on intersectional representation in terms of race and other identities among men and women in the years 2021, 2022, and 2023.
intersectional, representation, race, gender, identity
false
Intersectional RepresentationUS Diversity, Equity, and Inclusion Report
Multiple Chart
BCG
View slide
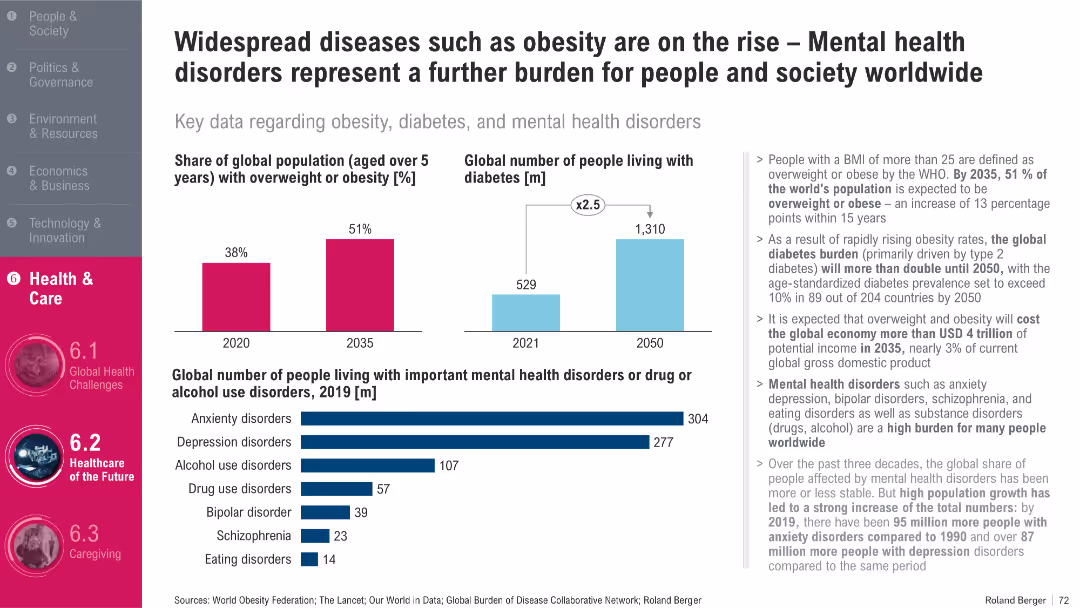
Three-part layout: bar charts (top), bullet text (right), horizontal bar chart (bottom); magenta and blue hues
Market Analysis and Trends
Healthcare & Pharmaceuticals
The slide presents key statistics on obesity, diabetes, and mental health. It notes a sharp rise in overweight populations and diabetes by 2050 and highlights the large numbers living with anxiety and depression. The data underscores the growing burden of lifestyle and psychological health issues.
Obesity, Diabetes, Mental Health, Anxiety, Depression, Global Health
false
Widespread diseases such as obesity are on the rise – Mental health disorders represent a further burden for people and society worldwideTrend Compendium 2050 Six megatrends that will shape the world
Multiple Chart
Roland Berger
View slide
Comprises three line charts for 'Sovereign EMD Spreads', 'Corporate EMD Spreads', and 'Local EMD Yields'. Includes a color-coded legend and a table summarizing the current, 1-month ago, 12-month ago, and median values. The design is sophisticated with data-rich visualizations.
Market Analysis and Trends
Financial Services
The slide evaluates the emerging markets bond sector, comparing sovereign and corporate spreads, alongside local EMD yields. It is directed at financial professionals analyzing global market trends, offering insight into the performance of emerging markets, and is instrumental for investment strategy discussions.
Emerging Markets, Bond Spreads, Yields, Investment Strategy
false
Emerging Markets Bond Market UpdateMonthly Market Monitor January 2024
Multiple Chart
Morgan Stanley
View slide
A minimalistic design with the title text prominently displayed against a light blue geometric background.
Investment Analysis
Financial Services
This slide presents the fiscal year and quarter, highlighting its purpose as an investor presentation. It is used to set the context for the financial information that will follow.
Fiscal, Quarter, Investor, Presentation, Financial
false
Fiscal Year 2021 First Quarter: Investor PresentationFiscal Year 2021 First Quarter
Title
Booz Allen Hamilton
View slide
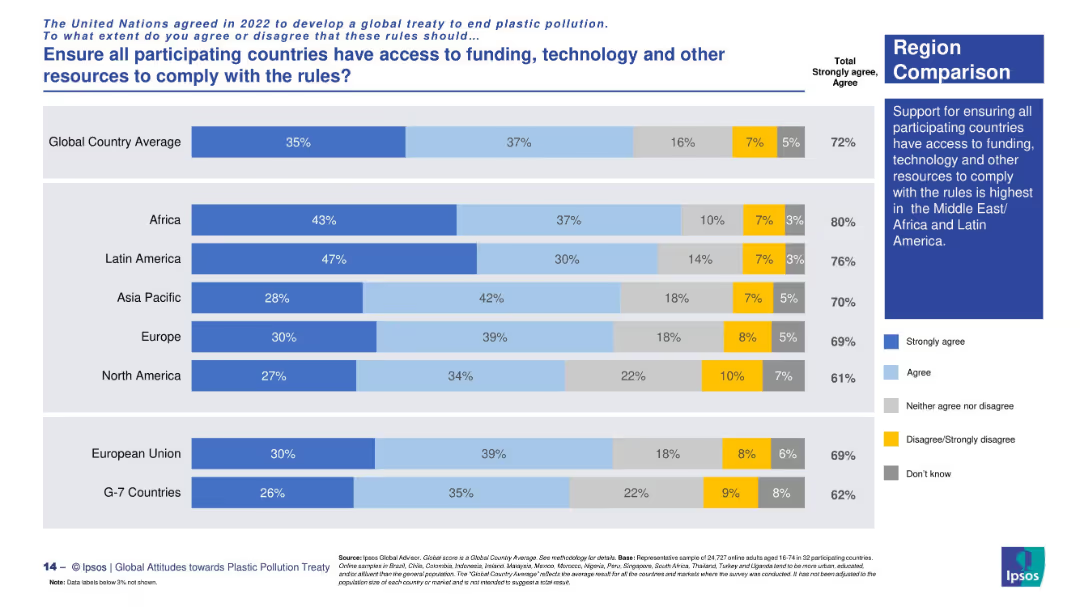
Horizontal bar chart with region-based comparison. Uses five-color segmented bars to represent opinion distribution across global regions. A text box on the right summarizes key insight.
Regulatory and Compliance
Government & Public Sector
This slide shows regional public opinion on ensuring equitable access to funding, technology, and other resources to help countries comply with UN plastic pollution treaty rules. Africa and Latin America show the strongest support.
UN treaty, plastic pollution, regional support, funding access, technology equity, Africa, Latin America, compliance support
false
Ensure all participating countries have access to funding, technology and other resources to comply with the rules?Attitudes towards a global plastic pollution treaty
Mixed Chart
IPSOS
View slide
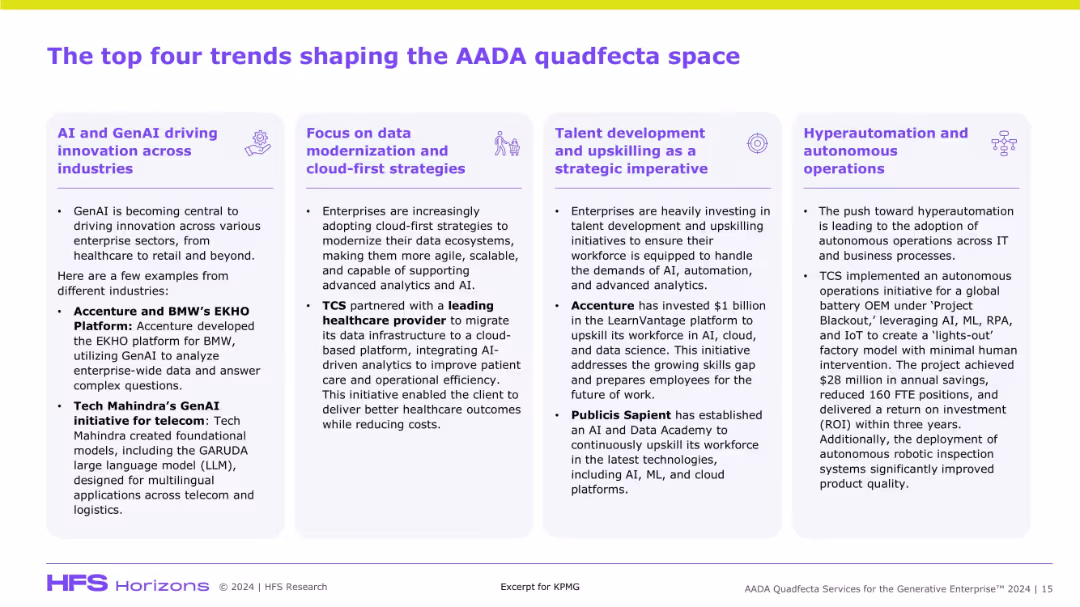
Four-column layout with bold headings and icons per trend. Purple and white color palette with bullet point explanations and industry use cases.
Technology and Digital Transformation
Artificial Intelligence
The slide outlines key trends influencing AADA (Analytics, Automation, Data, AI), including GenAI innovation, cloud modernization, talent upskilling, and hyperautomation. Examples like BMW, TCS, and Accenture support each trend’s relevance across sectors.
AADA, GenAI, cloud, talent, automation, TCS, Accenture, data strategies, transformation, AI initiatives
false
The top four trends shaping the AADA quadfecta spaceAADA Quadfecta Services for the Generative Enterprise™, 2024
Pillar
KPMG
View slide
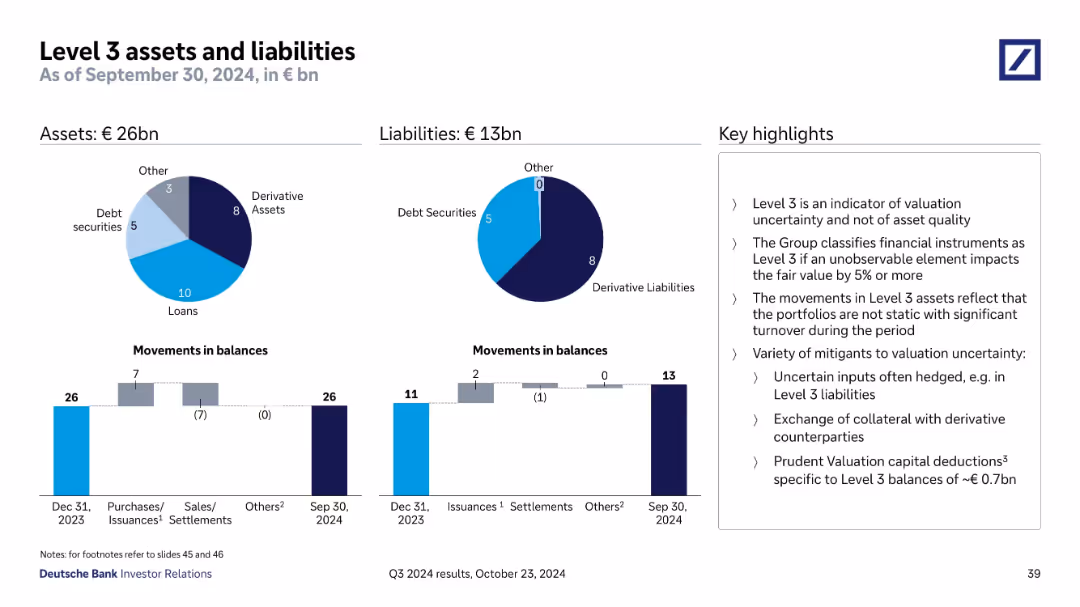
Features pie charts for assets and liabilities, bar charts for movement in balances over time, and a bulleted key highlights section.
Regulatory and Compliance
Financial Services
Summarizes Level 3 assets (€26bn) and liabilities (€13bn), categorizing by type (loans, derivatives, debt securities). Emphasizes valuation uncertainty and hedging strategies, and outlines balance movement from 2023 to Q3 2024.
Level 3, Assets, Liabilities, Valuation, Derivatives, Loans
false
Level 3 assets and liabilitiesQ3 2024 results
Multiple Chart
Deutsche Bank
View slide
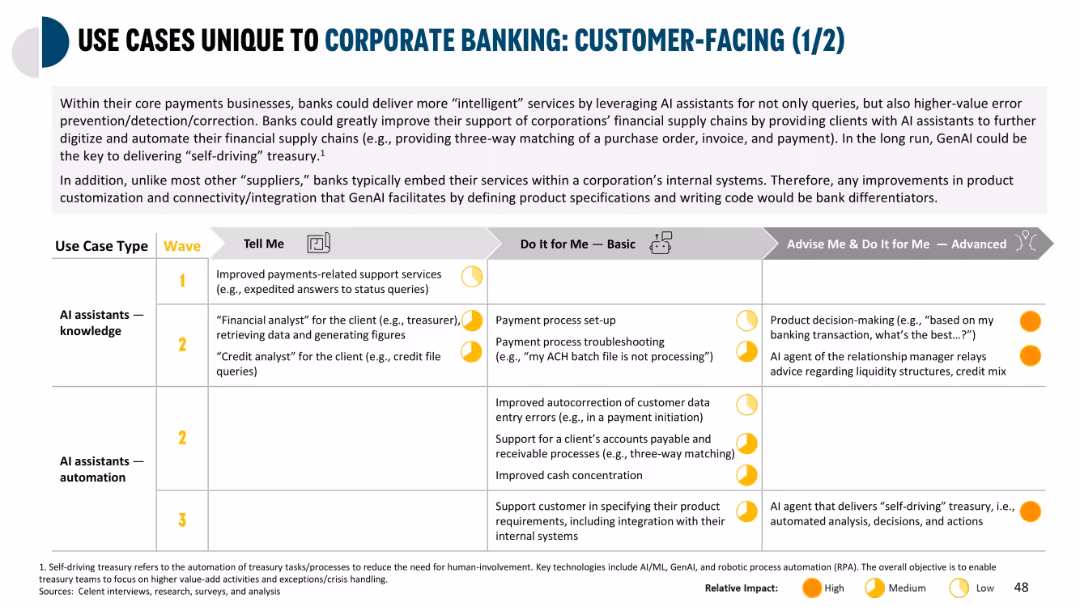
Structured matrix with three AI capability columns; icons for service categories; color-coded impact circles
Customer and Market Segmentation
Financial Services
Highlights AI assistant capabilities for corporate banking clients across knowledge and automation use cases. It describes functions such as payment help, financial advice, product setup, and integration support.
AI assistant, customer support, payment setup, digital transformation, corporate clients
false
USE CASES UNIQUE TO CORPORATE BANKING: CUSTOMER-FACING (1/2)Generative AI Making Waves
Mixed Chart
Oliver Wyman
View slide
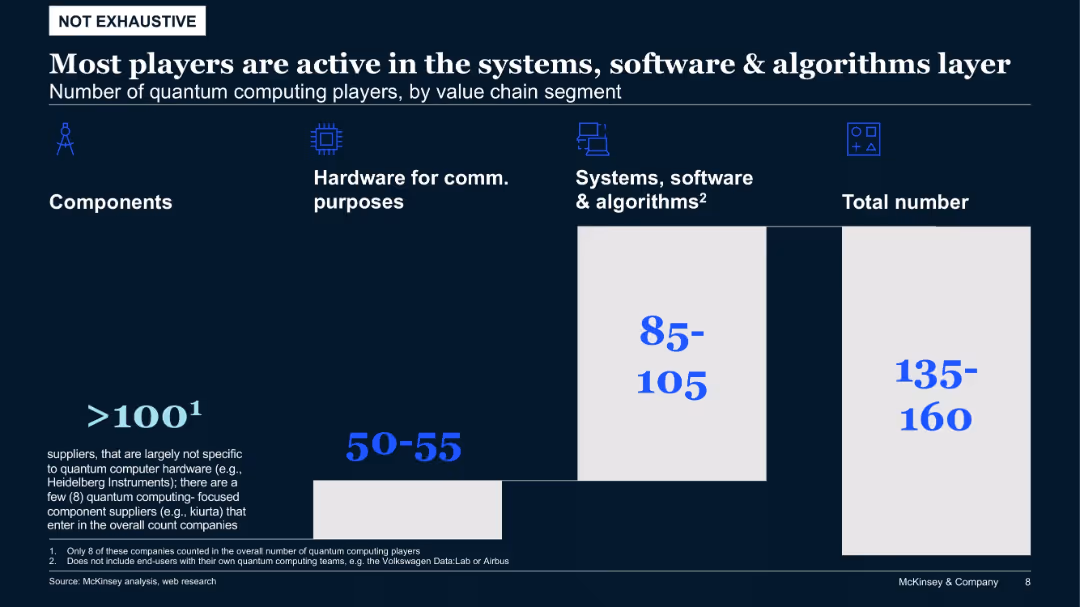
Bar-style chart comparing number of quantum players by value chain segment, with emphasis on software, hardware, and components
Product and Service Analysis
Artificial Intelligence
The majority of quantum computing players operate in the software and algorithms domain. Fewer focus on hardware and even fewer on components. The slide helps identify dominant value chain segments within the quantum computing industry.
quantum computing, value chain, software, hardware, algorithms, component suppliers
false
Most players are active in the systems, software & algorithms layerThe Quantum Technology Monitor December 2020
Single Chart
McKinsey
View slide
Text with two bar charts showing Middle East M&A deal volumes by fiscal year and by deal size category.
Mergers and Acquisitions
Financial Services
Analyzes the Middle East M&A market's mixed performance in 2023, with data on deal volumes and the impact of economic factors.
M&A, Middle East, deals, volumes, fiscal, year, market, analysis, economic
false
In 2023, the global mergers and acquisitions (M&A) market showed a mixed performance.2024 TransAct Middle East
Mixed Chart
PwC/Strategy&
View slide
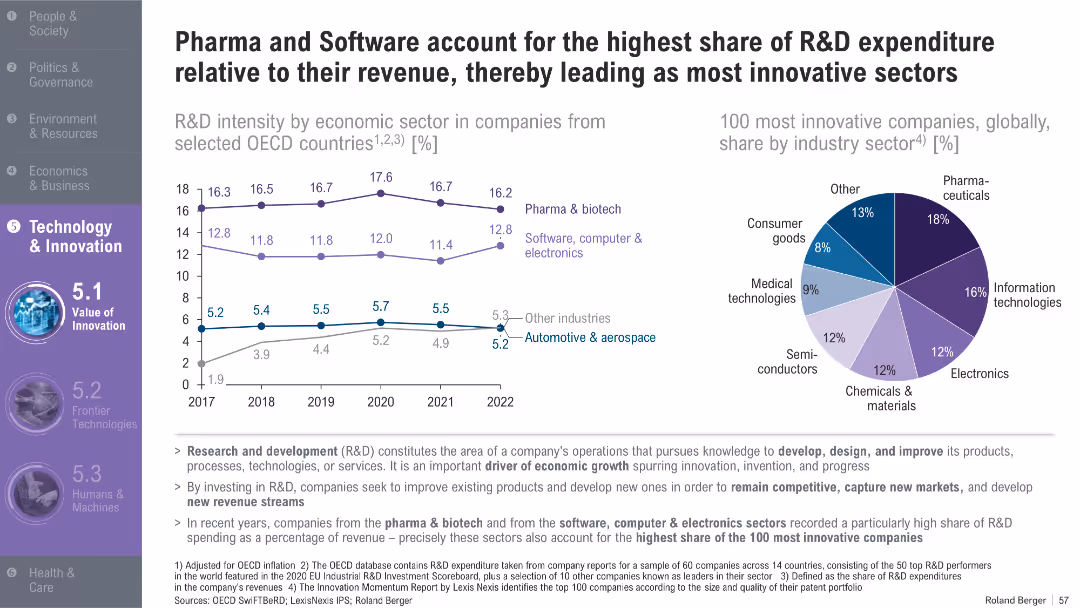
Line graph showing R&D intensity across sectors (2017–2022); pie chart for most innovative industries globally; supportive bullet points
Product and Service Analysis
Healthcare & Pharmaceuticals
This slide compares R&D spending relative to revenue in key sectors, showing that pharma and software consistently lead. A global innovation ranking further supports their dominance among top-performing firms.
R&D intensity, pharma, software, innovation, OECD, biotech, electronics, expenditure, sectors, competitiveness
false
Pharma and Software account for the highest share of R&D expenditure relative to their revenue, thereby leading as most innovative sectorsTrend Compendium 2050 Six megatrends that will shape the world
Multiple Chart
Roland Berger
View slide
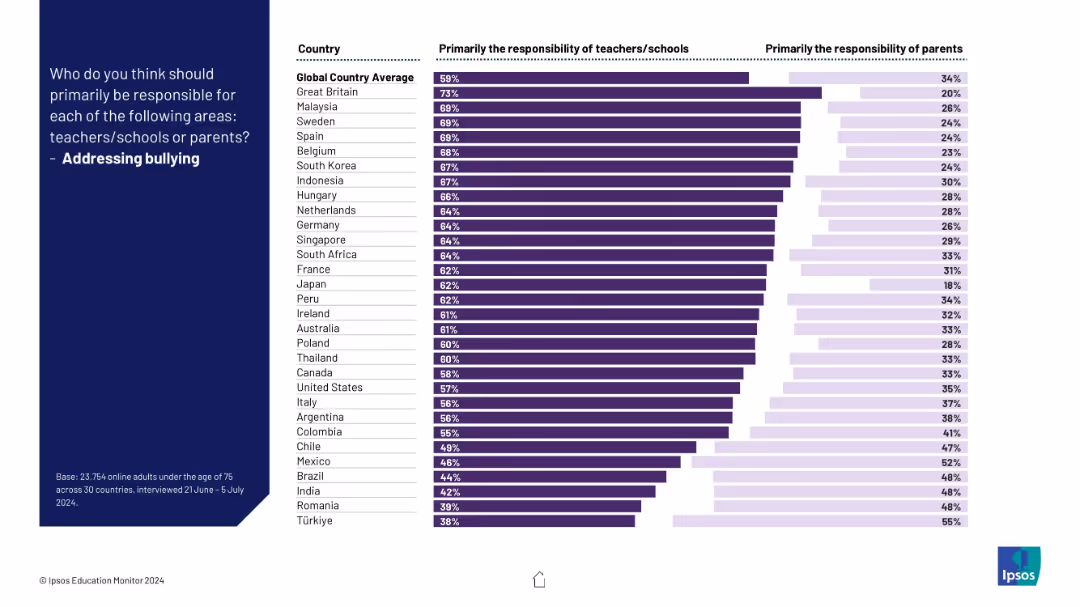
Bar chart contrasting opinions across countries on responsibility for tackling bullying; purple bars show division of roles.
Risk Assessment and Management
Education & Training
This slide assesses who is seen as responsible for addressing bullying in schools. Most countries favor institutional responsibility, though views differ significantly.
bullying, responsibility, schools, teachers, parents, children, survey, mental health, Ipsos, countries
false
Addressing bullyingIPSOS EDUCATION MONITOR 2024
Mixed Chart
IPSOS
View slide
This slide displays a combination of a line graph and bar chart, detailing incremental cases and tests per day in Italy during the COVID-19 pandemic. Key dates and actions are annotated. It has a blue and black color scheme with text boxes for annotations.
Market Analysis and Trends
Healthcare & Pharmaceuticals
The slide presents data on COVID-19 case numbers and testing frequency in Italy, highlighting the timeline of government actions and their impact. It's useful for analyzing the effectiveness of policy measures in pandemic management.
Italy, COVID-19, Lockdown, Testing, Case Numbers
false
Italy: As the country scales testing, the effects of national lockdown on viral transmission have yet to be determinedCOVID-19: Briefing Note
Single Chart
McKinsey
View slide
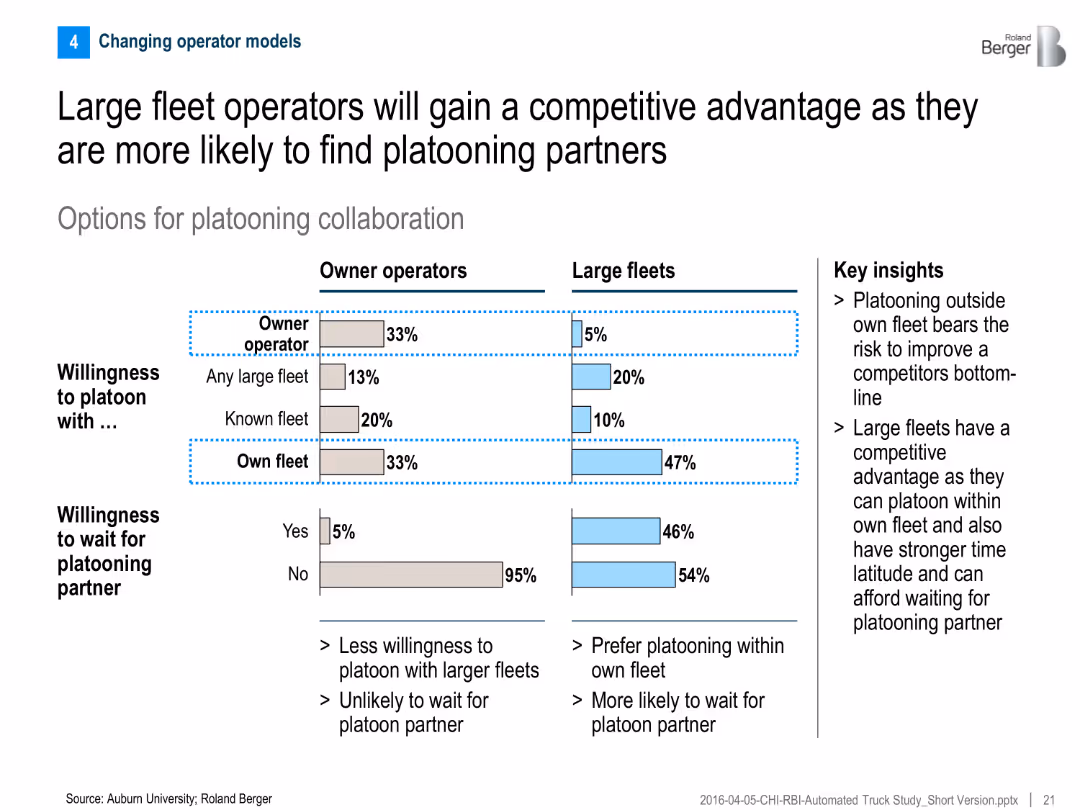
Comparative bar chart for owner operators vs. large fleets on willingness to platoon; includes key insight text on right
Competitive Landscape
Transportation & Logistics
The slide compares platooning preferences between owner operators and large fleets, showing that large fleets are more willing and able to platoon, giving them a strategic advantage.
Platooning, fleet operators, collaboration, competitive advantage, willingness to wait, truck automation
false
Large fleet operators will gain a competitive advantage as they are more likely to find platooning partnersAutomated Trucks The next big disruptor in the automotive industry?
Mixed Chart
Roland Berger
View slide
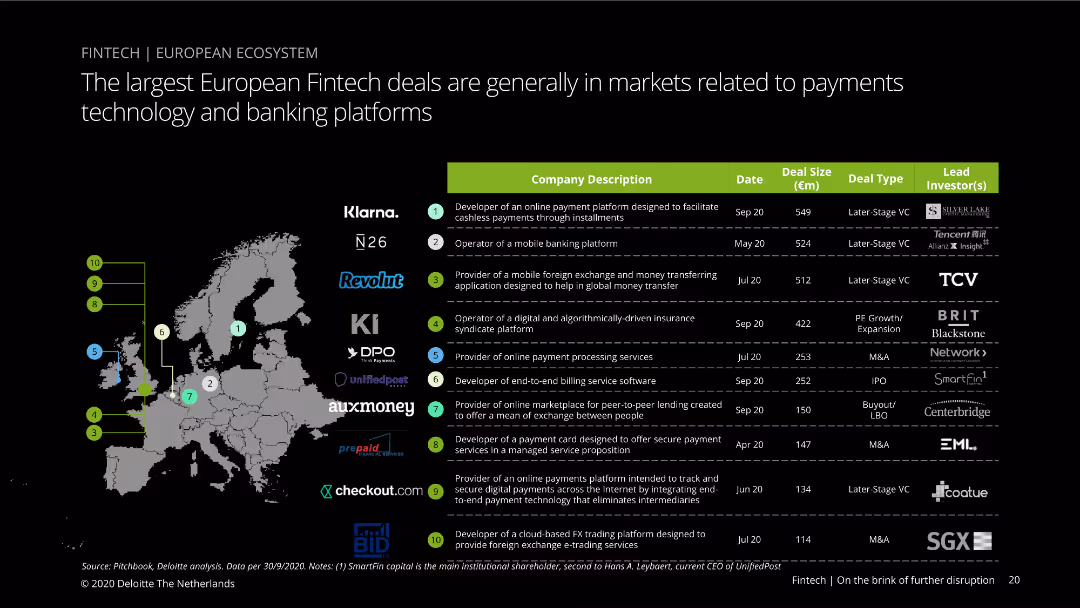
The slide features a map of Europe with markers indicating the location of fintech companies involved in significant deals. A table lists company names, descriptions, deal sizes, dates, and lead investors. Visual complexity is moderate to advanced.
Market Analysis and Trends
Financial Services
The slide presents the top fintech deals in Europe, highlighting key players, deal sizes, and leading investors. It's useful for analyzing trends in fintech investment and identifying major market players.
Fintech, deals, Europe, investors, companies, trends, market
false
The largest European Fintech deals are generally in markets related to payments technology and banking platformsFintech | On the brink of further disruption
Table
Deloitte
View slide
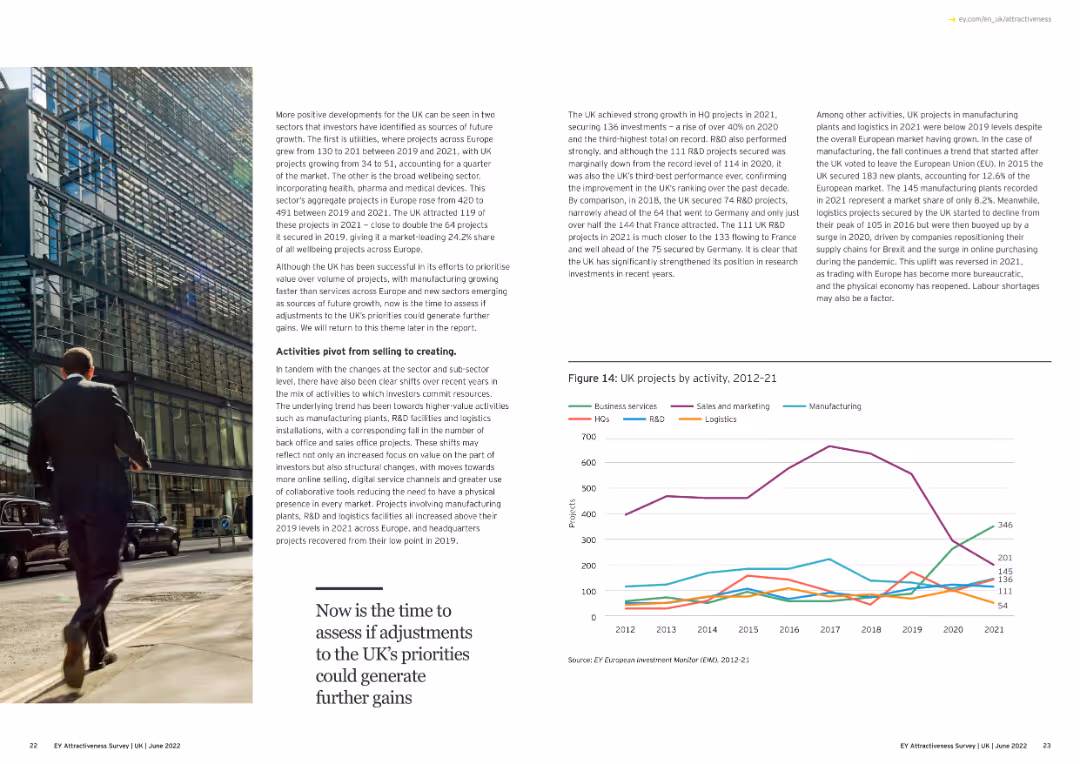
The slide features a line chart showing the leading sectors for investment in the UK from 2012 to 2021, with lines representing different sectors.
Market Analysis and Trends
Financial Services
This slide highlights the top sectors attracting investment in the UK over the years, providing insight into economic focus areas.
investment, sectors, UK, trends, 2012-21
false
More positive developments for the UK can be seen in two sectors that investors have identified as sources of future growth.Adapting to a changed world EY Attractiveness Survey
Mixed Chart
EY
View slide
Features a combination of text and graphics, including column charts that compare assets under custody and administration over a four-year span. The graphics are paired with descriptive text on the left.
Strategic Planning
Financial Services
The slide discusses the growth of the Securities Services division through new business wins, client retention, and market expansion. The charts compare assets under custody and administration from 2015 to 2019, indicating significant growth. This illustrates strategic achievements and market penetration.
growth, strategy, clients, market expansion, assets, custody, administration
false
Driving growth through new business wins, expansion of existing relationships, and investments in new capabilities and marketsCORPORATE & INVESTMENT BANK 2020
Multiple Chart
JP Morgan
View slide
The slide features bar charts showing US consumer behavior in terms of price sensitivity (sticker shock) and substitutability (trading down) from March 2022 to February 2023. Commentary on the right explains observed trends.
Market Analysis and Trends
Consumer Goods
The slide analyzes US consumer behavior under inflationary pressures, showing reduced price sensitivity and trading down trends since early 2023. It suggests that consumers are still cautious about prices despite slight easing of headline inflation.
US consumer behavior, price sensitivity, inflation, trends, trading down
false
US consumers report reductions in their price sensitivity and pressure to trade down since the beginning of 2023, but both metrics remain elevated amidst persistent inflationMarch Macro Brief Financial fissures emerge
Multiple Chart
Accenture
View slide
Features a column chart with percentages, blue columns, SEA country flags, and a title on top.
Market Analysis and Trends
Technology & Software
Provides predictions on the continued use of digital services by new consumers in SEA countries post-COVID-19.
digital services, future predictions, SEA, post-COVID-19, consumers
false
9 in 10 new digital consumers intend to continue using digital services going forwarde-Conomy SEA 2020 At full velocity: Resilient and racing ahead
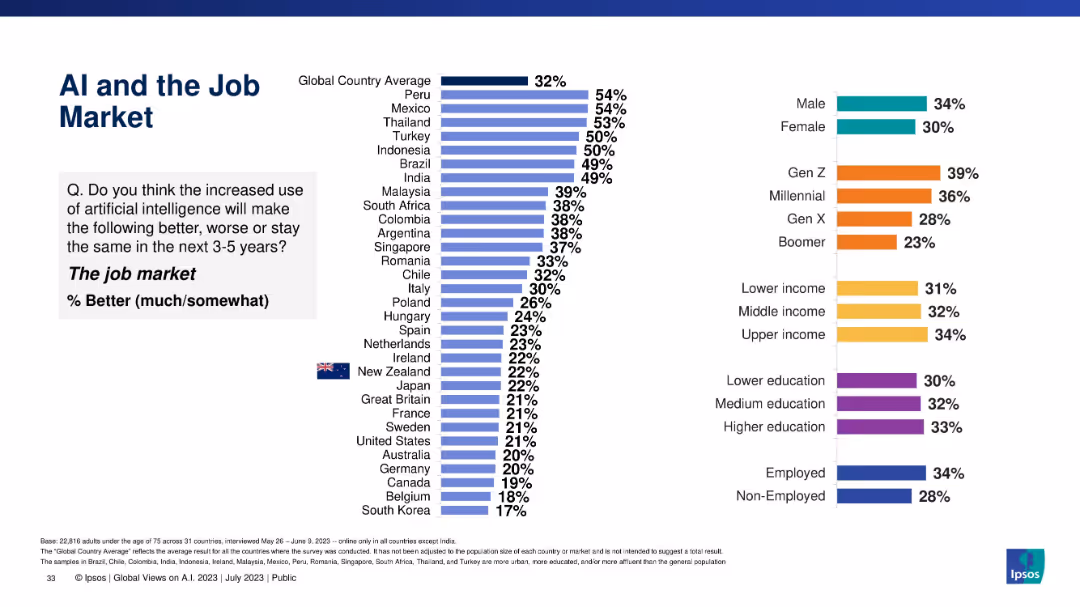
Single Chart
Bain
View slide
Comparative bar chart showing beliefs about AI’s impact on the job market, with demographic and global breakdowns, ranked by positivity.
Market Analysis and Trends
Artificial Intelligence
The slide captures a largely skeptical view of AI improving the job market, especially in developed countries. Gen Z is more optimistic, but most countries rank low on job market positivity from AI.
AI, job market, perception, global comparison, Ipsos, demographics, workforce, economic impact, employment trends
false
AI and the Job MarketGLOBAL VIEWS ON A.I. IN 2023
Multiple Chart
IPSOS
View slide
Two column charts comparing the percentage spend on circular materials in direct and indirect categories across various percentages. Each chart is clearly labeled with scales and categories.
Product and Service Analysis
Environmental Services & Sustainability
Presents survey results assessing the inefficiency in material use, showing the percentage of spend on sustainable vs. non-sustainable materials. It highlights areas for potential improvement in sustainability practices.
Sustainability, Materials, Inefficiency, Survey, Circular Economy
false
Inefficiency assessment (1/5)Nordic Circular Economy Playbook 2.0
Multiple Chart
Accenture
View slide
Slide with a blue and white color scheme, containing a title, a column chart of SEA-based funds' dry powder, and a sidebar with bullet points.
Market Analysis and Trends
Financial Services
Discusses investors' caution, the significance of dry powder, and the potential for investment opportunities.
investors, dry powder, SEA, capital, funds, caution, activity, opportunities
false
Investors remain cautious but ample dry powder maintains activity levelse-Conomy SEA 2020 At full velocity: Resilient and racing ahead
Mixed Chart
Bain
View slide
The slide presents survey findings on cryptocurrency ownership among Norwegian adults. It includes a column chart showing the percentage of adults owning crypto from 2018 to 2022 and a summary of key points about demographic trends and adoption rates.
Market Analysis and Trends
Financial Services
Highlights a survey by Arcane Research and EY showing that 10% of Norwegian adults own cryptocurrency, with a significant increase in adoption among young adults and females in the last year. Summarizes key demographic trends and growth over time.
Cryptocurrency, Norway, Survey, Adoption, Demographics
false
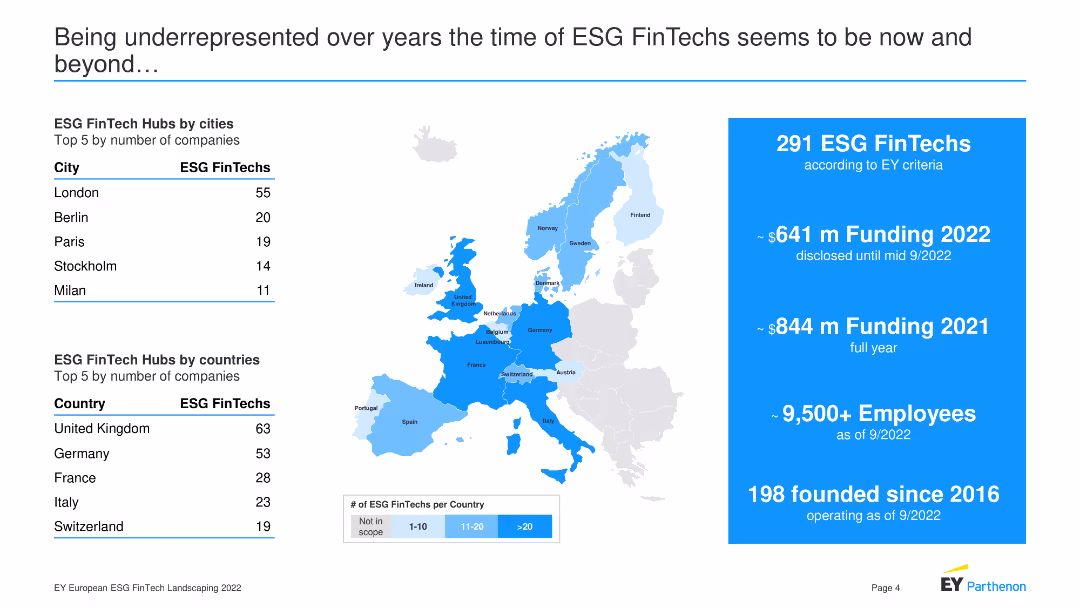
Being underrepresented over years the time of ESG FinTechs seems to be now and beyond…EY European ESG FinTech Landscaping
Mixed Chart
EY
View slide
Three column charts showing reductions in credit portfolio exposure, Prime Services credit RWA, and WM Ship Financing credit exposure for 1Q21 vs. 1Q22.
Risk Assessment and Management
Financial Services
Highlights the focused reductions in higher risk areas, including credit portfolio de-risking, Prime Services reduction, and successful repositioning of Ship Finance, showing percentage decreases in risk exposure over time.
risk reduction, credit portfolio, Prime Services, Ship Financing, de-risking
false
The focused reductions have been on higher risk areasInvestor Deep Dive 2022
Multiple Chart
Credit Suisse
View slide
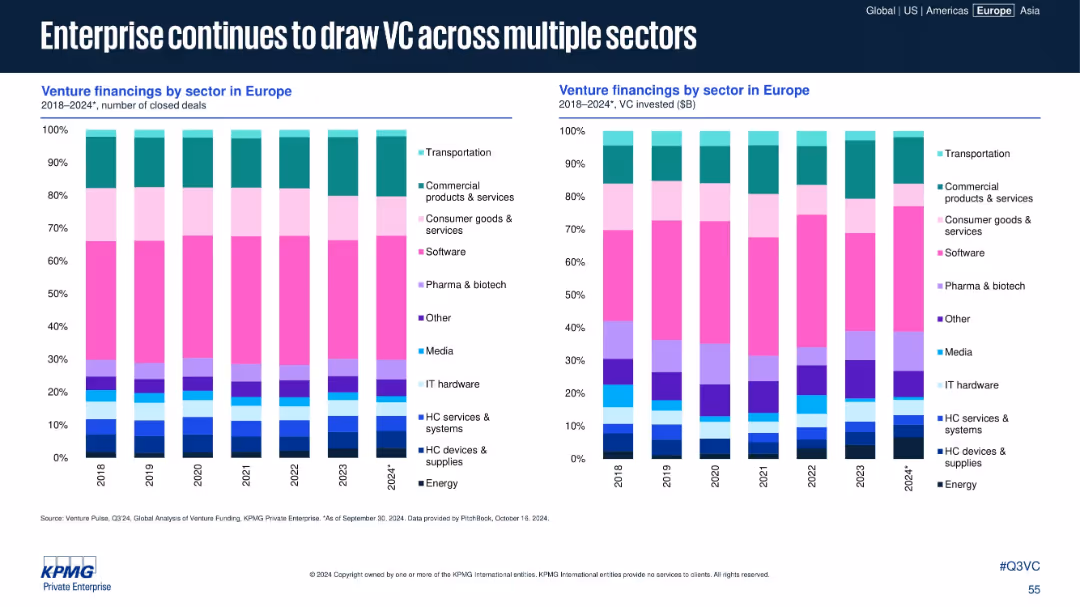
Two stacked bar charts showing sector-wise financing by deal count and VC dollars invested from 2018–2024
Customer and Market Segmentation
Technology & Software
This slide analyzes the distribution of VC investment across sectors in Europe. Enterprise-focused sectors such as software, commercial services, and transportation attract consistent investment, highlighting sustained sector interest.
enterprise, VC sector, software, biotech, transportation, deal count
false
Enterprise continues to draw VC across multiple sectorsVenture Pulse Q3 2024
Multiple Chart
KPMG
View slide
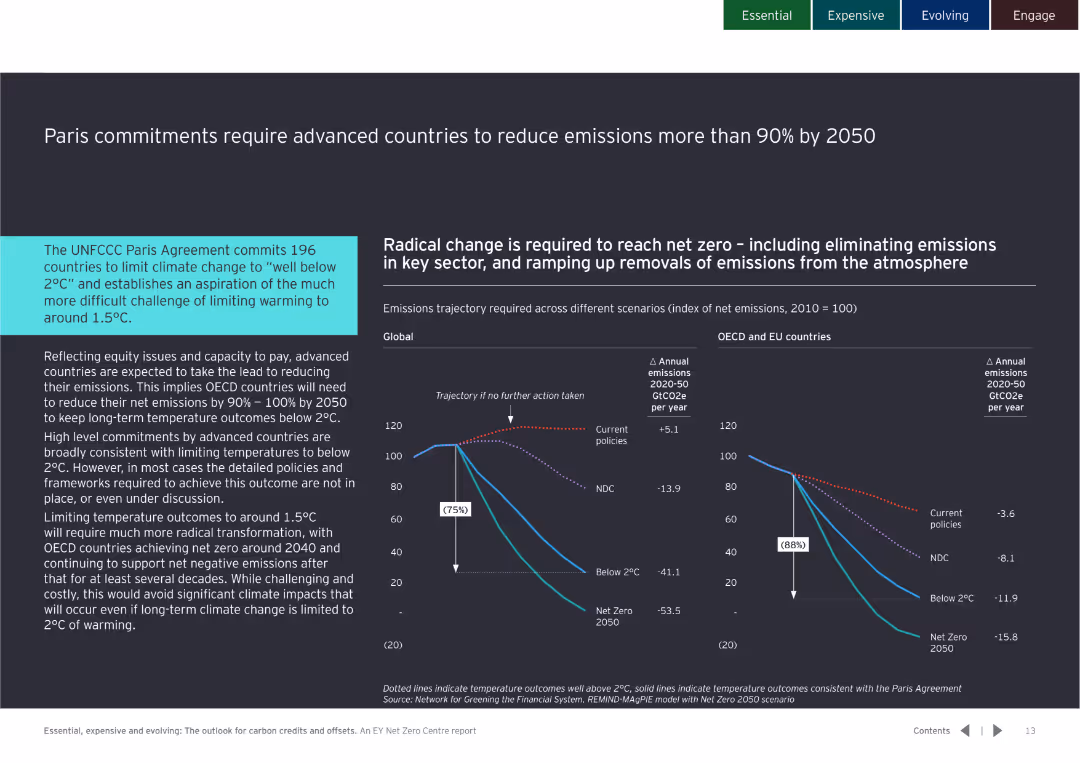
Contains detailed text with a line chart showing emissions trajectories for different scenarios from 2020 to 2050.
Regulatory and Compliance
Government & Public Sector
Highlights the need for OECD countries to reduce emissions by 90-100% by 2050 to meet Paris Agreement targets, emphasizing advanced countries' responsibilities.
Paris Agreement, emissions, reduction, 2050, OECD, targets, climate change, policy
false
Paris commitments require advanced countries to reduce emissions more than 90% by 2050Essential, expensive and evolving: The outlook for carbon credits and offsets
Multiple Chart
EY
View slide
This slide presents column charts and a table detailing additional losses required for a margin call across various leverage levels, showing peak-to-trough data and recovery times.
Risk Assessment and Management
Financial Services
It provides an analysis of the additional losses necessary to trigger margin calls, highlighting the buffer provided by recommended leverage levels during downturns.
losses, margin call, leverage, financial risk, recovery
false
Additional losses until a margin callHow leverage can be the best option to enhance returns and achieve your goals
Mixed Chart
UBS
View slide
This slide is advanced with a complex design that integrates a full text section and column chart. It provides a comprehensive view with various textual elements and data visualizations with a focus on CEO opinions on climate change initiatives over a decade.
Market Analysis and Trends
Environmental Services & Sustainability
It delves into the shift in CEO perspectives on climate change, comparing data from 2010 and 2020. The bar charts highlight the increased recognition of climate change initiatives' benefits. This slide would be relevant in discussions regarding business strategies in the context of environmental sustainability and corporate responsibility.
CEO, Climate Change, Survey, Decade Comparison, Benefits, Investments, Sustainability, Corporate Responsibility
false
Our survey shows that CEOs express a growing, if still subdued, appreciation of the upside of taking action to reduce their carbon footprint.PwC's 23rd Annual Global CEO Survey
Mixed Chart
PwC/Strategy&
View slide
This slide features a line chart showing the TRREB average price forecast from 1988 to 2021 (F). The line is blue, indicating a projected rise in average prices.
Market Analysis and Trends
Real Estate & Construction
The slide forecasts the average price trend for TRREB MLS® system, providing insights into future pricing dynamics based on historical data trends.
TRREB, average price, price forecast, line chart, pricing trends
false
Market Conditions Will Tighten in 2021Market Year in Review and Outlook 2021
Single Chart
IPSOS
View slide
The slide presents a column chart comparing technology and product investments in dollars over years 2019 and 2022 Outlook. There's a side section listing impacts of technology investments with corresponding percentage values and brief descriptions. Colors differentiate categories and investments over time.
Market Analysis and Trends
Technology & Software
This slide is likely used for presenting financial investment growth in technology over time, highlighting areas of tech impact, and business strategy alignment. It visualizes investment data to demonstrate strategic focus and outcomes.
investments, technology, growth, impact, strategy, finance, data visualization, business, planning, analytics
false
We continue to deliver customer and business value as we modernize our technologyConsumer & Community Banking
Mixed Chart
JP Morgan
View slide
The slide compares FinTech category adoption rates in 2015 and 2017, featuring two sets of icon-based lists for different years, connected by an arrow.
Market Analysis and Trends
Financial Services
The slide highlights the shift in FinTech adoption from 2015 to 2017, showing increased adoption rates in categories like money transfer and insurance.
FinTech, services, players, adoption, trends
false
New services and new players are driving higher adoptionInsights from the EY FinTech Adoption Index and EY FinTech Australia Census
Table
EY
View slide
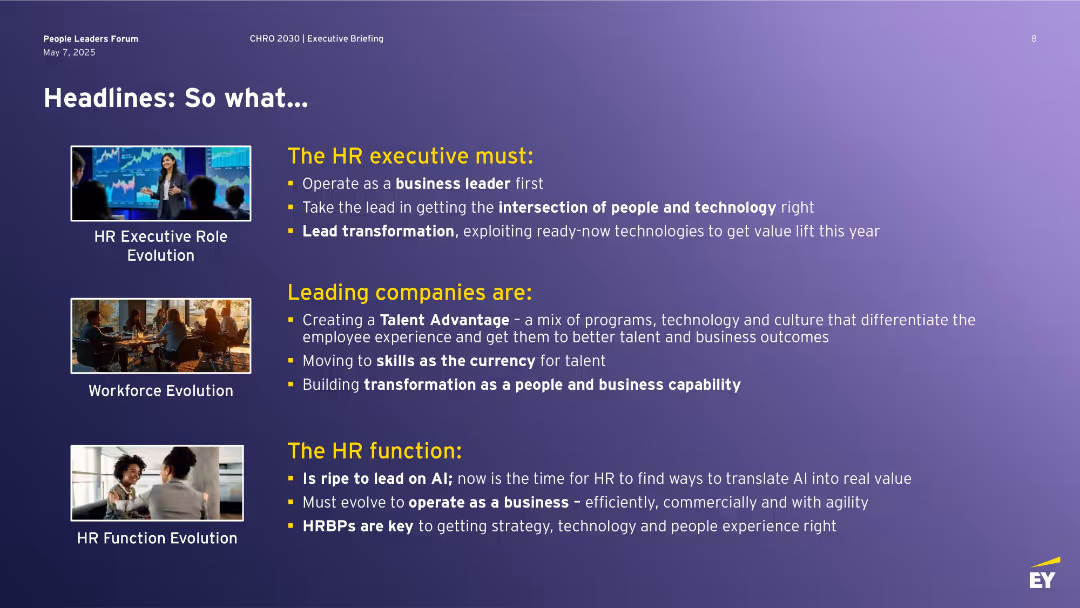
Purple background with three section blocks on HR role evolution, each with a photo and bullet-point text explaining HR's current imperatives.
Human Resources and Talent Management
Professional Services
Summarizes the evolving responsibilities of HR executives, emphasizing their role as business leaders who lead transformation by integrating technology and people strategy. Discusses how companies are shifting to skills-based models and AI adoption, and the need for HRBPs to deliver business outcomes through transformation and people experience strategies.
HR, transformation, talent advantage, AI, people strategy, HRBP, skills-based models
false
Headlines: So what…People Leaders Forum
Header Vertical
EY
View slide
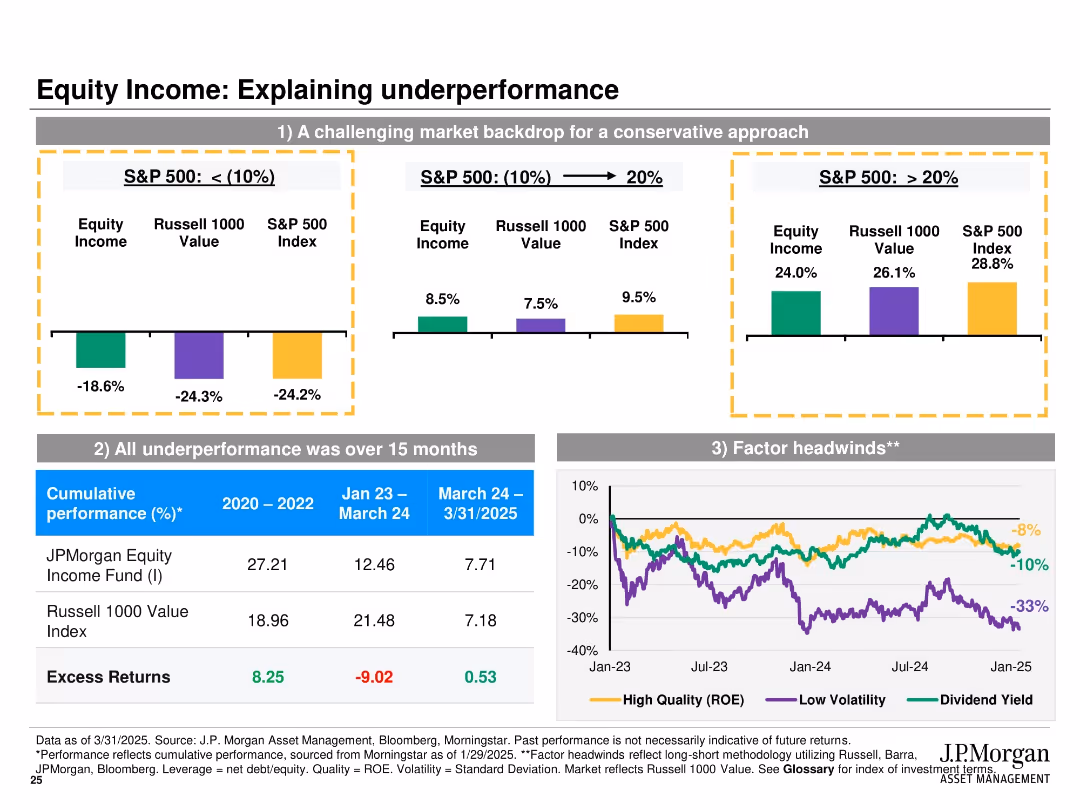
Multi-panel layout with bar charts and a line chart; panels compare performance across different S&P 500 return periods, show cumulative returns, and factor headwinds.
Performance Metrics and KPIs
Financial Services
This slide analyzes reasons for underperformance of the JPMorgan Equity Income Fund, attributing it to challenging market conditions, concentrated underperformance during a short period, and negative impacts from market factors like ROE and volatility.
underperformance, S&P 500, equity income, returns, factors, ROE, volatility, Russell 1000, analysis, headwinds
false
Equity Income: Explaining underperformanceJPMorgan Equity Income Strategy
Multiple Chart
JP Morgan
View slide
The slide includes a pie chart detailing a breakdown by property type and a line chart showing the net charge-off rate over time, comparing commercial banking to peer average. It also features text sections with bullet points.
Risk Assessment and Management
Financial Services
Analysis of credit risk management, with focus on performance, asset class strength, and exposure.
Risk, credit, performance, exposure, CRE, asset, lending, quality, portfolio, discipline
false
Maintaining risk discipline –CREInverstors Day 2023
Multiple Chart
JP Morgan
View slide
Contains a column chart and a line graph depicting the amount of investment in USD million and number of deals across various sectors including FinTech, Real Estate, etc
Market Analysis and Trends
Financial Services
Analyzes sector-wise venture capital investment and deals in 2019, emphasizing FinTech's significant share of the market
FinTech, investment, VC, sectors, 2019
false
In 2019, FinTech's have attracted ~40% of VC investment volumeBrazil Digital Report
Single Chart
McKinsey
View slide
Large text blocks with two percentage rings, detailing brand-switching statistics.
Customer and Market Segmentation
Retail & E-commerce
Analysis of the increasing trend of consumers trying different brands and small players set to benefit.
brand-switching, consumer trends, market analysis, retail, brands
false
More consumers trying different brands, and small players set to benefit mostSoutheast Asia's digital consumers: A new stage of evolution
Multiple Chart
Bain
View slide
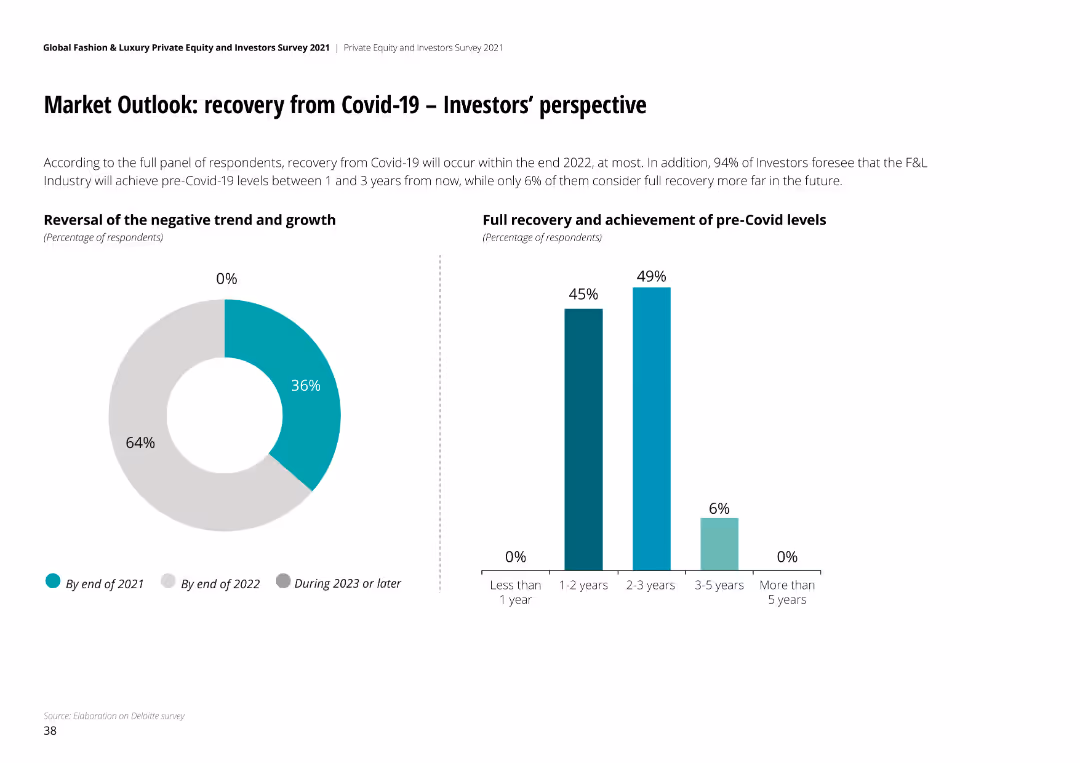
Pie chart and column chart showing timeline for recovery from Covid-19, with full recovery expected between 1 to 3 years by most investors.
Strategic Planning
Financial Services
Recovery from Covid-19 expected by end of 2022 for most investors. 94% foresee F&L industry reaching pre-Covid levels within 3 years, full recovery expected within 1-3 years.
Covid-19 recovery, F&L industry, investor perspective, recovery timeline, pre-Covid levels
false
Market Outlook: recovery from Covid-19 – Investors’ perspectiveGlobal Fashion & Luxury Private Equity and Investors Survey 2021
Multiple Chart
Deloitte
View slide
The slide employs a clean layout with a large bar chart that communicates the internet economy's growth in Singapore, along with annotations for future projections.
Financial Performance
Technology & Software
Summarizes the reach of the internet economy in Singapore, considering the challenges faced due to lockdowns, and forecasts growth, highlighting digital transformation and economic resilience.
Internet economy, Economic resilience, Lockdown challenges, Growth projection
false
Singapore Internet economy reaches $15B despite significant challenges due to lockdownse-Conomy SEA 2021 Roaring 20s: The SEA Digital Decade
Single Chart
Bain
View slide
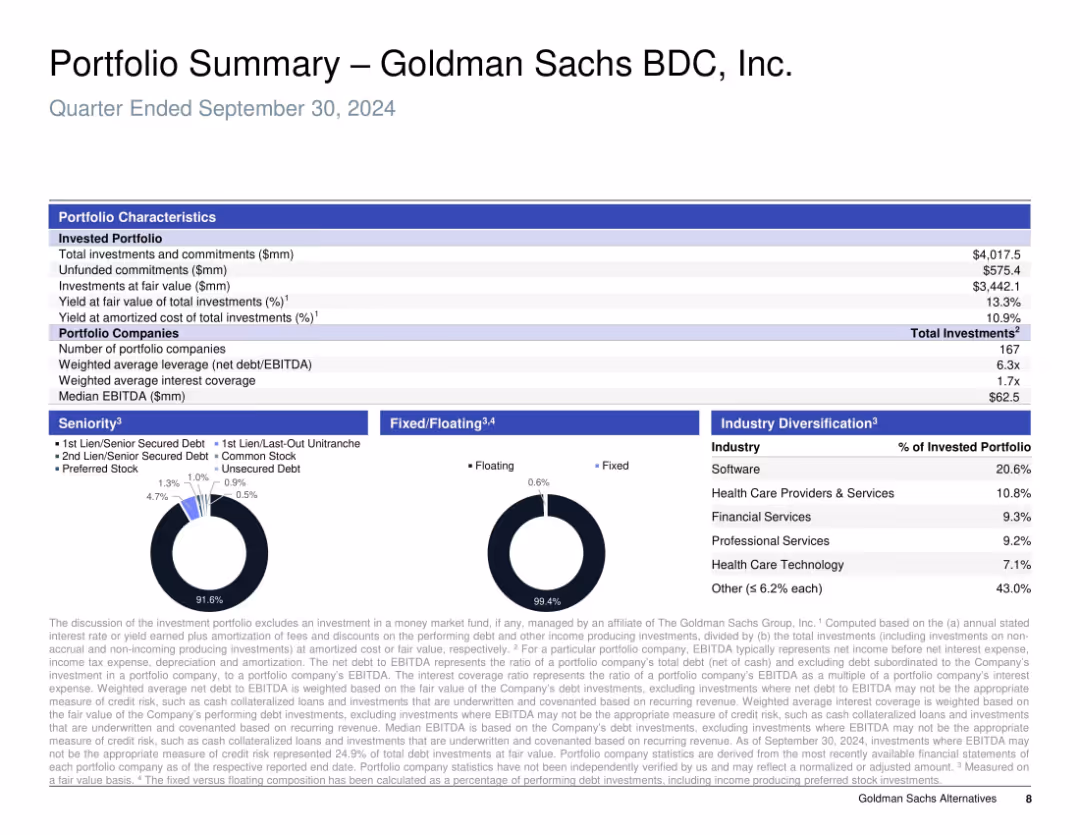
Tabular and pie chart layout; heavy use of structured text data with supporting pie charts for debt and investment diversification.
Investment Analysis
Financial Services
This slide summarizes the investment portfolio of Goldman Sachs BDC as of Q3 2024, including total investment value, sector allocation, leverage ratios, and seniority mix. It presents a snapshot of portfolio structure and performance metrics, highlighting diversification across software, healthcare, and financial services.
portfolio, investment, diversification, seniority, software, healthcare, leverage, BDC, fixed/floating
false
Portfolio Summary – Goldman Sachs BDC, Inc.Goldman Sachs BDC, Inc. Investor Presentation
Multiple Chart
Goldman Sachs
View slide
The slide features two vertical bar charts showing capital and leverage ratios, with recent FINMA rulings and guidance text on the right side, illustrating financial regulatory compliance.
Risk Assessment and Management
Financial Services
The slide discusses UBS's capital and leverage ratios, including recent FINMA rulings and future guidance, to illustrate the bank's regulatory compliance and capital management strategies.
capital ratios, leverage ratios, FINMA rulings, regulatory compliance, UBS
false
Capital and leverage ratiosSecond quarter 2023 Fixed Income investor presentation
Multiple Chart
UBS
View slide
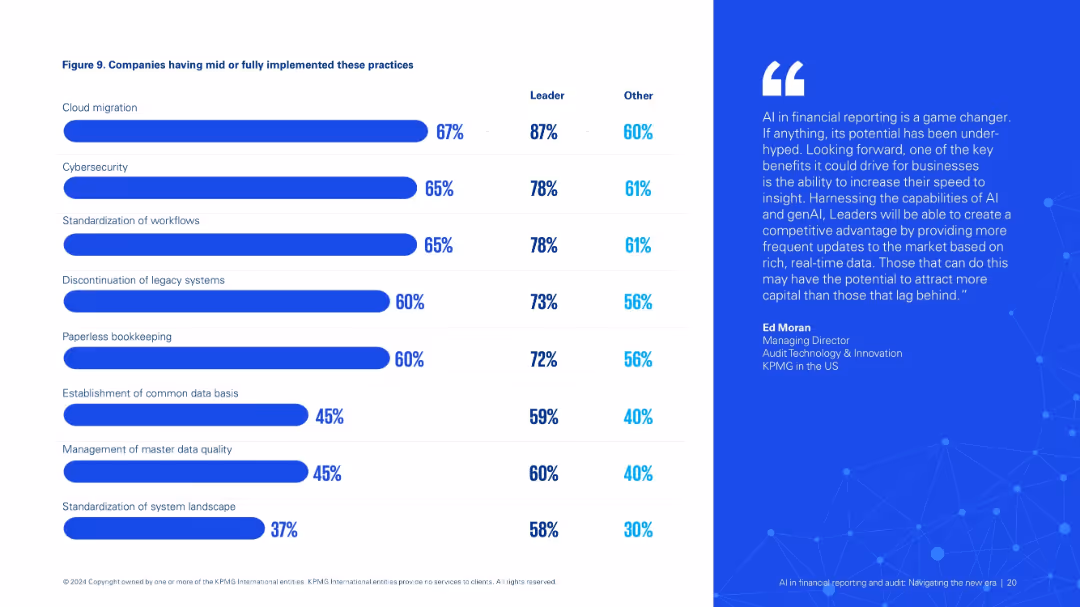
Two-column layout: left side includes implementation stats with a bar chart (Figure 9), right features a quote. Blue-white color scheme.
Operational Efficiency
Financial Services
Details implementation levels of key practices like cloud migration, cybersecurity, and workflow standardization that enable AI integration in financial reporting, especially among industry leaders.
implementation, AI adoption, cloud, cybersecurity, workflow, financial reporting
false
Companies having mid or fully implemented these practicesAI infinancial reporting and audit: Navigating the new era
Mixed Chart
KPMG
View slide
This slide juxtaposes graphical trends with textual imperatives, offering a visual and narrative guide on the concurrent management of the pandemic and economic implications. The design is straightforward with effective use of space.
Strategic Planning
Professional Services
It delineates the dual imperatives of managing the health crisis and safeguarding the economy, presenting a timeline that visually correlates the spread of the virus with economic trends, serving as a strategic guide for leaders.
Health Crisis, Economic Trends, Strategic Guide, Leadership, Pandemic Management, Timeboxing, Dual Imperatives, Graphical Representation
false
The imperative of our timeResponding to COVID-19: Addressing the economic impact of the crisis
Mixed Chart
McKinsey
View slide
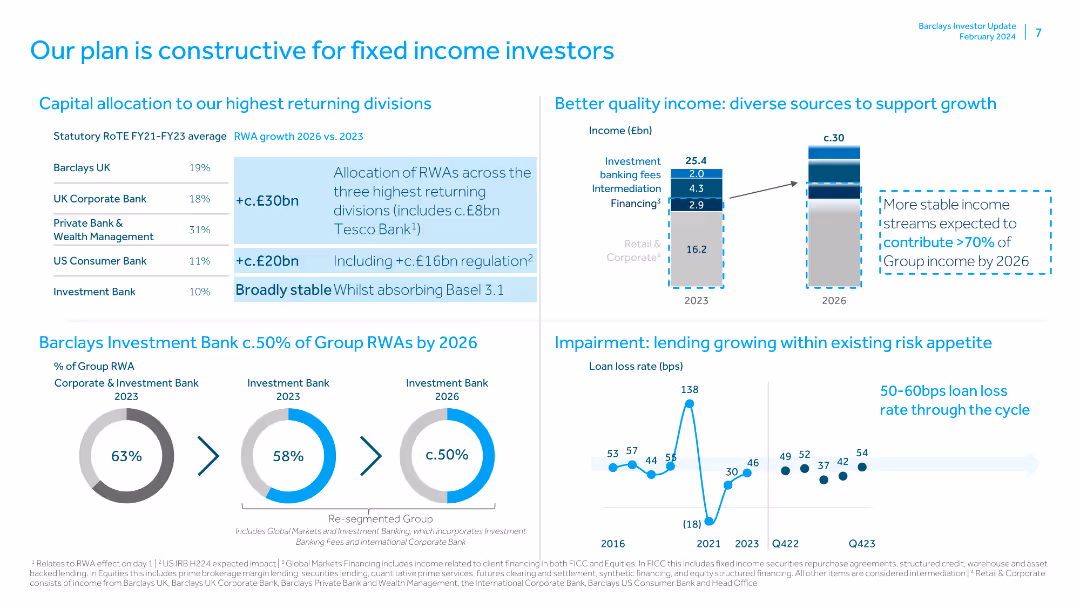
The slide includes a table of capital allocation by divisions, a bar chart of income sources, pie charts of group RWAs, and a line chart of loan loss rates, with text highlights.
Investment Analysis
Financial Services
The slide presents a plan for fixed income investors, focusing on capital allocation, quality income sources, and lending within risk appetite, supported by detailed data and projections.
Fixed Income, Investors, Capital, Allocation, Income, Risk
false
Our plan is constructive for fixed income investorsFY23 Fixed Income Investor Call 20th February 2024
Multiple Chart
Barclays
View slide
The slide features a list layout with iconography for different industries like Aircraft monitoring and Surgical robotics.
Client Case Studies
Transportation & Logistics
Highlights Ford's patents being cited across industries from agriculture to biopharma with specific examples of applications.
Ford, innovation, patents, industries, agriculture, biopharma
false
Ford’s IP is supporting innovation across industriesThe Economic Impact of Ford and the F-Series
Boxed
BCG
View slide
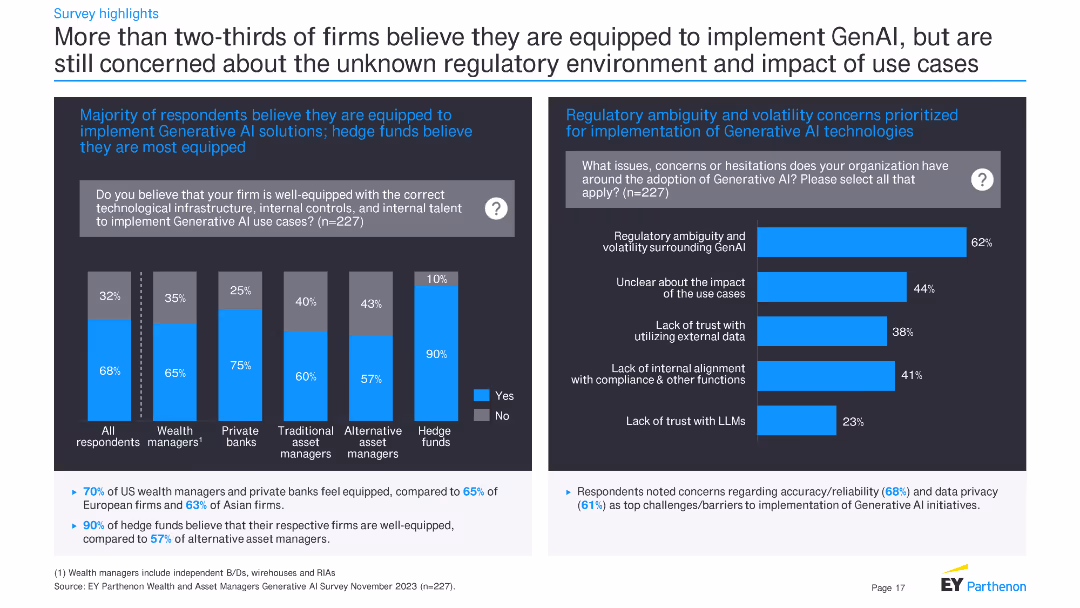
The slide features a column chart on the left and a bar chart on the right. The column chart shows the percentage of firms across different financial sectors that believe they are well-equipped to implement GenAI. The bar chart on the right highlights concerns related to regulatory ambiguity and other issues.
Risk Assessment and Management
Financial Services
The slide indicates that more than two-thirds of firms believe they are equipped to implement Generative AI, with hedge funds being the most confident. It also highlights major concerns like regulatory ambiguity, impact of use cases, and lack of trust with external data.
Generative AI, financial firms, regulatory concerns, implementation, survey results, hedge funds, technological readiness, data trust
false
More than two-thirds of firms believe they are equipped to implement GenAI, but are still concerned about the unknown regulatory environment and impact of use casesGenerative AI in wealth and asset management
Multiple Chart
EY
View slide
The slide features a line chart showing venture capital investments in T&L technology from 2016 to 2022H1 and a table listing selected venture capital deals in 2022. Text descriptions accompany these visual elements.
Investment Analysis
Transportation & Logistics
This slide presents an analysis of venture capital investment trends in technology within the Transport & Logistics industry, highlighting major investments and players in the market space.
venture capital, technology, investment, T&L, market trends, 2022, financial analysis, startup, funding series, innovation
false
Venture capital pushes technology innovationTransport & Logistics Barometer
Mixed Chart
PwC/Strategy&
View slide
The slide features text, survey results in bar charts, and an image depicting the integration of local and global communication strategies.
Strategic Planning
Professional Services
Explores the balance between global messaging and local execution, emphasizing the importance of local commitment and the autonomy of communication teams.
Glocal strategy, local communication, global strategy, survey results, balance
false
Against this backdrop, the need to project a long-term commitment in each local market is a given for today’s corporate communications professionalsTHE IPSOS REPUTATION COUNCIL
Multiple Chart
IPSOS
View slide
Organized table layout, green highlights, icons
Human Resources and Talent Management
Professional Services
Describes various roles in CAI development teams
CAI, roles, skillsets, team structure
false
What do Talent and Core Skillsets look like?Trends & AI in the Contact Center
Header Vertical
Deloitte
View slide
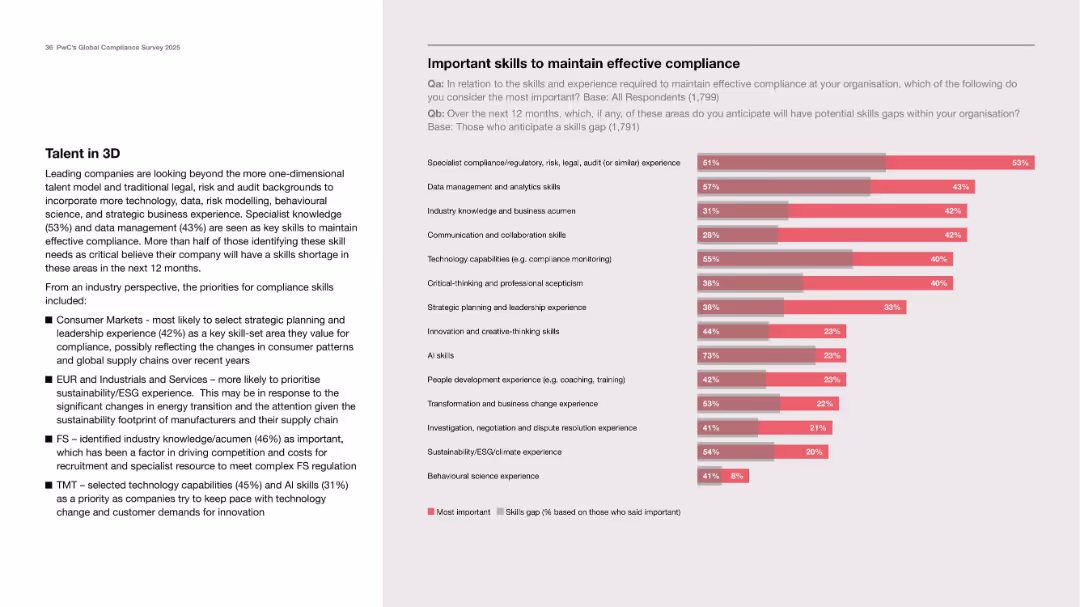
Two-column layout with text on left and double-bar chart comparing importance and skills gap on right.
Human Resources and Talent Management
Professional Services
Identifies key skills needed to maintain effective compliance, like tech, AI, and strategic thinking. Also highlights anticipated skill gaps in these areas, with visuals comparing importance versus availability. Emphasizes increasing demand for multidimensional compliance talent beyond legal or regulatory roles.
compliance skills, gap analysis, AI, technology, leadership
false
Important skills to maintain effective complianceMoving faster: Reinventing compliance to speed up, not trip up
Mixed Chart
PwC/Strategy&
View slide
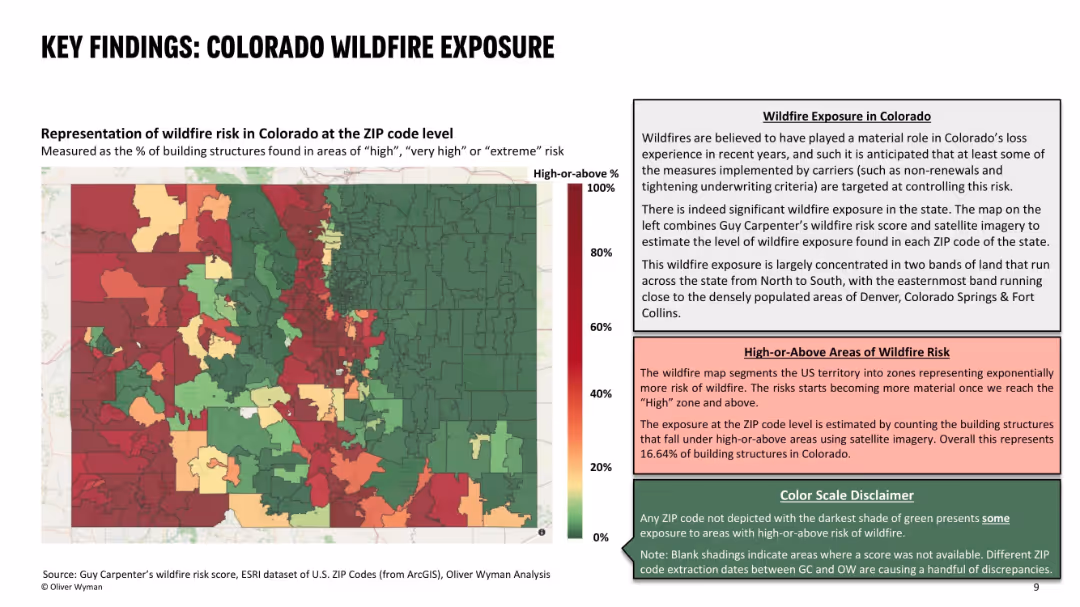
Left side features a color-coded ZIP code heat map of wildfire risk; right side contains descriptive text explaining the data and risk interpretation; uses red-green gradient with three text boxes for context and definitions.
Risk Assessment and Management
Environmental Services & Sustainability
This slide presents the wildfire exposure in Colorado at ZIP code level, identifying areas with high percentages of structures at significant wildfire risk. It highlights concentrated wildfire zones and their correlation with recent underwriting actions by insurers. About 16.6% of Colorado structures are in high-risk zones, influencing carrier decisions.
wildfire risk, ZIP code, building exposure, insurance, risk zones, high-risk areas, Colorado, wildfire impact, underwriting decisions
false
KEY FINDINGS: COLORADO WILDFIRE EXPOSUREHomeowner availability study
Mixed Chart
Oliver Wyman
View slide
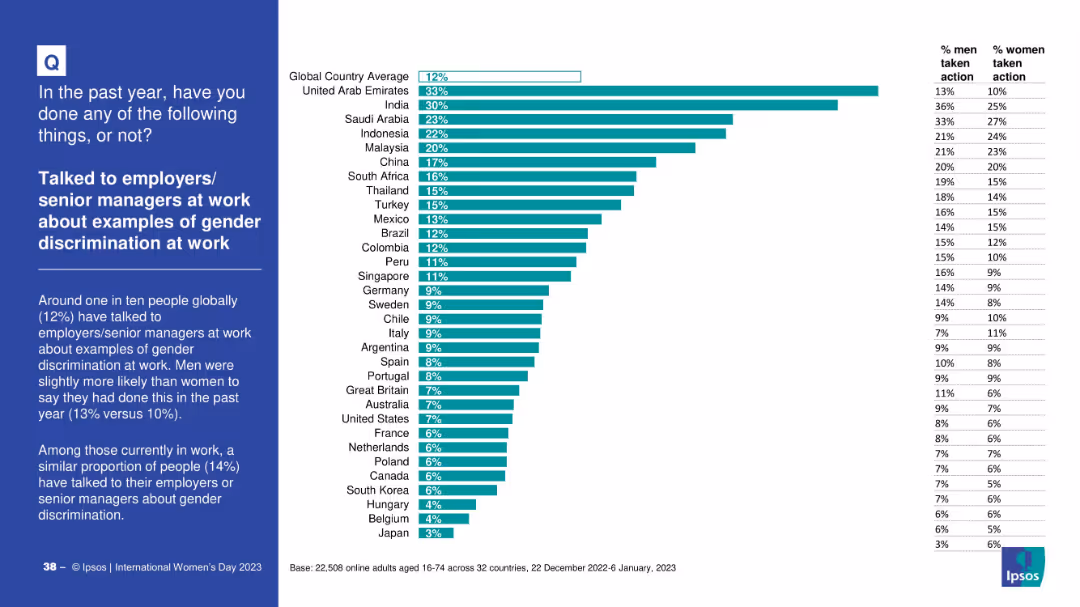
Standard Ipsos slide layout with bar chart and gender breakdown per country
Human Resources and Talent Management
Government & Public Sector
This slide explores how frequently people across countries discussed gender discrimination at work with managers. It highlights the overall low engagement rate and compares actions taken by men and women.
gender discrimination, workplace issues, senior management, HR, gender bias, Ipsos, employee voice
false
Talked to employers/senior managers at work about examples of gender discrimination at workINTERNATIONAL WOMEN'S DAY 2023
Mixed Chart
IPSOS
View slide
A timeline representation for various international markets with signed exit status, and a two-column summary of exit markets contribution to P&L and balance sheet.
Strategic Planning
Financial Services
Displays the timelines for exiting specific international markets and their financial impact, aiding in strategic decision-making and financial planning.
Exit Markets, Timelines, Financial Impact, P&L, Balance Sheet, Strategic Planning, International Markets, Financial Planning
false
Estimated Timelines for Signed Exit Markets & ContributionEarnings Results Presentation Third Quarter 2022
Table
Citigroup
View slide
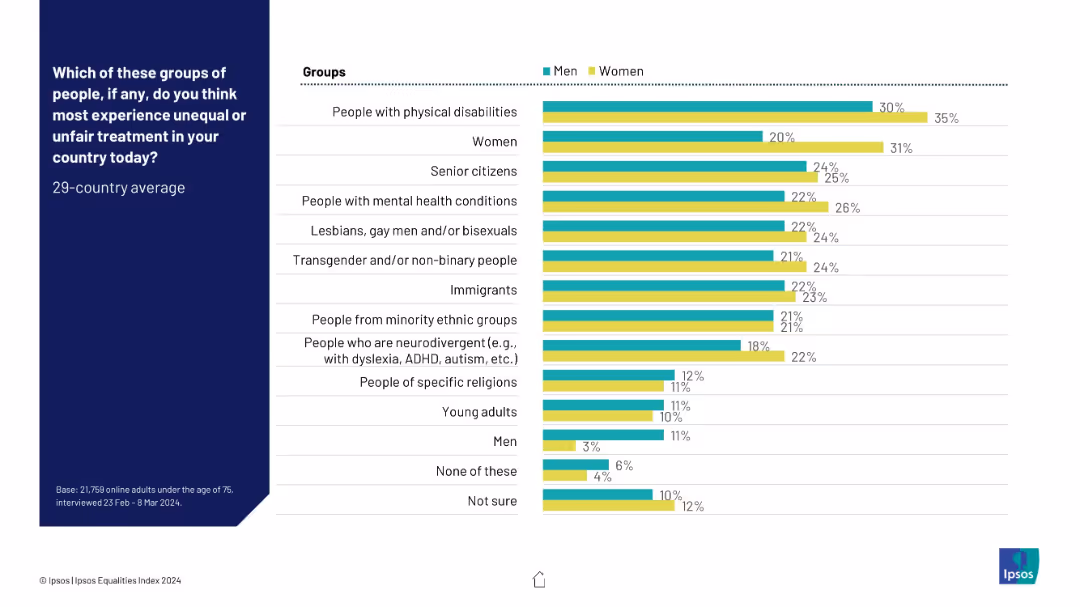
Dual bar chart comparing men and women responses by group; turquoise for men, yellow for women; visual parity shown.
Risk Assessment and Management
Government & Public Sector
This slide explores gender differences in the perception of unfair treatment toward various groups. Across nearly all categories, women report higher perceived inequality than men.
gender perception, unfair treatment, Ipsos, inequality awareness, men vs women, comparative chart
false
Which of these groups of people... most experience unequal or unfair treatment...?IPSOS EQUALITIES INDEX 2024
Mixed Chart
IPSOS
View slide
Bar chart with countries ranked by agreement that their nation should do more on climate change. Design consistent with prior slides.
Strategic Planning
Environmental Services & Sustainability
The slide highlights the demand for increased national climate efforts. Respondents from most countries support stronger action, with regional variations in urgency.
climate responsibility, national action, environmental policy, public pressure, Ipsos, climate change, international opinion
false
[COUNTRY] should do more in the fight…EARTH DAY 2024
Mixed Chart
IPSOS
View slide
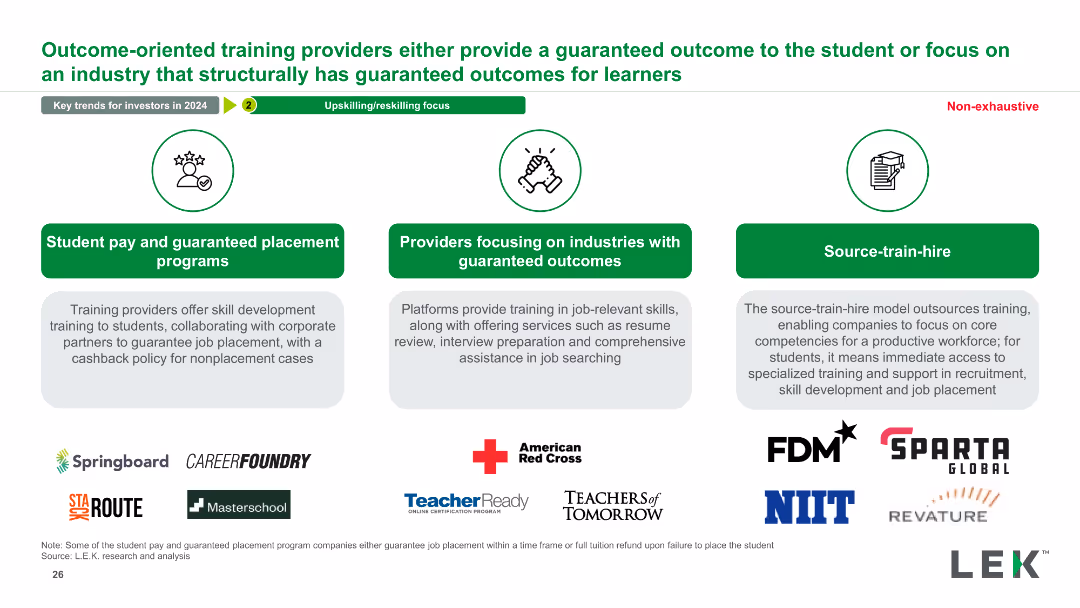
The slide features three blocks describing different types of outcome-oriented training providers, supported by logos of representative companies and brief descriptions.
Product and Service Analysis
Education & Training
This slide details outcome-oriented training providers, focusing on guaranteed outcomes for students or specific industries, along with examples of such providers.
training providers, outcome-oriented, guaranteed outcomes, industry focus, education analysis, training models, student placement
false
Outcome-oriented training providers either provide a guaranteed outcome to the student or focus on an industry that structurally has guaranteed outcomes for learnersEducation: 2023 M&A Deal Roundup and Trends to Watch Out for in 2024
Pillar
LEK
View slide
Slide includes column charts comparing preparedness across industries and regions.
Risk Assessment and Management
Financial Services
Evaluates the preparedness of executives in various industries for market shocks in 2024, highlighting significant improvements, especially in Asia.
market shocks, preparedness, industry, regional
false
Executives are more prepared for any potential market shocks in 2024 compared with 2023, particularly in Asia and certain industriesThe CEO's Guide to Costs and Growth
Multiple Chart
BCG
View slide
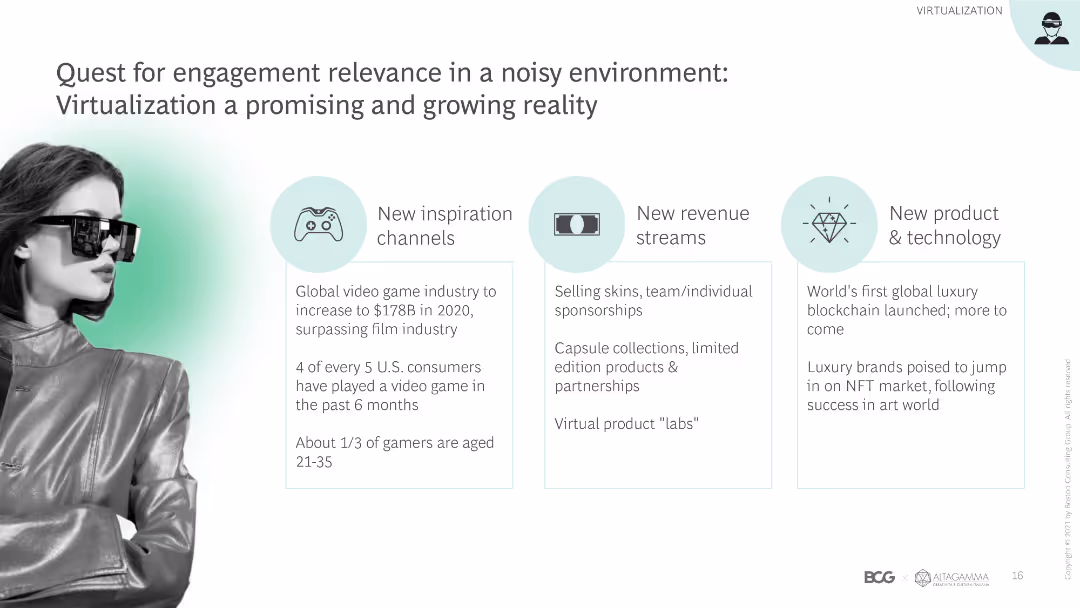
This slide has a content layout with sections on new inspiration channels, revenue streams, and products & technology, featuring relevant icons and brief text descriptions.
Technology and Digital Transformation
Retail & E-commerce
The slide explores the importance of engagement relevance through virtualization, highlighting new channels, revenue streams, and technological advancements in the luxury market.
Engagement relevance, virtualization, new channels, revenue streams, technology, luxury market, digital transformation, innovation, market trends
false
Quest for engagement relevance in a noisy environment: Virtualization a promising and growing realityTrue-Luxury Global Consumer Insights 8th Edition
Pillar
BCG
View slide
This slide is rich with column charts, dotted lines, and textual annotations, displaying financial growth trends in navy blue and light blue.
Financial Performance
Financial Services
Demonstrates a decade of financial performance, emphasizing consistent growth and strong returns, relevant for investors and analysts.
net income, ROTCE, TBVPS growth, financial growth, performance, decade, trends, investment
false
…which has led to strong absolute and relative performance over the last decadeFirm Overview 2022
Multiple Chart
JP Morgan
View slide
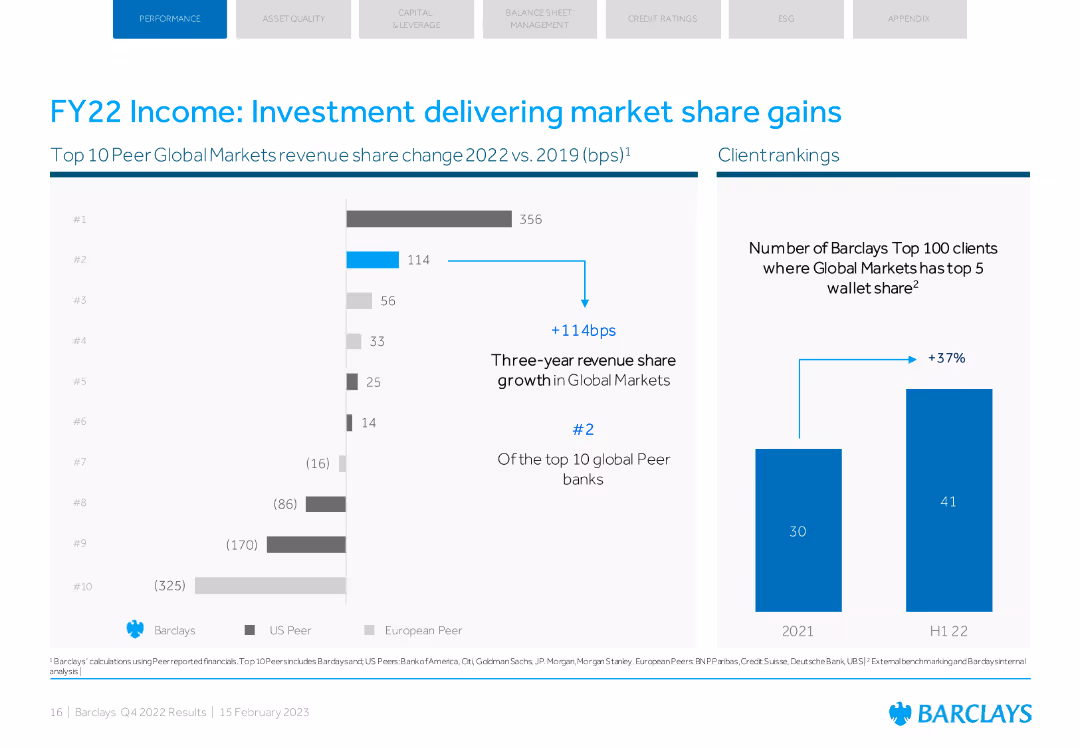
Column chart and bar chart showing market share changes and client rankings in Global Markets.
Market Analysis and Trends
Financial Services
This slide highlights Barclays' market share gains and client rankings in Global Markets for FY22.
investment, market share, gains, Global Markets, client rankings
false
FY22 Income: Investment delivering market share gainsBarclays PLC Q4 2022 Fixed Income Investor Presentation
Multiple Chart
Barclays
View slide
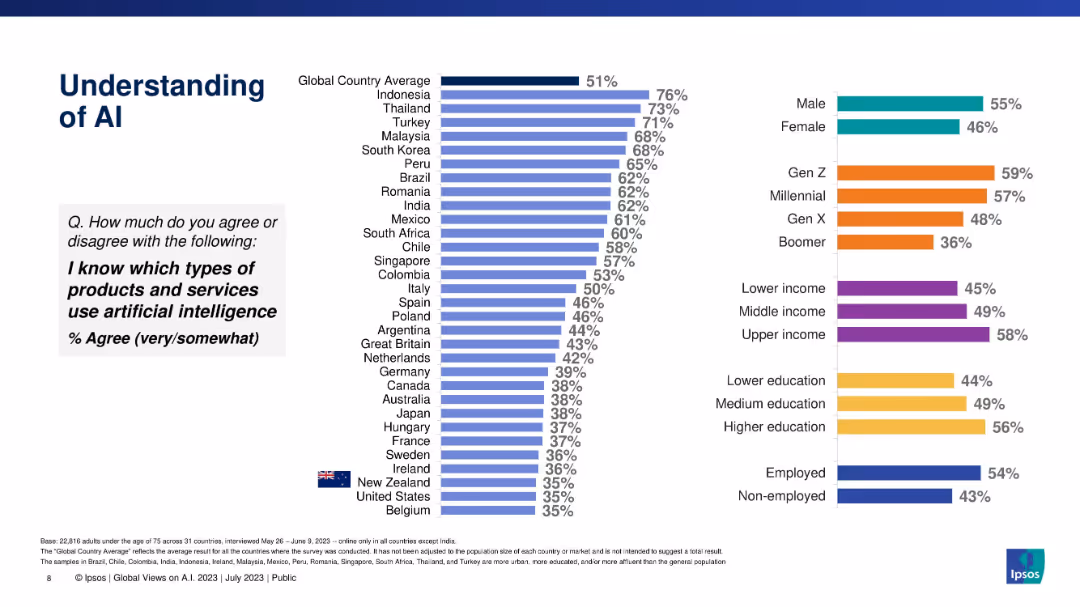
Vertical bar chart showing % of people who know which products/services use AI, by country and demographics.
Industry Overview
Artificial Intelligence
This slide measures familiarity with AI-powered products and services. It ranks countries by agreement and shows demographic patterns by gender, generation, income, and education, revealing significant differences in functional AI literacy.
AI products, awareness, demographics, Ipsos, product use, literacy, global view, services
false
Understanding of AIGLOBAL VIEWS ON A.I. IN 2023
Multiple Chart
IPSOS
View slide
Features column charts, with icons and data points detailing job creation and income boost figures. Emphasizes savings through color contrasts and visual hierarchy in design.
Market Analysis and Trends
Telecommunications
Details how the nbn network has facilitated job creation, increased incomes through remote work, and provided cost savings by enabling cheaper online alternatives to traditional services.
nbn, Jobs, Savings, Remote Work, Business Creation
false
The nbn network has enabled job and business creation, whilst also enabling users to boost their income and save money by using online alternativesThe economic and social impact of investment in the nbn network Key Insights Report
Multiple Chart
Accenture
View slide
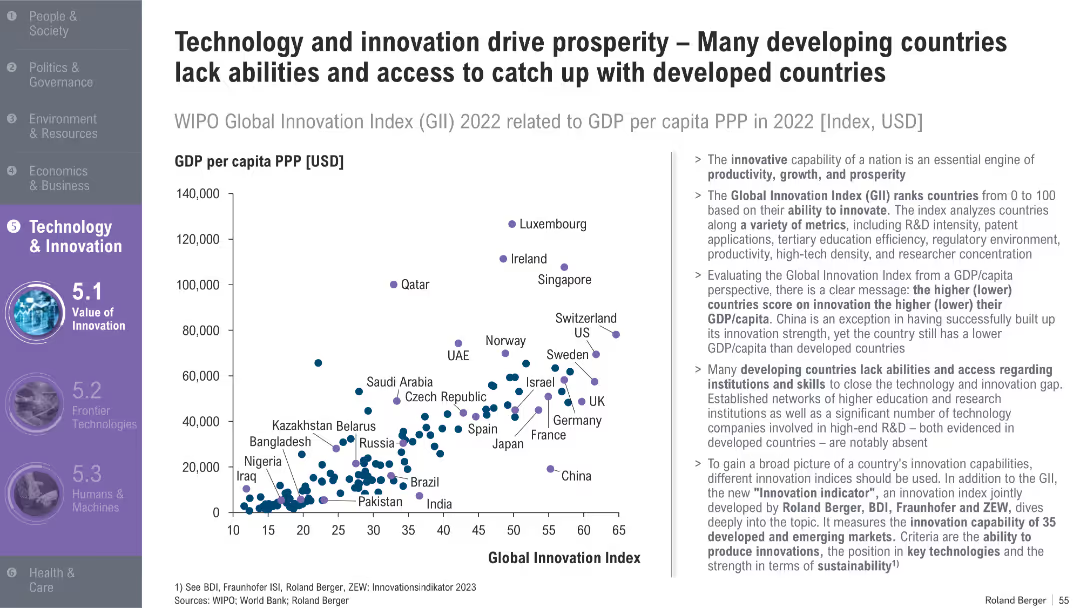
Scatterplot comparing GDP per capita vs. Global Innovation Index; developed and developing countries marked; explanatory text to the right
Market Analysis and Trends
Technology & Software
This slide explores the correlation between innovation and GDP per capita, identifying how many developing countries lag due to limited access to R&D infrastructure and education. It also introduces a new innovation index.
innovation, GDP per capita, R&D, Global Innovation Index, developing countries, productivity, skills, tech access
false
Technology and innovation drive prosperity – Many developing countries lack abilities and access to catch up with developed countriesTrend Compendium 2050 Six megatrends that will shape the world
Mixed Chart
Roland Berger
View slide
The slide features a diagram and detailed table presenting the total potential of forestry residues for energy production by 2060, including theoretical, technical, and sustainable potentials, and various factors affecting its scalability and sustainability constraints.
Technology and Digital Transformation
Energy & Utilities
This slide provides a deep-dive into the potential of forestry residues as a feedstock for energy production, analyzing its total potential by 2060 and highlighting the scalability issues and sustainability constraints associated with its use.
forestry residues, feedstock, total potential, energy production, 2060, scalability, sustainability constraints
false
Forestry residues supply is highly distributed and exposed to severe sustainability risks—especially in terms of biodiversityDeveloping sustainable carbon circularity Looking at advanced applications and business models
Mixed Chart
Kearney
View slide
Visually dramatic layout with circular stats and icons on dark purple landscape image.
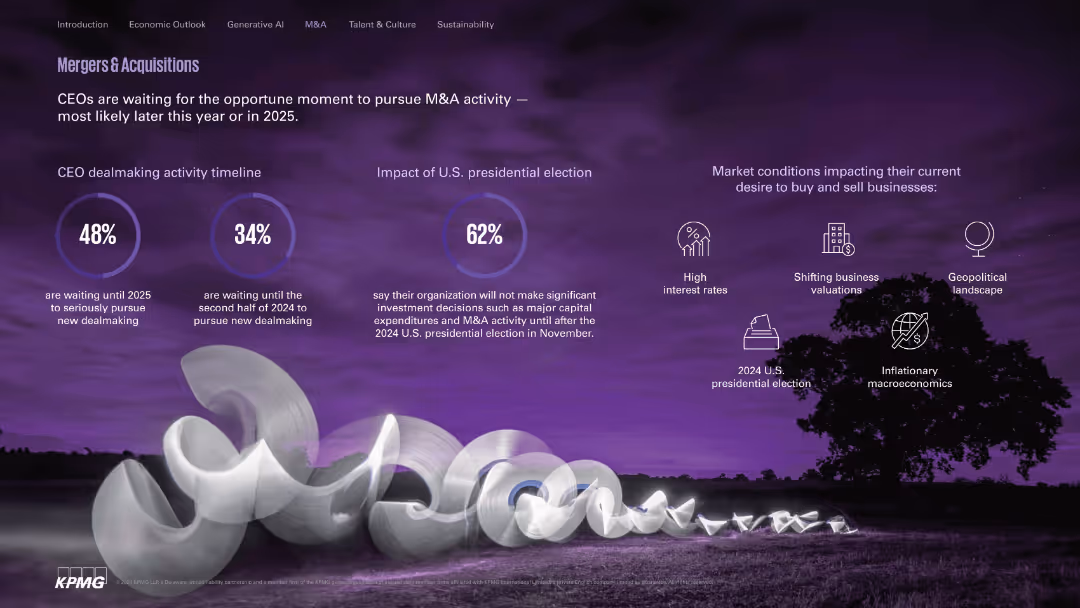
Mergers and Acquisitions
Financial Services
Outlines CEO timing for dealmaking, showing hesitancy until after the 2024 U.S. election. Identifies external factors like high interest rates and geopolitical tensions impacting M&A appetite.
M&A, dealmaking, investment timing, election, interest rates, valuations
false
Mergers & Acquisitions2024 U.S. CEO Outlook Pulse Survey
Mixed Chart
KPMG
View slide
A table with items comparing loyalty program elements like gamification and customer segmentation.
Technology and Digital Transformation
Hospitality & Tourism
Discusses loyalty program stages, emphasizing what differentiates the more successful programs.
loyalty, engagement, gamification, segmentation, rewards
false
Loyalty is a stage wise journey for the companies - what differentiates the leading programs are elements that build aspiration for customersA DATA DRIVEN APPROACH TO IMPROVE CUSTOMER ENGAGEMENT
Multiple Chart
BCG
View slide
It contains stacked column chart and a timeline of equity portfolio balance sheet progress, using shades of blue to represent different categories. The data is dense, yet the chart is clear and well-labeled.
Investment Analysis
Financial Services
The slide evaluates the progress in equity asset sales against market value adjustments over two years. It demonstrates a financial institution's efforts in managing equity investments, highlighting disposals and equity investment balances, relevant for discussions on asset management strategies.
Equity assets, Balance sheet, Asset management, Sales progress, Investment balance
false
Asset Management – Harvesting Progress of Balance Sheet Equity Portfolio Since Investor Day 2020Full Year and Fourth Quarter 2021 Earnings Results Presentation
Single Chart
Goldman Sachs
View slide
This slide presents a horizontal bar chart detailing the high-end levelized cost components for various renewable and conventional energy technologies, including capital, fixed O&M, variable O&M, and fuel costs.
Operational Efficiency
Energy & Utilities
The slide analyzes the high-end levelized cost components for different energy sources, emphasizing the cost structures and potential areas for reducing overall costs in renewable and conventional energy generation.
LCOE Components, High-End Cost, Energy Efficiency, Cost Breakdown, Renewable Energy
false
Levelized Cost of Energy Components—High EndLazards Lcoeplus
Single Chart
Roland Berger
View slide
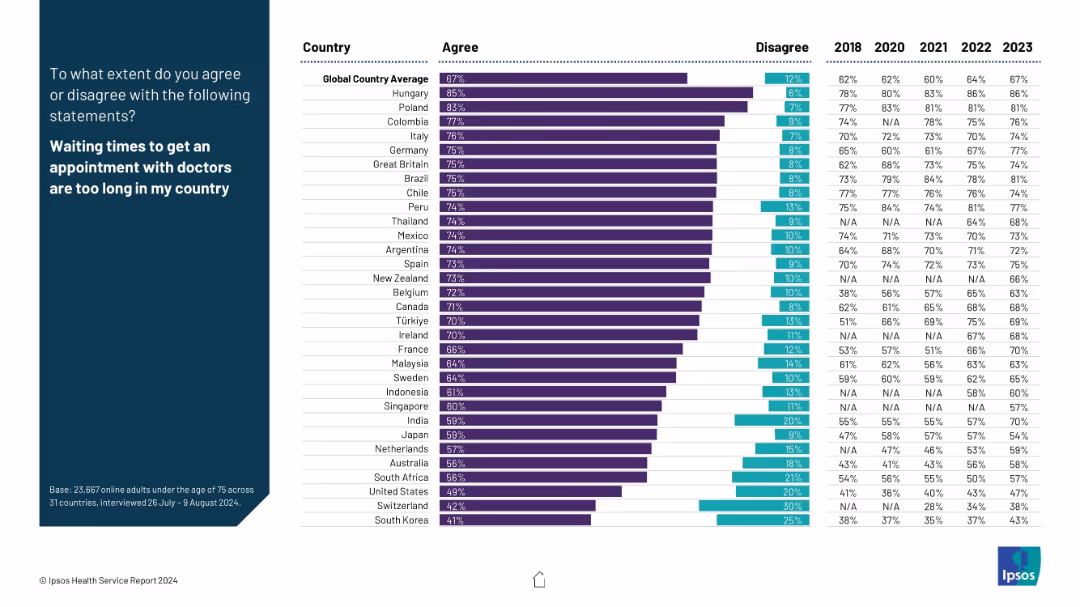
Bar chart showing percentage agreement/disagreement by country that waiting times are too long; includes yearly trend data.
Risk Assessment and Management
Healthcare & Pharmaceuticals
Respondents shared opinions on doctor appointment wait times. Hungary and Poland show the highest dissatisfaction. This data can signal accessibility issues and efficiency concerns in health systems worldwide.
healthcare access, waiting times, dissatisfaction, efficiency, survey
false
Long wait times for doctor appointmentsIPSOS HEALTH SERVICE REPORT 2024
Mixed Chart
IPSOS
View slide
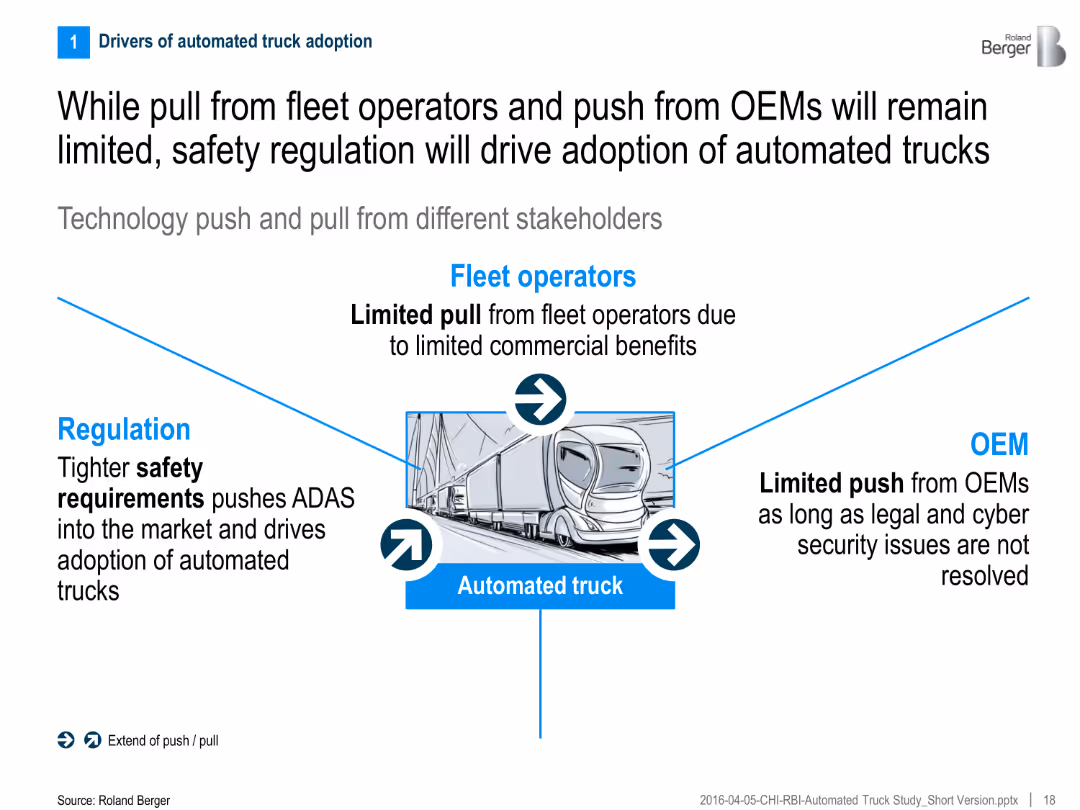
Central graphic showing push/pull from regulation, fleet operators, and OEMs toward automated truck adoption
Regulatory and Compliance
Transportation & Logistics
The slide highlights the limited commercial incentives from fleet operators and OEMs, stressing that regulation—especially safety requirements—is the key driver for automated truck adoption.
Regulation, OEMs, fleet operators, safety, automated trucks, adoption drivers, technology push/pull
false
While pull from fleet operators and push from OEMs will remain limited, safety regulation will drive adoption of automated trucksAutomated Trucks The next big disruptor in the automotive industry?
Linear Flow
Roland Berger
View slide
This slide includes text on energy transitions, along with a graphic showing global final energy demand projections by fuel type and region.
Market Analysis and Trends
Energy & Utilities
The slide explores the varied pace of global energy transitions, predicting significant growth in renewable energy capacity and shifts in final energy demand by 2050.
energy transitions, renewable energy, global demand, fuel types, energy projections
false
Multiple energy transitions will move at different pacesIf every energy transition is different, which course will accelerate yours?
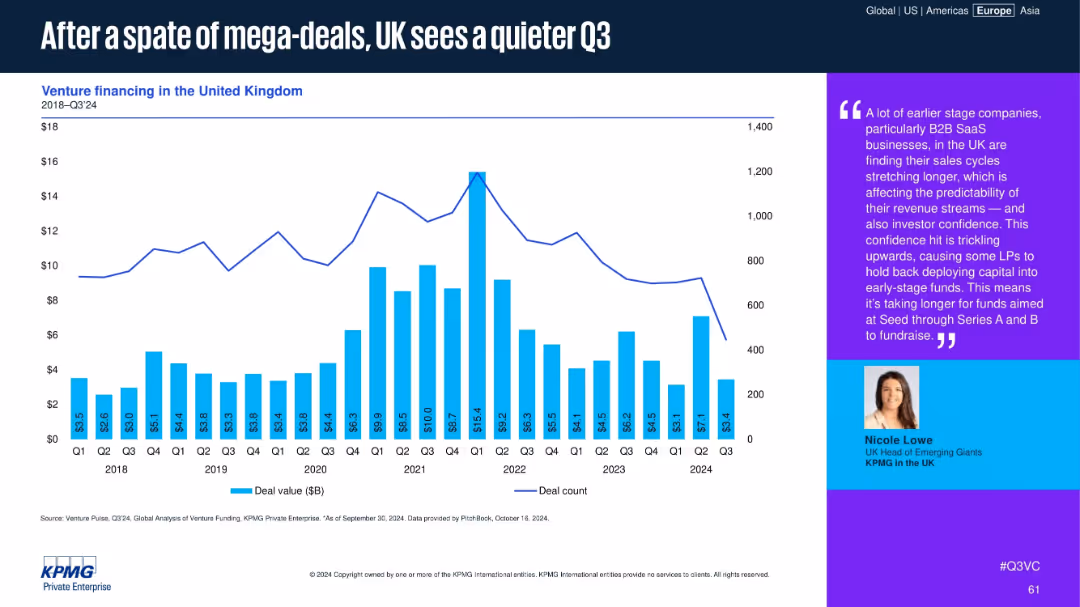
Multiple Chart
EY
View slide
Bar chart overlaid with a line graph showing venture financing deal value and count in the UK from 2018 to Q3 2024. Commentary on the right side with expert quote and photo.
Market Analysis and Trends
Financial Services
UK venture financing shows a notable Q3 slowdown after previous mega-deals, especially among early-stage B2B SaaS firms. The commentary highlights LP hesitancy and longer fundraising cycles amid uncertain revenue predictability.
UK, venture financing, SaaS, deal volume, early-stage, LP confidence, Q3 slowdown, fundraising, seed funds, Series A
false
After a spate of mega-deals, UK sees a quieter Q3Venture Pulse Q3 2024
Mixed Chart
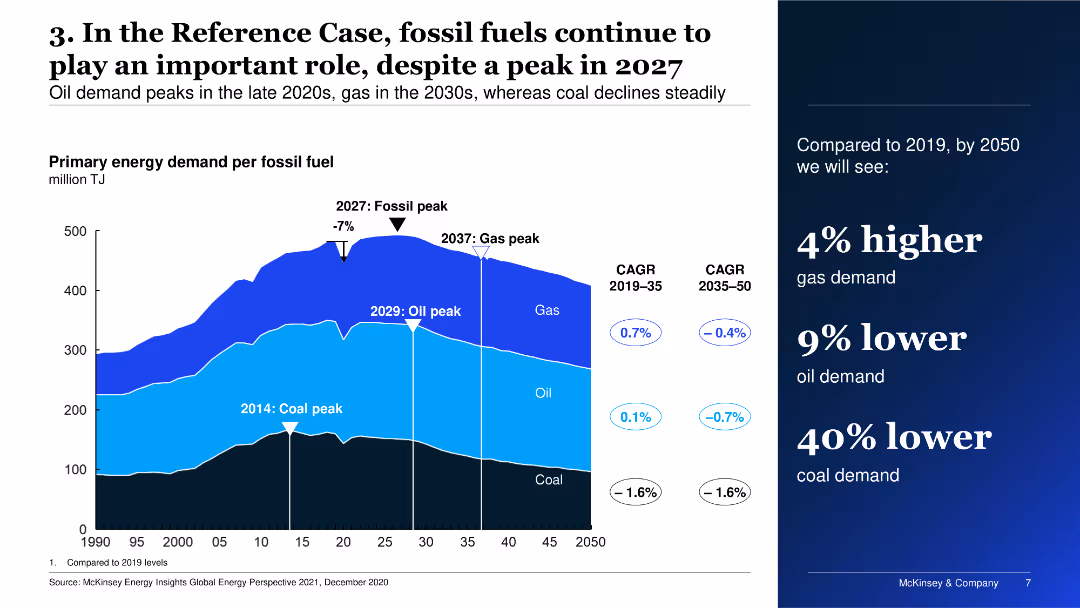
KPMG
View slide
The slide features a multi-layered area chart depicting primary energy demand per fossil fuel over time, alongside key dates for peaks in coal, oil, and gas demand.
Market Analysis and Trends
Energy & Utilities
The slide shows the projected primary energy demand for fossil fuels, highlighting peak periods for coal, oil, and gas, and compares expected demand changes from 2019 to 2050.
Energy, fossil fuels, demand, projections, trends
false
3. In the Reference Case, fossil fuels continue to play an important role, despite a peak in 2027Global Energy Perspective 2021
Mixed Chart
McKinsey
View slide
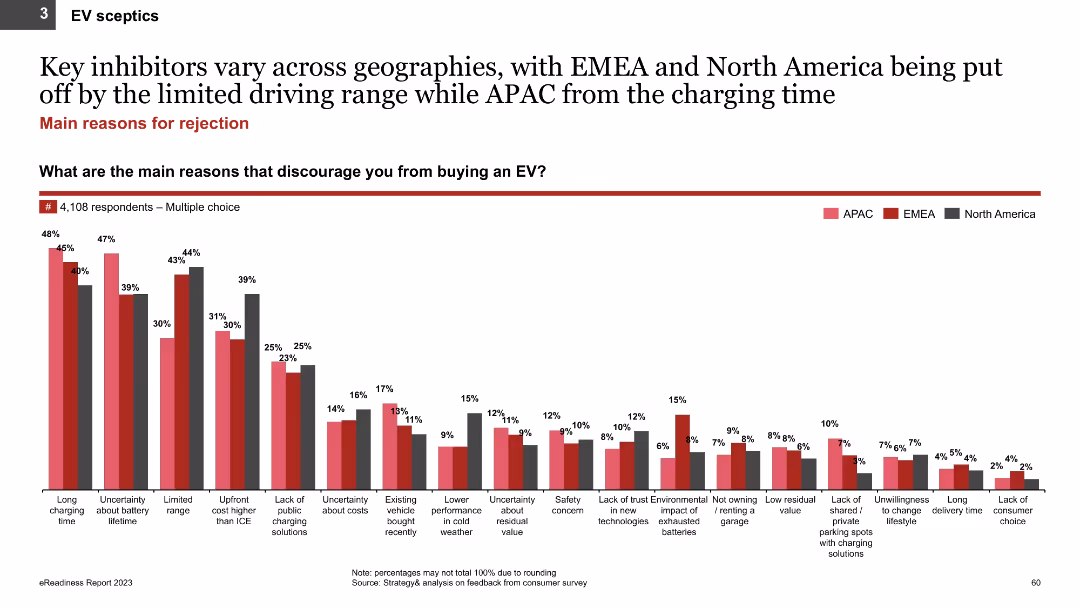
The slide shows a bar chart illustrating the main reasons for rejecting EVs among sceptics in APAC, EMEA, and North America. Each region is color-coded, and multiple reasons are displayed along the x-axis.
Market Analysis and Trends
Transportation & Logistics
The slide details the primary factors discouraging EV adoption, such as long charging times and limited driving range, based on a survey of 4,108 respondents. It aims to understand and address barriers to EV uptake.
EV rejection, barriers, charging time, driving range, regional differences
false
Key inhibitors vary across geographies, with EMEA and North America being put off by the limited driving range while APAC from the charging time4th edition eReadiness 2023
Single Chart
PwC/Strategy&
View slide
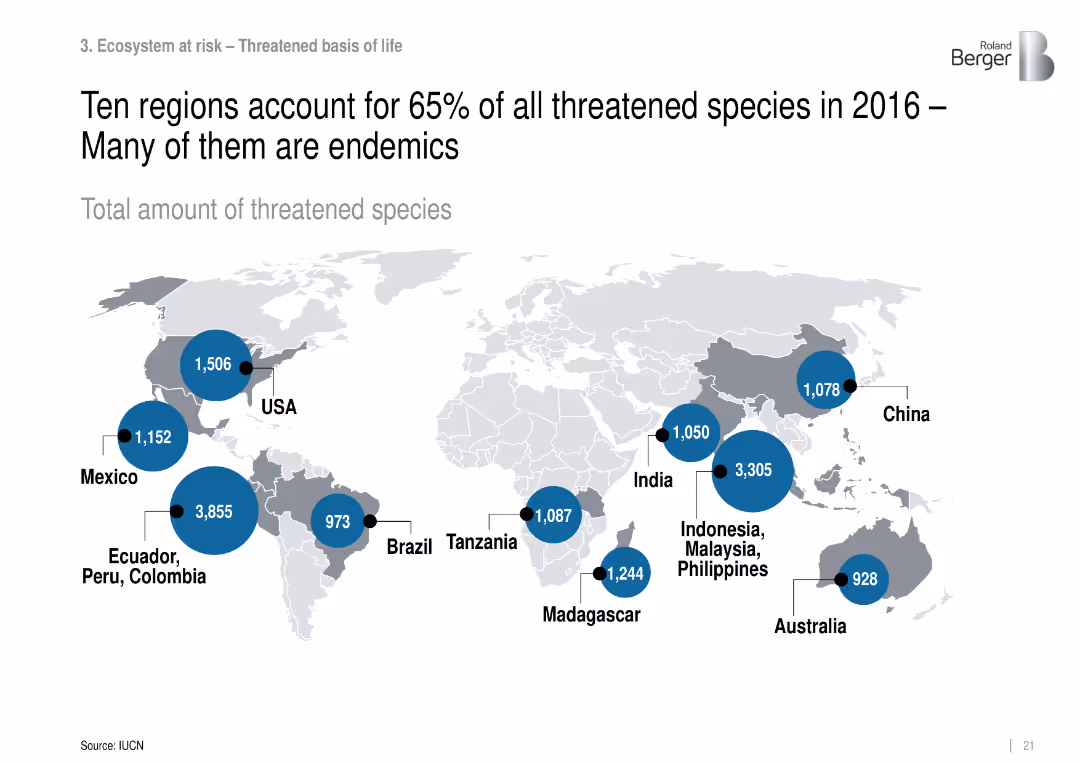
World map with data bubbles showing number of threatened species by region.
Strategic Planning
Environmental Services & Sustainability
Identifies biodiversity hotspots with high numbers of threatened species, focusing on endemic-rich regions like Ecuador, Indonesia, and Madagascar.
threatened species, biodiversity hotspots, endemic, conservation regions
false
Ten regions account for 65% of all threatened species in 2016 – Many of them are endemicsRoland Berger Trend Compendium 2030 Megatrend 4 Climate change & ecosystem at risk
Mixed Chart
Roland Berger
View slide
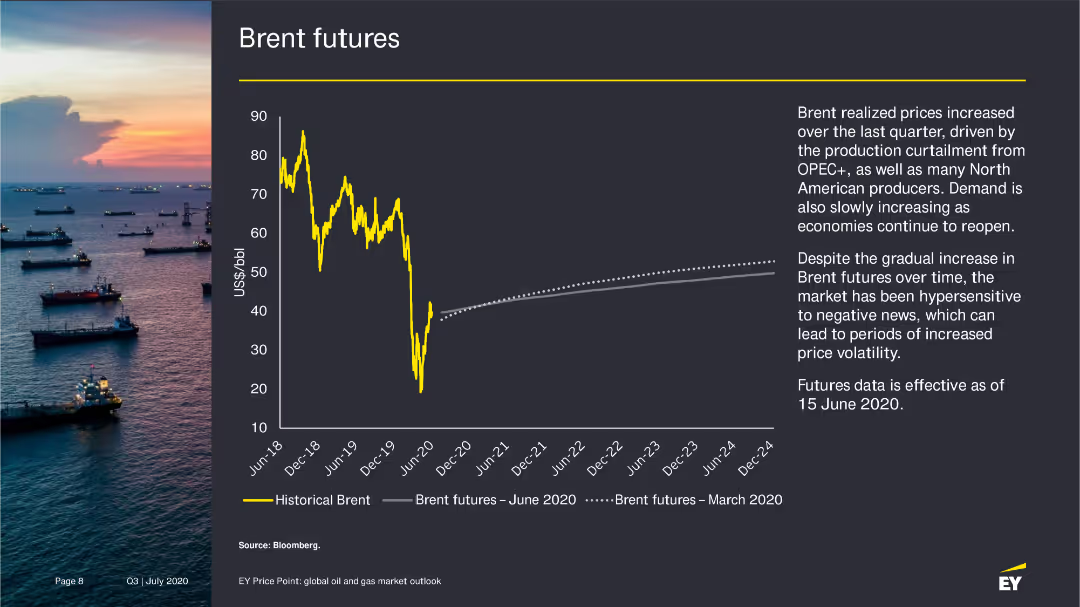
The slide presents a line chart showing historical Brent prices and Brent futures as of June 2020, with an accompanying narrative on the factors influencing these trends.
Market Analysis and Trends
Energy & Utilities
Analyzes the increase in Brent futures prices due to production cuts and rising demand, with projections for future price trends.
Brent futures, oil prices, market trends, 2020
false
Brent futures Brent realized prices increased over the last quarter, driven by the production curtailment from OPEC+, as well as many North American producers.EY Price Point: global oil and gas market outlook Q3 | July 2020
Mixed Chart
EY
View slide
Bar charts showing the breakdown of invested assets by class and currency for Global Wealth Management and Asset Management.
Financial Performance
Financial Services
Analyzes the distribution of invested assets across different classes and currencies, comparing Global Wealth Management and Asset Management.
Invested assets, asset class, currency, UBS, Global Wealth Management, Asset Management, financial performance, 3Q22
false
Invested asset split Global Wealth Management 3Q22Third quarter 2022 Financial results
Multiple Chart
UBS
View slide
Slide with icons representing different support mechanisms alongside a green color scheme, and text blocks outlining the mismatches in resources for college decision-making.
Human Resources and Talent Management
Education & Training
Discusses the mismatch between the resources available and those desired by students for making informed decisions about college, with a focus on first-generation students.
resources, college, decision-making, first-gen, support
false
Enrollment, transfer, and persistence statistics indicate that first-generation college students and low-income students need the most support in enrolling in higher education and attaining a degree.Gen Z Attitudes Toward Higher Education: Community colleges versus four-year degrees
Pillar
BCG
View slide
Column charts depict the investment deal values in Malaysia's internet sector, including deal count.
Investment Analysis
Technology & Software
Focuses on investment trends within Malaysia's internet sector, with data on deal values and counts from 2016 to H1 2020.
Investment, Internet sector, Malaysia, Deal values, Trends, 2016, 2020, Deal count
false
Malaysia Investment in Internet sectore-Conomy SEA 2020 At full velocity: Resilient and racing ahead
Single Chart
Bain
View slide
This slide shows a mix of textual content, column charts showing projected revenue growth, and images of diverse people using credit cards. The visual elements are balanced with descriptions of strategic areas such as digital innovation and distinctive brand.
Strategic Planning
Financial Services
Offers a broad overview of the global cards market, emphasizing the strategy focused on client-led growth and showcasing projected revenue increases from various card services. It aims to present Citi's comprehensive approach to maintaining and growing its market share in the cards segment.
global strategy, market growth, revenue projections, client engagement, credit cards
false
Cards: Global ViewGlobal Consumer Banking
Mixed Chart
Citigroup
View slide
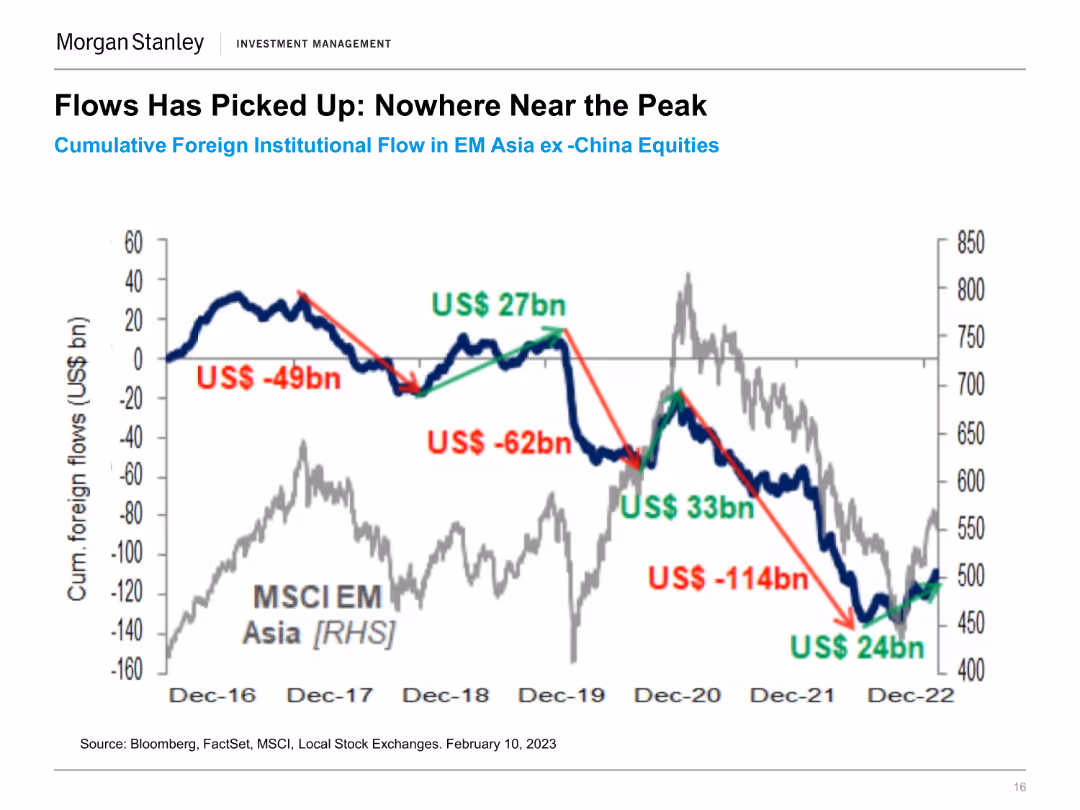
The slide includes a line chart tracking cumulative foreign institutional flow in EM Asia ex-China equities from December 2016 to February 2023. Key flow changes are highlighted.
Financial Performance
Financial Services
This slide shows the trends in foreign institutional investments in emerging market Asia, excluding China, indicating significant inflow and outflow events over the period.
Foreign Institutional Flow, EM Asia, Investment Trends, Equity Markets, Financial Performance, Market Inflows, Capital Movement, Investment Analysis
false
Flows Has Picked Up: Nowhere Near the PeakMorgan Stanley Investment Management Emerging Markets / Asia
Single Chart
Morgan Stanley
View slide
This slide shows a detailed diagram of an IT architecture, featuring components like SAP BTP Analytics, SAP S/4HANA, and cloud connectors, organized in a structured layout.
Technology and Digital Transformation
Technology & Software
The slide presents the architecture of a business technology platform, highlighting the integration of various components like SAP Analytics Cloud and connectivity services.
architecture, SAP, BTP, technology, cloud
false
Architecture SAP Innovation Awards 2022SAP Innovation Awards 2022 Entry Pitch Deck
Diagram
EY
View slide
Contains a clear visual hierarchy with text and iconography to delineate key principles, opportunities, and actions. The slide follows a consistent color scheme with blue as the primary color.
Strategic Planning
Financial Services
This slide outlines principles and responses to emerging trends in payments, highlighting customer choice, data-led services, and sustainable innovation. It is crafted to guide strategic thinking and decision-making in response to market trends, particularly in the areas of payment flexibility and risk management.
Emerging trends, Payment innovation, Customer choice, Strategic response
false
Looking ahead, we’ll continue to watch and respond to emerging trends in paymentsConsumer & Community Banking
Table
JP Morgan
View slide
The slide features two main visual elements: a bar graph on the left side comparing UK real GDP forecasts, and a line graph on the right side displaying 12-month inflation and Bank of England interest rates. The design is moderately dense with textual annotations and a legend explaining the data sources.
Market Analysis and Trends
Financial Services
This slide presents a forecast of the UK's real GDP growth and inflation trends, showing expectations from major institutions and actual economic performance. The inflation graph shows a recent peak and the interest rates set by the Bank of England. It is likely used to communicate economic forecasts to inform financial planning or policy-making decisions.
UK GDP, Inflation, Forecast, Economic Growth, Interest Rates, Monetary Policy, Financial Outlook, Comparative Analysis
false
Modest UK GDP growth outlook for 2023–25, after the economy grew by 0.1% in Q4 2022; inflation declined to 10.1% in March but remained above projectionsGlobal Economics Intelligence
Multiple Chart
McKinsey
View slide
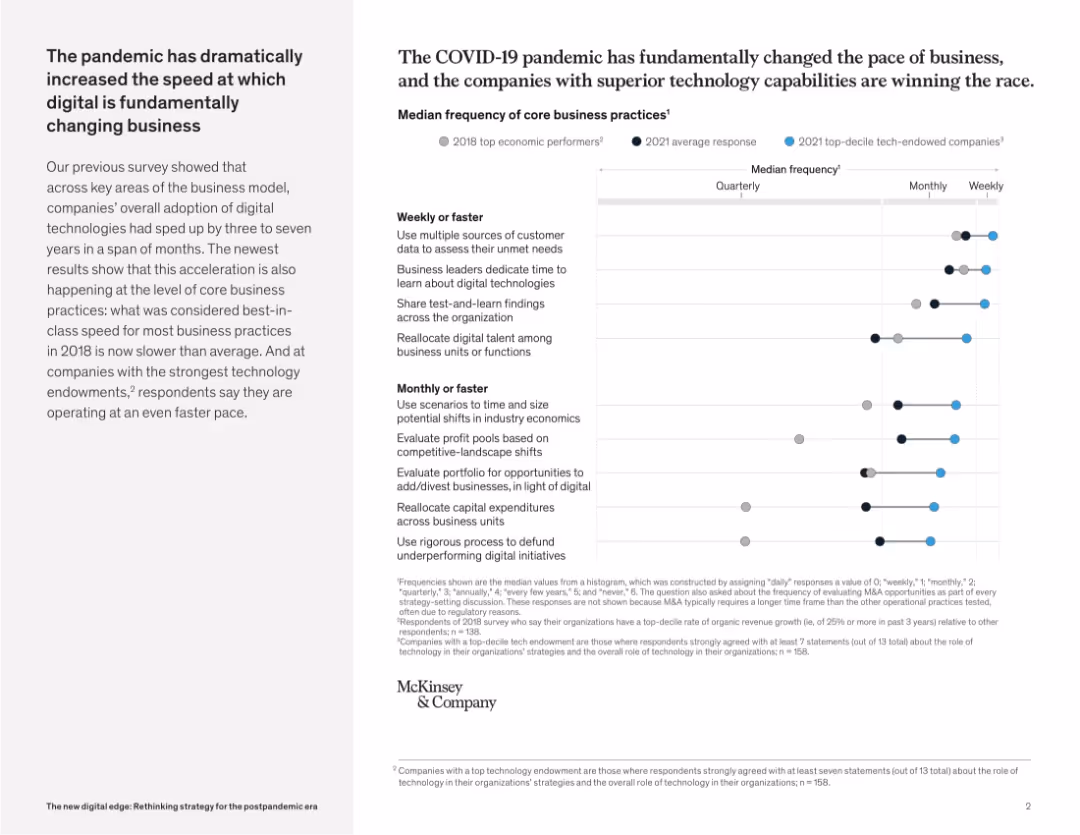
Right-heavy layout featuring dot plot chart comparing 2018 vs 2021 business process frequency across tech-maturity tiers. Left side contains narrative.
Market Analysis and Trends
Technology & Software
This slide demonstrates how COVID-19 accelerated digital transformation, especially in companies with strong tech capabilities. Business practices that were monthly in 2018 are now performed weekly, indicating a dramatic pace shift.
COVID-19 impact, digital acceleration, core processes, business transformation, tech capabilities, pace of change, pandemic disruption
false
The pandemic has dramatically increased the speed at which digital is fundamentally changing businessThe new digital edge: Rethinking strategy for the postpandemic era
Mixed Chart
McKinsey
View slide
Three pie charts showing geographical distribution of accounts, commissions, and client equity for IBKR.
Client Case Studies
Financial Services
Highlights geographical diversity in IBKR’s client base and financials, with pie charts displaying the regional spread of accounts and assets.
Geographical Diversity, Interactive Brokers, Client Accounts, Client Equity, Pie Charts, Americas, Europe, Asia-Pacific
false
Diversified Client Base – by Geography1Goldman Sachs US Financial Services Conference 2022
Multiple Chart
Goldman Sachs
View slide
The slide features a column chart comparing electricity generation per capita for various African countries in 2022. Key insights and outlooks discuss Nigeria's investment needs to increase power generation capacity by 2043.
Investment Analysis
Energy & Utilities
The slide discusses Nigeria's requirement for substantial investment to increase power generation capacity by 2043, comparing current electricity generation levels with other African countries. It highlights the implications for economic growth and productivity.
power generation, investment, electricity generation, economic growth, productivity
false
Nigeria will require an investment of about US$1.87 billion to increase power generation capacity to 350 GW by 2043Nigeria Economic Outlook
Mixed Chart
PwC/Strategy&
1
...
Next
Load More
Hold On!
We are searching in our database
If nothing, comes up, please try different filters!
Create a FREE account to continue browsing
Receive Instant Access to 1,000+ slides from companies like McKinsey, Google, and Goldman Sachs
First Name
Last Name
Email
Password
I agree to all
Terms & Privacy Policy
Thank you! Your submission has been received!
Oops! Something went wrong while submitting the form.
Have an account?
Sign in
Column Chart
Heatmap
Chevron
Org Chart
Infographic
Callouts
Timeline
List
Graphic
Picture
Process Flow
Diagram
Paragraph
Map
Table
Framework
Subtitle
Takeaway Box
Icon
Other Chart
Radar Chart
Waterfall Chart
Mekko Chart
Pie Chart
Scatter Plot
Line Chart
Bar chart
Bullet points


![[COUNTRY] should do more in the fight…](https://cdn.prod.website-files.com/654e70fb59937215cac87b19/6899c5da3cd8e1fabdb4c60f_v3Q4RGI05F9Y1pjx9qWO3G3XGk7EAaiTUBahSuMHYd0.avif)