My Account
My Slides
Search by Category
Templates
View All Templates
Download Template Slides
Leave Feedback
Login
Logout
Get Started
Browse all Slides
Browse all Slides
Create a FREE Account
Instant access to 1,000+ real slides from top companies like McKinsey, BCG, Goldman Sachs, Google and many more!
First Name
Last Name
Email
Password
I agree to all
Terms & Privacy Policy
Thank you! Your submission has been received!
Oops! Something went wrong while submitting the form.
Have an account?
Sign in
Instant access to the internet's best slides
Get access to 40+ advanced filters and more
Advanced Search and Filters
Access to
10,000+ slides
Access to Category Pages
Save/Bookmark Slides
PowerPoint Template Library (New)
Choose your plan
MONTHLY
$12/month
Billed every month, cancel anytime.
YEARLY
$9/month
Billed $108 annually, cancel anytime.
Checkout for $12/month
Checkout for $108/yr
Secured by Stripe | AES-256 bit encryption
Spark Your Next Big Idea with New Presentation Templates
VIEW ALL Templates
Welcome,
Welcome
Upgrade to SlideStart
Pro
Instant access to 15,000+ slides
Show Featured Only
Checkbox 8
Companies
Mckinsey
Bain
BCG
EY
Deloitte
Accenture
PwC/Strategy&
JP Morgan
Goldman Sachs
Morgan Stanley
Citigroup
Deutsche Bank
Barclays
LEK
Kearney
Oliver Wyman
Booz Allen Hamilton
Gartner
IPSOS
Nielsen
Slide type
Header Horizontal
Framework
Vertical Flow
Single Chart
Single Chart
Text Only
Mixed Chart
Header Vertical
Graphic
Pillar
Multiple Chart
Agenda
Title
Table
Linear Flow
Upgrade to SlideStart
Pro
Instant access to 40+ advanced filters
Industry
Upgrade to SlideStart
Pro
Instant access to 40+ advanced filters
Technology
Healthcare
Financial Services
Consumer Goods
Energy & Utilities
Manufacturing
Retail
E-commerce
Logistics
Telecommunications
Real Estate
Professional Services
Education
Media
Entertainment
Hospitatlity
Tourism
Agriculture
Food Production
Government & Public Sector
Environmental
Sustainability
Use Case
Upgrade to SlideStart
Pro
Instant access to 40+ advanced filters
Sales and Business Development
Mergers and Acquisitions
Corporate Finance and Valuation
Performance Metrics and KPIs
Client Case Studies
Competitive Landscape
Product and Service Analysis
Customer and Market Segmentation
Organizational Structure
Human Resources and Talent Management
Industry Overview
Regulatory and Compliance
Risk Assessment and Management
Agriculture & Food Production
Hospitality and Tourism
Government
Environmental
Sustainability
Clear all
Thank you! Your submission has been received!
Oops! Something went wrong while submitting the form.
Show Featured Only
Checkbox 8
Companies
Mckinsey
Bain
BCG
EY
Deloitte
Accenture
PwC/Strategy&
JP Morgan
Goldman Sachs
Morgan Stanley
Citigroup
Deutsche Bank
Barclays
LEK
Kearney
Oliver Wyman
Booz Allen Hamilton
Gartner
IPSOS
Nielsen
Slide type
Text Only
Linear Flow
Vertical Flow
Single Chart
Header Horizontal
Mixed Chart
Header Vertical
Pillar
Multiple Chart
Graphic
Agenda
Title
Table
Framework
Industry
Technology
Healthcare
Financial Services
Consumer Goods
Energy & Utilities
Manufacturing
Retail
E-commerce
Logistics
Telecommunications
Real Estate
Professional Services
Education
Media
Entertainment
Hospitatlity
Tourism
Agriculture
Food Production
Government & Public Sector
Environmental
Sustainability
Use Case
Sales and Business Development
Mergers and Acquisitions
Corporate Finance and Valuation
Performance Metrics and KPIs
Client Case Studies
Competitive Landscape
Product and Service Analysis
Customer and Market Segmentation
Organizational Structure
Human Resources and Talent Management
Industry Overview
Regulatory and Compliance
Risk Assessment and Management
Agriculture & Food Production
Hospitality and Tourism
Government
Environmental
Sustainability
Clear all
Thank you! Your submission has been received!
Oops! Something went wrong while submitting the form.
Tag
View slide
Line graphs showing trends in VaR and sVaR for regulatory scopes, detailed with average values per quarter.
Risk Assessment and Management
Financial Services
Analyzes the trading and regulatory risk profiles of the bank using VaR and sVaR metrics over multiple quarters, aimed at risk managers and financial analysts.
VaR, sVaR, risk assessment, Q3 2023
false
Value-at-Risk / stressed Value-at-Risk (VaR / sVaR)Q3 2023 results
Multiple Chart
Deutsche Bank
View slide
Features a comparative design with a pie chart and textual analysis side-by-side, effectively using space to discuss key global economic concerns.
Market Analysis and Trends
Financial Services
Compares business leader insights on global uncertainties and their expected impact on company performance.
economic, global shocks, uncertainty, risks
false
Majority of C suite leaders recognizing uncertainty is still the key challenge in 2023; nonetheless, only half are expecting additional shocksThe CEO Outlook Caution, Optimism, and Navigating the Road Ahead
Mixed Chart
BCG
View slide
Large area graph showing the daily new cases with a 7-day rolling average, accompanied by key observations that include numerical and percentage data.
Risk Assessment and Management
Government & Public Sector
Analyzes the rise in COVID-19 cases in early July 2020 and provides a snapshot of the global situation with key statistics on active cases, recoveries, and fatalities.
COVID-19, Case Growth, Recovery Rates, Summer Spread
false
Daily cases on the rise | Cases in early July ~1.5x those in June; ~56% of the confirmed cases have recovered globally COVID-19 BCG Perspectives Series Global Restart: Key Dynamics
Single Chart
BCG
View slide
An illustrative slide with two figures and accompanying icons and text boxes, outlining benefits of digitalization in terms of revenue, profit, productivity, and wages.
Investment Analysis
Technology & Software
It showcases the advantages of being digitally advanced, contrasting the benefits accrued by 'digital haves' versus 'have-mores'. The slide could be used to argue for increased digital investment in a strategic business context.
digital, advantages, business, investment, strategy
false
Digital “haves” and “have-mores”Digital Economy: Trends, Opportunities and Challenges
Uncategorized
McKinsey
View slide
Uses icons and lists to illustrate five key growth drivers, presented in a clean, structured layout.
Investment Analysis
Financial Services
Showcases JPMorgan's focus on key growth drivers such as scaling asset management and expanding global presence, providing an at-a-glance view of their strategic direction and achievements in the context of investment and market expansion.
growth drivers, asset management, global, JPMorgan, strategy
false
We’ve remained focused on our growth driversInverstors Day 2023
Pillar
JP Morgan
View slide
A structured slide with headers and a linear array of hexagons indicating financial services such as "Risk" and "Payments", with arrows pointing downwards, signifying the translation into a platform service with the assistance of "VOICE and APIs".
Technology and Digital Transformation
Financial Services
Transitioning Goldman Sachs' financial services into a more accessible platform, integrating technology like APIs to streamline services such as risk management, data analytics, and payments for better client engagement and operational efficiency.
platform, APIs, financial services, transformation, efficiency
false
Goldman Sachs - From Service Provider... to PlatformGoldman Sachs Investor Day
Diagram
Goldman Sachs
View slide
The slide includes two vertical column charts comparing CET1 capital ratio and leverage ratio for 3Q23 against requirements.
Financial Performance
Financial Services
This slide provides an overview of capital and leverage ratios, focusing on CET1 capital ratio and regulatory requirements.
capital ratios, leverage ratios, CET1, regulatory requirements, financial performance
false
Capital and leverage ratios We expect our CET1 ratio to remain ~14% throughout the integration timelineThird quarter 2023 Fixed Income investor presentation
Multiple Chart
UBS
View slide
Features comparative column charts and statistics on consumer activity changes, with clear visual elements to distinguish between the data points, emphasizing shifts in behavior and concerns.
Customer and Market Segmentation
Consumer Goods
Analyzes the evolving consumer behaviors in response to the COVID-19 pandemic, focusing on the increase in activities despite concerns, and the role of vaccination in enabling safer gatherings.
Consumer Behavior, COVID-19, Vaccination, Activities
false
Consumers are increasingly engaging in activities, with vaccines critical for return to normalcyHow COVID-19 Changed the Consumer
Mixed Chart
BCG
View slide
This slide displays a combination of text blocks and data visualizations, including a growth multiplier and key investment areas. It's color-coded to distinguish between different technology focus areas.
Operational Efficiency
Technology & Software
It emphasizes the importance of leveraging technology for innovation, considering both existing and upcoming technological developments. This could aid in technology investment strategies.
Innovation, Technology, Investments, Digital Transformation, Deep Tech, Market Trends, Business Model, Development
false
Leverage existing or developing technology to power innovation based on timeline and focusBCG Executive Perspectives: The Race for Innovation
Header Vertical
BCG
View slide
The slide shows two column charts with different approaches to labeling, highlighting the removal of redundant labels for clarity.
Technology and Digital Transformation
Professional Services
The slide demonstrates how removing redundant labels can improve the clarity and effectiveness of data presentations according to Tufte's principles.
Tufte, data-to-ink, ratio, survey, responses, visualization, labels, chart, clarity, design
false
Tufte principles: data-to-ink ratio Remove redundant labelsEY Academic Resource Center – mission
Multiple Chart
EY
View slide
Map of the United States showcasing the distribution of solar, wind, and geothermal projects with corresponding icons, plus a case study with text on the right.
Market Analysis and Trends
Energy & Utilities
This slide features a geographic overview and case study on JPMorgan Chase’s renewable energy projects, useful for discussions on sustainability and clean energy initiatives.
renewable energy, sustainability, solar, wind, geothermal, JPMorgan Chase, clean energy, geography, case study
false
Geography of Solar, Wind and Geothermal Projects2021 ENVIRONMENTAL SOCIAL & GOVERNANCE REPORT
Boxed
JP Morgan
View slide
Similar structure as slide 19811 with bar chart comparing country-level responses on a white background; blue question box on the left.
Market Analysis and Trends
Government & Public Sector
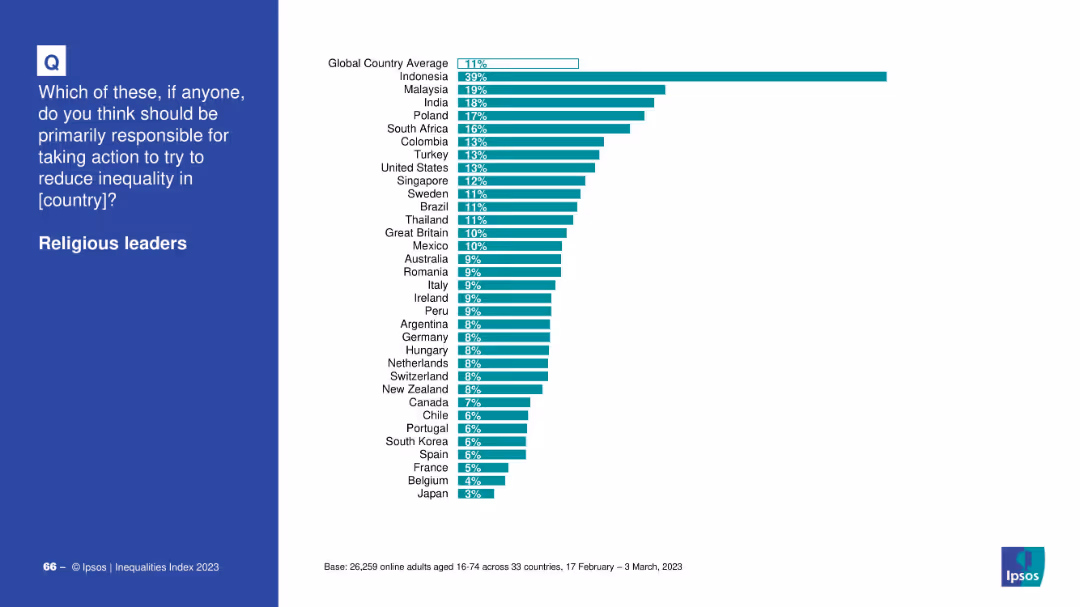
This slide displays public opinion across 33 countries on whether religious leaders should take primary responsibility for reducing inequality, with varying agreement.
religious leaders, global comparison, inequality, country-level data, public opinion, Ipsos, survey results
false
Religious leadersIPSOS EQUALITIES INDEX 2023
Mixed Chart
IPSOS
View slide
Standard Ipsos layout with question on the left and sentiment-based ranking chart on the right.
Market Analysis and Trends
Government & Public Sector
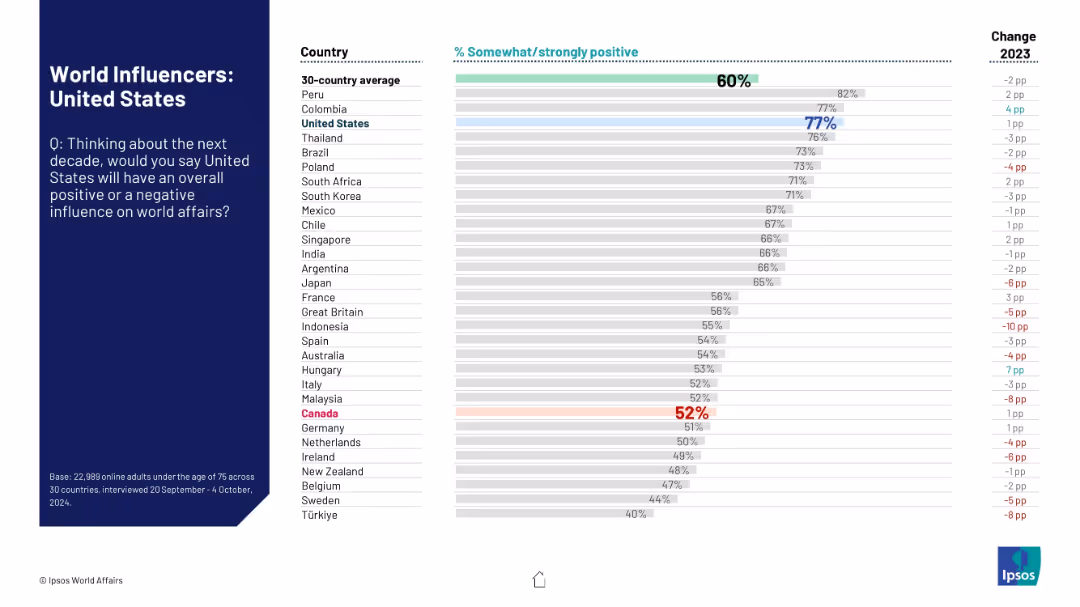
This slide captures global opinions on the United States' projected influence on global affairs. It displays country-by-country approval percentages and highlights changes from the prior year.
United States, global influence, perception, international opinion, bar graph, Ipsos, geopolitical standing, trend analysis, 2024
false
World Influencers: United StatesWORLD AFFAIRS
Mixed Chart
IPSOS
View slide
The slide features a circular chart illustrating global IT spending and growth for 2022, segmented into categories like communication services, data center systems, software, devices, and IT services.
Market Analysis and Trends
Technology & Software
The slide provides an overview of global IT spending and growth for 2022, with a focus on different segments like communication services, data center systems, software, and devices.
IT spending, growth, 2022, global, communication, data center, software, devices, services, categories
false
Global IT Spending & Growth for 2022Gartner delivers actionable, objective insight, guidance and tools to enable stronger performance on your organization’s mission critical priorities
Single Chart
Gartner
View slide
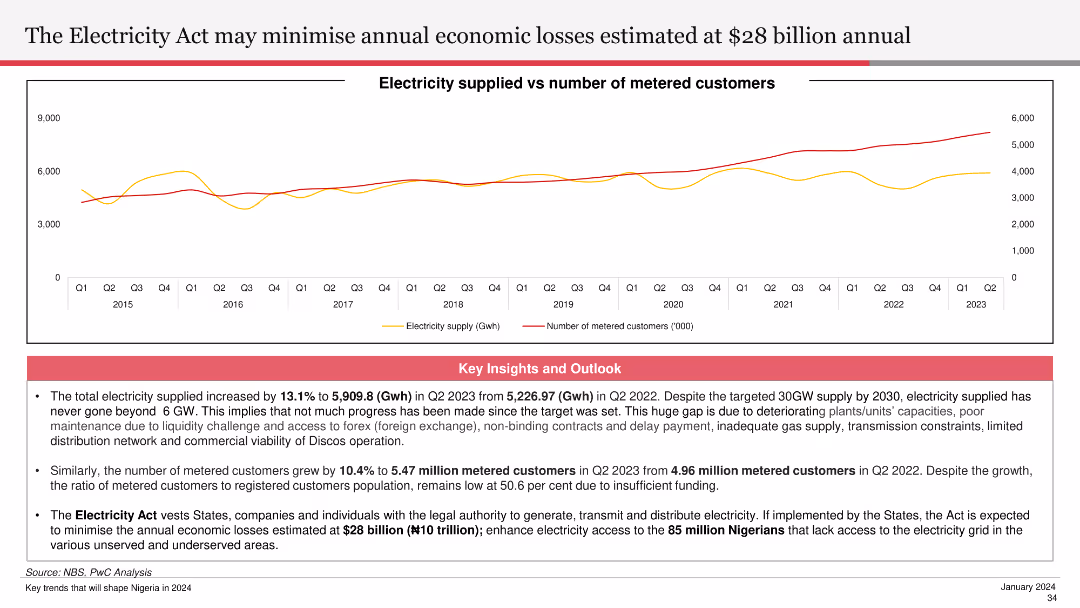
The slide includes a line chart showing electricity supplied versus the number of metered customers from Q1 2015 to Q2 2023. Key insights and outlooks discuss the potential economic impact of the Electricity Act and improvements in electricity supply.
Regulatory and Compliance
Energy & Utilities
This slide analyzes the expected impact of the Electricity Act on minimizing annual economic losses, highlighting improvements in electricity supply and customer metering. It discusses the Act's potential to enhance access and economic stability.
Electricity Act, economic losses, electricity supply, metered customers, economic stability
false
The Electricity Act may minimise annual economic losses estimated at $28 billion annualNigeria Economic Outlook
Mixed Chart
PwC/Strategy&
View slide
Bar charts showing Gen Z, Millennials, Gen X, and Baby Boomers’ views on education system quality, improvement over time, and whether growing up is harder now.
Customer and Market Segmentation
Education & Training
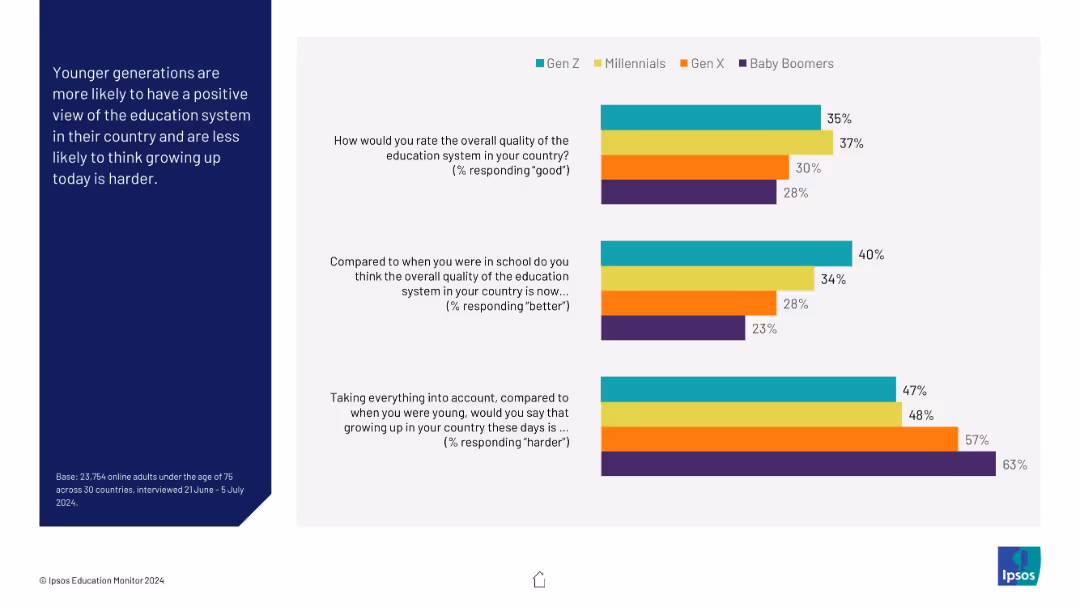
This generational analysis reveals that younger generations have a more favorable view of education and are less likely to believe growing up today is harder, while older generations report greater concern and skepticism toward modern challenges.
generation gap, education quality, growing up, Ipsos, Baby Boomers, Gen Z, perception
false
Generational views on education and growing upIPSOS EDUCATION MONITOR 2024
Mixed Chart
IPSOS
View slide
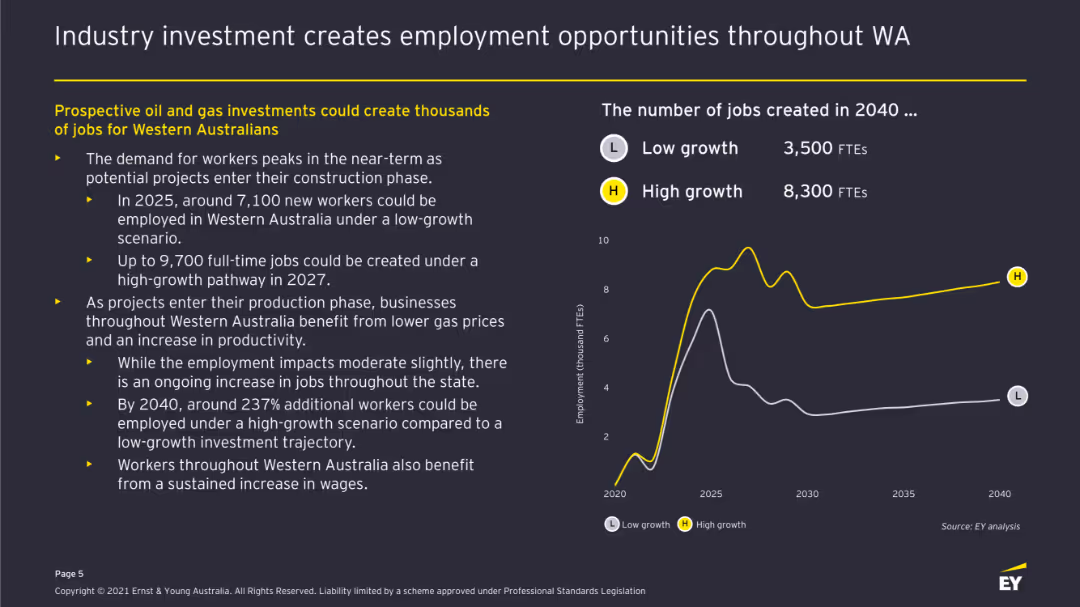
Line chart displaying employment projections under low and high growth scenarios. Accompanied by bullet points explaining employment impacts and job creation estimates.
Human Resources and Talent Management
Energy & Utilities
Highlights the job creation potential of prospective oil and gas investments, detailing the expected employment peaks and the long-term impact on job numbers in Western Australia.
Employment, Job Creation, Oil and Gas, Western Australia, Growth Scenarios, Workforce, Economic Activity
false
Industry investment creates employment opportunities throughout WAThe economic contribution of Western Australia’s oil and gas industry
Mixed Chart
EY
View slide
Two donut charts side by side comparing the share of FDI in Central America from the USA between 2021 and 2022. Each segment is color-coded.
Investment Analysis
Financial Services
The slide compares the share of Foreign Direct Investment in Central America from the USA for the years 2021 and 2022, highlighting the changes in investment distribution by country.
FDI, Central America, USA, donut chart, comparison
false
FDI in Central America from USANearshoring in Central America
Multiple Chart
Deloitte
View slide
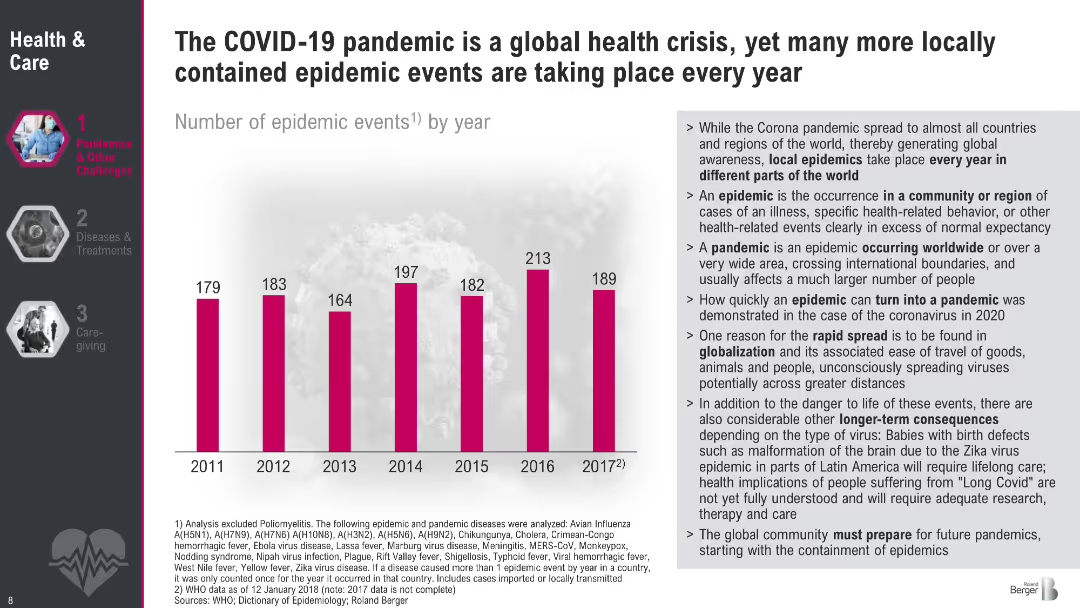
Bar chart layout (2011–2017) on left, text explanations on the right in bullet format; uses pink bars and gray text; background includes faded virus image; structured and clean design; left-hand navigation visible.
Risk Assessment and Management
Healthcare & Pharmaceuticals
Shows data on annual epidemic events and explains why local epidemics can become global pandemics. Key factors discussed include globalization, mutation speed, and long-term health impacts. Emphasizes the importance of early containment and preparedness in mitigating the spread and consequences of epidemics.
epidemics, local outbreaks, pandemic risk, containment, global health, virus spread, globalization
false
The COVID 19 pandemic is a global health crisis, yet many more locally contained epidemic events are taking place every yearMegatrend 2 Health & Care
Mixed Chart
Roland Berger
View slide
Provides definitions and statistics for various types of migrants, including refugees and internally displaced persons, with clear segmentation.
Market Analysis and Trends
Government & Public Sector
Educates on the complexities of migration and the varying statuses of migrants worldwide.
migration, refugees, IDPs, status, education
false
Migration is a complex topic – Not every migrant has crossed a border, not every immigrant is a refugeeRoland Berger Trend Compendium 2030: Megatrend 1 People & Society
Mixed Chart
Roland Berger
View slide
The slide features a colorful diagram illustrating the EFX Cloud architecture, highlighting various technological aspects such as data integration, real-time analytics, and built-in security features.
Technology and Digital Transformation
Technology & Software
This slide introduces the next phase in Equifax's cloud technology, detailing the enhanced capabilities and benefits of the EFX Cloud in improving service delivery and data management across its operations.
EFX Cloud, technology, data management, security
false
The EFX Cloud… the next chapterBarclays Credit Bureau Day
Diagram
Barclays
View slide
Includes column charts displaying the growth of green and sustainable financing at Barclays over the years.
Investment Analysis
Financial Services
Reviews Barclays' achievements in green and sustainable financing, detailing annual progress and future targets.
sustainable financing, green bonds, investment, financial services, growth, targets, environmental impact
false
FY23 progress against our sustainable financing targetsFY23 ESG Investor Presentation
Multiple Chart
Barclays
View slide
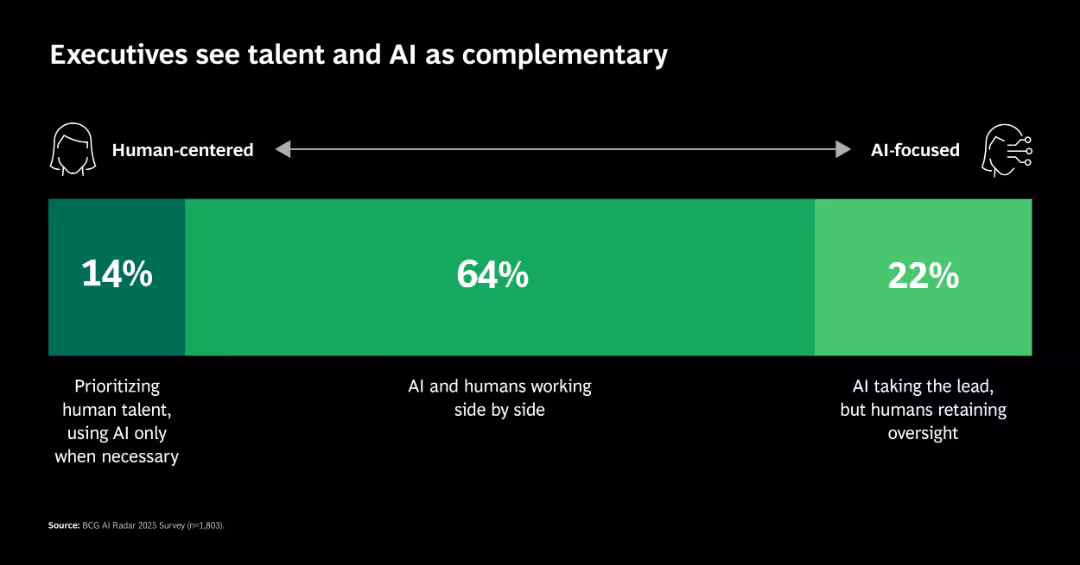
Single segmented horizontal bar showing distribution across a continuum: human-centered, hybrid, and AI-focused approaches.
Human Resources and Talent Management
Artificial Intelligence
Shows that 64% of executives prefer AI-human collaboration, with fewer choosing either extreme (AI-led or human-led). This reflects a trend toward integration rather than substitution.
AI collaboration, workforce, leadership, hybrid roles, talent strategy
false
Executives see talent and AI as complementaryFrom Potential to Profit: Closing the AI Impact Gap
Single Chart
BCG
View slide
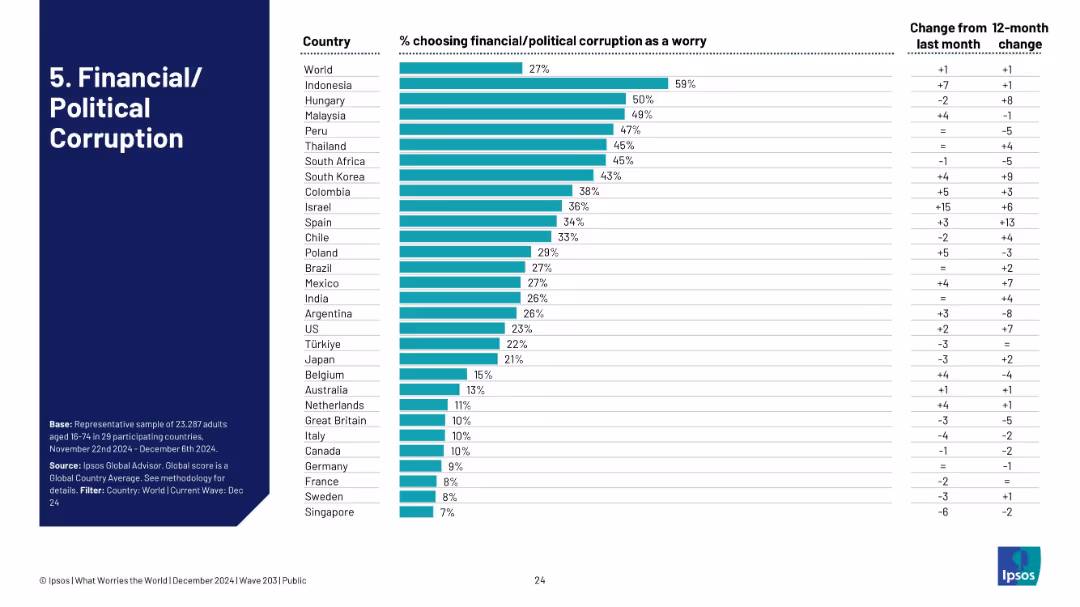
Bar graph depicting the percentage of people citing corruption as a key worry in different countries, with month/year change columns.
Regulatory and Compliance
Government & Public Sector
With 27% of people globally citing corruption as a concern, Indonesia and Hungary stand out. The slide visually compares perceptions by country and time, offering an overview of institutional trust issues worldwide.
corruption, governance, politics, Ipsos, transparency, country trust levels
false
5. Financial/Political CorruptionWHAT WORRIES THE WORLD? 2024
Single Chart
IPSOS
View slide
Slide displays bar charts showing preferred price ranges for the next vehicle purchase, categorized by overall consumers and specific groups like ICE and EV intenders.
Market Analysis and Trends
Transportation & Logistics
Highlights consumer expectations on vehicle affordability, emphasizing the economic considerations significant in purchasing decisions in the automotive sector.
affordability, consumer expectations, price sensitivity, electric vehicles, automotive market, purchasing behavior, economic factors, price range
false
Affordability remains a critical issue for the automotive industry as a majority of consumers still expect to pay less than €50K for their next vehicle.2024 Global Automotive Consumer Study
Mixed Chart
Deloitte
View slide
Contains six column charts showing 3-5 year earnings growth, trailing 12 month P/E, return on equity, market cap, beta, and dividend yield for S&P 500. Bars are vertical with varying data points in each category.
Financial Performance
Financial Services
Analyzes the one-month return of the S&P 500 index through various financial metrics. Useful for understanding recent performance trends in the index and comparing it with different financial indicators.
S&P 500, earnings growth, P/E ratio, return on equity, market cap, beta, dividend yield
false
S&P 500 Index: 1-Month Return Analysis 3-5 Year Earnings GrowthThe BEAT February 2024
Multiple Chart
Morgan Stanley
View slide
The slide includes pie charts depicting the impact of COVID-19 on home purchasing in Ontario.
Market Analysis and Trends
Real Estate & Construction
It discusses how the pandemic affected the timing of home purchases, with a majority buying earlier than expected.
COVID-19, pandemic, home purchasing, impact, timing, Ontario, pie chart, earlier, expected, analysis
false
COVID-19 Pandemic and Home PurchasingMarket Year in Review and Outlook 2021
Multiple Chart
IPSOS
View slide
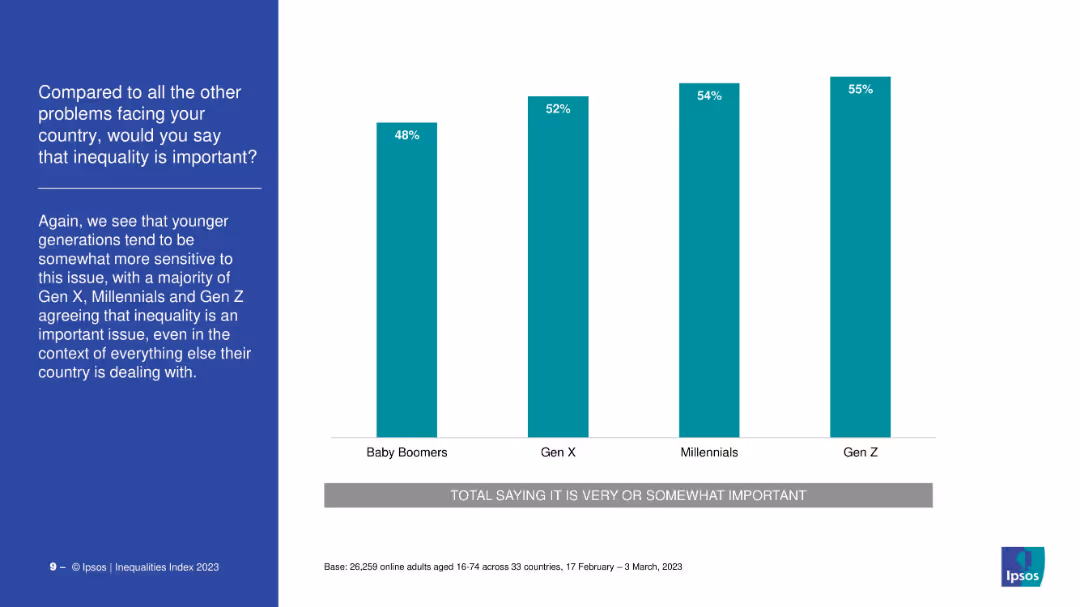
Vertical bar chart comparing importance of inequality by generation. Simple layout with teal bars and left-side title.
Market Analysis and Trends
Government & Public Sector
A generational comparison of perceived importance of inequality shows Gen Z rates it the highest (55%), followed by Millennials and Gen X, while Baby Boomers are least concerned at 48%.
inequality, generational attitudes, social concern, priorities, survey
false
Compared to all the other problems...IPSOS EQUALITIES INDEX 2023
Mixed Chart
IPSOS
View slide
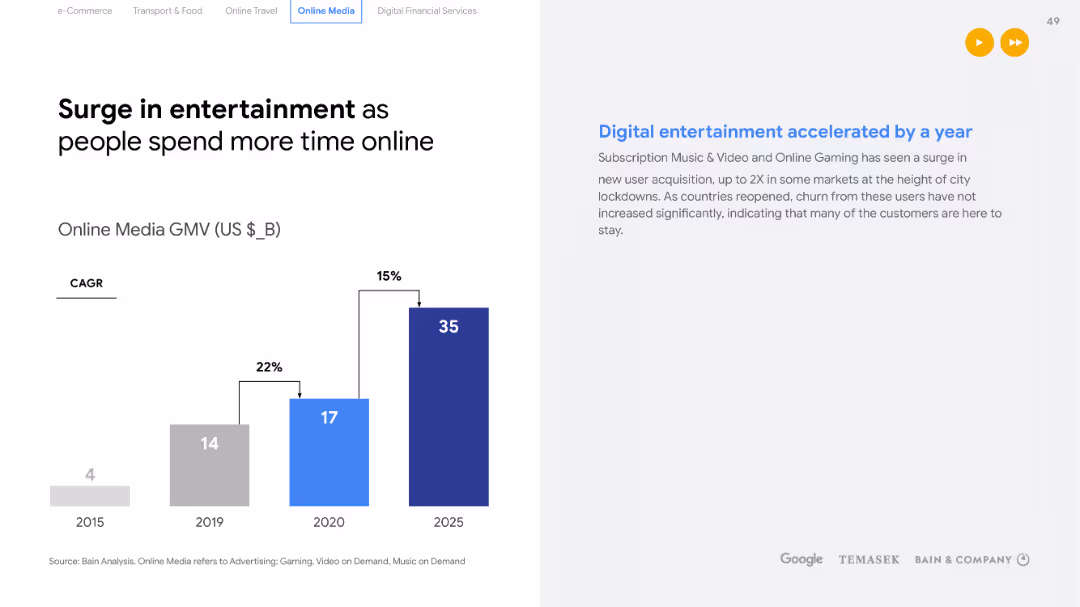
Bar chart displaying the GMV for Online Media from 2015 to a 2025 forecast, with a breakdown of different online media types. Text on the right outlines the acceleration of digital entertainment during the pandemic.
Market Analysis and Trends
Technology & Software
Forecasts growth in the online media sector and highlights the acceleration of digital entertainment adoption due to the pandemic. Useful for media companies and investors looking at digital trends and customer retention post-pandemic.
Online media, Digital entertainment, Growth forecast, Pandemic impact, Customer retention
false
Surge in entertainment as people spend more time onlinee-Conomy SEA 2020 At full velocity: Resilient and racing ahead
Single Chart
Bain
View slide
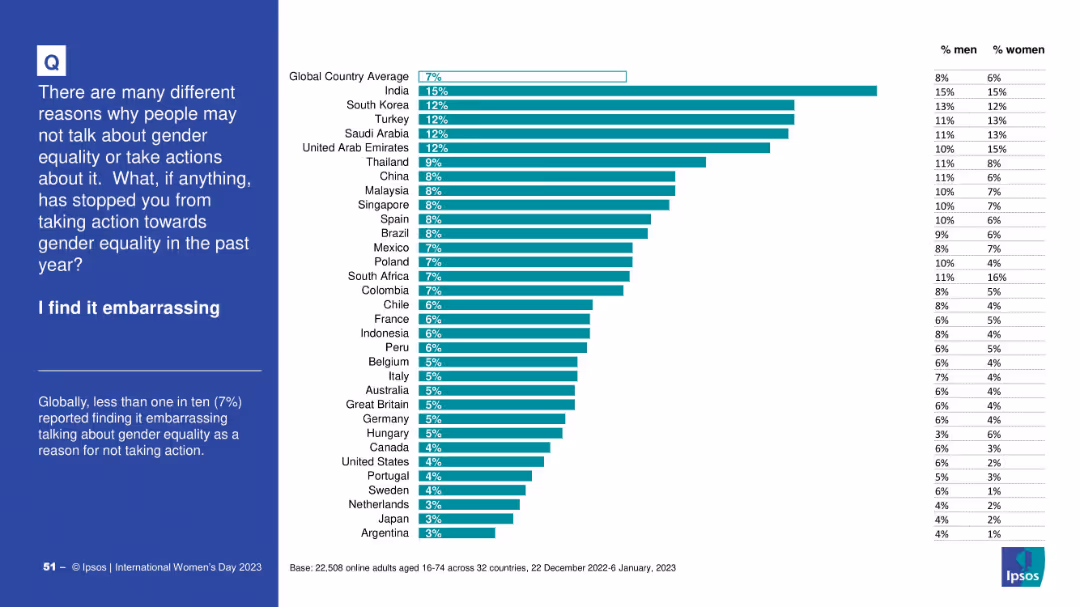
Bar chart ranking countries by % who cited embarrassment as a barrier; right-hand table with male/female split; explanatory text on the left.
Human Resources and Talent Management
Government & Public Sector
This chart shows the percentage of people who find discussing gender equality embarrassing. India leads with 15%, global average is 7%. Both male and female perceptions are displayed, highlighting cultural differences in stigma.
embarrassment, gender equality, stigma, survey, perceptions, Ipsos, global opinion
false
I find it embarrassingINTERNATIONAL WOMEN'S DAY 2023
Mixed Chart
IPSOS
View slide
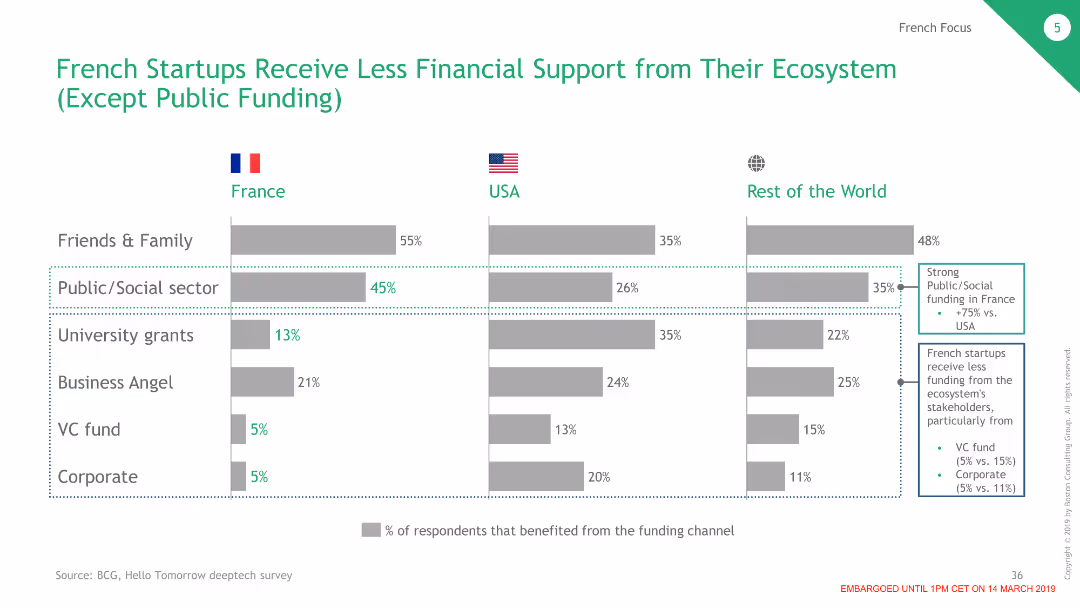
Features a bar chart comparing sources of financial support for startups in France, the USA, and the RoW, emphasizing public sector support.
Financial Performance
Financial Services
Highlights the relative lack of financial support from private sources for French startups compared to public sector support.
startups, financial support, France, public sector, funding
false
French Startups Receive Less Financial Support from Their Ecosystem (Except Public Funding)The Dawn of the Deep Tech Ecosystem
Multiple Chart
BCG
View slide
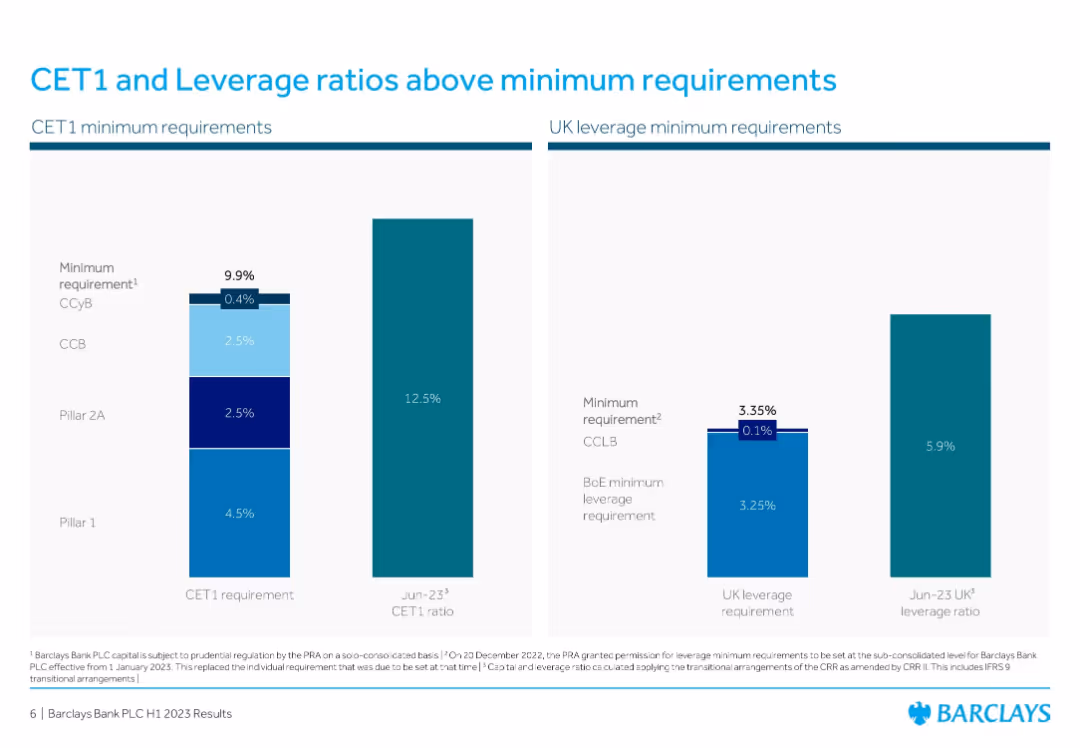
Dual bar charts comparing actual vs. required CET1 and leverage ratios
Regulatory and Compliance
Financial Services
Shows how Barclays’ CET1 capital ratio (12.5%) and UK leverage ratio (5.9%) exceed regulatory minimums. Helps illustrate compliance strength, capital buffers, and the institution’s financial resilience against regulatory thresholds.
CET1, Leverage Ratio, Regulation, Capital Buffer, Compliance, Barclays, Financial Safety, Ratios
false
CET1 and Leverage ratios above minimum requirementsH1 2023 Client information – Summary of existing disclosure
Multiple Chart
Barclays
View slide
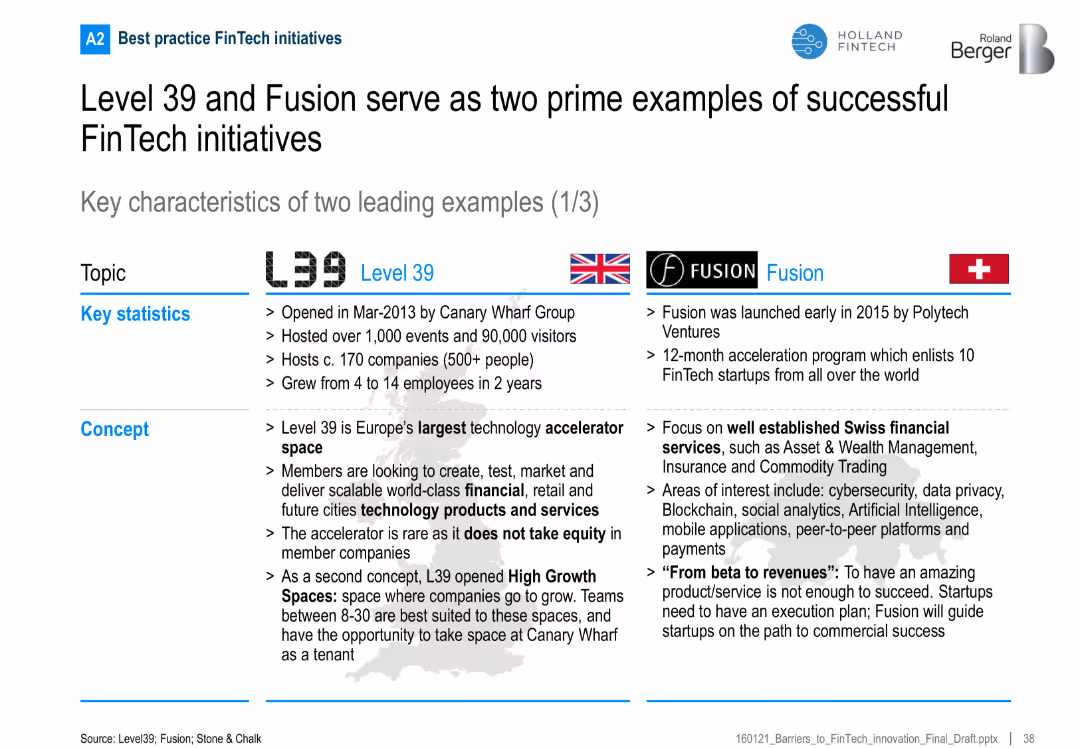
Two-column comparison of Level 39 and Fusion including key statistics and program concepts
Competitive Landscape
Financial Services
This slide compares London’s Level 39 and Geneva’s Fusion FinTech hubs in terms of their scale, focus areas, structure, and success frameworks, offering models for FinTech ecosystem development.
FinTech, accelerator, Level 39, Fusion, Switzerland, London, startups
false
Key characteristics of two leading examples (1/3)Barriers to FinTech innovation in the Netherlands
Table
Roland Berger
View slide
Left side has percentage boxes, right side has a pie chart and text
Sales and Business Development
Retail & E-commerce
Analysis of generative AI's potential to replace roles in sales operations, focusing on team efficiency
sales, AI, team replacement, sales operations
false
Sales* Some believe they can completely replace a team member with generative AI, with sales ops being most commonGenerative AI Surveys
Mixed Chart
Gartner
View slide
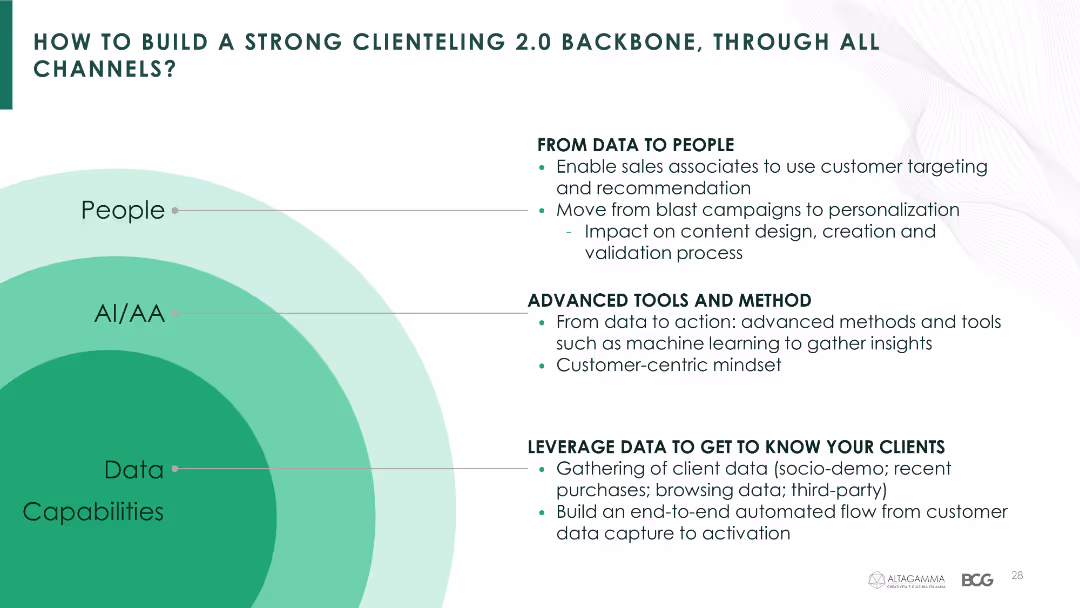
This slide uses a layered diagram with sections labeled 'People', 'AI/AA', and 'Data Capabilities' to illustrate the components of clienteling.
Strategic Planning
Retail & E-commerce
The slide explains how to build a clienteling backbone using data, advanced tools, and personalized recommendations, aimed at improving customer relationships across channels.
Clienteling, data, AI, recommendations, tools, customer-centric, insights, personalization, engagement
false
HOW TO BUILD A STRONG CLIENTELING 2.0 BACKBONE, THROUGH ALL CHANNELS?True-Luxury Global Consumer Insights 7th Edition
Diagram
BCG
View slide
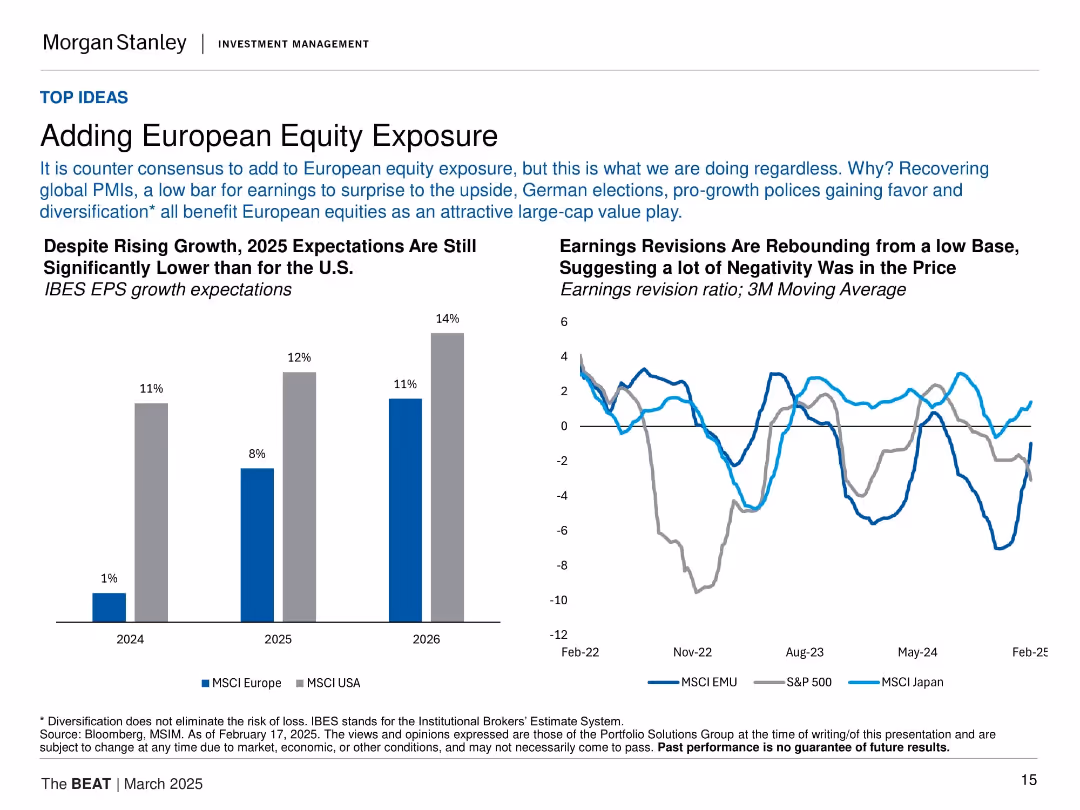
Bar chart of EPS growth expectations (EU vs US); line chart of earnings revisions by region. Clear labels and dual layout.
Investment Analysis
Financial Services
Advocates for increased European equity exposure despite a generally cautious consensus. Notes that EPS expectations are rising and revisions are turning positive, aided by global PMIs, pro-growth policies, and low valuation baselines.
Europe, equities, EPS growth, earnings revisions, MSCI Europe, diversification, investment strategy
false
Adding European Equity ExposureThe BEAT March 2025
Multiple Chart
Morgan Stanley
View slide
This slide presents column chart comparing current MREL/TLAC requirements with available capital resources, highlighted with clear, distinct colors for different types of capital. Key highlights discuss regulatory implications.
Regulatory and Compliance
Financial Services
Discusses the institution's capacity to meet and exceed regulatory capital requirements, providing a detailed view on the sufficiency of loss-absorbing capacity, and strategic planning implications for financial stability.
regulatory, capital, financial, stability, planning
false
Continued high loss-absorbing capacity In € bn, period endQ3 2023 Fixed Income Investor Conference Call
Mixed Chart
Deutsche Bank
View slide
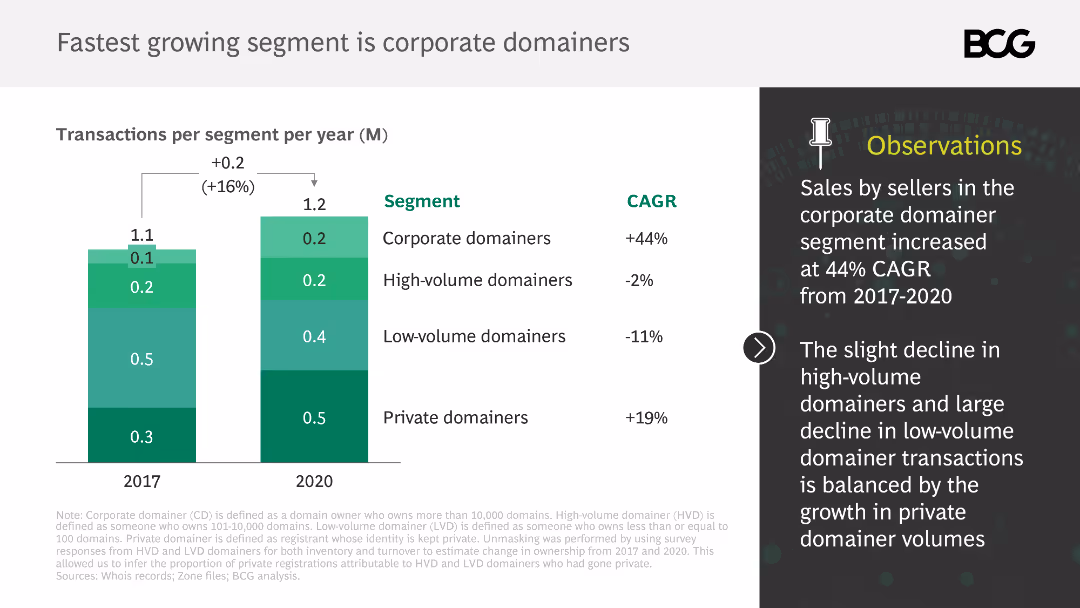
This slide presents a column chart comparing transactions per segment (corporate, high-volume, low-volume, private domainers) from 2017 to 2020. Observations are listed.
Market Analysis and Trends
Retail & E-commerce
It identifies the corporate domainer segment as the fastest-growing, with significant increases in transactions, while highlighting changes in other segments.
corporate domainers, transactions, growth, segments, market analysis
false
Fastest growing segment is corporate domainersWhat’s in a (Domain) Name? The $2 Billion Secondary Market for Dot-Com Domains
Mixed Chart
BCG
View slide
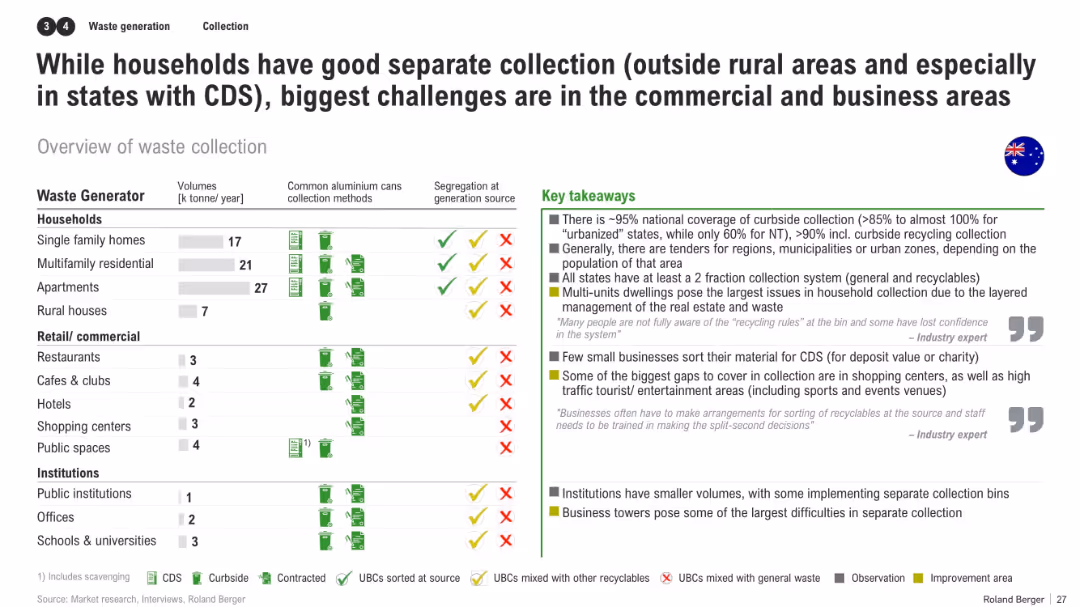
Matrix chart of waste generators vs. collection practices, with takeaway notes about systemic gaps in commercial recycling
Operational Efficiency
Environmental Services & Sustainability
The slide evaluates collection practices by waste generator type (households, commercial, institutional), revealing strong household coverage but poor segregation in businesses and institutions. It highlights pain points like awareness, infrastructure, and commercial participation.
waste collection, commercial waste, segregation, CDS, recycling gaps, business challenges, Australia
false
While households have good separate collection (outside rural areas and especially in states with CDS), biggest challenges are in the commercial and business areasAluminum Cans Market Assessment - Australia
Mixed Chart
Roland Berger
View slide
The slide includes a column chart comparing vacancy rates and a bar chart showing timely application processing. It has a mix of text and visual data elements, with a clear focus on workforce metrics.
Operational Efficiency
Professional Services
Slide includes bar charts and a text block. Displays vacancy comparisons and application processing timeliness over time.
Highlights workforce capacity issues within DEHS, comparing vacancy rates and analyzing the timeliness of application processing over a specified period.
false
DEHS | Increase Workforce Capacity | AnalysisNH DHHS Operations Assessment
Multiple Chart
Alvarez & Marsal
View slide
The slide contains bar charts showing investments in infrastructure and real estate sectors by value and number of deals, with different time periods represented.
Market Analysis and Trends
Real Estate & Construction
This slide presents investment data for infrastructure and real estate sectors, comparing the total value of investments and the number of deals across different months, aimed at providing insights into sector-specific investment trends.
PE/VC, Investments, Infrastructure, Real Estate, Value, Deals, Bar Chart
false
PE/VC investments: split by deal type and deal size (excluding infrastructure and real estate)Why do uncertain times need a certainty of purpose? January 2023
Multiple Chart
EY
View slide
The slide has moderate complexity, featuring a multi-layered column chart illustrating investment diversification across sectors, labeled with years and sectors.
Market Analysis and Trends
Financial Services
Focuses on investment diversification, showing how funds are allocated across various sectors like e-commerce, online media, and others with a year-on-year comparison.
Diversification, investment, sectors, e-commerce, online media
false
Investors continue to diversify into nascent sectorse-Conomy SEA 2020 At full velocity: Resilient and racing ahead
Single Chart
Bain
View slide
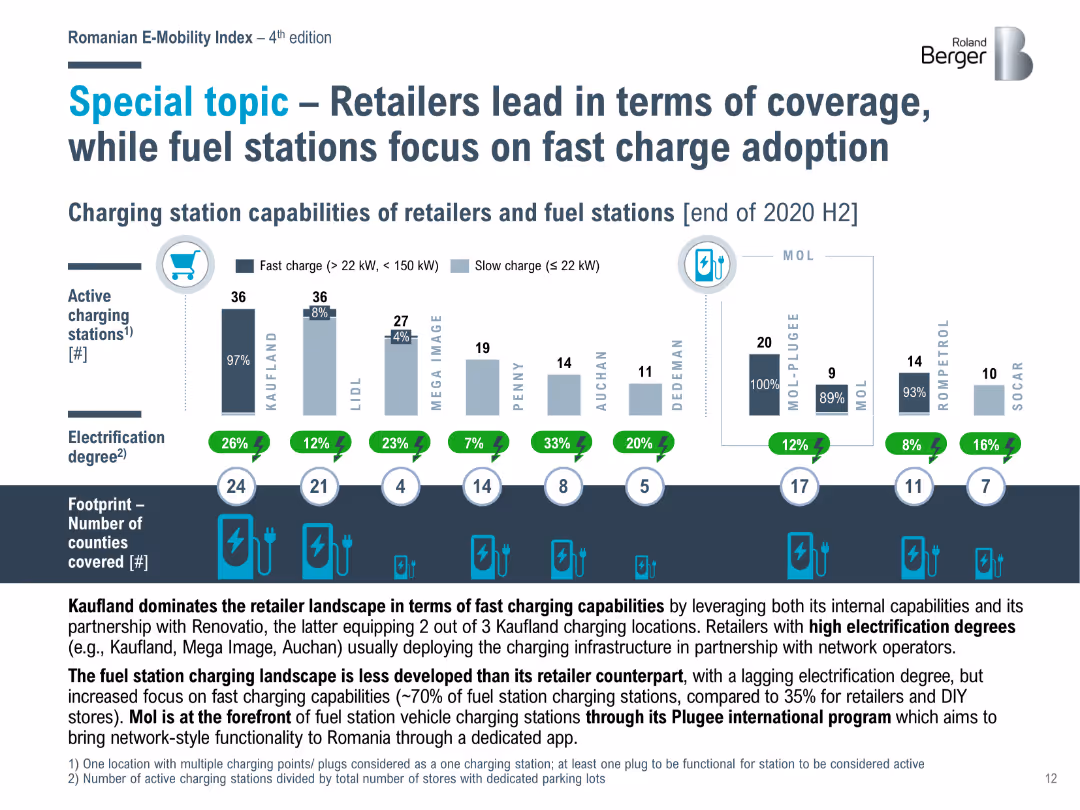
Bar chart comparing the charging station capabilities of retailers and fuel stations in Romania at the end of 2020 H2, highlighting the focus on fast charging.
Market Analysis and Trends
Energy & Utilities
Examines the leadership of retailers in charging station coverage in Romania, with fuel stations focusing on adopting fast charging technologies to meet increasing demand.
charging stations, retailers, fuel stations, Romania, fast charging
false
Special topic – Retailers lead in terms of coverage, while fuel stations focus on fast charge adoptionRomanian E Mobility Index REI 4 (Fourth Edition)
Mixed Chart
Roland Berger
View slide
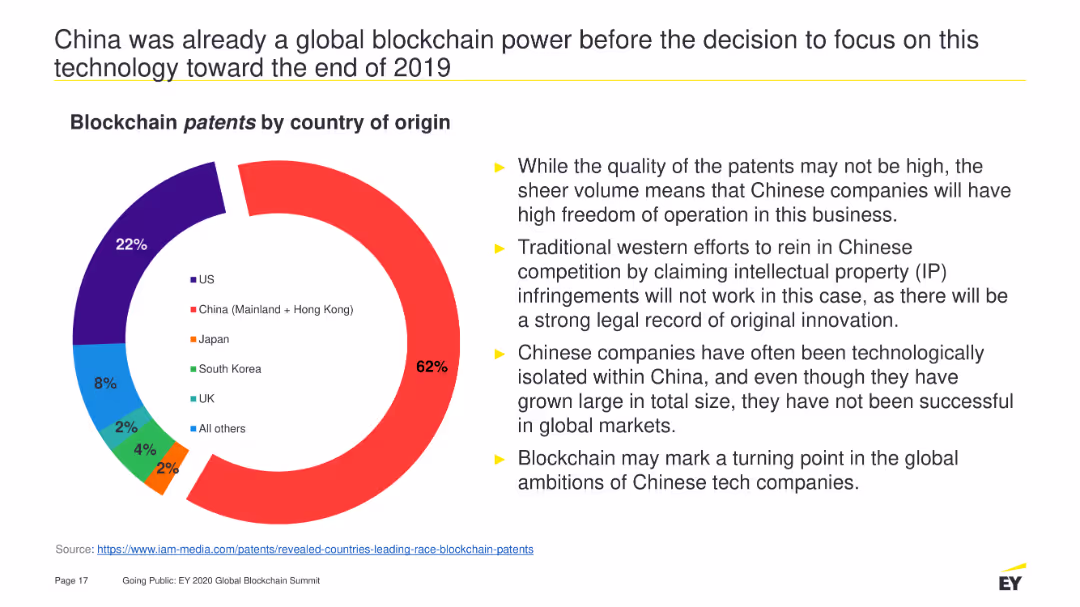
A pie chart depicting the distribution of blockchain patents by country of origin. It is visually dominated by China's portion (62%), followed by the US (22%), Japan (8%), and other countries with smaller percentages. The slide also contains bullet points summarizing the implications.
Market Analysis and Trends
Technology & Software
Highlights China's dominance in blockchain patents, explaining the high volume of patents and their potential impact on global market dynamics and competition strategies.
Blockchain, patents, China, technology, global market, intellectual property, innovation, competition, freedom of operation
false
China was already a global blockchain power before the decision to focus on this technology toward the end of 2019Going Public EY Global Blockchain Summit 2020
Mixed Chart
EY
View slide
A slide with two segments; the left side shows a circular diagram with sectors centered around client centricity, and the right side includes a descriptive statement on a black background.
Client Case Studies
Financial Services
This slide visually describes the integrated approach of the organization in serving global clients, emphasizing client centrality.
Integration, Client, Centricity, Global, Financial, Services, Organization, Approach
false
One Goldman SachsOne Goldman Sachs
Diagram
Goldman Sachs
View slide
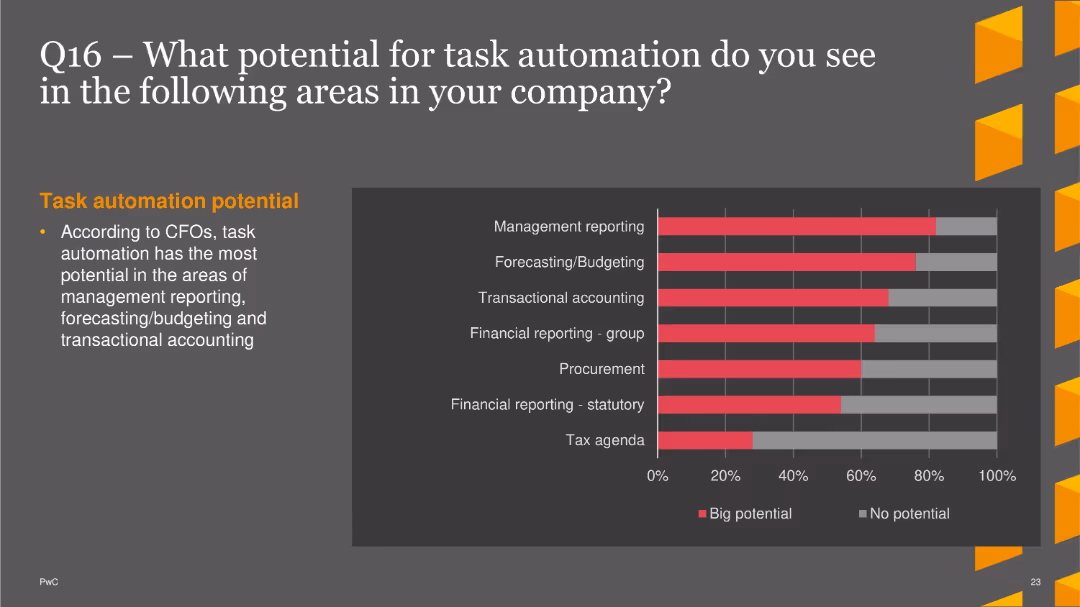
The slide displays a column chart indicating the potential for task automation in various company areas. Areas include management reporting, forecasting/budgeting, transactional accounting, financial reporting (group and statutory), procurement, and tax agenda. The potential is categorized as big potential (red) and no potential (gray). A short text section on the left side explains task automation potential according to CFOs.
Operational Efficiency
Financial Services
This slide shows survey data on the perceived potential for task automation in different company functions, with management reporting and forecasting/budgeting identified as areas with the highest potential. It provides insights for companies looking to enhance operational efficiency through automation.
task automation, management reporting, forecasting, transactional accounting, finance
false
Q16 – What potential for task automation do you see in the following areas in your company?PwC CFO Insights Survey 2022
Single Chart
PwC/Strategy&
View slide
The slide features a column chart depicting primary energy demand by fuel from 2000 to 2040 under stated policies scenario. It includes advanced biofuels, primary solid biofuels, hydro, nuclear, other renewables, gas, oil, and coal, with growth rates for each type.
Market Analysis and Trends
Energy & Utilities
This slide analyzes the projected growth rates of different energy sources, showing that wind and solar energies are expected to grow faster than advanced biomass by 2040.
primary energy demand, fuel, growth rate, wind energy, solar energy, biomass, 2040, stated policies scenario
false
Wind and solar energies are expected to grow faster than advanced biomass by 2040 (+7% vs. +2,5%)Developing sustainable carbon circularity Looking at advanced applications and business models
Mixed Chart
Kearney
View slide
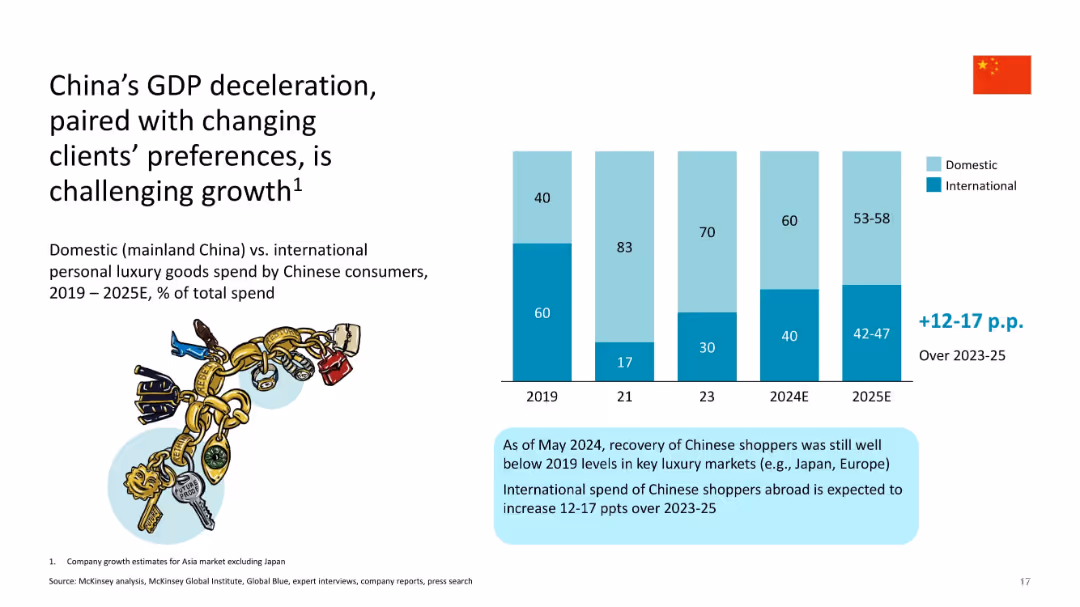
Split layout with text on left, bar chart on right; uses blue tones; Chinese flag and illustrated shopping bags
Market Analysis and Trends
Consumer Goods
Shows shift in Chinese consumer luxury spending from domestic to international markets due to GDP slowdown and evolving preferences; forecasts international spend increase of 12–17 percentage points from 2023–2025.
China, GDP, luxury spending, domestic vs international, consumer trends, 2025 forecast, preferences, growth challenge
false
China’s GDP deceleration, paired with changing clients’ preferences, is challenging growth1The State of Luxury January 2025
Mixed Chart
McKinsey
View slide
Bar chart comparing the growth rates of different consumer revenue segments in the entertainment and media industry from 2020 to 2025.
Market Analysis and Trends
Media & Entertainment
Forecasts the growth in consumer revenue across various segments, with particular emphasis on OTT video and VR as high-growth areas.
consumer revenue, segment growth, OTT video, VR, 2025 forecast, entertainment, media
false
Consumer revenue - Growth by segments: Overall growth for consumer revenue will be at 3.9 % (2020-2025)Global & Entertainment Media Outlook 2021-2025
Mixed Chart
PwC/Strategy&
View slide
The slide is divided into three columns comparing benefits of ESG in various categories, levels of ESG integration, and why companies are in the ESG game. It uses bar charts and percentages to compare different categories and their benefits.
Market Analysis and Trends
Environmental Services & Sustainability
The slide discusses the long-term value created by ESG initiatives, highlighting benefits like increased revenue, cost savings, and brand credibility. It also examines the integration levels of ESG in companies and the reasons behind their ESG initiatives.
ESG, value, benefits, integration, credibility
false
ESG creates long term value in cultural progress, brand credibility and cost savings. ESG ambitions must be integrated deep into the organization, otherwise results might trail behind.ESG maturity research and findings in Croatia
Multiple Chart
Kearney
View slide
This slide presents a column chart contrasting employer and employee views on the attention paid to financial benefits over three years, with a significant increase in employee attention highlighted for the recent year.
Human Resources and Talent Management
Financial Services
Focuses on HR leaders' perspectives on employee attentiveness to benefits, indicating a growing awareness and importance of financial benefits in the workplace.
HR Perspectives, Financial Benefits, Employee Attentiveness, Bar Graph, Trends
false
HR Leaders Know Employees Are WatchingState of the Workplace III
Single Chart
Goldman Sachs
View slide
Features a line chart comparing net charge-off performance against a peer group over a decade, alongside bullet points summarizing portfolio diversification and market conditions. The visual complexity is moderate with a clear focus on risk metrics.
Risk Assessment and Management
Financial Services
Outlines JPMorgan's risk discipline in commercial and industrial lending, highlighting historical performance and strategies for downturn preparedness.
risk discipline, commercial banking, loan security, industry analysis, performance metrics, market commentary
false
Maintaining strong risk discipline – C&ICommercial Banking 2019
Mixed Chart
JP Morgan
View slide
Features column chart with efficiency ratios and a strategic plan outline with arrows and bullet points detailing expense management.
Operational Efficiency
Financial Services
Showcases a plan for expense savings to enable growth funding, likely used for operational strategy meetings or financial planning discussions.
Expense Savings, Efficiency, Growth Funding, Operational Strategy, Financial Planning
false
Expense Savings Creating Capacity to Fund Future GrowthGoldman Sachs Investor Day
Mixed Chart
Goldman Sachs
View slide
A multi-line graph comparing revenue against media spend in different channels, emphasizing superior returns from TV advertising with numbered key insights.
Investment Analysis
Media & Entertainment
Focuses on the comparative ROI from various media channels, particularly highlighting the efficiency of TV advertising in generating higher returns.
TV advertising, media channels, ROI, investment returns, comparative analysis
false
ADVERTISERS SEE GREATER RETURNS ON AN ADDITIONAL DOLLAR SPENT ON TV ADS COMPARED TO ONE SPENT ON OTHER CHANNELSAccenture Post and Parcel Industry Research 2019
Mixed Chart
Accenture
View slide
The slide contains pie charts showing the development in self-confidence, presentation skills, and business networking skills among program participants.
Strategic Planning
Education & Training
The slide outlines the Smart Futures program, emphasizing the development of employability skills and business mentoring for young people.
Smart Futures, employability, skills development, mentoring
false
Smart FuturesEY Foundation 2022-23 Impact Report
Multiple Chart
EY
View slide
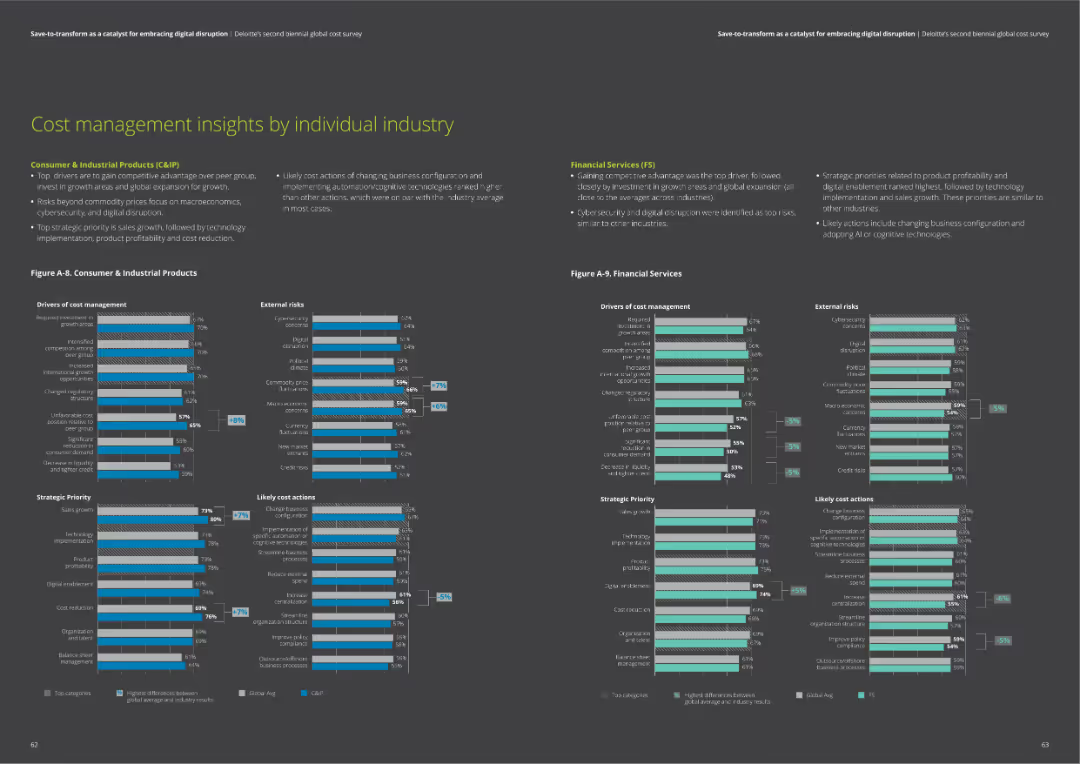
The slide contains two column charts comparing drivers of cost management, external risks, strategic priorities, and likely cost actions for Consumer & Industrial Products and Financial Services sectors.
Market Analysis and Trends
Financial Services
Insights on cost management, including drivers, risks, priorities, and actions for Consumer & Industrial Products and Financial Services. Helps understand industry-specific trends.
cost management, industry insights, risks, priorities, actions
false
Cost management insights by individual industrySave-to-transform as a catalyst for embracing digital disruption Deloitte’s second biennial global cost survey
Multiple Chart
Deloitte
View slide
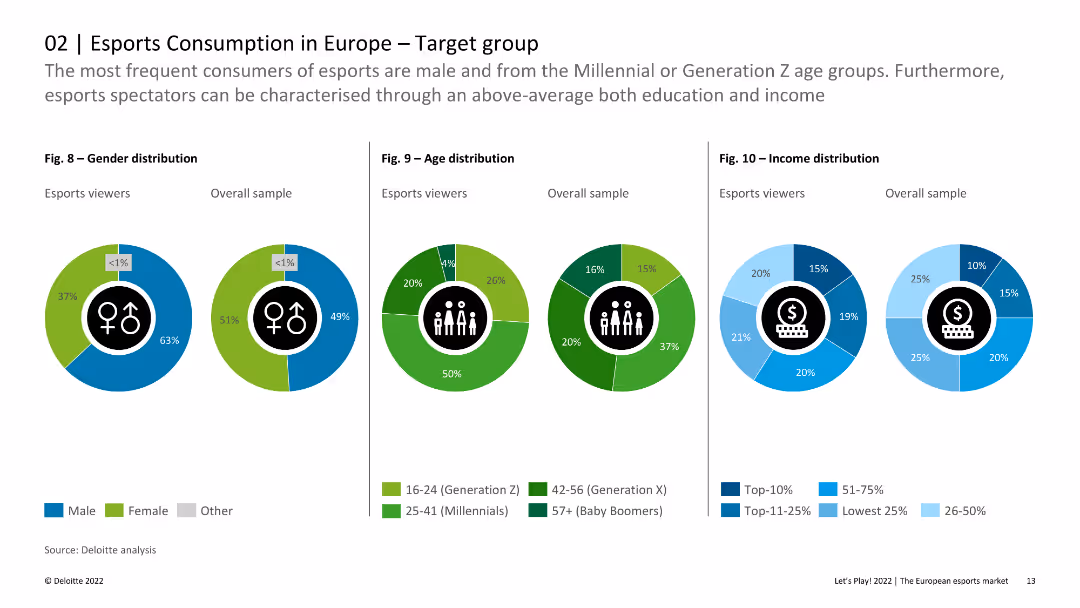
The slide includes pie charts and column charts showing gender, age, and income distribution among esports viewers compared to the overall sample. The visual layout is clear and data-centric.
Customer and Market Segmentation
Media & Entertainment
This slide provides detailed demographic breakdowns of esports viewers in Europe, emphasizing differences in gender, age, and income distribution compared to the general population. It highlights that esports viewers are younger and more male-dominated.
Esports, Demographics, Gender, Age, Income
false
The most frequent consumers of esports are male and from the Millennial or Generation Z age groups.Let’s Play! 2022 The European esports market
Multiple Chart
Deloitte
View slide
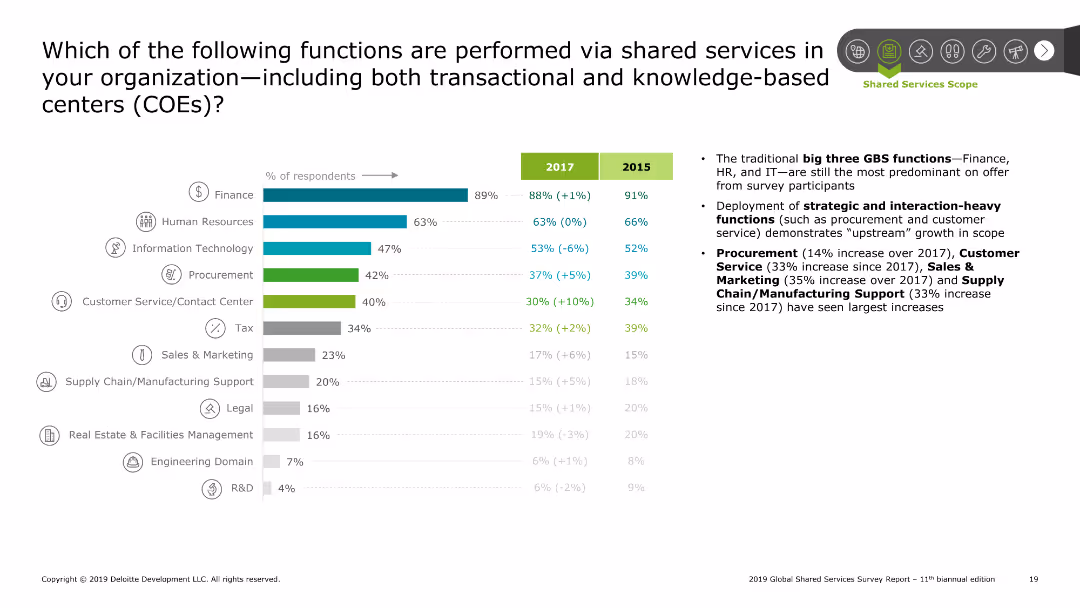
Bar chart showing percentage of respondents performing various functions via shared services for 2017 and 2015. Functions listed include finance, HR, IT, procurement, etc. Right side contains summary points on trends and growth.
Operational Efficiency
Professional Services
The slide presents the functions performed via shared services with a bar chart comparing 2017 and 2015 data. Key functions include finance, HR, and IT, with notable growth in procurement and customer service functions. Summary points emphasize the trends and strategic deployment of these functions.
SSC, shared services, functions, finance, HR, IT
false
Which of the following functions are performed via shared services in your organization including both transactional and knowledge based centers (COEs)?2019 Global Shared Services Survey Report 11th biannual edition
Mixed Chart
Deloitte
View slide
Continuation of the previous slide, with value levers on the left and impact potential within 1 year on the right.
Technology and Digital Transformation
Technology & Software
Discusses the impact of industrializing ML across all industries by detailing specific value levers and expected impact within a year.
ML, impact, value, performance, risk, productivity
false
Why should leaders pay attention? 2McKinsey Technology Trends Outlook 2022 Industrializing machine learning
Header Vertical
McKinsey
View slide
The slide features a column chart showing the total public energy-related R&D spending in billions from 1974 to 2019, categorized by energy source. The chart includes annotations explaining key trends and changes.
Financial Performance
Energy & Utilities
This slide details the allocation of public R&D spending across various energy sources, showing that Carbon Capture, Utilization, and Storage (CCUS) receives a small portion compared to other technologies like renewables and nuclear.
R&D spending, CCUS, energy, public investment
false
Total public energy-related R&D spendCarbon Capture Utilization and Storage
Single Chart
Kearney
View slide
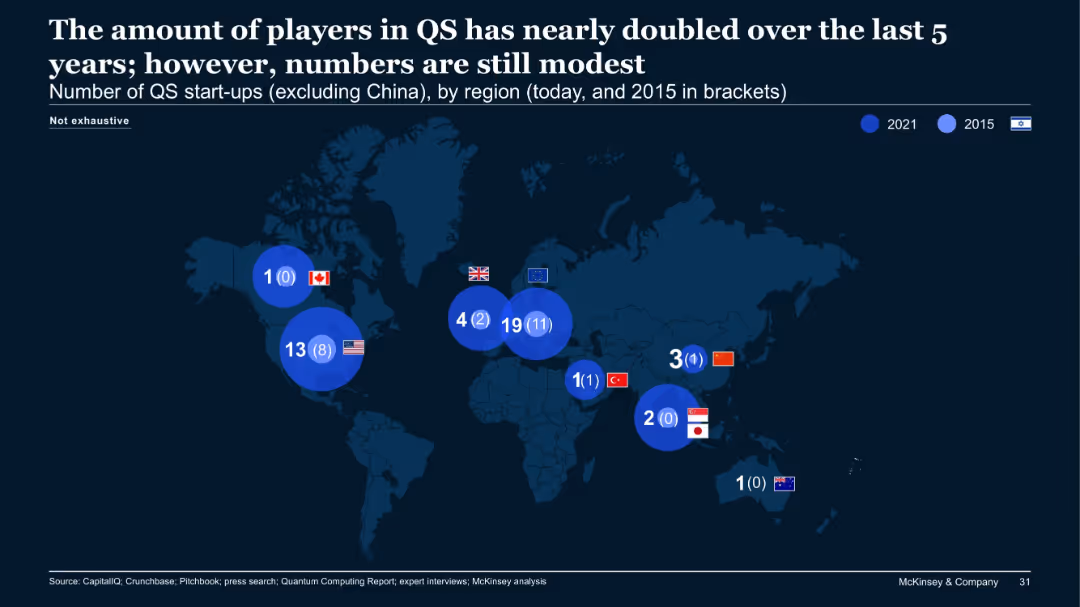
World map illustrating QS (quantum sensing) start-ups per region in 2021 and 2015, excluding China.
Market Analysis and Trends
Technology & Software
The number of quantum sensing (QS) start-ups has almost doubled over five years, though the overall volume remains modest. The EU leads with 19 in 2021 (up from 11), followed by the US. The map emphasizes regional differences and emerging interest in QS.
QS, quantum sensing, start-ups, growth, global, EU, map
false
The amount of players in QS has nearly doubled over the last 5 years; however, numbers are still modestThe Quantum Technology Monitor September 2021
Single Chart
McKinsey
View slide
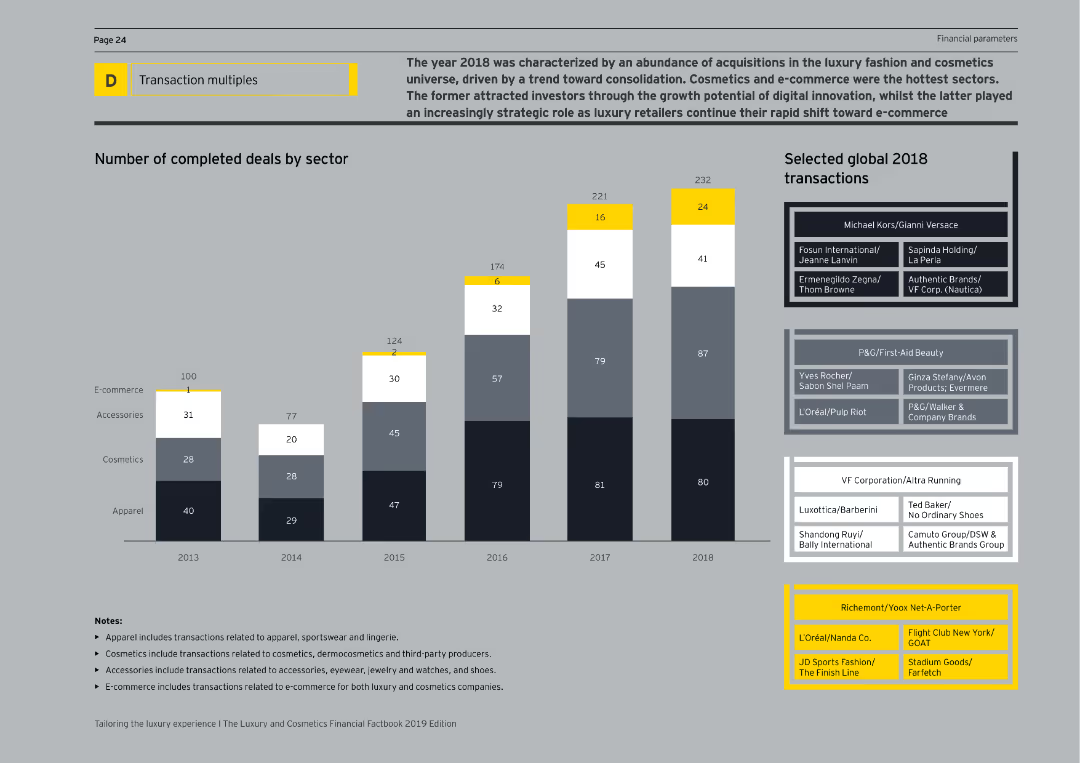
The slide features a column chart displaying the number of completed deals by sector from 2013 to 2018, and a list of selected global 2018 transactions on the right. The visual complexity is moderate, with clear labels and sector breakdowns.
Mergers and Acquisitions
Consumer Goods
The slide summarizes the acquisition activities in the luxury fashion and cosmetics sectors for 2018, highlighting the number of deals completed in various sectors such as e-commerce, accessories, cosmetics, and apparel, along with notable global transactions.
Acquisitions, Luxury, Fashion, Cosmetics, Deals
false
The year 2018 was characterized by an abundance of acquisitions in the luxury fashion and cosmetics universeTailoring the luxury experience The Luxury and Cosmetics Financial Factbook 2019 Edition
Mixed Chart
EY
View slide
The slide contains three column charts comparing IPO volumes, cash on the sidelines, and higher loan paydowns, showing changes from past averages to current levels.
Market Analysis and Trends
Financial Services
The slide indicates that key financial metrics are at cyclical lows, suggesting potential for future upside, with comparisons of IPO volumes, cash reserves, and loan paydowns.
IPO Volumes, Cash Reserves, Loan Paydowns, Financial Metrics, Cyclical Lows, Upside Potential, Column Charts, Analysis
false
We Are At Cyclical Lows Suggesting Upside AheadAchieving 30% Margins Through Growth
Multiple Chart
Morgan Stanley
View slide
This slide includes a line graph tracking the percentage change in marketing budgets over several periods, and an insights section with bullet points.
Market Analysis and Trends
Professional Services
Analyzes shifts in traditional advertising spend over recent months and projections, with sector-specific insights on how industries adapt their marketing strategies post-Covid.
traditional advertising, marketing spend, Covid-19, industry analysis, budget forecast
false
Traditional advertising marketing spend expected to dip in the next 12 months falling into pre Covid territoryThe CMO Survey Marketing in a Post Covid Era
Mixed Chart
Deloitte
View slide
Contains column chart in dark and light blue shades, depicting TLTRO transactions over time.
Financial Performance
Financial Services
Reviews TLTRO metrics and future projections, highlighting impacts on liquidity and financial stability.
TLTRO, financial forecast, liquidity, NSFR, LCR, banking, financial stability, projections
false
TLTRO development and forecast In € bnQ3 2023 Fixed Income Investor Conference Call
Single Chart
Deutsche Bank
View slide
Column chart indicating VCs' deal activity expectations with associated quotes on the right, structured under a descriptive title.
Investment Analysis
Technology & Software
Surveys VC expectations for increased deal activity in healthtech, SaaS, and Web3 from 2025-2030, and reduced focus on edtech.
healthtech, SaaS, Web3, edtech, VCs, long-term focus, deal activity, 2025-2030
false
>80% of VCs expect to increase focus on healthtech, SaaS, and Web3, while enthusiasm for edtech coolse-Conomy SEA 2022 Through the waves, towards a sea of opportunity
Mixed Chart
Bain
View slide
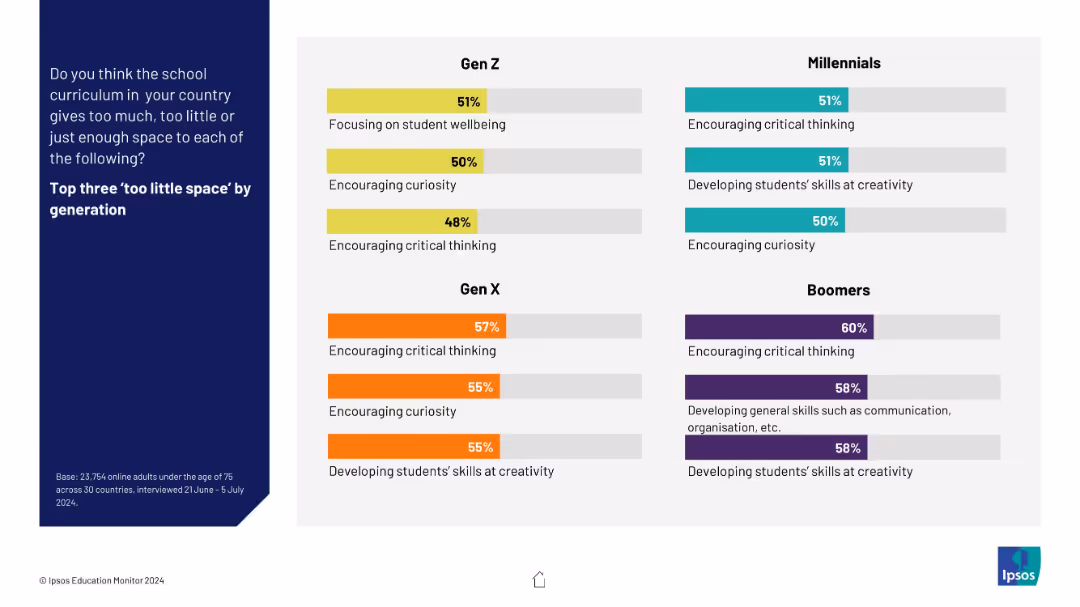
Four quadrant-style boxes segmented by generation, showing the top three areas lacking space in the curriculum. Each entry includes a percentage.
Customer and Market Segmentation
Education & Training
The slide details generational perspectives on which parts of the curriculum receive too little emphasis. Boomers most frequently cite critical thinking, while Gen Z highlights wellbeing and curiosity.
education gaps, generational perspective, curriculum critique, critical thinking, wellbeing
false
Do you think the school curriculum in your country gives too much, too little or just enough space to each of the following?IPSOS EDUCATION MONITOR 2024
Mixed Chart
IPSOS
View slide
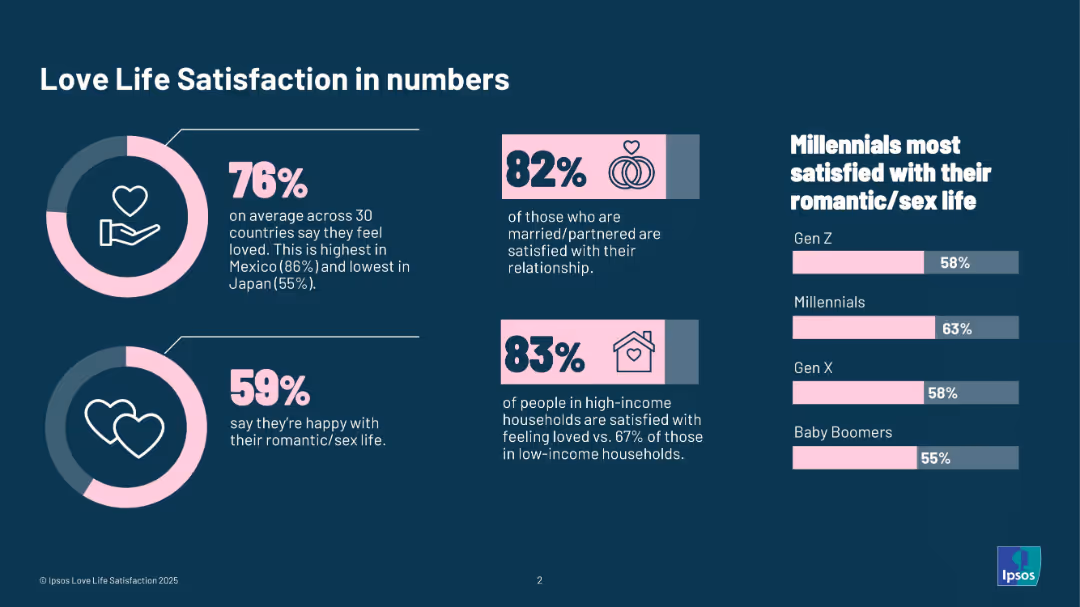
Dark background with icons and statistics displayed in infographic format using pink and white on blue.
Human Resources and Talent Management
Professional Services
This infographic summarizes global sentiments around love life satisfaction. It includes statistics on feeling loved, satisfaction by relationship status, income level, and generational breakdowns—highlighting that Millennials are most satisfied with their romantic/sex lives.
love life, satisfaction, relationship, income, generation, statistics, Ipsos, romantic life, emotional well-being
false
Love Life Satisfaction in numbersIPSOS LOVE LIFE SATISFACTION 2025
Multiple Chart
IPSOS
View slide
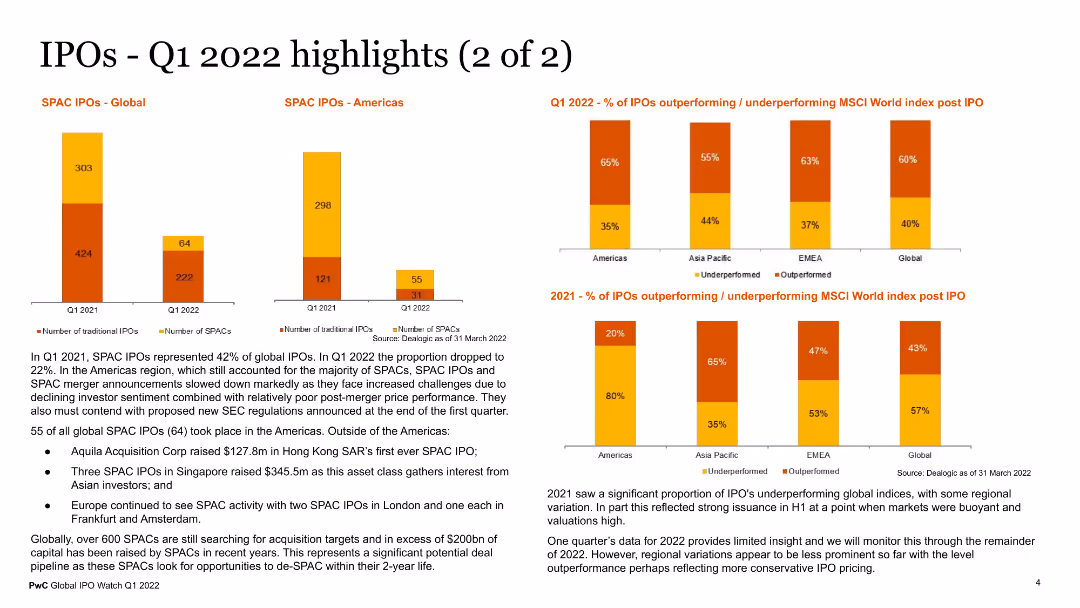
The slide includes visual elements such as a column chart for SPAC IPOs globally and in the Americas, and a bar chart showing the percentage of IPOs outperforming or underperforming MSCI World Index post IPO. The charts use different colors for clarity. Text sections provide additional context on SPAC activities and IPO performance trends.
Market Analysis and Trends
Financial Services
This slide provides additional highlights of IPO activities in Q1 2022, focusing on SPAC IPOs and performance metrics against the MSCI World Index. It offers insights into the performance and trends of SPACs and traditional IPOs, useful for financial analysts and investors.
SPAC IPOs, Q1 2022, IPO performance, MSCI World Index, financial trends
false
IPOs - Q1 2022 highlights (2 of 2)Global IPO Watch Q1 2022
Multiple Chart
PwC/Strategy&
View slide
The slide has two sections with descriptions of the basic oxygen furnace and direct reduction of iron processes, including images of the relevant furnaces.
Market Analysis and Trends
Energy & Utilities
The slide details hydrogen consumption in the steel industry, explaining basic oxygen furnace and direct reduction of iron processes, market trends, and hydrogen sources.
hydrogen, steel, oxygen furnace, direct reduction, iron, market trends, case study
false
The steel industry consumes about 13 Mt H2 per year, 4 of which is dedicated for direct reduction of ironHydrogen applications and business models
Mixed Chart
Kearney
View slide
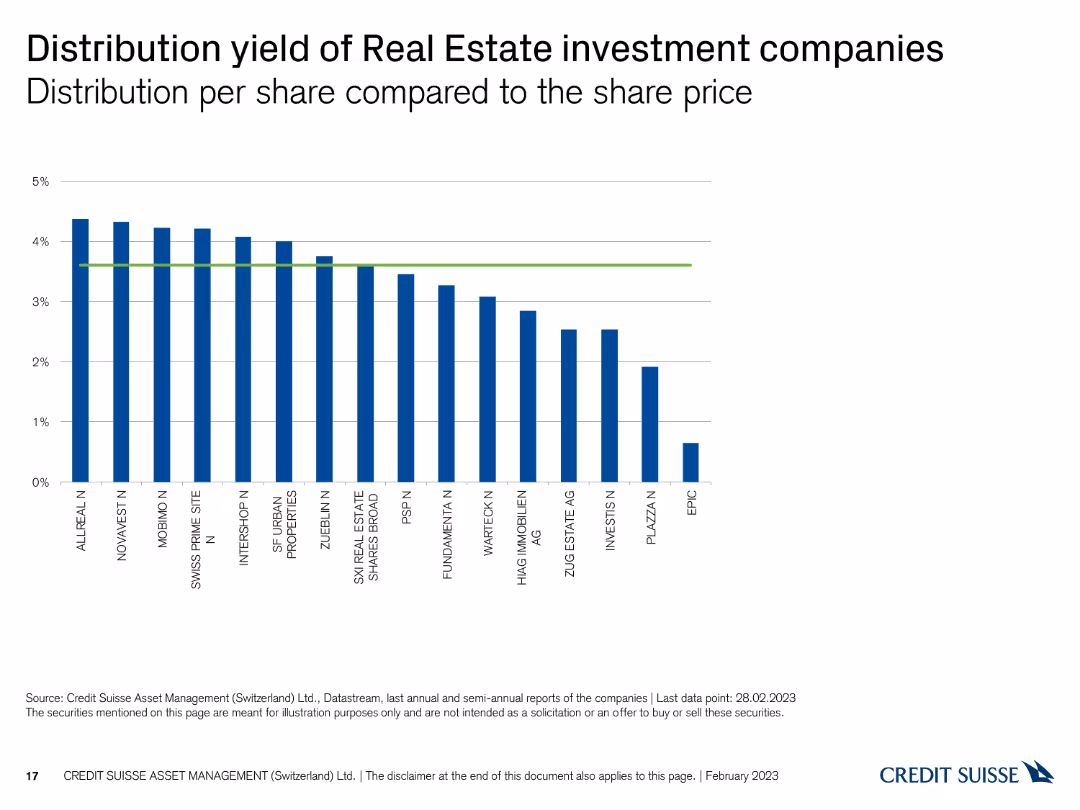
This slide displays a column chart showing the distribution yield per share for Swiss real estate investment companies, with vertical bars representing yield percentages and a green reference line.
Financial Performance
Real Estate & Construction
The slide presents the distribution yields of real estate investment companies, comparing their returns. It is used for evaluating income potential and investment performance.
Real estate, distribution yield, investment companies, returns, comparison
false
Distribution yield of Real Estate investment companies Distribution per share compared to the share priceSwiss Real Estate Funds At a glance February 2023
Single Chart
Credit Suisse
View slide
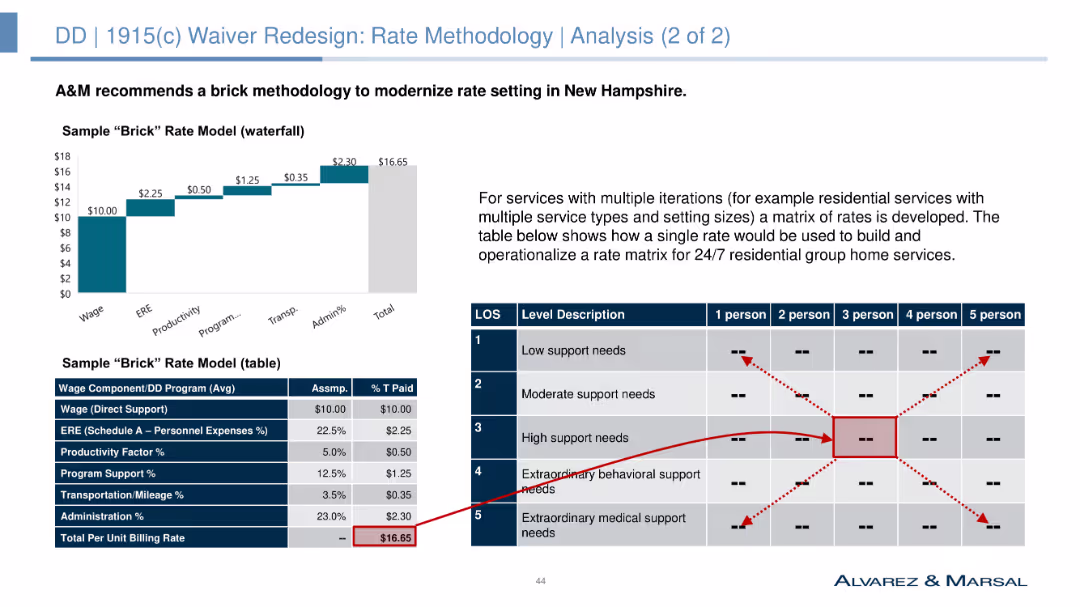
Column chart and table showing a sample "brick" rate model for various residential service types.
Market Analysis and Trends
Government & Public Sector
Recommends a "brick" rate methodology to modernize rate setting in New Hampshire, providing a sample rate model for different residential service types and their respective costs.
rate methodology, brick model, residential services, cost analysis, NH's DD population, funding models, strategic planning, rate setting
false
DD | 1915(c) Waiver Redesign: Rate Methodology | Analysis (2 of 2)NH DHHS Operations Assessment
Mixed Chart
Alvarez & Marsal
View slide
Features a table on the left with GDP growth assumptions and two line graphs on the right showing earnings projections and market indices. Predominantly textual with accompanying data visualizations.
Investment Analysis
Financial Services
The slide forecasts global GDP growth and equities earnings, analyzing financial markets and investment opportunities. It compares historical data with future projections.
GDP Growth, Financial Markets, Equities Earnings, Investment Opportunities, Projections, Global Economy
false
No boom, no bust | 2022 will be unlike either 2020 or 2021Citi Global Wealth Investments OUTLOOK 2022
Mixed Chart
Citigroup
View slide
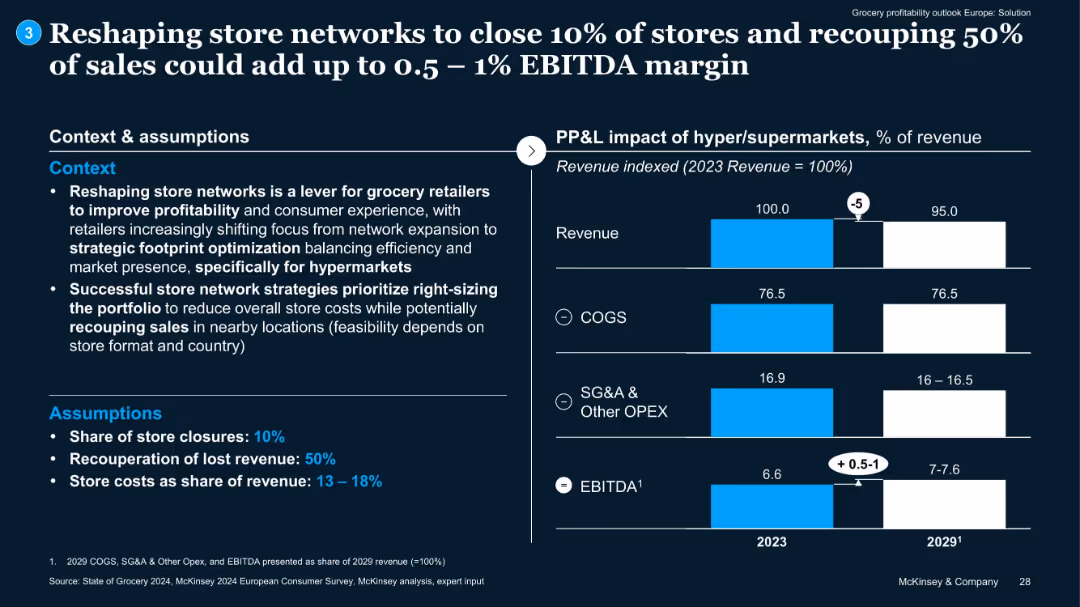
Context and assumptions on left; bar chart on right comparing 2023 and 2029 cost components. EBITDA uplift is marked with arrows.
Operational Efficiency
Retail & E-commerce
Proposes store network reshaping (10% closure) with 50% sales recouped to drive 0.5–1% EBITDA uplift. Assumptions on cost reduction and efficiency gains included.
store optimization, EBITDA, cost reduction, footprint, hypermarkets
false
Reshaping store networks to close 10% of stores and recouping 50% of sales could add up to 0.5 – 1% EBITDA marginGrocery profitability outlook –Europe
Mixed Chart
McKinsey
View slide
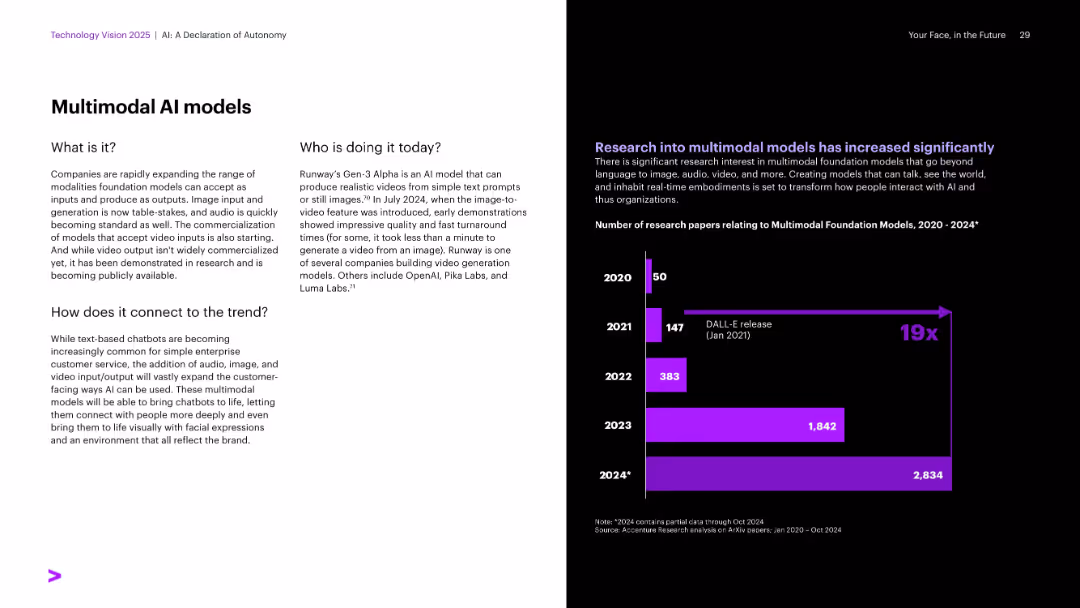
Split layout: white text section on left; black right side with vertical bar graph in bright purple, using a clean, corporate style.
Technology and Digital Transformation
Artificial Intelligence
This slide discusses the rise of multimodal AI models capable of processing text, audio, image, and video. It highlights the expansion of input/output modalities in AI systems and presents data on the sharp rise in research papers related to multimodal foundation models from 2020–2024, showcasing significant momentum in the field.
Multimodal AI, video generation, Runway, DALL·E, input/output AI
false
Multimodal AI modelsAI: A Declaration of Autonomy
Mixed Chart
Accenture
View slide
Showcases a pie chart illustrating the breakdown of a bond portfolio and column charts representing maturity breakdown of the bonds with segments labeled as up to 1 year, 1-5 years, etc.
Financial Performance
Financial Services
Provides an analysis of a bond portfolio focused on hold-to-collect debt securities, detailing their types, maturity, and fair value gap, which is essential for financial strategy and risk assessment.
bonds, securities, portfolio, maturity, finance
false
Debt securities hold-to-collect portfolioQ4 / FY 2023 Fixed Income Investor Conference Call
Multiple Chart
Deutsche Bank
View slide
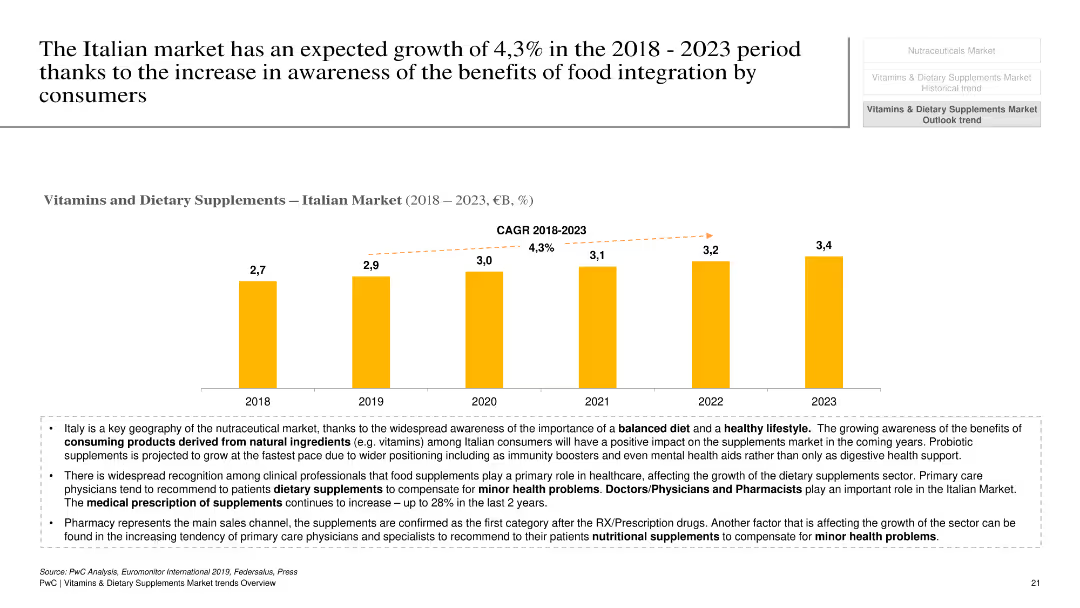
This slide features a column chart showing the growth of the Italian vitamins and dietary supplements market from 2018 to 2023, with a projected CAGR of 4.3%. Text boxes below the chart provide additional context and factors driving this growth.
Market Analysis and Trends
Healthcare & Pharmaceuticals
The slide presents the growth forecast for the Italian market for vitamins and dietary supplements, highlighting the projected CAGR and key factors contributing to this growth. It emphasizes the impact of increased consumer awareness and the role of healthcare professionals in recommending supplements.
Italian market, vitamins, dietary supplements, growth forecast, consumer awareness
false
The Italian market has an expected growth of 4,3% in the 2018 -2023 period thanks to the increase in awareness of the benefits of food integration by consumersVitamins & Dietary Supplements Market trends - Overview
Mixed Chart
PwC/Strategy&
View slide
The slide features a diagram showing the biomass-to-energy carbon cycle, detailing the flow of CO2 from biofuel production to consumption, and its subsequent absorption by biomass through photosynthesis.
Technology and Digital Transformation
Energy & Utilities
This slide explains the carbon neutrality of bioenergy through the natural carbon cycle of biomass, illustrating how CO2 emissions from biofuel production and consumption are balanced by biomass absorption.
biomass, bioenergy, carbon cycle, CO2 emissions, carbon neutrality, biofuel production
false
In principle, use of bioenergy would be carbon neutral if there were no emission from non renewable sources in its industrial value chainDeveloping sustainable carbon circularity Looking at advanced applications and business models
Linear Flow
Kearney
View slide
The slide displays a combined pie chart and bar graph, accompanied by bullet points to the left that provide context and explain the visual data.
Market Analysis and Trends
Industrial & Manufacturing
Analyzes the overall economic contribution of Combat Air activities, including the Tempest programme, to the UK economy.
Combat Air, GVA, Economic Contribution, Tempest Programme, Pie Chart
false
Combat Air activities, including the Tempest programme, are expected to contribute £100.1bn of GVA to the UK economy over the next 30 yearsAssessment of the expected economic impact of the Tempest Programme (2021-2050)
Mixed Chart
PwC/Strategy&
View slide
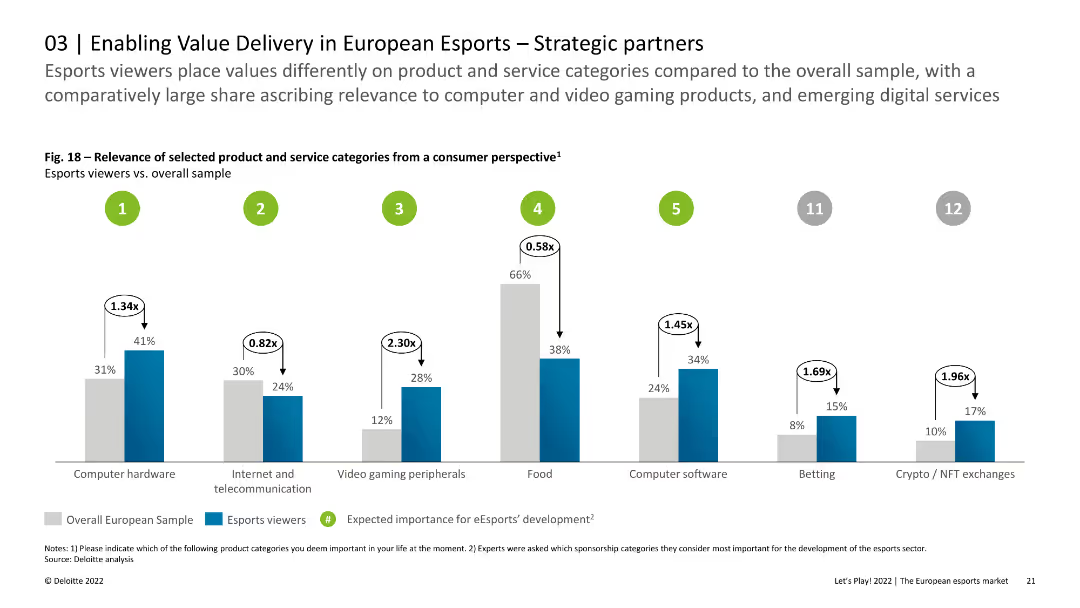
The slide features column charts showing the relevance of selected product and service categories from a consumer perspective. The visual layout is detailed and clear.
Strategic Planning
Media & Entertainment
This slide examines the preferences of esports viewers regarding various product and service categories, comparing their importance to the overall sample. It highlights the high relevance of computer hardware and gaming peripherals among esports consumers in Europe.
Esports, Product Relevance, Consumer Preferences, Europe
false
Esports viewers place values differently on product and service categories compared to the overall sample, with a comparatively large share ascribing relevance to computer and video gaming products, and emerging digital servicesLet’s Play! 2022 The European esports market
Single Chart
Deloitte
View slide
Left side graph showing GDP recovery curves; right side contains economic data for China, US, Eurozone, and World.
Financial Performance
Government & Public Sector
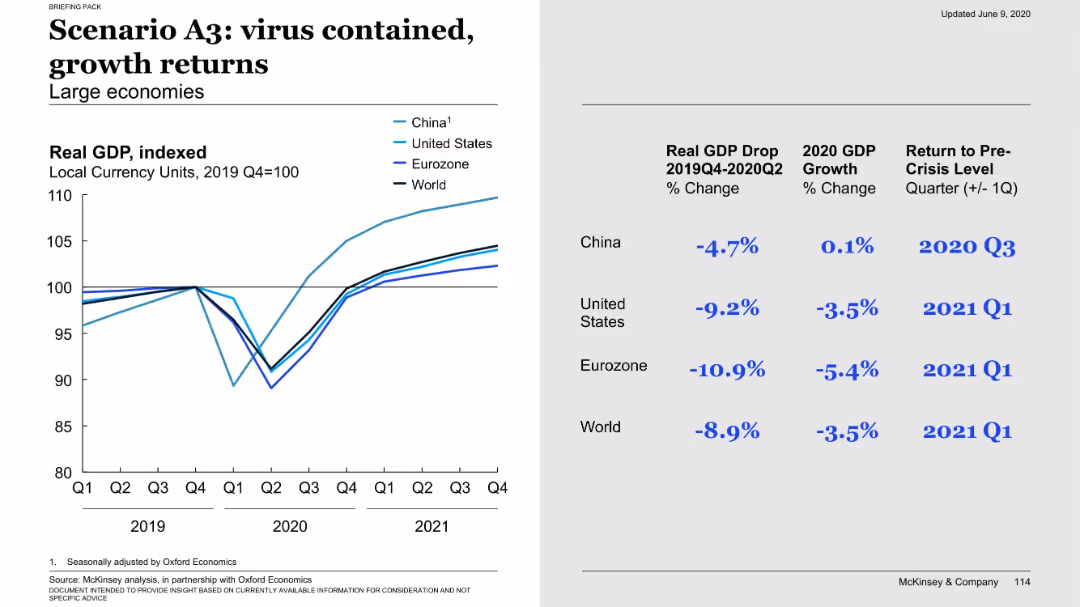
A best-case scenario where the virus is contained and economic growth returns quickly. The chart compares GDP index recovery for major economies and highlights minimal GDP contraction for China with faster recovery compared to the US and Europe.
A3, growth, GDP, virus contained, recovery, economic rebound, China, US, Eurozone, scenario
false
Scenario A3: virus contained, growth returnsCOVID-19: Briefing materials
Mixed Chart
McKinsey
View slide
The slide is split into two main sections. The left side has a text block and an illustration of a stressed individual, while the right side features a column chart depicting stress levels over three time points with gender differentiation. The chart uses green tones for distinction.
Market Analysis and Trends
Technology & Software
The slide addresses the high levels of stress experienced by millennials and Gen Z during the pandemic, with a focus on gender differences. A bar chart compares stress levels across 2020, 2020 Pulse, and 2021, highlighting that women reported higher stress. The content suggests persistent high stress levels and the implications for mental health and workforce management strategies.
Stress, Pandemic, Millennials, Gen Z, Mental Health, Gender, Bar Chart, Workforce Management, Health Trends
false
One of the more concerning insights from last year’s millennial survey was the pre-pandemic finding that 48% of Gen Zs and 44% of millennials felt stressed all or most of the time.The Deloitte Global 2021 Millennial and Gen Z Survey
Mixed Chart
Deloitte
View slide
Four quadrant layout divided by themes: Financial, Data, Technology Infrastructure, and People. Each quadrant includes a bar chart with accompanying textual insights. Dark blue accent color.
Technology and Digital Transformation
Retail & E-commerce
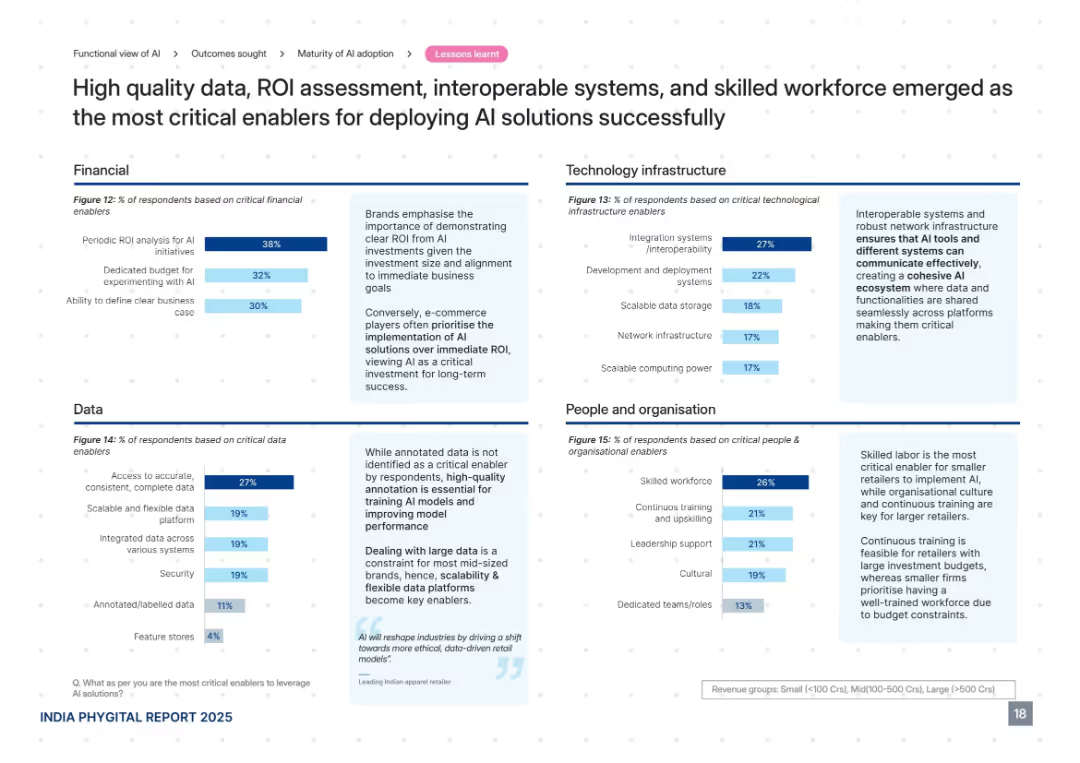
The slide identifies key enablers for successful AI deployment, such as ROI evaluation, data accuracy, interoperable systems, and skilled workforce. It highlights that e-commerce players prioritize AI investment more than ROI and stresses the importance of annotated data and skilled teams for long-term AI integration success.
AI enablers, data quality, ROI, interoperability, workforce, budget, infrastructure
false
High quality data, ROI assessment, interoperable systems, and skilled workforce emerged as the most critical enablers for deploying AI solutions successfullyAI in Retail
Mixed Chart
PwC/Strategy&
View slide
This slide displays a combination of column charts and line graphs in a blue and white color palette, projecting the growth of the Philippines' digital economy, specifically highlighting e-commerce, transport & food, online travel, and online media sectors. Each sector's growth trajectory from 2021 to 2030 is clearly shown, with annotations for compounded annual growth rates (CAGR).
Market Analysis and Trends
Retail & E-commerce
This slide analyzes the anticipated growth of the digital economy in the Philippines, with a projection of reaching approximately $35 billion by 2025, driven by e-commerce. It serves as an analytical tool for market researchers, strategists, and business development professionals to identify trends and investment opportunities within the digital marketplace of the Philippines.
Philippines, Digital Economy, E-commerce, Growth, Projection, CAGR, Online Travel, Media, Transport
false
Philippines Philippines is expected to continue its double-digit climb towards ~$35B by 2025, largely fueled by e-commercee-Conomy SEA 2023 report: Philippines
Multiple Chart
Bain
View slide
Single-column layout with a bar chart showing fintech adoption rates across 20 markets. Uses flags and horizontal bars to represent adoption percentages for each country.
Market Analysis and Trends
Financial Services
Shows the progress of fintech adoption globally, highlighting the percentage of adoption in various countries, categorized by early adopters, early majority, and late majority.
fintech, adoption, global, markets, progress
false
Fintech has achieved initial mass adoption in most marketsInsights from the EY FinTech Adoption Index and EY FinTech Australia Census
Single Chart
EY
View slide
A bubble chart showing the growth and CARG (2020-2025) of different IT services, categorized by 'Run,' 'Build,' and 'Design.' Each bubble represents a service category with varying sizes indicating their market impact.
Technology and Digital Transformation
Technology & Software
This slide illustrates the transition from on-premise to cloud services, highlighting the growth rates and market sizes of different IT service categories, aiding in strategic planning for digital transformation.
On-Prem to Cloud, IT Services, Growth, Digital Transformation, Market Impact
false
From On Prem to CloudGartner delivers actionable, objective insight, guidance and tools to enable stronger performance on your organization’s mission critical priorities
Single Chart
Gartner
View slide
Left side features a vertical stacked bar chart (2021–2023) with segments for Deposits, Transactional Products, and Corporate Lending. Right side includes color-coded text boxes with descriptions of each segment. Clean, corporate layout with blue color palette.
Product and Service Analysis
Financial Services
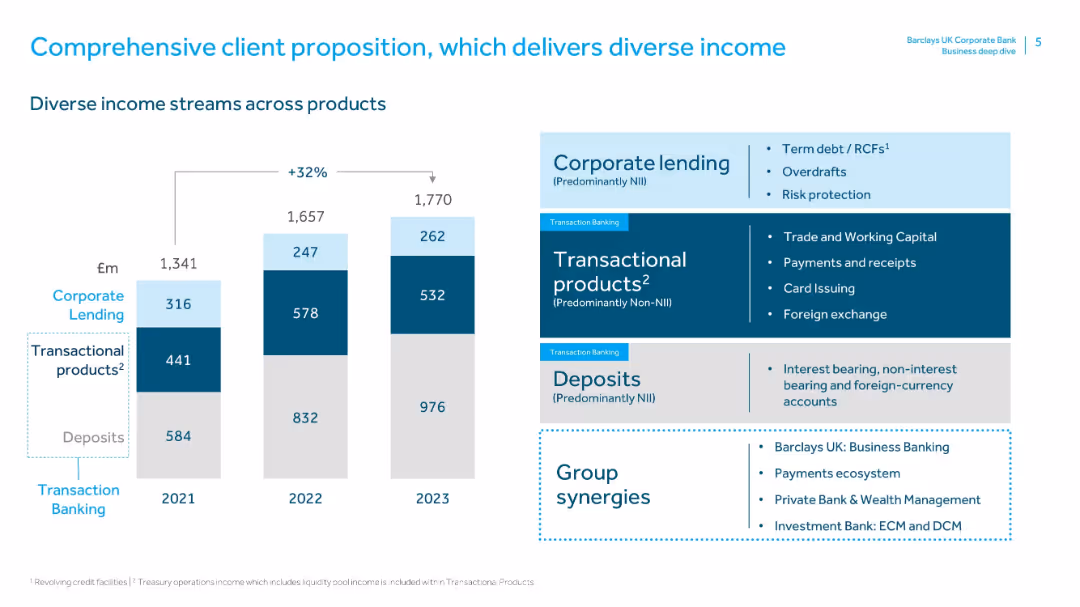
This slide shows how Barclays UK Corporate Bank generates income from diverse products—Deposits, Transactional Products, and Corporate Lending—with a 32% growth in total income from 2021 to 2023. It outlines product characteristics and synergies from other Barclays divisions.
deposits, transactional products, corporate lending, income growth, group synergies, NII, non-NII, diversification, product analysis, revenue streams
false
Comprehensive client proposition, which delivers diverse incomeBarclays UK Corporate Bank Business deep dive: 18th June 2024
Mixed Chart
Barclays
View slide
Horizontal bar chart on the left showing percentage of people concerned about poverty and inequality across countries. Flags and country names on left; bars extend right with percentages. Right panel has a narrative box in dark blue. Clear, minimalist design.
Market Analysis and Trends
Government & Public Sector
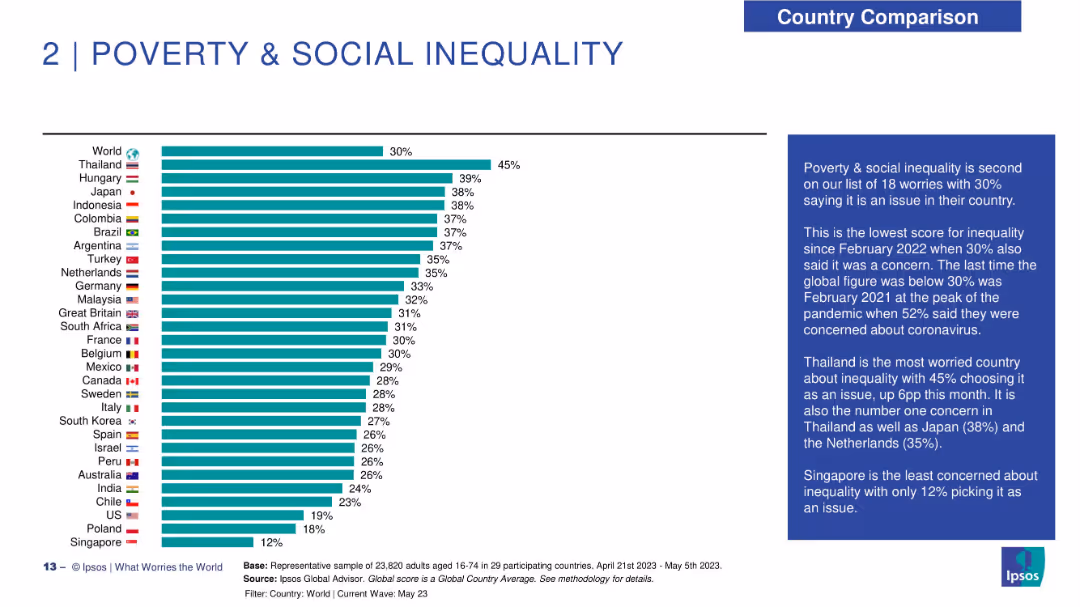
The slide highlights concern levels around poverty and social inequality globally. Thailand ranks highest (45%), while Singapore is the least concerned (12%). The global average concern is 30%, tied with February 2022 as the lowest recent level. The slide provides insights into public perception trends and highlights countries where inequality is the top concern.
poverty, social inequality, concern levels, Ipsos, survey results, global sentiment, economic disparity, regional comparison, public perception, inequality trend
false
POVERTY & SOCIAL INEQUALITYWHAT WORRIES THE WORLD? 2023
Mixed Chart
IPSOS
View slide
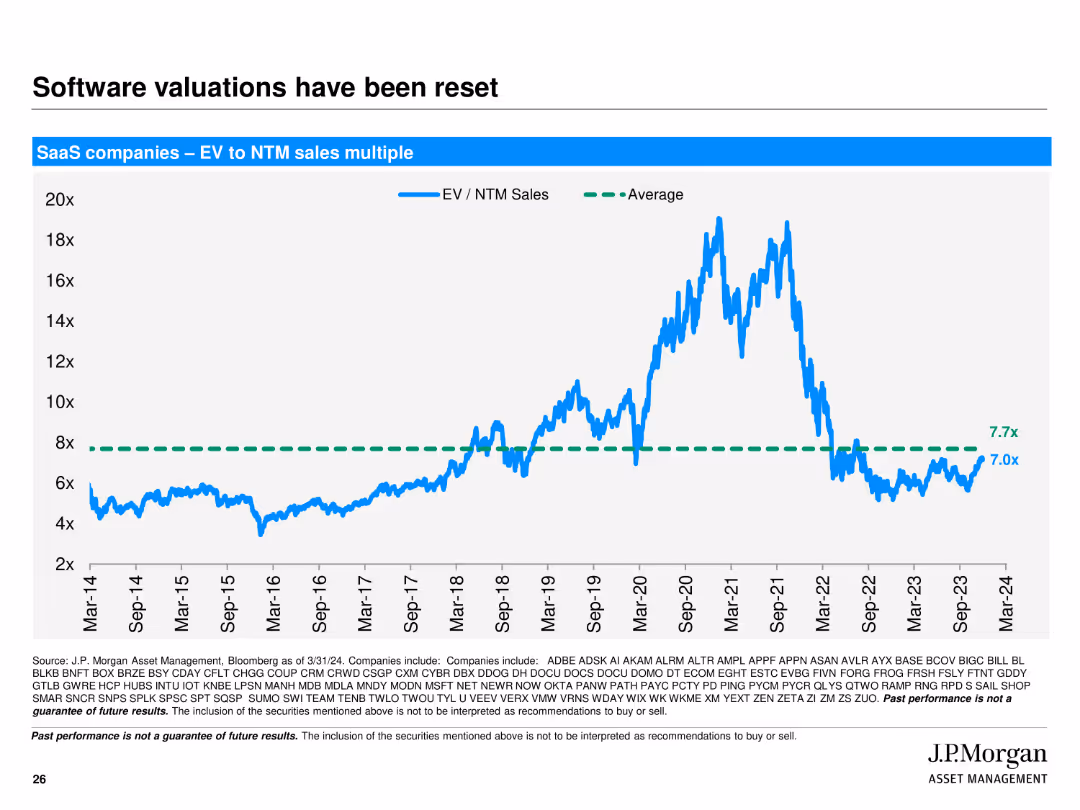
The slide shows a line chart of SaaS companies’ EV to NTM sales multiple from 2014 to 2024, with an average line for comparison.
Market Analysis and Trends
Technology & Software
Analyzes the trend of software valuations, showing the EV to NTM sales multiple for SaaS companies over a decade, indicating a reset in valuations to historical averages.
software, valuations, SaaS, EV, NTM sales, trend, line chart, market analysis
false
Software valuations have been resetJ.P. Morgan Growth Advantage Strategy
Single Chart
JP Morgan
View slide
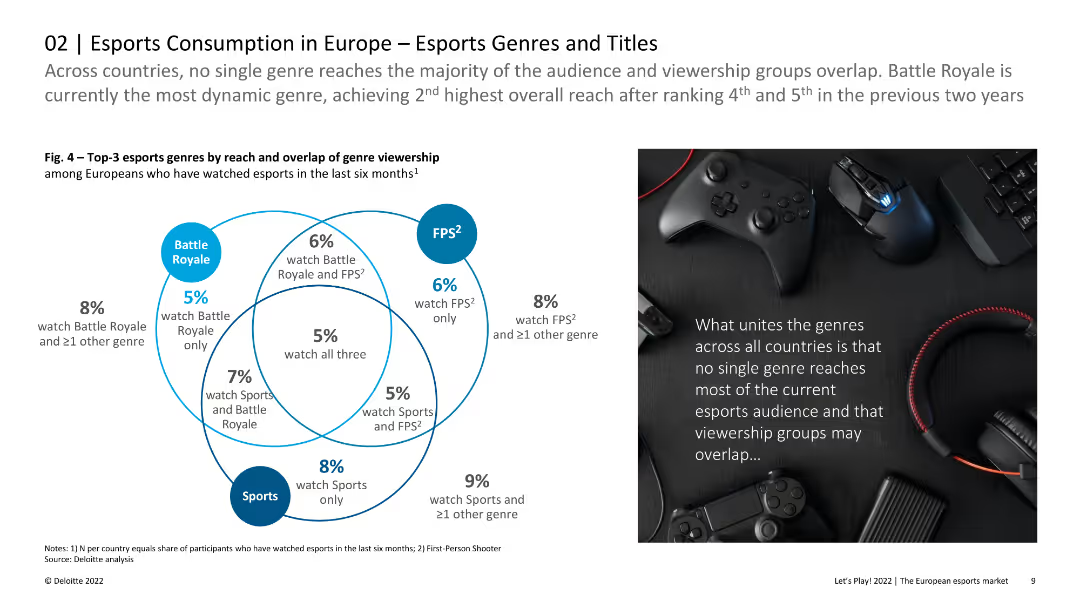
The slide features a Venn diagram showing the overlap of viewership among three esports genres: Battle Royale, FPS, and Sports. The right side includes a photo of gaming accessories. The layout is balanced with a clear, engaging visual format.
Market Analysis and Trends
Media & Entertainment
This slide presents data on the reach and overlap of esports genre viewership in Europe, highlighting that no single genre dominates the audience. It suggests the dynamic nature of Battle Royale games and the significant overlap in viewership groups.
Esports, Genres, Viewership, Europe, Battle Royale
false
Across countries, no single genre reaches the majority of the audience and viewership groups overlap. Battle Royale isLet’s Play! 2022 The European esports market
Diagram
Deloitte
1
...
Next
Load More
Hold On!
We are searching in our database
If nothing, comes up, please try different filters!
Create a FREE account to continue browsing
Receive Instant Access to 1,000+ slides from companies like McKinsey, Google, and Goldman Sachs
First Name
Last Name
Email
Password
I agree to all
Terms & Privacy Policy
Thank you! Your submission has been received!
Oops! Something went wrong while submitting the form.
Have an account?
Sign in
Column Chart
Heatmap
Chevron
Org Chart
Infographic
Callouts
Timeline
List
Graphic
Picture
Process Flow
Diagram
Paragraph
Map
Table
Framework
Subtitle
Takeaway Box
Icon
Other Chart
Radar Chart
Waterfall Chart
Mekko Chart
Pie Chart
Scatter Plot
Line Chart
Bar chart
Bullet points