My Account
My Slides
Search by Category
Templates
View All Templates
Download Template Slides
Leave Feedback
Login
Logout
Get Started
Browse all Slides
Browse all Slides
Create a FREE Account
Instant access to 1,000+ real slides from top companies like McKinsey, BCG, Goldman Sachs, Google and many more!
First Name
Last Name
Email
Password
I agree to all
Terms & Privacy Policy
Thank you! Your submission has been received!
Oops! Something went wrong while submitting the form.
Have an account?
Sign in
Instant access to the internet's best slides
Get access to 40+ advanced filters and more
Advanced Search and Filters
Access to
10,000+ slides
Access to Category Pages
Save/Bookmark Slides
PowerPoint Template Library (New)
Choose your plan
MONTHLY
$12/month
Billed every month, cancel anytime.
YEARLY
$9/month
Billed $108 annually, cancel anytime.
Checkout for $12/month
Checkout for $108/yr
Secured by Stripe | AES-256 bit encryption
Spark Your Next Big Idea with New Presentation Templates
VIEW ALL Templates
Welcome,
Welcome
Upgrade to SlideStart
Pro
Instant access to 15,000+ slides
Show Featured Only
Checkbox 8
Companies
Mckinsey
Bain
BCG
EY
Deloitte
Accenture
PwC/Strategy&
JP Morgan
Goldman Sachs
Morgan Stanley
Citigroup
Deutsche Bank
Barclays
LEK
Kearney
Oliver Wyman
Booz Allen Hamilton
Gartner
IPSOS
Nielsen
Slide type
Header Horizontal
Framework
Vertical Flow
Single Chart
Single Chart
Text Only
Mixed Chart
Header Vertical
Graphic
Pillar
Multiple Chart
Agenda
Title
Table
Linear Flow
Upgrade to SlideStart
Pro
Instant access to 40+ advanced filters
Industry
Upgrade to SlideStart
Pro
Instant access to 40+ advanced filters
Technology
Healthcare
Financial Services
Consumer Goods
Energy & Utilities
Manufacturing
Retail
E-commerce
Logistics
Telecommunications
Real Estate
Professional Services
Education
Media
Entertainment
Hospitatlity
Tourism
Agriculture
Food Production
Government & Public Sector
Environmental
Sustainability
Use Case
Upgrade to SlideStart
Pro
Instant access to 40+ advanced filters
Sales and Business Development
Mergers and Acquisitions
Corporate Finance and Valuation
Performance Metrics and KPIs
Client Case Studies
Competitive Landscape
Product and Service Analysis
Customer and Market Segmentation
Organizational Structure
Human Resources and Talent Management
Industry Overview
Regulatory and Compliance
Risk Assessment and Management
Agriculture & Food Production
Hospitality and Tourism
Government
Environmental
Sustainability
Clear all
Thank you! Your submission has been received!
Oops! Something went wrong while submitting the form.
Show Featured Only
Checkbox 8
Companies
Mckinsey
Bain
BCG
EY
Deloitte
Accenture
PwC/Strategy&
JP Morgan
Goldman Sachs
Morgan Stanley
Citigroup
Deutsche Bank
Barclays
LEK
Kearney
Oliver Wyman
Booz Allen Hamilton
Gartner
IPSOS
Nielsen
Slide type
Text Only
Linear Flow
Vertical Flow
Single Chart
Header Horizontal
Mixed Chart
Header Vertical
Pillar
Multiple Chart
Graphic
Agenda
Title
Table
Framework
Industry
Technology
Healthcare
Financial Services
Consumer Goods
Energy & Utilities
Manufacturing
Retail
E-commerce
Logistics
Telecommunications
Real Estate
Professional Services
Education
Media
Entertainment
Hospitatlity
Tourism
Agriculture
Food Production
Government & Public Sector
Environmental
Sustainability
Use Case
Sales and Business Development
Mergers and Acquisitions
Corporate Finance and Valuation
Performance Metrics and KPIs
Client Case Studies
Competitive Landscape
Product and Service Analysis
Customer and Market Segmentation
Organizational Structure
Human Resources and Talent Management
Industry Overview
Regulatory and Compliance
Risk Assessment and Management
Agriculture & Food Production
Hospitality and Tourism
Government
Environmental
Sustainability
Clear all
Thank you! Your submission has been received!
Oops! Something went wrong while submitting the form.
Tag
View slide
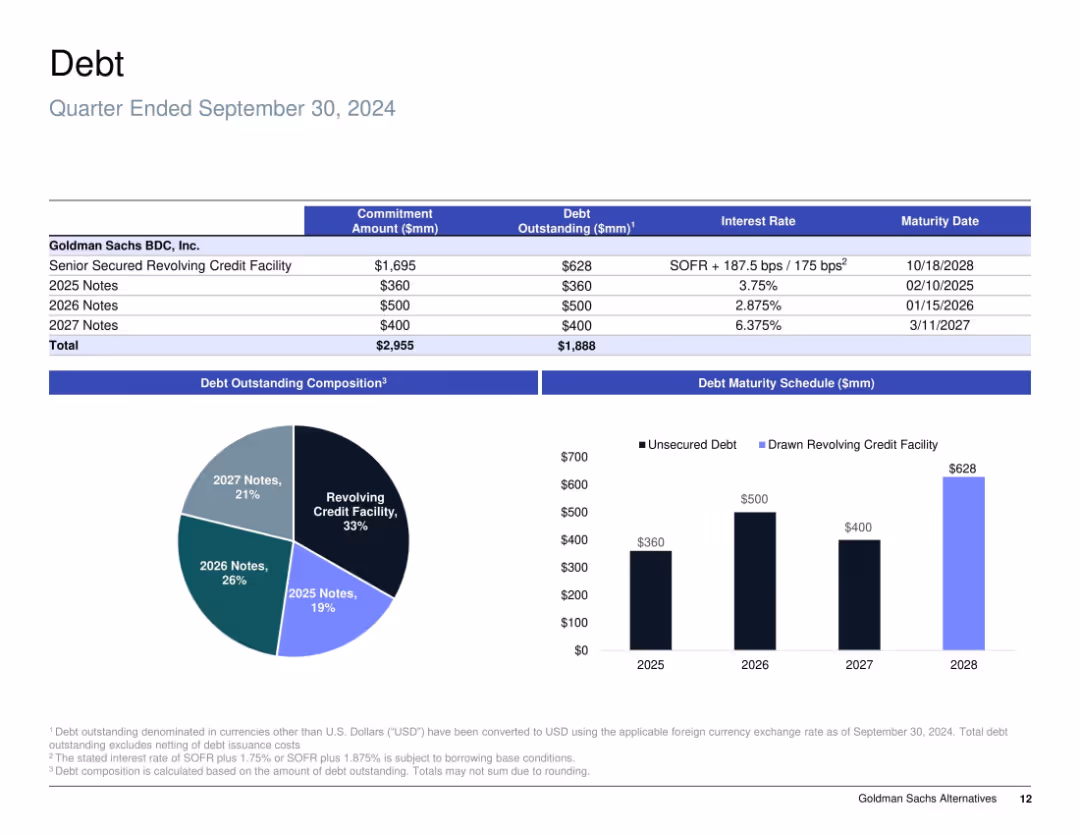
Combination of a data table, bar chart, and pie chart; blue-themed, clean, and data-dense.
Corporate Finance and Valuation
Financial Services
This slide details Goldman Sachs BDC’s debt structure as of Q3 2024, including the composition, maturity schedule, and interest rates. It shows the distribution of outstanding debt across revolving credit facilities and unsecured notes, and visualizes how much matures each year through 2028.
debt, maturity, credit facility, notes, interest rate, unsecured, revolving, corporate finance
false
DebtGoldman Sachs BDC, Inc. Investor Presentation
Multiple Chart
Goldman Sachs
View slide
Slide includes graphs, text, and icons, visually dense with information about financial and investment performance.
Investment Analysis
Financial Services
Evaluates Q1 FY21 performance with an investment lens, offering insights into market position and financial returns. For presenting to investors or in strategic planning meetings.
Performance, Investment, Revenue Growth, EBITDA, Capital Deployment
false
Q1 FY'21 PERFORMANCE:Fiscal Year 2021 First Quarter
Pillar
Booz Allen Hamilton
View slide
Table ranking banks by revenue and market share, column charts showing wallet share, and notable transactions.
Competitive Landscape
Financial Services
Showcases Credit Suisse’s leading position in investment banking, detailing market share, revenue, and notable transactions in 2019.
Investment banking, market-leading, Credit Suisse, revenue, transactions
false
Investment Banking Switzerland has further strengthened its market-leading position in 2019Credit Suisse Investor Day 2019 Growth in Wealth Management
Mixed Chart
Credit Suisse
View slide
The slide features three vertical column charts comparing net new money, deposits in wealth management, and deposits in Swiss businesses.
Financial Performance
Financial Services
This slide presents data on client confidence, showcasing net new money and deposits across various sectors in Q3 2023.
client confidence, net new money, wealth management, Swiss businesses, deposits
false
Client trust and confidence demonstrated by strong flows in GWM and P&CThird quarter 2023 Fixed Income investor presentation
Multiple Chart
UBS
View slide
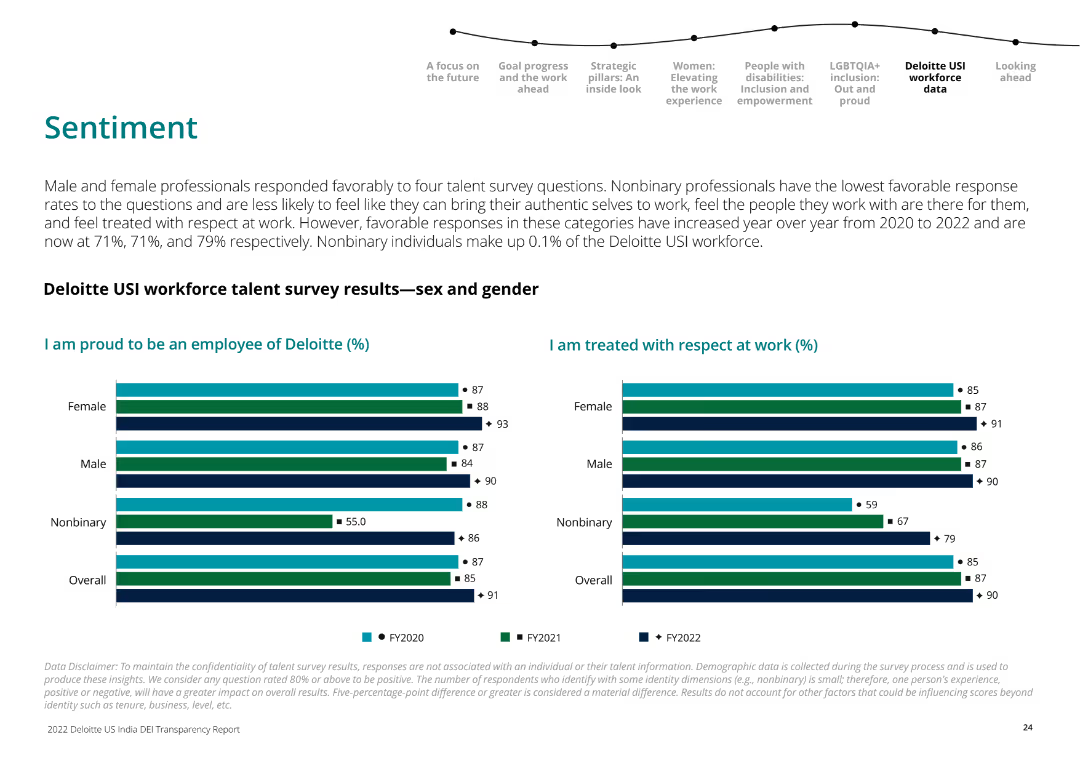
Horizontal bar charts showing talent survey results for male, female, and nonbinary professionals on pride in employment and respect at work.
Human Resources and Talent Management
Professional Services
The slide presents survey results indicating the sentiments of Deloitte USI employees regarding their pride and respect at work by gender over FY2020 to FY2022.
workforce, sentiment, survey, Deloitte, gender, FY2022, pride, respect, bar chart
false
Sentiment Male and female professionals responded favorably to four talent survey questions.2022 Deloitte US India Diversity, Equity, and Inclusion (DEI) Transparency Report
Multiple Chart
Deloitte
View slide
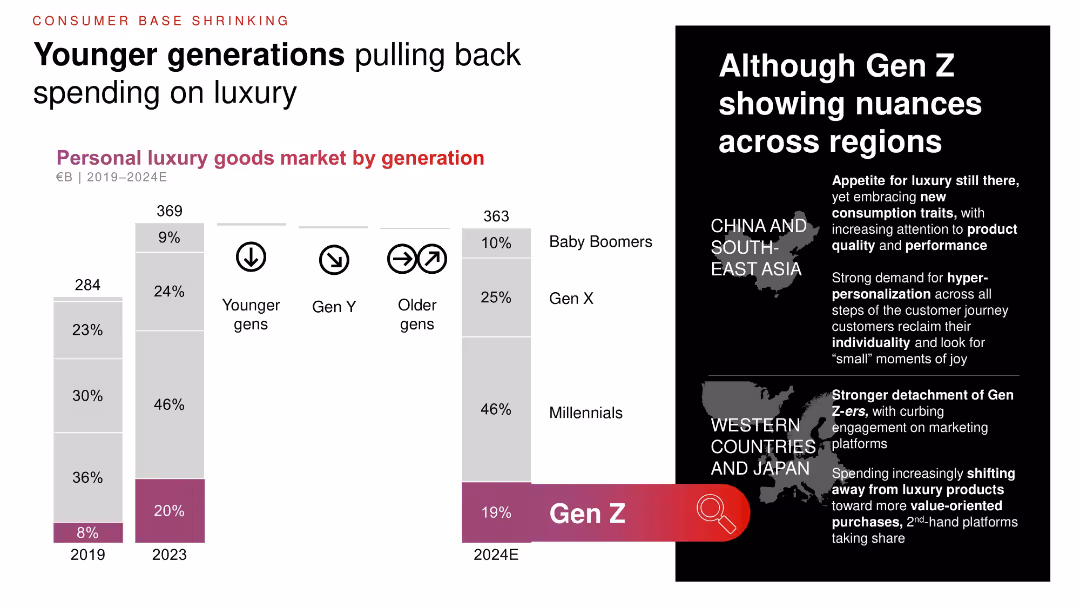
Vertical stacked bar charts of luxury goods market by generation (2019–2024E); regional callouts with maps; focus on Gen Z’s evolving consumption behaviors.
Customer and Market Segmentation
Consumer Goods
This slide highlights a pullback in luxury spending from younger generations, especially Gen Z. It breaks down spending by generation, noting regional differences in behavior and preferences between Asia and Western countries.
Gen Z, generational trends, luxury spending, consumer behavior, regional analysis, millennials
false
Younger generations pulling back spending on luxuryGood times for a change
Mixed Chart
Bain
View slide
Contains a timeline and structured text boxes outlining strategic priorities and goals from 2023 to 2028.
Strategic Planning
Financial Services
The slide outlines strategic priorities over time, focusing on sustainable growth and value creation through 2028.
priorities, strategic planning, sustainable growth, timeline, goals
false
Delivering on our priorities while creating long-term sustainable valueFourth quarter 2023 Fixed Income investor presentation
Linear Flow
UBS
View slide
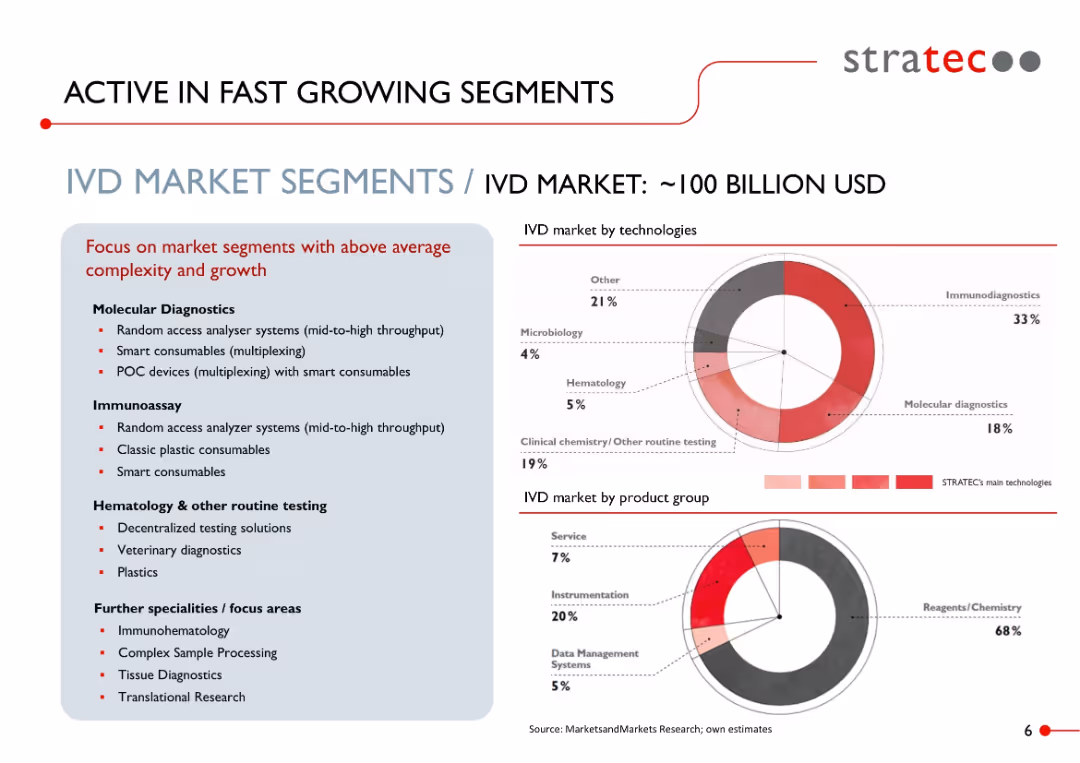
Split layout: text-heavy left box with bullet points on market segments; right side features two donut charts with red highlights and technology/product breakdowns.
Market Analysis and Trends
Healthcare & Pharmaceuticals
Highlights the high-growth and high-complexity segments within the IVD (In Vitro Diagnostics) market, valued at ~$100B. Focus areas include molecular diagnostics, immunoassays, and smart consumables. Two charts segment the market by technologies and product groups.
IVD, immunoassay, smart consumables, molecular diagnostics, healthcare, market segmentation, diagnostics, STRATEC, medical technology
false
ACTIVE IN FAST GROWING SEGMENTSGOLDMAN SACHS MEDTECH AND HEALTHCARE SERVICES CONFERENCE
Mixed Chart
Goldman Sachs
View slide
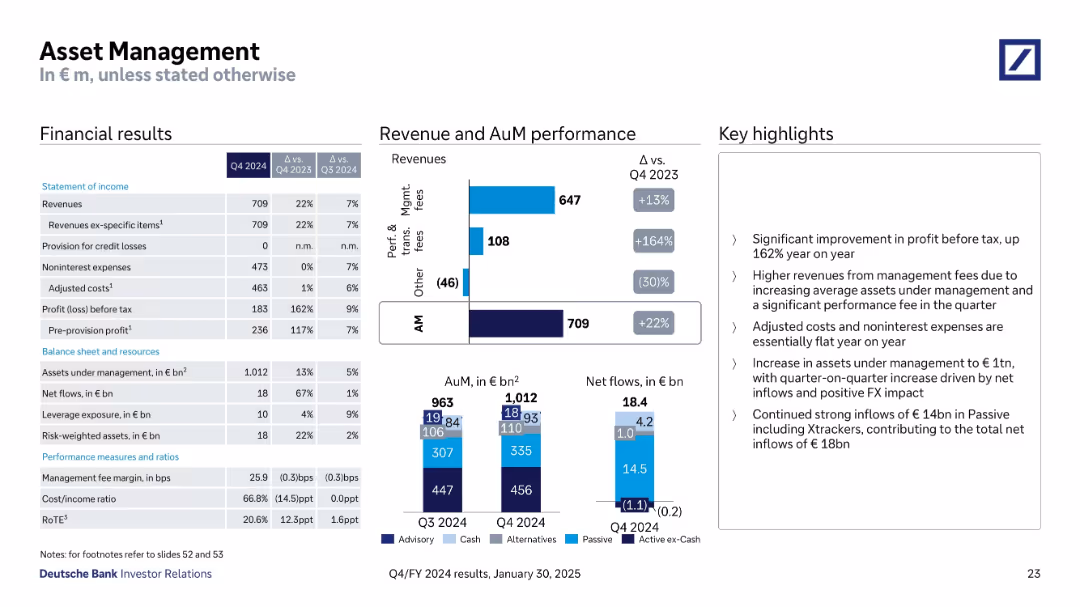
Structured with financial tables, stacked bar charts for AuM & net flows, and performance highlights
Financial Performance
Financial Services
The Asset Management division reported a 22% YoY increase in revenue, driven by strong net inflows and higher management and performance fees. Assets under management reached €1,012bn with inflows of €18.4bn. Adjusted costs remained flat, and profit before tax rose by 162% YoY.
Asset Management, AuM, Net Flows, Fees, Profit, Expenses, Inflows
false
Asset ManagementQ4/FY 2024 results
Multiple Chart
Deutsche Bank
View slide
Line graph showing real consumer spending trends for different major economies
Market Analysis and Trends
Financial Services
The slide presents trends in real consumer spending, comparing major economies, with a focus on the impact of reopening in China.
consumer spending, trends, major economies, China, reopening
false
Recent consumer spending growth remains tepid or negative in most major economies; China’s consumer rebound after re opening is starting to take holdMarch Macro Brief Financial fissures emerge
Single Chart
Accenture
View slide
Includes multiple pie charts and a column chart detailing the deposit and loan distribution by business type and product, with annotations explaining key strategies.
Financial Performance
Financial Services
This slide details the bank's deposit and loan structures as of Q1 2023, highlighting diversity and stability across different banking sectors and products, and outlines how these are managed to mitigate risks and ensure growth.
Deposits, Loans, Banking, Diversification, Q1 2023, Risk Management, Stability, Growth
false
…with well diversified deposit base and loan bookAccelerated execution of Global Hausbank strategy to drive returns
Multiple Chart
Deutsche Bank
View slide
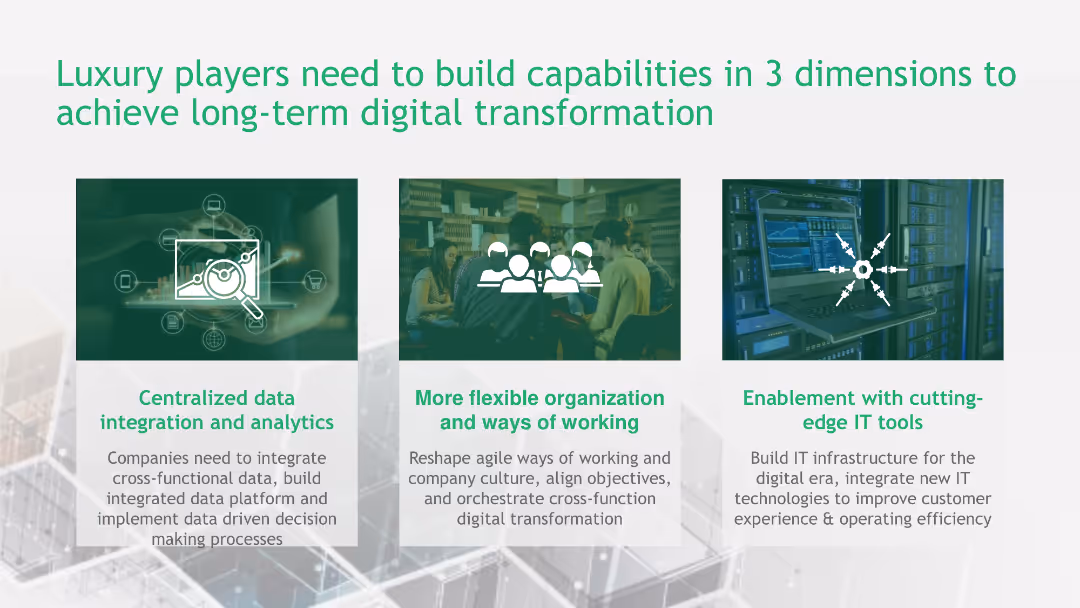
The slide presents a three-part framework for digital transformation in the luxury sector, covering data integration, organizational flexibility, and cutting-edge IT tools.
Technology and Digital Transformation
Consumer Goods
This slide outlines three essential capabilities luxury brands need for digital transformation: centralized data integration, organizational flexibility, and adoption of advanced IT tools.
digital transformation, luxury sector, data integration, organizational flexibility, IT tools
false
Luxury players need to build capabilities in 3 dimensions to achieve long-term digital transformationChina Luxury Digital Playbook
Pillar
BCG
View slide
The slide includes two pie charts showing the distribution of interest-bearing debt and interest rate distribution, accompanied by labels and percentages.
Financial Performance
Financial Services
It conveys the debt composition and interest rates as of a specific date, for financial analysis or investor relations.
Debt Structure, Interest Rates, Financial Analysis, Distribution, Pie Charts, Bonds, Loans
false
I. Debt structure, 31 March 2021Goldman Sachs Symposium presentation
Multiple Chart
Goldman Sachs
View slide
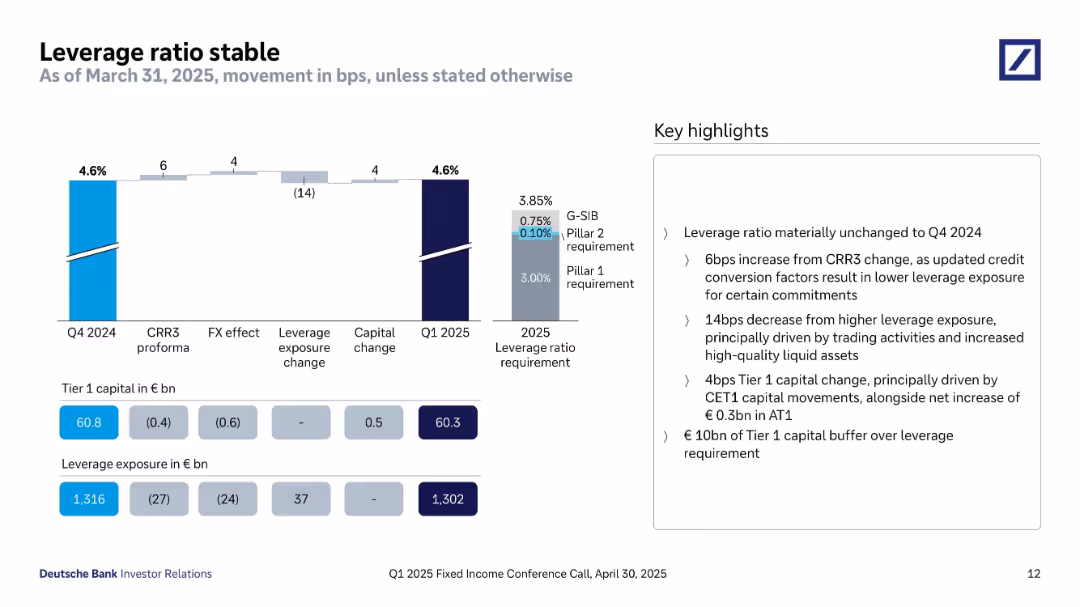
A bar chart tracks changes in leverage ratio across CRR3, FX, exposure, and capital from Q4 2024 to Q1 2025, alongside Tier 1 capital and leverage exposure values. A vertical bar displays the 2025 leverage ratio requirement. Highlights are shown on the right.
Financial Performance
Financial Services
The slide shows the leverage ratio remains unchanged at 4.6%, meeting the 3.85% regulatory requirement. It presents the components contributing to the movement: a reduction in leverage exposure and a small positive impact from capital changes. The Tier 1 capital buffer over requirement is €10bn. Key highlights address the specific impacts of trading activities, capital shifts, and credit conversion factor updates under CRR3.
leverage ratio, Tier 1 capital, leverage exposure, CRR3, capital change, liquidity, regulatory compliance
false
Leverage ratio stableQ1 2025 Fixed Income Investor Conference Call
Mixed Chart
Deutsche Bank
View slide
Uses three columns with bold headers to outline building blocks, platforms, and outcomes, accompanied by a supportive narrative below in a clean, structured layout.
Technology and Digital Transformation
Technology & Software
Highlights the strategic importance of transitioning to platform-based operations in finance and technology, explaining the building blocks, specific platforms, and expected outcomes of the initiative.
digital platforms, client engagement, technology strategy, API, cloud, Goldman Sachs, customer experience, revenue growth, operational efficiency, partnerships
false
Transitioning to Platforms is Central to our StrategyGoldman Sachs Presentation to Bank of America Merrill Lynch Future of Financials Conference
Linear Flow
Goldman Sachs
View slide
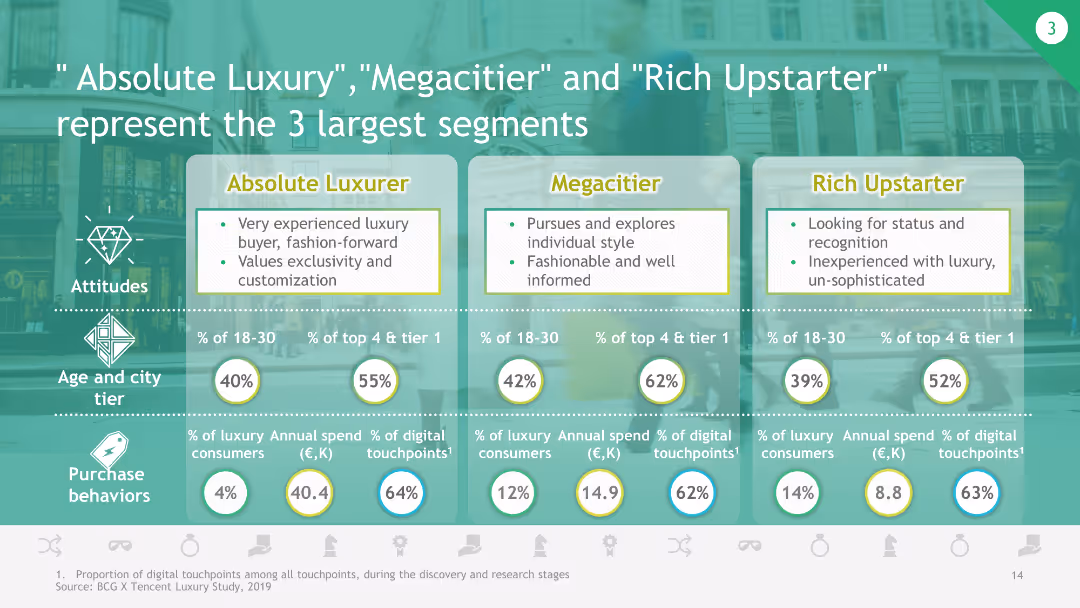
The slide uses a comparative layout to describe the attitudes, age and city tier distribution, and purchase behaviors of the three largest luxury consumer segments.
Customer and Market Segmentation
Consumer Goods
This slide highlights the three largest luxury consumer segments in China, detailing their characteristics, age distribution, city tier, and purchase behaviors.
luxury segments, consumer behavior, China market, age distribution, purchase behavior
false
Absolute Luxury,"Megacitier"and "Rich Upstarter" represent the 3 largest segmentsChina Luxury Digital Playbook
Table
BCG
View slide
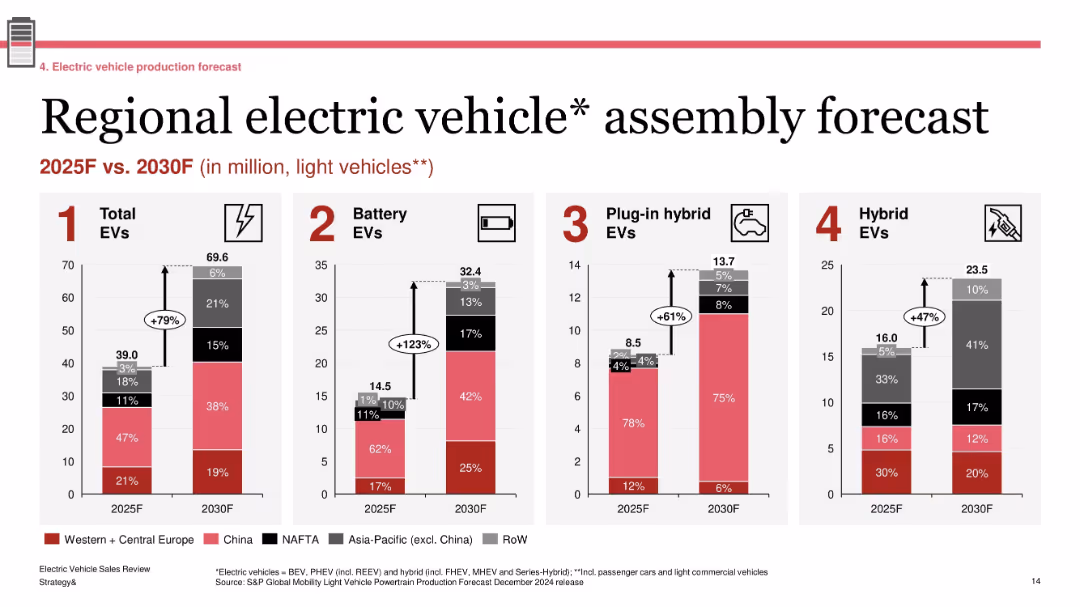
Four grouped bar charts showing production forecasts by region; labeled segments with growth percentages; standard red-gray-black color palette
Technology and Digital Transformation
Industrial & Manufacturing
The slide forecasts EV assembly volumes across major global regions between 2025 and 2030. It projects a 79% increase in total EVs, with battery EVs seeing the most significant growth (+123%). Regional shares are shown for each EV type (BEV, PHEV, Hybrid), emphasizing China and Western Europe as leading contributors.
EV forecast, regional production, BEV growth, 2030 outlook, light vehicles, automotive transformation
false
Regional electric vehicle assembly forecastElectric Vehicle Sales Review Q4 2024
Single Chart
PwC/Strategy&
View slide
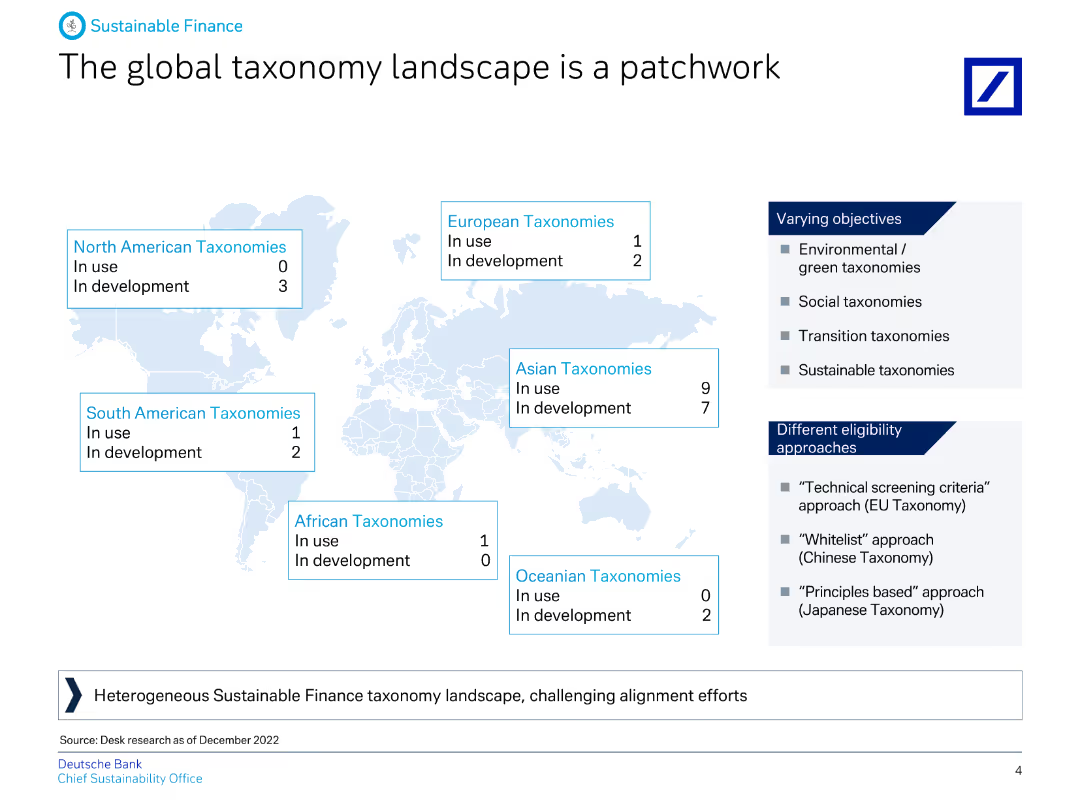
Features a world map showing the status of taxonomies in different regions, with accompanying text explaining the varying objectives and eligibility approaches.
Market Analysis and Trends
Financial Services
This slide provides an overview of the global taxonomy landscape, detailing the status and development of taxonomies in different regions and their varying objectives.
Taxonomy, global, finance, ESG, regions, objectives, eligibility, banking, sustainability, landscape
false
The global taxonomy landscape is a patchworkInsights into our sustainable finance governance and processes
Graphic
Deutsche Bank
View slide
A blue-themed slide with three main sections: Risk and Controls, Operating Model, and Organizational Structure. Each section has bulleted details.
Operational Efficiency
Financial Services
This slide outlines key areas of focus for improving bank operations, highlighting efficiency and simplification.
Modernization, Efficiency, Digitization, Risk Management, Organizational Change, Simplicity
false
Building a Modern, Efficient and Simpler BankCITY 2022 Investor Day
Table
Citigroup
View slide
Column chart showing top concerns for digital health adoption, such as patient privacy and talent shortage, across SEA countries.
Technology and Digital Transformation
Healthcare & Pharmaceuticals
This slide discusses the primary concerns regarding digital health adoption in SEA, highlighting patient privacy and the shortage of skilled talent.
Patient privacy, digital health, concerns, SEA, talent shortage
false
Patient privacy and talent shortage are major concerns for digital health adoption in almost all SEA countries2023 APAC Hospital Insights Survey Findings for Healthcare Providers
Multiple Chart
LEK
View slide
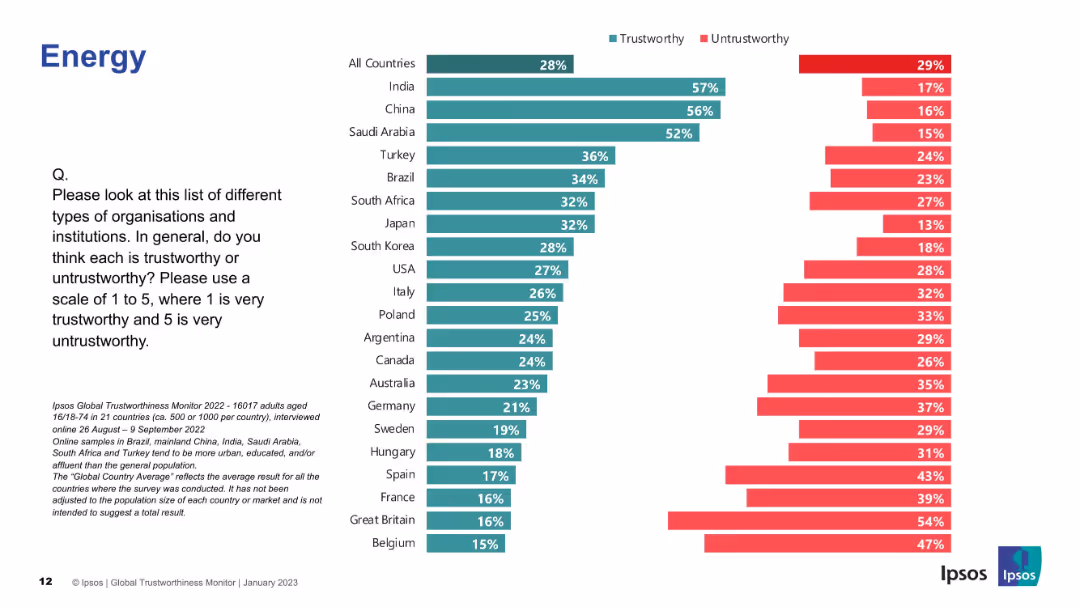
Similar bar chart layout to previous slide; green/red bars showing trust levels across countries.
Market Analysis and Trends
Energy & Utilities
This slide compares public trust in energy companies globally. India, China, and Saudi Arabia top the list for perceived trustworthiness.
energy, trust, perception, Ipsos, countries, bar chart, survey, utilities, data analysis, trustworthiness
false
EnergyIPSOS GLOBAL TRUSTWORTHINESS MONITOR January 2023
Mixed Chart
IPSOS
View slide
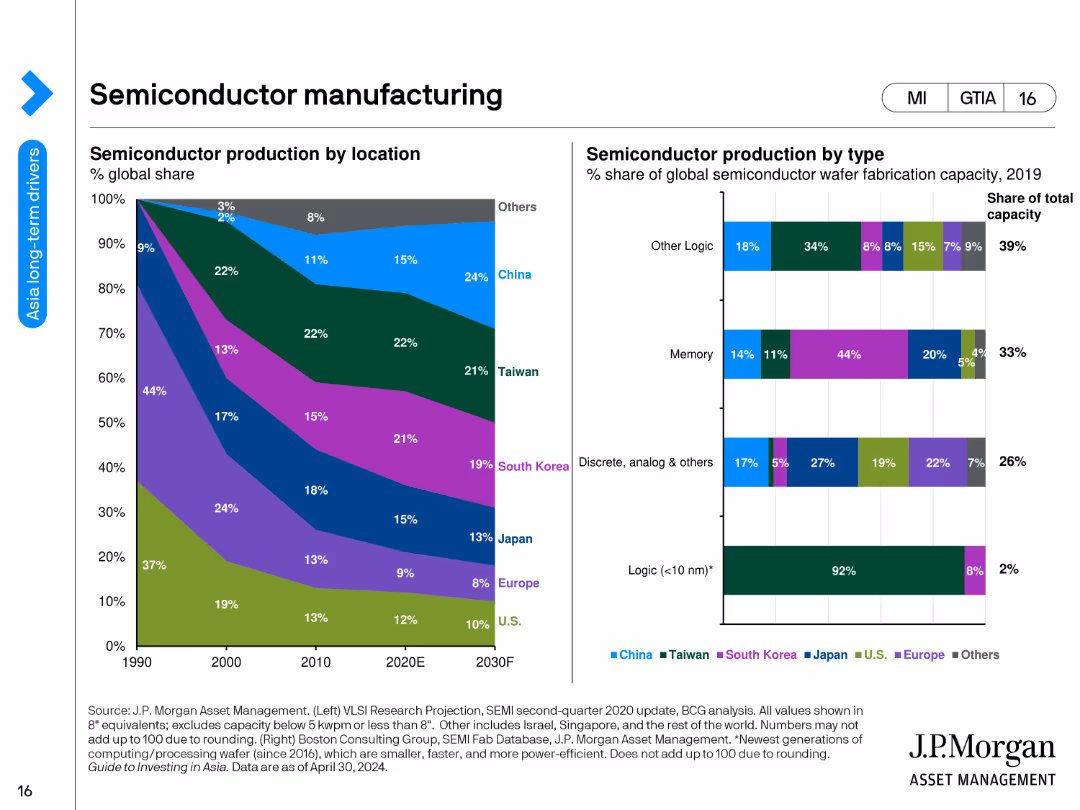
Two charts: a stacked area chart showing semiconductor production by location over time, and a stacked bar chart showing production by type.
Market Analysis and Trends
Industrial & Manufacturing
The slide provides an overview of global semiconductor production, highlighting changes in production locations and types over the years and projections for the future.
semiconductor production, manufacturing, locations, production types, global trends, industrial analysis, economic insights, technology, development, future projections
false
Semiconductor manufacturingGuide to Investing in Asia
Multiple Chart
JP Morgan
View slide
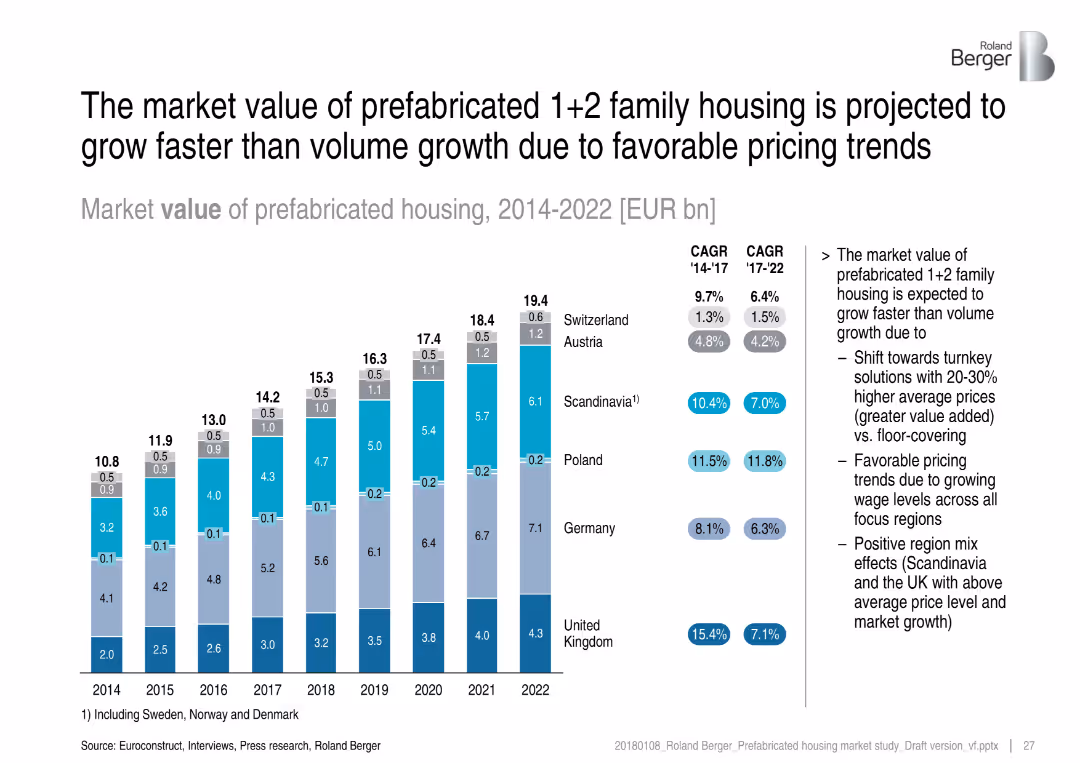
Stacked bar chart in euros by year and country, growth drivers listed on the right, CAGR values annotated
Market Analysis and Trends
Real Estate & Construction
The slide outlines market value growth for prefabricated 1+2 family housing from 2014 to 2022, showing that value is increasing faster than volume due to higher prices and premium solutions. The shift toward turnkey solutions and regional effects support this trend.
market value, prefabricated housing, pricing trends, CAGR, premium, turnkey, growth
false
The market value of prefabricated 1+2 family housing is projected to grow faster than volume growth due to favorable pricing trendsPrefabricated housing market in Central and Northern Europe – Overview of market trends and development
Mixed Chart
Roland Berger
View slide
A two-column slide, the left side shows column charts with market share and industry wallet, while the right side lists key focus areas for discussion with check marks.
Market Analysis and Trends
Financial Services
Discussing the ranking in investment banking fees, the slide covers historical data, market share, regional performance, and focus areas for in-depth discussion regarding future strategy and client relationships.
Banking, Fees, Market Share, Strategy
false
We have been ranked #1 in Investment Banking (IB) fees for over a decade and have consistently achieved top positions across products and regionsInverstors Day 2023
Mixed Chart
JP Morgan
View slide
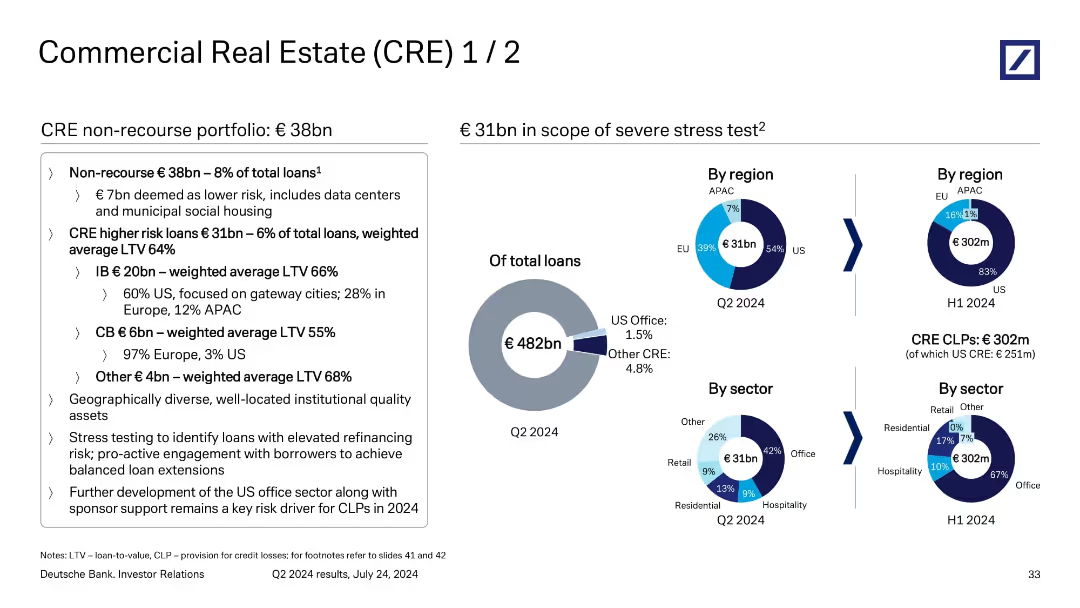
Balanced layout: text analysis on left, three donut/pie charts on right showing geographic and sector exposure to CRE loans.
Investment Analysis
Financial Services
The slide outlines Deutsche Bank’s €38bn non-recourse CRE loan portfolio, breaking down higher-risk segments by region and sector. It highlights a €31bn subset exposed to severe stress test conditions and discusses risk concentrations in the US office market. It also quantifies provisions (CLPs) related to CRE in H1 2024.
CRE, non-recourse loans, US office risk, CLPs, stress testing
false
Commercial Real Estate (CRE) 1 / 2Q2 2024 results
Mixed Chart
Deutsche Bank
View slide
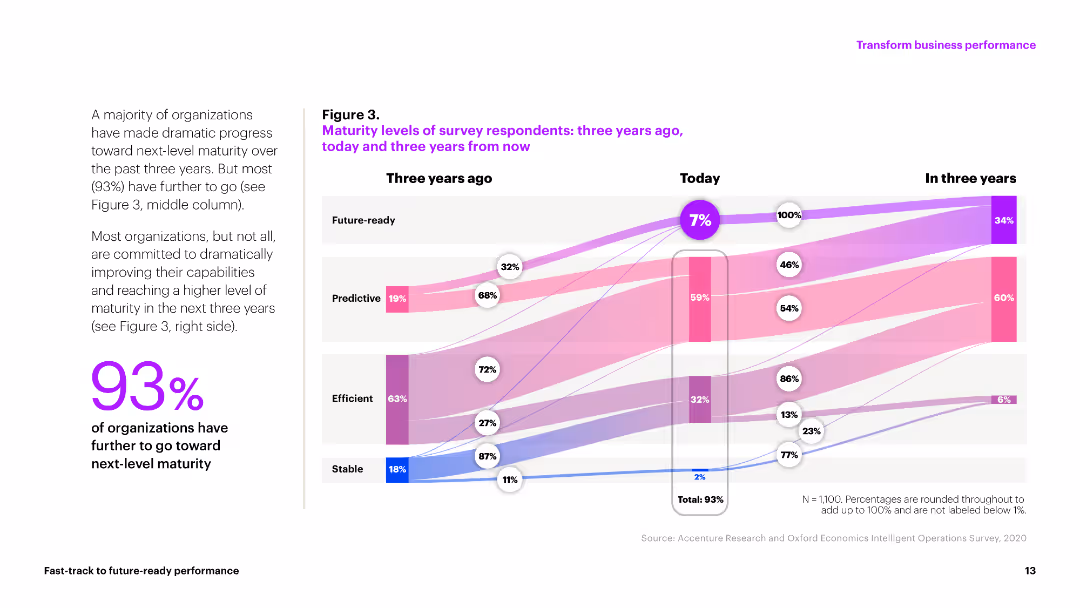
The slide contains a flow diagram comparing maturity levels of organizations over three years. The visual shows progression from stable to future-ready with multiple colored bands representing different stages.
Market Analysis and Trends
Professional Services
The slide depicts the maturity levels of organizations from three years ago, today, and projected for three years into the future. It highlights that only 7% are currently future-ready with 93% aiming to improve.
maturity, progress, organizations, future, stages
false
Figure 3. Maturity levels of survey respondents: three years ago, today and three years from nowFAST-TRACK TO FUTURE-READY PERFORMANCE
Mixed Chart
Accenture
View slide
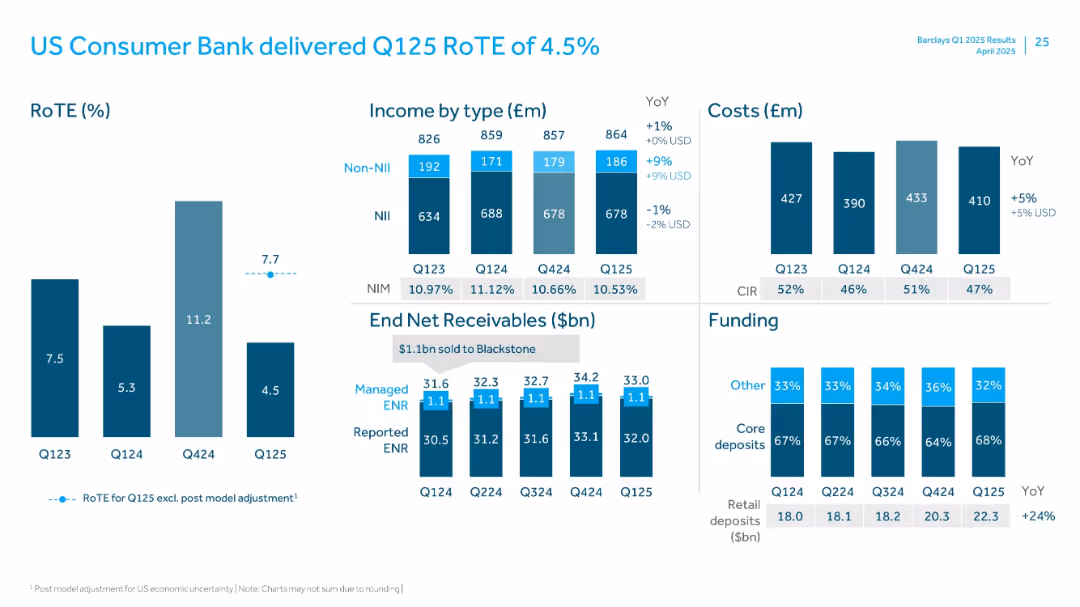
Visuals include RoTE bars, income breakdown, cost bars, ENR trend, and deposit funding mix.
Financial Performance
Financial Services
Analyzes performance of US Consumer Bank with a low RoTE of 4.5%. Contains income and cost breakdowns, net receivables trend, and funding mix. Retail deposits up 24% YoY. Includes post-model adjustment commentary.
US Consumer, RoTE, ENR, Retail Deposits, Income, NIM, Non-NII, Q125
false
US Consumer Bank delivered Q125 RoTE of 4.5%Q1 2025 Results Presentation
Multiple Chart
Barclays
View slide
Consists of a gradient green scale illustrating levels of digital marketing maturity from Nascent to Multi-moment. The layout is straightforward with circular nodes and connecting lines.
Market Analysis and Trends
Media & Entertainment
This slide assesses various brands on their digital marketing maturity, categorizing them from nascent to multi-moment stages. It highlights the progression and maturity in digital marketing practices among brands, useful for understanding market positions and planning marketing strategies.
digital marketing, brand assessment, maturity scale, nascent, multi-moment, marketing strategies, market analysis, progression, technology, engagement
false
Brands were assessed based on their level of digital marketing maturityUnderstanding the path to digital marketing maturity
Linear Flow
BCG
View slide
The slide includes a line graph of relative returns of investment strategies and a bar chart of strategy performance across recessions.
Market Analysis and Trends
Financial Services
Analyzes the performance of mean reversion strategies in the financial market and their relative performance post-COVID compared to passive strategies.
mean reversion, COVID cyclicals, investment strategies, market analysis, financial performance
false
The “mean reversion” theme of 2021 has been retired. COVID cyclicals reboundedCiti Global Wealth Investments OUTLOOK 2022
Multiple Chart
Citigroup
View slide
The slide features a matrix showing the usage of strategic levers by leaders, with a heatmap indicating the percentage of companies selecting each lever.
Strategic Planning
Professional Services
It presents the strategic levers used by leaders to create value, highlighting the importance of supply and demand power in procurement strategies.
Strategic levers, procurement, supply power, demand power, value creation, leaders, strategic planning
false
In the eyes of CFO’s, Procurement has made strides in the right directionExcellence in Procurement
Mixed Chart
Kearney
View slide
The slide includes a line graph showing the average five-year fixed contract mortgage rate trends.
Market Analysis and Trends
Real Estate & Construction
It explains how lower borrowing costs have made housing more affordable, showing the decline in mortgage rates.
Borrowing costs, affordability, mortgage rates, housing, decline, trends, line graph, financial impact, analysis
false
Low Borrowing Costs Improved AffordabilityMarket Year in Review and Outlook 2021
Single Chart
IPSOS
View slide
Country-level bar chart with teal bars on white background, global average shown at top
Market Analysis and Trends
Government & Public Sector
This slide explores perceptions of religious discrimination globally. Indonesia and India report the highest perceived inequality toward religious groups, with a global average of 12%. Japan shows the lowest perception at 4%.
religion, inequality, discrimination, Ipsos, global views, survey, religious bias, 2023
false
People of specific religionsIPSOS EQUALITIES INDEX 2023
Mixed Chart
IPSOS
View slide
The slide contains a table with data on non-performing assets and allowance for credit losses, column charts showing net charge-offs and core provision for credit losses trending, and text.
Risk Assessment and Management
Financial Services
The slide reviews trends in credit quality, focusing on the normalization in the credit environment and expected CRE stress, with data on charge-offs and credit loss allowances.
Credit, Quality, Risk, Assets, Allowance, Losses
false
Credit quality Trends reflect normalization in the credit environment and expected CRE stressBarclays Americas Select Franchise Conference 2024
Mixed Chart
Barclays
View slide
Two line charts: one showing US household liquid savings by income quintile, and the other displaying US credit card delinquency rates by income group, highlighting growing disparities in consumer financial health.
Market Analysis and Trends
Consumer Goods
The slide analyzes the widening disparities in consumer financial health, showing that higher-income groups have substantial savings while lower-income groups face increasing credit card delinquencies and depleted savings.
Consumer Health, Spending, Savings, Delinquency, Financial Disparities
false
Disparities in consumer health and spending resilience are set to widen further, with lower income groups likely to face particular pressure to rein in spendingJanuary Macro Brief Special edition: 2024 outlook and top 10 macro trends
Multiple Chart
Accenture
View slide
Two charts showing year-over-year changes in housing prices and volumes, and property developer funding sources.
Market Analysis and Trends
Real Estate & Construction
The slide analyzes China's property market trends, focusing on housing prices, transaction volumes, and the funding structure of property developers.
China, property market, housing prices, volumes, developer funding
false
China: Property marketGuide to the Markets Australia | 2Q 2024
Multiple Chart
JP Morgan
View slide
The slide uses column charts to show the intention to buy electric vehicles among different personas. It also features radial gauges indicating EV preference among each persona group. The layout is dense with multiple visual elements, including icons and illustrations.
Customer and Market Segmentation
Transportation & Logistics
This slide illustrates the EV purchase intentions among different personas, highlighting Tech Enthusiasts, Dreamers, Luxurious, and Pragmatic as key segments. It provides data on cluster sizes, regional distribution, and EV preference, focusing on key target groups.
EV intention, personas, column charts, radial gauges, target segments
false
Tech Enthusiasts, Dreamers, Luxurious and Pragmatic consistently show the highest intention to buy in the near future4th edition eReadiness 2023
Multiple Chart
PwC/Strategy&
View slide
Split-panel layout with statistics, bullet points, and colored bars; simple visual style with balanced white space
Market Analysis and Trends
Financial Services
Highlights the realistic self-assessment of FinTechs in Europe, noting that while they are innovation drivers, they are not expected to revolutionize the market alone. The slide shares percentages on customer satisfaction, cooperation with traditional banks, and regulatory gaps.
FinTech, innovation, regulation, digitalization, cooperation, market drivers, blockchain, technology
false
FinTechs are realistic about their market position – They are a major innovation driver but will not revolutionize the industry aloneFinTechs in Europe – Challenger and Partner
Mixed Chart
Roland Berger
View slide
The slide shows a column chart indicating the average crypto asset knowledge score and the number of correct answers participants provided on a knowledge quiz.
Technology and Digital Transformation
Financial Services
This slide measures the average knowledge score of participants regarding crypto assets, based on a series of quiz questions.
Knowledge, crypto assets, quiz, score, participants
false
Crypto Asset KnowledgeCRYPTO ASSET SURVEY
Mixed Chart
IPSOS
View slide
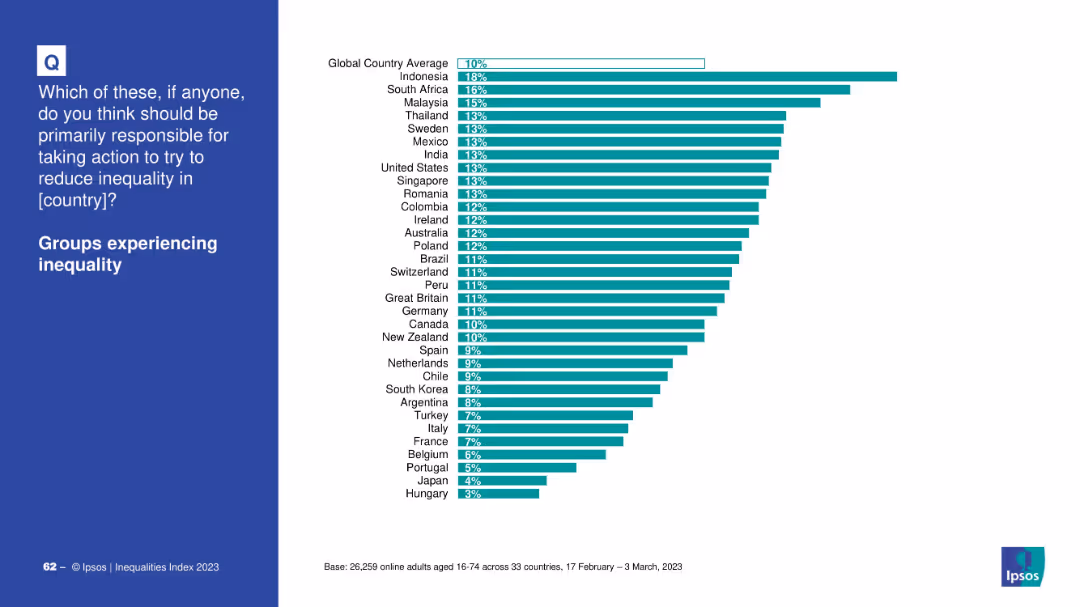
Country ranking bar chart showing support for responsibility among affected groups.
Market Analysis and Trends
Government & Public Sector
This chart illustrates how people from different countries think groups experiencing inequality should be primarily responsible. Indonesia ranks highest; Hungary lowest.
affected groups, inequality, country opinions, responsibility, Ipsos, bar chart, global ranking
false
Groups experiencing inequalityIPSOS EQUALITIES INDEX 2023
Mixed Chart
IPSOS
View slide
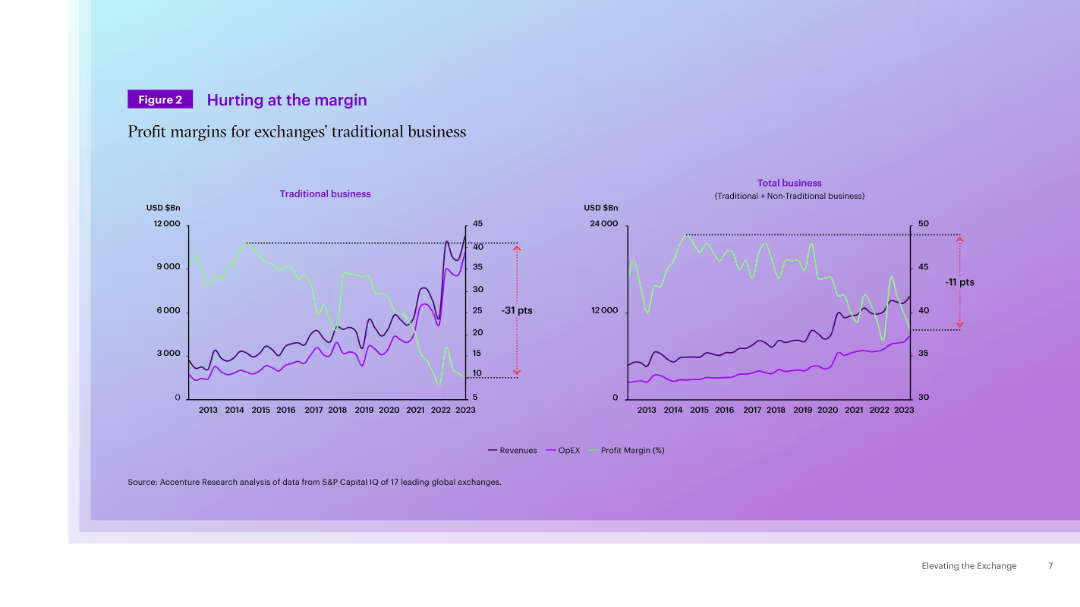
Dual-line chart layout showing traditional vs. total business trends in revenue, OPEX, and profit margin from 2013–2023. Purple background gradient.
Financial Performance
Financial Services
This slide compares trends in traditional and total business segments of exchanges over a decade. Traditional business margins fell sharply, while non-traditional services have helped mitigate the overall decline.
profit margin, traditional vs total business, revenue, OpEX, exchanges
false
Figure 2 Hurting at the marginElevating the Exchange
Multiple Chart
Accenture
View slide
Graphical layout with bar charts comparing technology in use and deployment across various domains.
Technology and Digital Transformation
Technology & Software
Slide depicts technology usage and deployment statistics, emphasizing the higher adoption rate of hybrid work technologies.
Technology, Statistics, Hybrid Work, Data Analysis
false
Technology in use or being deployedFuture Workplace Index 2.0
Single Chart
EY
View slide
The slide presents a detailed framework using icons and numbering for different aspects of digital marketing across data targeting, activation, and collaboration.
Technology and Digital Transformation
Professional Services
Describes a framework for achieving digital marketing maturity through various technical and organizational strategies.
digital marketing, framework, activation, data, collaboration, measurement, technology
false
Appendix | Digital marketing maturity framework across key activities & channelsUnderstanding the path to digital marketing maturity
Pillar
BCG
View slide
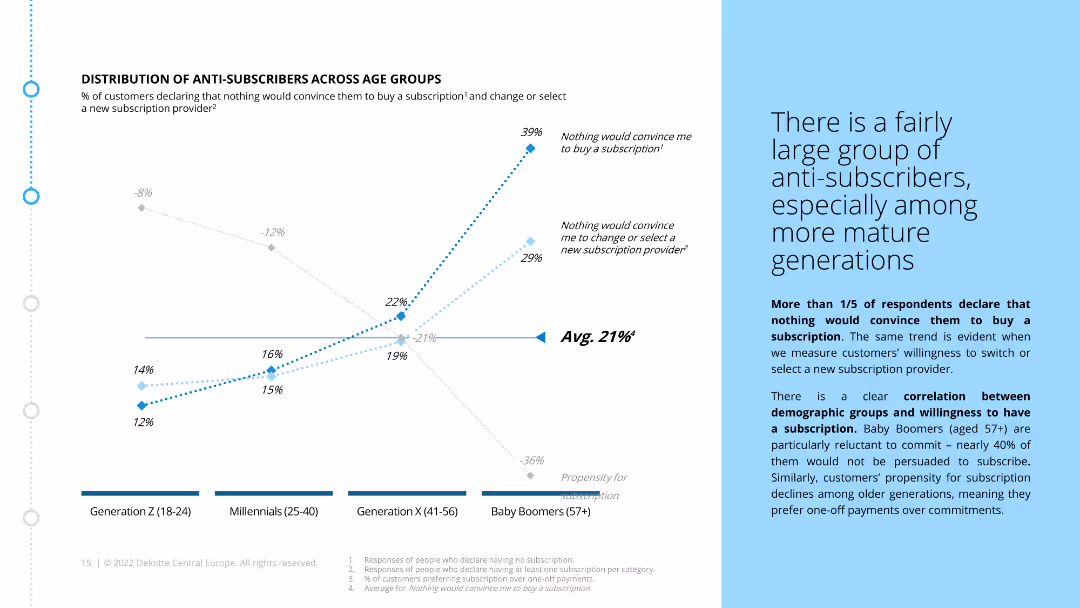
The slide includes a line chart that shows the percentage of anti-subscribers across different age groups. It also contains a text box explaining the correlation between age and subscription reluctance.
Market Analysis and Trends
Consumer Goods
The slide highlights the demographic distribution of customers who are reluctant to subscribe, particularly among older generations. It shows a clear correlation between age and subscription resistance.
anti-subscribers, age groups, market segmentation, customer demographics, subscription reluctance, generational differences, ecommerce, retail
false
DISTRIBUTION OF ANTI SUBSCRIBERS ACROSS AGE GROUPSDemystifying the hype of subscription
Mixed Chart
Deloitte
View slide
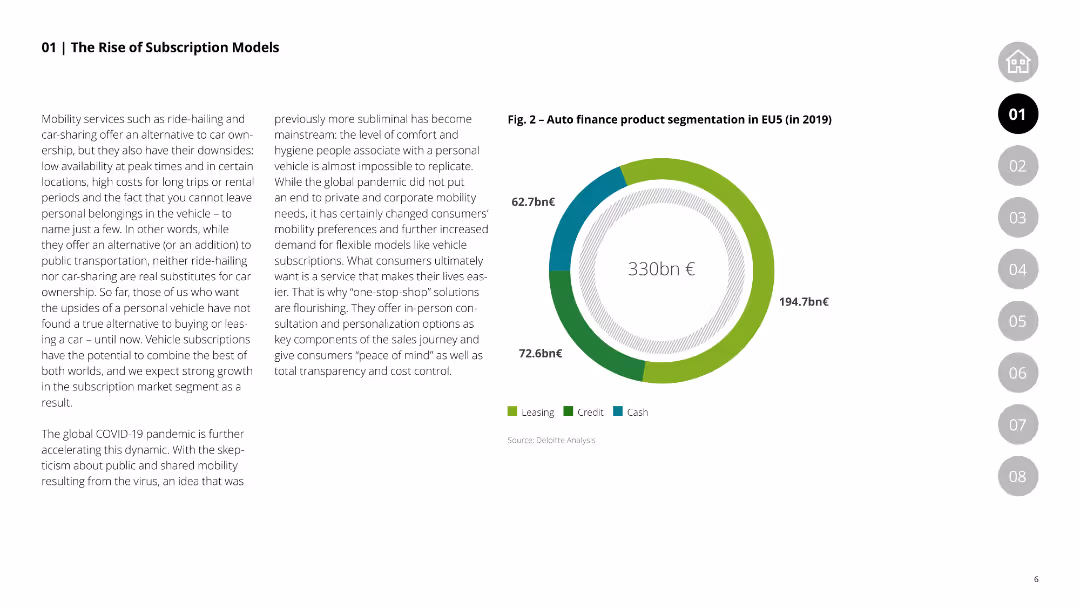
This slide includes a column chart showing product segmentation in the EU5 auto finance market for 2019, comparing leasing, credit, and cash products.
Market Analysis and Trends
Financial Services
Details the segmentation of auto finance products in the EU5 market, emphasizing the shift towards subscription models and how it caters to changing consumer preferences.
auto finance, product segmentation, EU5, leasing, credit, cash, subscription models
false
Fig. 2 – Auto finance product segmentation in EU5 (in 2019)Vehicle-as-a-Service From vehicle ownership to usage-based subscription models
Mixed Chart
Deloitte
View slide
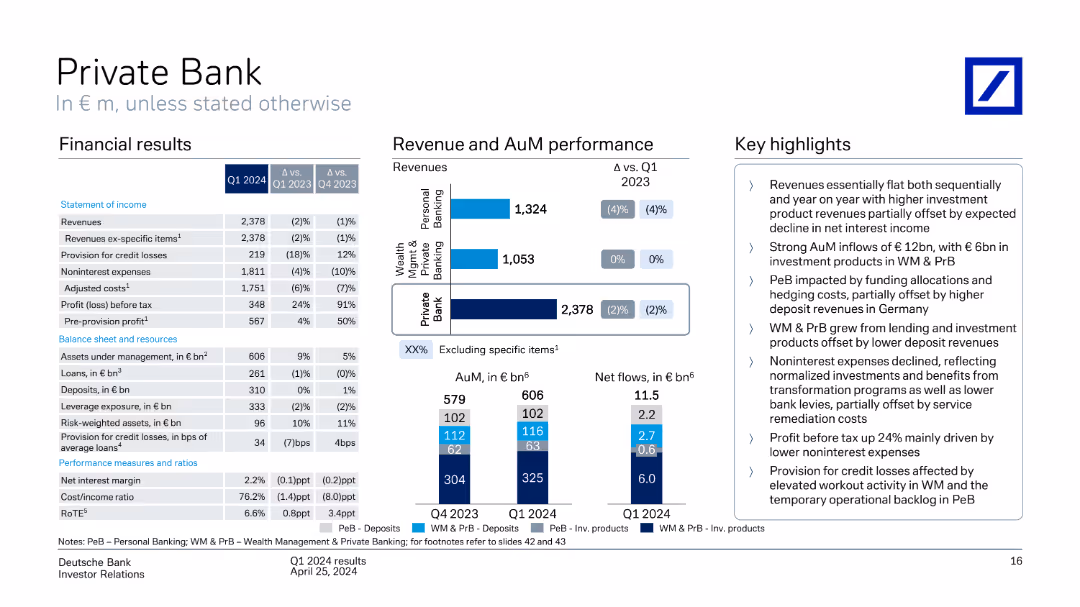
A column chart and bar chart showing revenue and assets under management performance, with a table of financial results and key highlights. The slide is detailed with a balance of text and visuals.
Financial Performance
Financial Services
The slide presents Q1 2024 financial results for the Private Bank, including revenue, profit, and assets under management, with a detailed breakdown of performance across different segments.
Private Bank, revenue performance, financial results, assets under management
false
Private Bank In € m, unless stated otherwiseQ1 2024 results
Multiple Chart
Deutsche Bank
View slide
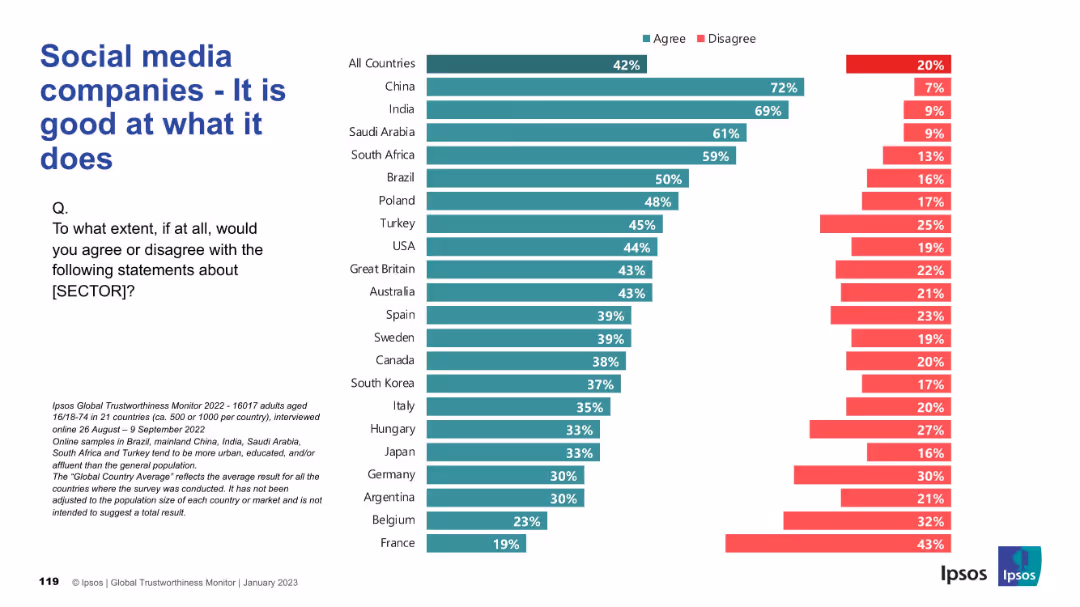
Similar chart format showing agreement/disagreement on performance of social media companies globally.
Product and Service Analysis
Technology & Software
This slide shows public agreement with the competence of social media companies. While emerging markets show strong belief in performance, Western nations like France and Belgium express more skepticism.
social media, performance, public perception, global opinion, Ipsos survey, competence, tech industry, country comparison
false
Social media companies - It is good at what it doesIPSOS GLOBAL TRUSTWORTHINESS MONITOR January 2023
Mixed Chart
IPSOS
View slide
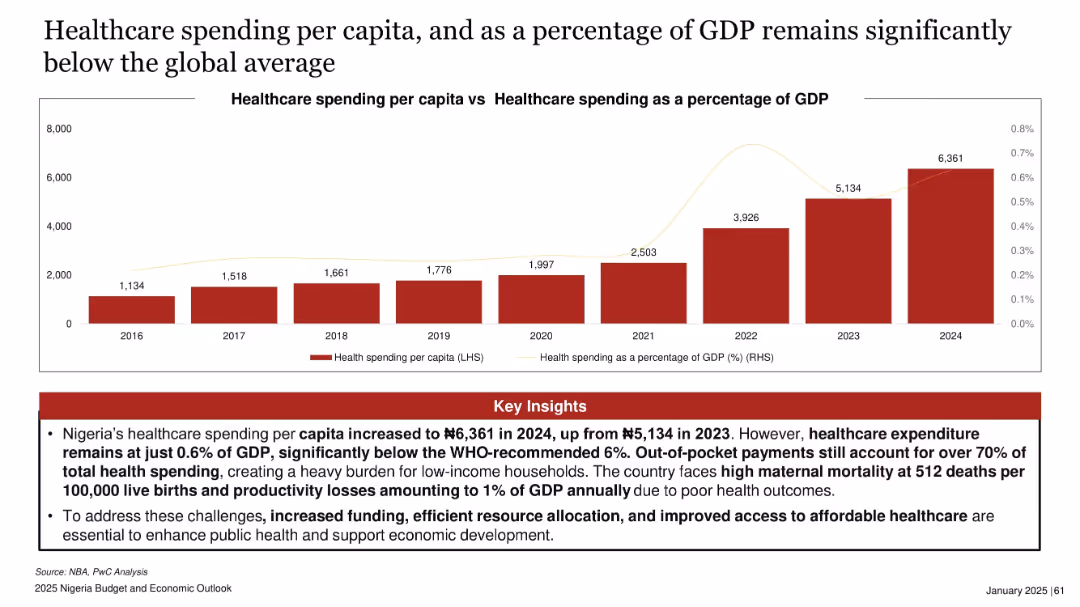
Bar chart showing healthcare spending per capita (2016–2024) and line chart overlay of GDP percentage. Red insights section below.
Regulatory and Compliance
Healthcare & Pharmaceuticals
This slide reveals Nigeria's underfunded healthcare system, with per capita spending far below WHO guidelines and just 0.6% of GDP. It points to critical issues such as maternal mortality and high out-of-pocket costs, calling for urgent funding increases.
healthcare spending, GDP, Nigeria, maternal mortality, public health, WHO standards, funding gap
false
Healthcare spending per capita, and as a percentage of GDP remains significantly below the global average2025 Nigeria Budget and Economic Outlook
Mixed Chart
PwC/Strategy&
View slide
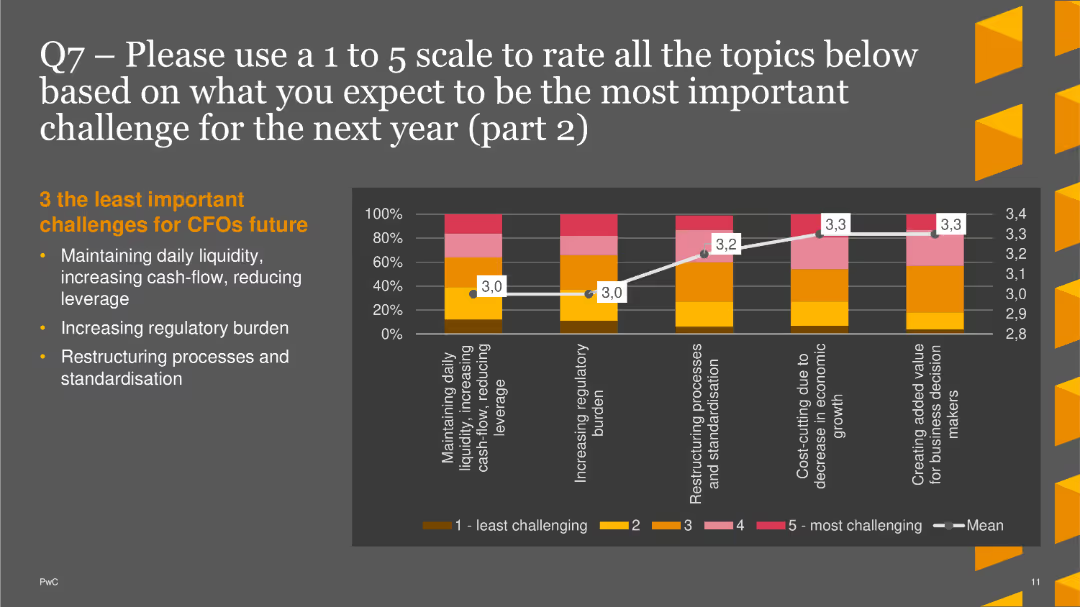
The slide features a column chart showing less significant expected challenges, including liquidity management and regulatory burden.
Market Analysis and Trends
Financial Services
This slide highlights the least important expected challenges for CFOs in the next year: daily liquidity, regulatory burden, and restructuring processes.
Future Challenges, CFOs, Column Chart, PwC, Survey, 2022, Regulatory Burden
false
Q7 – Please use a 1 to 5 scale to rate all the topics below based on what you expect to be the most important challenge for the next year (part 2)PwC CFO Insights Survey 2022
Mixed Chart
PwC/Strategy&
View slide
The slide includes a main text section at the top, followed by two sets of data visuals. The left visual is a column chart showing the top concerns among Gen Zs, and the right visual for millennials.
Market Analysis and Trends
Consumer Goods
The slide highlights the top concerns for Gen Z and millennials, with cost of living being the primary issue. It includes survey data showing the percentages of respondents from both groups who are concerned about various issues like climate change and unemployment.
Gen Z, millennials, cost of living, survey, concerns
false
The cost of living is the top concern among both Gen Zs and millennialsDeloitte Gen Z and Millennial Survey 2022
Multiple Chart
Deloitte
View slide
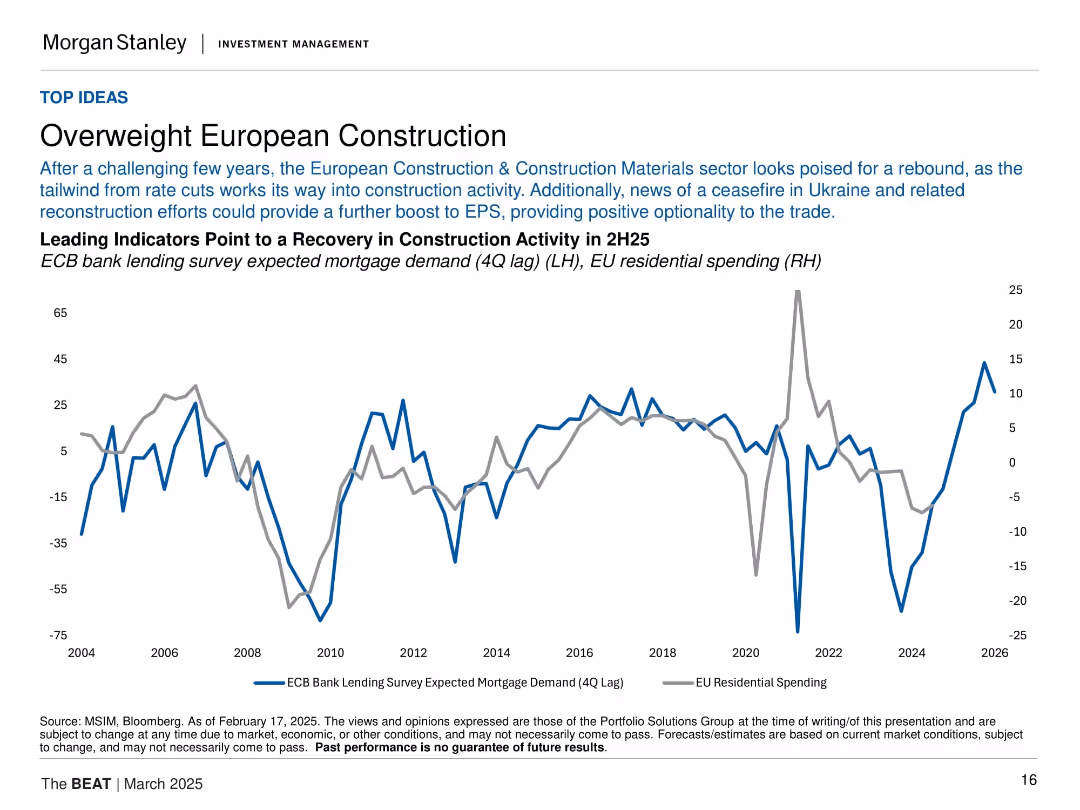
Two-line title followed by multi-sentence explanatory text in smaller font. Includes a dual-axis line graph with two indicators (blue and grey lines) showing correlation between mortgage demand and EU residential spending.
Investment Analysis
Real Estate & Construction
The slide presents an investment thesis favoring European construction, citing easing monetary policy and geopolitical developments (e.g., Ukraine ceasefire) as catalysts for recovery. The chart illustrates leading indicators of a potential rebound in EU residential construction spending.
European construction, mortgage demand, residential spending, ECB, EPS, macro trends, Ukraine, investment thesis, housing rebound, rate cuts
false
Overweight European ConstructionThe BEAT March 2025
Single Chart
Morgan Stanley
View slide
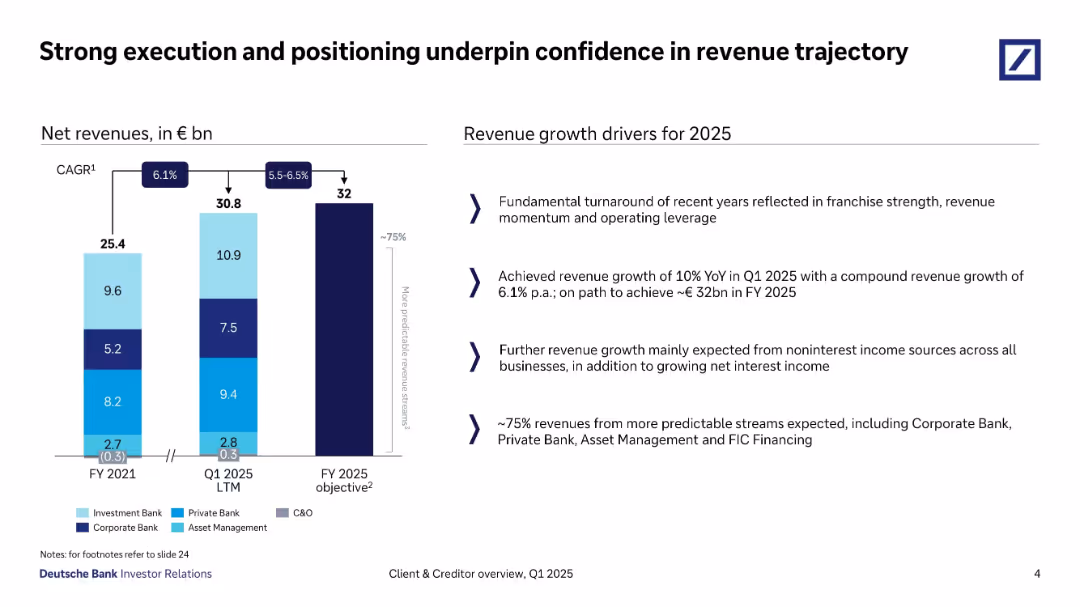
Split layout: bar chart on left (FY2021–FY2025 revenue forecast by business segment); bullet points on right summarizing revenue growth drivers.
Strategic Planning
Financial Services
This slide illustrates Deutsche Bank's projected revenue growth through FY 2025, with CAGR expectations and a targeted €32bn revenue. Key drivers include turnaround momentum, increased noninterest income, and reliance on more predictable income streams.
revenue growth, FY2025, predictable income, CAGR, segment analysis, momentum, private bank, asset management, financial planning
false
Strong execution and positioning underpin confidence in revenue trajectoryClient & Creditor Overview
Mixed Chart
Deutsche Bank
View slide
This slide features a comparative chart with ratings from Moody's, S&P, and Fitch for various financial institutions. Symbols indicate rating levels and outlooks.
Competitive Landscape
Financial Services
It compares credit ratings for UBS and its peers, providing a visual representation of ratings across different agencies as of September 2023.
credit ratings, peer comparison, Moody's, S&P, Fitch, UBS, financial, operating company, September 2023
false
Credit ratings peer comparison Long-term senior unsecured debt – operating company, as of 11.9.23Second quarter 2023 Fixed Income investor presentation
Table
UBS
View slide
Utilizes tables and a line graph tracking sector performance, highlighting ROE and dividend growth.
Market Analysis and Trends
Technology & Software
Discusses the consistency of growth and profits across different industries, with a focus on leaders in the tech and healthcare sectors.
consistent growth, profits, industry analysis, ROE, dividends
false
Which industries have the most consistent growth and profits?Citi Global Wealth Investments OUTLOOK 2022
Mixed Chart
Citigroup
View slide
Features multiple line graphs showing mobility trends in different sectors across various countries.
Strategic Planning
Transportation & Logistics
Analyzes recovery in mobility across sectors like retail and public transit post-COVID-19, comparing several countries to highlight varying speeds of economic recovery.
mobility, retail, public transit, trends
false
Retail and recreation mobility recovered fastest; public transit mobility remains lower in most countriesWhat the Evolution of Travel Means for Business
Multiple Chart
BCG
View slide
Slide shows a central title with three images below, each representing a different report topic: industrial, process, and warehouse automation, with corresponding titles and seasonal indicators.
Industry Overview
Professional Services
Anticipates future detailed reports on factory and warehouse automation, serving as a teaser for upcoming publications.
Automation, Reports, Industry, Factory, Warehouse, Upcoming, Seasonal
false
In the coming months, look for additional, detailed reports on factory and warehouse automationProcess Automation: A quickly growing market with structural tailwinds and investment opportunities
Diagram
LEK
View slide
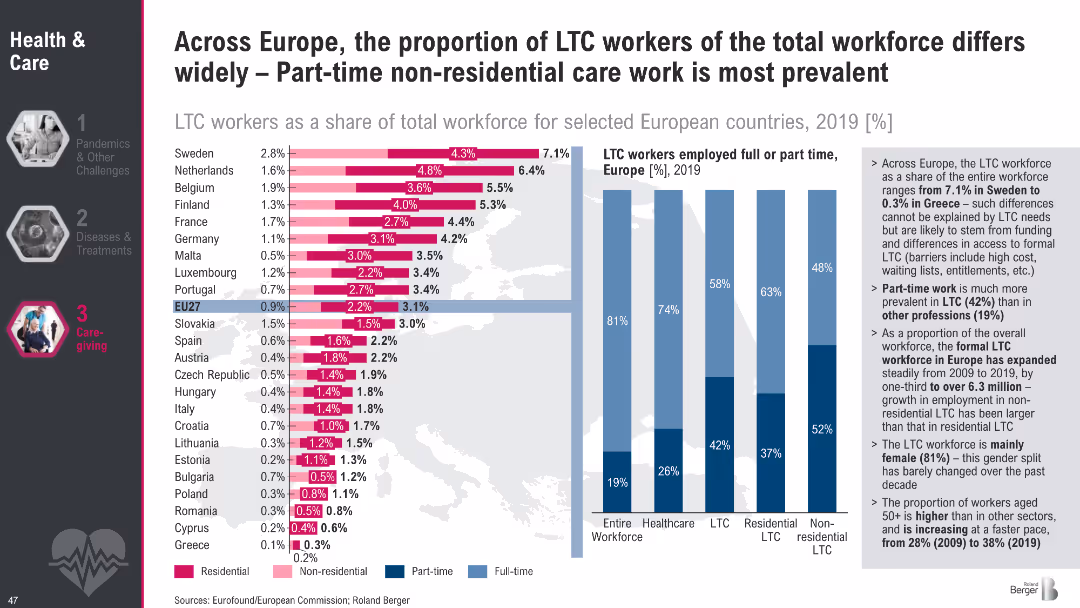
Bar chart of LTC workers as % of total workforce across countries, segmented by residential/non-residential care; vertical bars show part-time/full-time ratios.
Human Resources and Talent Management
Healthcare & Pharmaceuticals
The slide examines employment trends in the LTC workforce across Europe, highlighting variation in workforce size, part-time prevalence, and the distinction between residential and non-residential care. It also underscores gender imbalance and the aging workforce.
LTC workforce, part-time care, non-residential care, employment trends, Europe, healthcare labor, care sector
false
Across Europe, the proportion of LTC workers of the total workforce differs widely Part time non residential care work is most prevalentMegatrend 2 Health & Care
Multiple Chart
Roland Berger
View slide
The slide contains a series of donut charts illustrating consumer uptake of technology, specifically EV adoption and heat pump adoption (% of sales) from 2025 to 2050 across different regions (Global, Europe, US, China). Each chart shows adoption rates at different time intervals.
Market Analysis and Trends
Energy & Utilities
This slide highlights the projected consumer adoption rates of electric vehicles (EVs) and heat pumps across different regions by 2050. It shows significant growth trends, driven by technological advancements and government mandates to reduce emissions and increase energy efficiency.
Consumers, Technology, Adoption, EV, Heat Pump, 2050, Growth
false
Consumer uptake of technologyIf every energy transition is different, which course will accelerate yours?
Multiple Chart
EY
View slide
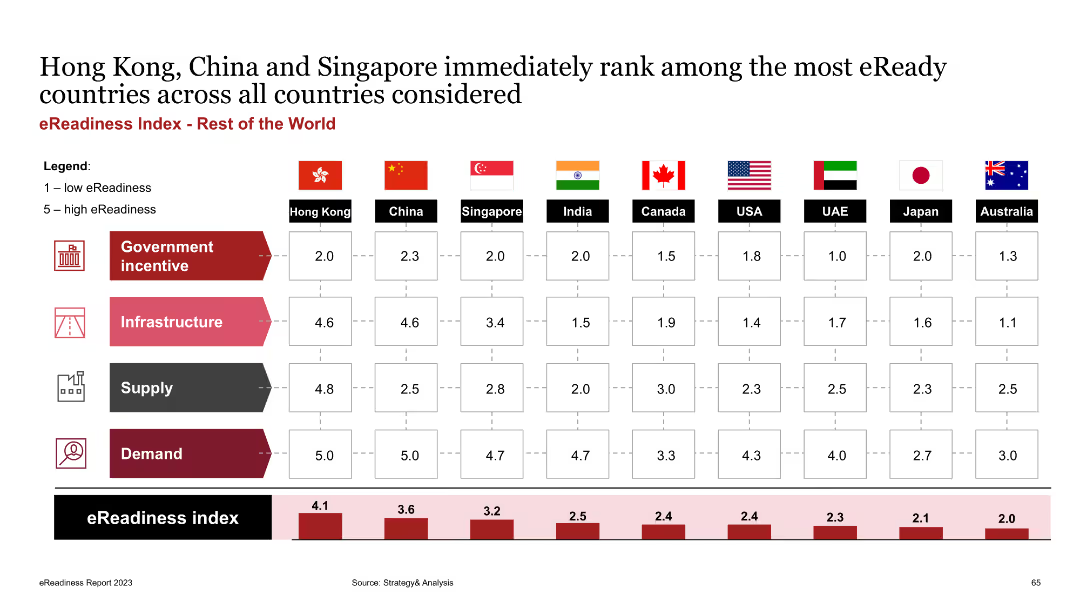
The slide features a table comparing eReadiness scores for countries outside Europe, across four dimensions: government incentives, infrastructure, supply, and demand. Each category is color-coded.
Market Analysis and Trends
Transportation & Logistics
The slide ranks eReadiness of countries globally, showing Hong Kong, China, and Singapore as leaders. It aims to provide a comprehensive view of EV market readiness beyond Europe.
eReadiness, global comparison, government incentives, infrastructure, supply, demand
false
Hong Kong, China and Singapore immediately rank among the most eReady countries across all countries considered4th edition eReadiness 2023
Mixed Chart
PwC/Strategy&
View slide
Combines column charts and line graphs depicting hydrogen uptake volumes and percentages across various applications up to 2050.
Performance Metrics and KPIs
Energy & Utilities
Analyzes projected hydrogen consumption for domestic applications, highlighting growth areas like mining and public transport.
hydrogen, domestic, uptake, mining, trucks, buses, refineries
false
Domestic could account for +3M ton of total hydrogen demand by 2050Chilean Hydrogen Pathway
Multiple Chart
McKinsey
View slide
Column charts showing top sellers and buyers since 2014, segmented by different years and totals.
Competitive Landscape
Financial Services
Provides an overview of the top sellers and buyers in the European market since 2014, focusing on the competitive landscape.
Sellers, buyers, market, Europe, competitive
false
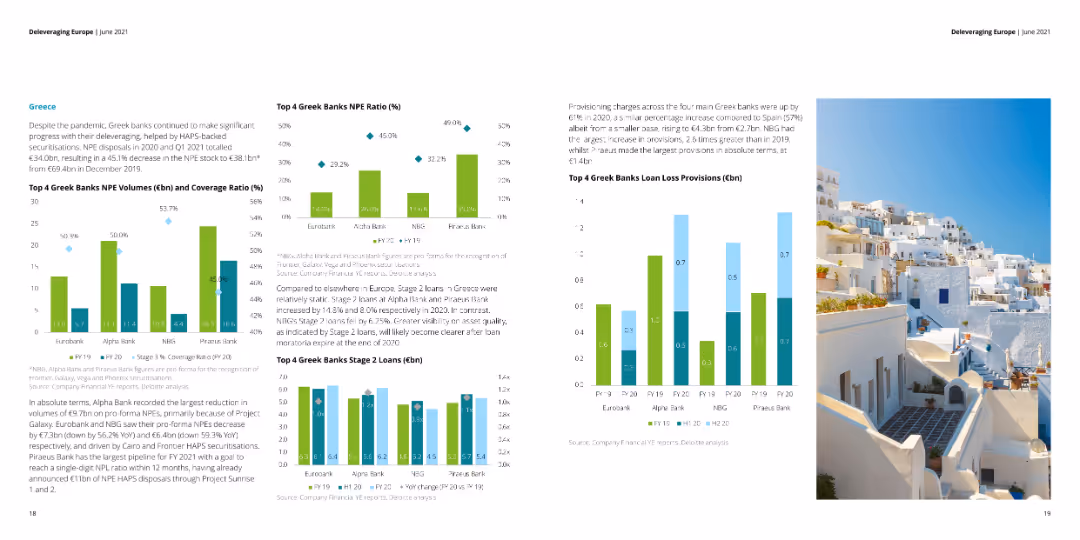
Top 4 Greek Banks NPE Ratio (%)Deleveraging Europe
Multiple Chart
Deloitte
View slide
Three-dimensional block diagram comparing different decarbonisation scenarios and strategies. Clear color-coded sections for easy understanding.
Strategic Planning
Environmental Services & Sustainability
Models four scenarios for carbon market outcomes up to 2050. Details the potential impacts and design criteria for each scenario.
carbon market, future scenarios, decarbonisation
false
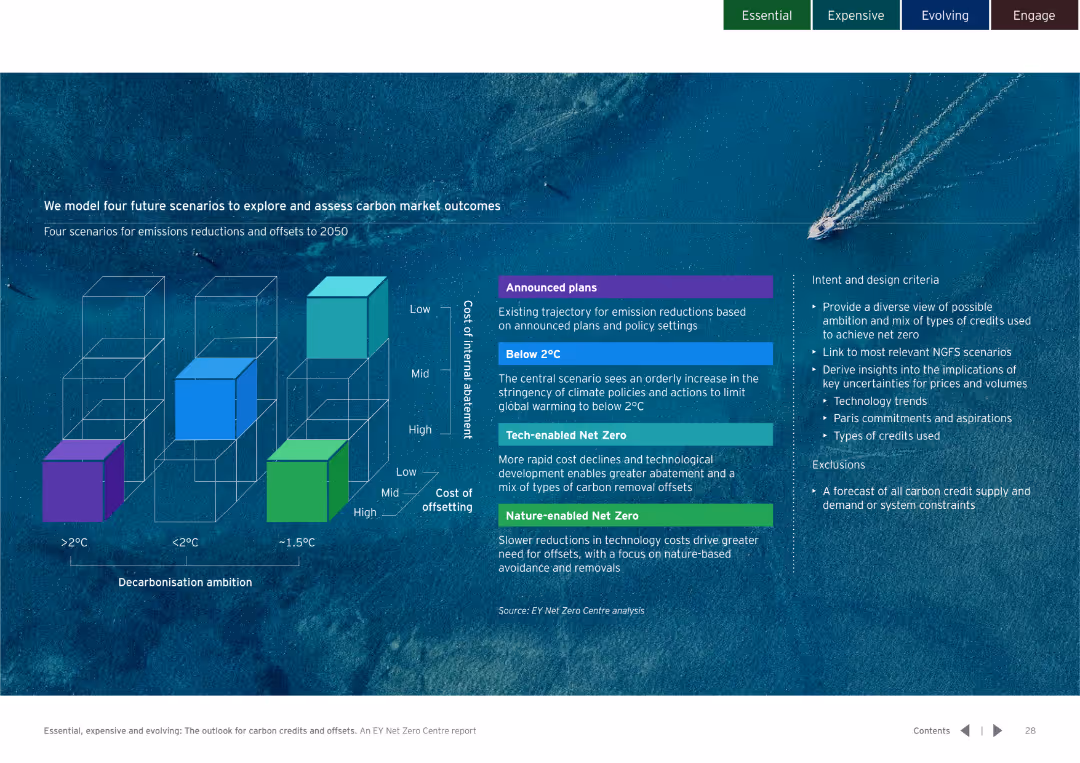
We model four future scenarios to explore and assess carbon market outcomesEssential, expensive and evolving: The outlook for carbon credits and offsets
Diagram
EY
View slide
Full-width layout with three vertical bar charts showing AI maturity distribution across revenue, industry, and geography.
Operational Efficiency
Financial Services
Illustrates AI maturity levels (beginner, implementer, leader) across company revenue bands, industries, and regions. Highlights disparities in adoption and positioning for AI leadership across sectors and regions.
AI maturity, benchmarking, revenue, industry comparison, regional trends, implementation, leader status, AI adoption
false
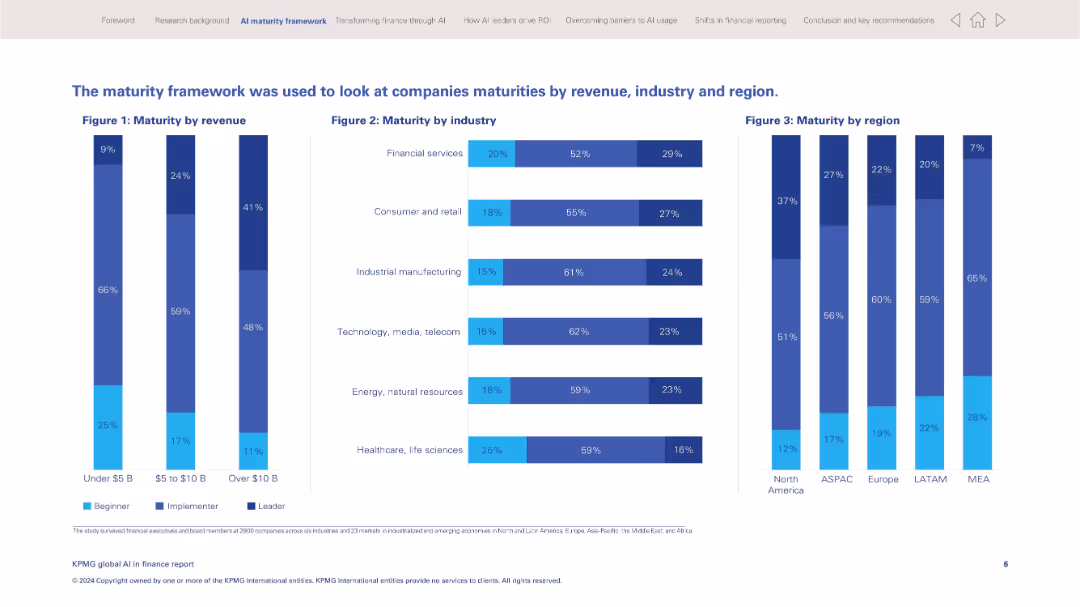
The maturity framework was used to look at companies maturities by revenue, industry and region.KPMG global AI in finance report
Multiple Chart
KPMG
View slide
Contains a line chart detailing the percentage of social media activities handled by outside agencies over time, segmented by economic sector.
Operational Efficiency
Professional Services
Analyzes trends in outsourcing social media activities, useful for strategic planning and optimizing operational efficiency in professional services.
social media, agencies, outsourcing, trend, professional services, operational efficiency, strategic planning, analysis
false
Most marketers do not use outside agencies for their social media activitiesThe CMO Survey The Highlights and Insights Report February 2022
Mixed Chart
Deloitte
View slide
Contains line graphs and column charts detailing the net interest margin (NIM) for different bank divisions and the group overall, alongside key financial highlights.
Performance Metrics and KPIs
Financial Services
Analyzes the net interest margin trends within the bank, highlighting changes due to market conditions and bank strategies, crucial for assessing profitability.
NIM, trends, profitability, bank strategy
false
Net interest margin (NIM) Divisional NIM developmentQ1 2023 results
Multiple Chart
Deutsche Bank
View slide
A detailed process flow diagram depicts the stages of the procurement process from product selection to payment. Includes icons and descriptions for each step, interactions with a central data hub, and customer service systems.
Operational Efficiency
Professional Services
Provides a comprehensive view of the procurement process, showing the sequence and tools involved from the initial product need to final payment, highlighting integration with technology for efficiency.
Procurement, Process, Technology, Efficiency, Integration
false
What this looks like in practical termsThe Future of Procurement: Why is Technology Lagging Behind?
Diagram
Kearney
View slide
Two bar charts tracking venture activity and VC corporate participation by quarter from 2018 to H1 2021.
Strategic Planning
Financial Services
The slide shows consistent quarterly momentum in venture activity and corporate VC participation. It highlights deal values, counts, and funding types (Angel, Early, Later VC), pointing to sustained growth and investor confidence in fintech innovation through H1 2021.
venture capital, VC, fintech, deal momentum, funding stages, corporate participation
false
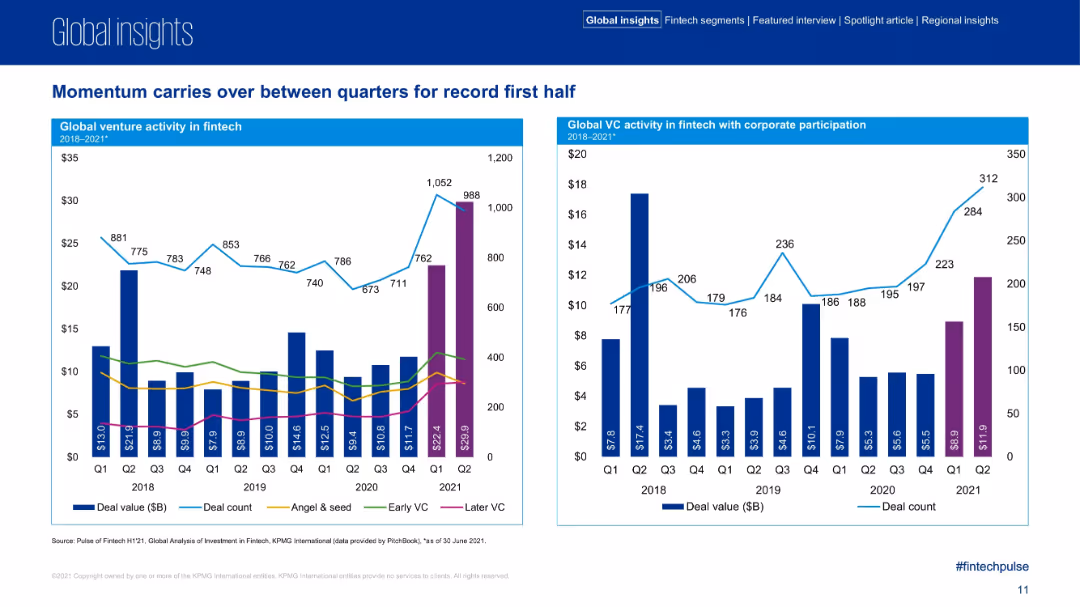
Momentum carries over between quarters...Pulse of Fintech H1’21
Multiple Chart
KPMG
View slide
The slide contains sets of column charts for three years and text annotations. It also includes a line graph overlaid on the charts.
Market Analysis and Trends
Financial Services
This slide evaluates the shift in market focus by CEOs in China, specifically their reduced preference for the US market. It could be used to discuss changes in international business strategies and economic forecasts.
China, CEOs, Market Focus, US, Growth Ambitions, Trends, Economic Strategy
false
EXHIBIT 10 China’s CEOs are radically revising their growth ambitions and are behind the drop in votes for the US as top marketPwC's 22nd Annual Global CEO Survey
Multiple Chart
PwC/Strategy&
View slide
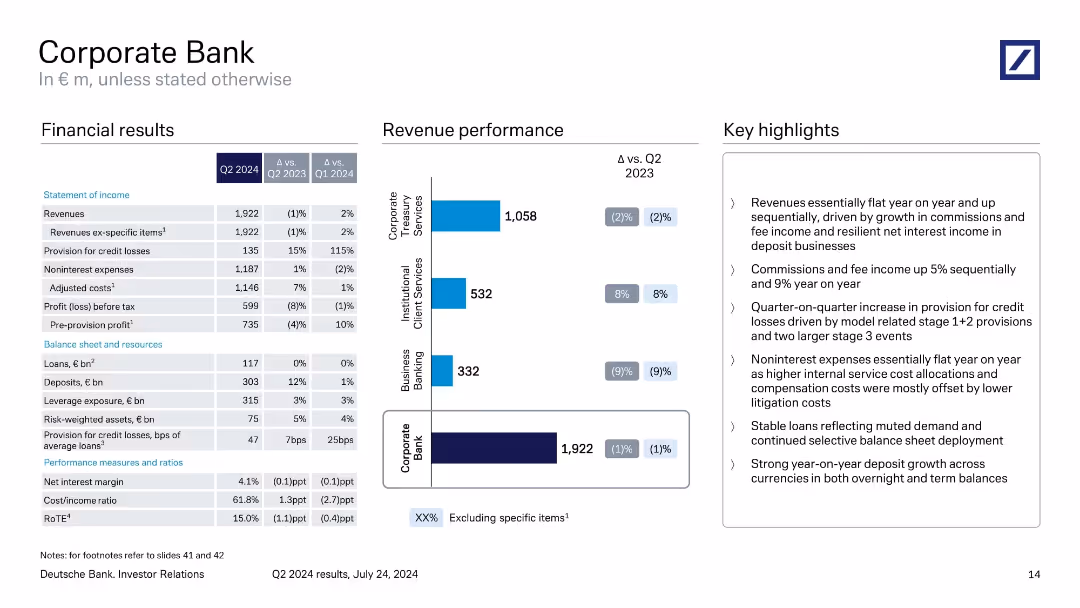
Three-column layout with financial table, revenue bar chart, and key highlights.
Product and Service Analysis
Financial Services
Reviews Q2 2024 performance of the Corporate Bank division. Highlights include flat revenue, rising provisions for credit losses, steady expenses, and growth in deposits. Segment-level revenue performance for treasury, institutional, and business banking is visualized.
Corporate Bank, Q2 2024, revenue, credit losses, business banking, Deutsche Bank
false
Corporate BankQ2 2024 results
Mixed Chart
Deutsche Bank
View slide
Pie chart of FDI by regions and a bar chart showing top five investing countries by FDI in Europe.
Market Analysis and Trends
Financial Services
This slide examines the origins of FDI in Europe, with a significant share coming from European companies.
FDI, Europe, investing countries, regions, origin
false
60% of FDI in Europe comes from European based companies, followed by the US at 21%How can Europe turn on the taps of foreign investment?
Multiple Chart
EY
View slide
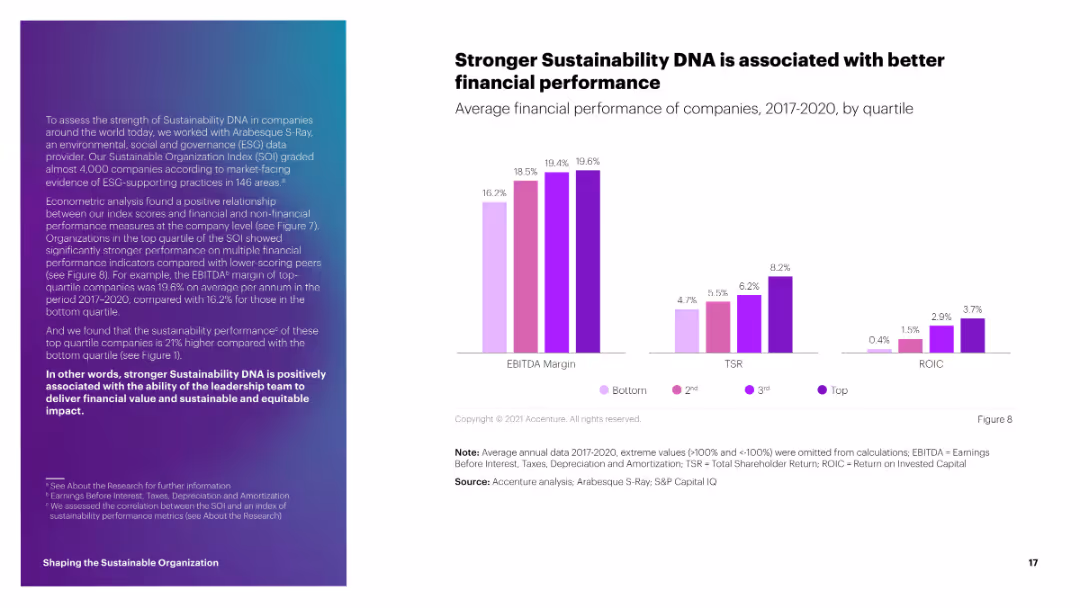
The slide includes a column chart comparing financial performance metrics (EBITDA margin, TSR, ROIC) across quartiles. The bars are in shades of purple, and the layout includes explanatory text.
Financial Performance
Environmental Services & Sustainability
This slide presents data showing that companies with stronger sustainability DNA perform better financially, with higher EBITDA margins, total shareholder returns, and returns on invested capital.
sustainability, financial performance, EBITDA, TSR, ROIC
false
Stronger Sustainability DNA is associated with better financial performanceShaping the Sustainable Organization
Multiple Chart
Accenture
View slide
A list format slide with a bold header, followed by four key points each backed by a description.
Corporate Finance and Valuation
Financial Services
Outlines the key success factors of an asset management company, ideal for investor relations or company meetings.
Success, Asset Management, Investment, Global Scale, Performance
false
What Drives Our SuccessGoldman Sachs Investor Day
Table
Goldman Sachs
View slide
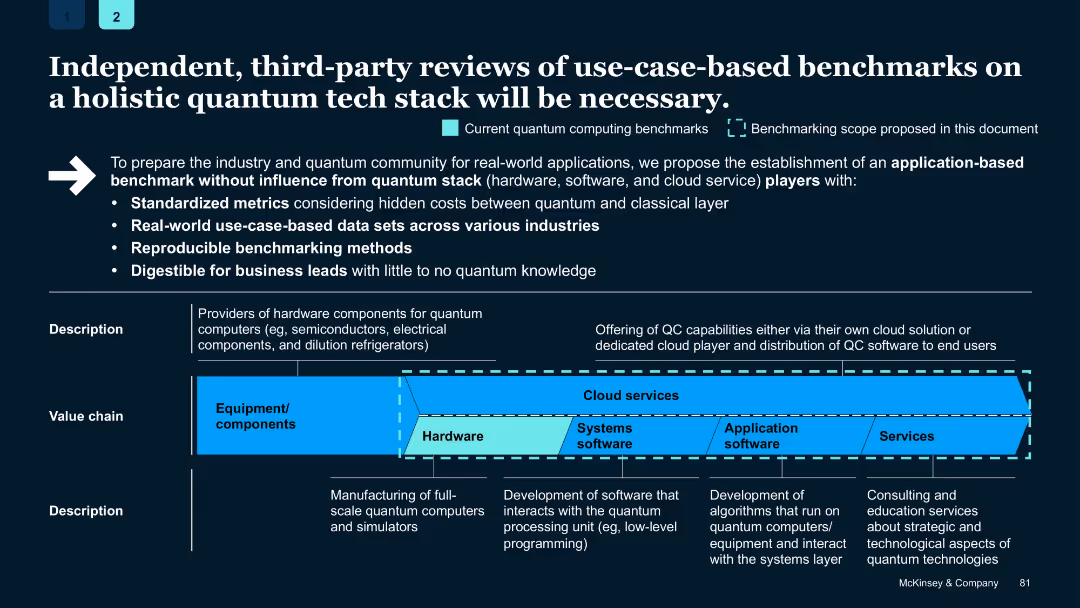
Dark-themed slide with horizontal value chain diagram, arrows and bullet points; callouts highlight benchmarking domains
Technology and Digital Transformation
Technology & Software
Emphasizes the need for unbiased, third-party benchmarking for quantum computing tech stacks using standardized metrics, reproducible methods, and real-world data to support business decisions across the stack from hardware to services.
quantum computing, benchmarking, tech stack, standardized metrics, hardware, software, cloud, third-party
false
Independent, third-party reviews of use-case-based benchmarks on a holistic quantum tech stack will be necessary.Quantum Technology Monitor
Uncategorized
McKinsey
View slide
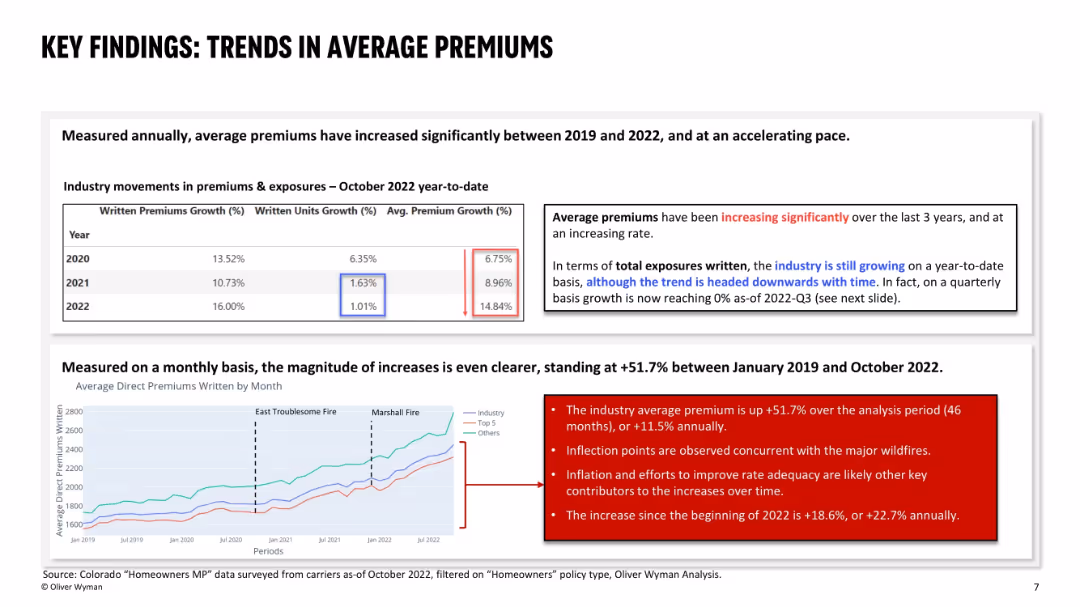
Upper section shows a yearly premium growth table; bottom section has a line chart showing monthly premium trends; highlights notable fire events and uses red callout boxes to emphasize observations.
Pricing Strategies
Financial Services
This slide analyzes significant increases in average premiums between 2019 and 2022, both annually and monthly. It links major premium spikes to wildfire events, inflation, and insurer efforts to restore rate adequacy. Premiums rose +51.7% overall in the period, with sharper increases in 2022 alone.
premium growth, rate adequacy, wildfires, inflation, pricing trends, homeowners, Colorado, insurance, premium trend analysis
false
KEY FINDINGS: TRENDS IN AVERAGE PREMIUMSHomeowner availability study
Mixed Chart
Oliver Wyman
View slide
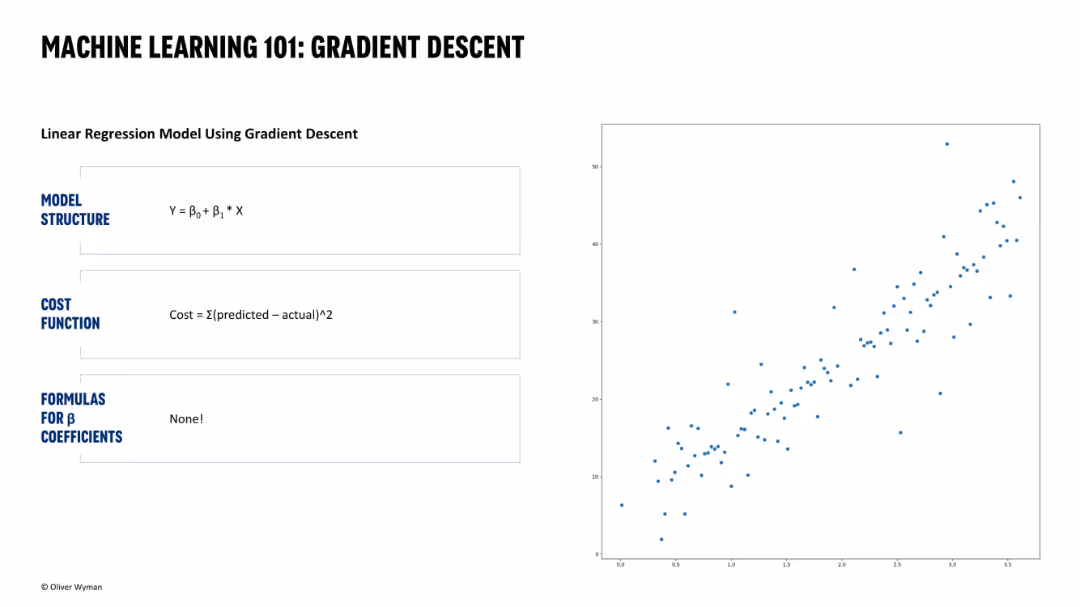
Similar layout to Slide 16331. Left panel shows model structure and cost function with "None!" under formulas. Scatter plot on the right shows data without regression line.
Technology and Digital Transformation
Artificial Intelligence
Introduces the gradient descent method for linear regression. It contrasts traditional analytical formulas by not requiring explicit coefficient formulas and visually represents raw data distribution.
gradient descent, linear regression, cost function, machine learning, no formulas, model structure, predictive analysis, data visualization, scatter plot
false
MACHINE LEARNING 101: GRADIENT DESCENTGPT-3 and the actuarial landscape
Single Chart
Oliver Wyman
View slide
Pie chart and a bar chart detailing plans for refining shared services center footprints over the next three years.
Operational Efficiency
Professional Services
Details strategies and plans for optimizing the footprint of shared services centers, highlighting cost and talent factors.
shared services, footprint refinement, pie chart, bar chart, optimization
false
How are organizations refining their SSC footprint?2023 Global Shared Services and Outsourcing Survey
Multiple Chart
Deloitte
View slide
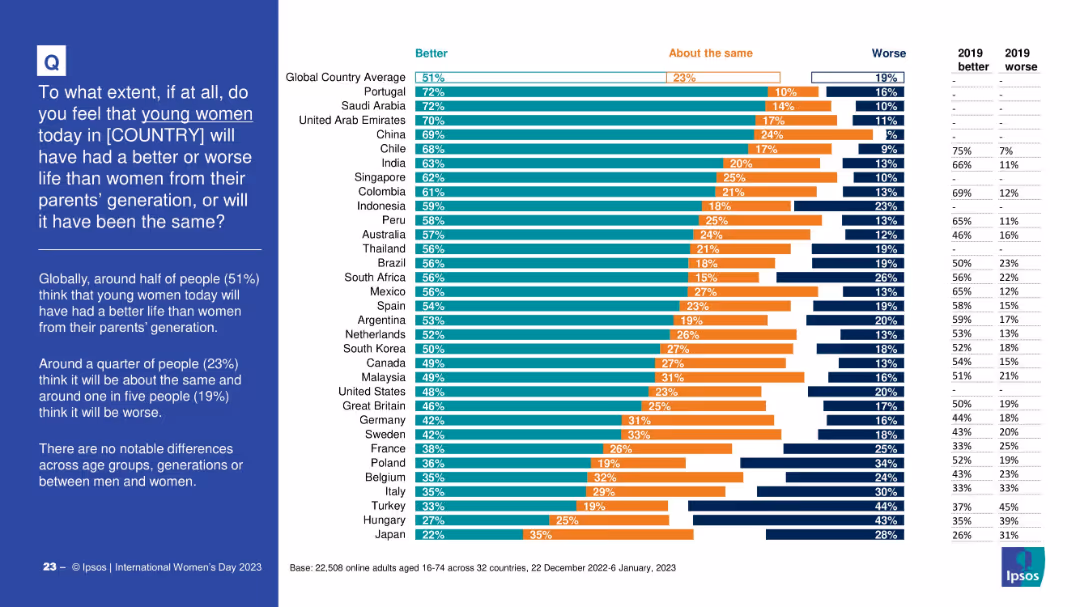
Bar chart comparing public opinion across countries on whether young women today will have a better, worse, or similar life to women from their parents’ generation. Includes three-part segmented bars per country and a data table for 2019 comparison. Left-aligned question and summary in blue box.
Market Analysis and Trends
Government & Public Sector
This slide presents global data on perceptions of how life outcomes for young women today compare to those of previous generations. It highlights that 51% globally think women’s lives will be better, with variations across countries. Historical comparison data from 2019 is included.
gender equality, generational trends, global survey, perception, young women, life improvement, societal progress, public opinion, Ipsos
false
Perceptions of Life for Young Women vs. Previous GenerationsINTERNATIONAL WOMEN'S DAY 2023
Mixed Chart
IPSOS
View slide
The slide has a list format with color-coded sections, each providing key points about the investment thesis, and a company logo in the top right corner.
Strategic Planning
Financial Services
The slide articulates a financial institution's investment thesis, highlighting the pillars of earnings, risk management, and capital allocation. It's useful for communicating the company's strategic positioning and investment potential to stakeholders or potential investors.
Investment Thesis, Earnings, Risk Management, Capital Allocation, Strategic Position, Financial Institution
false
SimpleButPowerfulInvestmentThesisMorgan Stanley - US Financials, Payments, & CRE Conference
Table
Morgan Stanley
View slide
The slide contains two column charts. The left chart shows the top countries for universities with QT research programs, and the right chart shows the number of universities offering QT master’s degrees per country.
Human Resources and Talent Management
Education & Training
This slide provides data on the growth of quantum technology education, indicating a significant increase in the number of universities offering QT master's degrees. It highlights the leading countries in QT research and education.
Universities, QT, Master's Degrees, Research, Education
false
The number of universities offering QT master’s degrees has increased to 50, a 74 percent increase since 2021.Quantum Technology Monitor
Multiple Chart
McKinsey
View slide
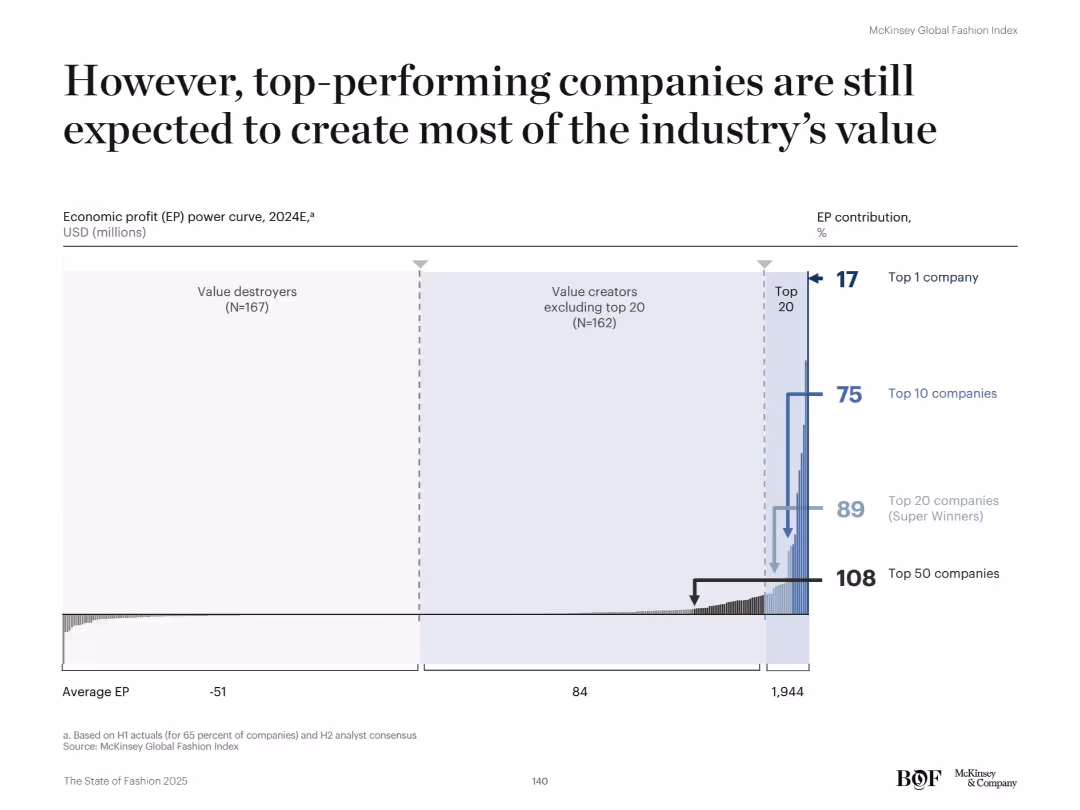
Wide bar chart resembling a power curve distribution with annotations. Horizontal layout. The chart groups companies by economic profit tiers and illustrates percentage contributions for top-performing brackets.
Financial Performance
Retail & E-commerce
Despite the narrowing EP gap, the top 20 companies (Super Winners) are still projected to deliver the majority of industry economic profit in 2024. The top 10 will account for 75% and the single top company for 17% of EP. The rest, including 167 value destroyers, generate below-average or negative EP.
super winners, economic profit, EP curve, top companies, fashion, value destroyers, retail performance
false
However, top-performing companies are still expected to create most of the industry’s valueThe State of Fashion 2025
Single Chart
McKinsey
View slide
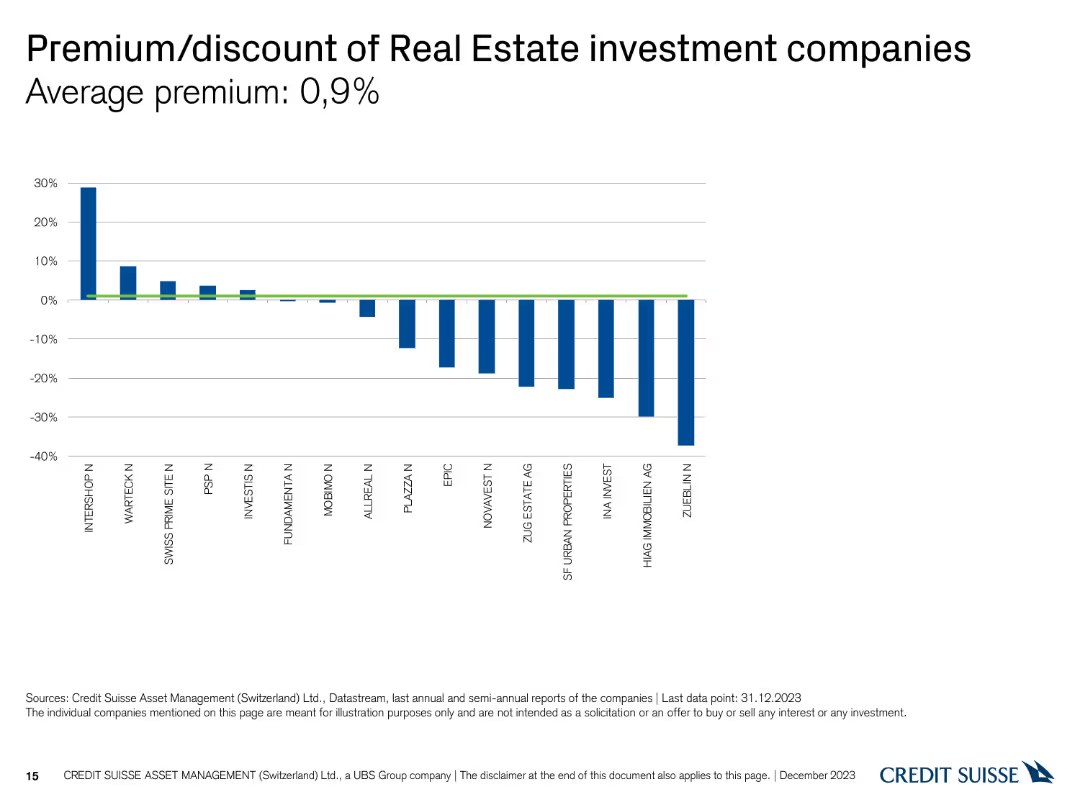
The slide has a column chart showing the premium or discount of various real estate investment companies.
Market Analysis and Trends
Real Estate & Construction
This slide compares the premium and discount percentages of different real estate investment companies, highlighting an average premium of 0.9% as of December 31, 2023.
premium, discount, real estate, investment, companies
false
Premium/discount of Real Estate investment companies Average premium: 0,9Swiss Real Estate Funds At a glance December 2023
Single Chart
Credit Suisse
View slide
Slide with column chart showing portfolio loans and a pie chart for commercial portfolio mix. The layout is clean, using contrasting colors for clarity.
Financial Performance
Financial Services
The slide presents the financial state of commercial portfolio loans, highlighting changes over quarters and the distribution of different loan types. It’s typically used for analyzing financial trends and the makeup of portfolio investments in a business setting.
Portfolio, Trends, Finance, Commercial, Analysis
false
Total commercial portfolio overviewMorgan Stanley US Financials, Payments, & CRE Conference
Multiple Chart
Morgan Stanley
View slide
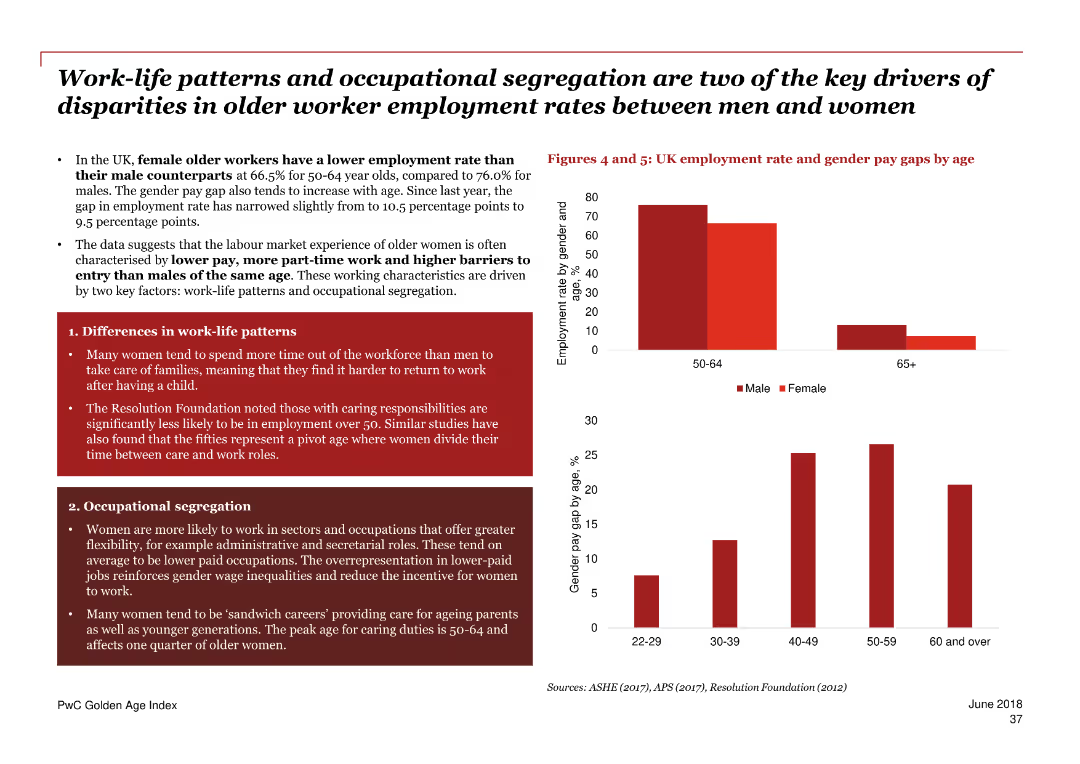
The slide contains two bar charts comparing employment rates and gender pay gaps by age group. It also includes text sections explaining the impact of work-life patterns and occupational segregation on older women’s employment.
Human Resources and Talent Management
Government & Public Sector
This slide examines the factors affecting employment rates and pay gaps for older women in the UK, focusing on work-life patterns and occupational segregation. It discusses the challenges and barriers faced by older female workers.
work-life patterns, occupational segregation, older women, UK, employment rates, gender pay gap, challenges, barriers
false
Work life patterns and occupational segregation are two of the key drivers of disparities in older worker employment rates between men and womenPwC Golden Age index Unlocking a potential $3.5 trillion prize from longer working lives
Multiple Chart
PwC/Strategy&
View slide
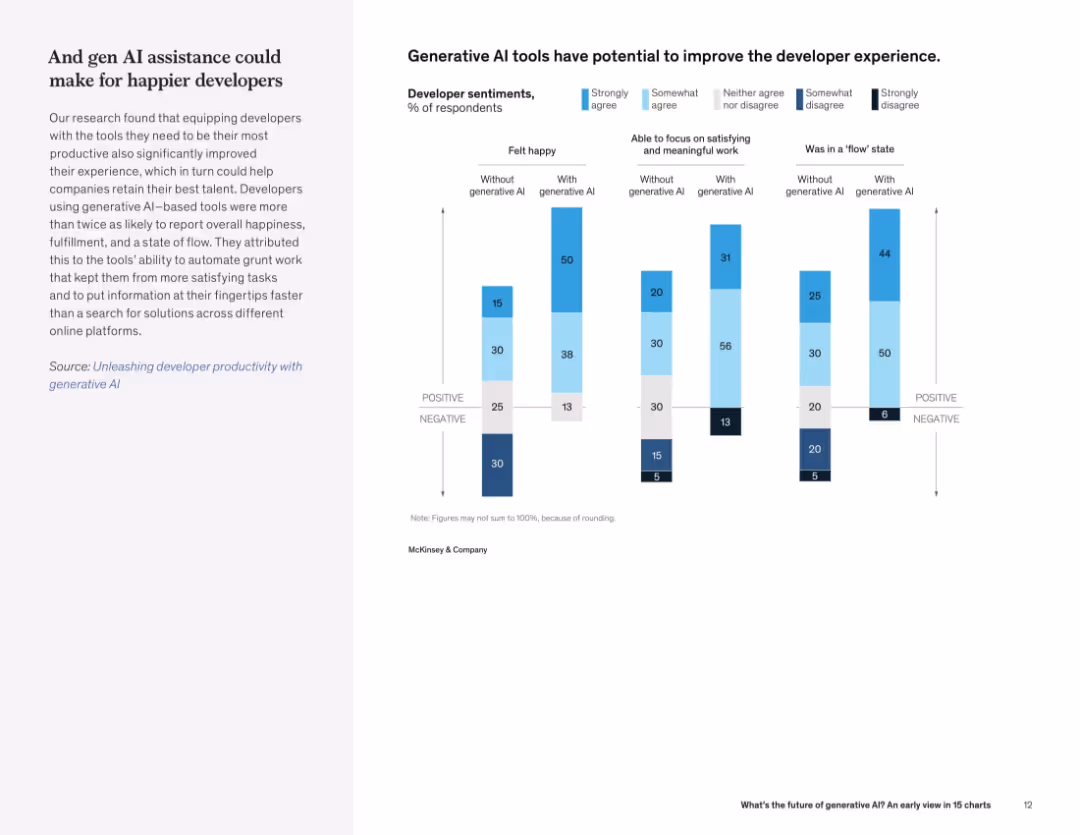
Text on left, and a grouped bar chart on right showing developer sentiment improvements (e.g., happiness, focus, flow state) with and without generative AI.
Human Resources and Talent Management
Technology & Software
Developers using generative AI tools report higher levels of happiness, focus, and "flow" compared to those who don’t. The data highlights gen AI’s potential to enhance the developer experience.
developer experience, generative AI, productivity, flow state, job satisfaction, retention
false
Generative AI tools have potential to improve the developer experienceWhat’s the future of generative AI? An early view in 15 charts
Mixed Chart
McKinsey
View slide
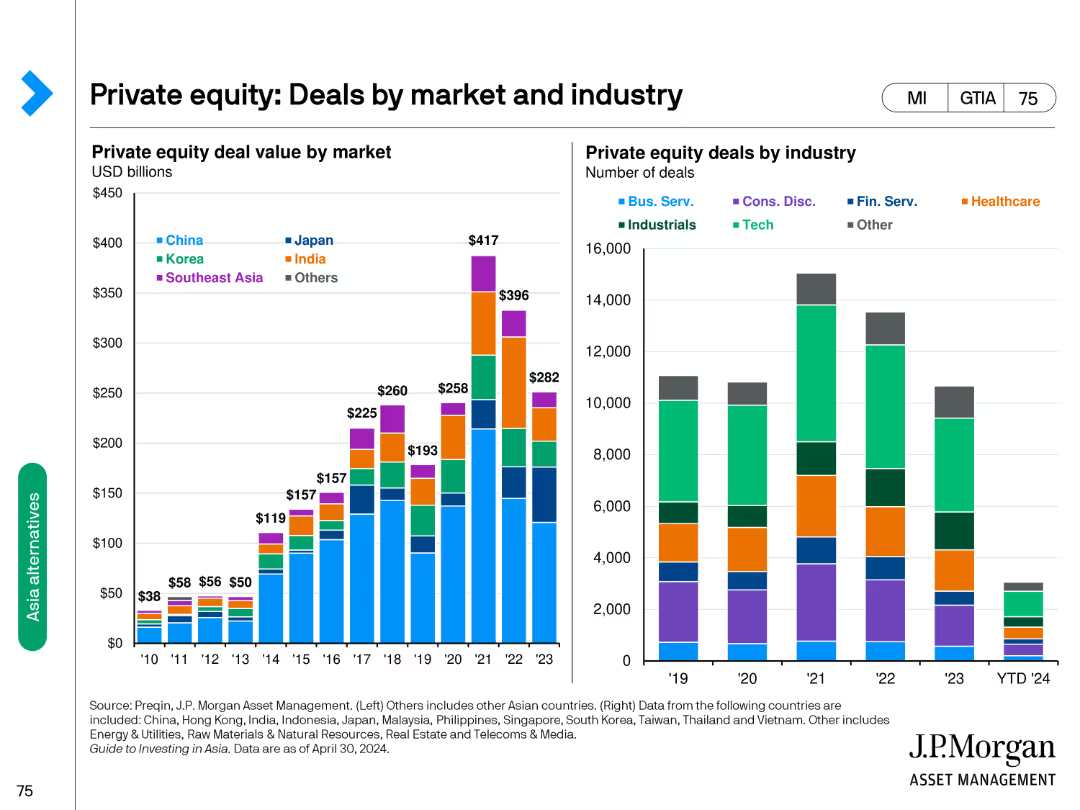
Contains column charts showing private equity deal value by market and industry, indicating variations across different regions and sectors.
Market Analysis and Trends
Financial Services
Presents private equity deal values in billions and the number of deals categorized by industry, highlighting market and industry distributions.
private equity, deals, market, industry, value
false
Private equity: Deals by market and industryGuide to Investing in Asia
Multiple Chart
JP Morgan
View slide
Uses consistent layout; left-side statement and right-side bar graph with yearly data comparison.
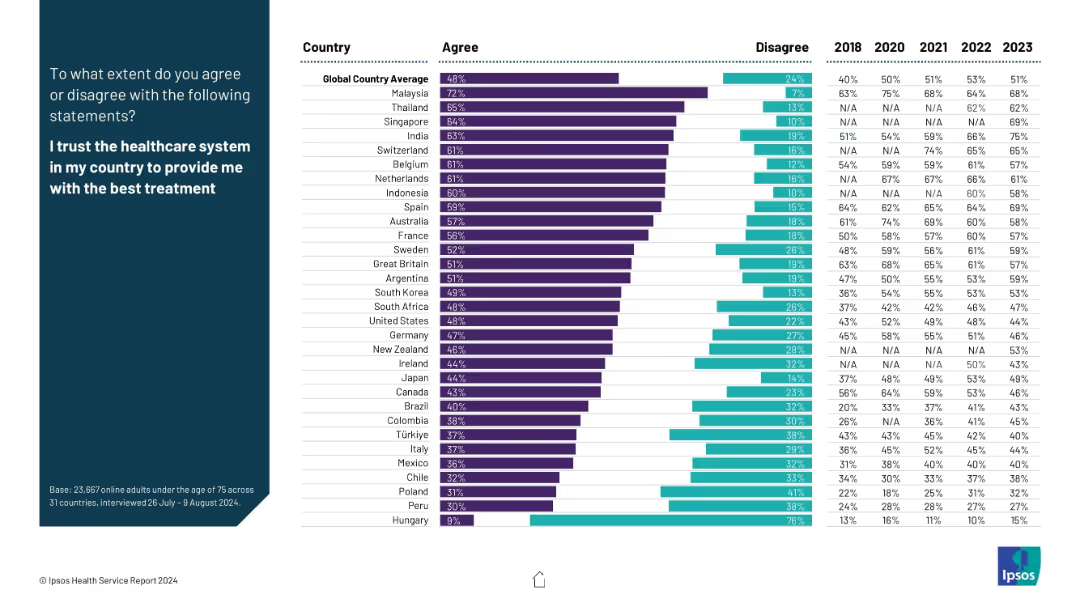
Market Analysis and Trends
Healthcare & Pharmaceuticals
The slide reveals trust levels in national healthcare systems, as measured by public agreement with a statement on receiving the best treatment. Cross-national data and temporal trends are presented, useful for gauging systemic trust globally.
healthcare trust, treatment quality, public sentiment, global comparison, Ipsos, survey, healthcare systems, perception
false
I trust the healthcare system in my country to provide me with the best treatmentIPSOS HEALTH SERVICE REPORT 2024
Mixed Chart
IPSOS
View slide
The slide has a dark background with a highlighted yellow text box containing a quote. It includes a question and four circular charts with percentages showing responses.
Technology and Digital Transformation
Healthcare & Pharmaceuticals
The slide discusses Australian consumers' openness to personalized medicine, genetic testing, and non-urgent care in retail locations, using wearables, and sensors.
Technology-enhanced care, personalized medicine, genetic testing, wearables, Australia
false
‘I am open to technology enhanced care for more personalized care and better health care experiences.’Health care consumer views on value
Mixed Chart
EY
View slide
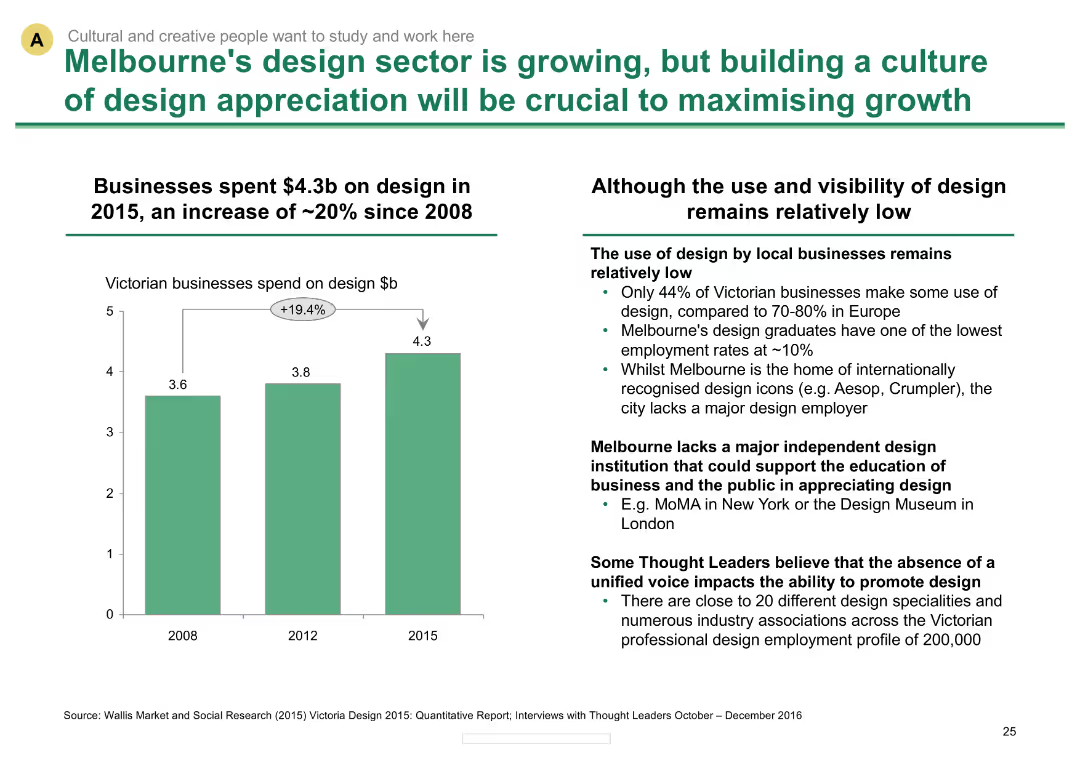
Column chart showing growth in design spending; text describing challenges in design sector visibility
Market Analysis and Trends
Industrial & Manufacturing
Analyzes growth in Melbourne's design sector and challenges in increasing design appreciation among businesses
Design sector growth, business spending, design challenges, Melbourne, industry trends
false
Melbourne's design sector is growing, but building a culture of design appreciation will be crucial to maximising growthMelbourne as a Global Cultural Destination
Mixed Chart
BCG
View slide
The slide uses a central circular graphic to show the firm's sustainable finance group structure, accompanied by lists of service offerings on either side.
Strategic Planning
Financial Services
Showcases the company's strategic approach to sustainability in finance, detailing services such as client advisory, risk management, and ESG product development, illustrating the company's commitment to integrating sustainable practices with client services.
Sustainability, Finance, Strategic Planning, Client Advisory, Risk Management, ESG
false
Our Approach: ClientsSustainability: Our Issuance Framework
Framework
Goldman Sachs
View slide
Features complex pie charts detailing the composition of the deposit base across different banking segments.
Financial Performance
Financial Services
Reviews the stability and diversification of the bank's deposit portfolio, emphasizing strong positions in key market segments.
deposits, diversification, finance, stability, banking, market segments
false
Stable and well diversified deposit portfolioQ4 / FY 2023 Fixed Income Investor Conference Call
Multiple Chart
Deutsche Bank
View slide
A three-column comparison of optical fiber, LPWAN, Wi-Fi 6, and 5G/6G cellular, contrasting current and previous generations.
Technology and Digital Transformation
Technology & Software
This slide compares current advanced connectivity technologies with previous generations, highlighting the advancements.
Connectivity, Optical Fiber, LPWAN, Wi-Fi 6, 5G, 6G, Technology Comparison
false
Why are advanced-connectivity technologies interesting, compared with what already exists?McKinsey Technology Trends Outlook 2022 Advanced Connectivity
Header Vertical
McKinsey
1
...
Next
Load More
Hold On!
We are searching in our database
If nothing, comes up, please try different filters!
Create a FREE account to continue browsing
Receive Instant Access to 1,000+ slides from companies like McKinsey, Google, and Goldman Sachs
First Name
Last Name
Email
Password
I agree to all
Terms & Privacy Policy
Thank you! Your submission has been received!
Oops! Something went wrong while submitting the form.
Have an account?
Sign in
Column Chart
Heatmap
Chevron
Org Chart
Infographic
Callouts
Timeline
List
Graphic
Picture
Process Flow
Diagram
Paragraph
Map
Table
Framework
Subtitle
Takeaway Box
Icon
Other Chart
Radar Chart
Waterfall Chart
Mekko Chart
Pie Chart
Scatter Plot
Line Chart
Bar chart
Bullet points