My Account
My Slides
Leave Feedback
Login
Logout
Get Started
Browse all Slides
Browse Slides Pro
Create a FREE Account
Instant access to 1,000+ real slides from top companies like McKinsey, BCG, Goldman Sachs, Google and many more!
First Name
Last Name
Email
Password
I agree to all
Terms & Privacy Policy
Thank you! Your submission has been received!
Oops! Something went wrong while submitting the form.
Have an account?
Sign in
Instant access to the internet's best slides
Get access to 40+ advanced filters and more
Advanced Search and Filters
Access to
8,000+ slides
Access to Category Pages
Save/Bookmark Slides
PowerPoint Template Library (Coming Soon)
Choose your plan
MONTHLY
$12/month
Billed every month, cancel anytime.
YEARLY
$9/month
Billed $108 annually, cancel anytime.
Checkout for $12/month
Checkout for $108/yr
Secured by Stripe | AES-256 bit encryption
Welcome,
Welcome
Upgrade to SlideStart
Pro
Instant access to 8,000+ slides
Show Featured Only
Checkbox 8
Companies
Mckinsey
Bain
BCG
EY
Deloitte
Accenture
PwC/Strategy&
JP Morgan
Goldman Sachs
Morgan Stanley
Citigroup
Deutsche Bank
Barclays
LEK
Kearney
Oliver Wyman
Booz Allen Hamilton
Gartner
IPSOS
Nielsen
Slide type
Header Horizontal
Framework
Vertical Flow
Single Chart
Single Chart
Text Only
Mixed Chart
Header Vertical
Graphic
Pillar
Multiple Chart
Agenda
Title
Table
Linear Flow
Upgrade to SlideStart
Pro
Instant access to 40+ advanced filters
Industry
Upgrade to SlideStart
Pro
Instant access to 40+ advanced filters
Technology
Healthcare
Financial Services
Consumer Goods
Energy & Utilities
Manufacturing
Retail
E-commerce
Logistics
Telecommunications
Real Estate
Professional Services
Education
Media
Entertainment
Hospitatlity
Tourism
Agriculture
Food Production
Government & Public Sector
Environmental
Sustainability
Use Case
Upgrade to SlideStart
Pro
Instant access to 40+ advanced filters
Sales and Business Development
Mergers and Acquisitions
Corporate Finance and Valuation
Performance Metrics and KPIs
Client Case Studies
Competitive Landscape
Product and Service Analysis
Customer and Market Segmentation
Organizational Structure
Human Resources and Talent Management
Industry Overview
Regulatory and Compliance
Risk Assessment and Management
Agriculture & Food Production
Hospitality and Tourism
Government
Environmental
Sustainability
Clear all
Thank you! Your submission has been received!
Oops! Something went wrong while submitting the form.
Show Featured Only
Checkbox 8
Companies
Mckinsey
Bain
BCG
EY
Deloitte
Accenture
PwC/Strategy&
JP Morgan
Goldman Sachs
Morgan Stanley
Citigroup
Deutsche Bank
Barclays
LEK
Kearney
Oliver Wyman
Booz Allen Hamilton
Gartner
IPSOS
Nielsen
Slide type
Text Only
Linear Flow
Vertical Flow
Single Chart
Header Horizontal
Mixed Chart
Header Vertical
Pillar
Multiple Chart
Graphic
Agenda
Title
Table
Framework
Industry
Technology
Healthcare
Financial Services
Consumer Goods
Energy & Utilities
Manufacturing
Retail
E-commerce
Logistics
Telecommunications
Real Estate
Professional Services
Education
Media
Entertainment
Hospitatlity
Tourism
Agriculture
Food Production
Government & Public Sector
Environmental
Sustainability
Use Case
Sales and Business Development
Mergers and Acquisitions
Corporate Finance and Valuation
Performance Metrics and KPIs
Client Case Studies
Competitive Landscape
Product and Service Analysis
Customer and Market Segmentation
Organizational Structure
Human Resources and Talent Management
Industry Overview
Regulatory and Compliance
Risk Assessment and Management
Agriculture & Food Production
Hospitality and Tourism
Government
Environmental
Sustainability
Clear all
Thank you! Your submission has been received!
Oops! Something went wrong while submitting the form.
Tag
View slide
Red line and bar graph against a white background, showing China's cases per day and total reported cases, with key event markers.
Risk Assessment and Management
Healthcare & Pharmaceuticals
Outlines China's response to COVID-19 with lockdowns and testing, highlighting the timeline of cases and government actions.
China, lockdowns, testing, COVID-19, government response
false
China: Rapid lockdowns were employed to manage outbreak before ramping up testing and response capabilitiesCOVID-19: Briefing Note
Single Chart
McKinsey
View slide
Features multiple line graphs showing mobility trends in different sectors across various countries.
Strategic Planning
Transportation & Logistics
Analyzes recovery in mobility across sectors like retail and public transit post-COVID-19, comparing several countries to highlight varying speeds of economic recovery.
mobility, retail, public transit, trends
false
Retail and recreation mobility recovered fastest; public transit mobility remains lower in most countriesWhat the Evolution of Travel Means for Business
Multiple Chart
BCG
View slide
The slide contains multiple charts: column charts for profit before tax, operating income, cost/income ratio, mandate volume, loans, and invested assets.
Financial Performance
Financial Services
The slide presents various financial metrics for Global Wealth Management, comparing data from multiple quarters to 1Q20.
wealth management, profit, operating income, cost ratio, loans
false
Global Wealth Management Profit before taxFirst quarter 2020 results
Multiple Chart
UBS
View slide
The slide features a series of scatter plots representing contracting activity for different types of drilling units in various environments. Each plot is labeled and uses differently sized bubbles to indicate contract duration, with trend lines showing rate changes over time. The design is minimalistic but effective, with clear labels and a legend explaining the symbols used. The visual hierarchy is well managed to guide the viewer through the data.
Market Analysis and Trends
Energy & Utilities
This slide analyzes contracting activity within the oil drilling sector, specifically looking at day rates and contract durations for harsh and benign environment floaters, as well as premium jack-ups. It's designed to help stakeholders understand market conditions and the profitability of deploying specific drilling units under current economic conditions. This data is crucial for strategic decisions regarding fleet deployment and investment in new technologies or markets.
contracting activity, drilling units, scatter plots, market analysis, day rates, trend analysis, oil drilling, environment, profitability, strategic decisions
false
…and this is reflected in increased contracting activitySeadrill Investor Presentation Barclays CEO Energy & Power Conference, New York
Multiple Chart
Barclays
View slide
Sequential column charts showing the growth in pretax pre-provision earnings over different quarters.
Financial Performance
Financial Services
Reviews the growth in pretax earnings over time, highlighting effective financial management and earnings stability.
Earnings, Growth, Finance, Stability
false
Pretax Pre-Provision EarningsBread Financial: Barclays Global Financial Services Conference
Single Chart
Barclays
View slide
Contains comparative column charts showing advisory and underwriting share of wallet, APAC IBCM gross revenues, and key differentiators.
Competitive Landscape
Financial Services
The slide highlights the competitive strengths of the Credit Suisse APAC IBCM franchise, including market share, revenue growth, and key differentiators in the region.
APAC IBCM, Competitive Strengths, Market Share, Revenue Growth, Differentiators
false
Top Credit Suisse APAC IBCM franchiseCredit Suisse Investor Day 2019 An effective approach: 3 case studies
Multiple Chart
Credit Suisse
View slide
Presents a column chart comparing the average weekly study hours of students in Nigerian public schools to those in various other countries, highlighting the educational challenges in Nigeria.
Strategic Planning
Education & Training
Analyzes the limitations in study hours faced by students in Nigerian public schools due to inadequate power supply, using international benchmarks to underscore the need for infrastructural improvements like solar power installations.
education, Nigeria, study hours, international comparison, public schools, power supply, benchmarks
false
Study hours: Limited power supply is a major constraint to study time of boarding students, as several public boarding schools lack electricity accessSocio-economic case for deepening solar PV deployment in Nigeria
Multiple Chart
BCG
View slide
Consists of a gradient green scale illustrating levels of digital marketing maturity from Nascent to Multi-moment. The layout is straightforward with circular nodes and connecting lines.
Market Analysis and Trends
Media & Entertainment
This slide assesses various brands on their digital marketing maturity, categorizing them from nascent to multi-moment stages. It highlights the progression and maturity in digital marketing practices among brands, useful for understanding market positions and planning marketing strategies.
digital marketing, brand assessment, maturity scale, nascent, multi-moment, marketing strategies, market analysis, progression, technology, engagement
false
Brands were assessed based on their level of digital marketing maturityUnderstanding the path to digital marketing maturity
Linear Flow
BCG
View slide
Column chart displaying the percentage of respondents agreeing they need to do more about physical health, with countries sorted from highest to lowest agreement.
Customer and Market Segmentation
Healthcare & Pharmaceuticals
Illustrates the global drive to improve physical health, showing agreement levels across countries. Nigeria has the highest agreement, while Netherlands has the lowest.
physical health, global, agreement, survey, improvement
false
The drive to do more about our physical health is strong across all marketsA NEW WORLD DISORDER?
Multiple Chart
IPSOS
View slide
Illustrative graph depicting potential economic recovery scenarios post-COVID-19, categorized as "Flatten," "Fight," and "Future."
Strategic Planning
Professional Services
Outlines possible economic impacts and recovery paths under different COVID-19 management scenarios, highlighting critical decision points for businesses and governments.
COVID-19, scenarios, economic impact, recovery, management, flatten, fight, future, decision making
false
Scenarios and potential outcomes driven by five key questionsFacts, scenarios, and actions for leaders Publication #3 with a focus on Emerging Stronger from the Crisis
Mixed Chart
BCG
View slide
This slide presents a horizontal bar chart detailing the high-end levelized cost components for various renewable and conventional energy technologies, including capital, fixed O&M, variable O&M, and fuel costs.
Operational Efficiency
Energy & Utilities
The slide analyzes the high-end levelized cost components for different energy sources, emphasizing the cost structures and potential areas for reducing overall costs in renewable and conventional energy generation.
LCOE Components, High-End Cost, Energy Efficiency, Cost Breakdown, Renewable Energy
false
Levelized Cost of Energy Components—High EndLazards Lcoeplus
Single Chart
Roland Berger
View slide
Features pie charts, percentage callouts, and bullet points emphasizing the focus of high-tech leaders on as-a-service models for growth.
Investment Analysis
Technology & Software
Highlights the strategic focus of high-tech leaders on as-a-service for scaling businesses and the priorities of C-suite executives.
high-tech, as-a-service, leadership, C-suite, strategy, scaling
false
Leaders are betting on as-a-service to deliverTransforming the Industry that transformed the World: 01 Shift to as-a-serice
Multiple Chart
Accenture
View slide
A combination of bar graphs and statistical data showcasing usage intent, media frequency, and adoption rates across various digital services.
Market Analysis and Trends
Technology & Software
This slide offers a quantitative glimpse into the behaviors of digital consumers in the Philippines, with implications for targeted marketing and service design.
digital consumers, Philippines, media usage, market analysis, adoption rates, services
false
Philippines: Digital consumers in numberse-Conomy SEA 2022 Through the waves, towards a sea of opportunity
Multiple Chart
Bain
View slide
Slide contains a column chart with textual annotations. Layout includes key financial metrics over time.
Financial Performance
Financial Services
Overview of cost efficiencies and projected savings in various areas for a financial institution from 2023 to 2026.
cost, efficiency, 2026, savings, financial
false
Costs: c.£2bn cost efficiency by 2026FY 2023 Results Announcement
Mixed Chart
Barclays
View slide
Color-coded table showing asset class returns, sortable by year. Dense with data.
Market Analysis and Trends
Financial Services
Overview of asset class returns over years, useful for historical performance analysis and strategy development.
Asset Classes, Returns, Color-coded Table, Historical Performance, Strategy Development, Dense Data, Morgan Stanley, Market Monitor
false
Major Asset Class Return Analysis (%)Monthly Market Monitor January 2024
Table
Morgan Stanley
View slide
Contains text boxes with bullet points highlighting different factors contributing to the business model and barriers.
Strategic Planning
Education & Training
Explains various barriers to entry and elements of the business model that enhance the attractiveness of private K-12.
barriers, business model, K-12, private, strategy
false
The attractiveness of private K-12 is underpinned by secular growth drivers (2/2)Good as Gold: Resilience and Continued Attractiveness of the Global K-12 Sector
Multiple Chart
LEK
View slide
The slide shows a column chart listing the top issues facing Canada, with a focus on housing.
Market Analysis and Trends
Real Estate & Construction
It highlights the top concerns in Ontario at the end of 2020, with housing affordability and availability as significant issues.
Top issues, Canada, housing, affordability, availability, Ontario, concerns, 2020, coronavirus, economy
false
Top Issues at End of 2020 (Ontario)Market Year in Review and Outlook 2021
Single Chart
IPSOS
View slide
Two pie charts: one showing the percentage of people who borrowed money to buy investments, and another showing if they did so based on advisor recommendations.
Financial Performance
Financial Services
Highlights the percentage of investors who borrowed money to buy investments before or during the pandemic, and the influence of financial advisors on this decision.
borrowed money, investments, advisor, pandemic
false
Borrowed Money to Buy InvestmentsINVESTING AND THE COVID-19 PANDEMIC
Multiple Chart
IPSOS
View slide
Two-column layout with a bar chart showing operating expenses over time and text describing cost structure changes, including immediate exit rate savings and defragmentation strategies.
Operational Efficiency
Financial Services
This slide explains the cost structure transition from a federated to a centralized model, highlighting operating expense reductions and strategies for immediate savings and defragmentation.
cost, structure, transition, centralized, savings
false
Our cost structure reflects the period of transition from a federated to a centralized modelInvestor Deep Dive 2022
Mixed Chart
Credit Suisse
View slide
This slide features a combination of a line chart showing a 12-month share price trend and a data table with corporate information. The layout is clear with a concise display of financial data.
Financial Performance
Financial Services
The slide provides a snapshot of the company's financial status as of December 2018, including stock price, market capitalization, and share distribution. It serves as a financial overview for stakeholders.
financials, mining, share price, market capitalization, shareholders, company snapshot
false
Company Snapshot As at 31 December 2018IMDEX Presentation Morgan Stanley Conference
Mixed Chart
Morgan Stanley
View slide
Textual analysis with bullet points detailing the characteristics, demographics, and behaviors of crypto owners.
Customer and Market Segmentation
Financial Services
Provides a detailed profile of crypto asset owners, including their financial literacy, demographics, and behaviors. Emphasizes market segmentation and targeted advertising.
Crypto, Market Segmentation, Financial Literacy, Demographics, Advertising
false
Profile of Crypto OwnersCRYPTO ASSET SURVEY 2023
Mixed Chart
IPSOS
View slide
Depicts column charts with percentages showing purchase cancellations by income level in various regions.
Market Analysis and Trends
Transportation & Logistics
Studies the impact of income on the likelihood of maintaining or cancelling car purchase plans during the pandemic.
income effect, purchase decisions, market behavior
false
Across markets, higher-income households seem less likely to revise their initial purchase intentCOVID-19 Auto & Mobility Consumer Insights
Multiple Chart
McKinsey
View slide
The slide features comparative visuals of traditional and edge cloud computing models. Graphical elements and color coding effectively delineate different computational approaches against a dark theme.
Technology and Digital Transformation
Technology & Software
The slide provides a clear and concise comparison between traditional cloud and edge computing. It highlights the benefits of edge computing in reducing data transmission delays and costs while offering a more relevant set of data for businesses to comply with data residency laws.
Cloud Computing, Edge Computing, Data Transmission
false
What distinguishes edge computing from traditional cloud?McKinsey Technology Trends Outlook 2022 Cloud and edge computing
Diagram
McKinsey
View slide
A column chart illustrating the percentage of respondents across different countries who cite high fuel prices as a key motivator for purchasing an EV. The global average is highlighted.
Market Analysis and Trends
Transportation & Logistics
The slide shows how high fuel/oil/gas prices drive consumers to adopt electric vehicles, with data from multiple countries compared to the global average.
EV adoption, fuel prices, consumer motivation, country comparison
false
High fuel/oil/gas prices have become a significant driving force for EV adoption among consumersEY Mobility Consumer Index (MCI) 2023 study
Single Chart
EY
View slide
The slide presents a column chart with four vertical bars depicting revenue growth over time, from 2017 to a long-term target. The bars are segmented into two parts indicating different revenue sources. To the right, there are three text boxes with additional insights into revenue trends.
Market Analysis and Trends
Financial Services
This slide discusses the growth in recurring revenues, with a focus on management services and revenue goals. It details revenue increases over years, comparison with industry averages, and growth strategy. It’s useful for financial analysts and investors to understand company performance and strategic positioning.
Recurring Revenues, Growth, Management Services, Strategic Goals, CAGR, Competitor Analysis
false
Targeting Continued Strong Growth in Recurring RevenuesFixed Income Investor Presentation for Goldman Sachs Annual Leveraged Finance & Credit Conference
Mixed Chart
Goldman Sachs
View slide
Slide with text on the left, multiple tables on the right, showing current and projected AI usage percentages
Technology and Digital Transformation
Financial Services
Examines the impact of AI on customer service in wealth management, forecasting significant adoption in coming years.
AI, customer service, wealth management, investment, advisory, performance analysis
false
AI will transform customer serviceBuilding a Future-Ready Investment Firm
Table
Deloitte
View slide
Horizontal axis graph depicting stages of value capture and creation with interconnections shown between various operational elements.
Operational Efficiency
Professional Services
Discusses how to effectively operationalize synergies in a business integration context, emphasizing quick wins and long-term value projects.
synergies, operational efficiency, business, integration, value creation, projects
false
Operationalize the synergiesHow to gain value from M&A
Mixed Chart
Deloitte
View slide
Split layout with text and bullet points detailing vaccine efficacy scenarios, complemented by quotes and regulatory considerations.
Regulatory and Compliance
Healthcare & Pharmaceuticals
Discusses the implications of different COVID-19 vaccine efficacy rates on public health strategy and vaccine adoption policies.
efficacy, vaccine, COVID-19, health policy
false
Vaccine efficacy expected to impact demand dynamics & healthcare response prioritiesVaccines & Therapeutics Outlook Part I: Timelines and Success Factors
Header Vertical
BCG
View slide
Data-heavy slide with bar graphs and charts showing daily cases, growth of daily new cases, recovery rates, and testing data for the top 15 economies by GDP.
Risk Assessment and Management
Government & Public Sector
Presents detailed COVID-19 case numbers, recovery rates, and testing data for major economies, highlighting the disparity in pandemic management.
COVID-19, Economy, Recovery, Testing, GDP, Pandemic Management
false
De-averaged view | 9 of top 15 economies show increasing daily case numbers; recovery rate of 75+% for 7 economiesCOVID-19 BCG Perspectives Series Global Restart: Key Dynamics
Multiple Chart
BCG
View slide
Includes two bar charts detailing the share of podcast advertising revenue by placement (pre-roll, mid-roll, post-roll) from 2019 to 2020.
Market Analysis and Trends
Media & Entertainment
Discusses revenue distribution by ad placement in podcasts, with mid-roll placements remaining predominant.
podcast advertising, ad placements, mid-roll, revenue share, 2019-2020
false
Mid-roll placements continued to account for three-fourths of revenuesU.S. Podcast Advertising Revenue Study
Single Chart
PwC/Strategy&
View slide
Line graph and forecasts showing quarterly luxury goods market trends in 2020 with scenario analysis for Q4 outcomes.
Market Analysis and Trends
Consumer Goods
Forecasts the Q4 luxury goods market performance for 2020 with scenario analysis and key drivers affecting the market.
luxury goods, market forecast, 2020, Q4 predictions, market trends
false
After Q2, the worst quarter ever for luxury market, and good signs of recovery in Q3, uncertainty is still the keyword for holiday seasonBAIN-ALTAGAMMA 2020 WORLDWIDE LUXURY MARKET MONITOR
Mixed Chart
Bain
View slide
Includes flow chart, bold text for emphasis.
Market Analysis and Trends
Retail & E-commerce
Insights into personalized luxury shopping experiences.
UHNWI, personalized, luxury, digital, VIP
false
UHNWIs LOOKING FOR “WHAT MONEY CANNOT BUY”, BEYOND PRODUCTS: CUSTOMER NETWORK AS THE NEW MEASURE OF VALUEBAIN-ALTAGAMMA 2019 WORLDWIDE LUXURY MARKET MONITOR
Linear Flow
Bain
View slide
Bar graph showcasing job vulnerability across different occupational categories with color coding based on median annual wage.
Risk Assessment and Management
Professional Services
Analyzes the vulnerability of various jobs during the COVID-19 crisis, highlighting those at higher risk.
jobs, vulnerability, COVID-19, occupational categories, risk assessment
false
There may be an estimated $57 million vulnerable jobs due to the crisis concentrated in food service, customer service, and production workResponding to COVID-19: Addressing the economic impact of the crisis
Single Chart
McKinsey
View slide
Column chart showing negative to positive impacts of EU politics on US investments in France, accompanied by authoritative quotes.
Strategic Planning
Government & Public Sector
Discusses the investment climate in France influenced by European political uncertainties and the strategies suggested by experts.
EU politics, US investments, France, political uncertainties, Merkel, Italian budget
false
Uncertainties over Europe highly concern respondentsAmCham – Bain Barometer 19th Edition
Mixed Chart
Bain
View slide
The slide shows a balance sheet summary with column chart for assets and liabilities, emphasizing different categories with color coding. Key highlights offer insights into the balance sheet management strategies.
Operational Efficiency
Financial Services
This slide outlines the structure of a conservatively managed balance sheet, highlighting key asset and liability segments and their implications for financial stability and growth strategies. It underscores the importance of conservative financial management practices.
balance sheet, assets, liabilities, financial, management
false
Conservatively managed balance sheet Net1 in € bn, as of September 30, 2023Q3 2023 Fixed Income Investor Conference Call
Multiple Chart
Deutsche Bank
View slide
Moderate visual complexity, this slide uses iconography to represent the drivers behind the development and adoption of Emissions Management Systems (EMS). It is text-light but the icons are accompanied by concise bullet points that explain each driver in detail.
Technology and Digital Transformation
Industrial & Manufacturing
The slide focuses on the drivers stimulating the development of sophisticated Emissions Management Systems in process industries. It points out the significant contributions of these industries to greenhouse gas emissions and the resultant demand for EMS to reduce environmental impacts while ensuring compliance with stringent governmental regulations.
Emissions Management, Environmental sustainability, Regulatory compliance, EMS drivers
false
Process industries significantly contribute to greenhouse gas emissions, which are driving / stimulating development of sophisticated Emissions Management Systems (EMS)Process Automation: A quickly growing market with structural tailwinds and investment opportunities
Pillar
LEK
View slide
This slide features a circular diagram divided into various sectors representing strategic business directions, surrounded by four case studies positioned in each quadrant, each with a logo, a short description, and associated strategic goals.
Strategic Planning
Consumer Goods
The slide showcases how four companies (CHR Hansen, Arla, Faerch, Carlsberg) leverage strategic directions to create business value from sustainable development goals (SDGs). Each quadrant emphasizes a different strategy such as diversity and inclusion, CSR due diligence, product development sustainability, and minimizing carbon footprint.
Sustainability, CSR, Diversity, Product Development, Carbon Footprint
false
4 company cases show how business value can be derived from the SDGs by pursuing different strategic directions 1SDG Guide for Business Leaders
Diagram
McKinsey
View slide
Vertical bar chart displaying investment priorities in digital marketing areas such as AI, customer relationship management, and analytics.
Customer and Market Segmentation
Retail & E-commerce
Highlights the strong focus on digital marketing investments in areas critical to enhancing consumer engagement and data analysis capabilities.
digital marketing, investment, AI, customer relationship, analytics, strategic planning, consumer engagement, data analysis
false
Majority are investing in digital marketing…2022 retail industry outlook
Single Chart
Deloitte
View slide
The slide is split into two columns and one row with a dominant red color scheme. It features multiple boxes with rounded corners, each containing icons and brief texts describing different elements such as 'Our environment,' 'Why,' 'What,' 'How,' 'Services & impact.' There is also a use of pie charts.
Industry Overview
Professional Services
This slide details PwC's value creation through its business model and practices. It discusses the company's environmental considerations, purpose, vision, transformation process, and the impact of services in areas like assurance, tax, and advisory. It is suitable for explaining PwC's strategic approach and its relevance to stakeholders.
value creation, business model, services, impact, strategy
false
How we create value Our environment2017-2018 PwC Annual Report
Linear Flow
PwC/Strategy&
View slide
This slide features a split layout with a large orange header. The left side contains a textual explanation in white text on a black background. The right side displays a pie chart and a bar chart comparing data on worker empowerment.
Market Analysis and Trends
Education & Training
This slide explores the empowerment of workers with specialized skills. It compares workers who have specialized training to those who do not, across several metrics such as promotions, raises, and job satisfaction. The data is sourced from PwC's Global Workforce Hopes and Fears Survey 2022.
empowerment, skills, training, job satisfaction, promotions
false
Workers with specialised skills also feel more empoweredGlobal Workforce Hopes and Fears Survey 2022
Multiple Chart
PwC/Strategy&
View slide
The slide presents a timeline from 1991 to 2018, showing key milestones in renewable and heavy lifting sectors, accompanied by icons like wind turbines and gears, which add context to each entry.
Industry Overview
Energy & Utilities
The slide outlines the company's history and growth in the renewables sector, highlighting major projects and acquisitions, aiming to establish credibility and experience in the industry.
renewables, timeline, growth, projects, acquisitions
false
Renewables and Heavy LiftingBarclays CEO Energy-Power Conference 2019
Linear Flow
Barclays
View slide
This introductory slide features a circular diagram with four segments around a central label 'Clients', designed with shades of blue and black. Brief texts accompany icons symbolizing trust, client-centricity, and global reach.
Organizational Structure and Change
Financial Services
Introduces the company's focus on client relationships and outlines the core areas of service. It sets the stage for discussions on company values, structure, or strategic direction.
Client Relations, Core Services, Company Values
false
Our Client Franchise is the Foundation of Our Firm One Goldman SachsState of the Franchise
Framework
Goldman Sachs
View slide
The slide consists of a complex bar chart with multiple data sets, illustrating the gross merchandise value (GMV) growth in billions across various sectors. It features a color-coded key and future projections up to the year 2025. The design uses a blue color palette with yellow highlights for emphasis.
Financial Performance
Technology & Software
Detailing the impressive growth trajectory of Southeast Asia's digital economy, this slide provides a breakdown of GMV across key sectors, projecting continued expansion. It's useful for financial analysis and forecasting, aiding investors and businesses in strategy development and market participation decisions.
digital economy, SEA, GMV growth, sector analysis, financial forecasting, bar chart, 2025 projections
false
SEA’s digital economy is closing in on $200B, growing 20% YoYe-Conomy SEA 2022 Through the waves, towards a sea of opportunity
Single Chart
Bain
View slide
Column chart showing potential topline benefits from advancing maturity levels.
Technology and Digital Transformation
Financial Services
Discusses the potential incremental topline benefits for companies at different maturity levels in the SHoP framework.
topline, growth, customer conversion, NPS, engagement
false
25-30% incremental topline potential for companies by advancing DLCE maturityA DATA DRIVEN APPROACH TO IMPROVE CUSTOMER ENGAGEMENT
Mixed Chart
BCG
View slide
The slide contains pie charts showing improvements in self-confidence, presentation skills, and business networking skills among workshop participants.
Performance Metrics and KPIs
Education & Training
The slide showcases employability workshops delivered in schools, connecting young people with local labor market opportunities and key employability skills.
employability workshops, self-confidence, labor market, skills development
false
Employability and enrichment workshopsEY Foundation 2022-23 Impact Report
Multiple Chart
EY
View slide
Displays trends in credit performance across various geographic regions using line graphs for metrics like NCL and DPD rates.
Risk Assessment and Management
Financial Services
Analyzes credit trends within Citigroup's global consumer banking, focusing on delinquency and non-performing loans across regions.
Credit, Trends, Consumer, Banking, Delinquency
false
Global Consumer Banking – Credit TrendsFourth Quarter 2021 Earnings Results Presentation
Multiple Chart
Citigroup
View slide
Graph showing the cumulative number of tests per million population versus cases per million, along with a column chart comparing testing-to-case ratios by country.
Regulatory and Compliance
Healthcare & Pharmaceuticals
Discusses the scale of COVID-19 testing in various countries and contrasts it with the number of reported cases to evaluate testing adequacy as of April 2020.
COVID-19, testing, healthcare capacity, countries, testing ratios, cases, global overview, adequacy
false
Virus monitoring | Testing continues to be a pressing issueFacts, scenarios, and actions for leaders Publication #3 with a focus on Emerging Stronger from the Crisis
Multiple Chart
BCG
View slide
The slide features column charts showing group cost base and full-time employee trends, as well as a table with restructuring expenses.
Operational Efficiency
Financial Services
This slide provides updates on group costs and employee reductions, highlighting actions already initiated to achieve cost base reduction by 2023.
cost transformation, group cost base, full-time employees, restructuring expenses, cost reduction
false
Significant progress on our CHF ~2.5 bn cost transformation4Q22 and Full Year 2022 Results Analyst and Investor Call
Multiple Chart
Credit Suisse
View slide
Slide shows two column charts comparing the growth of the luxury second-hand market against the total personal luxury market.
Market Analysis and Trends
Retail & E-commerce
Examines the growth of the second-hand luxury market, projecting significant increases and discussing market share.
Second-hand luxury, market growth, market analysis, trends, market share, projections, personal luxury
false
Luxury 2nd-hand market estimated at 22 B€ and growing faster than overall personal luxury...2019 True-Luxury Global Consumer I nsight
Multiple Chart
BCG
View slide
A world map colored in shades of blue indicating the percentage of activities that can be automated in different regions, accompanied by a pie chart showing economic figures for key regions.
Market Analysis and Trends
Industrial & Manufacturing
Analyzes the potential impact of automation globally, presenting the percentage of activities that can be automated by region and the economic impact in terms of total full-time equivalents (FTEs) and dollars.
Global, Automation, Economy, Impact, Regions
false
All countries could be impacted by automationA FUTURE THAT WORKS: AI, AUTOMATION, EMPLOYMENT, AND PRODUCTIVITY
Multiple Chart
McKinsey
View slide
Features a line chart on battery price outlook and images of various battery types.
Financial Performance
Energy & Utilities
Details the expected decline in EV battery costs and market predictions up to 2030.
EV, battery cost, market forecast, lithium-ion, price decline
false
Batteries form a major portion of EV costs; global battery market est. at $116 Bn by 2030; significant reduction in prices expected (dropped ~90% from 2010-2020)e-mobility in India Market paradigms and ways to play
Mixed Chart
PwC/Strategy&
View slide
Features a circular diagram with six segments representing different stakeholder groups involved in Chile's hydrogen market, paired with key considerations for engaging these stakeholders.
Strategic Planning
Energy & Utilities
Focuses on the roles of various stakeholders in developing the Chilean hydrogen ecosystem, including off-takers, ecosystem builders, and financiers, emphasizing coordinated action for market growth.
stakeholders, hydrogen, market, ecosystem
false
The development of the Chilean hydrogen ecosystem will depend on 6 key groups of stakeholdersChilean Hydrogen Pathway
Framework
McKinsey
View slide
Visual comparison using bar charts to show the cost disparities between generators, solar mini-grids, and grid electricity, alongside another chart depicting the proportion of market fires caused by generators, emphasizing economic and safety impacts.
Regulatory and Compliance
Industrial & Manufacturing
Highlighting the economic and safety challenges posed by generator use in Nigeria, this slide compares their high costs to other energy sources and their significant role in market fires, advocating for safer and more economical alternatives like solar energy.
generators, costs, fires, market safety, energy sources, Nigeria, economic impact, safety
false
Given high running cost, MSME's relying on generators reduce their operating hours to minimise energy spend, resulting in ~USD4-5bn in sales, lost annuallySocio-economic case for deepening solar PV deployment in Nigeria
Multiple Chart
BCG
View slide
Column chart displaying asset and liability composition. Layout is clean, with each chart and graph clearly labeled.
Financial Performance
Financial Services
Overview of company's assets and liabilities at the end of the year, useful for financial analysis and understanding company structure.
assets, liabilities, financial stability, balance sheet, equity
false
Net balance sheet 17 Net1 in € bn, as of December 31, 2023Client & Creditor Overview
Multiple Chart
Deutsche Bank
View slide
Illustrates the segmentation of customer base into free and premium members, with a diagram showing current features and expansion potential.
Market Analysis and Trends
Financial Services
This slide provides an analysis of the premium membership model, showcasing the transition from a free user base to a more comprehensive premium service, highlighting the potential for substantial growth through added features and services.
premium membership, customer base, expansion, segmentation, services
false
Premium membership now draws from a growing free member base and expanding productBarclays Global Credit Bureau Forum
Mixed Chart
Barclays
View slide
This slide features a purple gradient background with three main columns titled 'Sync the network strategy', 'The network dimensions of success', and 'Build future network talent'. Contains bullet points and subtitles.
Technology and Digital Transformation
Technology & Software
Describes best practices in network strategy integration across a company's lifecycle, emphasizing resilience, cost efficiency, and innovation in network management. Designed for strategic planning and technology enhancement initiatives.
network, strategy, best practices, innovation, technology, resilience, cost efficiency, management
false
III. Adopting network best practices across the lifecycleModern Networks
Header Vertical
Accenture
View slide
Features a global map showing countries with varying levels of commitment to achieving net-zero emissions. The countries are color-coded based on their current commitment status, ranging from no target to net-zero commitments, with a legend explaining the color coding.
Regulatory and Compliance
Environmental Services & Sustainability
Analyzes global commitments to achieving net zero emissions, highlighting the disparities in climate ambition across different regions. Useful for evaluating the progress and commitments of countries in terms of climate action.
Net zero, Climate commitments, Global analysis, 2050
false
Few countries have a net zero ambitionClimate Change: BCG’s Perspectives and Offerings
Mixed Chart
BCG
View slide
The slide contains a table and column charts showing leverage levels, drawdown percentages, and margin call data. Visual elements include a mix of text and numerical data in both tabular and graphical formats.
Risk Assessment and Management
Financial Services
The slide discusses how maintaining prudent levels of leverage can help avoid margin calls during significant market drawdowns, providing historical analysis data.
leverage, margin call, drawdown, financial risk, prudent levels
false
Keeping a prudent level of leverage helps to avoid margin callsHow leverage can be the best option to enhance returns and achieve your goals
Mixed Chart
UBS
View slide
The slide is moderately complex, featuring two main sections with distinct headers. On the left, a column chart details family law final order types with a key explaining colors for settled, transferred, and other outcomes. A bar graph on the right shows the age of finalizations in months.
Market Analysis and Trends
Government & Public Sector
The slide compares family law case outcomes between the Federal Circuit Court (FCC) and Family Court of Australia (FCoA), focusing on settlement rates and the duration before finalization. It's designed to present an analysis of the efficiency and process variation between the two courts.
Family law, finalization, FCC, FCoA, settlement, transfer, duration, analysis, court process, efficiency
false
Family law finalisationsReview of efficiency of the operation of the federal courts
Multiple Chart
PwC/Strategy&
View slide
Column chart depicting changes in CET1 capital from 2Q22 to 3Q22. Visuals include net profit, repurchase, dividend, currency effects, and others.
Financial Performance
Financial Services
Shows the progression of CET1 capital across different periods, highlighting the contributions and deductions leading to the final 3Q22 figure.
CET1, capital, net profit, dividend, currency
false
Common equity tier 1 capitalThird quarter 2022 Financial results
Single Chart
UBS
View slide
This slide features a three-column layout, each with a distinct category—Active to Passive, ESG, Digital Execution—presented with a mix of textual content and numerical data in a blue color scheme.
Financial Performance
Financial Services
It discusses the shift in client services towards passive strategies, ESG and impact investing, and improving digital execution capabilities. It includes AUS data, ETF count, and API connectivity as part of the service features.
Innovation, ESG, Digital, ETF, API
false
Continue to Innovate to Serve Evolving Client NeedsGoldman Sachs Investor Day
Table
Goldman Sachs
View slide
The slide features a detailed case study on the stakeholders and regulations in the energy-from-waste sector in the UK, including a value chain diagram, production cost analysis, and key regulations and policies.
Client Case Studies
Energy & Utilities
This slide examines the stakeholders and regulatory environment of the energy-from-waste sector in the UK, highlighting the value chain, production costs, and key regulations that support and govern waste-to-energy initiatives.
energy from waste, UK, case study, stakeholders, regulations, value chain, production cost, policy
false
Energy from waste is more and more competitive, supported by landfill tax and increasing emission controlsDeveloping sustainable carbon circularity Looking at advanced applications and business models
Mixed Chart
Kearney
View slide
Features a line chart showing global change in CO2 emissions generated by the power sector under different scenarios. Includes numbered points summarizing three carbon pricing scenarios and their impacts on emissions and tax revenues.
Strategic Planning
Energy & Utilities
Highlights three carbon pricing scenarios, comparing impacts on CO2 emissions and tax revenues, indicating significant reduction potential in emissions and variation in government tax revenues depending on the scenario.
carbon pricing, emissions, energy transition, tax revenues, scenarios
false
Benefits of pricing carbon as a commodity in shaping the energy transitionThe green transition
Mixed Chart
EY
View slide
This slide uses blue column charts and gray bars to depict changes in CET1 ratio and Risk-weighted Assets. It includes detailed footnotes and highlights key regulatory impacts and capital management strategies used to improve financial ratios.
Regulatory and Compliance
Financial Services
Displays quarterly changes in CET1 ratios influenced by regulatory adjustments, capital strategies, and market conditions. It underscores the bank's efforts in maintaining robust capital ratios through strategic financial management and regulatory compliance.
CET1 ratio, capital, regulatory, market, management
false
CET1 ratio increase due to optimization initiatives Period endQ3 2023 Fixed Income Investor Conference Call
Multiple Chart
Deutsche Bank
View slide
The slide presents a line chart showing technology adoption rates in US households over time, color-coded by technology type. Key observations about the impact of world events on technology adoption are summarized on the right.
Market Analysis and Trends
Technology & Software
This slide examines the historical trends in technology adoption among US households, noting that major world events generally do not hinder technological progress, with some delays observed during WWII.
Technology adoption, US households, historical trends, world events, resilience
false
Major world events do not seem to stop technology adoption. At best, they slightly delay it, but most of the time, there is no visible slowdownGoing Public EY Global Blockchain Summit 2020
Mixed Chart
EY
View slide
A multi-colored ranking chart lists ASEAN countries across several skill categories, providing a clear comparison.
Strategic Planning
Technology & Software
Analyzes ASEAN countries' positions in global skill rankings, highlighting areas of strength and needed improvement.
skills, ranking, ASEAN, talent availability, training, education, index
false
ASEAN countries are widely spread across overall global skills ranking and availability of skilled talent indexASEAN Growth and Scale Talent Playbook
Table
Kearney
View slide
A multi-line chart showing FDI variations across several Central American countries from 2015 to 2022. Each country is represented by a different color.
Investment Analysis
Financial Services
This slide compares the Foreign Direct Investment trends in various Central American countries, indicating significant events and their impact on FDI for each country.
FDI, Central America, country comparison, trends
false
FDI in Central American countriesNearshoring in Central America
Single Chart
Deloitte
View slide
The slide shows a scatter plot of service lines and markets for top 20 clients.
Client Case Studies
Professional Services
The slide demonstrates how large clients rely on Ipsos' cross-country and cross-sector expertise.
clients, service lines, markets, expertise, Ipsos, top 20
false
OUR LARGE CLIENTS RELYOn this cross-country & cross-sectorexpertiseOur Path to Ipsos 2025: A Strategic Update
Single Chart
IPSOS
View slide
The slide presents icons showing different fears affecting innovators, with comparative intensity levels among average and leading innovators.
Human Resources and Talent Management
Professional Services
Explores common fears among innovators, comparing how these fears vary between average and leading innovators and their impact on innovation efficiency.
innovation, fears, impact, career, outcomes, criticism, comparison
false
What kind of fears are we talking about?Driving innovation at scale
Pillar
McKinsey
View slide
Features three distinct icons representing urban dynamics, mobility evolution, and customer preferences, each accompanied by a brief descriptor, arranged horizontally across the slide.
Strategic Planning
Transportation & Logistics
Discusses the major forces shaping future transportation ridership including urban dynamics, mobility options, and shifting customer expectations. Ideal for strategic planning in urban transport and mobility sectors.
urban dynamics, mobility, customer preferences, transportation, future trends
false
Three forces likely to influence future ridershipPerspectives on WMATA's ridership
Pillar
BCG
View slide
This slide presents a series of line charts depicting household savings dynamics in the US, EU, and UK, along with commentary. Each chart shows the actual savings rate, model-predicted trend savings rate, and cumulative excess savings.
Risk Assessment and Management
Financial Services
The slide discusses household savings dynamics, indicating that US consumers are depleting excess savings accrued during the pandemic. It forecasts savings trends and highlights differences between US and European savings behaviors, suggesting cautious consumer spending in the future.
household savings, US, EU, UK, dynamics, forecast
false
The US consumer has been resilient to date, but caution is warranted amid declining excess savingsMarch Macro Brief Financial fissures emerge
Multiple Chart
Accenture
View slide
A multi-line graph comparing revenue against media spend in different channels, emphasizing superior returns from TV advertising with numbered key insights.
Investment Analysis
Media & Entertainment
Focuses on the comparative ROI from various media channels, particularly highlighting the efficiency of TV advertising in generating higher returns.
TV advertising, media channels, ROI, investment returns, comparative analysis
false
ADVERTISERS SEE GREATER RETURNS ON AN ADDITIONAL DOLLAR SPENT ON TV ADS COMPARED TO ONE SPENT ON OTHER CHANNELSAccenture Post and Parcel Industry Research 2019
Mixed Chart
Accenture
View slide
Table displaying donations and collected figures; text on left
Regulatory and Compliance
Professional Services
Details the donations and social value created by EY's initiatives, with a focus on specific projects
Social value, donations, projects, community, EY
false
During the corporate event dedicated to the Social Value initiative, open to all EY personnel, the 4 projects selected andEY Italia for the country system
Table
EY
View slide
Slide with a table and line charts showing non-GAAP P&L figures, revenue, cost of services, contribution, and adjusted EBITDA over four quarters.
Financial Performance
Professional Services
This slide presents Gartner's non-GAAP profit and loss statement, including revenue, costs, and adjusted EBITDA, with accompanying quarterly trends.
Non-GAAP, P&L, revenue, EBITDA, Gartner
false
Non-GAAP P&L Revenues $ millionsGartner Introduction
Multiple Chart
Gartner
View slide
Circular charts showing percentages of tax concerns related to virtual work, with text discussing the impact.
Regulatory and Compliance
Financial Services
Discusses the increased tax concerns for family offices due to virtual work arrangements and the need for new strategies.
virtual work, tax concerns, family offices, APAC, connected businesses
false
The impact of virtual work is further increasing concerns about taxEY Family Office Study
Multiple Chart
EY
View slide
Line graphs and scatter plot on a logarithmic scale, comparing the daily growth rates and cumulative confirmed cases across countries.
Regulatory and Compliance
Healthcare & Pharmaceuticals
Analyzes COVID-19 case growth rates and doubling times, indicating which countries are successfully flattening the curve as of April 2020.
COVID-19, statistics, health policy, growth rate, logarithmic scale, flattening the curve, countries, cases, progression
false
Disease progression | Many countries currently flattening the curveFacts, scenarios, and actions for leaders Publication #3 with a focus on Emerging Stronger from the Crisis
Multiple Chart
BCG
View slide
Slide displays icons next to headers summarizing behaviors promoting innovation like 'Believe & Value', 'Frame & Champion', and more, each accompanied by descriptions.
Human Resources and Talent Management
Professional Services
Describes leadership behaviors that foster an innovation-friendly environment, focusing on empowerment, symbolic actions, and the promotion of innovation as a core value.
leadership, innovation, behaviors, culture, empowerment, symbols, value
false
Leadership behaviors in fear-less culturesDriving innovation at scale
Table
McKinsey
View slide
Data visualization slide with charts and a photo, presenting statistics related to the report's findings on women's well-being.
Technology and Digital Transformation
Professional Services
Provides a visual representation of data regarding improvements and continuing challenges in women's well-being at work, emphasizing both progress and areas needing attention.
Data, Women, Well-Being, Progress, Challenges
false
Table of contentsWomen @ Work 2023
Agenda
Deloitte
View slide
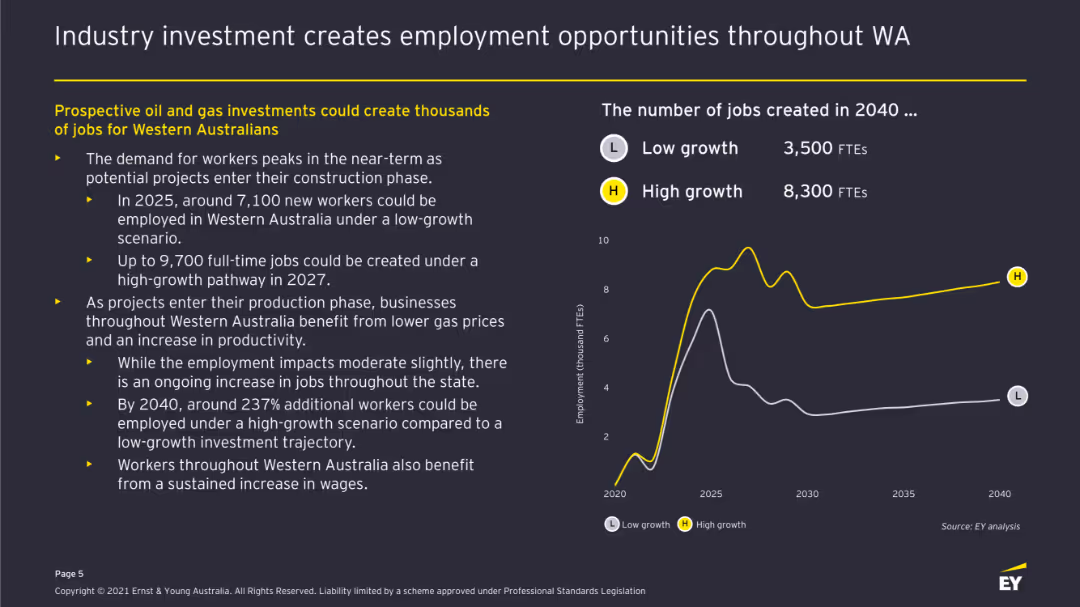
Line chart displaying employment projections under low and high growth scenarios. Accompanied by bullet points explaining employment impacts and job creation estimates.
Human Resources and Talent Management
Energy & Utilities
Highlights the job creation potential of prospective oil and gas investments, detailing the expected employment peaks and the long-term impact on job numbers in Western Australia.
Employment, Job Creation, Oil and Gas, Western Australia, Growth Scenarios, Workforce, Economic Activity
false
Industry investment creates employment opportunities throughout WAThe economic contribution of Western Australia’s oil and gas industry
Mixed Chart
EY
View slide
Displays a list of six key levers for addressing the cost base in a strategic manner, each accompanied by an icon and a brief description.
Operational Efficiency
Professional Services
Outlines the six essential levers for strategic cost management, detailing their relevance and impact on business operations. The levers include Operating Governance, Service Delivery Model, Business Process Optimisation, Organisation Design, External Spend Management, and Demand Management. This slide is essential for understanding strategic approaches to cost reduction.
Cost Management, Strategic Levers, Business Operations, Optimization
false
Six key leversStrategic Cost Transformation Grab’n Go session
Table
Deloitte
View slide
The slide presents a simple two-column comparison of actions and future directions with respect to the client franchise in FICC and Equities. A dark theme with white and blue text highlights the top 100 clients' attributes and planned actions.
Sales and Business Development
Financial Services
It discusses strategies for strengthening client relationships in FICC and Equities, appropriate for discussions on client management and business development.
Client franchise, FICC, Equities, growth plan
false
Strengthened Client Franchise FICC and EquitiesGlobal Banking & Markets
Table
Goldman Sachs
View slide
This slide features two stacked column charts: one showing PE/VC investments by deal segments in terms of value, and another showing the number of deals. The charts use different colors to differentiate between segments like Growth, Buyout, Start-up, PIPE, and Credit Investment, with detailed numerical data.
Market Analysis and Trends
Financial Services
This slide breaks down the PE/VC investments across various deal segments by both value and number of deals, providing a comprehensive view of how different segments are performing over time. This information is essential for strategic planning and investment analysis.
PE/VC, deal segments, investment value, number of deals, growth, buyout
false
PE/VC monthly headline trends: investments PE/VC investments: split across deal segments (value in US$m)Why do uncertain times need a certainty of purpose? April 2023
Multiple Chart
EY
View slide
Complex visual with column charts tracking quarterly financial data such as income, costs, and profitability metrics, specifically focusing on return on tangible equity (RoTE).
Financial Performance
Financial Services
Highlights the financial performance of Barclays UK in Q423, emphasizing profitability and efficiency in various banking services.
financial performance, RoTE, Barclays, Q423, banking, profitability, costs, income
false
Barclays UK delivered 19.7%1 RoTE in Q423FY 2023 Results Announcement
Multiple Chart
Barclays
View slide
Graphical layout with bar charts comparing technology in use and deployment across various domains.
Technology and Digital Transformation
Technology & Software
Slide depicts technology usage and deployment statistics, emphasizing the higher adoption rate of hybrid work technologies.
Technology, Statistics, Hybrid Work, Data Analysis
false
Technology in use or being deployedFuture Workplace Index 2.0
Single Chart
EY
View slide
This slide includes three pie charts and textual analysis. The layout is structured with headers and bullet points discussing survey data.
Strategic Planning
Financial Services
Highlights the lack of tax function involvement in strategic decision-making related to new business or product lines. The slide provides survey data and emphasizes the need for proactive tax role in business strategy to avoid costly retractions.
tax, business development, product lines, strategy, pie chart, involvement
false
Tax functions not involved in the development of new business or product linesTax Function Effectiveness
Multiple Chart
PwC/Strategy&
View slide
The slide displays a table listing different CO2-based products, their compounds, and the current status of deployment, categorized into commercial, lab-scale, and demonstration stages. It uses color coding for each category.
Product and Service Analysis
Energy & Utilities
The slide provides a detailed overview of various CO2-based chemical products, their current development stages, and potential applications, highlighting the maturity levels of different pathways.
CO2-based products, chemical compounds, deployment status, maturity stages
false
Different CO2-based products and the current status of deploymentCarbon Capture Utilization and Storage
Table
Kearney
View slide
Contains diagrams and pie chart describing changes in retail strategies for the luxury market from 2019 to 2025F.
Strategic Planning
Retail & E-commerce
Discusses the need for luxury retailers to adapt to new consumer behaviors by rethinking store roles and customer experiences.
retail, luxury, transformation, 2025, strategy
false
Retail networks will need to be redesigned around customers: store role, global and local footprint, experiential customer experience and ergonomicsBAIN-ALTAGAMMA 2020 WORLDWIDE LUXURY MARKET MONITOR
Multiple Chart
Bain
View slide
Two graphs juxtapose U.S. goods imports and business inventory/sales ratio, marked by a distinct visual separation. Contains numerical data and is moderately text-dense.
Operational Efficiency
Industrial & Manufacturing
Focuses on the recovery of the service sector and manufacturing, analyzing inventory levels and trade growth, relevant for operational and financial planning.
Service Recovery, Manufacturing, Inventory Levels, Trade Growth, Operational Planning, Financial Analysis
false
Services recovery is strong. Manufacturing still has a “tailwind”Citi Global Wealth Investments OUTLOOK 2022
Single Chart
Citigroup
View slide
Six line graphs showing search volumes for food delivery services, indexed to 2016 levels, with annotations for specific multipliers. Each graph represents a different country.
Market Analysis and Trends
Technology & Software
Provides insight into the search trends for food delivery services over several years across different countries. Useful for understanding the growth of interest in food delivery and market potential for e-commerce in the food sector.
Search trends, Food delivery services, Market analysis, E-commerce growth, Indexed data
false
Spike in Food Deliveries subsided as lockdowns easede-Conomy SEA 2020 At full velocity: Resilient and racing ahead
Multiple Chart
Bain
View slide
Contains a pie chart and annotated sections with icons and key points.
Market Analysis and Trends
Transportation & Logistics
Focuses on key customer concerns in the e-mobility market, such as vehicle price, charging infrastructure, and battery performance.
e-mobility, customer concerns, vehicle price, charging infrastructure, battery performance
false
In order to drive adoption in the e-mobility market, manufacturers and other ecosystem players need to address key customer concernse-mobility in India Market paradigms and ways to play
Single Chart
PwC/Strategy&
1
...
Next
Load More
Hold On!
We are searching in our database
If nothing, comes up, please try different filters!
Create a FREE account to continue browsing
Receive Instant Access to 8,000+ of the internet's best slides
First Name
Last Name
Email
Password
I agree to all
Terms & Privacy Policy
Thank you! Your submission has been received!
Oops! Something went wrong while submitting the form.
Have an account?
Sign in
Column Chart
Heatmap
Chevron
Org Chart
Infographic
Callouts
Timeline
List
Graphic
Picture
Process Flow
Diagram
Paragraph
Map
Table
Framework
Subtitle
Takeaway Box
Icon
Other Chart
Radar Chart
Waterfall Chart
Mekko Chart
Pie Chart
Scatter Plot
Line Chart
Bar chart
Bullet points