My Account
My Slides
Leave Feedback
Login
Logout
Get Started
Browse all Slides
Browse Slides Pro
Create a FREE Account
Instant access to 1,000+ real slides from top companies like McKinsey, BCG, Goldman Sachs, Google and many more!
First Name
Last Name
Email
Password
I agree to all
Terms & Privacy Policy
Thank you! Your submission has been received!
Oops! Something went wrong while submitting the form.
Have an account?
Sign in
Instant access to the internet's best slides
Get access to 40+ advanced filters and more
Advanced Search and Filters
Access to
8,000+ slides
Access to Category Pages
Save/Bookmark Slides
PowerPoint Template Library (Coming Soon)
Choose your plan
MONTHLY
$12/month
Billed every month, cancel anytime.
YEARLY
$9/month
Billed $108 annually, cancel anytime.
Checkout for $12/month
Checkout for $108/yr
Secured by Stripe | AES-256 bit encryption
Welcome,
Welcome
Upgrade to SlideStart
Pro
Instant access to 8,000+ slides
Show Featured Only
Checkbox 8
Companies
Mckinsey
Bain
BCG
EY
Deloitte
Accenture
PwC/Strategy&
JP Morgan
Goldman Sachs
Morgan Stanley
Citigroup
Deutsche Bank
Barclays
LEK
Kearney
Oliver Wyman
Booz Allen Hamilton
Gartner
IPSOS
Nielsen
Slide type
Header Horizontal
Framework
Vertical Flow
Single Chart
Single Chart
Text Only
Mixed Chart
Header Vertical
Graphic
Pillar
Multiple Chart
Agenda
Title
Table
Linear Flow
Upgrade to SlideStart
Pro
Instant access to 40+ advanced filters
Industry
Upgrade to SlideStart
Pro
Instant access to 40+ advanced filters
Technology
Healthcare
Financial Services
Consumer Goods
Energy & Utilities
Manufacturing
Retail
E-commerce
Logistics
Telecommunications
Real Estate
Professional Services
Education
Media
Entertainment
Hospitatlity
Tourism
Agriculture
Food Production
Government & Public Sector
Environmental
Sustainability
Use Case
Upgrade to SlideStart
Pro
Instant access to 40+ advanced filters
Sales and Business Development
Mergers and Acquisitions
Corporate Finance and Valuation
Performance Metrics and KPIs
Client Case Studies
Competitive Landscape
Product and Service Analysis
Customer and Market Segmentation
Organizational Structure
Human Resources and Talent Management
Industry Overview
Regulatory and Compliance
Risk Assessment and Management
Agriculture & Food Production
Hospitality and Tourism
Government
Environmental
Sustainability
Clear all
Thank you! Your submission has been received!
Oops! Something went wrong while submitting the form.
Show Featured Only
Checkbox 8
Companies
Mckinsey
Bain
BCG
EY
Deloitte
Accenture
PwC/Strategy&
JP Morgan
Goldman Sachs
Morgan Stanley
Citigroup
Deutsche Bank
Barclays
LEK
Kearney
Oliver Wyman
Booz Allen Hamilton
Gartner
IPSOS
Nielsen
Slide type
Text Only
Linear Flow
Vertical Flow
Single Chart
Header Horizontal
Mixed Chart
Header Vertical
Pillar
Multiple Chart
Graphic
Agenda
Title
Table
Framework
Industry
Technology
Healthcare
Financial Services
Consumer Goods
Energy & Utilities
Manufacturing
Retail
E-commerce
Logistics
Telecommunications
Real Estate
Professional Services
Education
Media
Entertainment
Hospitatlity
Tourism
Agriculture
Food Production
Government & Public Sector
Environmental
Sustainability
Use Case
Sales and Business Development
Mergers and Acquisitions
Corporate Finance and Valuation
Performance Metrics and KPIs
Client Case Studies
Competitive Landscape
Product and Service Analysis
Customer and Market Segmentation
Organizational Structure
Human Resources and Talent Management
Industry Overview
Regulatory and Compliance
Risk Assessment and Management
Agriculture & Food Production
Hospitality and Tourism
Government
Environmental
Sustainability
Clear all
Thank you! Your submission has been received!
Oops! Something went wrong while submitting the form.
Tag
View slide
A pie chart dominates half the slide, with complementary circular graphics and minimal text for clarity in comparison.
Market Analysis and Trends
Technology & Software
Examines the influx of new digital consumers during the pandemic, offering a breakdown that could influence digital marketing strategies.
digital consumers, pandemic trends, consumer analysis, SEA, pre-pandemic comparison, internet economy
false
Thailand and the Philippines have had the highest proportion of new users start consuming online during the pandemice-Conomy SEA 2021 Roaring 20s: The SEA Digital Decade
Single Chart
Bain
View slide
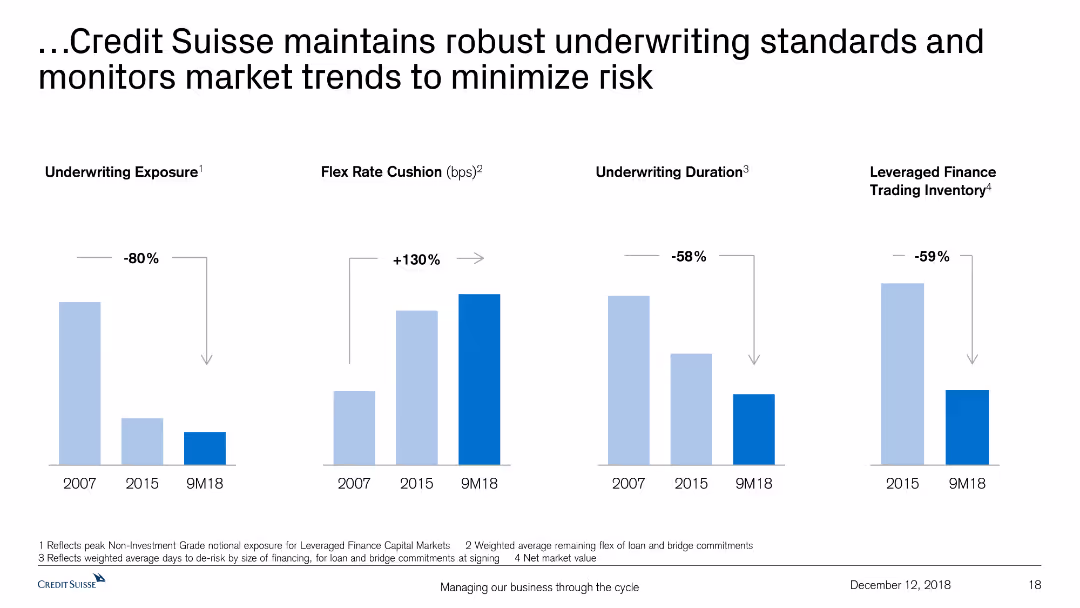
The slide includes comparative bar charts showing underwriting exposure, flex rate cushion, underwriting duration, and trading inventory.
Risk Assessment and Management
Financial Services
The slide explains how Credit Suisse upholds strong underwriting standards and adapts to market trends to reduce risk, supported by relevant data.
underwriting standards, market trends, risk minimization, Credit Suisse, exposure, flex rate, duration, inventory
false
…Credit Suisse maintains robust underwriting standards and monitors market trends to minimize riskCredit Suisse Investor Day 2018 Managing our business through the cycle
Multiple Chart
Credit Suisse
View slide
Three line charts displaying Australia's y/y real GDP, unemployment rate, and y/y percentage change in CPI from 2005-25F. Moderate complexity, suitable for presenting detailed economic data and trends.
Market Analysis and Trends
Financial Services
This slide analyzes the Australian economy, discussing the impacts of persistent inflation, rising interest rates, and strong labor market conditions on economic growth. It provides projections for GDP, unemployment, and CPI.
Australia, GDP, unemployment, CPI, economy
false
The Australian economy is weighed down by persistent inflation and rising interest rates, but robust labor market conditions continue to support consumer spendingGlobal economic outlook Macroeconomic outlook and impact on businesses
Multiple Chart
EY
View slide
A data-centric slide featuring a bar graph comparing spending between Tier 1 and Tier 2 cities across Southeast Asia. The graph is central, with supporting text on either side providing context and interpretation for the data.
Market Analysis and Trends
Retail & E-commerce
Examines the spending behaviors of consumers in Tier 1 and Tier 2 cities in Southeast Asia, highlighting the trend of increasing expenditure in smaller cities and the implications for retail strategies and market expansion.
spending behaviors, Tier 1 cities, Tier 2 cities, Southeast Asia, consumer expenditure, retail strategy, market expansion, economic trends
false
New norms = new purchasing habitsDigital Consumers of Tomorrow, Here Today: A SYNC SOUTHEAST ASIA REPORT
Multiple Chart
Bain
View slide
The slide features a column chart comparing wholesale, retail, and perimeter channels over 2017 and 2018, with associated percentage growth.
Market Analysis and Trends
Retail & E-commerce
Discusses the growth rates of personal luxury goods through various sales channels, highlighting the impact of different retail strategies.
luxury goods, retail growth, wholesale, perimeter sales, channel analysis
false
IN 2018 SUSTAINED RETAIL PACE, DRIVEN BY ORGANIC GROWTH; WHOLESALE SLOWED DOWN DUE TO WEAK DEPT. STORES & SPECIALTYALTAGAMMA 2018 WORLDWIDE LUXURY MARKET MONITOR
Multiple Chart
Bain
View slide
The slide shows multiple charts: a bar chart for investment percentages in greenfield initiatives, a column chart for investment constraints, and a column chart for quality perception of PPP tenders.
Market Analysis and Trends
Real Estate & Construction
This slide evaluates the attractiveness of greenfield infrastructure investments in Italy, focusing on the allocation of financing, perceived investment constraints, and the quality of PPP tenders compared to EU averages.
Greenfield, infrastructure, Italy, investment, PPP tenders
false
Attractiveness of the greenfield infrastructures in ItalyEY Infrastructure Barometer - Italy
Multiple Chart
EY
View slide
The slide includes a vertical bar chart showing the job titles of survey participants, with an image of a professional woman using a tablet on the right.
Human Resources and Talent Management
Professional Services
Breakdown of survey participants' job titles, indicating a significant presence of C-suite executives.
Job titles, survey participants, C-suite, demographics, HR
false
Job title Chief Executive Officer (CEO)/ PresidentGreece goes the distance, continuing to win investors’ trust
Mixed Chart
EY
View slide
The slide features a circular diagram representing global forces with different areas like 'business fragmentation' and 'individualism'. Each segment has brief descriptors and the design is color-coded for clarity.
Strategic Planning
Professional Services
This appendix slide offers a conceptual framework for understanding the forces influencing global business and people management. It associates various global trends with potential impacts on business structures and decision-making, providing a reference point for considering future scenarios in a corporate context.
Global forces, business trends, people management, conceptual framework
false
AppendixThe future of work: A journey to 2022
Framework
PwC/Strategy&
View slide
The slide combines text and a line chart. The text details the capital structure and free cash flow deployment, while the chart shows share repurchases over time.
Financial Performance
Financial Services
The slide discusses the capital structure, financial leverage, and free cash flow deployment strategies, including share repurchases and debt metrics.
Capital Structure, Leverage, Free Cash Flow, Share Repurchases, Debt Ratings, Investment Grade
false
Capital Structure and AllocationGartner Introduction
Mixed Chart
Gartner
View slide
Two sets of column charts are present. The top set displays regional/style-based expected EPS growth versus actual EPS growth in 2022, using horizontal bars. The bottom set uses vertical bars to show S&P 500 sectors' EPS growth. Red and gray color schemes distinguish between expected and actual figures.
Investment Analysis
Financial Services
This slide examines the expected versus actual earnings per share growth for different regions and S&P 500 sectors, providing insights for investors and market analysts.
EPS growth, corporate earnings, regional analysis, sector performance, financial forecasting, investment strategy
false
Corporate Earnings GrowthMonthly Market Monitor November 2023
Multiple Chart
Morgan Stanley
View slide
This slide features a structured overview with icons and brief descriptions of various investment themes across sectors like renewables, built environment, and electric mobility.
Investment Analysis
Financial Services
Provides insights into accessible thematic investment opportunities within sectors like forest conservation, sustainable farming, and renewables, highlighting the potential for early and mature capital investments.
investment opportunities, renewables, thematic sectors, capital investment
false
These prioritized sectors offer a range of accessible thematic investment plays; Built environment, EVs, Forest conservation and Renewables are most attractiveSoutheast Asia’s Green Economy 2022 Report
Header Horizontal
Bain
View slide
This slide displays multiple tables and a bar chart detailing financial statistics such as revenues, deposits, and loans, categorized by business sector.
Financial Performance
Financial Services
Reviews the performance of Deutsche Bank's Corporate Banking sector, detailing earnings, expense management, and resource allocation for Q3 2023.
corporate banking, revenue analysis, financial performance, deposits, loans
false
Corporate Bank In € m, unless stated otherwiseQ3 2023 results
Mixed Chart
Deutsche Bank
View slide
The slide features wave graphics and icons to discuss the advantages of quantum communication. The content is arranged in a clear, linear fashion, with color differentiation aiding in distinguishing between the different sections and points made on the slide.
Technology and Digital Transformation
Technology & Software
This slide delves into the benefits and aspirations of quantum communications over traditional methods, focusing on enhanced security and computational power. It serves to inform on the potential applications and breakthroughs that quantum communications might offer in various fields.
Quantum Communications, Security, Computing Power
false
Why is quantum communications interesting compared with what already exists? slide 2McKinsey Technology Trends Outlook 2022 Quantum technologies
Header Horizontal
McKinsey
View slide
Complex slide with three sets of column charts representing business growth, customer balances, and financial metrics over time. Uses color contrasts and percentage changes for clarity.
Financial Performance
Financial Services
This slide provides a comprehensive view of JP Morgan Chase & Co.'s growth, customer balance changes, and financial metrics, illustrating the firm's performance over recent years and is likely used for financial analysis and investor relations.
business growth, customer balances, financial metrics, JP Morgan Chase, financial analysis, investor relations
false
We have grown our core franchise and maintained strong financial resultsConsumer & Community Banking
Multiple Chart
JP Morgan
View slide
Consists of a column chart showcasing planned growth strategies and a pie chart detailing ownership transition plans, set against a clear, textual backdrop.
Strategic Planning
Technology & Software
Presents strategic initiatives and ownership transition plans as pivotal components of business strategy, highlighting the directional shifts businesses may undertake to foster growth.
Business Strategy, Growth, Transition, Planning
false
Business strategy2023 Midyear Business Leaders Outlook
Multiple Chart
JP Morgan
View slide
Multiple column charts showing broadband connections by type over years with a legend indicating nbn and non-nbn technologies.
Operational Efficiency
Telecommunications
Analyzes the growth and distribution of nbn broadband connections in Australia since 2011, showing significant infrastructure expansion.
nbn, broadband, Australia, infrastructure, rollout, internet, connectivity, growth
false
The nbnnetwork roll out has had a profound impact on broadband availability and technology qualityThe economic and social impact of investment in the nbn network Methodology Report
Single Chart
Accenture
View slide
Features column charts and additional commentary sections detailing liquidity ratios and available resources, presented with clarity and depth.
Financial Performance
Financial Services
Discusses Citibank's liquidity coverage ratios, providing insights into financial health and regulatory compliance. Important for risk management and ensuring operational continuity.
liquidity coverage, financial health, Citibank, regulatory compliance, risk management
false
3Q23 Liquidity Coverage RatioThird Quarter 2023 Earnings Results Presentation
Multiple Chart
Citigroup
View slide
Displays a line chart showing the Japan Specific Health Adjustment Factor (SMR) over time, with text detailing the proposed factor for 2023.
Market Analysis and Trends
Financial Services
This slide proposes a Japan Specific Health Adjustment Factor for 2023, using a rolling 3-year weighted average, showing the historical data trend.
Japan, health adjustment, SMR, financial services, market trends
false
Proposed Japan Specific Health Adjustment Factor (2023)Scalar calibration For Life insurance business
Mixed Chart
Oliver Wyman
View slide
A bar chart showing reasons for switching vehicle brands, using varying shades of teal. The chart includes percentages and is straightforward in layout.
Market Analysis and Trends
Transportation & Logistics
This slide presents reasons why consumers consider switching vehicle brands, with the desire for something different being the most dominant factor. Useful for analyzing brand loyalty and consumer behavior in the automotive sector.
Brand loyalty, consumer behavior, market analysis, vehicle brands, switching reasons
false
Survey respondents indicated that trying something different is the most important reason for choosing a new brand of vehicle over the one they currently drive.2024 Global Automotive Consumer Study
Single Chart
Deloitte
View slide
The slide features three sets of column charts with color-coded bars representing revenue, pre-tax income, and assets under supervision over multiple years. Red and green arrows denote annual increases or decreases. There are also percentage values and text boxes providing a 10-year summary including recurring revenue, pre-tax margin, ROE, and net charge-off rate.
Financial Performance
Financial Services
Showcasing financial stability, the slide presents a multi-year overview of revenue, pre-tax income, and assets under supervision. It emphasizes consistent growth with yearly comparisons and long-term averages, suitable for financial reviews or investor relations.
growth, revenue, income, assets, financial stability
false
Consistent growth for JPMCAsset & Wealth Management 2022
Multiple Chart
JP Morgan
View slide
This slide features a green and white line chart against a black background, showing the performance of the "50 Most Innovative Companies of 2021." The slide is labeled with key percentages in bold green, providing a visual comparison to the "MSCI World Index." The data is clearly depicted for easy comparison, and the slide's overall design is straightforward, emphasizing the financial data presented.
Investment Analysis
Financial Services
The slide provides evidence of the financial performance of innovative companies, illustrating their continued outperformance during the COVID-19 crisis. It could be used by financial analysts or investment strategists to evaluate the merits of investing in innovative companies, demonstrating their potential for resilience and growth. The inclusion of an index comparison provides a benchmark for assessing the relative success of innovation-led strategies.
financial performance, innovative companies, COVID-19, MSCI World Index, investment strategy
false
The 50 Most Innovative Companies of 2021 accelerated out of the crisisBCG Executive Perspectives: The Race for Innovation
Single Chart
BCG
View slide
Slide with bar charts showing the expected and achieved Returns on Digital Investment (RODI) by automotive companies, compared to cross-industry performance.
Financial Performance
Transportation & Logistics
Discusses the financial returns on digital investments by automotive companies, highlighting how champions outperform contenders and cadets in achieving higher than expected RODI.
RODI, financial performance, automotive, investment returns, digital transformation
false
AUTO-OESCHAMPIONS SET THEMSELVES HIGHER “RODI” TARGETS AND ACHIEVE THEM TOO.AUTOMOTIVE –OES
Multiple Chart
Accenture
View slide
This slide features a dark background with a header, body text, and a column chart showing three percentage indicators. Each indicator is accompanied by descriptive text explaining consumer openness to virtual primary care consultations versus in-person consultations.
Technology and Digital Transformation
Healthcare & Pharmaceuticals
The slide discusses the openness of Irish consumers to switch to virtual primary care consultations, despite a general preference for in-person consultations. It highlights the percentage of consumers willing to consider virtual consultations.
healthcare, virtual care, primary care, Ireland, consultations
false
‘But I am open to switching to virtual primary care.’ Consumers: IrelandHealth care consumer views on value
Mixed Chart
EY
View slide
Similar to the previous slide, this one has a circular diagram with the Goldman Sachs logo at the center. "Continuous Improvement" is highlighted, and there are bullet points for different aspects like "Risk Appetite and Cycle Preparedness."
Risk Assessment and Management
Financial Services
This slide expands on the element of "Continuous Improvement" from the risk management cycle at Goldman Sachs. It enumerates key areas such as risk appetite, regulatory compliance, cybersecurity, and reputation. The slide is suitable for presentations aimed at detailing risk mitigation strategies and preparedness in financial operations.
risk, management, Goldman Sachs, continuous improvement, compliance
false
Risk Management at Goldman SachsGoldman Sachs Investor Day
Linear Flow
Goldman Sachs
View slide
This slide has a blue and green color scheme with a pie chart showing outstanding debt and preferred shares. It contains bullet points with checkmarks and three text sections on the left side. The slide is marked as number 7.
Regulatory and Compliance
Financial Services
The slide presents actions taken for a seamless LIBOR transition, including leadership roles, meeting investor needs, and managing LIBOR exposure. It uses a pie chart to show the composition of outstanding debt and shares, and bullet points for structured information.
LIBOR, transition, debt, shares, derivatives, risk management
false
LIBOR TransitionGoldman Sachs Investor Day
Mixed Chart
Goldman Sachs
View slide
The slide includes a line graph and column charts about funded loans and net interest income, with supplemental textual descriptions. The slide design effectively balances detailed data and explanatory text.
Financial Performance
Financial Services
Provides an overview of progress in lending across the franchise, detailing growth in funded loans, net interest income, and lending strategies for different client segments.
Lending, Net Interest Income, Funded Loans, Franchise Growth, PWM, GS Select, Institutional Financing, Client Strategy
false
Investing & Lending Progress in increasing lending across franchiseGoldman Sachs Presentation to Credit Suisse Financial Services Conference
Multiple Chart
Goldman Sachs
View slide
The slide features a column chart comparing CMHC vacancy rates for purpose-built rentals and condo rentals in 2019 and 2020.
Market Analysis and Trends
Real Estate & Construction
This slide displays the vacancy rates for purpose-built and condo rentals, showing a significant increase in 2020.
CMHC, vacancy rates, rental market, purpose-built, condo rentals, column chart
false
CMHC Vacancy Rates Climbed in 2020Market Year in Review and Outlook 2021
Single Chart
IPSOS
View slide
Features column chart with efficiency ratios and a strategic plan outline with arrows and bullet points detailing expense management.
Operational Efficiency
Financial Services
Showcases a plan for expense savings to enable growth funding, likely used for operational strategy meetings or financial planning discussions.
Expense Savings, Efficiency, Growth Funding, Operational Strategy, Financial Planning
false
Expense Savings Creating Capacity to Fund Future GrowthGoldman Sachs Investor Day
Mixed Chart
Goldman Sachs
View slide
A dual-axis chart showing semiconductor supply shortages and price pressures from Jan 2019 to Jan 2023, indicating supply and price trends.
Risk Assessment and Management
Technology & Software
The slide highlights the easing but still elevated semiconductor supply and price pressures, with insights into inventory improvements.
semiconductor, supply chain, price pressures, technology, risk management, inventory
false
Semiconductor supply and price pressures continue to ease but remain somewhat elevated 3 times higher than their long term averagesMarch Macro Brief Financial fissures emerge
Mixed Chart
Accenture
View slide
A pie chart shows the proportion of SDG-aligned investments against other investments, with associated text blocks. A color-coded list describes contributions to SDG goals.
Regulatory and Compliance
Government & Public Sector
Communicates the company's commitment to sustainability through SDG-aligned investments. It highlights the yearly investment averages and the main areas of contribution, suitable for reports on corporate responsibility and sustainability initiatives.
SDG Goals, Investments, Sustainability, Corporate Responsibility, Innovation
false
Leonardo investments and innovation contributes to the alignment with SDG goalsGoldman Sachs Investor Meeting
Table
Goldman Sachs
View slide
Contains multiple bullet points aligned with numbers on a circular, futuristic city graphic. Text sections are clearly numbered from 1 to 4, detailing consumer trends and preferences in vehicle technology.
Market Analysis and Trends
Transportation & Logistics
Outlines consumer readiness and trends regarding vehicle technology adoption, highlighting challenges in EV adoption and consumer willingness to switch vehicle brands. Useful for strategic insights in automotive and technology sectors.
consumer trends, vehicle technology, EV adoption, market analysis, future insights, connectivity, subscription models, economic concerns
false
Are consumers ready to fully move away from ICE technology?2024 Global Automotive Consumer Study
Header Vertical
Deloitte
View slide
A set of bar charts shows the net sentiment on consumer spending across different types of fashion brands, segmented by consumer income levels.
Market Analysis and Trends
Consumer Goods
Explores consumer spending sentiments on various fashion brands, particularly highlighting differences in spending habits between high-income and general consumers. Useful for targeted marketing strategies.
luxury, consumer, spending, fashion, brands
false
Fashion & Luxury BrandsA Pulse Check of the Luxury Consumer
Multiple Chart
BCG
View slide
This slide features two bar charts showing the costs of conversion and reconversion for different hydrogen storage methods, emphasizing compression costs.
Market Analysis and Trends
Energy & Utilities
The slide explains that conversion and reconversion processes increase LCOH, with compression being the cheapest yet lowest energy-dense option, supported by the charts.
LCOH, conversion, reconversion, compression, storage costs
false
Conversion and reconversion increase LCOH, with compression being the cheapest option but with the lowest energy density once storedHydrogen applications and business models
Multiple Chart
Kearney
View slide
Two maps of Vietnam, one highlighting e-commerce demand and the other supply density, with green and blue shading. Each map points to Hanoi, Danang, and HCM City. Source information includes Google and Bain Analysis.
Market Analysis and Trends
Technology & Software
Analyzes digital participation across Vietnam's top metro cities, showing demand and supply dynamics in e-commerce, beneficial for regional market strategies and investment considerations.
Vietnam, Digital Participation, E-Commerce Demand, Supply Density, Metro Cities, Market Analysis, Geographic Trends, Consumer Behavior, Investment Insights
false
Vietnam Top 3 metro cities lead in digital participation; gaps widen beyonde-Conomy SEA 2023 report: Vietnam
Multiple Chart
Bain
View slide
Slide includes a pathway diagram outlining steps for leveraging risk management in organizational growth, with clear visual markers and directional flow.
Strategic Planning
Professional Services
Provides a strategic guide on integrating risk management into business growth plans, emphasizing realistic goals and leadership, applicable in strategic business planning workshops or seminars.
risk management, strategy, growth, leadership
false
Your journey to making Risk Management a catalyst for growth...Risk Management as a catalyst for growth
Linear Flow
PwC/Strategy&
View slide
A slide presenting nontraditional sales channels with potential in both B2B and B2C sectors, including voice, gaming, and remote interactions, complemented by relevant statistics and expectations.
Technology and Digital Transformation
Retail & E-commerce
Discusses the rise of new sales channels such as voice and gaming, including their potential impact and growth in the B2B and B2C sectors.
Sales Channels, B2B, B2C, Voice Technology, Gaming, Remote Work, AI, Channel Strategy, Market Innovation, Customer Engagement
false
Across B2B and B2C, new sales channels are emerging that are geared toward voice, gaming, and remote/hybrid interactionsBCG Executive Perspectives: The Future of Sales and Marketing is Here
Header Horizontal
BCG
View slide
Slide includes a title at the top, followed by a two-column layout with one column dedicated to methodology description and the other to pie and bar charts displaying demographic data such as ethnicity, age, seniority, and LGBT percentage.
Market Analysis and Trends
Professional Services
The slide presents demographic breakdowns from a survey of 5,000 women across 10 countries, detailing ethnicity, age, seniority, and LGBT representation in the professional environment.
demographics, survey, methodology, ethnicity, age, seniority, professional, representation
false
MethodologyWomen @ Work 2023: 7 The Gender Equality Leaders are benefiting from doing it right
Mixed Chart
Deloitte
View slide
The slide contains an area chart showing the projected economic impact of COVID-19 on New York's GDP, compared to the pre-COVID baseline. It visually represents data points through shading and text annotations to highlight key figures like total economic loss.
Financial Performance
Government & Public Sector
Provides detailed projections of the economic impact of COVID-19 on New York, including total loss and timeline to recovery. Valuable for discussions on fiscal planning and economic strategies in response to pandemics.
COVID-19, economic impact, GDP, New York, projections, recovery, fiscal planning
false
Latest estimates of economic impact in NY is $243B vs. pre-Covid GDP level, and an additional $202B vs. pre-Covid trend, for a total loss of $445BNY COVID-19 Preliminary Economic Impact Assessment
Mixed Chart
BCG
View slide
Bar charts showing banks' debt securities as % of total assets, with a column chart for debt securities portfolio composition
Risk Assessment and Management
Financial Services
The slide discusses interest rate risk on securities portfolios for APAC banks, comparing them to US and European banks. It highlights the implications for corporates.
interest rate, securities, APAC banks, debt, risk
false
Interest rate risk on securities portfolios is a general concern for APAC banks, but it does not appear more pronounced than it is for banks in the US or EuropeMarch Macro Brief Financial fissures emerge
Multiple Chart
Accenture
View slide
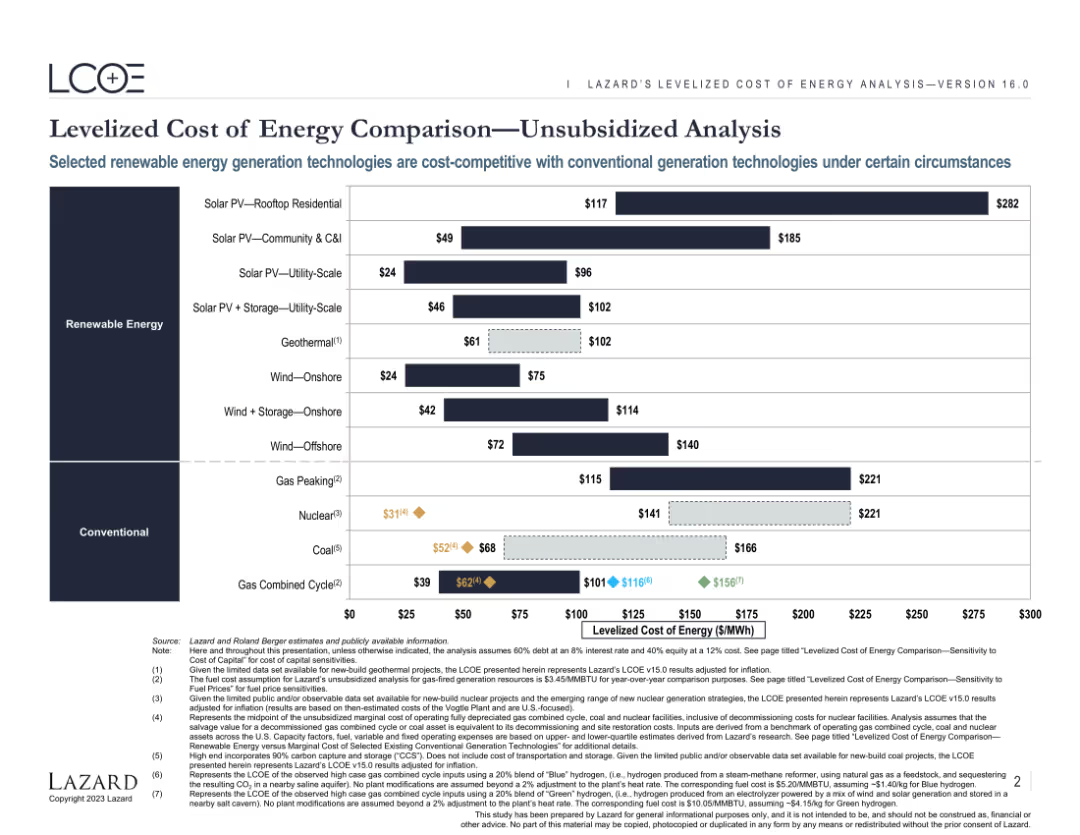
Features a comparative bar chart displaying the levelized cost of energy (LCOE) for various renewable and conventional energy sources. The chart includes both current and projected costs, highlighting the competitiveness of different technologies.
Market Analysis and Trends
Energy & Utilities
Provides an analysis of the levelized cost of energy for various renewable and conventional energy sources. Highlights the cost competitiveness and market potential of different energy generation technologies under specific conditions.
Energy, LCOE, Renewable, Conventional, Comparison
false
Levelized Cost of Energy Comparison—Unsubsidized AnalysisLazards Lcoeplus
Single Chart
Roland Berger
View slide
Column chart comparing the levelized cost of storage for various energy storage systems, both subsidized and unsubsidized, for different configurations and use cases.
Financial Performance
Energy & Utilities
The slide compares the capacity-based levelized cost of storage across multiple energy storage configurations, highlighting the costs with and without subsidies.
Energy storage, Cost analysis, Capacity, Subsidies, Comparison
false
Levelized Cost of Storage Comparison—Capacity ($/kW-year)Lazards Lcoeplus
Single Chart
Roland Berger
View slide
Presents a bar chart categorizing various government operational expenditures such as personnel, subsidies, and interest payments, with monetary values in NS '000.
Regulatory and Compliance
Government & Public Sector
Details operational expenditure categories within the government, essential for financial management and planning, focusing on personnel and interest payments as major expenses.
operational, expenditure, government, financial planning, analysis, personnel, subsidies, interest payments, table, management
false
Operational ExpenditureNational Budget 2024/25 For Our Humanity: Now's the time to work together.
Single Chart
PwC/Strategy&
View slide
Contains four numbered points with blue icons and brief text descriptors, neatly aligned for easy reading.
Investment Analysis
Financial Services
Describes the strategy for capital reinvestment, dividends, share repurchases, and strategic acquisitions focused on growth sectors.
capital allocation, dividends, share repurchase, acquisitions, growth
false
Our capital allocation strategy is focused on growth and returning capital to shareholdersDeutsche Bank Global Industrials & Materials
Header Vertical
Deutsche Bank
View slide
Detailed graph showing the maturity curve of organizational levers in the Automotive-OES sector, featuring elements like social media, cloud, digital sales, and various partnerships.
Strategic Planning
Transportation & Logistics
Explains the development stages of organizational capabilities in the Automotive-OES sector, from traditional setups to advanced digital integrations. Focus on technology and leadership.
automotive, technology, digital, leadership, partnerships, maturity, organizational, development, sector
false
Maturity curve of organizational levers in the Automotive – OES sectorAUTOMOTIVE –OES
Single Chart
Accenture
View slide
The slide includes a combination of column charts, bar charts, and pie charts to display survey data. The charts categorize respondents by country, type of hospital, hospital size, and respondent role.
Market Analysis and Trends
Healthcare & Pharmaceuticals
This slide presents survey data on hospital priorities in APAC, categorizing responses by country, hospital type, size, and roles. It provides insights into the current focus areas for hospital executives.
healthcare, survey, priorities, APAC, hospitals
false
L.E.K. Consulting sponsors a unique analysis of hospital priorities in APAC; our third annual study engaged more than 400 hospital executives across public and private providers in eight key marketsAsia-Pacific 2022 Hospital Priorities Survey: Strategic Implications for Healthcare Providers
Single Chart
LEK
View slide
Lists key topics in a clean format with blue accents. Simple layout for easy reading.
Strategic Planning
Professional Services
Outlines the main points to be covered, focusing on distribution industry dynamics and profitability.
Agenda, Distribution, Profitability, Overview, Dynamics, Strategy
false
Agenda: Distribution industry dynamicsEY-Parthenon Perspectives: Investing in distribution
Agenda
EY
View slide
The slide contains multiple column charts with data annotations and a legend. Dense with numerical data, use of blue tones, and clear segmentation of information.
Investment Analysis
Technology & Software
This slide details the year-over-year growth of Indonesia's digital economy, focusing on sectors such as e-commerce and online media, suitable for presentations on investment opportunities and market growth trends.
digital economy, growth, Indonesia, e-commerce, online media
false
At ~22% YoY GMV growth, Indonesia’s digital economy hits ~$77B in 2022 and is on course to reach ~$130B by 2025, driven primarily by e-commercee-Conomy SEA 2022 Through the waves, towards a sea of opportunity
Multiple Chart
Bain
View slide
This slide features a column chart and textual annotations. The layout is divided into three main columns with comparative data across different years.
Financial Performance
Financial Services
This slide presents the financial investments and adjustments within the franchise, focusing on expense ratios and investment volumes over a three-year period. It is used for evaluating financial discipline and strategic investment outcomes.
Finance, Investment, Expense, Ratio, Comparison, Data-Driven Business, Client Solutions, Client Experience
false
Significant investment in the franchise while maintaining strong expense disciplineCommercial Banking 2022
Mixed Chart
JP Morgan
View slide
The slide contains two column charts side by side, showing cumulative gross cost reductions and cumulative integration-related expenses as percentages of total saves and expenses.
Operational Efficiency
Financial Services
This slide demonstrates the projected cost savings and integration-related expenses from 2023 to 2026, detailing the impact on gross cost savings.
cost savings, expenses, integration, gross cost, 2026
false
~13bn of cumulative gross cost saves to be achieved by year-end 2026Fourth quarter 2023 Results and investor update
Multiple Chart
UBS
View slide
The slide features multiple bar graphs showing the static reach of fuels like crude oil, natural gas, hard coal, lignite, and uranium in years. The graphs compare the reach based on current production and reserve levels.
Market Analysis and Trends
Energy & Utilities
Analyzes the potential scarcity of different fossil fuels based on their current production rates and known reserves. The focus is on how long existing reserves can sustain current production levels, with implications for energy planning and risk management regarding fuel scarcity.
fossil fuels, scarcity, reserves, production, sustainability
false
There is a long static reach of fuels, especially for hard coal and lignite – But some form of scarcity may arise neverthelessRoland Berger Trend Compendium 2030: Megatrend 3 Scarcity of resources
Mixed Chart
Roland Berger
View slide
The slide features a column chart showing changes in assets under management over time, with callout boxes indicating specific factors contributing to the increases or decreases, and an annotation explaining equity movements. The chart uses shades of blue and gray for visual differentiation.
Financial Performance
Financial Services
This slide presents the movements in Macquarie Infrastructure and Real Assets (MIRA) Equity Under Management (EUM), highlighting the impact of new equity raised, listed security price movements, and foreign exchange movements, suitable for financial analysis and investor presentations.
MIRA, EUM, equity, investment, financial analysis, Macquarie, bar graph, performance, capital, foreign exchange
false
MIRA EUM movement Increase of 5% primarily due to new equity raisedGoldman Sachs 16thAnnual Australia and New Zealand Investment Forum
Single Chart
Goldman Sachs
View slide
Includes a pie chart displaying ownership structure post-transaction and a series of bullet points explaining transaction details.
Mergers and Acquisitions
Financial Services
Explains the merger between CDEV and Colgate, outlining the ownership distribution and transaction terms, focusing on shareholder approval and financial considerations.
mergers, acquisitions, ownership structure, shareholder approval, transaction details, equity
false
Transaction Review and Ownership StructureBarclays CEO Energy-Power Conference
Mixed Chart
Barclays
View slide
A comparative layout displaying traditional vs. talent-to-value approaches in engaging organizational change agents, with two pie charts reflecting engagement strategies and their impacts.
Human Resources and Talent Management
Professional Services
This slide contrasts traditional and modern approaches to engaging employees and stakeholders in sustainability strategies, advocating for a broader inclusion of organizational talents and key customers to maximize the strategic impact and operational success in aligning with SDGs.
Employee Engagement, Sustainability, SDGs, Stakeholder Inclusion, Strategic Impact
false
Successful companies identify and engage the key employees, key customers and stakeholders to execute the SDG strategy and drive impactSDG Guide for Business Leaders
Mixed Chart
McKinsey
View slide
The slide features a column chart with annotations, and two iconographic bullet points. Red and grey are the primary colors used in the graphics.
Financial Performance
Financial Services
The slide outlines Leonardo's ESG-linked financial sources, including transactions and key performance indicators aligned with the company's strategy and long-term plans. It emphasizes sustainability in finance.
ESG, finance, sustainability, KPI, funding, credit facility, term loan, CO2 emissions reduction, STEM employment
false
Step up in FOCF in 2021 and 2022Goldman Sachs Investor Meeting
Mixed Chart
Goldman Sachs
View slide
Graphs and statistics about Indonesia's GDP, population demographics, and digital investment growth are presented on a dark background.
Financial Performance
Technology & Software
The slide discusses Indonesia's economic profile, internet users, and investment growth, positioning it as a future digital hub.
Indonesia, GDP, digital hub, investment, economic profile, internet users, growth
false
Indonesia is well-positioned to be the next digital hub in Southeast Asia.Unlocking the next wave of digital growth: beyond metropolitan Indonesia
Pillar
Kearney
View slide
Column charts and icons represent loan volumes and risk metrics. Clear, visual breakdown of data by sector.
Risk Assessment and Management
Financial Services
Examines the growth in lending and maintenance of loan loss rates, detailing risk mitigation measures up to 2026.
lending, risk, loans, 2026, growth
false
Impairment: lending growth to maintain loan loss rate of 50-60bpsFY 2023 Results Announcement
Multiple Chart
Barclays
View slide
The slide features a column chart on the right showing the willingness to purchase crypto assets after seeing advertisements, with a breakdown of responses on the left. The layout is moderately complex.
Market Analysis and Trends
Financial Services
This slide examines the impact of advertising on the willingness to buy crypto assets, showing that most people remain neutral while some become more or less willing to purchase. It aims to evaluate advertising effectiveness.
crypto, advertising, willingness, impact, responses
false
Willingness to Purchase Crypto Assets After Seeing AdvertisingCRYPTO ASSET SURVEY
Mixed Chart
IPSOS
View slide
A visually dense slide with key trends and leadership implications in sales and marketing, utilizing a clear segmentation to guide the viewer through complex information.
Technology and Digital Transformation
Retail & E-commerce
Summarizes the transformation of sales and marketing in light of recent trends, with a focus on digitalization, consumer expectations, and technological advancements.
Sales Trends, Marketing Evolution, Digital Transformation, Leadership Strategy, Consumer Expectations, Technological Innovation, Omnichannel Strategy, Personalization, AI, Data Privacy
false
The future of sales and marketing is hereBCG Executive Perspectives: The Future of Sales and Marketing is Here
Agenda
BCG
View slide
Features bar charts and text highlighting factors affecting workplace satisfaction and motivation.
Human Resources and Talent Management
Professional Services
Analyzes key factors affecting employee motivation and workplace culture, useful for enhancing organizational culture and HR policies.
Employee Motivation, Workplace Culture, Job Satisfaction, Organizational Culture, HR Policies
false
While pay is a main factor, purpose and authenticity round out the top three characteristics employees are looking for at workGlobal Workforce Hopes and Fears Survey 2022
Single Chart
PwC/Strategy&
View slide
This slide presents a horizontal sequence of mobile app screens showing features of the Credit Journey service, including credit score access, historical scores, and tailored offers. Each screen is annotated with explanations of features.
Financial Performance
Financial Services
This slide outlines the Credit Journey service offered by Chase, showing various app functionalities aimed at enhancing customer engagement and providing value through tailored financial products and services.
credit score, customer engagement, app, Chase, financial products, tailored offers, identity protection, historical scores
false
Credit Journey drives repeat customer engagement and familiarity with Chase for prospectsConsumer & Community Banking 2019
Linear Flow
JP Morgan
1
...
Load More
Hold On!
We are searching in our database
If nothing, comes up, please try different filters!
Create a FREE account to continue browsing
Receive Instant Access to 8,000+ of the internet's best slides
First Name
Last Name
Email
Password
I agree to all
Terms & Privacy Policy
Thank you! Your submission has been received!
Oops! Something went wrong while submitting the form.
Have an account?
Sign in
Column Chart
Heatmap
Chevron
Org Chart
Infographic
Callouts
Timeline
List
Graphic
Picture
Process Flow
Diagram
Paragraph
Map
Table
Framework
Subtitle
Takeaway Box
Icon
Other Chart
Radar Chart
Waterfall Chart
Mekko Chart
Pie Chart
Scatter Plot
Line Chart
Bar chart
Bullet points