My Account
My Slides
Search by Category
Templates
Leave Feedback
Login
Logout
Get Started
Browse all Slides
Browse all Slides
Create a FREE Account
Instant access to 1,000+ real slides from top companies like McKinsey, BCG, Goldman Sachs, Google and many more!
First Name
Last Name
Email
Password
I agree to all
Terms & Privacy Policy
Thank you! Your submission has been received!
Oops! Something went wrong while submitting the form.
Have an account?
Sign in
Instant access to the internet's best slides
Get access to 40+ advanced filters and more
Advanced Search and Filters
Access to
10,000+ slides
Access to Category Pages
Save/Bookmark Slides
PowerPoint Template Library (New)
Choose your plan
MONTHLY
$12/month
Billed every month, cancel anytime.
YEARLY
$9/month
Billed $108 annually, cancel anytime.
Checkout for $12/month
Checkout for $108/yr
Secured by Stripe | AES-256 bit encryption
📢 Ready to start building slides? Check out our new template library
view templates
Welcome,
Welcome
Upgrade to SlideStart
Pro
Instant access to 15,000+ slides
Show Featured Only
Checkbox 8
Companies
Mckinsey
Bain
BCG
EY
Deloitte
Accenture
PwC/Strategy&
JP Morgan
Goldman Sachs
Morgan Stanley
Citigroup
Deutsche Bank
Barclays
LEK
Kearney
Oliver Wyman
Booz Allen Hamilton
Gartner
IPSOS
Nielsen
Slide type
Header Horizontal
Framework
Vertical Flow
Single Chart
Single Chart
Text Only
Mixed Chart
Header Vertical
Graphic
Pillar
Multiple Chart
Agenda
Title
Table
Linear Flow
Upgrade to SlideStart
Pro
Instant access to 40+ advanced filters
Industry
Upgrade to SlideStart
Pro
Instant access to 40+ advanced filters
Technology
Healthcare
Financial Services
Consumer Goods
Energy & Utilities
Manufacturing
Retail
E-commerce
Logistics
Telecommunications
Real Estate
Professional Services
Education
Media
Entertainment
Hospitatlity
Tourism
Agriculture
Food Production
Government & Public Sector
Environmental
Sustainability
Use Case
Upgrade to SlideStart
Pro
Instant access to 40+ advanced filters
Sales and Business Development
Mergers and Acquisitions
Corporate Finance and Valuation
Performance Metrics and KPIs
Client Case Studies
Competitive Landscape
Product and Service Analysis
Customer and Market Segmentation
Organizational Structure
Human Resources and Talent Management
Industry Overview
Regulatory and Compliance
Risk Assessment and Management
Agriculture & Food Production
Hospitality and Tourism
Government
Environmental
Sustainability
Clear all
Thank you! Your submission has been received!
Oops! Something went wrong while submitting the form.
Show Featured Only
Checkbox 8
Companies
Mckinsey
Bain
BCG
EY
Deloitte
Accenture
PwC/Strategy&
JP Morgan
Goldman Sachs
Morgan Stanley
Citigroup
Deutsche Bank
Barclays
LEK
Kearney
Oliver Wyman
Booz Allen Hamilton
Gartner
IPSOS
Nielsen
Slide type
Text Only
Linear Flow
Vertical Flow
Single Chart
Header Horizontal
Mixed Chart
Header Vertical
Pillar
Multiple Chart
Graphic
Agenda
Title
Table
Framework
Industry
Technology
Healthcare
Financial Services
Consumer Goods
Energy & Utilities
Manufacturing
Retail
E-commerce
Logistics
Telecommunications
Real Estate
Professional Services
Education
Media
Entertainment
Hospitatlity
Tourism
Agriculture
Food Production
Government & Public Sector
Environmental
Sustainability
Use Case
Sales and Business Development
Mergers and Acquisitions
Corporate Finance and Valuation
Performance Metrics and KPIs
Client Case Studies
Competitive Landscape
Product and Service Analysis
Customer and Market Segmentation
Organizational Structure
Human Resources and Talent Management
Industry Overview
Regulatory and Compliance
Risk Assessment and Management
Agriculture & Food Production
Hospitality and Tourism
Government
Environmental
Sustainability
Clear all
Thank you! Your submission has been received!
Oops! Something went wrong while submitting the form.
Tag
View slide
Includes a line chart on the left showing macro hedge fund relative performance and volatility, and a column chart on the right comparing hedge fund style returns during bear markets.
Risk Assessment and Management
Financial Services
This slide analyzes volatility in alternative investments, focusing on macro hedge fund performance and comparing different hedge fund styles during bear markets.
volatility, hedge funds, performance, alternative investments, bear markets
false
Volatility and alternative investmentsGuide to the Markets UK | Q2 2024
Multiple Chart
JP Morgan
View slide
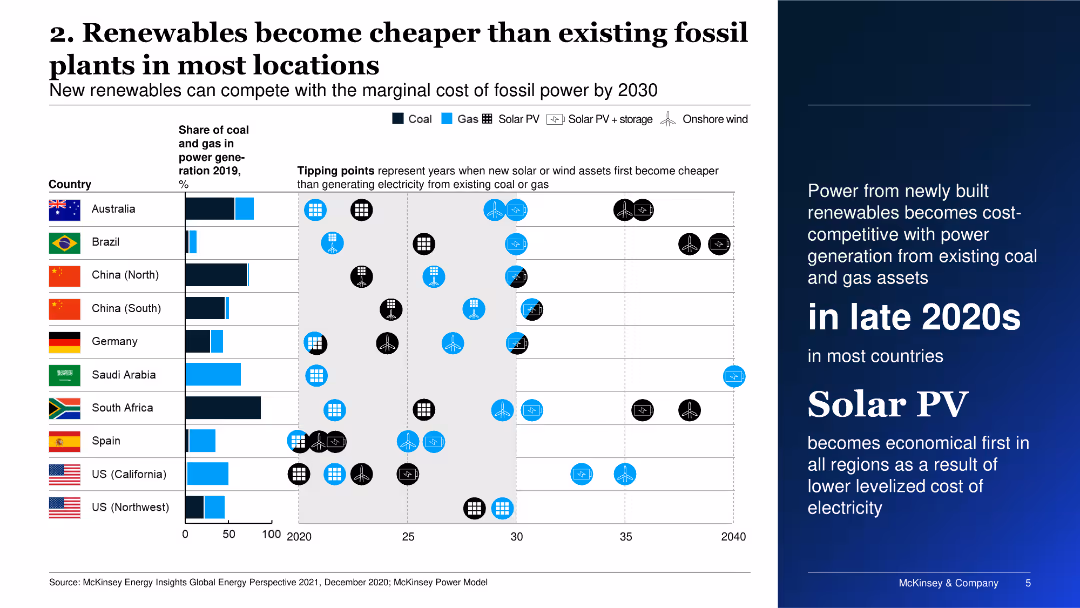
The slide includes a bar chart showing the break-even production cost of clean hydrogen versus incumbent technology across various sectors.
Technology and Digital Transformation
Energy & Utilities
The slide evaluates the cost-competitiveness of clean hydrogen in different sectors, emphasizing the potential for hydrogen to become competitive by 2030.
clean hydrogen, cost-competitive, sectors, 2030, energy
false
2. Renewables become cheaper than existing fossil plants in most locationsGlobal Energy Perspective 2021
Mixed Chart
McKinsey
View slide
Slide presents a column chart showing marketers' ratings on how climate-related changes influence customer experience, divided by business sectors.
Product and Service Analysis
Environmental Services & Sustainability
Evaluates marketers' beliefs regarding the impact of climate-related changes on customer experience, providing insights across different sectors.
climate change, customer experience, product changes, marketer opinions, sustainability
false
Marketers do not believe that making climate-related changes to products/services will change their customers’ experienceThe CMO Survey The Highlights and Insights Report February 2022
Mixed Chart
Deloitte
View slide
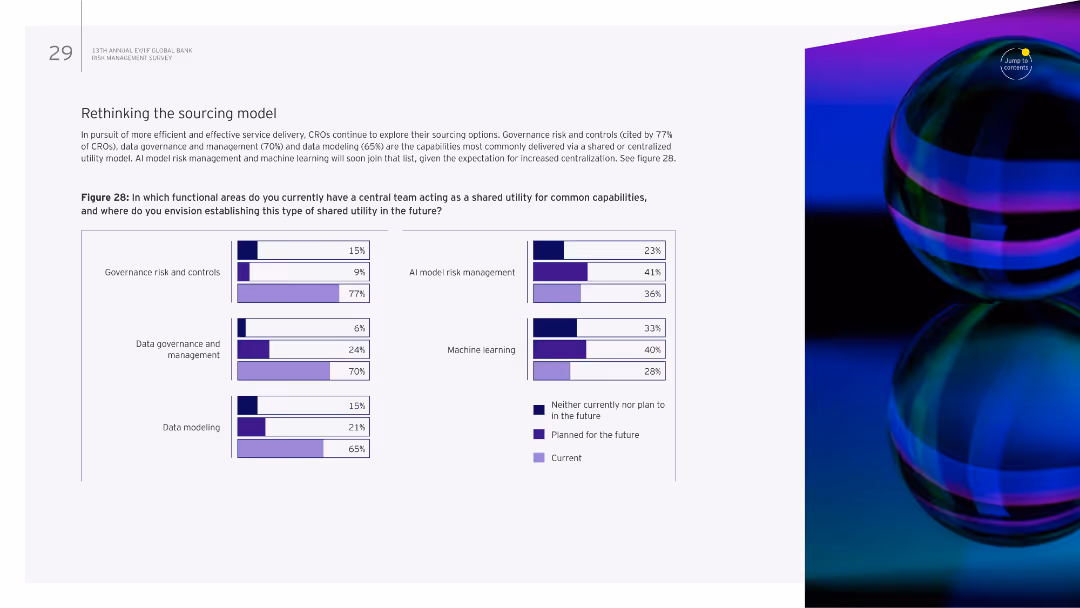
A content slide with text on the left and a column chart on the right. The chart highlights risk management roles and functions with potential for outsourcing.
Operational Efficiency
Financial Services
This slide discusses the potential for outsourcing and co-sourcing in risk management, identifying key functions that could benefit from these strategies.
outsourcing, co-sourcing, risk management, functions, strategies
false
Rethinking the sourcing model In pursuit of more efficient and effective service delivery, CROs continue to explore their sourcing optionsManaging through persistent volatility: the evolving role of the CRO and the need for organizational agility
Multiple Chart
EY
View slide
An advanced layout that includes a series of bar graphs comparing the company's CRE concentration to its peers. Each bar graph is dedicated to a different aspect of CRE concentration, such as "Other CRE," "Multifamily," and "Office CRE." The slide is information-dense, using different shades of blue and gray to differentiate between the company and its peers.
Competitive Landscape
Financial Services
The slide compares the company’s commercial real estate (CRE) concentration to that of its peers, highlighting a strategic position of having the lowest CRE concentration. It serves to underline the company's prudent risk management practices in loan portfolio distribution.
CRE Concentration, Competitive Analysis, Risk Management, Real Estate, Loan Portfolio, Peer Comparison, Strategy, Market Position
false
Lowest CRE concentration relative to peersMorgan Stanley US Financials, Payments, & CRE Conference
Multiple Chart
Morgan Stanley
View slide
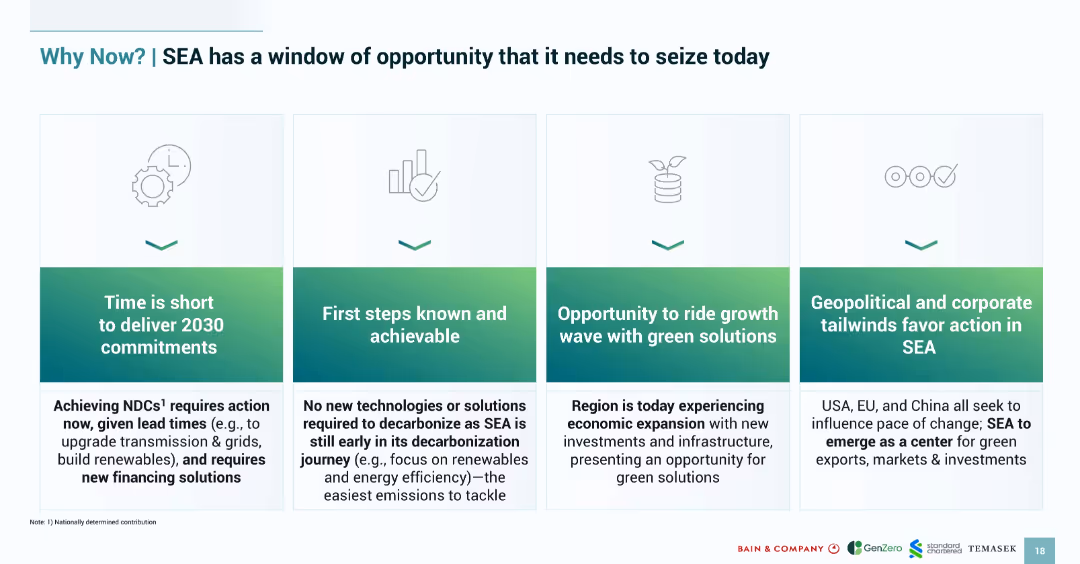
Four-tile layout with icons and captions outlining urgent reasons for SEA to act on green transition; soft green gradient background.
Strategic Planning
Environmental Services & Sustainability
Lays out four reasons why Southeast Asia must act now on decarbonization: short timelines, actionable steps, economic growth synergy, and geopolitical support. Emphasizes urgency and achievability.
SEA, decarbonization, urgency, opportunity, strategic timing, green transition
false
Why Now? | SEA has a window of opportunity that it needs to seize todaySOUTHEAST ASIA’S GREEN ECONOMY 2024
Pillar
Bain
View slide
The slide features a pie chart and a column chart. The pie chart shows the split of QT investments by investor type (2001-2022), while the column chart shows the change in QT investments by investor type between 2001-21 and 2022.
Investment Analysis
Financial Services
This slide indicates that venture capital and private funding dominate QT investments, making up nearly 80% of inflows, with significant growth in 2022.
venture capital, private funding, QT investments, investor types, growth analysis
false
Venture capital and other private funding make up nearly 80 percent of QT inflows; venture capital, private, and angel investments grew in 2022.Quantum Technology Monitor
Multiple Chart
McKinsey
View slide
Column chart comparing economic expectations of study respondents for 2018 and 2019, with categories for upturn, boom, downturn, and recession.
Market Analysis and Trends
Financial Services
The slide analyzes the shifting economic expectations of participants in the 10th Operations Efficiency Radar, comparing sentiments from 2018 and 2019. It highlights the growing anticipation of an economic downturn among respondents, reflecting changes in business confidence and economic outlook.
Economic Expectations, Operations Efficiency, Downturn
false
In this environment, the 10th Operations Efficiency Radar provides additional guidance on prioritized efficiency levers for 2019 overall …10th Operations Efficiency Radar
Mixed Chart
Roland Berger
View slide
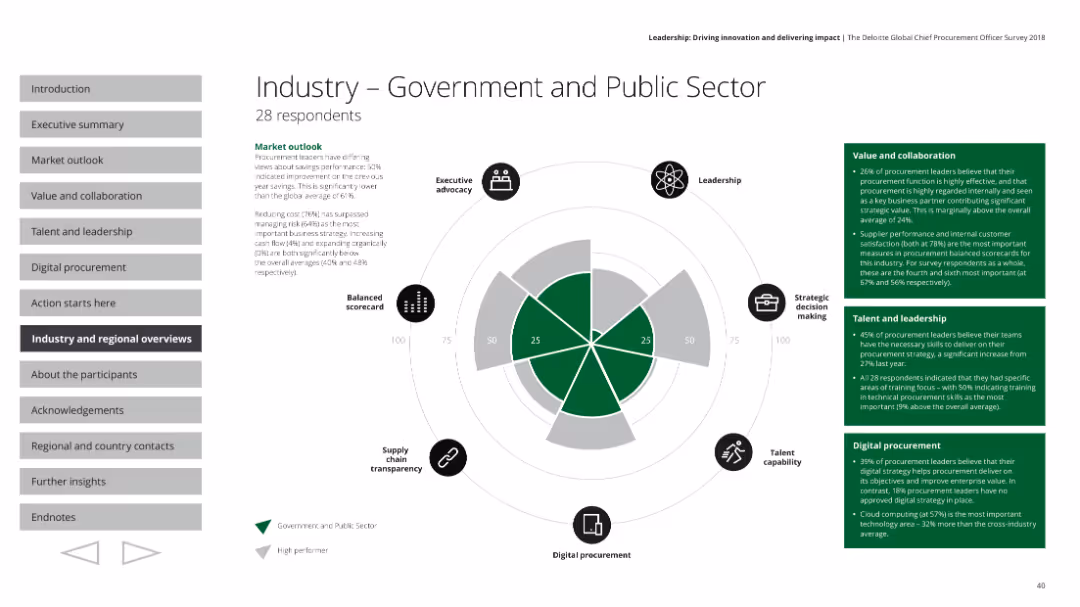
The slide features a radar chart, text boxes with survey results, and small icons indicating various aspects of performance.
Industry Overview
Government & Public Sector
This slide provides an overview of the government and public sector's procurement performance based on a survey. It covers executive advocacy, leadership, strategic decision making, talent capability, digital procurement, and supply chain transparency, with detailed market outlook and specific metrics on value, collaboration, talent, and leadership.
Government, public sector, procurement, radar chart, performance
false
Industry - Government and Public SectorLeadership: Driving innovation and delivering impact The Deloitte Global Chief Procurement Officer Survey 2018
Mixed Chart
Deloitte
View slide
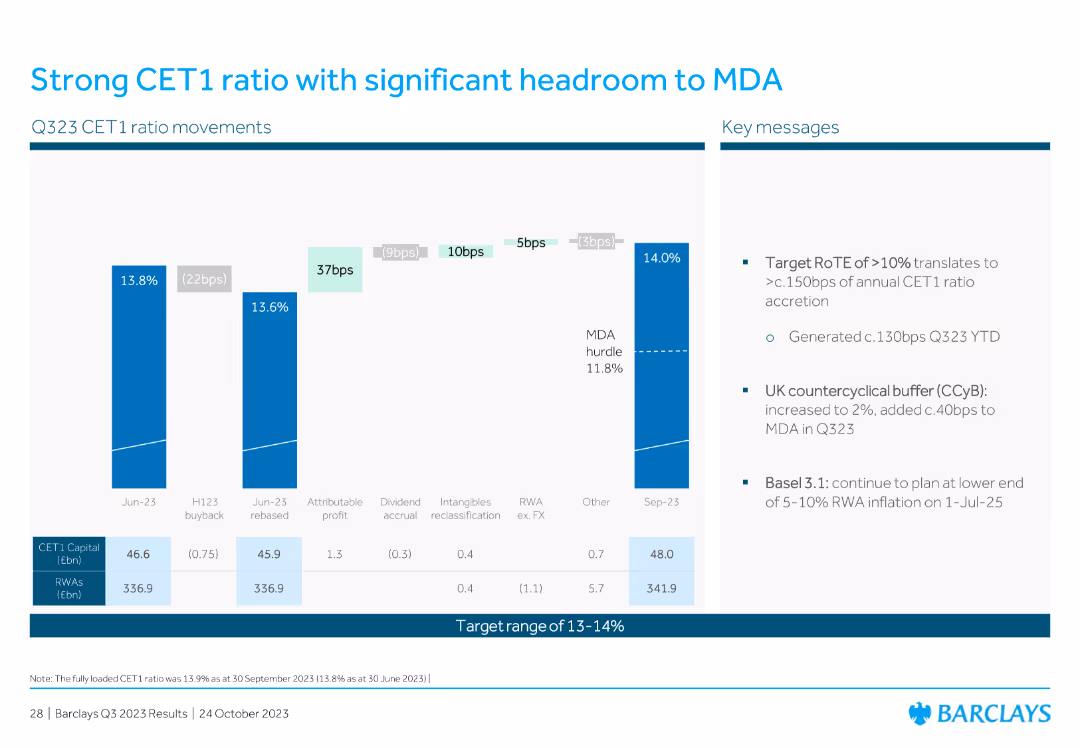
Displays a vertical bar chart showing CET1 ratio movements and key messages. The layout is clean, with a strong focus on data points and explanatory text.
Financial Performance
Financial Services
The slide illustrates the CET1 ratio movements and key messages related to financial health and regulatory requirements, emphasizing the bank's robust capital position and strategic targets.
CET1 ratio, MDA, capital, financial health, regulatory, key messages, capital position
false
Strong CET1 ratio with significant headroom to MDABarclays PLC Q3 2023 Fixed Income Investor Presentation
Mixed Chart
Barclays
View slide
A composite slide with two images of women, text, and a graph detailing statistics about women's menstrual health at work. The design is informative, with clear sections for textual explanation and data visualization in a professional blue and green color scheme.
Technology and Digital Transformation
Healthcare & Pharmaceuticals
The slide presents statistical data on menstrual health challenges affecting women in the workplace, suggesting the need for policy changes regarding paid leave for menstrual symptoms.
menstrual health, workplace, statistics, policy, paid leave, health challenges
false
Women who experience challenges related to their menstrual health often work through their symptomsWomen @ Work 2023: 2 When it comes to women's health, many are suffering in silence
Single Chart
Deloitte
View slide
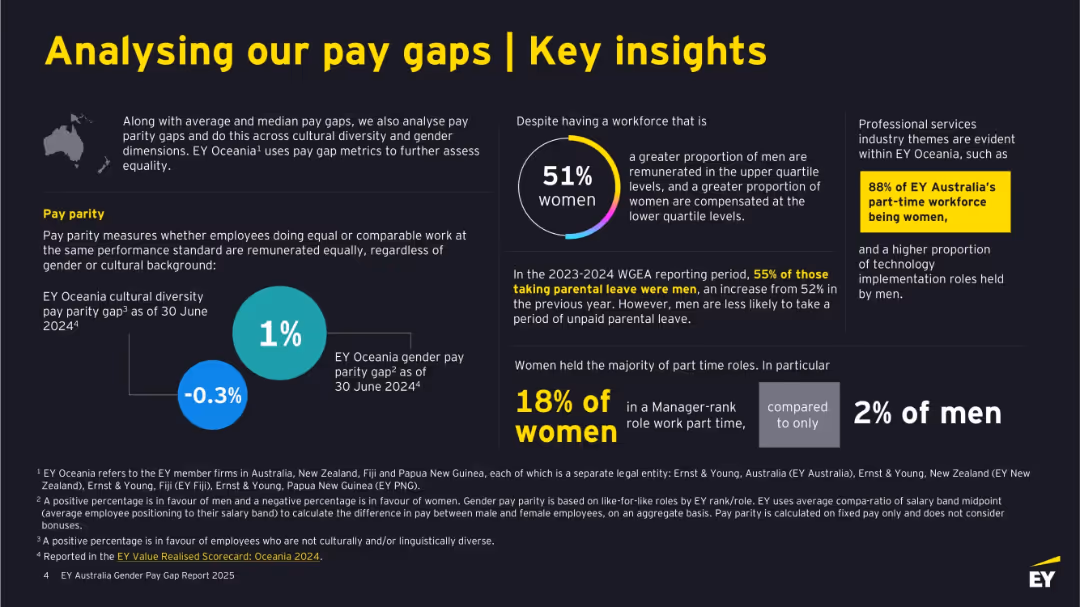
Multi-section layout on a dark background with white and yellow text. Includes infographic circles, text blocks, and callouts. Balanced left/right text and graphics.
Human Resources and Talent Management
Professional Services
This slide presents further analysis of pay gaps by highlighting gender and cultural diversity metrics, part-time work trends, and parental leave stats. It reveals workforce composition and roles by gender, emphasizing equity efforts and the professional services industry context. It also shows specific metrics like a 1% diversity gap and 88% women in part-time roles.
gender equality, diversity, pay parity, parental leave, part-time, workforce, EY Oceania, cultural inclusion
false
Analysing our pay gaps | Key insightsEY Australia Gender Pay Gap Report 2025
Mixed Chart
EY
View slide
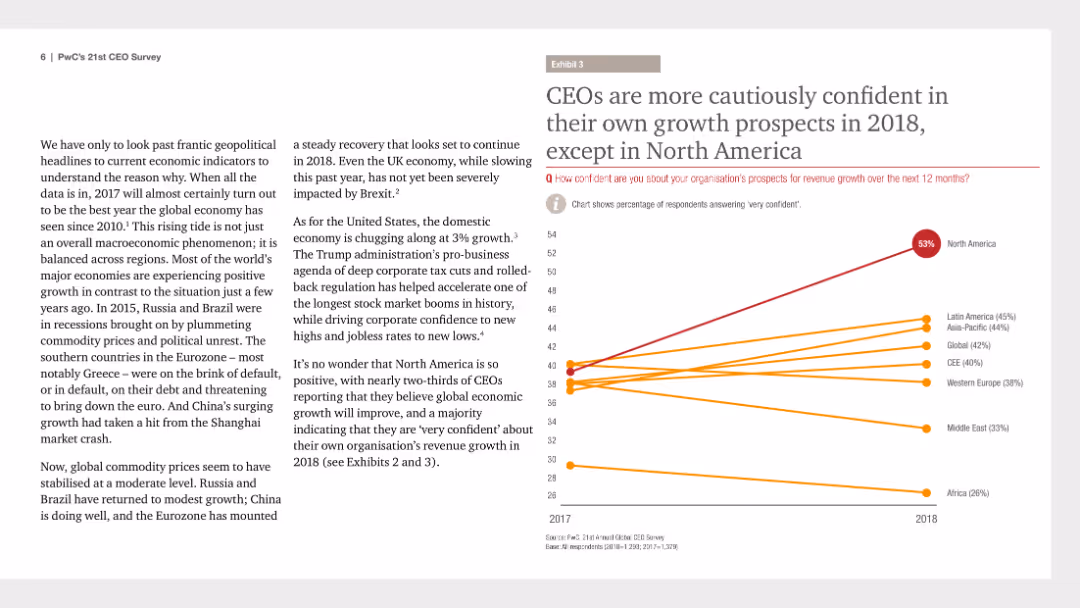
This slide includes a line chart that tracks CEO confidence in their organization's growth prospects from 2017 to 2018, with lines representing different regions.
Strategic Planning
Financial Services
The slide highlights CEO confidence levels regarding their own growth prospects for 2018 compared to 2017, emphasizing caution in most regions except North America.
CEO confidence, growth prospects, 2018, strategic planning, regional comparison, line chart, PwC, CEO Survey, cautious optimism
false
CEOs are more cautiously confident in their own growth prospects in 2018, except in North America21st CEO Survey The Anxious Optimist in the Corner Office
Mixed Chart
PwC/Strategy&
View slide
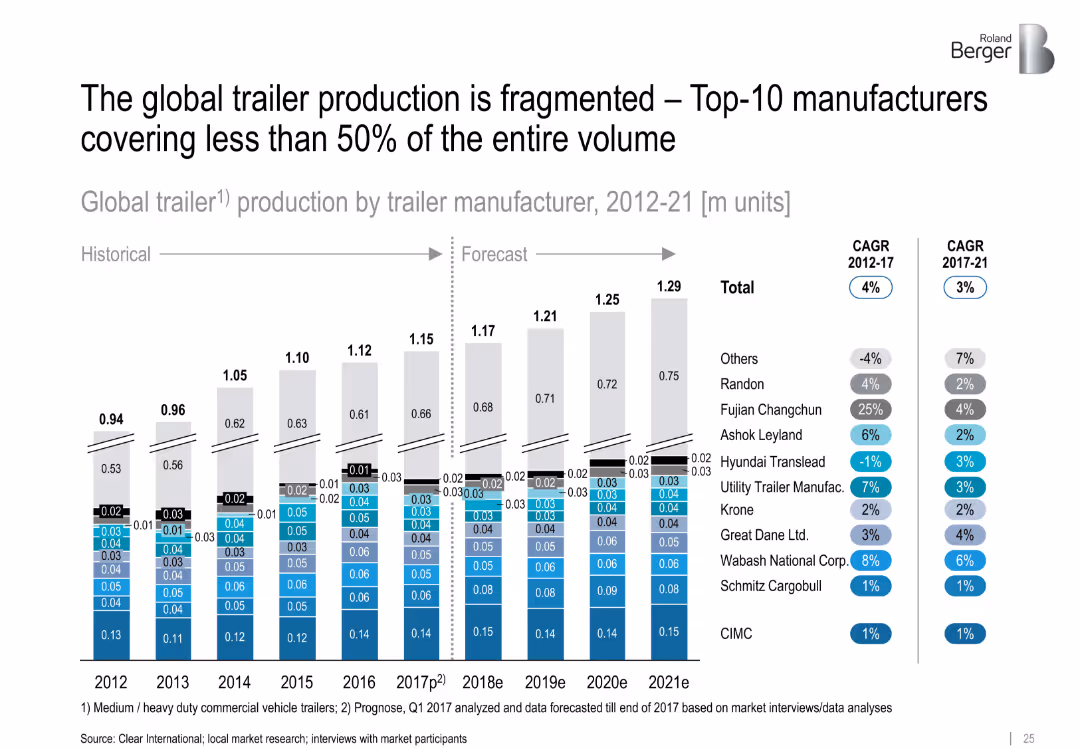
Stacked bar chart showing trailer production by manufacturer (2012–2021) with CAGR per company
Competitive Landscape
Industrial & Manufacturing
This slide emphasizes the fragmentation of the global trailer manufacturing market, where even the top 10 players account for less than 50% of volume. Detailed stacked bars show annual production by brand and CAGR metrics.
trailer manufacturers, fragmentation, global market, production trends, top 10, CAGR
false
The global trailer production is fragmented – Top-10 manufacturers covering less than 50% of the entire volumeTruck and trailer components – Success factors for suppliers in specialized markets
Linear Flow
Roland Berger
View slide
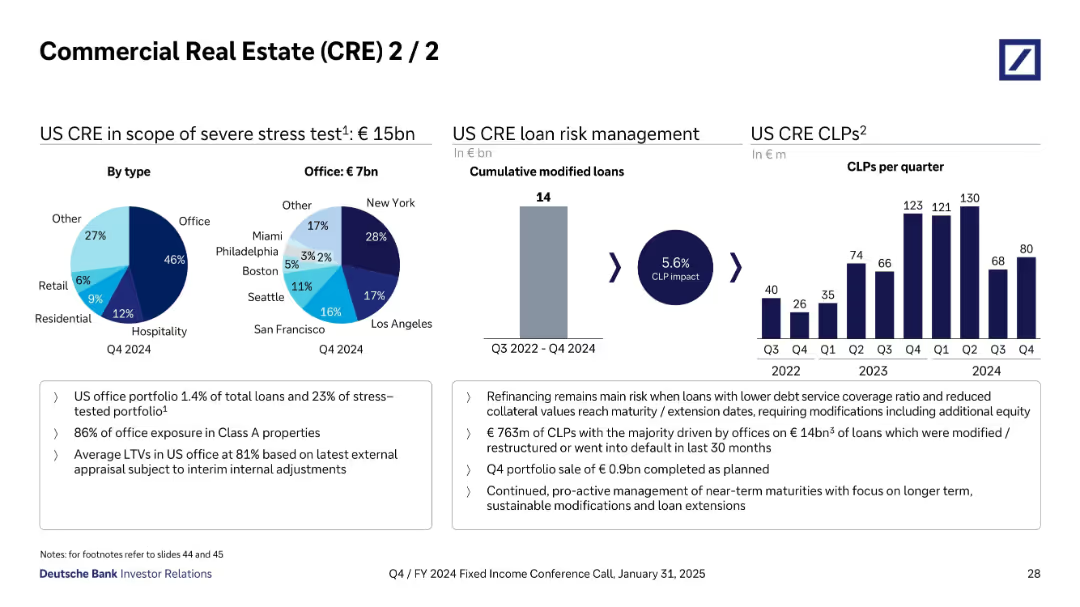
Left section shows pie charts for US CRE by type and office distribution; middle shows bar chart of cumulative modified loans; right shows quarterly CLPs bar chart.
Risk Assessment and Management
Financial Services
Focuses on US CRE stress exposure (€15bn), especially US office loans (€7bn) with significant risk in cities like NYC and LA. Emphasizes loan modifications and €763m CLPs driven by refinancing risk and office default trends.
US CRE, loan modifications, CLP, stress test, office, refinancing, defaults
false
Commercial Real Estate (CRE) 2 / 2Q4/FY 2024 Fixed Income Investor Conference Call
Multiple Chart
Deutsche Bank
View slide
Pyramid graphs, text overlays and column chart
Market Analysis and Trends
Retail & E-commerce
Predicts expansion of luxury market consumer base.
luxury, customer base, 2025, Asia
false
THE LUXURY CUSTOMER BASE WILL CONTINUE TO BE ENLARGED FROM THE BOTTOM DRIVING FUTURE GROWTH OF THE ENTRY-PRICE SEGMENTBAIN-ALTAGAMMA 2019 WORLDWIDE LUXURY MARKET MONITOR
Multiple Chart
Bain
View slide
Depicts a line chart measuring the effectiveness of linking social media to marketing strategies over time, with sector-specific insights.
Strategic Planning
Professional Services
Assesses the effectiveness of integrating social media with marketing strategies, crucial for strategic planning in tech and professional services.
social media, marketing, strategy, integration, effectiveness, technology, professional services, planning, assessment
false
Marketers improve their abilities to effectively link social media to their overarching marketing strategiesThe CMO Survey The Highlights and Insights Report February 2022
Mixed Chart
Deloitte
View slide
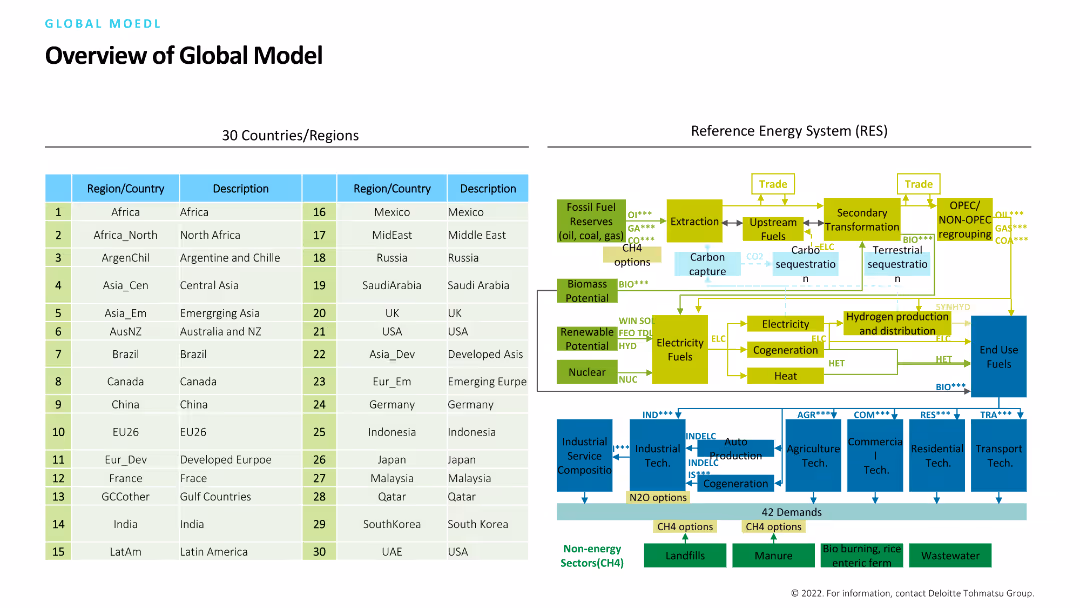
The slide is divided into two sections: a table listing 30 countries/regions with descriptions, and a complex flow diagram illustrating the reference energy system (RES), including fossil fuel reserves, renewable potential, and more.
Strategic Planning
Industrial & Manufacturing
The slide provides a comprehensive overview of a global model, detailing regions and their energy systems. It's intended for strategic planning in the energy and manufacturing sectors, showing resource and energy flows.
Global model, energy system, regions, strategic planning, reference energy system
false
Overview of Global ModelMulti-regional transmission model
Header Horizontal
Deloitte
View slide
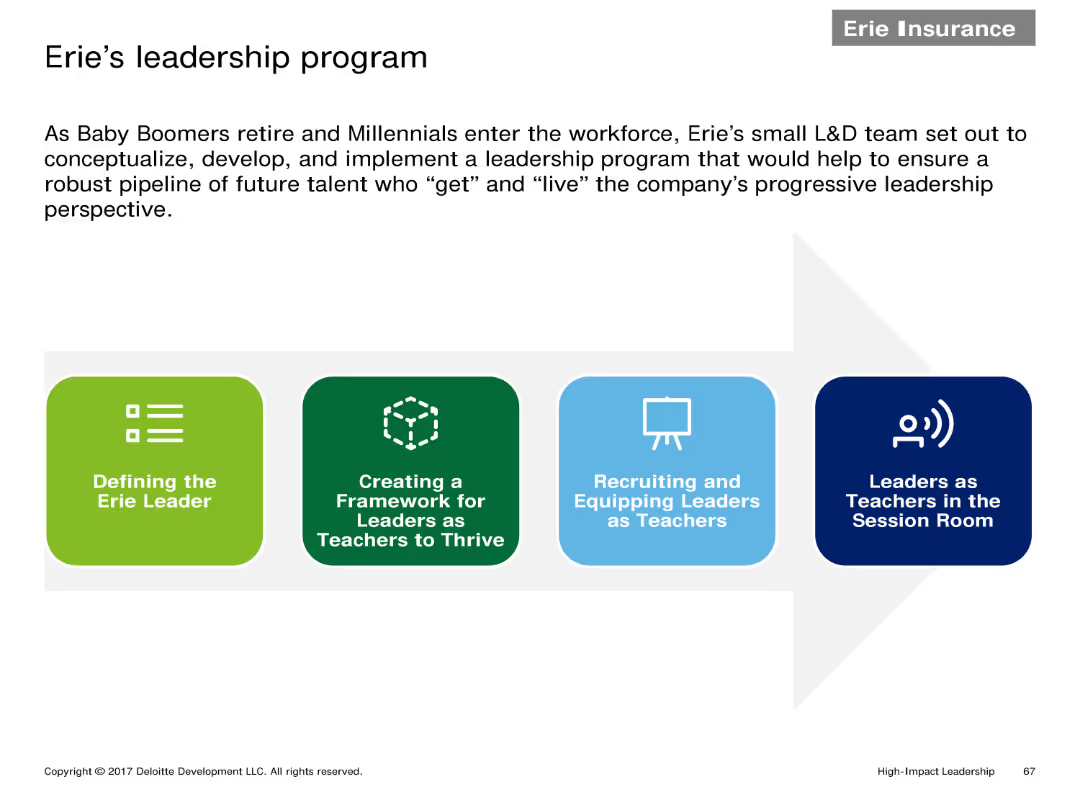
A horizontal flowchart with four stages: Defining the Erie Leader, Creating a Framework for Leaders, Recruiting and Equipping Leaders, Leaders as Teachers.
Human Resources and Talent Management
Financial Services
Describes the steps of Erie's leadership program aimed at developing future leaders within the organization by focusing on defining, creating frameworks, and equipping leaders.
Leadership program, flowchart, future leaders, Erie, framework
false
Erie’s leadership programHigh-Impact Leadership Master Deck
Linear Flow
Deloitte
View slide
A series of blocks and arrows outline the current state and a 5-year growth plan, with textual and numerical information in a clear, linear fashion. The color scheme is predominantly blue with white text for readability.
Financial Performance
Financial Services
Describes a pro forma simulation for third-party growth, balance sheet management, and future fee-earning potential, including plans for asset under supervision (AUS) growth and capital strategy.
Growth, Balance Sheet, Pro Forma, AUS, Capital
false
3rd Party Growth and Balance Sheet Remix OpportunityGoldman Sachs Investor Day
Table
Goldman Sachs
View slide
This slide uses line charts to compare GDP growth and recovery patterns after various flu outbreaks (SARS, H2N2, H3N2, Spanish Flu) with COVID-19. It uses color highlights to draw attention to specific data points and recovery phases.
Strategic Planning
Healthcare & Pharmaceuticals
Compares economic impacts of various pandemics, providing a historical perspective to gauge the potential recovery trajectory from COVID-19. Useful for healthcare policy planning and economic forecasting discussions.
pandemics, GDP, economic impact, recovery, SARS, Spanish Flu, COVID-19, healthcare policy
false
Empirically, flu shocks have been V-shaped - at this point - Covid-19 is a deep V-shaped, veering towards a U-shapeNY COVID-19 Preliminary Economic Impact Assessment
Multiple Chart
BCG
View slide
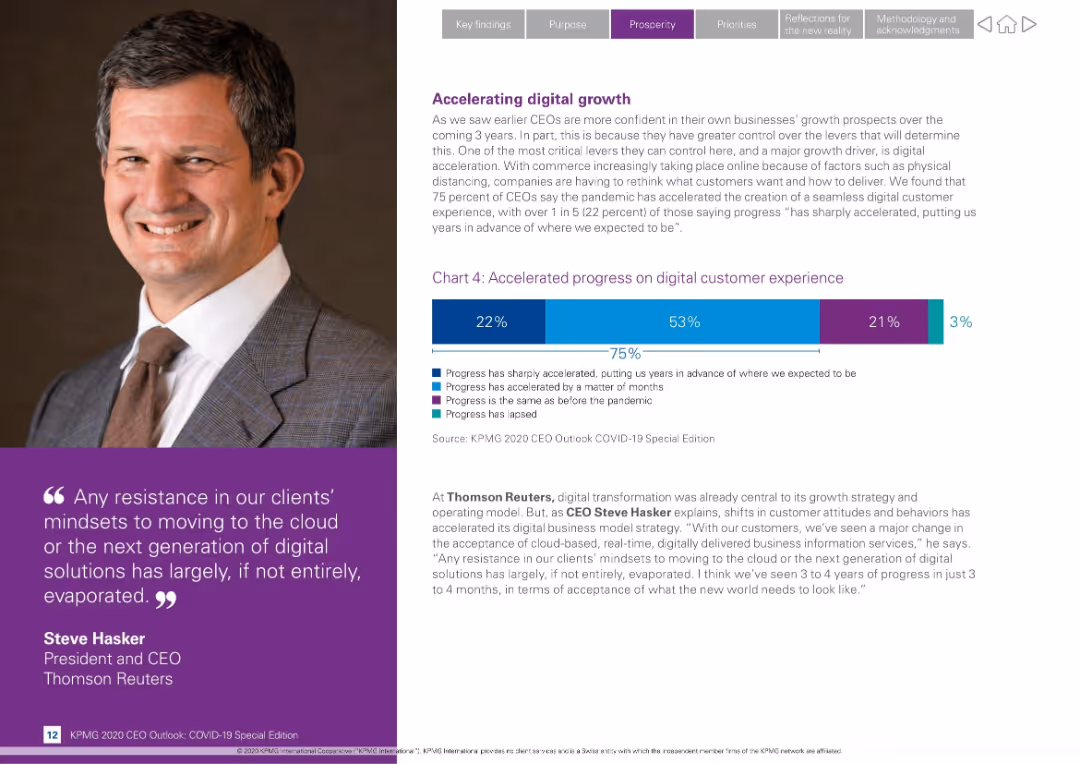
Split layout with CEO photo left, bar chart and narrative on right; features quote and digital transformation stats
Technology and Digital Transformation
Technology & Software
Highlights how the pandemic has accelerated digital transformation, especially customer experience. 75% of CEOs say progress accelerated; includes quote from Steve Hasker of Thomson Reuters on cloud adoption.
digital growth, transformation, customer experience, Steve Hasker, COVID-19, technology, progress acceleration, cloud adoption, KPMG
false
Accelerating digital growthKPMG 2020 CEO Outlook: COVID-19 Special Edition
Mixed Chart
KPMG
View slide
Two-column comparison format, with icons and bullet points, contrasting two strategies. Uses a mix of text and imagery to convey information.
Strategic Planning
Financial Services
Details capabilities to boost an affluent strategy, contrasting the First Republic model with the CCB affluent strategy across various service dimensions.
affluent strategy, relationship-based lending, expert advice, service model, product benefits, wealth management
false
First Republic provides capabilities to accelerate our existing affluent strategyInverstors Day 2023
Table
JP Morgan
View slide
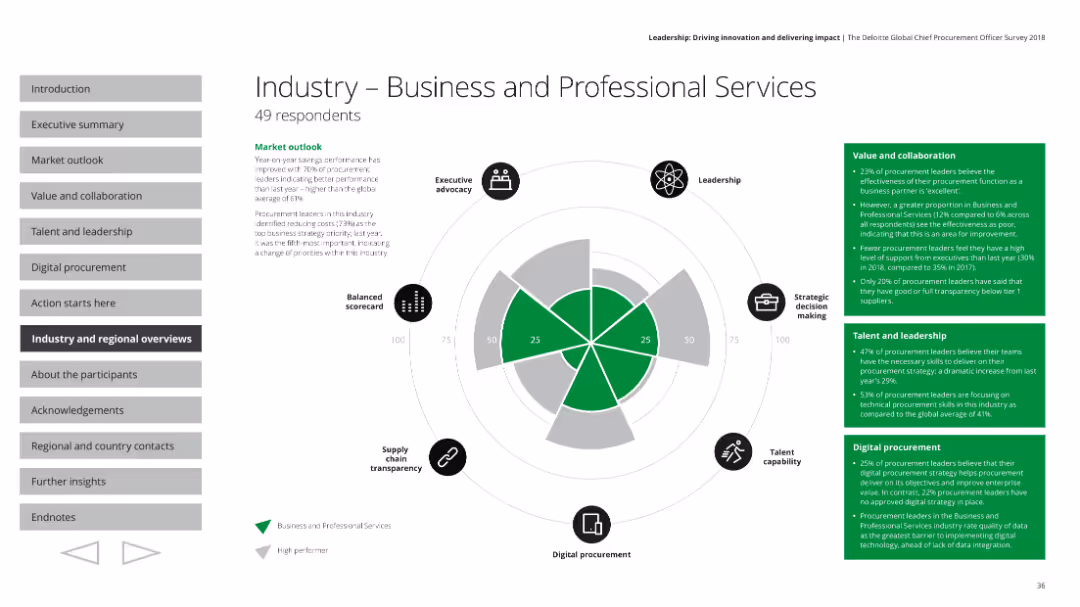
Includes a radar chart and text blocks summarizing key performance areas like market outlook, value and collaboration, and leadership in the industry.
Industry Overview
Professional Services
Provides an overview of the business and professional services industry, detailing performance metrics, strategic priorities, and leadership challenges.
Industry overview, performance, strategy, leadership
false
Industry - Business and Professional ServicesLeadership: Driving innovation and delivering impact The Deloitte Global Chief Procurement Officer Survey 2018
Mixed Chart
Deloitte
View slide
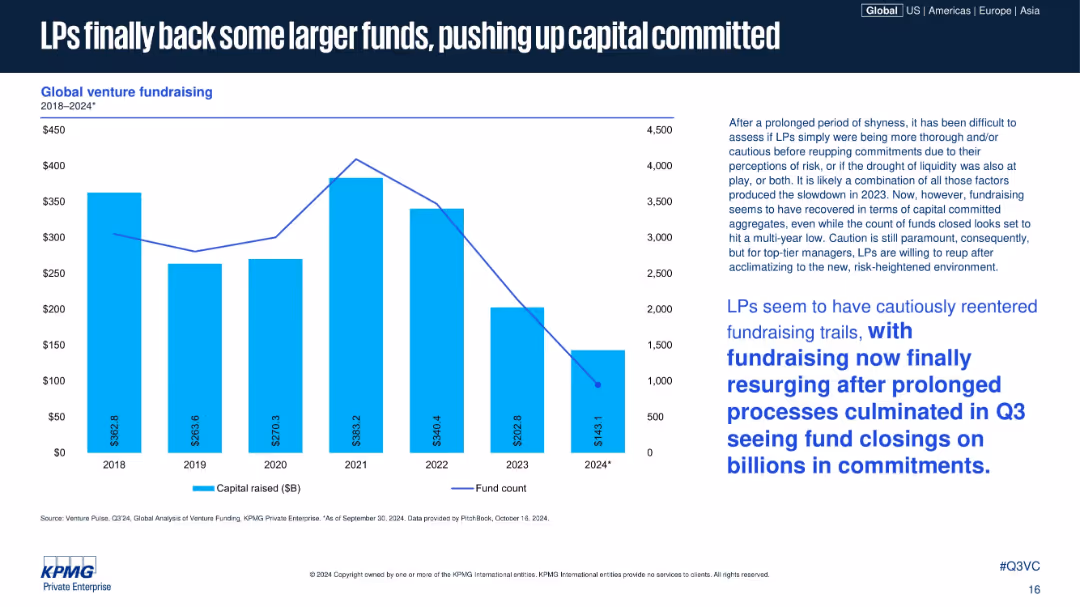
Bar chart with overlay line showing capital raised vs. fund count, 2018–2024; right column of text offers commentary; blue theme throughout.
Strategic Planning
Financial Services
The slide details global venture fundraising trends, showing a recovery in capital raised in 2024 despite a drop in the number of funds closed. Commentary explains LPs are cautiously returning, backing larger funds after a period of risk aversion and liquidity concerns.
fundraising, LPs, venture capital, capital committed, fund count, 2024 rebound, investor confidence, capital deployment, risk appetite
false
LPs finally back some larger funds, pushing up capital...Venture Pulse Q3 2024
Mixed Chart
KPMG
View slide
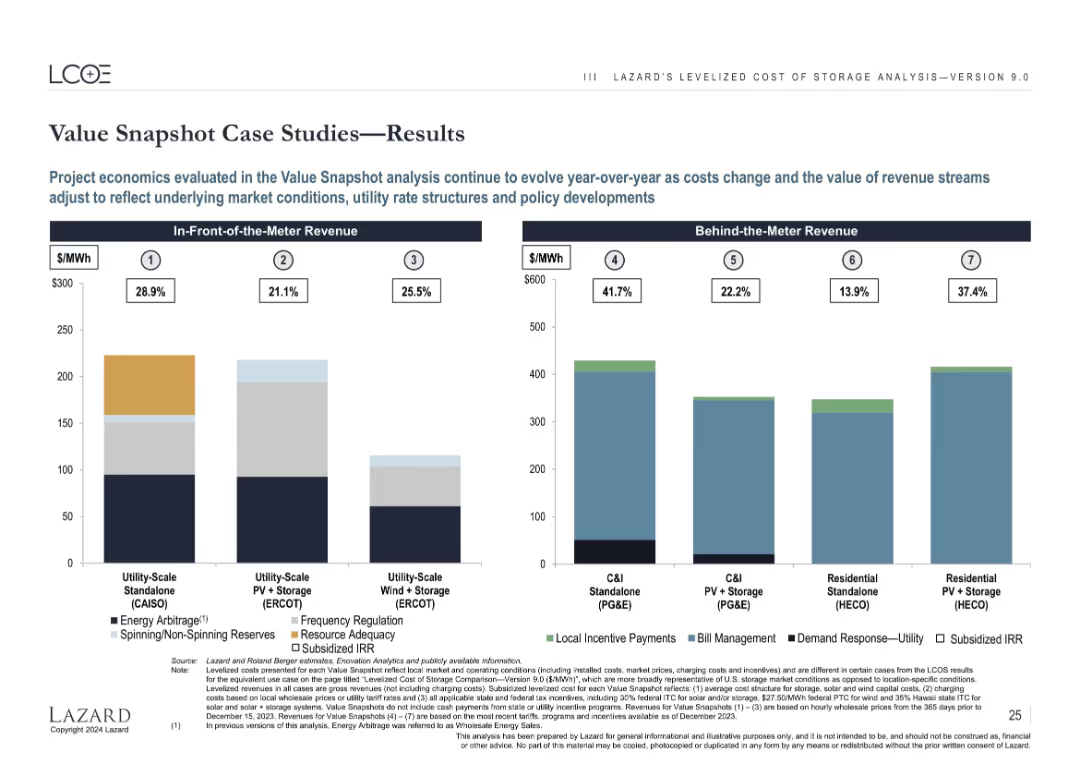
Split bar charts showing revenue breakdowns by use case, with value percentages and revenue sources.
Investment Analysis
Energy & Utilities
Visualizes revenue composition from each of the 7 case studies listed earlier. In-front-of-the-meter and behind-the-meter projects are separated, with revenue split across categories like energy arbitrage, subsidies, and demand response, including IRR estimates.
project economics, revenue, arbitrage, incentives, IRR, behind-the-meter, in-front
false
Value Snapshot Case Studies—ResultsLazard LCOE+
Multiple Chart
Roland Berger
View slide
White background with multiple text sections and bar charts showing credit cost distribution over time. Important quotes highlighted.
Market Analysis and Trends
Environmental Services & Sustainability
Analyzes the increasing demand for carbon credits, rising costs, and the implications for future pricing and supply dynamics.
demand increase, carbon credits, supply costs
false
Increasing demand, race to quality and rising unit supply costs will result in carbon credits being scarce and expensive across all outlooksEssential, expensive and evolving: The outlook for carbon credits and offsets
Multiple Chart
EY
View slide
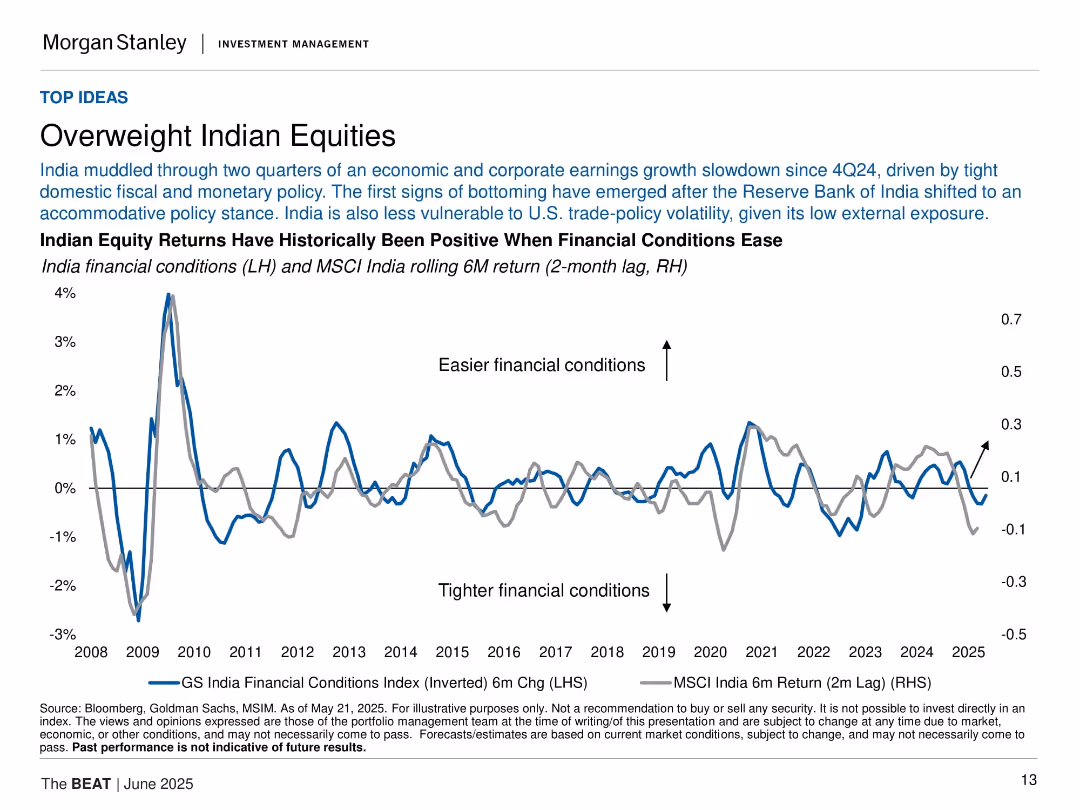
Dual-axis line chart showing India financial conditions and equity returns; minimal layout with focus on trends.
Investment Analysis
Financial Services
This slide supports overweighting Indian equities based on easing financial conditions and accommodative policy by the RBI. A dual-line chart illustrates the historical correlation between financial conditions and equity returns.
Indian equities, financial conditions, RBI, monetary policy, MSCI India, investments, easing, macroeconomic, returns
false
Overweight Indian EquitiesThe BEAT June 2025
Single Chart
Morgan Stanley
View slide
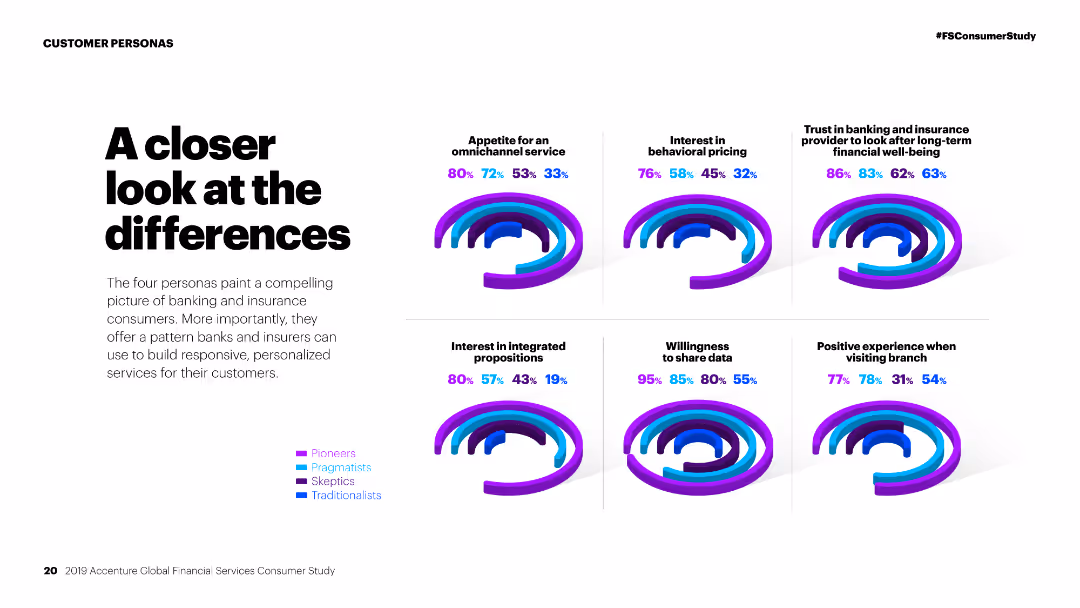
Column charts comparing personas on various factors like omnichannel service, behavioral pricing, and willingness to share data.
Competitive Landscape
Financial Services
Comparison of different customer personas in financial services, analyzing their preferences and behaviors towards various service aspects.
Personas, financial services, comparison, omnichannel service, behavioral pricing, data sharing, customer preferences, market study, segmentation
false
A closer look at the differences2019 Accenture Global Financial Services Consumer Study DISCOVER THE PATTERNS IN PERSONALITY
Multiple Chart
Accenture
View slide
The slide contains bold headers, bullet points, and infographics, illustrating macro and micro levels of sustainability impact.
Investment Analysis
Environmental Services & Sustainability
Urges the importance of sustainability for market potential and regulatory compliance. Suitable for leadership briefings.
sustainability, market size, regulations, corporate strategy, leadership
false
Why should leaders pay attention slide 1McKinsey Technology Trends Outlook 2022 Future of sustainable consumption
Header Horizontal
McKinsey
View slide
Utilizes split content areas to compare current states and needed actions with visual elements like icons to illustrate points clearly.
Strategic Planning
Environmental Services & Sustainability
Analyzes the gap between current climate actions and the targets set, emphasizing the need for specific plans, governance, and financing to achieve these goals in SEA.
Climate action, strategic planning, SEA, governance, financing
false
Introduction More SEA countries commit to Net Zero and start to translate ambitions to actionsSoutheast Asia’s Green Economy 2022 Report
Agenda
Bain
View slide
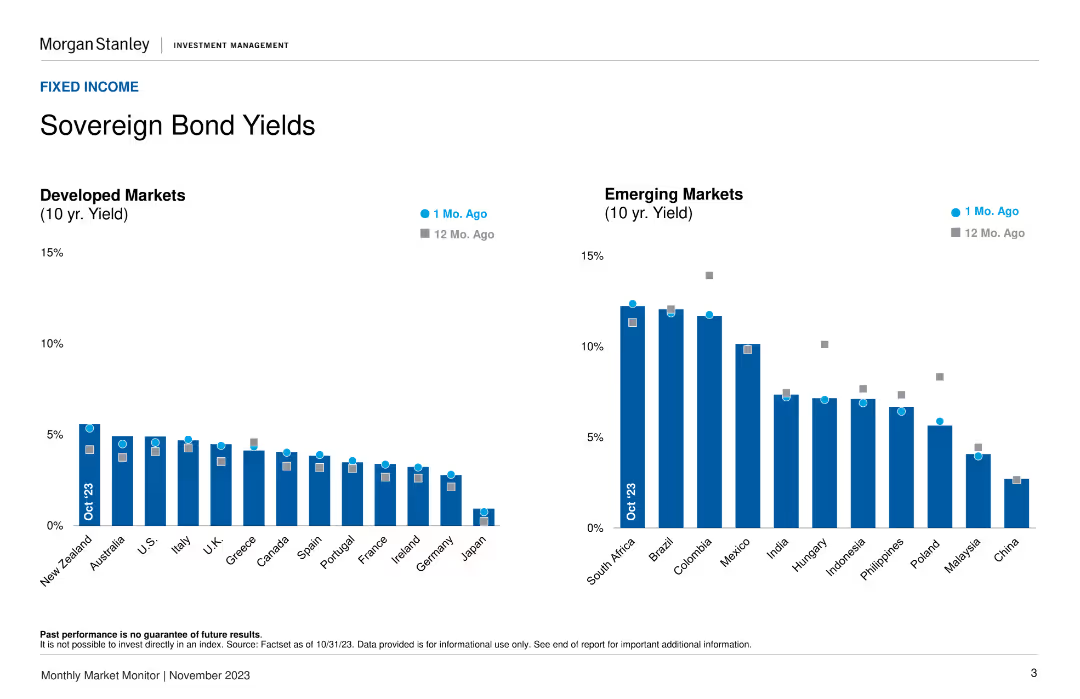
Two column charts showing 10-year bond yields for developed and emerging markets, comparing current rates to rates from 1 month and 12 months ago.
Market Analysis and Trends
Financial Services
Provides 10-year sovereign bond yields for developed and emerging markets, helping analyze trends in bond yields and their implications.
Bond yields, developed markets, trends
false
Sovereign Bond Yields Developed Markets (10 yr. Yield)Monthly Market Monitor November 2023
Multiple Chart
Morgan Stanley
View slide
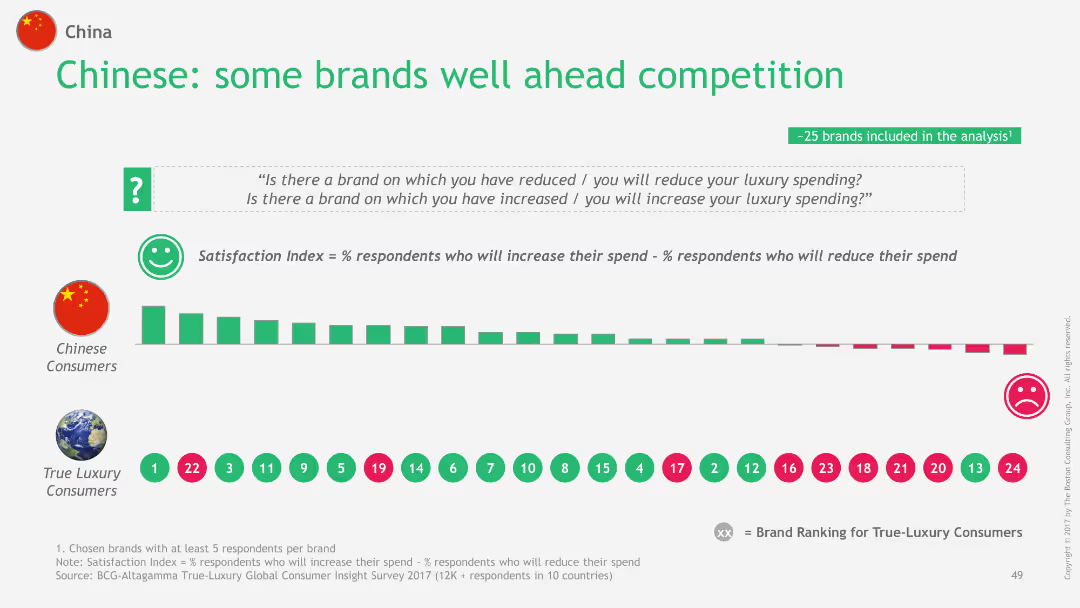
The slide features a bar chart comparing the satisfaction index of various luxury brands among Chinese consumers and True-Luxury Consumers. It shows the ranking of 25 brands based on the percentage of respondents likely to increase vs. reduce their luxury spending.
Customer and Market Segmentation
Consumer Goods
This slide presents the satisfaction index of luxury brands among Chinese consumers, highlighting which brands are ahead in customer satisfaction compared to True-Luxury Consumers, using a comparative analysis of 25 brands.
China, luxury, brand satisfaction, consumers, index
false
Chinese: some brands well ahead competition2018 True-Luxury Global Consumer Insight
Single Chart
BCG
View slide
Slide with textual content and icons, comparing objectives, strengths, and opportunities in two-column format. Uses iconography for visual emphasis on certain points.
Strategic Planning
Financial Services
Communicates strategies and objectives of a financial institution, illustrating the foundation of strengths and addressing opportunities.
strategies, objectives, banking, growth, opportunities, strengths, financial planning, market share, customer experience, innovation
false
We are pursuing strategies to be the bank for all, extend our presence, and grow wallet shareConsumer & Community Banking
Table
JP Morgan
View slide
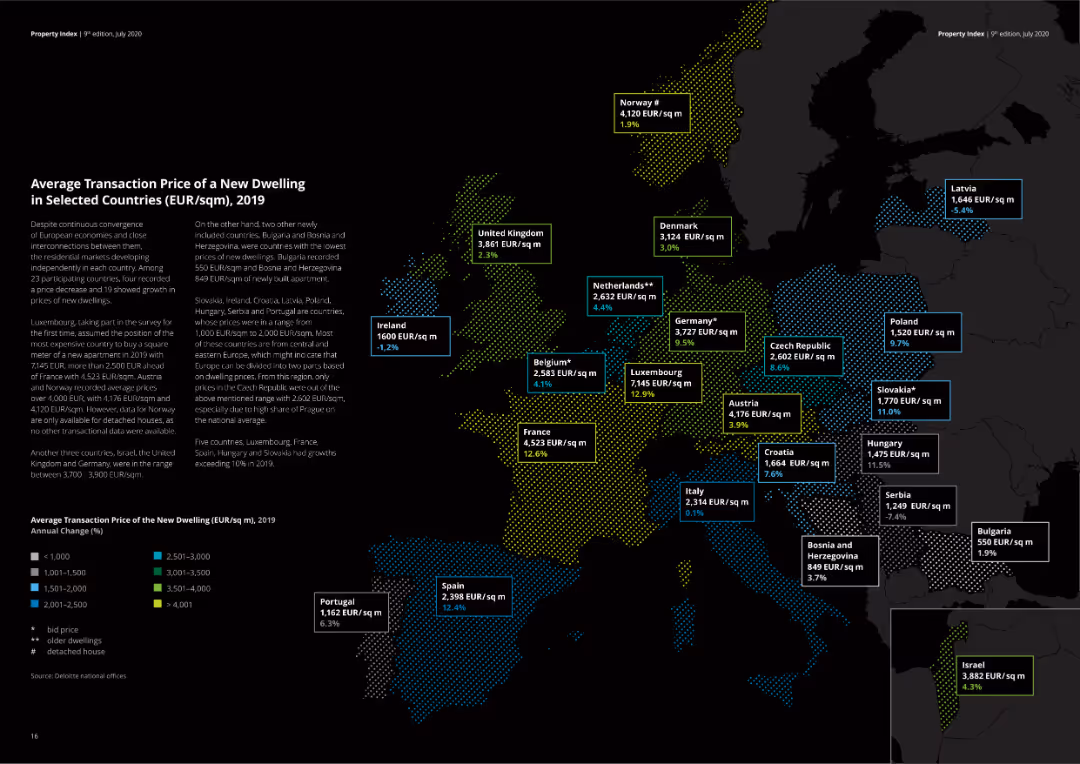
The slide includes a map of Europe with highlighted transaction prices for new dwellings in different countries. It also features a color-coded legend to indicate price ranges. Visual elements are detailed and informative. Visual complexity is advanced.
Market Analysis and Trends
Real Estate & Construction
Shows the average transaction prices for new dwellings across Europe, with a detailed map and legends. This slide is useful for real estate professionals and investors analyzing price trends and market conditions in the European housing market.
Transaction price, new dwelling, Europe, real estate, market
false
Average Transaction Price of a New Dwelling in Selected Countries (EUR/sqm), 2019Property Index Overview of European Residential Markets
Graphic
Deloitte
View slide
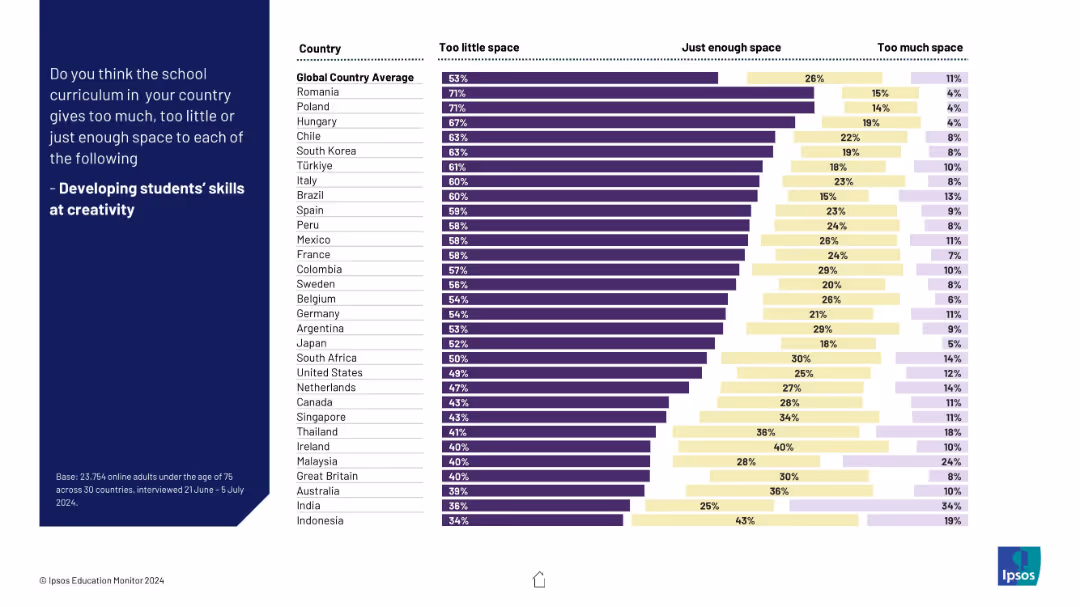
Consistent bar chart layout with responses per country; visualizes views on curriculum space for creativity; organized into three sections.
Human Resources and Talent Management
Education & Training
This slide investigates how well schools promote creativity. Respondents in many countries believe creativity receives too little attention, with Romania and Poland showing the strongest concern.
creativity, student skills, curriculum, innovation, global education, survey data, learning gaps
false
Developing students’ skills at creativityIPSOS EDUCATION MONITOR 2024
Mixed Chart
IPSOS
View slide
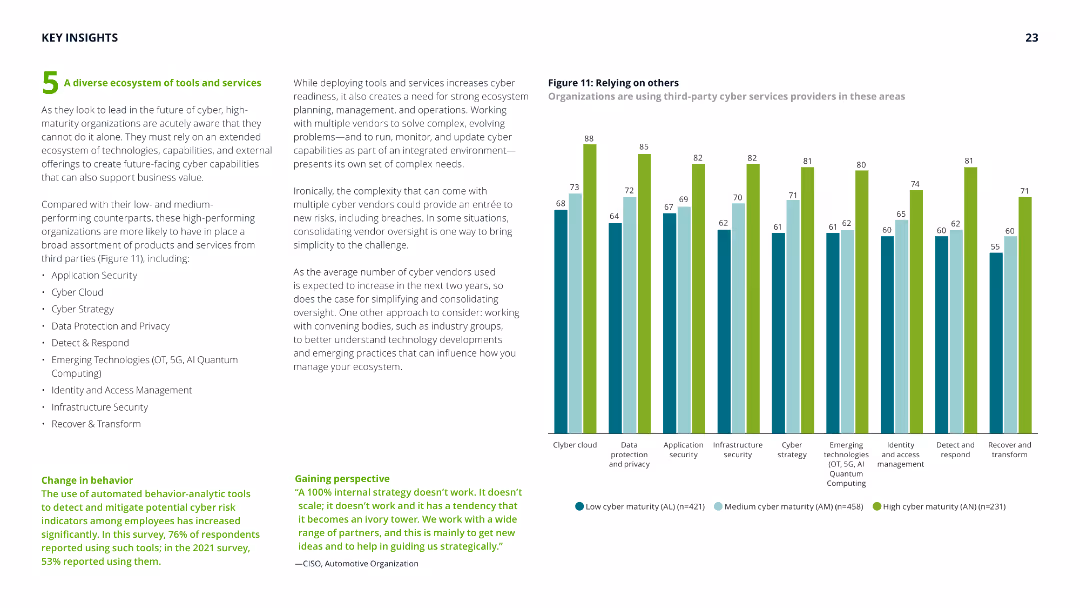
Contains a column chart with green and blue bars representing strategies for engaging and developing cyber talent across different maturity groups.
Human Resources and Talent Management
Technology & Software
Analyzes strategies used by organizations to engage, retain, and develop cyber talent, highlighting the challenges and importance of having the right skills in place.
Cyber talent, engagement, retention, skill development, HR strategies
false
5 A diverse ecosystem of tools and servicesGlobal Future of Cyber Survey
Mixed Chart
Deloitte
View slide
This slide contains a series of horizontal bar charts comparing responses between LGBTQIA+ employees and the overall employee population at Deloitte on various aspects like pride in the company, respect at work, authenticity, and support.
Human Resources and Talent Management
Professional Services
The slide presents survey results showing differences in feelings of authenticity and support at work between LGBTQIA+ professionals and their peers at Deloitte, highlighting a testimonial and the company's commitment to LGBTQIA+ inclusivity.
LGBTQIA+, survey, Deloitte, inclusion, authenticity, support, testimonial, commitment
false
FY2020 talent survey results - LGBTQIA+2021 Diversity, Equity, and Inclusion (DEI) Transparency Report
Mixed Chart
Deloitte
View slide
Contains a line graph comparing the Gini coefficient trends in developed and developing economies from 1990 to 2030.
Financial Performance
Professional Services
Examines the trends in income inequality within countries, highlighting differences in economic development and projections for future disparities.
income inequality, Gini coefficient, economic development, developed economies, developing economies
false
Globalization triggers advocacy as well as opposing views – This can be seen in both political and socio-economic settingsRoland Berger Trend Compendium 2030 Megatrend 2 Globalization & future markets
Header Horizontal
Roland Berger
View slide
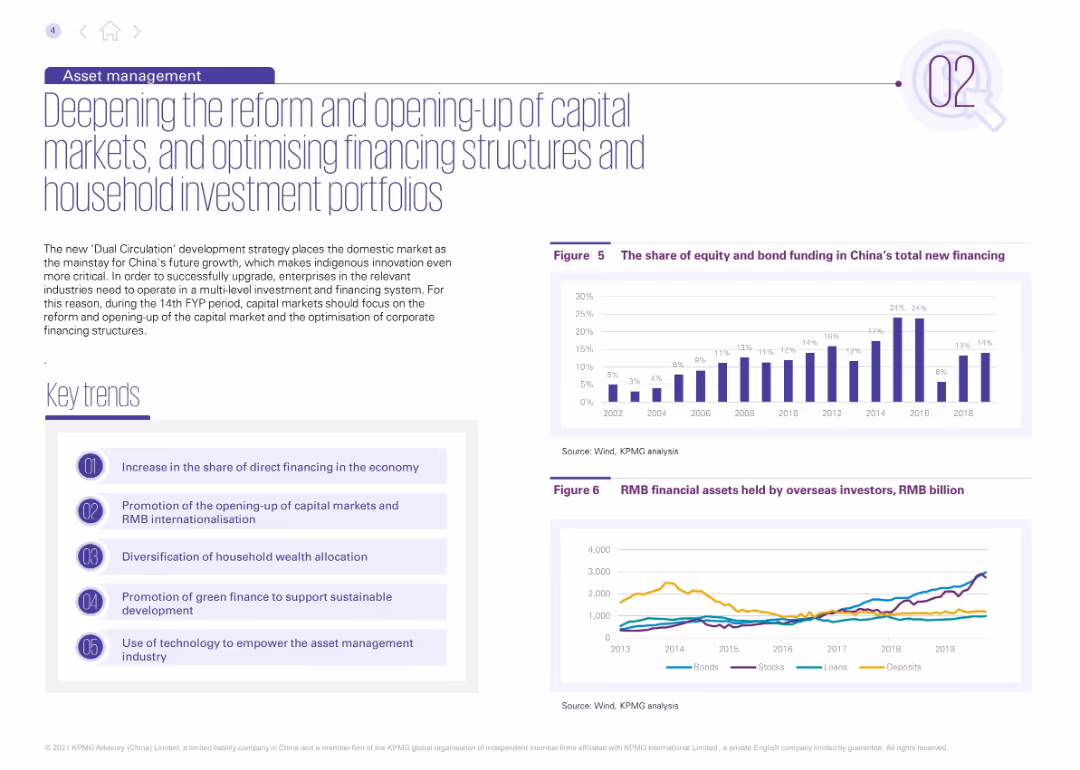
Purple-themed layout with two charts and five key trends. Describes financial reforms and household wealth shifts. Charts show the share of direct financing and RMB assets held by foreign investors.
Corporate Finance and Valuation
Financial Services
Focuses on reforms in China’s capital markets during the 14th FYP, including increased direct financing and RMB internationalization. It emphasizes innovation and technology’s role in asset management.
capital markets, RMB, foreign investment, wealth management, finance reform, FYP
false
Deepening the reform and opening-up of capital markets...The 14th Five- Year Plan: Sector Impact Outlook
Multiple Chart
KPMG
View slide
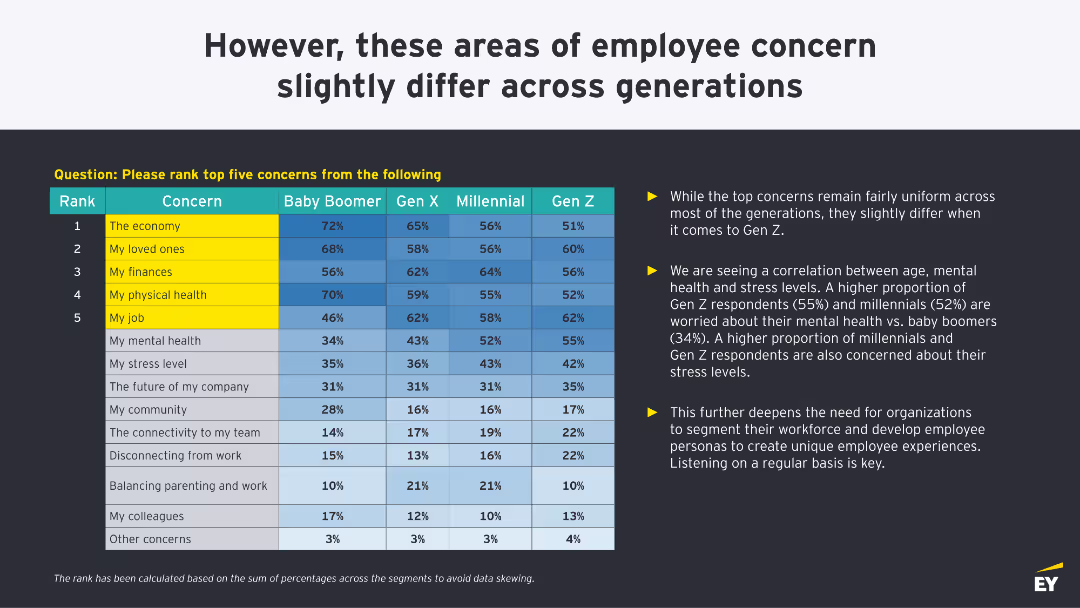
The slide features a table ranking employee concerns by generation, along with bullet points highlighting the differences and correlations between generations.
Human Resources and Talent Management
Professional Services
The slide analyzes the concerns of employees from different generations, showing how priorities like mental health and stress levels vary across age groups, highlighting the need for tailored approaches.
generations, employee, concerns, analysis, differences
false
However, these areas of employee concern slightly differ across generationsPhysical return and work reimagined study
Table
EY
View slide
Features three large numbered circles aligned horizontally, each describing a sub-trend of globalization including economic integration, and BRICS markets.
Market Analysis and Trends
Professional Services
Discusses three key aspects of globalization impacting new markets and economies, highlighting economic integration and the diversification of global markets.
globalization, economic integration, BRICS, new markets, sub-trends
false
Globalization is a multifaceted process not limited to economic effects – Political and social aspects run in parallelRoland Berger Trend Compendium 2030 Megatrend 2 Globalization & future markets
Pillar
Roland Berger
View slide
The slide features a column chart showing the year-on-year growth in capital importation by sector for Q3 2023. It contrasts significant growth in manufacturing with declines in banking, financing, ICT, and trading sectors.
Market Analysis and Trends
Financial Services
This slide presents the year-on-year changes in capital flows to various sectors, highlighting the substantial increase in manufacturing and declines in banking, financing, ICT, and trade. It provides insights into sectoral performance and investment trends.
capital flows, manufacturing, banking, financing, ICT, trade
false
Capital flows to Manufacturing grew Y o Y by 185% while Banking, Financing , ICT and Trade shrunk...Nigeria Economic Outlook
Mixed Chart
PwC/Strategy&
View slide
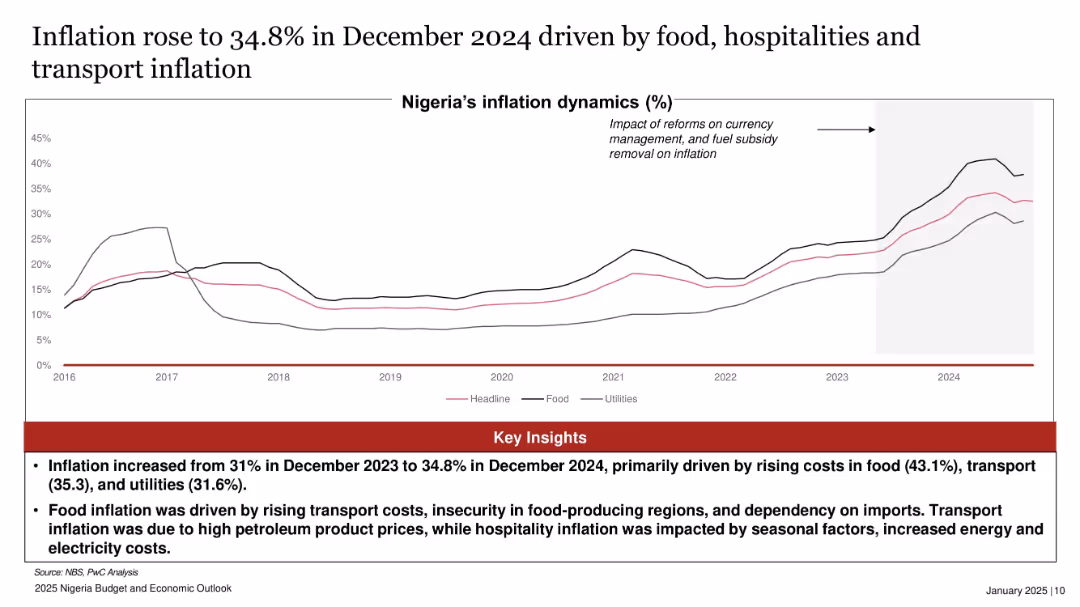
Line chart with three trend lines showing headline, food, and utilities inflation from 2016 to 2024.
Risk Assessment and Management
Government & Public Sector
The slide details inflation trends in Nigeria, which rose to 34.8% in December 2024. It attributes the spike to rising costs in food (43.1%), transport (35.3%), and utilities (31.6%), highlighting the impact of transport costs and fuel subsidies on price dynamics.
inflation, Nigeria, food prices, transport, utilities, cost drivers, headline inflation
false
Inflation rose to 34.8% in December 2024...2025 Nigeria Budget and Economic Outlook
Mixed Chart
PwC/Strategy&
View slide
Slide includes pie charts and detailed lists comparing product types and their market share over time.
Financial Performance
Financial Services
Discusses the diversification of financial products over years, analyzing risk-adjusted returns and market growth strategies.
Diversification, Products, Growth, Financial
false
Product DiversificationBread Financial: Barclays Global Financial Services Conference
Multiple Chart
Barclays
View slide
Features line graphs with mobility data compared to baseline, with indicators for workplace, public transit, and retail & recreation.
Strategic Planning
Transportation & Logistics
Reviews mobility recovery trends and suggests a rise in the work from home practice due to the ongoing pandemic.
mobility trends, work from home, pandemic response
false
Retail and recreation mobility recovered fastest; lower recovery of workplace mobility indicates continued adoption of work from homeCOVID-19 BCG Perspectives Series Global Restart: Key Dynamics
Multiple Chart
BCG
View slide
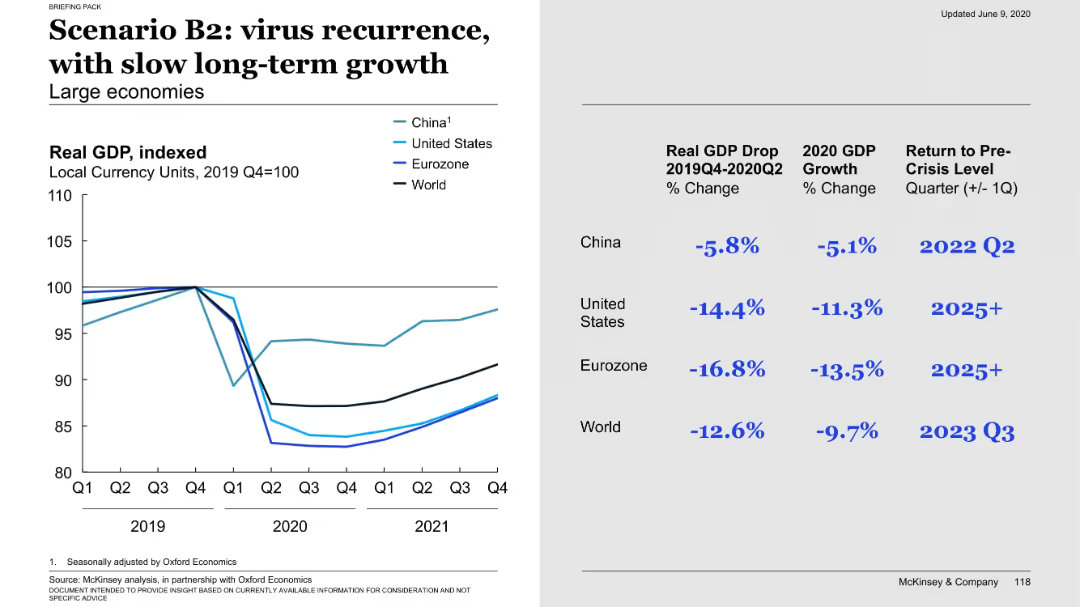
Split-slide layout with a line graph on the left and a data table on the right. Visualizes GDP recovery paths for major economies post-COVID-19.
Market Analysis and Trends
Financial Services
Projects slow economic recovery for China, US, Eurozone, and world under Scenario B2, highlighting GDP drop and projected return to pre-crisis levels. US and Eurozone recover slower than China and world average.
GDP, economic scenarios, recovery, COVID-19, China, US, Eurozone, forecast
false
Scenario B2: virus recurrence, with slow long-term growthCOVID-19: Briefing materials
Mixed Chart
McKinsey
View slide
The slide has a two-column format comparing supportive and opposing views on clean-energy trends. Each column contains bullet points and an icon at the top. The design is straightforward with a blue and black color scheme that provides a professional and clear presentation of information.
Strategic Planning
Energy & Utilities
This slide presents contrasting perspectives on the viability and future of clean-energy technologies. It's structured for strategic planning sessions, offering a platform for debate on the sustainability of traditional renewables, the feasibility of 100% renewable energy adoption, and the growth potential in clean tech markets. This is aimed at stakeholders who are formulating long-term strategies and considering the varying opinions and data points in the clean-energy discourse.
clean energy, renewables, debate, sustainability, technology viability, market growth, strategic planning, renewable adoption, contrasting views, business opportunities
false
What are some topics of debate related to the trend?McKinsey Technology Trends Outlook 2022 Future of clean energy
Header Horizontal
McKinsey
View slide
Slide features a column chart showing annual unlinked rides with a focus on recent years impacted by the SafeTrack program, marked with annotations and a downward trend.
Risk Assessment and Management
Transportation & Logistics
Analyzes the impact of the SafeTrack program on ridership, presenting the associated risks and losses, and highlighting the need for strategic responses to these challenges.
SafeTrack, ridership loss, risk management, transportation
false
Rail ridership has dipped significantly since '09Perspectives on WMATA's ridership
Single Chart
BCG
View slide
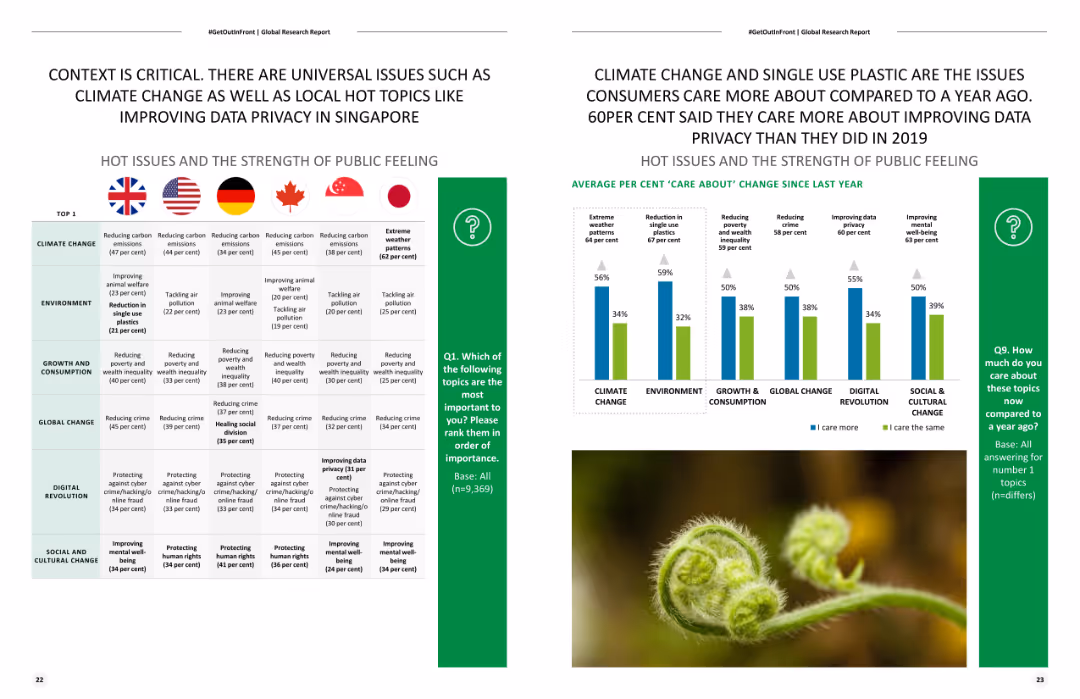
Slide includes two column charts and flags representing different countries. The left chart shows public opinion on issues by country, and the right chart shows changes in opinions over time.
Market Analysis and Trends
Environmental Services & Sustainability
Compares public concerns about various global issues, with a focus on climate change, environment, growth and consumption, etc., across different countries and over time.
Climate change, public opinion, environment, global issues, trends
false
CONTEXT IS CRITICAL. THERE ARE UNIVERSAL ISSUES SUCH AS CLIMATE CHANGE AS WELL AS LOCAL HOT TOPICS LIKE IMPROVING DATA PRIVACY IN SINGAPORE#GetOutInFront
Mixed Chart
Deloitte
View slide
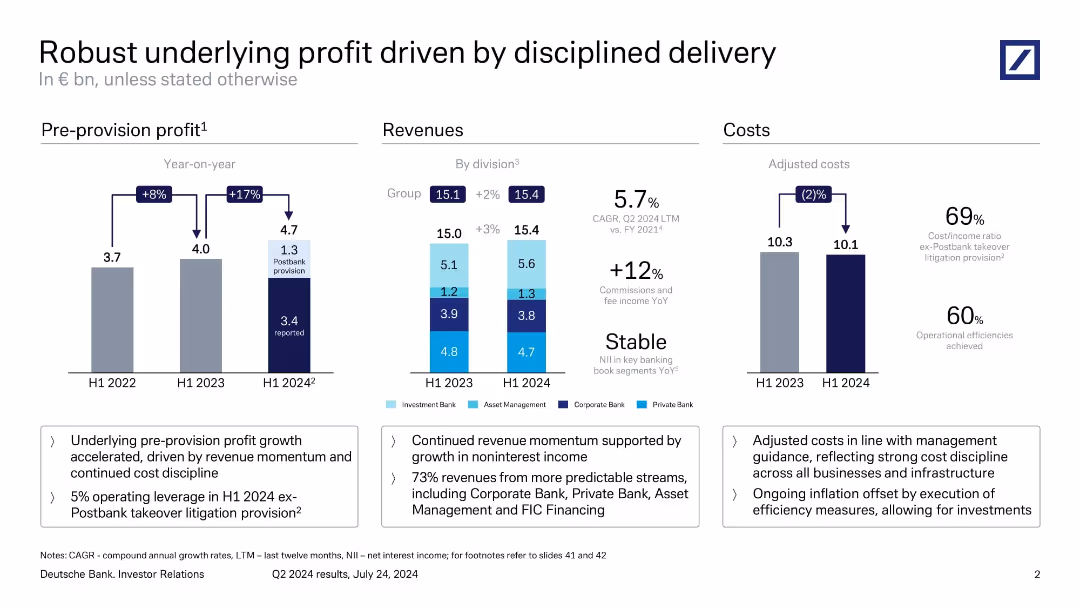
Three-panel layout: bar charts for profit, revenue, and costs, with text highlights at the bottom.
Strategic Planning
Financial Services
The slide presents a year-over-year analysis of pre-provision profits, revenue by division, and adjusted costs. It emphasizes revenue momentum and operational efficiency, with a notable Postbank provision. Text boxes summarize financial strategy and cost discipline measures.
profit growth, revenue, cost discipline, Postbank, adjusted costs, division revenue, Deutsche Bank
false
Robust underlying profit driven by disciplined deliveryQ2 2024 results
Multiple Chart
Deutsche Bank
View slide
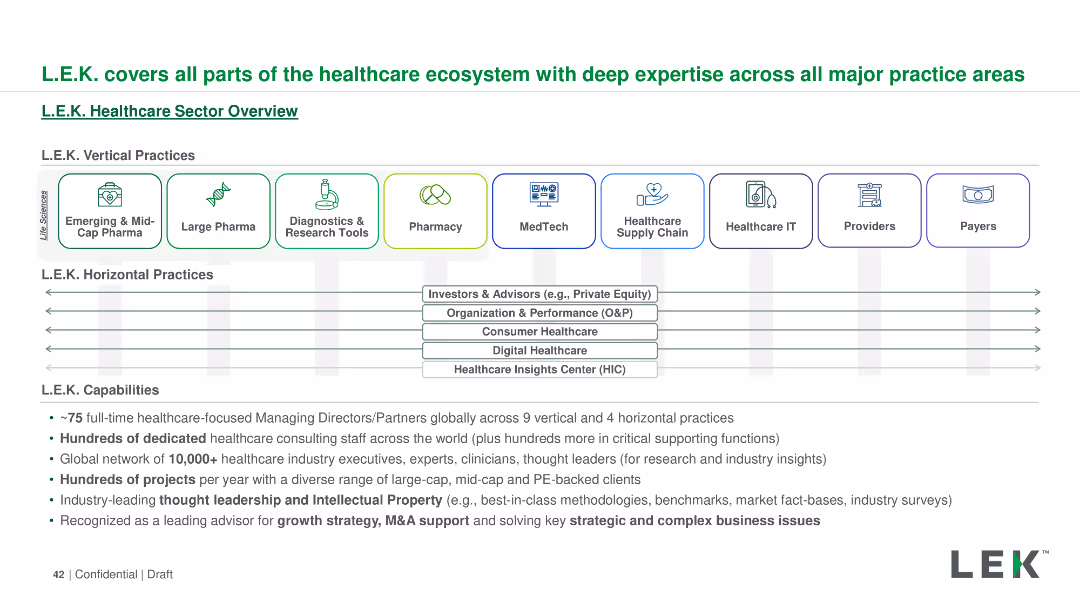
The slide outlines L.E.K.'s healthcare sector capabilities using a horizontal layout. It includes icons and text boxes to detail vertical and horizontal practices, capabilities, and global reach. Colors and icons are used for visual categorization.
Industry Overview
Professional Services
The slide provides an overview of L.E.K.'s comprehensive involvement in the healthcare ecosystem, covering vertical and horizontal practices, capabilities, and their global network. It highlights their expertise and range of services in the healthcare sector.
L.E.K., healthcare, ecosystem, vertical practices, horizontal practices, capabilities, global reach, services
false
L.E.K. covers all parts of the healthcare ecosystem with deep expertise across all major practice areas2023 SEA Hospital Insights Survey Findings Summary materials
Diagram
LEK
View slide
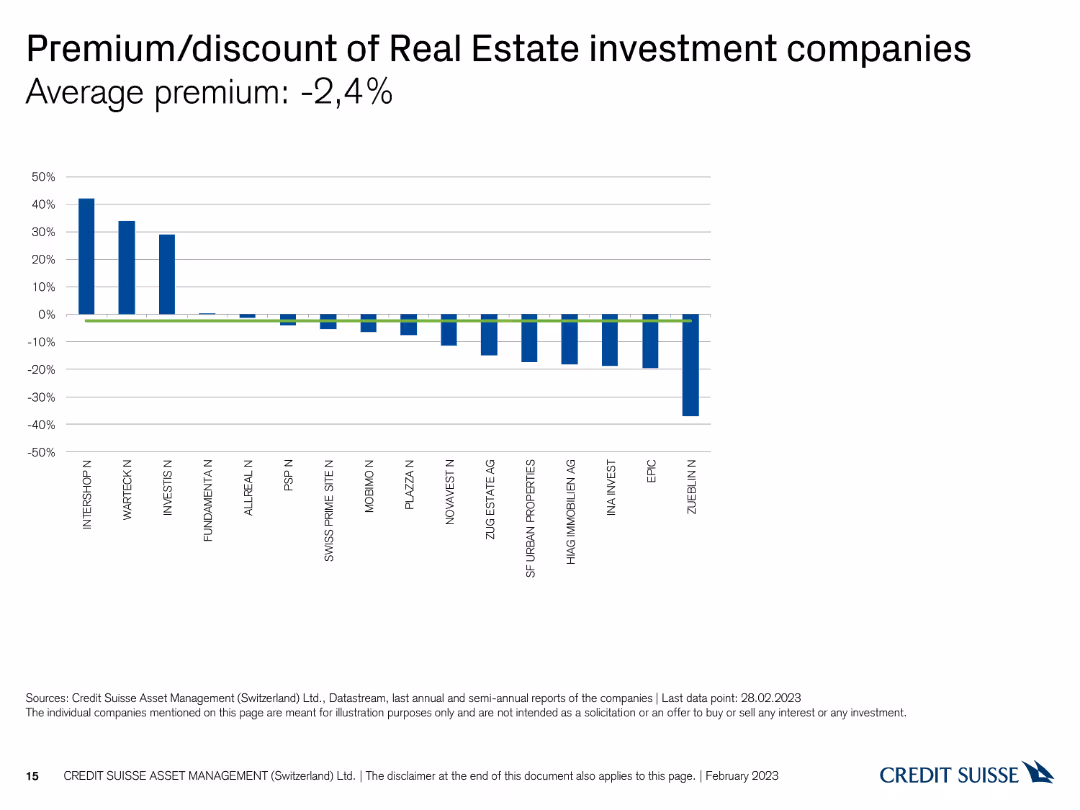
This slide contains a column chart depicting the premium or discount of Swiss real estate investment companies, with bars indicating the percentage difference from the average premium.
Financial Performance
Real Estate & Construction
The slide shows the average premium or discount for real estate investment companies, helping to assess market valuation trends. It is useful for investment analysis and valuation.
Real estate, premium, discount, valuation, comparison
false
Premium/discount of Real Estate investment companies Average premium: -2,4%Swiss Real Estate Funds At a glance February 2023
Single Chart
Credit Suisse
View slide
The slide features a world map pinpointing regions of international expansion with a focus on EMEA countries, supplemented by bullet points on strategy. The color contrast and map design aid in focusing on the strategic elements.
Strategic Planning
Financial Services
Provides a strategy for international expansion of the commercial banking model, with a focus on market opportunities and targeted regions. It's useful for global strategic planning and discussing international growth potential with stakeholders.
CB model, international expansion, market opportunity, strategic planning, EMEA, APAC
false
Replicating our proven CB model internationallyCommercial Banking 2019
Header Vertical
JP Morgan
View slide
It displays column chart comparing different types of capital against regulatory requirements, using a clean layout with direct visual comparisons to enhance understanding.
Regulatory and Compliance
Financial Services
Details the financial institution’s buffer over minimum required levels for loss-absorbing capacity, important for regulatory compliance and financial health discussions in the banking sector.
financial health, regulatory, banking, compliance
false
Significant buffer over MREL/TLAC requirements Loss-absorbing capacity, in € bn, period endClient & Creditor Overview July 2023
Multiple Chart
Deutsche Bank
View slide
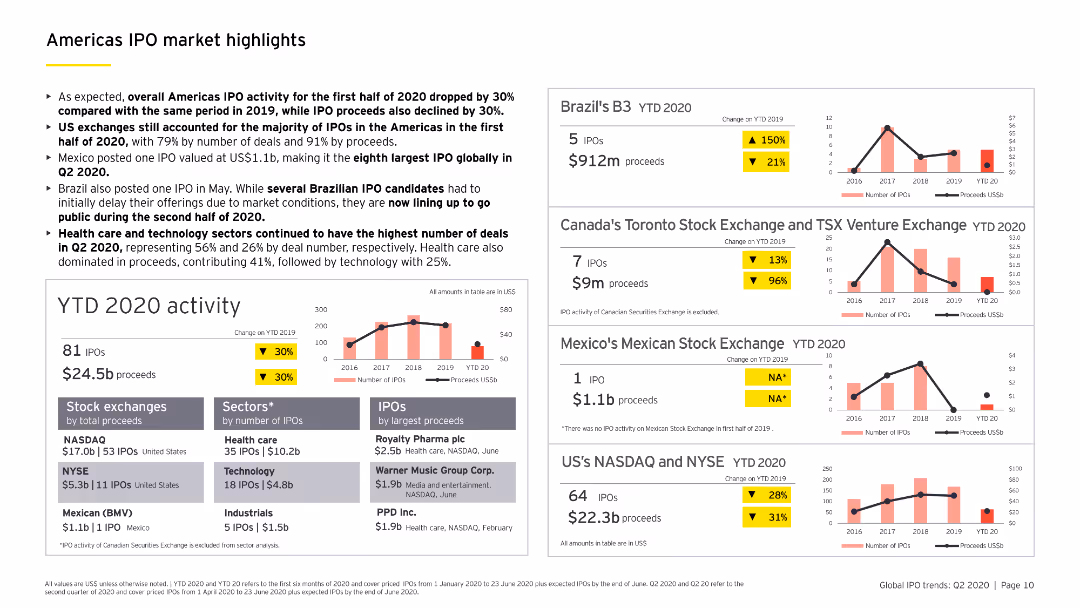
Contains multiple column charts and a bar chart detailing YTD 2020 IPO activity in the Americas, including sector-specific analysis and major stock exchanges.
Market Analysis and Trends
Financial Services
Highlights key IPO market trends in the Americas for the first half of 2020, including a breakdown by sectors, stock exchanges, and notable IPOs.
IPO, Americas, YTD 2020, sector analysis, stock exchanges
false
Americas IPO market highlights As expected, overall Americas IPO activity for the first half of 2020 dropped by 30% compared with the same period in 2019Is your equity story adapting to the new norm?
Multiple Chart
EY
View slide
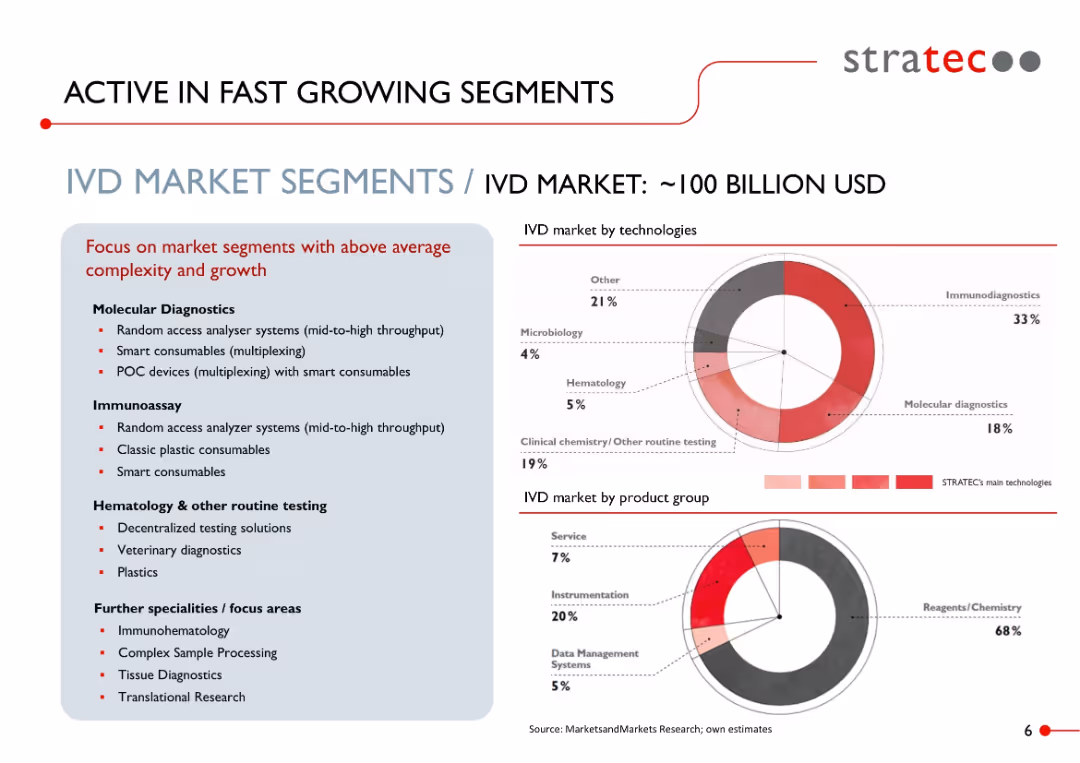
Split layout: text-heavy left box with bullet points on market segments; right side features two donut charts with red highlights and technology/product breakdowns.
Market Analysis and Trends
Healthcare & Pharmaceuticals
Highlights the high-growth and high-complexity segments within the IVD (In Vitro Diagnostics) market, valued at ~$100B. Focus areas include molecular diagnostics, immunoassays, and smart consumables. Two charts segment the market by technologies and product groups.
IVD, immunoassay, smart consumables, molecular diagnostics, healthcare, market segmentation, diagnostics, STRATEC, medical technology
false
ACTIVE IN FAST GROWING SEGMENTSGOLDMAN SACHS MEDTECH AND HEALTHCARE SERVICES CONFERENCE
Mixed Chart
Goldman Sachs
View slide
This slide combines maps and inset data points to compare population growth and decline across various countries, emphasizing changes in countries like India, Nigeria, and Pakistan.
Market Analysis and Trends
Government & Public Sector
Provides detailed projections of population changes in key countries from 2020 to 2050. It includes comparative analysis highlighting countries with the highest growth and those with declines, such as China and Germany.
population, India, Nigeria, China, growth
false
30% of total worldwide population growth between now and 2050 is expected to take place in three countries: India, Nigeria and PakistanRoland Berger Trend Compendium 2030: Megatrend 1 People & Society
Graphic
Roland Berger
View slide
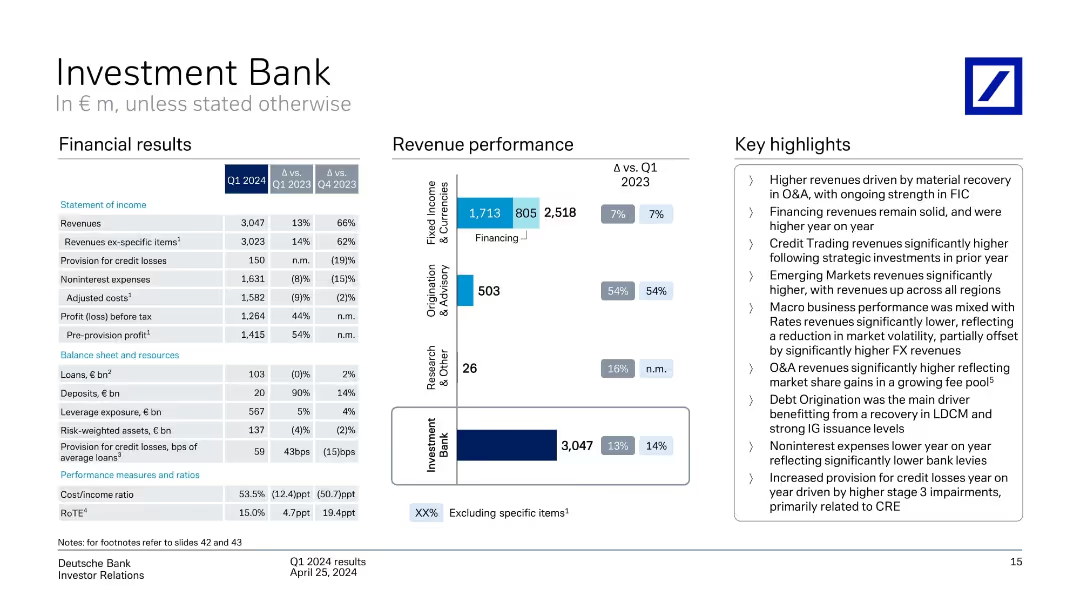
Income table on left, revenue bar chart in middle, highlights on right
Financial Performance
Financial Services
Financial breakdown of the Investment Bank for Q1 2024, with notable YoY growth in Origination & Advisory. Revenues increased due to strong FX and Credit Trading, despite macro volatility. Stage 3 impairments impacted credit losses.
investment bank, FIC, O&A, FX trading, credit losses, revenue
false
Investment BankQ1 2024 results
Mixed Chart
Deutsche Bank
View slide
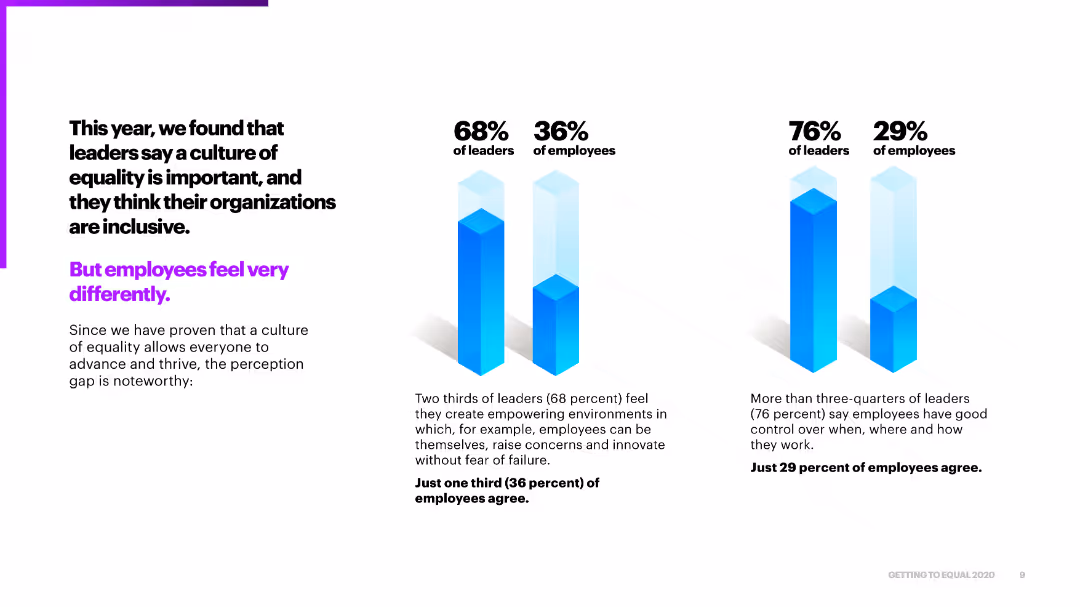
This slide features a column chart comparing the perceptions of leaders and employees on the importance of a culture of equality within organizations. The design uses blue and purple colors for emphasis.
Market Analysis and Trends
Professional Services
The slide highlights the disparity between leaders' and employees' perceptions of organizational equality, showing that a higher percentage of leaders believe in inclusive environments compared to employees.
equality, perceptions, leaders, employees, organizational culture
false
This year, we found that leaders say a culture of equality is important, and they think their organizations are inclusive.THE HIDDEN VALUE OF CULTURE MAKERS
Multiple Chart
Accenture
View slide
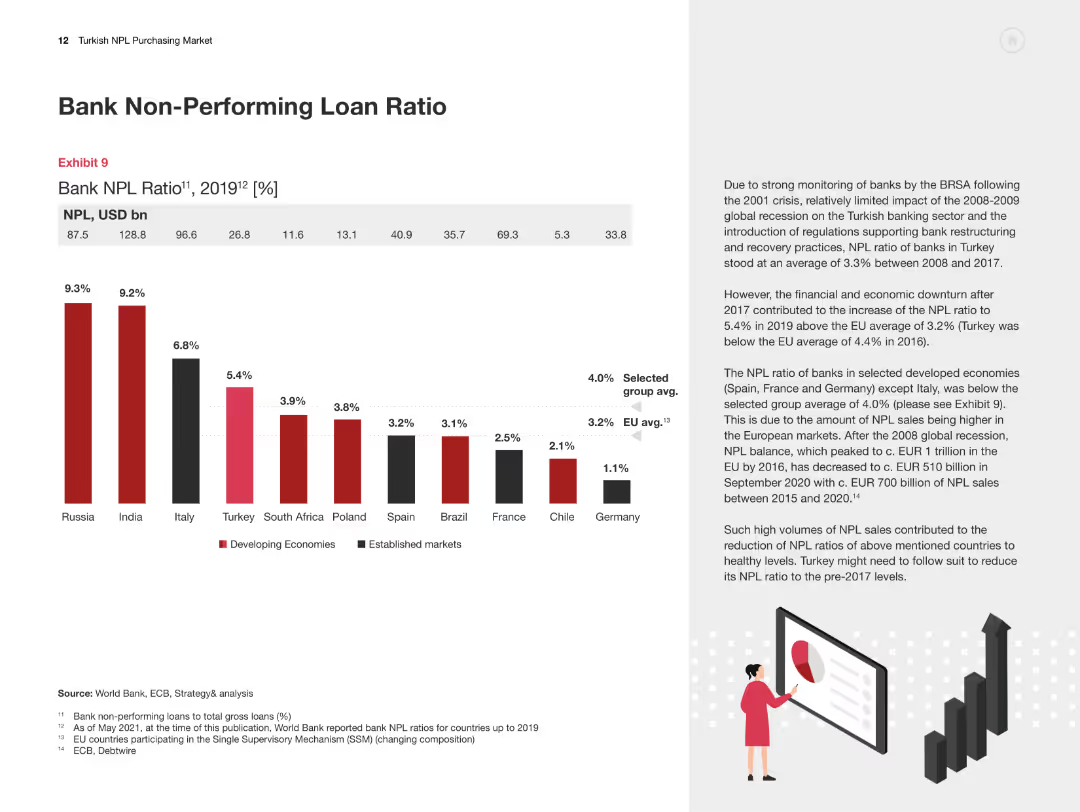
The slide features a column chart comparing the bank NPL ratios across various countries for 2019, with explanatory text on the significance and implications of these ratios.
Risk Assessment and Management
Financial Services
This slide presents a comparative analysis of bank non-performing loan ratios across different countries, emphasizing the significance and implications for the Turkish market.
NPL Ratio, Comparative Analysis, Turkey, International Comparison, Risk Assessment
false
Bank Non-Performing Loan RatioTurkish NPL Purchasing Market Overview and the way forward
Mixed Chart
PwC/Strategy&
View slide
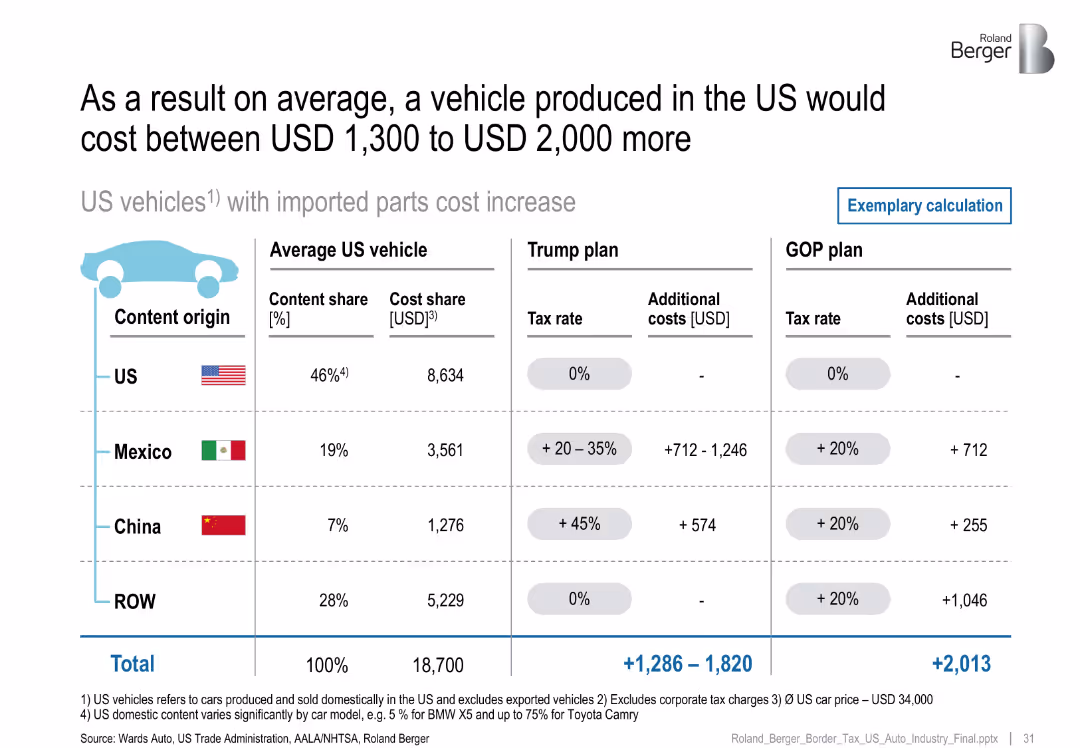
Table showing average vehicle content share by country of origin and associated additional cost per Trump and GOP plans
Financial Performance
Industrial & Manufacturing
Illustrates the compounded cost impact on US-made vehicles due to import tariffs on parts. Shows per vehicle cost increases under both tax scenarios, emphasizing the contribution from Mexican and Chinese components.
vehicle pricing, import parts, tariff impact, cost structure, US production, content share, trade policy
false
As a result on average, a vehicle produced in the US would cost between USD 1,300 to USD 2,000 moreNew US tax/tariff proposals and their impact on the US automotive industry
Table
Roland Berger
View slide
Outlines ML sub-processes and examples of technology solutions within each stage of the ML workflow.
Technology and Digital Transformation
Technology & Software
Details the noteworthy software solutions that facilitate each stage of the ML workflow from data management to live-model operations.
ML workflow, data management, model development, operations
false
What are the most noteworthy technologies?McKinsey Technology Trends Outlook 2022 Industrializing machine learning
Linear Flow
McKinsey
View slide
A bar chart illustrating the perceived effectiveness of various traditional paid media channels like linear TV, radio, and print. Each bar is segmented to show different confidence levels among marketers.
Market Analysis and Trends
Media & Entertainment
This slide presents survey data on marketers' confidence in the effectiveness of traditional paid media channels. It highlights the perceived effectiveness of channels like TV, radio, and print for brand building and consumer acquisition.
Media, Effectiveness, Traditional, Channels, Confidence
false
Perceived effectiveness of primary paid traditional channelsEra of alignment
Mixed Chart
Nielsen
View slide
The slide presents circular diagrams and column charts comparing company sizes and the structure of customer service across different regions and industries. It uses a mix of green, blue, and gray colors for easy differentiation.
Organizational Structure and Change
Professional Services
Analyzes company demographics and customer service structures across various industries, highlighting differences in organization size and service placement. Useful for businesses evaluating their customer service frameworks and considering organizational adjustments for improved performance.
company profiles, organizational structure, customer service, industries, demographics
false
The company profiles size, type of customer service and industriesCustomer Service Excellence 2022
Multiple Chart
Deloitte
View slide
Features bar charts and text highlighting factors affecting workplace satisfaction and motivation.
Human Resources and Talent Management
Professional Services
Analyzes key factors affecting employee motivation and workplace culture, useful for enhancing organizational culture and HR policies.
Employee Motivation, Workplace Culture, Job Satisfaction, Organizational Culture, HR Policies
false
While pay is a main factor, purpose and authenticity round out the top three characteristics employees are looking for at workGlobal Workforce Hopes and Fears Survey 2022
Single Chart
PwC/Strategy&
View slide
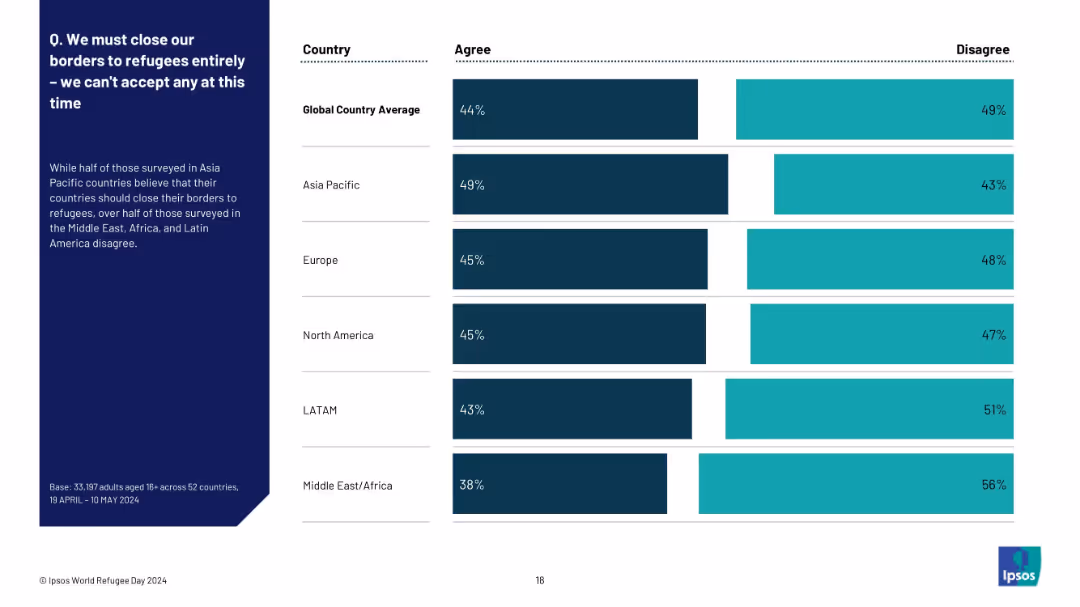
Similar layout to 19901; left text explanation with a regional breakdown bar chart on the right
Market Analysis and Trends
Government & Public Sector
The slide focuses on regional views of closing borders to refugees. Asia Pacific has the highest agreement rate, while Middle East/Africa and LATAM are more opposed. It complements slide 19902 by summarizing views at the regional rather than country level.
refugee policy, regional attitudes, border control, Ipsos, regional breakdown, public opinion, immigration
false
Q. We must close our borders to refugees entirely – we can’t accept any at this timeWORLD REFUGEE DAY
Mixed Chart
IPSOS
View slide
Multi-bar chart with detailed job gains and losses by region in New Zealand. Provides a clear visual breakdown.
Strategic Planning
Industrial & Manufacturing
Detailed analysis of job market changes in New Zealand’s regions, highlighting areas with net job gains or losses, critical for HR and regional planners.
Jobs, Detail, New Zealand, Regions, Analysis
false
Auckland and Wellington are expected to have the largest net job gain; West Coast and Southland a small net lossFuture of Work Tripartite Forum: Evidence base on the Future of Work
Multiple Chart
McKinsey
View slide
This slide features multiple stacked column charts displaying the projected market share of different types of vehicle powertrains globally from 2018 to 2035. The colors differentiate types such as battery electric, plug-in hybrid, and gasoline, showing a trend towards electrification, especially after 2025.
Market Analysis and Trends
Transportation & Logistics
The slide presents data on the evolution of the vehicle powertrain market share over time, with a focus on the increasing role of electrified vehicles. It is useful for discussing the future of automotive industry trends, particularly electrification and its regulatory, technological, and market drivers.
electrification, market trends, vehicle powertrains, forecast, automotive industry
false
BCG market forecast to 2035—GlobalWhat if all vehicles were electric?
Single Chart
BCG
View slide
The slide features a blue and white color scheme with two main charts showing the Liquidity Coverage Ratio (LCR) and Net Stable Funding Ratio (NSFR) over several quarters. Key highlights are presented in bullet points alongside the charts.
Financial Performance
Financial Services
This slide provides a quarterly analysis of liquidity and funding metrics, detailing trends in Liquidity Coverage Ratio and Net Stable Funding Ratio, highlighting compliance with financial regulatory requirements, and implications for financial stability and strategic financial planning.
liquidity, funding, regulatory, financial, stability
false
Sound liquidity and funding base In € bn, unless stated otherwiseQ3 2023 Fixed Income Investor Conference Call
Multiple Chart
Deutsche Bank
View slide
The slide includes column charts and a line chart illustrating the sensitivity of group revenues to interest rates and CHF yield curve shifts.
Financial Performance
Financial Services
This slide discusses the cumulative group revenues sensitivity of CHF ~0.9 bn by 2025 vs. 2022 and the impact of higher forward rate expectations.
revenues, interest rates, forward rate, yield curve, funding costs
false
CHF ~0.9 bn additional group revenues by 2025 from higher forward rate expectations4Q22 and Full Year 2022 Results Analyst and Investor Call
Multiple Chart
Credit Suisse
View slide
This slide contains two column charts comparing EV/EBITDA and EV/FCF multiples for Waste Management and Environmental Services sectors from 2019 to 2020. Text boxes with methodological notes and private sector observations are included on the right side.
Market Analysis and Trends
Financial Services
The slide analyzes the recovery of EV/EBITDA and EV/FCF multiples in the Waste Management and Environmental Services sectors post Q1 2020 market volatility. It provides methodological insights and observations about private sector valuation.
EV/EBITDA, EV/FCF, Waste Management, Environmental Services, Market Volatility
false
Sector public valuations have largely recovered from the initial market shock brought on by COVID-19Sector trading multiples are still above 3-year historical metrics, suggesting continued bullish market sentimentEnvironmental Services Outlook
Multiple Chart
LEK
View slide
Evaluation of funding models under different assumptions
Strategic Planning
Telecommunications
Presents bar graphs with detailed cost analyses for different funding models under varying assumptions. The visual representation uses different colors to denote various types of costs, making it easy to understand at a glance which factors are the most significant in each model.
Evaluates the potential for school connectivity in Kalimantan, Sulawesi, Nusa Tenggara, and Papua under different financial assumptions, focusing on the sustainability and impact of various funding models.
false
P&L of total area in Kalimantan, Sulawesi, Nusa Tenggara & Papua | No model sufficient by itself to cover all schools, though clear differences in potential ariseIndonesia case study
Multiple Chart
BCG
View slide
Includes a list on the left detailing financial metrics and two column charts on the right visualizing 'Total Assets' and 'Total Equity' over time. The slide uses contrasting colors for easy differentiation between liquid and total assets.
Financial Performance
Financial Services
Exhibits the company’s financial robustness by showcasing key figures such as total assets and equity. The visual data emphasizes liquidity and growth, presenting a snapshot of the company’s financial health and stability without long-term debt.
Financial Strength, Total Assets, Total Equity, Liquidity, Growth, Stability
false
Financial Strength – Liquid and Growing1Goldman Sachs US Financial Services Conference 2022
Multiple Chart
Goldman Sachs
View slide
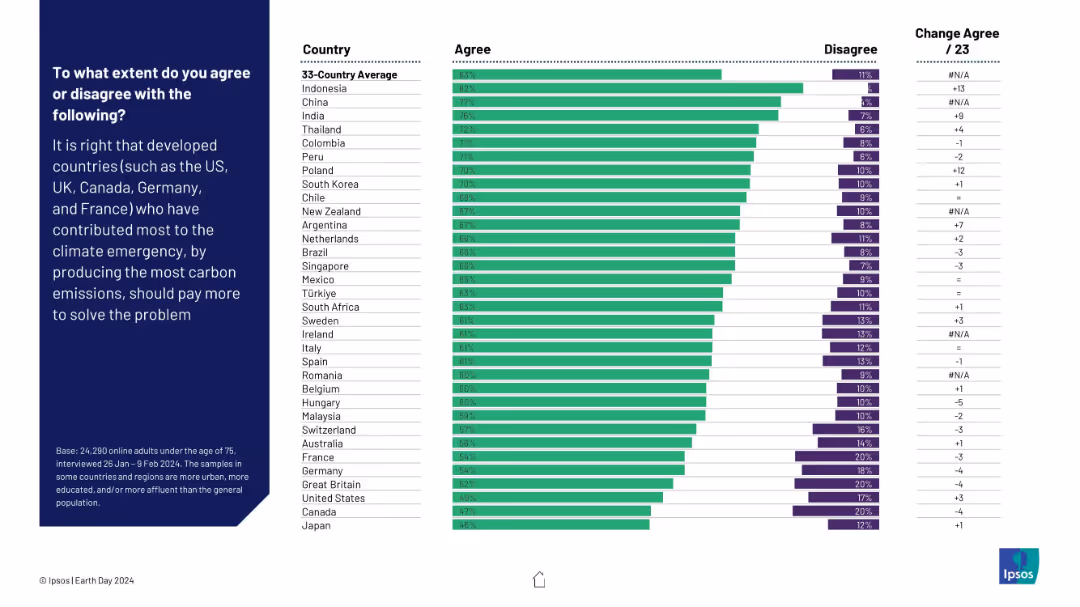
Horizontal bar chart showing agreement/disagreement by country on whether developed countries should pay more due to higher carbon contributions. Change from 2023 is noted.
Regulatory and Compliance
Environmental Services & Sustainability
This slide reflects opinions on climate justice—whether developed nations should pay more for their historic carbon emissions. Strong support is evident in Indonesia, China, and India. The data shows a global push for equitable climate responsibility distribution.
climate justice, carbon emissions, responsibility, financial contribution, global fairness, sustainability, Ipsos, Earth Day
false
To what extent do you agree or disagree with the following?EARTH DAY 2024
Mixed Chart
IPSOS
View slide
Features circular diagrams showing aspects of creativity in high-growth brands, with accompanying text discussing creative business transformation.
Market Analysis and Trends
Professional Services
This slide examines how high-growth brands foster creativity, encouraging risk-taking and collaboration, and compares these aspects with negative-growth brands.
high-growth, brands, creativity, professional services, market trends
false
FIGURE 1: High-growth brands are more likely to have the mindset and processes to allow creativity to flourish2023 Global Marketing Trends
Multiple Chart
Deloitte
View slide
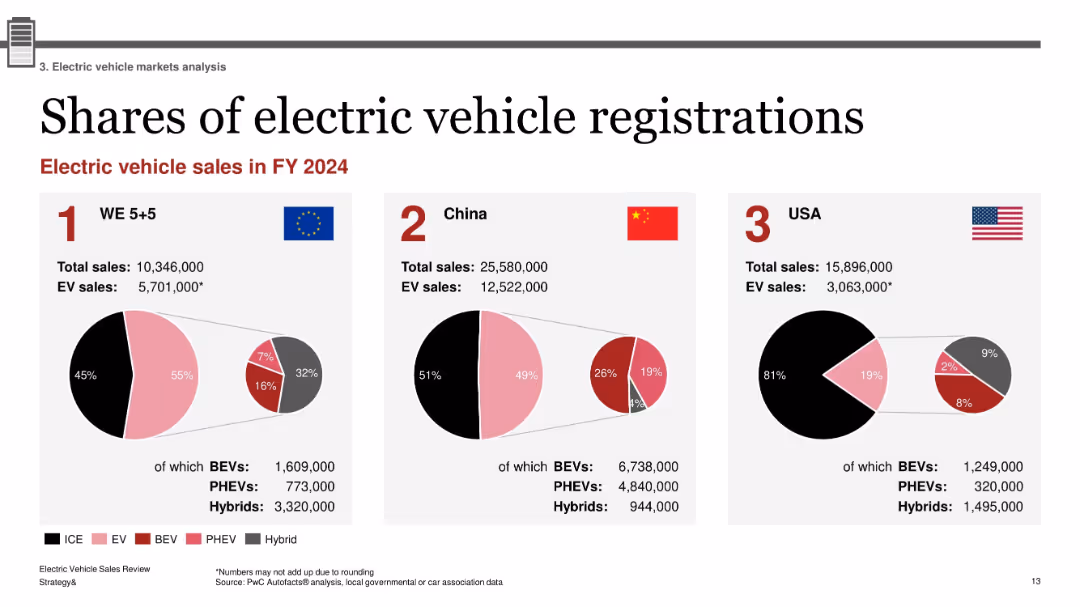
Three-part layout with pie charts for WE 5+5, China, and USA; flags and national data; red-pink-black hybrid color scheme with category breakout
Market Analysis and Trends
Industrial & Manufacturing
This slide compares electric vehicle registrations in FY2024 across Western Europe, China, and the USA. Each region’s total and EV sales are provided, with breakdowns into BEVs, PHEVs, and Hybrids. China leads in absolute numbers, while Western Europe shows the highest EV share percentage. The visualization highlights regional market penetration and composition.
EV registrations, BEV, PHEV, hybrid market, regional comparison, 2024 sales, WE5+5, China, USA
false
Shares of electric vehicle registrationsElectric Vehicle Sales Review Q4 2024
Single Chart
PwC/Strategy&
View slide
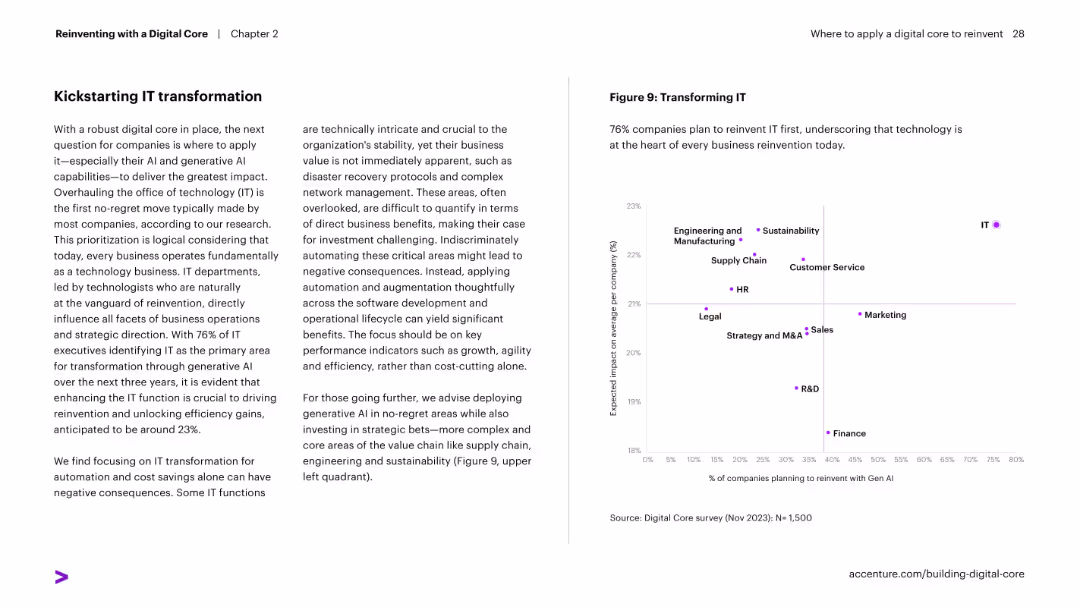
Two-column layout: text on left explains IT transformation priority; right features scatterplot of functions showing expected impact vs. GenAI reinvention planning.
Strategic Planning
Technology & Software
Argues for prioritizing IT transformation in digital reinvention strategies. Shows that companies expect the highest impact from reinventing IT with GenAI, followed by functions like supply chain and sustainability.
IT transformation, GenAI, strategy, scatterplot, business reinvention, impact
false
Kickstarting IT transformationReinventing with a Digital Core
Mixed Chart
Accenture
View slide
Uses a pie chart and a bar graph to show investment deal values in SEA, with a focus image of a woman using a smartphone.
Investment Analysis
Technology & Software
Presents data on regional investment dominance with a focus on Singapore and Indonesia, and the growth in fintech investments.
Investment Focus, Fintech, Southeast Asia, Singapore, Indonesia, Market Share, Growth Analysis
false
Singapore and Indonesia dominate deals in region, with investments in fintech growingSoutheast Asia's digital consumers: A new stage of evolution
Multiple Chart
Bain
View slide
The slide features text, an image of a person, and column charts showing percentages of harassment and microaggressions experienced by Gen Zs and millennials.
Risk Assessment and Management
Professional Services
This slide examines the growing concern over harassment and microaggressions, particularly among Gen Zs, detailing experiences and impacts in the workplace.
harassment, microaggressions, Gen Z, millennials, workplace behavior, inappropriate behavior
false
Harassment and microaggressions are becoming a widespread concern, particularly among Gen Zs2023 Gen Z and Millennial Survey
Multiple Chart
Deloitte
View slide
Slide contains four columns each with a green icon (dollar sign, building blocks, light bulb) and text blocks. It uses a clean and professional design with bullet points and minimalistic icons to present statistical data.
Industry Overview
Professional Services
This slide summarizes productivity strategies and expectations among companies over the next three years, focusing on investments in talent and technology to drive growth.
productivity, talent, technology, investments, growth
false
To increase productivity, companies are prioritizing new and existing talent.Private company outlook: Productivity
Pillar
Deloitte
View slide
The slide features stacked column charts depicting the distribution of retail categories in e-commerce GMV. It utilizes contrasting colors to differentiate categories and includes descriptive text.
Market Analysis and Trends
Technology & Software
The slide compares the online shopping trends for groceries over time and the expected continuity of these habits. It provides insights into changing consumer behavior and market opportunities.
e-Commerce, groceries, online shopping, consumer behavior, market trends
false
Shoppers are buying more groceries online - and they’re not going backe-Conomy SEA 2020 At full velocity: Resilient and racing ahead
Mixed Chart
Bain
View slide
The slide features multiple bar charts and a bar chart, detailing changes in DE&I spending by company size, sales, and economic sectors. Colors are red and grey.
Market Analysis and Trends
Professional Services
Details DE&I spending trends across various company sizes and sectors, highlighting significant increases in B2C sectors and larger firms.
DE&I, marketing, trends, B2C, spending, company size, retail, communications, real estate, economic sector
false
Companies spend more on DE&I in marketing across the board, with big companies making the biggest increasesThe CMO Survey The Highlights and Insights Report February 2022
Multiple Chart
Deloitte
View slide
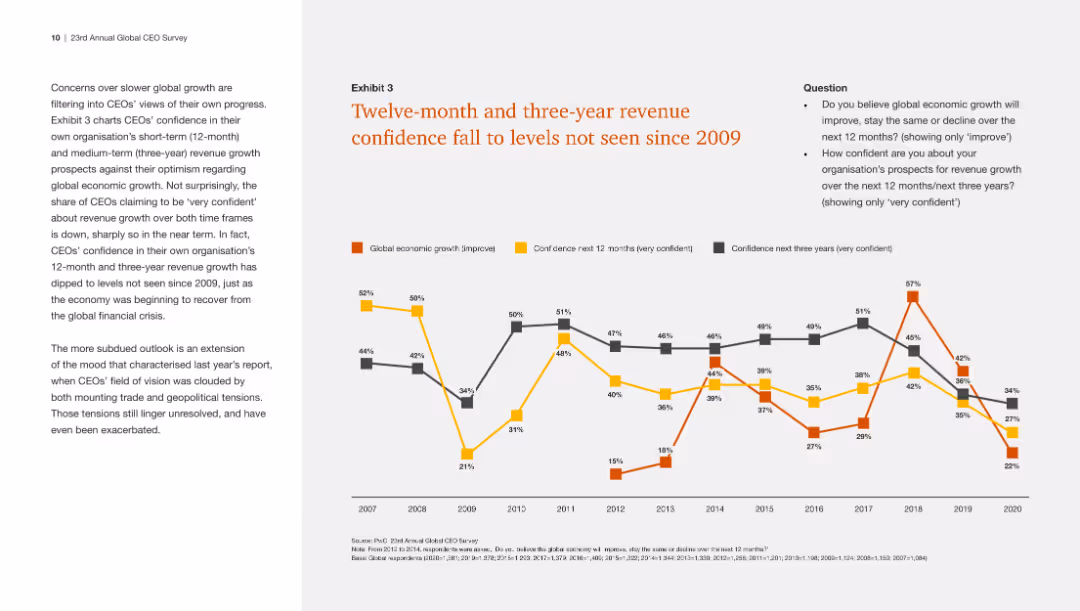
The slide contains a line chart comparing global economic growth confidence with CEOs' confidence in their own revenue growth over the next 12 and 36 months from 2007 to 2020.
Market Analysis and Trends
Financial Services
This slide shows a significant decline in CEOs' confidence in revenue growth, aligning with low confidence in global economic growth, not seen since the global financial crisis.
Revenue confidence, economic growth, CEO outlook, long-term trends
false
Exhibit 3 Twelve-month and three-year revenue confidence fall to levels not seen since 200923rd Annual Global CEO Survey Navigating the rising tide of uncertainty
Mixed Chart
PwC/Strategy&
View slide
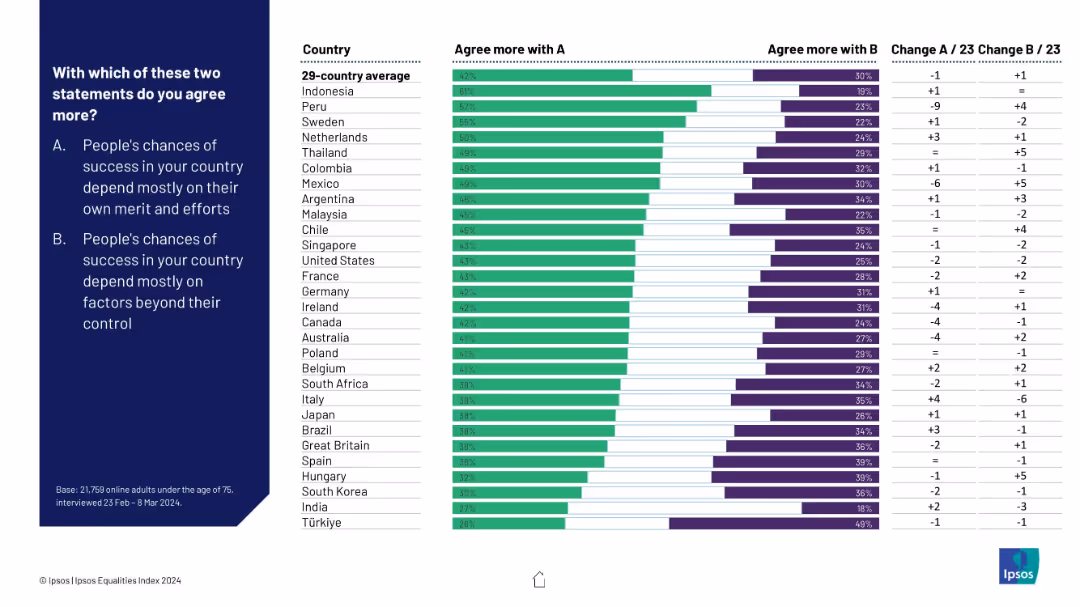
Dual-bar format comparing responses to two statements: success by merit vs factors beyond control; includes country rankings
Market Analysis and Trends
Education & Training
This comparison chart shows public belief in meritocracy vs structural barriers. Countries vary widely, with Indonesia and Peru leaning toward personal merit, while Turkey and India attribute outcomes to external factors.
meritocracy, social mobility, success factors, public opinion, structural inequality, Ipsos, international comparison
false
With which of these two statements do you agree more?IPSOS EQUALITIES INDEX 2024
Mixed Chart
IPSOS
View slide
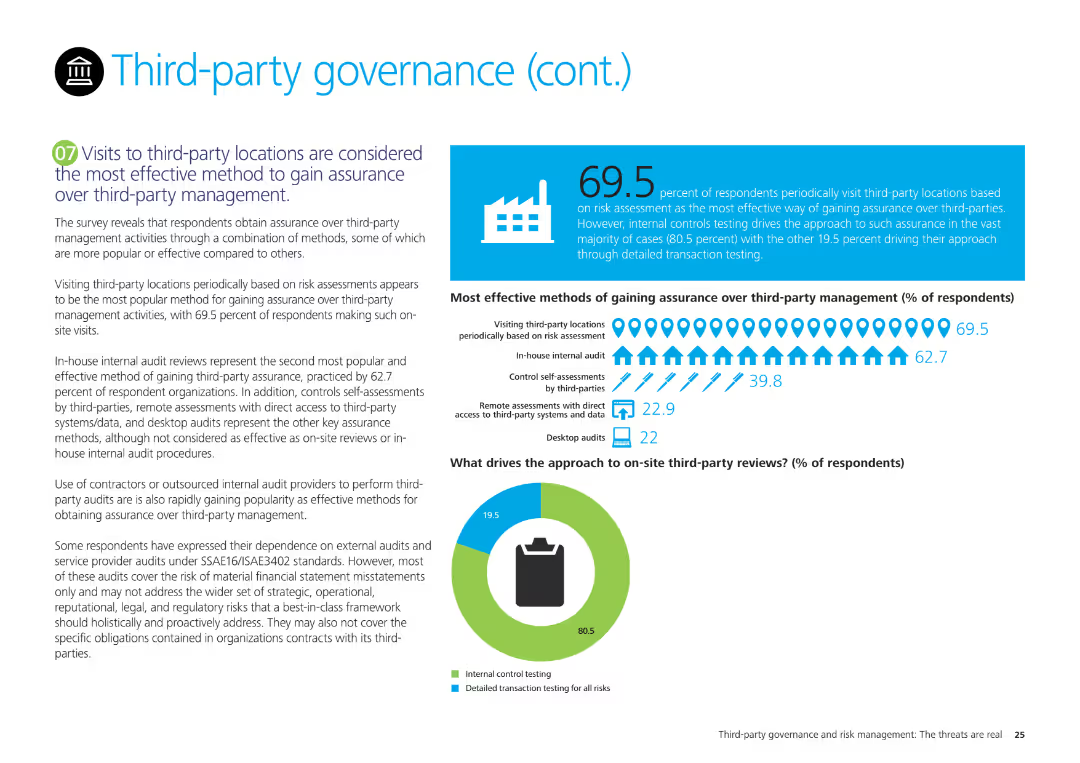
The slide features a pie chart on third-party review approaches and a column chart on methods for gaining assurance over third-party management, with explanatory text.
Regulatory and Compliance
Professional Services
It examines survey results on the most effective methods for gaining assurance over third-party management, emphasizing site visits, internal audits, and controls self-assessments.
Third-party management, assurance, survey results, site visits, internal audits, controls self-assessments
false
Visits to third-party locations are considered the most effective method to gain assurance over third-party management.Third-party governance and risk management The threats are real
Mixed Chart
Deloitte
View slide
A pie chart shows 91% 'Yes' in a bold orange color, alongside a bar chart detailing percentages per sector like Financial Services and Manufacturing, indicating the presence of formal HR functions.
Market Analysis and Trends
Professional Services
Discusses the prevalence of formal HR functions across various sectors, useful for analyzing organizational maturity and HR management practices across industries.
HR, functions, organization, sectors, management, analysis, prevalence
false
Does your organisation have a formal HR function?HR Pulse Survey Presentation of results
Multiple Chart
PwC/Strategy&
View slide
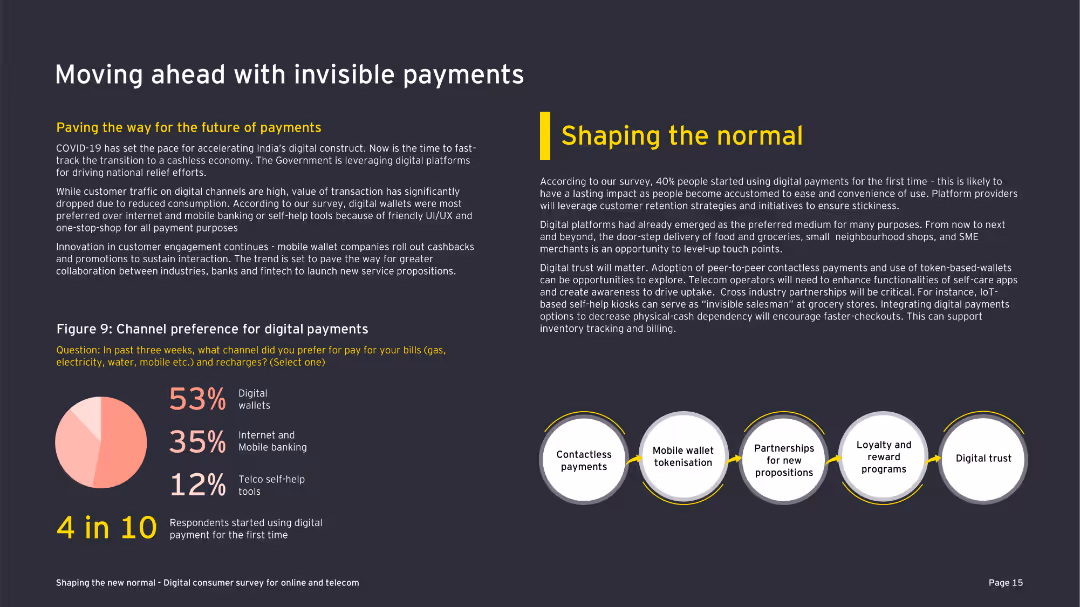
This slide includes a diagram illustrating eight forces influencing consumer behavior, supported by text explanations. The layout is visually complex.
Market Analysis and Trends
Telecommunications
The slide identifies eight key factors shaping the future of consumer behavior in the telecom sector, highlighting driving and restraining forces.
consumer trends, future consumer, telecom, influencing factors, COVID-19, digital adoption, connectivity, technology integration, behavior
false
Moving ahead with invisible paymentsShaping the new normal Digital consumer survey for online and telecom
Mixed Chart
EY
View slide
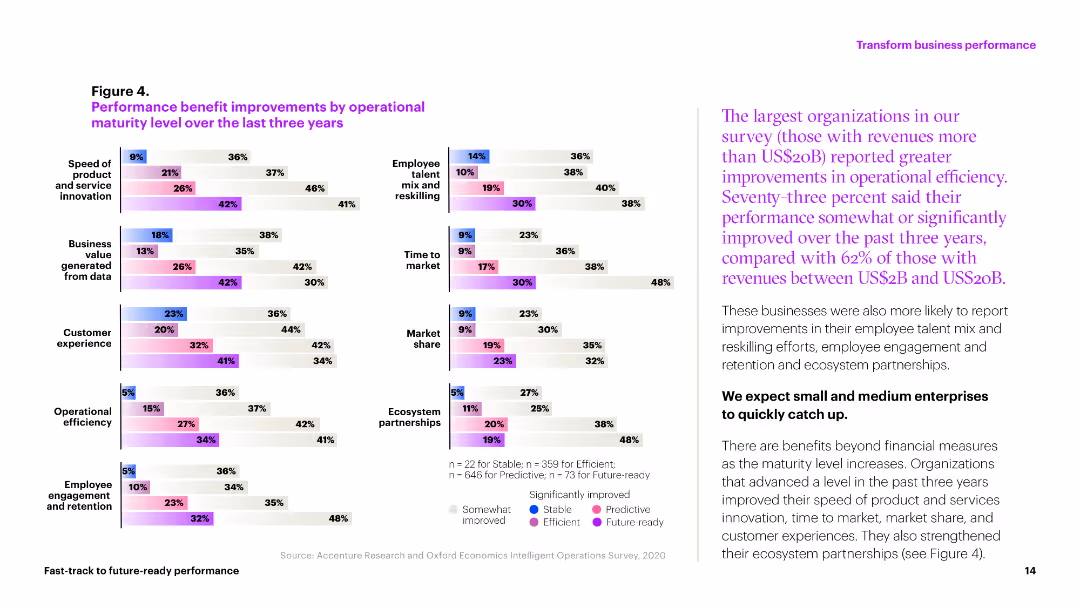
The slide includes multiple column charts showing performance improvements in various operational metrics over three years. Colors differentiate levels of improvement across categories like market share and efficiency.
Operational Efficiency
Professional Services
This slide illustrates the operational improvements achieved by organizations in areas like customer experience, market share, and operational efficiency over the past three years.
performance, improvements, metrics, efficiency, market share
false
Figure 4. Performance benefit improvements by operational maturity level over the last three yearsFAST-TRACK TO FUTURE-READY PERFORMANCE
Multiple Chart
Accenture
View slide
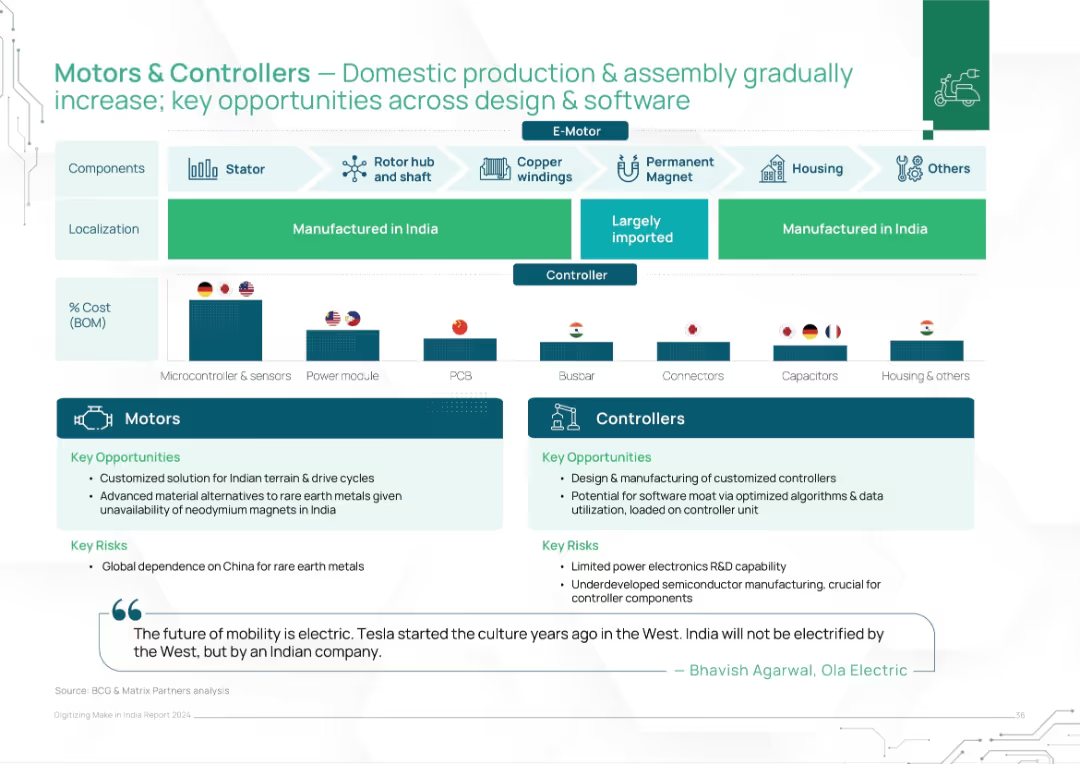
Split block layout separating motor and controller components with localization, cost %, and opportunity/risk sections. National flag icons denote sourcing.
Operational Efficiency
Industrial & Manufacturing
This slide outlines the domestic manufacturing potential for electric vehicle motors and controllers, showcasing localization levels, cost structures, and sourcing countries. It identifies key opportunities in customization, software design, and material innovation, while also flagging risks like rare earth dependence and limited semiconductor capabilities.
motors, EV, localization, manufacturing, India, components, electronics, rare earths, cost structure, R&D
false
Motors & Controllers — Domestic production & assembly gradually increase; key opportunities across design & softwareDigitizing Make in India Report 2024
Mixed Chart
BCG
1
...
Next
Load More
Hold On!
We are searching in our database
If nothing, comes up, please try different filters!
Create a FREE account to continue browsing
Receive Instant Access to 1,000+ slides from companies like McKinsey, Google, and Goldman Sachs
First Name
Last Name
Email
Password
I agree to all
Terms & Privacy Policy
Thank you! Your submission has been received!
Oops! Something went wrong while submitting the form.
Have an account?
Sign in
Column Chart
Heatmap
Chevron
Org Chart
Infographic
Callouts
Timeline
List
Graphic
Picture
Process Flow
Diagram
Paragraph
Map
Table
Framework
Subtitle
Takeaway Box
Icon
Other Chart
Radar Chart
Waterfall Chart
Mekko Chart
Pie Chart
Scatter Plot
Line Chart
Bar chart
Bullet points