My Account
My Slides
Search by Category
Leave Feedback
Login
Logout
Get Started
Browse all Slides
Browse Slides (Pro)
Create a FREE Account
Instant access to 1,000+ real slides from top companies like McKinsey, BCG, Goldman Sachs, Google and many more!
First Name
Last Name
Email
Password
I agree to all
Terms & Privacy Policy
Thank you! Your submission has been received!
Oops! Something went wrong while submitting the form.
Have an account?
Sign in
Instant access to the internet's best slides
Get access to 40+ advanced filters and more
Advanced Search and Filters
Access to
8,000+ slides
Access to Category Pages
Save/Bookmark Slides
PowerPoint Template Library (Coming Soon)
Choose your plan
MONTHLY
$12/month
Billed every month, cancel anytime.
YEARLY
$9/month
Billed $108 annually, cancel anytime.
Checkout for $12/month
Checkout for $108/yr
Secured by Stripe | AES-256 bit encryption
Welcome,
Welcome
Upgrade to SlideStart
Pro
Instant access to 8,000+ slides
Show Featured Only
Checkbox 8
Companies
Mckinsey
Bain
BCG
EY
Deloitte
Accenture
PwC/Strategy&
JP Morgan
Goldman Sachs
Morgan Stanley
Citigroup
Deutsche Bank
Barclays
LEK
Kearney
Oliver Wyman
Booz Allen Hamilton
Gartner
IPSOS
Nielsen
Slide type
Header Horizontal
Framework
Vertical Flow
Single Chart
Single Chart
Text Only
Mixed Chart
Header Vertical
Graphic
Pillar
Multiple Chart
Agenda
Title
Table
Linear Flow
Upgrade to SlideStart
Pro
Instant access to 40+ advanced filters
Industry
Upgrade to SlideStart
Pro
Instant access to 40+ advanced filters
Technology
Healthcare
Financial Services
Consumer Goods
Energy & Utilities
Manufacturing
Retail
E-commerce
Logistics
Telecommunications
Real Estate
Professional Services
Education
Media
Entertainment
Hospitatlity
Tourism
Agriculture
Food Production
Government & Public Sector
Environmental
Sustainability
Use Case
Upgrade to SlideStart
Pro
Instant access to 40+ advanced filters
Sales and Business Development
Mergers and Acquisitions
Corporate Finance and Valuation
Performance Metrics and KPIs
Client Case Studies
Competitive Landscape
Product and Service Analysis
Customer and Market Segmentation
Organizational Structure
Human Resources and Talent Management
Industry Overview
Regulatory and Compliance
Risk Assessment and Management
Agriculture & Food Production
Hospitality and Tourism
Government
Environmental
Sustainability
Clear all
Thank you! Your submission has been received!
Oops! Something went wrong while submitting the form.
Show Featured Only
Checkbox 8
Companies
Mckinsey
Bain
BCG
EY
Deloitte
Accenture
PwC/Strategy&
JP Morgan
Goldman Sachs
Morgan Stanley
Citigroup
Deutsche Bank
Barclays
LEK
Kearney
Oliver Wyman
Booz Allen Hamilton
Gartner
IPSOS
Nielsen
Slide type
Text Only
Linear Flow
Vertical Flow
Single Chart
Header Horizontal
Mixed Chart
Header Vertical
Pillar
Multiple Chart
Graphic
Agenda
Title
Table
Framework
Industry
Technology
Healthcare
Financial Services
Consumer Goods
Energy & Utilities
Manufacturing
Retail
E-commerce
Logistics
Telecommunications
Real Estate
Professional Services
Education
Media
Entertainment
Hospitatlity
Tourism
Agriculture
Food Production
Government & Public Sector
Environmental
Sustainability
Use Case
Sales and Business Development
Mergers and Acquisitions
Corporate Finance and Valuation
Performance Metrics and KPIs
Client Case Studies
Competitive Landscape
Product and Service Analysis
Customer and Market Segmentation
Organizational Structure
Human Resources and Talent Management
Industry Overview
Regulatory and Compliance
Risk Assessment and Management
Agriculture & Food Production
Hospitality and Tourism
Government
Environmental
Sustainability
Clear all
Thank you! Your submission has been received!
Oops! Something went wrong while submitting the form.
Tag
View slide
The slide uses horizontal bar graphs to compare the online spend of HVUs and non-HVUs in the Philippines. It features a blue and grey color scheme, with each category of spend such as transport, gaming, and travel represented by a bar. The right side of the slide includes two column charts showing changes in spend percentage. It provides demographic and geographic composition percentages through pie charts.
Customer and Market Segmentation
Technology & Software
This slide compares the online spending of high-value users (HVUs) with non-HVUs in the Philippines, emphasizing transport as a significant factor. It's useful for businesses and marketers to identify and capitalize on key differentiators in consumer spending behavior, especially in the context of transportation and e-commerce sectors.
HVUs, Non-HVUs, Philippines, Transport, Online Spend, Gaming, Travel, E-commerce, Market Segmentation
false
Philippines HVUs spend 6.3X vs non-HVUs; transport is a key differentiatore-Conomy SEA 2023 report: Philippines
Multiple Chart
Bain
View slide
Contains bar charts detailing macroeconomic concerns by region.
Risk Assessment and Management
Financial Services
Analyzes executive concerns about macroeconomic factors like inflation and supply chain disruptions, with a focus on differences across North America, Europe, and Asia.
macroeconomic, inflation, supply chain, concerns, regions
false
However, executives remain cautious about the uncertain economic outlook, inflation, and rising interest rates, especially in this historic election yearThe CEO's Guide to Costs and Growth
Multiple Chart
BCG
View slide
Demographics infographic, statistical representations, and a purple and white theme.
Industry Overview
Technology & Software
The slide shows survey demographics, highlighting the representation of various high-tech industries and geographic distribution. This could be used in presentations analyzing market trends, industry representation, or for setting the context in a broader industry analysis discussion.
Survey, Demographics, High Tech, Industries, Geographic Distribution, Market Trends, Analysis, Context, Representation
false
Survey demographicsTransforming the Industry that transformed the World: 02 Expand industry boundaries
Multiple Chart
Accenture
View slide
The slide has a purple-themed color scheme with two main visual elements. On the left, there's a hexagonal flow chart with text labels like "Identify Consumer Demand". On the right, a radial graph shows various business impacts in shades of purple indicating different impact levels.
Strategic Planning
Technology & Software
The slide emphasizes the importance of an end-to-end approach to business planning and intelligent manufacturing. It maps interventions across the value chain and their degree of impact, serving as a strategic planning tool for assessing business processes and performance frontiers.
Value Chain, Business Planning, Manufacturing, Strategic Planning, End-to-End, Performance, Intelligent Manufacturing, Impact Levels, Fullfillment Capabilities, Optimization
false
Building full value chain business planning and intelligent manufacturing and fulfillment capabilities at the performance frontier requires an end-to-end approachTotal Enterprise Reinvention
Single Chart
Accenture
View slide
The slide is split into two main sections: one with a line chart showing OPEC crude oil production and oil prices, and the other with a line chart showing the US Strategic Petroleum Reserve. Descriptive text supports each chart.
Market Analysis and Trends
Energy & Utilities
This slide explores the influence of OPEC+ on global oil production and prices, and the US's release of its Strategic Petroleum Reserve. It discusses production cuts and the strategic reserve's impact on the market.
OPEC+, oil production, strategic reserve, US, prices
false
OPEC+ in charge US and others release strategic reservesEY Price Point: global oil and gas market outlook Q1 | January 2022
Multiple Chart
EY
View slide
Column chart with a radar chart overlay showing indicators like income per client, income per employee, and cost-to-income ratio. Indicators are displayed for 2018, 2021, and 2023.
Financial Performance
Financial Services
Highlights the significant growth in income and profitability for European retail banks in 2023 compared to previous years.
income, profitability, retail banking, Europe, radar
false
Retail Banking Radar Indicators Overall EuropeRetail Banking Evolution in the Age of AI
Single Chart
Kearney
View slide
The slide features a scatter plot with bubbles of various sizes and colors representing different industries and use cases. The axes show 'Volume' of data and 'Impact score' of machine learning applications.
Industry Overview
Technology & Software
This slide analyzes the potential impact of machine learning across various industries like healthcare, consumer goods, and energy, highlighting areas with higher data volumes and impact scores.
Machine Learning, Industries, Data Volume, Impact, Visualization
false
Machine learning has broad potential across industries and use casesA FUTURE THAT WORKS: AI, AUTOMATION, EMPLOYMENT, AND PRODUCTIVITY
Single Chart
McKinsey
View slide
Slide is a table layout detailing figures, with clear demarcation and legible text.
Risk Assessment and Management
Energy & Utilities
Analyzes BBVA's exposure to the Oil & Gas sector, with a breakdown by region and subsegment.
Oil, Gas, exposure, BBVA, risk
false
Appendix 1: Oil & Gas Sector Exposure BreakdownBBVA - Thinking Ahead Morgan Stanley European Financials Conference 2016
Table
Morgan Stanley
View slide
Slide with column chart showing portfolio loans and a pie chart for commercial portfolio mix. The layout is clean, using contrasting colors for clarity.
Financial Performance
Financial Services
The slide presents the financial state of commercial portfolio loans, highlighting changes over quarters and the distribution of different loan types. It’s typically used for analyzing financial trends and the makeup of portfolio investments in a business setting.
Portfolio, Trends, Finance, Commercial, Analysis
false
Total commercial portfolio overviewMorgan Stanley US Financials, Payments, & CRE Conference
Multiple Chart
Morgan Stanley
View slide
This slide includes two column charts comparing the growth of Global Fixed Income and Credit Investments Group from 2015 to 3Q19, with additional information on innovative offerings.
Investment Analysis
Financial Services
The slide highlights the creation of a leading credit platform, detailing the growth in assets under management and innovative, higher-margin offerings.
Credit Platform, AuM, Fixed Income, Investments, Innovation
false
Created a leading credit platform with ~CHF 120 bn AuMCredit Suisse Investor Day 2019 An effective approach: 3 case studies
Multiple Chart
Credit Suisse
View slide
Depicts multiple bar charts showing the increase in online adoption across various retail categories, with a particular focus on groceries.
Market Analysis and Trends
Retail & E-commerce
Details the significant increase in online retail adoption in Southeast Asia, with an emphasis on the rapid rise of online grocery shopping.
Online adoption, retail categories, Southeast Asia, groceries, bar chart
false
Five years of digital transformation in a single yearDigital Consumers of Tomorrow, Here Today: A SYNC SOUTHEAST ASIA REPORT
Multiple Chart
Bain
View slide
The slide contains a line chart tracking e-commerce as a percentage of core retail sales with estimates and a line graph of warehouse construction spending.
Market Analysis and Trends
Retail & E-commerce
It analyzes the impact of e-commerce on retail sales and correlates it with warehouse construction spending, emphasizing its ongoing influence on the economy.
e-commerce, retail sales, warehouse construction, economy
false
Digitization E commerce is still shaping the economyCiti Global Wealth Investments OUTLOOK 2022
Multiple Chart
Citigroup
View slide
Features column charts and annotations emphasizing the growth in industry gross balances and systematic wallet growth.
Investment Analysis
Financial Services
The slide details the expansion in client financing for equities, highlighting significant increases and revenue gap bridging strategies.
equities, client financing, gross balances, systematic growth, revenue gap, market analysis, investment banking
false
Increase Client Financing in EquitiesGoldman Sachs Investor Day
Multiple Chart
Goldman Sachs
View slide
Contains a line graph comparing TCO for electric and diesel buses over mileage.
Investment Analysis
Financial Services
Analyzes how long-term savings from EVs can offset higher initial costs.
EV, TCO, cost savings, electric buses, diesel comparison
false
In addition to battery cost reductions, long term cost savings must be communicated effectively to buyers to overcome worries over higher initial coste-mobility in India Market paradigms and ways to play
Mixed Chart
PwC/Strategy&
View slide
Contains a pair of column charts with a notable use of color coding to differentiate between various appeal origins. Textual content is balanced with visual data.
Operational Efficiency
Government & Public Sector
This slide explores the typical practices of the Appeal Division, including the use of three-judge benches and statistics on appeal origins, which aids in understanding division operations and decision-making.
appeal division, three-judge bench, case management, practices
false
Practices of the Appeal DivisionReview of efficiency of the operation of the federal courts
Mixed Chart
PwC/Strategy&
View slide
The slide features a multi-faceted analysis with icons and bullet points, highlighting the impact of rural e-commerce strategies in China.
Market Analysis and Trends
Retail & E-commerce
Discussing the successful increase in rural e-commerce due to service centers and partnerships, this slide presents a case study on expanding digital comfort and online purchasing within rural communities in China.
E-commerce, rural strategy, China, digital adoption
false
Digital comfort: Large ecommerce player in ChinaDigital consumer spending in India: A $100 Bn opportunity
Header Vertical
BCG
View slide
This slide includes text, icons representing different mood factors, and a line chart showing Mood Monitor scores over several years.
Risk Assessment and Management
Healthcare & Pharmaceuticals
The slide presents the Mood Monitor, which gauges Gen Zs' and millennials' optimism about the future, based on responses to various questions about their mood.
mood monitor, optimism, Gen Z, millennials, mental health, future outlook
false
Mood Monitor2023 Gen Z and Millennial Survey
Mixed Chart
Deloitte
View slide
The slide includes line graphs comparing CAC vs CO2 emissions from electricity generation for FCEV and BEV under different scenarios.
Regulatory and Compliance
Energy & Utilities
The slide analyzes the carbon abatement cost and CO2 emissions for fuel cell electric vehicles and battery electric vehicles, considering the impact of grid emissions on savings.
CAC, CO2, FCEV, BEV, emissions, savings
false
As emissions from the grid grow, FCEV would save more CO2 than 600-km range BEV, but for 400 km, BEV would still be betterHydrogen applications and business models
Mixed Chart
Kearney
View slide
The slide combines a column chart with an upward trend for three quarters, an accompanying high-quality image of a car, and bullet points outlining key facts about the company's offer in lighting. The visual focus is balanced between the chart and the image, with both elements prominently displayed against a clean white background. The text is concise, using bold fonts for emphasis.
Product and Service Analysis
Industrial & Manufacturing
This slide highlights the company's significant order book in lighting, emphasizing orders from major automotive OEMs and production across regions. It discusses new orders and projects future revenue targets. This visual and textual combination effectively conveys the company's capabilities in lighting and its market relevance, likely aimed at investors or partners.
Lighting, Order Book, OEMs, Production, Growth, Revenue Targets, Column Chart, Automotive, Market Relevance, Forecast
false
Plastic Omnium’s relevant offer in Lighting Securing the order book for the coming years15TH ANNUAL AUTO CONFERENCE GOLDMAN SACHS
Mixed Chart
Goldman Sachs
View slide
The slide features a line chart comparing expected returns and volatility across different leverage levels and asset allocations.
Investment Analysis
Financial Services
This slide assesses how prudent use of leverage can potentially enhance returns more effectively than adding high-risk assets, given various loan costs.
leverage, risk assets, expected returns, volatility, investment strategy
false
Prudent leverage may improve returns more than adding to risk assetsHow leverage can be the best option to enhance returns and achieve your goals
Multiple Chart
UBS
View slide
This slide is designed with a circular diagram at the center, surrounded by text blocks, icons, and a title, all unified by a consistent blue color palette.
Human Resources and Talent Management
Technology & Software
It stresses the importance of investing in employees’ career growth, suitable for discussions on HR development strategies and managerial training.
career growth, HR, investment, training, enablement, employees, performance management
false
Businesses need to invest in employees' careers to meet employees' needs for growth and progressionASEAN Growth and Scale Talent Playbook
Diagram
Kearney
View slide
The layout presents a three-column text arrangement with headers like 'Global Banking & Markets', 'Asset & Wealth Management', and 'Platform Solutions'. The text is white on a dark background for contrast, with bullet points summarizing objectives and accomplishments in each sector.
Strategic Planning
Financial Services
Describes the strategic objectives and achievements in various business units, such as expanding banking footprint and client assets under supervision, relevant for understanding the company's strategic focus areas and growth measures.
Strategic goals, banking, wealth management
false
Strong Progress Against Our Business GoalsState of the Franchise
Table
Goldman Sachs
View slide
This slide has column charts with financial data in blue and black colors on a white background.
Financial Performance
Financial Services
The slide presents a comprehensive view of the Institutional Clients Group financial results, featuring detailed quantitative metrics such as net interest income, total revenues, credit costs, and net income, juxtaposed with year-on-year and quarter-on-quarter comparisons. It is likely used to evaluate financial performance and make strategic decisions.
financial, clients, income, revenue, costs, credit, EBT, net income, ROcTE, efficiency
false
institutional Clients Group ResultsEarnings Results Presentation Second Quarter 2023
Mixed Chart
Citigroup
View slide
This slide presents a narrative scenario with a moderate visual complexity. It uses a balanced text layout to tell a story about gender diversity issues in a professional setting. Red highlights and silhouette icons emphasize key points. The design includes bullet points, two text blocks, and stylized graphic elements.
Technology and Digital Transformation
Professional Services
The slide narrates a scenario of gender bias in a multinational company, depicting the overlooked leadership potential of a female employee due to stereotypes. It serves to initiate discussions on gender diversity and inclusion within corporate environments, particularly in international mobility opportunities.
Gender bias, Leadership, Diversity, Inclusion, Multinational
false
Picture this scenarioMoving women with purpose: Creating gender inclusive global mobility
Boxed
PwC/Strategy&
View slide
Three line charts depicting UK y/y real GDP, UK unemployment rate, and UK y/y percent change in headline CPI from 2005-25F. Moderate complexity with clear visual representations for economic trends analysis.
Market Analysis and Trends
Financial Services
The slide provides an economic forecast for the UK, projecting subdued GDP growth, persistent inflation, and softening employment trends. It discusses the effects of fiscal and monetary policies, as well as ongoing strikes and public holidays on economic activity.
UK, GDP, unemployment, CPI, forecast
false
Our baseline anticipates subdued UK GDP growth amid challenging fiscal and monetary policy headwinds, persistent inflation and softening employment trendsGlobal economic outlook Macroeconomic outlook and impact on businesses
Multiple Chart
EY
View slide
Features logos of various start-ups in the SME services market, categorized by service type, against a cityscape background.
Competitive Landscape
Financial Services
The slide provides a snapshot of the start-up environment in the SME services sector, highlighting the market entry of specialized service providers. It's valuable for discussing the evolving competitive landscape and potential investment opportunities within the SME services space.
SME Services, Start-ups, Market Landscape, Service Providers, Investment Opportunities
false
At the same time, dedicated SME services start-ups are also pursuing the market.Unlocking the next wave of digital growth: beyond metropolitan Indonesia
Header Vertical
Kearney
View slide
Contains stacked column charts for leverage exposure and risk-weighted assets, split into categories such as trading and lending.
Financial Performance
Financial Services
Analyzes the bank's exposure to different types of financial risk at the end of Q3 2023, presenting quantitative leverage and risk data. Used for evaluating financial stability.
leverage, risk, financial analysis, Q3 2023
false
Leverage exposure and risk-weighted assets CRD4, in € bn, period endQ3 2023 results
Multiple Chart
Deutsche Bank
View slide
Displays column charts comparing the importance of analytical versus creative skills among marketing leaders.
Operational Efficiency
Professional Services
Analyzes trends in the prioritization of analytical skills over creative expertise in marketing, driven by data-intense market demands.
marketing, analytics, creative, skills, leadership, technology, efficiency
false
FIGURE 1 Chief marketing officers often identify analytical expertise as a more important skill than creative expertise Chief marketing officers who identified analytical and creative expertise as top skills2022 Global Marketing Trends
Mixed Chart
Deloitte
View slide
Similar to the previous slide, this uses a split circular diagram with segments highlighted in orange and red, focusing on different tax proposals like Betting activities and VAT on asset managers. Icons and minimal text enhance clarity.
Regulatory and Compliance
Government & Public Sector
Further tax amendments for Namibia in 2018 are shown, discussing betting and gaming taxes, VAT changes for asset managers, and fuel levy increases. It helps in reviewing the expected financial outcomes from these legislative changes.
tax, amendments, revenue, betting, VAT, asset managers, fuel levy, Namibia, 2018
false
Betting and gaming activities – 37%Re-Imagine the Possible 2018/2019
Framework
PwC/Strategy&
View slide
Presents a detailed abatement cost curve for a steel plant, categorizing various decarbonization technologies and their potential impacts.
Operational Efficiency
Industrial & Manufacturing
Focuses on decarbonization strategies for the steel industry, highlighting cost-effective measures and technology shifts. Useful for operational planning and cost management.
decarbonization, steel industry, cost management, operational efficiency, technology, sustainability
false
Reevaluate decarbonization plans | Massive changes to decarbonization actions: Steel exampleUS Inflation Reduction Act: Climate & Energy Featuresand Potential Implications
Mixed Chart
BCG
View slide
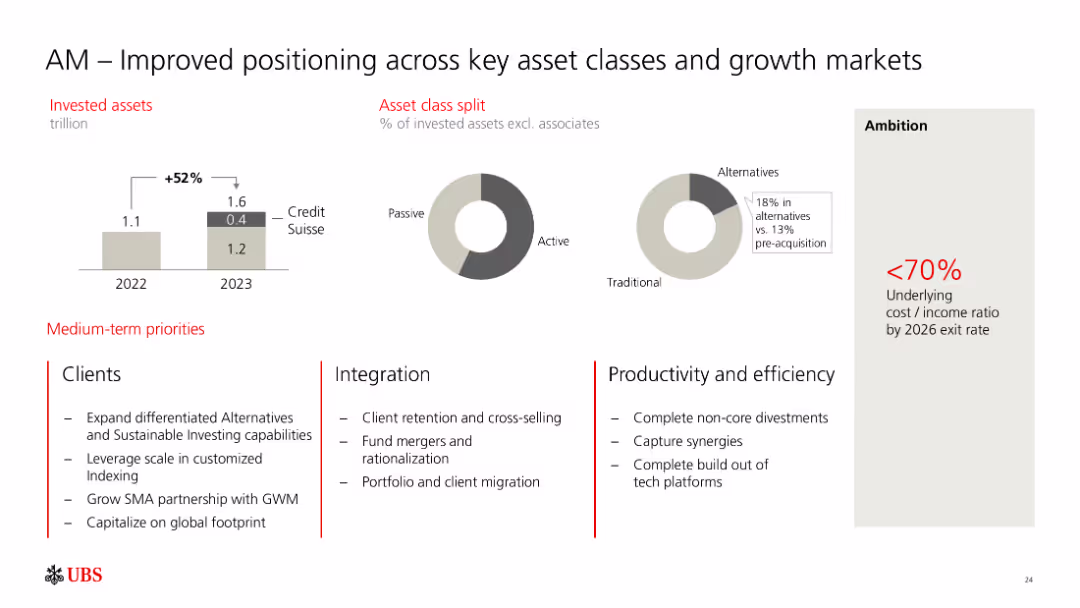
The slide shows bar graphs indicating invested assets growth from 1.1 trillion in 2022 to 1.6 trillion in 2023, including Credit Suisse assets. Pie charts display the asset class split between passive, active, and alternatives. Text outlines medium-term priorities for clients, integration, and productivity.
Market Analysis and Trends
Financial Services
The slide highlights improved positioning of asset management across key asset classes and growth markets. It details asset growth, asset class distribution, and strategic priorities in client services, integration, and productivity. This slide is suitable for discussing asset management strategies and market positioning.
asset management, growth markets, asset classes, strategic priorities, Credit Suisse
false
AM – Improved positioning across key asset classes and growth marketsFourth quarter 2023 Results and investor update
Multiple Chart
UBS
View slide
Utilizes a scatter plot and bar graph to discuss types and frequencies of business disruptions.
Risk Assessment and Management
Industrial & Manufacturing
Analyzes different types of business disruptions and their predictability, offering a framework for understanding the likelihood and impact of various events like pandemics and cyber attacks.
Disruptions, Business, Framework, Predictability, Impact
false
Disruptions of operations are often impossible to predict, but happen with regularityCovid 19: Briefing Materials
Multiple Chart
McKinsey
View slide
Contains column charts and tables showing trends in loan and deposit figures over several quarters.
Financial Performance
Financial Services
This slide tracks the development of loans and deposits across various banking divisions, highlighting trends and changes. It is crucial for financial strategists and banking executives to assess liquidity management, lending practices, and deposit accumulation, enabling data-driven decision-making for operational and strategic initiatives in the banking sector.
Loans, Deposits, Banking Trends, Financial Analysis, Liquidity Management
false
Loan and deposit development In € bn, unless stated otherwise, loan-to-deposit ratio 79%Q3 2023 results
Multiple Chart
Deutsche Bank
View slide
The slide includes a pie chart and a list of areas of expertise in market and opinion research.
Strategic Planning
Professional Services
The slide highlights Ipsos' comprehensive offerings in market and opinion research across different sectors.
expertise, market research, opinion research, Ipsos, sectors, services
false
EXPERTISE IN ALL SPHERES of market and opinion researchOur Path to Ipsos 2025: A Strategic Update
Single Chart
IPSOS
View slide
Dark background with white text. Includes circular charts showing percentages and yellow highlights.
Market Analysis and Trends
Healthcare & Pharmaceuticals
This slide highlights that 59% of consumers would switch to virtual consultations for prescription renewal, 58% for discussing test results, 54% to save time, and 54% for minor medical conditions, indicating a preference for virtual healthcare solutions among U.S. consumers.
virtual consultations, healthcare, U.S. consumers, preferences, statistics
false
‘I would switch to virtual consultations for minor matters or greater convenience.’ Consumers: United StatesHealth care consumer views on value
Mixed Chart
EY
View slide
Column charts for capital metrics, column charts for assets and liabilities, text boxes
Financial Performance
Financial Services
Detailed capital and liquidity metrics, balance sheet overview of a financial firm
Capital, Liquidity, Balance Sheet, Bar Chart, Column Chart, Financials
false
Capital and Balance Sheet OverviewEarnings Results Presentation
Multiple Chart
Citigroup
View slide
The slide includes a line graph tracking investor sentiment over time. It contrasts views on the stock market and the economy, with textual annotations explaining key trends and dates.
Market Analysis and Trends
Financial Services
Analyzes investor sentiment shifts regarding the stock market and economy, noting particularly low bullishness. Useful for market trend analysis and investment strategy planning.
Investor Sentiment, Bearish Trends, Bullish Sentiment, Stock Market, Economy, Market Analysis, Investment Strategy, Trend Tracking, Economic Outlook, Sentiment Change
true
Investors are more bearish on the stock market and economy, with bullish sentiment among its lowest levelsBCG Investor Perspective Series: Pulse Check #21
Single Chart
BCG
View slide
Featuring a box plot distribution chart, the slide has a title, descriptive subtext, and clearly labeled axes. Each box plot indicates the inter-quartile and 90th percentile ranges of year-to-date total shareholder returns by industry.
Risk Assessment and Management
Financial Services
Showcases the variability of shareholder returns within industries, highlighting that even companies within the same sector can experience widely different financial performances. Designed for risk analysis within sectors.
Shareholder returns, Variability, Industry analysis, Risk management, Financial performance
false
Even within sectors, there is significant variance between companies Distribution of year-to-date total shareholder returns by industry percent1COVID-19: Briefing Note
Single Chart
McKinsey
View slide
Text-heavy discussing geographical spread and operational models of GBS with a pie chart (Figure 7) showing operational models.
Strategic Planning
Professional Services
Analyzes the benefits and considerations of various GBS deployment models, such as hub-and-spoke.
GBS, models, hub-and-spoke, deployment, benefits
false
Under a coordinated approach, the advantages of combining in-house with outsourced service delivery include:Global Business Services Performance improvement
Mixed Chart
Deloitte
View slide
The slide features multiple column charts with percentages indicating new car purchase intent and changes in mobility mode.
Market Analysis and Trends
Transportation & Logistics
Analyzes the impact of COVID-19 on consumer behaviors related to car buying, aftermarket services, and mobility preferences.
COVID-19, car purchase, mobility, consumer behavior, market analysis
false
Consumer’s car purchase intent and mobility below pre-COVID-19 levels but recoveringCOVID-19 Auto & Mobility Consumer Insights
Multiple Chart
McKinsey
View slide
Features table style displaying branch consolidations, savings, deposit share gains, and new builds. Highlights key market data points.
Operational Efficiency
Financial Services
Presents a data-driven approach for optimizing the branch network to align with customer demand in various markets.
Data-Driven, Branch Optimization, Customer Demand, Market Expansion, Financial Efficiency, Savings
false
We have a proven, data driven approach to optimize and extend our branch network coverageConsumer & Community Banking
Table
JP Morgan
View slide
A column chart showing market share by region from 2000 to 2030. Uses color-coded segments to represent different regions. Includes a dashed line for future projections. Clear, structured layout with a legend and source information at the bottom.
Market Analysis and Trends
Technology & Software
Slide analyzes the projected decline in market share for U.S. companies in the semiconductor industry by 2030, suggesting a need for strategic actions to maintain competitiveness in a global context.
semiconductor, market share, projections, U.S., decline
false
In absence of action, market share of US companies (a proxy for design leadership) is projected to drop to 36% by 2030The Growing Challenge of Semiconductor Design Leadership
Single Chart
BCG
View slide
Slide has a pie chart detailing portfolio composition and column charts showing maturity breakdown and fair value gap.
Risk Assessment and Management
Financial Services
Discusses the composition and maturity of debt securities in a Hold-to-Collect portfolio, with emphasis on risk management through asset distribution and maturity stages.
debt securities, portfolio, maturity, risk management, fair value, bonds, asset distribution
false
Debt securities Hold-to-Collect portfolioClient & Creditor Overview May 31, 2023
Multiple Chart
Deutsche Bank
View slide
This slide contains a bar graph showing weighted average year-to-date local currency shareholder returns by industry, with varying bar widths representing market cap sizes. It has a clear title, a source line, and annotations for data points.
Market Analysis and Trends
Financial Services
The slide presents market capitalization trends across various industries, indicating a decline with varying degrees. It serves to compare sectors and provide insights into the economic impact on market values.
Market capitalization, Industry comparison, Shareholder returns, Economic trends, Data analysis
false
Market capitalization has declined across sectors, with significant variation to the extent of the decline Weighted average year-to-date local currency shareholder returns by industry in percent.1 Width of bars is starting market cap in $COVID-19: Briefing Note
Single Chart
McKinsey
View slide
The slide shows a balanced layout with text on the left and related hexagonal icons on the right. It details investment approaches like "Equity," "Debt," and "Tax Credit Equity," with impacts such as "Sustainable Transport" and "Communities."
Investment Analysis
Government & Public Sector
This slide is about Goldman Sachs' Urban Investment Group and its commitment to creating commercial opportunities within communities. It is useful for presentations related to urban development, community engagement, and investment impacts on education and sustainable transport.
urban investment, Goldman Sachs, community, sustainability, finance
false
Urban Investment GroupGoldman Sachs Investor Day
Table
Goldman Sachs
View slide
The slide features a line graph tracking CEO optimism versus pessimism over time, alongside a detailed analysis. The layout is clean with a balance of text and visual data.
Market Analysis and Trends
Professional Services
Depicts a shift in CEO sentiment towards economic growth, showcasing an increasing trend in pessimism. Useful for discussions on market sentiment and planning.
CEO, Pessimism, Optimism, Economic Growth, Survey
false
In the survey, CEOs express a record level of pessimism regarding the global economic outlook in 2020, with 53% projecting a decline in the rate of global economic growth, up sharply from 29% last year.PwC's 23rd Annual Global CEO Survey
Mixed Chart
PwC/Strategy&
View slide
Title at the top with two bar charts below showing changes in consumer behavior, and quotes on the right side for emphasis.
Market Analysis and Trends
Retail & E-commerce
Reflects on how the pandemic has led consumers to reconsider their purchases with an emphasis on sustainability and ethics.
consumer habits, sustainability, ethical purchasing, waste reduction, pandemic impact, testimonials
false
Consumers are forced to face their own consumption causing many to reconsider their purchases accordinglyHow is COVID-19 changing the retail consumer?
Single Chart
Accenture
View slide
The slide features a column chart showing world bioenergy consumption by sector (energy, transport, industry, buildings) from 2018 to 2040 under a stated policies scenario. It includes detailed data on the growth of bioenergy use in power, heat, car, truck, shipping, aviation, industry, and residential sectors.
Market Analysis and Trends
Energy & Utilities
This slide projects the growth of world bioenergy consumption across various sectors until 2040, with a focus on the significant contributions from the power and transport sectors to the overall increase in bioenergy demand.
world bioenergy consumption, sector, 2018-2040, power, heat, transport, industry, buildings, growth forecast
false
World bioenergy consumption by sectorDeveloping sustainable carbon circularity Looking at advanced applications and business models
Single Chart
Kearney
View slide
A column chart displays CCB revenue from 2018 to 2019. Adjacent to it, smaller bar segments represent contributing factors like volume, pricing actions, and others.
Market Analysis and Trends
Financial Services
The slide provides an analysis of the revenue growth in Consumer & Community Banking, identifying the impact of volume, pricing, macro rates, and other factors. It serves to break down the components of revenue changes over the year.
revenue, growth, volume, pricing, CCB, analysis, trends, topline
false
Topline growth was volume-driven, and pricing actions offset secular trendsCONSUMER & COMMUNITY BANKING
Single Chart
JP Morgan
View slide
Slide uses horizontal bars to compare potential impacts on organizations failing to meet productivity targets, focusing on business growth and valuation impacts.
Risk Assessment and Management
Professional Services
Evaluates potential negative outcomes for companies not achieving their productivity goals, highlighting differences between larger and smaller companies.
productivity, impacts, valuation, growth, targets
false
Those surveyed said declining valuations are the most likely impact to smaller companiesPrivate company outlook: Productivity
Single Chart
Deloitte
View slide
The slide features a box plot and a column chart displaying the distribution of average daily time spent on online intermediaries. Two tables provide detailed statistics about the average time and proportion of online time spent.
Market Analysis and Trends
Telecommunications
This slide presents data on the average daily time spent on Online Intermediaries (OIs), showing detailed statistics, including the mean, median, and percentile distributions, based on panelist data from Ipsos Iris Clickstream Data.
Online Intermediaries, Daily Time, Statistics, Box Plot, Column Chart
false
Average daily time spent on Online IntermediariesIpsos Iris passive monitoring data analysis
Mixed Chart
IPSOS
View slide
The slide includes a column chart displaying participants' views on the importance of crypto assets in the financial ecosystem, rated from 1 to 7.
Market Analysis and Trends
Financial Services
This slide assesses participants' opinions on the current significance of crypto assets within the financial ecosystem.
Financial ecosystem, crypto assets, significance, survey, participants
false
Current Role of Crypto Assets in the Financial EcosystemCRYPTO ASSET SURVEY
Mixed Chart
IPSOS
View slide
Contains text descriptions and bullet points with a sidebar example of an Indian alcohol beverage manufacturer, a QR code, and percentage growth figures.
Market Analysis and Trends
Professional Services
Describes strategies for leveraging customer insights to develop and prioritize demand spaces, illustrated by a case study with positive growth outcomes.
Customer Insights, Demographics, Market Segmentation, Demand Spaces, Growth Strategy
false
Leverage deep customer insights—demographics, needs, context—to develop and prioritize meaningful demand spacesBCG Executive Perspectives: The Future of Sales and Marketing is Here
Text Only
BCG
View slide
The slide is split into two sections. The left side contains images depicting growth estimates for various vessel types from 2023 to 2024. The right side lists key market catalysts for the drybulk sector.
Market Analysis and Trends
Transportation & Logistics
This slide analyzes the growth projections for different vessel types in the drybulk sector and identifies major market catalysts affecting this industry.
shipping, drybulk, growth estimates, market catalysts, transportation
false
Freight rate catalysts and drybulk outlookDeutsche Bank’s 2023 Shipping Summit
Header Horizontal
Deutsche Bank
View slide
Contains multiple column charts showing operational metrics like lost-time incident rates and clean operations, alongside textual information on global operations.
Regulatory and Compliance
Environmental Services & Sustainability
Emphasizes the company’s commitment to safety, ethical standards, and environmental responsibility, including specific targets for reducing operational incidents.
corporate responsibility, safety, ethical standards, environmental, targets
false
Corporate ResponsibilityBarclays CEO Energy-Power Conference 2019
Multiple Chart
Barclays
View slide
The slide includes two vertical column charts comparing credit and market risk RWA, and the rundown based on natural run-off profiles.
Risk Assessment and Management
Financial Services
This slide outlines the strategy for reducing non-core and legacy assets, focusing on risk-weighted assets (RWA).
rundown, non-core assets, legacy assets, RWA, credit risk
false
Accelerating the rundown of Non-core and Legacy assetsThird quarter 2023 Fixed Income investor presentation
Multiple Chart
UBS
View slide
Combines text, icons, and images to outline the modules and pathways of the Kearney Procurement Academy, including online learning.
Technology and Digital Transformation
Education & Training
Provides an overview of the Kearney Procurement Academy, its training modules, and online learning pathways for skills development.
procurement, academy, training, development, modules, online learning, pathways, education, skills
false
The Kearney Procurement Academy plays an important role in driving skills development building to ensure sustainability and propagation of resultsExcellence in Procurement
Header Vertical
Kearney
View slide
The slide features a column chart displaying the private funding value from 2019 to H1 2022 alongside an orange line graph for the average 10-year US treasury rate. Annotations provide additional context about market trends, including recent changes affecting investments.
Investment Analysis
Financial Services
Highlights investment trends in the first half of 2022, comparing private funding values with the average 10-year US treasury rate, contextualized with annotations on SEA’s deal landscape, showing how rising interest rates affect investments.
investments, trends, H1 2022, private funding, treasury rates, SEA, market
false
Investments maintained strong momentum in H1 2022, but investors are getting increasingly cautiouse-Conomy SEA 2022 Through the waves, towards a sea of opportunity
Mixed Chart
Bain
View slide
The slide contains two column charts displaying operating expenses and risk-weighted assets over different periods. It uses a minimalistic design with blue and white colors and clear annotations.
Operational Efficiency
Financial Services
The slide explains the efficient utilization of resources with a focus on cost management and RWA efficiency. It shows changes in operating expenses and risk-weighted assets, emphasizing disciplined expense management.
Resource Utilization, Cost Efficiency, RWA, Operating Expenses, Capital Management
false
Efficient utilization of resources – Continued focus on cost and RWA efficiencyCredit Suisse Investor Day 2018 Leveraging capabilities for Wealth Management
Multiple Chart
Credit Suisse
View slide
A bar graph with clear annotations showing the private funding value in Malaysia from 2019 to H1 2023. Colors differentiate the sectors, and the deal count is at the bottom.
Market Analysis and Trends
Financial Services
Demonstrates a downward trend in private funding in various sectors in Malaysia, indicating a shift in investment landscape.
Malaysia, Private Funding, Decline, Sectors, E-commerce, Digital Media, Travel, Investment Landscape, Deal Count
false
Malaysia Funding declines across the board, including in previously popular sectors like e-commerce and DFSe-Conomy SEA 2023 report: Malaysia
Single Chart
Bain
1
...
Load More
Hold On!
We are searching in our database
If nothing, comes up, please try different filters!
Create a FREE account to continue browsing
Receive Instant Access to 8,000+ of the internet's best slides
First Name
Last Name
Email
Password
I agree to all
Terms & Privacy Policy
Thank you! Your submission has been received!
Oops! Something went wrong while submitting the form.
Have an account?
Sign in
Column Chart
Heatmap
Chevron
Org Chart
Infographic
Callouts
Timeline
List
Graphic
Picture
Process Flow
Diagram
Paragraph
Map
Table
Framework
Subtitle
Takeaway Box
Icon
Other Chart
Radar Chart
Waterfall Chart
Mekko Chart
Pie Chart
Scatter Plot
Line Chart
Bar chart
Bullet points