My Account
My Slides
Search by Category
Leave Feedback
Login
Logout
Get Started
Browse all Slides
Browse Slides (Pro)
Create a FREE Account
Instant access to 1,000+ real slides from top companies like McKinsey, BCG, Goldman Sachs, Google and many more!
First Name
Last Name
Email
Password
I agree to all
Terms & Privacy Policy
Thank you! Your submission has been received!
Oops! Something went wrong while submitting the form.
Have an account?
Sign in
Instant access to the internet's best slides
Get access to 40+ advanced filters and more
Advanced Search and Filters
Access to
8,000+ slides
Access to Category Pages
Save/Bookmark Slides
PowerPoint Template Library (Coming Soon)
Choose your plan
MONTHLY
$12/month
Billed every month, cancel anytime.
YEARLY
$9/month
Billed $108 annually, cancel anytime.
Checkout for $12/month
Checkout for $108/yr
Secured by Stripe | AES-256 bit encryption
Welcome,
Welcome
Upgrade to SlideStart
Pro
Instant access to 8,000+ slides
Show Featured Only
Checkbox 8
Companies
Mckinsey
Bain
BCG
EY
Deloitte
Accenture
PwC/Strategy&
JP Morgan
Goldman Sachs
Morgan Stanley
Citigroup
Deutsche Bank
Barclays
LEK
Kearney
Oliver Wyman
Booz Allen Hamilton
Gartner
IPSOS
Nielsen
Slide type
Header Horizontal
Framework
Vertical Flow
Single Chart
Single Chart
Text Only
Mixed Chart
Header Vertical
Graphic
Pillar
Multiple Chart
Agenda
Title
Table
Linear Flow
Upgrade to SlideStart
Pro
Instant access to 40+ advanced filters
Industry
Upgrade to SlideStart
Pro
Instant access to 40+ advanced filters
Technology
Healthcare
Financial Services
Consumer Goods
Energy & Utilities
Manufacturing
Retail
E-commerce
Logistics
Telecommunications
Real Estate
Professional Services
Education
Media
Entertainment
Hospitatlity
Tourism
Agriculture
Food Production
Government & Public Sector
Environmental
Sustainability
Use Case
Upgrade to SlideStart
Pro
Instant access to 40+ advanced filters
Sales and Business Development
Mergers and Acquisitions
Corporate Finance and Valuation
Performance Metrics and KPIs
Client Case Studies
Competitive Landscape
Product and Service Analysis
Customer and Market Segmentation
Organizational Structure
Human Resources and Talent Management
Industry Overview
Regulatory and Compliance
Risk Assessment and Management
Agriculture & Food Production
Hospitality and Tourism
Government
Environmental
Sustainability
Clear all
Thank you! Your submission has been received!
Oops! Something went wrong while submitting the form.
Show Featured Only
Checkbox 8
Companies
Mckinsey
Bain
BCG
EY
Deloitte
Accenture
PwC/Strategy&
JP Morgan
Goldman Sachs
Morgan Stanley
Citigroup
Deutsche Bank
Barclays
LEK
Kearney
Oliver Wyman
Booz Allen Hamilton
Gartner
IPSOS
Nielsen
Slide type
Text Only
Linear Flow
Vertical Flow
Single Chart
Header Horizontal
Mixed Chart
Header Vertical
Pillar
Multiple Chart
Graphic
Agenda
Title
Table
Framework
Industry
Technology
Healthcare
Financial Services
Consumer Goods
Energy & Utilities
Manufacturing
Retail
E-commerce
Logistics
Telecommunications
Real Estate
Professional Services
Education
Media
Entertainment
Hospitatlity
Tourism
Agriculture
Food Production
Government & Public Sector
Environmental
Sustainability
Use Case
Sales and Business Development
Mergers and Acquisitions
Corporate Finance and Valuation
Performance Metrics and KPIs
Client Case Studies
Competitive Landscape
Product and Service Analysis
Customer and Market Segmentation
Organizational Structure
Human Resources and Talent Management
Industry Overview
Regulatory and Compliance
Risk Assessment and Management
Agriculture & Food Production
Hospitality and Tourism
Government
Environmental
Sustainability
Clear all
Thank you! Your submission has been received!
Oops! Something went wrong while submitting the form.
Tag
View slide
The slide features a world map with highlighted regions, specifically Africa. It indicates areas where L.E.K. Global Education Practice has on-ground experience, with a focus on 20+ African countries. The slide uses shading to highlight regions and a callout for additional emphasis.
Market Analysis and Trends
Education & Training
This slide highlights L.E.K. Consulting’s global education practice, particularly their experience in Africa. It underscores the firm's extensive on-ground experience in over 20 African countries, emphasizing their global reach and specialized expertise in education.
education, global practice, Africa, experience, consulting
false
L.E.K. Global Education PracticeEducation: Mega Trends and Opportunities in Africa
Graphic
LEK
View slide
This slide includes text on energy transitions, along with a graphic showing global final energy demand projections by fuel type and region.
Market Analysis and Trends
Energy & Utilities
The slide explores the varied pace of global energy transitions, predicting significant growth in renewable energy capacity and shifts in final energy demand by 2050.
energy transitions, renewable energy, global demand, fuel types, energy projections
false
Multiple energy transitions will move at different pacesIf every energy transition is different, which course will accelerate yours?
Multiple Chart
EY
View slide
This slide displays a bar chart with horizontal bars illustrating survey responses about remote working preferences among Millennials and Gen Z. The bars are color-coded for each group, accompanied by explanatory text on the left.
Market Analysis and Trends
Professional Services
The slide highlights survey findings on the growing preference for remote work among Millennials and Gen Z, with detailed insights into their views on work-life balance, productivity, and the desire to continue remote work post-pandemic. It provides valuable data for employers planning future work arrangements.
Remote Work, Millennials, Gen Z, Work-Life Balance, Survey
false
Appetite for remote working to become the “norm” isThe Deloitte Global Millennial Survey 2020
Multiple Chart
Deloitte
View slide
This slide showcases a close-up image of a wet umbrella, with annotations highlighting potential business challenges like Earnings miss, Liquidity crunch, etc.
Strategic Planning
Professional Services
Focuses on defining strategic goals for business resilience, enumerating critical challenges that businesses might face under stress.
Resiliency, Business challenges, Strategic planning, Liquidity, Bankruptcy
false
Defining your resiliency ambitionIntroduction to Bain & Company
Linear Flow
Bain
View slide
Rocket-shaped diagram with five steps explaining how emerging countries can increase their technological competitiveness. Text details each step, from FDI to robust educational systems.
Technology and Digital Transformation
Technology & Software
The slide outlines a five-step approach for emerging countries to enhance their technological competitiveness. It emphasizes the role of FDI, capital inflows, robust educational systems, and sectoral supply chains in transforming these countries into competitive innovation leaders.
Technological Competitiveness, Emerging Countries, FDI
false
In the future, emerging countries have the potential to maintain their momentum A combination of factors supports this developmentMegatrend 5 - Technology & Innovation
Vertical Flow
Roland Berger
View slide
A bar graph and timeline are depicted, contrasting the private funding value across different halves of the years. The visual elements are in shades of blue, offering a stark visual against the white background. The data points are clear, and there is a dotted line indicating a forecasted trend.
Investment Analysis
Financial Services
The slide outlines the growth in deal value in Singapore, making it a preferred investment destination in the region. It provides historical and current data on private funding values, useful for assessing the investment climate and predicting future trends in regional investment activities.
investment, growth, deal value, Singapore, private funding
false
Deal value grew from ~$4B in H1 2021 to ~$7B a year later, throning Singapore as the region’s most favoured investment countrye-Conomy SEA 2022 Through the waves, towards a sea of opportunity
Single Chart
Bain
View slide
Slide integrates flow diagrams and bullet points. Visuals and text are arranged to delineate the full-service proposition and evolving client needs.
Strategic Planning
Financial Services
Discusses Barclays' strategy to align services with client needs, highlighting aspects like financing, investments, and risk management. It outlines the focus on digital delivery, client relationships, and market access.
strategy, services, client needs, digital, investments
false
Our proposition, and evolving client needsFY 2023 Results Announcement
Header Vertical
Barclays
View slide
This slide features two column layout with labels "Top 5" and "Top 3" and text blocks explaining targets for 2025 and 2030 in terms of GW. A map of Chile highlights northern and southern hydrogen valleys.
Industry Overview
Energy & Utilities
The slide outlines Chile's aspirations to be among the top global producers and exporters of green hydrogen by 2025 and 2030, with specific GW capacity targets. Also indicates geographic areas of development.
Chile, hydrogen, exporters, 2025, 2030
false
We aspire that Chile be among the top 5 producers of green hydrogen worldwide and the top 3 exporters; our target is 5 GW of hydrogen capacity under development by 2025, 25 GW by 2030Chilean Hydrogen Pathway
Graphic
McKinsey
View slide
The slide is organized into sections detailing fuel cell R&D funding, key improvement levers, areas improved, and benefits/challenges. Includes a bar chart on R&D funding breakdown.
Risk Assessment and Management
Energy & Utilities
Discusses the challenges in fuel cell technology related to cost and durability, and outlines key improvement areas with corresponding benefits and challenges.
Fuel cells, cost reduction, durability, performance, challenges, R&D funding, improvement levers, benefits
false
Reducing costs and improving durability while maintaining performance continues to be a key challengeHydrogen applications and business models
Mixed Chart
Kearney
View slide
The slide shows a progressive blue column chart indicating growth in investment banking revenue over years, accompanied by a small pie chart and annotations. It's well-organized and visually straightforward.
Financial Performance
Financial Services
Details the growth in commercial banking investment banking revenue, emphasizing the bank's commitment to delivering quality services. Useful in financial reviews and investor presentations, highlighting performance and goals.
investment banking, revenue growth, commercial banking, financial review, performance
false
Delivering the best investment bank to CB clientsCommercial Banking 2019
Single Chart
JP Morgan
View slide
This slide includes a donut chart, column chart, and text blocks. The left side presents company culture changes, and the right side shows productivity agreement levels.
Organizational Structure and Change
Professional Services
Discusses changes in company culture and productivity measurement since the pandemic, highlighting survey results and country-specific differences.
company culture, productivity, pandemic, survey, organizational change
false
A majority of employees believe that the company culture has changed for the good and that their productivity can be measured irrespective of their work locationGlobal Employee Survey - Key findings and implications for ICMIF
Multiple Chart
EY
View slide
A dark background is used with three icons representing different innovation areas accompanied by descriptive text and examples in a list format. The green and white color scheme is consistent with the overall presentation theme, and the layout allows each innovation area to be distinct and easily readable.
Strategic Planning
Technology & Software
The slide details different innovation areas CEOs should focus on, providing descriptions and examples. It's a strategic planning tool, useful for discussions on aligning innovation efforts with company objectives and market positioning. The slide is likely intended to help leaders determine where to allocate resources for innovation and how to shape their company's path forward in the market.
innovation areas, strategic focus, company objectives, market positioning, CEOs
true
CEOs should set the innovation focus and use it to navigate their innovation plan options across 5 key dimensionsBCG Executive Perspectives: The Race for Innovation
Agenda
BCG
View slide
Includes predictive analytics displayed through line graphs and future market projections for the FoodTech sector, with annotations for projected growth trends and investment hotspots.
Financial Performance
Agriculture & Food Production
Forecasts future trends in FoodTech investments, highlighting areas expected to see significant growth and investment opportunities. Useful for investors and analysts focusing on future market potentials and growth forecasting in FoodTech.
FoodTech, Investment Forecast, Growth Trends, Market Projections, Future Opportunities
false
Almost 17 years of near-zero rates has caused house prices to rise strongly.Banking on AI Banking Top 10 Trends for 2024
Mixed Chart
Accenture
View slide
Includes a list on the left detailing financial metrics and two column charts on the right visualizing 'Total Assets' and 'Total Equity' over time. The slide uses contrasting colors for easy differentiation between liquid and total assets.
Financial Performance
Financial Services
Exhibits the company’s financial robustness by showcasing key figures such as total assets and equity. The visual data emphasizes liquidity and growth, presenting a snapshot of the company’s financial health and stability without long-term debt.
Financial Strength, Total Assets, Total Equity, Liquidity, Growth, Stability
false
Financial Strength – Liquid and Growing1Goldman Sachs US Financial Services Conference 2022
Multiple Chart
Goldman Sachs
View slide
Slide with bullet points and checkboxes detailing strategies for businesses to consider in anticipation of returning to normal operations.
Strategic Planning
Professional Services
Provides a checklist for businesses on considerations and actions for transitioning back to normal operations after a crisis.
Return strategy, business preparedness, employee protection, customer reassurance
false
Companies should be prepared for the “return”COVID-19: Briefing Note
Vertical Flow
McKinsey
View slide
A monochromatic background with a central, bold statement in orange. There's a list of three key opportunities and challenges related to digitization.
Strategic Planning
Professional Services
Serves as a thematic transition in a presentation, setting the stage for discussing how digitization affects growth, globalization, and work. It’s a prompt for deeper analysis on how these opportunities and challenges can be managed for strategic benefits.
opportunities, challenges, digitization, strategy, growth
false
Three opportunities and challengesDigital Economy: Trends, Opportunities and Challenges
Agenda
McKinsey
View slide
A color-coded bar chart compares average salaries in the US, EU, and ASEAN for digital roles. The bars represent different roles and are aligned with flags of each region. The slide background is purple, and there's a key for job roles at the top.
Market Analysis and Trends
Technology & Software
This slide shows salary discrepancies in tech roles across regions, highlighting the challenge of hiring overseas talent in ASEAN due to a large salary gap with the US/EU. It can be used to discuss talent acquisition strategies.
salary, tech roles, ASEAN, hiring, talent gap, digital roles, US, EU, salary comparison
false
The large salary gap for digital talent between most ASEAN countries and US/EU reduces the feasibility of hiring overseas talent to mitigate the talent gapASEAN Growth and Scale Talent Playbook
Multiple Chart
Kearney
View slide
The slide features a diagram of the Snowy 2.0 hydro scheme, with various reservoirs and flow directions indicated, accompanied by text explanations.
Strategic Planning
Energy & Utilities
Outlines the operational assumptions for the Snowy 2.0 project, including inflows, outflows, and storage capacities, highlighting key sensitivities in the model.
Snowy 2.0, hydro scheme, assumptions, inflows, outflows, storage, sensitivity, operational
false
Snowy 2.0 operation assumptionsReinforcing the New South Wales Southern Shared Network (HumeLink) PADR – EY Market Modelling
Diagram
EY
View slide
The slide features a central diagram surrounded by text, breaking down the strategic priorities and core agendas of Barclays' DEI strategy.
Strategic Planning
Financial Services
Outlines the key components and strategic priorities of Barclays' DEI strategy, emphasizing inclusivity and accountability in the workplace.
DEI, strategy, inclusivity, accountability, workforce, leadership, data transparency, culture
false
Executing our DEI strategy 1 : Five strategic priorities, through six core agendasFY23 ESG Investor Presentation
Diagram
Barclays
View slide
The slide features a dark background with a prominent yellow text box containing a quote. Below, there is a question and four circular charts with percentages.
Customer and Market Segmentation
Healthcare & Pharmaceuticals
The slide presents data on Australian consumers' willingness to switch to virtual consultations for various reasons such as prescription renewal, discussing test results, etc.
Virtual consultations, healthcare, convenience, consumer behavior, Australia
false
‘I would switch to virtual consultations for minor matters or greater convenience.’Health care consumer views on value
Mixed Chart
EY
View slide
Bar chart showing the number of industrial robots per 100 employees in manufacturing for various countries in 2019. Column charts detailing the turnover of service robots by application for 2019 and 2023.
Technology and Digital Transformation
Technology & Software
This slide highlights the growth and deployment of smart robotics, focusing on the leading role of Asian countries. It presents data on the number of industrial robots and projects the turnover for service robots in various applications, emphasizing the expanding role of robotics in different sectors.
Smart Robotics, Industrial Robots, Deployment
false
Smart robotics is a growth area expected to play a significant role across a variety of applications Asian countries lead in terms of robots deployedMegatrend 5 - Technology & Innovation
Multiple Chart
Roland Berger
View slide
This slide features a circular flowchart detailing portfolio management strategies and a list of key actions taken in various markets, emphasizing strategic decisions like business model evolution and market exit or entry.
Strategic Planning
Consumer Goods
Showcases Nestlé's strategic approach to optimizing its portfolio through selective market actions and business model adjustments. Useful for understanding strategic decision-making processes and their impact on business performance.
strategic planning, portfolio management, business model, market strategies, optimization
false
5 Growth by choice: optimize portfolio rigorouslyDeutsche Bank 2023 Leveraging emerging market opportunities
Linear Flow
Deutsche Bank
View slide
This slide uses a dark background with white and blue text. It includes a list of technologies under categories like ACES and adjacent tech. Visuals include stylized icons representing each technology category.
Technology and Digital Transformation
Transportation & Logistics
It outlines innovative technologies in the mobility sector, such as autonomy and electrification, with descriptions of each. Additional adjacent technologies like lightweight materials are also presented.
autonomy, connectivity, electrification, smart mobility, lightweight technologies, decarbonization
false
What are the most noteworthy technologies?McKinsey Technology Trends Outlook 2022 Future of mobility
Header Horizontal
McKinsey
View slide
Slide with a bar chart showing industry participation in a survey, highlighted in various shades of green, alongside pie charts depicting regional and operational scopes.
Market Analysis and Trends
Professional Services
Summarizes industry, regional, and operational participation in a 2023 survey, focusing on the evolving landscape of contact centers.
Survey Participation, Industry Representation, Regional Analysis, Operational Scope, Contact Centers
false
2023 Survey witnessed record participation!Trends & AI in the Contact Center
Mixed Chart
Deloitte
View slide
This slide features two pie charts illustrating different asset allocation strategies and a set of bar charts depicting their correlation with stocks and bonds.
Strategic Planning
Financial Services
Showcases alternative asset allocation models that balance performance with risk, pivotal for formulating a resilient investment strategy.
asset allocation, alternative investments, performance, risk management, pie charts, correlation analysis, strategy development
false
Meaningful Allocation to Alts Has Competitive Performance and Reduced RiskMonthly Market Monitor November 2023
Multiple Chart
Morgan Stanley
View slide
Line chart and national flags illustrating respondents' perceptions of economic conditions in SEA.
Market Analysis and Trends
Financial Services
The slide shows a trend in economic perceptions among SEA respondents, with a comparison of views from different countries.
economic conditions, SEA, perceptions, line chart, survey
false
DESPITE ECONOMIC CONDITIONS IMPROVING SINCE BEGINNING OF THE YEAR, MAJORITY STILL THINK THE ECONOMIC CONDITIONS ARE POORIPSOS SEA AHEAD SHIFTS & SENTIMENTS
Mixed Chart
IPSOS
View slide
Two main sections show a comparison of ROE figures for Global Markets and Investment Banking against competitors, and bullet points highlighting drivers for higher returns. There is also a blue color theme with bar charts for visual comparison.
Strategic Planning
Financial Services
This slide compares Goldman Sachs' capital deployment strategies and ROE performance in Global Markets to its peers, possibly serving as a strategic guide for optimizing resource allocation and capital redeployment in client financing for business planning sessions.
Capital deployment, ROE, Global Markets, resource optimization, strategy
false
Capital Deployment Opportunities for Global MarketsGoldman Sachs Investor Day
Multiple Chart
Goldman Sachs
View slide
A bar chart compares the ICT market size in 2021 and projected growth in 2026 across ASEAN countries. The slide background is dark red with a maroon header.
Market Analysis and Trends
Technology & Software
The slide predicts a substantial increase in digital talent demand aligned with the ICT market growth in ASEAN countries, useful for strategic planning in talent management.
ICT market, digital talent, ASEAN, market growth, talent management, 2026 projection
false
Given strong ICT market growth of 1.4x to 1.8x by 2026, the amount of digital talent required will similarly see strong demandASEAN Growth and Scale Talent Playbook
Multiple Chart
Kearney
View slide
Horizontal bar charts comparing agreement and disagreement on statements about societal change, conflict, immigration, and leadership, with a focus on specific concerns.
Market Analysis and Trends
Government & Public Sector
This slide addresses concerns related to rapid societal changes, such as values conflict, immigration issues, and weak leadership, highlighting agreement and disagreement levels.
societal change, conflict, immigration, leadership, concerns, bar chart, agreement, disagreement
false
Perceptions of a society changing too fast are often linked to concerns over values conflict, immigration and weak leadershipA NEW WORLD DISORDER?
Mixed Chart
IPSOS
View slide
Displays a text block with a circular infographic highlighting consumer attitudes towards data tracking and a scenic image with birds.
Regulatory and Compliance
Technology & Software
Explores consumer perceptions of privacy in data tracking, highlighting the potential for security functions to foster customer trust.
privacy, data, marketing, tracking, consumer, trust, security, technology, perception, engagement
false
Marketing has traditionally used detailed customer data to improve the customer experience. But with pushback on data tracking, can the security function work with marketing to deepen customer trust?2022 Global Marketing Trends
Mixed Chart
Deloitte
View slide
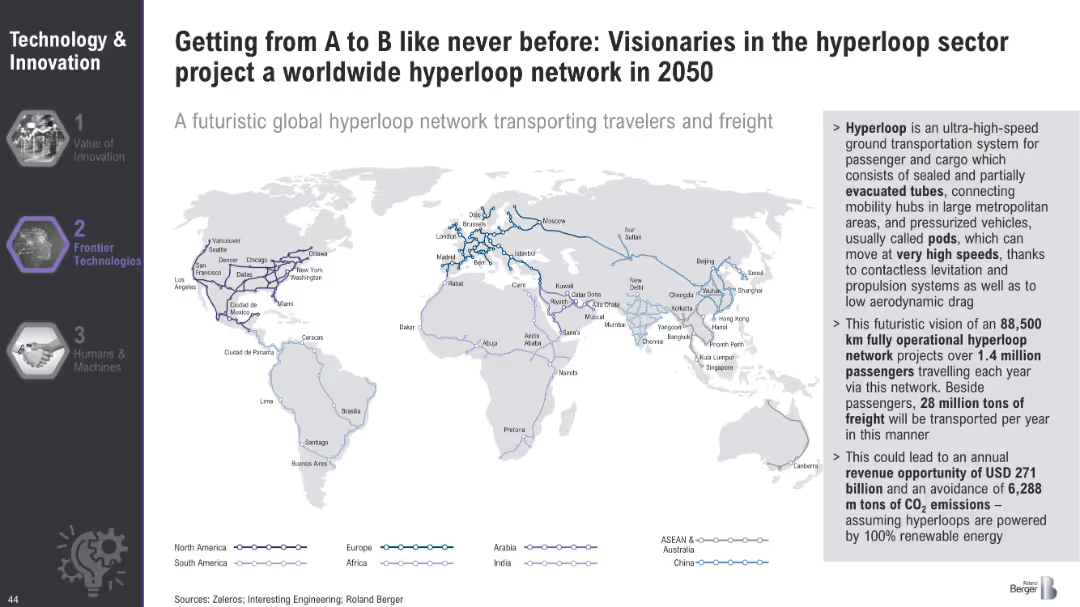
World map illustrating the projected global hyperloop network for 2050, highlighting major routes and connections across continents.
Technology and Digital Transformation
Transportation & Logistics
The slide envisions a global hyperloop network by 2050, outlining the potential routes and connections that could transport passengers and freight at high speeds. It emphasizes the economic and environmental benefits of this futuristic transportation system.
Hyperloop, Global Network, Transportation
false
Getting from A to B like never before: Visionaries in the hyperloop sector project a worldwide hyperloop network in 2050Megatrend 5 - Technology & Innovation
Graphic
Roland Berger
View slide
Segmented pyramid chart showing three categories of lighting end-users: high-end image creators, mainstream professionals and prosumers, and amateurs
Customer and Market Segmentation
Consumer Goods
The slide provides an overview of lighting end-user segments, detailing the needs and characteristics of each segment
segmentation, lighting, end-users, professionals, amateurs
false
Lighting end-users can be segmented into high-end image creators, mainstream professionals and prosumers, and amateurs…Project Spiritus Final report Market Study
Framework
EY
View slide
A column chart compares the levelized cost of hydrogen as a feedstock for different grid utilizations (wind, solar, grid wind, grid solar) over different capacities (1 MW, 10 MW, 100 MW) by 2030.
Market Analysis and Trends
Energy & Utilities
The slide discusses the potential competitiveness of green hydrogen as a feedstock, noting the current higher cost compared to brown sources but highlighting future cost reductions.
green hydrogen, feedstock, levelized cost, grid, wind, solar, competitiveness, future cost, hydrogen production
false
Green hydrogen as a feedstock includes a low number of steps and could become competitive in certain situationsHydrogen applications and business models
Multiple Chart
Kearney
View slide
Column chart showing growth, company logos, red stamped labels
Mergers and Acquisitions
Industrial & Manufacturing
Strategies and outcomes of LANXESS's acquisitions
Growth, Acquisitions, Synergy, Integration, Consumer Protection
false
On the growth track: Three highly complementary acquisitions strengthen LANXESS specialty characterLANXESS – Morgan Stanley Cannon Ball Run Field trip
Header Vertical
Morgan Stanley
View slide
The slide contains column charts displaying historical trends of transformation expenses and technology expenses from 2021 to 2023.
Financial Performance
Financial Services
This slide illustrates the transformation and technology spending trends over the past three years, highlighting key investments.
Transformation, Technology, Spending, Trends, Historical, Financial, Analysis, Consultants, Compensation, Change-the-Bank
false
Transformation and technology spend historical trendEarnings Results Presentation Fourth Quarter and Full Year 2023
Multiple Chart
Citigroup
View slide
Includes two line graphs illustrating pre-tax income projections over a timeline, with legends and annotations.
Investment Analysis
Financial Services
Discusses future income estimates related to growth initiatives, aiming for a positive return on investment, suitable for investor relations or financial planning.
Growth Initiatives, Income Projections, Investment, ROI, Financial Planning, Trends, Analysis
false
Growth Initiatives to Generate Positive ReturnsGoldman Sachs Investor Day
Single Chart
Goldman Sachs
View slide
A graphical timeline illustrating significant ESG milestones from pre-2020 to 2024, marked with icons and brief descriptions of each achievement.
Strategic Planning
Financial Services
Outlines Barclays' progression in ESG initiatives over several years, demonstrating commitments like joining the Paris Pledge and setting new financing restrictions.
ESG, sustainability, strategic milestones, climate action, corporate responsibility, green financing
false
ESG milestones reflect our commitment to our PurposeFY23 ESG Investor Presentation
Linear Flow
Barclays
View slide
The slide uses a table and bar charts to present data on different innovation levers with activity levels and trends over time.
Sales and Business Development
Technology & Software
Discusses the optimization of innovation processes, highlighting key levers such as innovation strategy, new structures, and non-core innovations.
Innovation, Strategy, Optimization, Trends
false
Fewer activities are planned on the Innovation levers Optimization of the innovation system/process ranks highly in Innovation10th Operations Efficiency Radar
Pillar
Roland Berger
View slide
Diagram of ML workflow, future progression circular graphic, and side notes explaining the model deployment into production.
Technology and Digital Transformation
Technology & Software
Explanation of machine learning workflows, the process of bringing AI and ML into production, and future progression with scalable deployment.
ML workflow, AI, production, scalability, future progression
false
What is the trend about? McKinsey Technology Trends Outlook 2022 Industrializing machine learning
Linear Flow
McKinsey
View slide
Slide displays two line charts tracking the Value-at-Risk for DB Group's trading and regulatory books. Annotations and quarterly averages are shown. Colors are primarily blue and white.
Risk Assessment and Management
Financial Services
Analysis of DB Group's trading and regulatory risk over quarterly periods, illustrating changes and risk management effectiveness.
Risk, trading, regulatory, finance, analysis, value-at-risk, quarterly, management, DB Group
false
Value-at-Risk / stressed Value-at-Risk (VaR / sVaR) In € m, unless stated otherwiseQ3 2023 Fixed Income Investor Conference Call
Multiple Chart
Deutsche Bank
View slide
Shows a flow diagram connecting parts of the presentation with business divisions and technology booths, illustrating the overall strategy and value delivery process.
Technology and Digital Transformation
Financial Services
This slide describes how business divisions and corporate functions use technology to deliver client value, detailing the role of technology booths in the digital transformation process.
business divisions, corporate functions, technology, client value, profitability, technology booths, digital transformation, strategy, value delivery
false
Business Divisions and Corporate Functions use technology to deliver value to our clients in a profitable mannerCredit Suisse Investor Day 2018 Utilizing technology
Diagram
Credit Suisse
View slide
Features a blue column chart indicating the percentage of users increasing food delivery frequency, with additional insights in text format.
Market Analysis and Trends
Retail & E-commerce
Analyzes the food delivery sector, showing the surge in user frequency and the competitive landscape. This slide is essential for businesses operating in or entering the food delivery market, providing data to strategize on customer retention and market entry.
Food Delivery, User Growth, Market
false
Food delivery remains sizzling hot, with incumbents expanding rapidly and new entrants rushing to join the racee-Conomy SEA 2021 Roaring 20s: The SEA Digital Decade
Mixed Chart
Bain
View slide
The slide consists of complex data tables and a map detailing epidemiological and economic statistics. It uses a clean layout with a mixture of red indicators for immediate visual attention and comparative statistics.
Market Analysis and Trends
Government & Public Sector
The slide provides a detailed look at epidemiological trends and policy indicators in the Americas. It can be used to inform decisions on travel restrictions and to gauge the overall state of the pandemic, offering insights into both the health situation and the resulting economic policies.
Americas, Epidemiology, Policies, COVID-19, Health Data, Economic Indicators, Travel, Statistics, Public Sector, Governance
false
AmericasCOVID-19: Briefing Note
Multiple Chart
McKinsey
View slide
The slide features icons and text for various sectors, including Life Sciences, Retail, Industrials, Healthcare, Digital, and Education. Each sector is represented by an icon and listed with specific subcategories. Below the sectors, the firm’s service lines are illustrated with icons.
Industry Overview
Professional Services
This slide provides an overview of L.E.K. Consulting’s sector and capability experience, detailing their expertise across various industries and highlighting their service lines such as Strategy, Marketing & Sales, Mergers & Acquisitions, and Strategy Activation.
sectors, capabilities, consulting, experience, services
false
L.E.K . Consulting: Sector and Capability E xperienceEducation: Mega Trends and Opportunities in Africa
Pillar
LEK
View slide
This slide features a large circular progress chart showing a 50% reduction, and multiple icons with text descriptions on benefits of automated matching and remote closing.
Operational Efficiency
Transportation & Logistics
The slide illustrates how automation in transaction matching and business operations has improved efficiency and effectiveness in logistics, highlighting benefits like increased business partnering capacity and remote work adaptation.
Automation, efficiency, reconciliation, remote closing, logistics, business improvement, transaction matching, capacity enhancement, COVID-19 adaptation
false
Benefits: Automated Close & ReconciliationDigital Finance Seeing is Believing
Mixed Chart
Deloitte
View slide
The slide contains bar charts showing investments in infrastructure and real estate sectors by value and number of deals, with different time periods represented.
Market Analysis and Trends
Real Estate & Construction
This slide presents investment data for infrastructure and real estate sectors, comparing the total value of investments and the number of deals across different months, aimed at providing insights into sector-specific investment trends.
PE/VC, Investments, Infrastructure, Real Estate, Value, Deals, Bar Chart
false
PE/VC investments: split by deal type and deal size (excluding infrastructure and real estate)Why do uncertain times need a certainty of purpose? January 2023
Multiple Chart
EY
View slide
The slide is divided into upper and lower sections with colorful tables displaying annual return percentages across different asset classes, highlighting higher and lower performances from 2013 to YTD.
Investment Analysis
Financial Services
This retrospective analysis of annual returns across asset classes aids investors in understanding historical performance trends for strategic planning.
Asset class analysis, annual returns, historical performance, financial trends, strategic planning, investment review
false
Asset Class Return Analysis (%)Monthly Market Monitor November 2023
Table
Morgan Stanley
View slide
Depicts a multi-category column chart with various colors representing different segments of digital financial services. Noteworthy are the substantial deal values in H1 2021 which are clearly highlighted.
Market Analysis and Trends
Financial Services
Highlights the explosive growth in digital financial services, particularly in payments and investments, with H1 2021 deal values surpassing the full year of 2020. Fintech infrastructure is presented as a significant emerging theme.
Digital Financial Services, Growth, Fintech, SEA
false
Digital financial services steam ahead; H1 2021 deal values alone have surpassed those of full year 2020e-Conomy SEA 2021 Roaring 20s: The SEA Digital Decade
Mixed Chart
Bain
View slide
Column chart illustrating the distribution of podcast ad inventory by spot length (up to 15 seconds to over 91 seconds) across three years.
Product and Service Analysis
Media & Entertainment
Compares the standardization of podcast ad lengths to those typical in digital media, highlighting industry adoption of shorter ad formats.
Podcast, Ads, Digital Media, Ad Lengths
false
Podcast ads are starting to mirror the digital industry-standard of 15s and 30s ad lengthsU.S. Podcast Advertising Revenue Study
Single Chart
PwC/Strategy&
View slide
A slide filled with various charts and graphs: pie charts for gender and age distribution, bar charts for income, and employment status, and a map showing the regional distribution of respondents.
Customer and Market Segmentation
Financial Services
Provides demographic information about the survey respondents, including gender, age, region, income, employment status, household composition, marital status, and education level.
demographics, gender, age, income, employment
false
Demographics Gender Age RegionINVESTING AND THE COVID-19 PANDEMIC
Multiple Chart
IPSOS
View slide
Includes a column chart showing the number of CCUS projects dedicated to various industries (chemicals, heavy industries, power generation, hydrogen, oil & gas, clusters).
Market Analysis and Trends
Energy & Utilities
Explores the expansion of CCUS applications to additional large emitting sectors, analyzing the number of projects and their statuses within these industries.
CCUS, application, heavy industries, blue hydrogen, chemicals, project expansion, industry analysis
false
CCUS projects dedicated to industryCarbon Capture Utilization and Storage
Mixed Chart
Kearney
View slide
This slide presents a column chart comparing economic capital assessments versus exposure over several years, with clear annotations and color highlights.
Financial Performance
Financial Services
Discusses the significant increase in capital requirements for insurance syndicates, reflecting on market conditions and the implications for risk management strategies.
capital requirements, insurance syndicates, risk management, market conditions, 2019
false
Actually, market conditions have hit capital the hardest!Lloyd’s and Bermuda
Mixed Chart
PwC/Strategy&
View slide
Image of a tree cross-section, with text discussing how organizations are redefining their purpose beyond profit.
Market Analysis and Trends
Professional Services
Explores how brands are shifting focus towards purpose-driven strategies, with insights from the Edelman Trust Barometer.
marketing, purpose, trends, strategy, organizations, branding, Edelman
false
Many organizations are redefining why they exist beyond profit— pushing them to rethink everything from product delivery to employee and community engagement. How does marketing play a role in purpose?2022 Global Marketing Trends
Mixed Chart
Deloitte
View slide
Features a column chart and a breakdown of expenses, with a clean and professional design.
Operational Efficiency
Financial Services
Analyzes JPMorgan's adjusted expenses in various sectors, using bar graphs to indicate investment focuses and outlook for 2023, aiming to present a narrative of prudent and focused investment strategies.
investing, expenses, bar graphs, JPMorgan, operational efficiency
false
Expense discipline and focused investingInverstors Day 2023
Single Chart
JP Morgan
View slide
The slide features a detailed diagram of business models in industrial automation, showing different roles such as component suppliers, module manufacturers, and integrators across the value chain.
Strategic Planning
Industrial & Manufacturing
The slide explains various business models in industrial automation, highlighting the differences in growth and margin profiles across the value chain.
business models, industrial automation, value chain, component suppliers, module manufacturers, integrators
false
Business models vary from specialized component / module manufacturer to fully integrated conglomerates; growth and margin profiles vary across the value chainIntroduction to a dynamic market with numerous investment opportunities
Table
LEK
View slide
The slide features a maturity curve for various bioenergy products, showing their progression from research to mature technology. Products include biogasoline, biomethanol, biobutanol, bio jet fuel, renewable diesel, biomethane, gas from waste, wood pellets, wood chips, biodiesel, and bioethanol.
Technology and Digital Transformation
Energy & Utilities
This slide illustrates the maturity levels of different bioenergy products, highlighting the stages from lab work to widely deployed commercial-scale projects, and the associated technology risks and capital requirements.
bioenergy products, maturity curve, research, development, deployment, mature technology, biogasoline, biomethanol, biobutanol
false
Technology maturity curve for bioenergy productsDeveloping sustainable carbon circularity Looking at advanced applications and business models
Single Chart
Kearney
View slide
Pie charts and a column chart illustrating the scope and reporting structure of shared services within organizations.
Operational Efficiency
Professional Services
Examines the maturity and scope of global business services, reporting structures, and the extent of service functions.
GBS, maturity, scope, pie chart, bar chart, reporting structure
false
What is the maturity, scope and reporting structure of your GBS organization?2023 Global Shared Services and Outsourcing Survey
Multiple Chart
Deloitte
View slide
This slide showcases dual column charts for global and Indian OTT market revenues from 2019 to 2024. The global market is indicated in gray, while India is highlighted in orange, showing rapid growth. Additionally, it features a line graph comparing subscription and transactional VOD market shares.
Market Analysis and Trends
Media & Entertainment
Highlights the dramatic growth of India's OTT market, positioning it as a significant player on the global stage by 2024. This slide is beneficial for discussions on market entry strategies, competitive analysis, and investment opportunities in India's burgeoning digital content market, emphasizing the shift towards subscription models.
OTT, market growth, India, global comparison
false
India is the fastest growing OTT market at 28.6 % CAGR ; to become the sixth-largest market in 2024Global Entertainment & Media Outlook: 2020-2024
Multiple Chart
PwC/Strategy&
View slide
Column chart of renewable energy projects by country and a list of top European countries by attractiveness index.
Market Analysis and Trends
Energy & Utilities
Analyzes renewable energy investments, showcasing the dominance of four European countries in this sector.
renewable energy, investments, Europe, top countries, attractiveness index
false
Four countries account for the bulk of renewable energy investmentsHow can Europe turn on the taps of foreign investment?
Mixed Chart
EY
View slide
Displays a circle diagram for budget sectoral allocations and a bubble chart showing access to regional markets with country statistics.
Strategic Planning
Government & Public Sector
This slide explores Namibia’s budget allocation across various sectors and the potential for agro-processing market expansion in neighboring countries.
budget allocation, Namibia, agro-processing, market expansion, regional markets, strategic planning
false
Opportunities Budget Sectoral Allocations FY18/19 (%)Budget on a plate 2019/2020
Mixed Chart
PwC/Strategy&
View slide
The slide has a large image on the left of a woman reading a report in a green environment, with a column chart on the right showing investor views on the alternative industry state compared to a year ago.
Market Analysis and Trends
Financial Services
This slide analyzes investor perceptions of the current state of the alternative investment industry compared to a year ago, highlighting growth expectations and industry stability.
investors, market performance, growth, stability, alternative industry
false
Despite economic and financial market performance, a majority of investors still see alternatives as poised for continued growth Investors: How would you describe the current state of the alternatives industry as compared with one year ago?Can resilience shape a shifting landscape?
Mixed Chart
EY
View slide
Contains logos and brief descriptions of three organizations: Social Progress Imperative, Play Verto, and Deloitte. Text blocks are well-organized with a clear, professional layout.
Strategic Planning
Professional Services
This slide presents three partnership organizations involved in social progress and consulting, providing brief overviews of each. It's aimed at highlighting the roles and unique selling points of each partner in the context of social impact.
partnerships, consulting, social impact, organizations
false
The Social Progress Imperative strives to improve the lives of people around the world by generating data driving insight on the most critical issues impacting society. Its flagship tool, theUkraine Refugee Pulse
Pillar
Deloitte
View slide
Slide includes a line graph and column charts illustrating global print and digital news circulation from 2013 to 2018.
Market Analysis and Trends
Media & Entertainment
Discusses global trends in news consumption, focusing on the rise of digital subscriptions and the stability of print circulation.
global trends, news consumption, digital subscriptions, print circulation, rise, stability, media market, circulation data, comparison
false
Globally, paying audiences for news continue to grow, driven primarily by digital circulationWestern Europe News Media Landscape Trends
Mixed Chart
Accenture
View slide
Features pie charts and column charts analyzing commercial real estate loan risk and modifications.
Market Analysis and Trends
Real Estate & Construction
Provides a detailed look at commercial real estate loan risks and modifications over recent quarters, useful for risk assessment in real estate finance.
real estate, CRE, loan risk, market analysis, modifications
false
Commercial Real Estate (CRE) 2 / 2Q4 / FY 2023 Fixed Income Investor Conference Call
Multiple Chart
Deutsche Bank
View slide
Multiple column charts display financial performance over several years with projections up to 2026, accompanied by textual analysis.
Financial Performance
Financial Services
Reiterates Barclays' financial data focusing on RoTE, income, and other key financial indicators, setting performance targets for 2026 and illustrating past performance trends and future aspirations.
financials, RoTE, targets, 2026, performance
false
Today’s financials and 2026 targetsFY 2023 Results Announcement
Multiple Chart
Barclays
View slide
A comparative analysis layout showing potential profit losses for Asian and Chinese BEV manufacturers under different market scenarios. Utilizes color coding for clarity.
Risk Assessment and Management
Transportation & Logistics
Focuses on the challenges facing Asian and Chinese manufacturers in the BEV market, detailing the risk of significant profit losses under slow electrification scenarios and potential gains in more favorable conditions.
BEV, Asian OEMs, Chinese OEMs, profit loss, risks
false
Archetypes 4 6 | Asian and Chinese BEV stragglers face significant profit lossesThe Combustion Engine Business Model in the Age of Electromobility
Table
BCG
View slide
The slide presents two graphs: one for JKM and another for TTF gas prices. Both graphs show consultant and bank/broker price estimates using distinct colors. The background image includes gas facilities, and text details the forecast ranges.
Market Analysis and Trends
Energy & Utilities
This slide discusses the gas price outlook for JKM and TTF, comparing consultant and bank/broker price estimates. It highlights the price trends and provides average forecasts for 2026, considering market uncertainties.
JKM, TTF, gas prices, forecasts, consultants, bank/broker
false
Gas price outlook For both benchmarks, consultants (on average) forecast a wider range of prices throughout the forecast period.EY Price Point: global oil and gas market outlook Q1 | January 2022
Multiple Chart
EY
View slide
Bar chart comparing the growth rates of different consumer revenue segments in the entertainment and media industry from 2020 to 2025.
Market Analysis and Trends
Media & Entertainment
Forecasts the growth in consumer revenue across various segments, with particular emphasis on OTT video and VR as high-growth areas.
consumer revenue, segment growth, OTT video, VR, 2025 forecast, entertainment, media
false
Consumer revenue - Growth by segments: Overall growth for consumer revenue will be at 3.9 % (2020-2025)Global & Entertainment Media Outlook 2021-2025
Mixed Chart
PwC/Strategy&
View slide
Features a purple growth trend line graph depicting revenue growth and market opportunity. Design is simple with clear textual annotations.
Market Analysis and Trends
Transportation & Logistics
Charts the growth of Experian’s automotive sector, focusing on revenue and market potential. Designed for presentations to investors or stakeholders interested in market trends and business opportunities in the automotive sector.
automotive market, revenue growth, Experian, market opportunity
false
Experian Automotive Large robust industry with strong track record of growth: Revenue, Profits, Product Sets, and Clients ServedBarclays Global Credit Bureau Forum
Single Chart
Barclays
View slide
Features a combination of column charts and line graphs in grayscale and green, highlighting brand popularity in the second-hand market.
Market Analysis and Trends
Retail & E-commerce
Analyzes brand performance in the second-hand luxury market versus new goods market, with specific focus on brands like Alexander McQueen.
brand popularity, second-hand market, luxury goods, market analysis, brand performance
false
Popularity of brands in 2nd-hand market disproportionate to share of 1st-hand sales2019 True-Luxury Global Consumer I nsight
Single Chart
BCG
View slide
Slide presents diagrams and statistics in a visually segregated format, enhancing readability and focus on specific data points. The layout is effectively utilized to present complex data.
Strategic Planning
Environmental Services & Sustainability
Explores the potential expansion of Copernicus user base beyond traditional commercial markets, specifically targeting public authorities and academics. Useful for strategic planning in expanding market reach and user engagement.
Copernicus, user base, market expansion, public authorities, academics
false
COPERNICUS CONTESTABLE USER BASECOPERNICUS Market report February 2019
Multiple Chart
PwC/Strategy&
View slide
Utilizes a dual-part layout contrasting traditional and modern approaches to DEI, with colorful icons and text blocks facilitating an easy comparison. Visual elements are organized to guide the viewer through a narrative flow from historical views to current business-focused strategies, highlighted by changes in background color and bold headings.
Strategic Planning
Professional Services
Discusses the evolution of DEI from a purely ethical consideration to a critical element in business strategy. It illustrates how businesses can leverage DEI for broader societal impact and internal benefits, linking ethical practices with strategic business outcomes.
DEI, strategic advantage, business ethics, corporate strategy, organizational change, talent management
false
Shift the mindset from DEI as a “do-good” signaling move to lever of long-term, sustainable business advantageRethink & Broaden Diversity, Equity, and Inclusion to Create a Competitive Advantage
Header Horizontal
BCG
View slide
The slide includes a line chart showing trends in USD/LCU exchange rates for various currencies from 2020 to 2025, indicating volatility and headwinds for the USD in 2022, with projected trends up to 2025.
Market Analysis and Trends
Technology & Software
The slide provides an overview of exchange rate trends for various currencies, highlighting increased volatility through 2025 and the expected impact on USD, with detailed line charts for visual clarity.
FX overview, volatility, exchange rates, USD, currencies, trends, 2020-2025, line chart, headwinds, projection
false
FX overview: higher volitivity through 2025Gartner delivers actionable, objective insight, guidance and tools to enable stronger performance on your organization’s mission critical priorities
Mixed Chart
Gartner
View slide
The slide features two sets of bar charts comparing awareness and preference for traditional financial services in 2015 and 2017 across six markets.
Market Analysis and Trends
Financial Services
The slide illustrates the decline in barriers to FinTech adoption, such as lack of awareness and preference for traditional services, from 2015 to 2017 in various markets.
FinTech, barriers, adoption, awareness, traditional services
false
Barriers to increased adoption are evaporating quicklyInsights from the EY FinTech Adoption Index and EY FinTech Australia Census
Single Chart
EY
View slide
Contains a list of US proprietary data assets and their uses, paired with textual descriptions of AI advantages in Equifax’s operations, emphasizing the integration of AI technologies and data assets.
Technology and Digital Transformation
Technology & Software
The slide provides an overview of how Equifax leverages its proprietary data alongside advanced AI capabilities to enhance decision-making processes and product development, highlighting the strategic use of technology in business.
AI capabilities, proprietary data, technology, Equifax
false
EFX driving leading AI capabilities leveraging EFXCloud and EFX unique proprietary dataBarclays Credit Bureau Day
Header Horizontal
Barclays
View slide
Three charts: a line chart for labor supply percentage change (US and Euro area), a line chart for global supply chain pressure index, and a line chart for global commodity prices from 2016-2023.
Market Analysis and Trends
Financial Services
The slide emphasizes the importance of supply conditions on inflationary dynamics in 2024, with a better balance between supply and demand expected, but lingering risks remain.
supply conditions, inflation, labor supply, supply chain pressure, commodity prices, 2024
false
Supply conditions will be an important driver of inflationary dynamics in 2024, and while better balance between supply and demand is expected, risks will lingerGlobal economic outlook: finding balance in 2024
Multiple Chart
EY
View slide
Features a creative and vibrant collage of images and text, serving as the cover of a report. The design is modern and engaging, with bold text for the title and authors.
Strategic Planning
Financial Services
Serves as the introductory slide for a financial outlook report, likely setting the stage for discussion on strategies for sustained returns in the current economic climate.
Financial Outlook, Strategy, Investment, Market Conditions, Economic Climate, Return on Investment, Financial Planning, Report Cover
false
Citi Global Wealth Investments OUTLOOK 2022Citi Global Wealth Investments OUTLOOK 2022
Title
Citigroup
View slide
Features column charts showcasing 'Strong Returns', 'Cost Saves', 'Low Volatility', and 'Potential for Better Revenue Growth', with annotations and comparison to peers. The slide uses varying shades to differentiate the data points.
Financial Performance
Financial Services
The slide compiles key financial performance indicators, such as returns, cost savings, and volatility, to underscore the company’s momentum. It also projects potential revenue growth areas, positioning the company as a strong player in the financial industry.
Financial Performance, Returns, Cost Savings, Volatility, Revenue Growth
false
Momentum building for leading financial performanceGoldman Sachs US Financial Services Conference 2022
Multiple Chart
Goldman Sachs
View slide
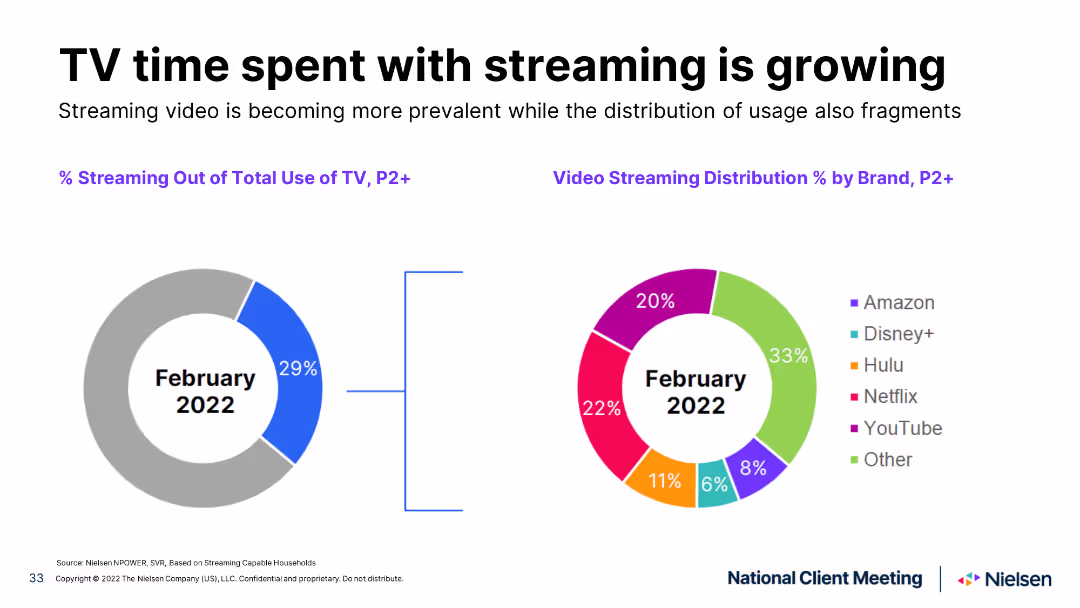
Pie chart slide showing the percentage of TV time spent streaming in February 2021 and February 2022, with distinct color segments for different streaming services.
Market Analysis and Trends
Media & Entertainment
Illustrates the increase in TV streaming time and the changing distribution among streaming services over a year, highlighting trends.
TV streaming, growth, comparison, streaming services, trends
false
TV time spent with streaming is growing February 2022Spring 2022 National Client Meeting
Multiple Chart
Nielsen
View slide
Column chart detailing quarterly profit before tax (PBT) changes with various contributing factors and a breakdown of 4Q23 results versus previous quarters.
Financial Performance
Financial Services
Analyzes UBS's quarterly profit before tax for 4Q23, highlighting underlying versus reported figures and factors affecting results.
PBT, Financial Performance, UBS, 4Q23, Analysis
false
4Q23 underlying PBT of 0.6bnThird quarter 2023 Fixed Income investor presentation
Mixed Chart
UBS
View slide
The slide features a world map highlighting the number of H2 bus projects in various countries.
Market Analysis and Trends
Transportation & Logistics
The slide provides an overview of H2 bus projects worldwide, indicating the geographical distribution and the number of projects per country.
H2 buses, projects, global, evaluation, potential
false
Overview of H2 buses projectHydrogen applications and business models
Graphic
Kearney
View slide
Slide features a large column chart comparing annual sales losses from various sources of market fire, and a pie chart illustrating percentage of total sales lost from fires.
Market Analysis and Trends
Energy & Utilities
This slide presents data on the financial impact of generator-linked fires on MSMEs in markets, highlighting significant sales losses which account for approximately 1% of gross sales annually.
MSMEs, generator, fire, sales, loss
false
MSMEs in markets lose ~USD100-300m annually (~1% of their gross sales) to fire incidents caused by generator setsSocio-economic case for deepening solar PV deployment in Nigeria
Mixed Chart
BCG
View slide
The slide is laid out as a flowchart diagram known as the 'Innovation Flywheel', with descriptions accompanying each step. It includes side text elaborating on the process details.
Strategic Planning
Technology & Software
It suggests using agile methods to build, test, and launch innovations, tailored to different innovation focus areas. Suitable for process optimization discussions.
Agile, Innovation, Process, Flywheel, Prototyping, MVP, Customer Feedback, Experiments, Product Development
false
Use agile innovation processes to build, test, launch, and learn across innovation focus areasBCG Executive Perspectives: The Race for Innovation
Linear Flow
BCG
View slide
A single line chart showing the Global Supply Chain Pressure Index from 2015 to 2023, highlighting significant events and pressures.
Market Analysis and Trends
Transportation & Logistics
The slide discusses the return of global supply chain pressures to pre-pandemic levels and the impact of various global events on these pressures.
supply chain, global pressures, pre-pandemic, transportation, logistics, market trends
false
Global supply chain pressures have now reverted to pre pandemic levelsMarch Macro Brief Financial fissures emerge
Mixed Chart
Accenture
View slide
The slide features a circular diagram showing "Macro Forces," "Shifts," and "Signals" with arrows indicating change and response/inspiration actions.
Strategic Planning
Professional Services
The slide explains how change happens at various levels, using macro forces, shifts, and signals, and how Ipsos uses this framework to monitor trends over time.
change, macro forces, shifts, signals, Ipsos
false
Ipsos’sTheory of Change helps us look at how change happens across several levelsA NEW WORLD DISORDER?
Diagram
IPSOS
View slide
Slide shows two column charts comparing the growth of the luxury second-hand market against the total personal luxury market.
Market Analysis and Trends
Retail & E-commerce
Examines the growth of the second-hand luxury market, projecting significant increases and discussing market share.
Second-hand luxury, market growth, market analysis, trends, market share, projections, personal luxury
false
Luxury 2nd-hand market estimated at 22 B€ and growing faster than overall personal luxury...2019 True-Luxury Global Consumer I nsight
Multiple Chart
BCG
View slide
Features column charts and a line graph detailing loan loss rates and impairment charges over several quarters. The layout is straightforward, using contrasting colors to differentiate between different types of data, providing a clear visual representation of trends and specifics.
Risk Assessment and Management
Financial Services
Discusses the trends in loan delinquencies and the resulting financial strategies, such as reserve builds and write-offs, illustrating how Barclays manages financial volatility and credit risk.
delinquencies, impairment charges, financial strategy, credit risk
false
Higher delinquencies in US cards driving impairment reserve buildFY 2023 Results Announcement
Multiple Chart
Barclays
View slide
Features multiple content areas including accountability, engagement, diversity, and culture of change, each with its own icon.
Human Resources and Talent Management
Financial Services
This slide discusses the initiatives for developing accountability, engagement, and diversity within the organization, as part of the company culture.
accountability, engagement, diversity, culture change, leadership, talent development, behavioral expectations, employee feedback
false
People| Focus on Accountability, Engagement and Building Culture of Change2022-2024 Bank Handlowy Group Strategy
Framework
Citigroup
View slide
The slide presents infographics and percentages that emphasize the importance of digital enablers. Purple and grey tones are used, creating a clean and organized layout.
Strategic Planning
Technology & Software
Highlights the priorities of High Tech leaders in adopting AI/ML analytics platforms and 5G technology. It presents a case for customer-centric solutions and investment in digital enablers as a step towards innovative, tailored solutions.
AI/ML, 5G, digital enablers, High Tech, customer demand, custom solutions, sensor technologies, end device battery life, low/no code, split rendering
false
Leaders see these digital enablers as the futureTransforming the Industry that transformed the World: 02 Expand industry boundaries
Single Chart
Accenture
View slide
Bar chart comparing top front-office use cases for retail and commercial banks.
Customer and Market Segmentation
Financial Services
Lists top front-office use cases prioritized by retail and commercial banks, focusing on customer segmentation and automation.
front-office, retail, commercial, banks, use cases
false
Top front-office use cases for retail and commercial banksGenerative AI in retail and commercial banking
Multiple Chart
EY
1
...
Next
Load More
Hold On!
We are searching in our database
If nothing, comes up, please try different filters!
Create a FREE account to continue browsing
Receive Instant Access to 8,000+ of the internet's best slides
First Name
Last Name
Email
Password
I agree to all
Terms & Privacy Policy
Thank you! Your submission has been received!
Oops! Something went wrong while submitting the form.
Have an account?
Sign in
Column Chart
Heatmap
Chevron
Org Chart
Infographic
Callouts
Timeline
List
Graphic
Picture
Process Flow
Diagram
Paragraph
Map
Table
Framework
Subtitle
Takeaway Box
Icon
Other Chart
Radar Chart
Waterfall Chart
Mekko Chart
Pie Chart
Scatter Plot
Line Chart
Bar chart
Bullet points