My Account
My Slides
Leave Feedback
Login
Logout
Get Started
Browse all Slides
Browse Slides Pro
Create a FREE Account
Instant access to 1,000+ real slides from top companies like McKinsey, BCG, Goldman Sachs, Google and many more!
First Name
Last Name
Email
Password
I agree to all
Terms & Privacy Policy
Thank you! Your submission has been received!
Oops! Something went wrong while submitting the form.
Have an account?
Sign in
Instant access to the internet's best slides
Get access to 40+ advanced filters and more
Advanced Search and Filters
Access to
8,000+ slides
Access to Category Pages
Save/Bookmark Slides
PowerPoint Template Library (Coming Soon)
Choose your plan
MONTHLY
$12/month
Billed every month, cancel anytime.
YEARLY
$9/month
Billed $108 annually, cancel anytime.
Checkout for $12/month
Checkout for $108/yr
Secured by Stripe | AES-256 bit encryption
Welcome,
Welcome
Upgrade to SlideStart
Pro
Instant access to 8,000+ slides
Show Featured Only
Checkbox 8
Companies
Mckinsey
Bain
BCG
EY
Deloitte
Accenture
PwC/Strategy&
JP Morgan
Goldman Sachs
Morgan Stanley
Citigroup
Deutsche Bank
Barclays
LEK
Kearney
Oliver Wyman
Booz Allen Hamilton
Gartner
IPSOS
Nielsen
Slide type
Header Horizontal
Framework
Vertical Flow
Single Chart
Single Chart
Text Only
Mixed Chart
Header Vertical
Graphic
Pillar
Multiple Chart
Agenda
Title
Table
Linear Flow
Upgrade to SlideStart
Pro
Instant access to 40+ advanced filters
Industry
Upgrade to SlideStart
Pro
Instant access to 40+ advanced filters
Technology
Healthcare
Financial Services
Consumer Goods
Energy & Utilities
Manufacturing
Retail
E-commerce
Logistics
Telecommunications
Real Estate
Professional Services
Education
Media
Entertainment
Hospitatlity
Tourism
Agriculture
Food Production
Government & Public Sector
Environmental
Sustainability
Use Case
Upgrade to SlideStart
Pro
Instant access to 40+ advanced filters
Sales and Business Development
Mergers and Acquisitions
Corporate Finance and Valuation
Performance Metrics and KPIs
Client Case Studies
Competitive Landscape
Product and Service Analysis
Customer and Market Segmentation
Organizational Structure
Human Resources and Talent Management
Industry Overview
Regulatory and Compliance
Risk Assessment and Management
Agriculture & Food Production
Hospitality and Tourism
Government
Environmental
Sustainability
Clear all
Thank you! Your submission has been received!
Oops! Something went wrong while submitting the form.
Show Featured Only
Checkbox 8
Companies
Mckinsey
Bain
BCG
EY
Deloitte
Accenture
PwC/Strategy&
JP Morgan
Goldman Sachs
Morgan Stanley
Citigroup
Deutsche Bank
Barclays
LEK
Kearney
Oliver Wyman
Booz Allen Hamilton
Gartner
IPSOS
Nielsen
Slide type
Text Only
Linear Flow
Vertical Flow
Single Chart
Header Horizontal
Mixed Chart
Header Vertical
Pillar
Multiple Chart
Graphic
Agenda
Title
Table
Framework
Industry
Technology
Healthcare
Financial Services
Consumer Goods
Energy & Utilities
Manufacturing
Retail
E-commerce
Logistics
Telecommunications
Real Estate
Professional Services
Education
Media
Entertainment
Hospitatlity
Tourism
Agriculture
Food Production
Government & Public Sector
Environmental
Sustainability
Use Case
Sales and Business Development
Mergers and Acquisitions
Corporate Finance and Valuation
Performance Metrics and KPIs
Client Case Studies
Competitive Landscape
Product and Service Analysis
Customer and Market Segmentation
Organizational Structure
Human Resources and Talent Management
Industry Overview
Regulatory and Compliance
Risk Assessment and Management
Agriculture & Food Production
Hospitality and Tourism
Government
Environmental
Sustainability
Clear all
Thank you! Your submission has been received!
Oops! Something went wrong while submitting the form.
Tag
View slide
Ranked factors influencing loyalty-driven revenue in various sectors.
Strategic Planning
Retail & E-commerce
Analyzes key factors that impact revenue through loyalty programs across different industries, emphasizing a tailored approach for maximum effectiveness.
loyalty, program, revenue, industry, factors
false
Key factors influencing loyalty-driven revenue vary across industries – CMOs need to adopt a tailored approach while creating loyalty program roadmapsA DATA DRIVEN APPROACH TO IMPROVE CUSTOMER ENGAGEMENT
Table
BCG
View slide
Features column charts detailing the financial aspects of an acquisition, including breakdowns of loans, deposits, and expected impacts on financial metrics.
Mergers and Acquisitions
Financial Services
Details the acquisition of Tesco Bank's retail banking division, focusing on the financial benefits, expected impacts, and integration strategies.
acquisition, Tesco Bank, financial impact, retail banking, integration, Barclays, deposits, loans
false
Acquisition of Tesco Bank Retail BankingFY 2023 Results Announcement
Multiple Chart
Barclays
View slide
Dominated by two sets of bar graphs, one for front-end and the other for back-end digital tools, the slide visually contrasts the anticipated increases in usage. It is color-coded in blue and beige, with a white background that aids readability.
Technology and Digital Transformation
Financial Services
This slide indicates the expected growth in the use of digital tools among merchants, focusing on marketing, website services, analytics, and various operational software. The information is crucial for those involved in technology strategy and digital transformation efforts within the financial services industry, highlighting the shift towards more technologically integrated operations.
Digital Tools, Merchants, Transformation, Marketing, Analytics, Operation Software, Growth, Technology Strategy, Financial Services, Integration
false
Merchants have accelerated digital transformation due to the pandemice-Conomy SEA 2021 Roaring 20s: The SEA Digital Decade
Mixed Chart
Bain
View slide
A slide with a dark blue theme containing two column charts showing the evolution of market and credit RWAs from 2015 to 2019, along with bullet points outlining the company's risk management culture, processes, and oversight.
Risk Assessment and Management
Financial Services
It communicates Goldman Sachs' approach to risk management, detailing changes in risk-weighted assets and the infrastructure supporting risk management processes, valuable for presentations on corporate risk policies or compliance training.
Risk management, RWAs, market, credit, Goldman Sachs
false
Prudently Managing RiskGoldman Sachs Investor Day
Multiple Chart
Goldman Sachs
View slide
Features four images, each depicting different workplace experiences of LGBT+ individuals, with quotes.
Organizational Structure and Change
Professional Services
Examines various experiences of LGBT+ employees in the workplace, highlighting differing levels of comfort and openness.
LGBT+, workplace, employee experience, diversity, inclusion
false
4 LGBT+ archetypes at work are emergingOut @ Work Barometer
Header Horizontal
BCG
View slide
Contains a line graph comparing TCO for electric and diesel buses over mileage.
Investment Analysis
Financial Services
Analyzes how long-term savings from EVs can offset higher initial costs.
EV, TCO, cost savings, electric buses, diesel comparison
false
In addition to battery cost reductions, long term cost savings must be communicated effectively to buyers to overcome worries over higher initial coste-mobility in India Market paradigms and ways to play
Mixed Chart
PwC/Strategy&
View slide
Contains column charts and descriptive text comparing the structure of customer service centers and their impact on customer satisfaction. The layout is structured and uses a combination of blue, green, and gray tones.
Organizational Structure and Change
Professional Services
Evaluates how different organizational structures within customer service centers influence customer and employee satisfaction, suggesting optimal arrangements for higher satisfaction levels. Critical for companies reviewing their internal setups for efficiency and effectiveness in customer interactions.
customer service, organizational impact, satisfaction, structure analysis, service efficiency
false
The way Customer Service Centers are organized affects their resultsCustomer Service Excellence 2022
Multiple Chart
Deloitte
View slide
Displays a line graph charting cinema revenue in Hong Kong from 2018 to 2027, with annotations highlighting specific trends and yearly changes.
Market Analysis and Trends
Media & Entertainment
Focuses on the expected rebound of box office revenue in Hong Kong, detailing the impact of COVID-19 and the success of specific films in driving revenue.
Hong Kong, box office, cinema, COVID-19, revenue rebound, films
false
Box office revenue in Hong Kong is expected to rebound in 2023, recovering from the impact of COVID-19 in 2022Global Entertainment & Media Outlook: 2023-2027: Hong Kong summary
Mixed Chart
PwC/Strategy&
View slide
This slide features two bar charts showing the approach to purchasing standardization by country and by hospital type, with top selections highlighted.
Operational Efficiency
Healthcare & Pharmaceuticals
This slide analyzes the procurement strategies of hospitals, emphasizing the trend towards selecting preferred suppliers for specific procedures or products.
procurement processes, purchasing standardization, preferred supplier, hospital strategies, regional comparison
false
To streamline procurement processes, both public and private hospitals across the region are increasingly inclined to choose a preferred supplier for specific procedures or products2023 APAC Hospital Insights Survey Findings for Healthcare Providers
Multiple Chart
LEK
View slide
Contains a list ranking top countries by market position, bar graphs showing sales percentage in leading positions, and a pie chart indicating consumer trust.
Competitive Landscape
Consumer Goods
Analyzes Nestlé's market dominance and customer trust across key emerging markets, showcasing their leading positions and competitive advantages. This slide is useful for assessing market leadership and brand trustworthiness.
market positions, consumer trust, sales, leading positions, Nestlé
false
Strong market positions and consumer trustDeutsche Bank 2023 Leveraging emerging market opportunities
Mixed Chart
Deutsche Bank
View slide
The slide presents a bar chart showing the average percentage of correct responses to crypto asset knowledge questions for 2023 and 2022.
Human Resources and Talent Management
Financial Services
This slide provides insights into the general knowledge about crypto assets among respondents, comparing data from 2023 to 2022. It helps in understanding education and awareness levels.
Crypto, Knowledge, Education, Awareness, Comparison
false
Crypto Asset Knowledge A series of nine questions were developed to assess Canadians’ knowledge of crypto assets.Across these measures, the average percentage of correct responses was 56%.CRYPTO ASSET SURVEY 2023
Mixed Chart
IPSOS
View slide
Tabular comparison of industry use cases for immersive tech, accompanied by relevant isometric illustrations.
Technology and Digital Transformation
Technology & Software
Describes horizontal and vertical use case scenarios for immersive tech across various industries, highlighting specific applications and their significance.
Immersive tech, industries, use cases, application, significance
false
What industries could be most affected by the trend? (continued)McKinsey Technology Trends Outlook 2022 Immersive-reality technologies
Header Horizontal
McKinsey
View slide
Displaying a dynamic office scene, this slide emphasizes the agility of risk teams. It includes a text section detailing the benefits of enhancing flexibility in operations to respond more effectively to emerging risks. The visual portrays a team in an active discussion, suggesting a collaborative approach to agile risk management.
Operational Efficiency
Technology & Software
The slide outlines key steps for risk teams to improve their agility in managing business risks. It focuses on the adoption of new technologies, faster data processing, and stronger partnerships as means to enhance response capabilities to rapidly changing market conditions. This slide is valuable for organizations aiming to increase their operational flexibility and risk responsiveness.
agility, risk management, operational efficiency, technology adoption, partnerships, collaboration
false
STEP 3 Maximize agilityHyper-disruption demands constant reinvention
Mixed Chart
Accenture
View slide
The slide utilizes a clean layout with icons and text to discuss key factors like Equity Story and Financial Reporting in IPO processes.
Strategic Planning
Financial Services
This slide discusses the key elements that maximize value in an IPO, including equity stories, financial reporting, and the importance of internal setup and partners.
IPO, value, equity, financial reporting, partners, transparency, control
false
What maximizes value in an IPO for issuers and owners?Ready to go public? Initial Public Offering (IPO)
Pillar
PwC/Strategy&
View slide
The slide contrasts policy measures between countries using icons and bullet points, and presents two case studies in side panels.
Strategic Planning
Government & Public Sector
Discusses curated policy measures Australia could implement to attract major players in the industry, drawing parallels with successful international examples.
policy measures, industry tenants, Australia, investment incentives, supply chain security, case studies, Tesla, Hungary
false
To attract lighthouse tenants, Australia could offer incentives industrial preapprovals, supply chain security and financial incentivesCharging Ahead Australia’s battery powered future
Vertical Flow
Accenture
View slide
This slide features a column chart comparing current and prospective retirement ages across various countries, with color coding for easier differentiation between the data. The layout is clear with readable fonts and distinct colors for each country.
Market Analysis and Trends
Government & Public Sector
The slide analyzes retirement age trends to suggest necessary policy adaptations in light of changing demographics.
retirement, policy, demographics, OECD, trends
false
Future retirement ages will continue to rise in most countries The pandemic is heightening the need for further retirement reformsRoland Berger Trend Compendium 2030: Megatrend 1 People & Society
Mixed Chart
Roland Berger
View slide
The slide features three sets of column charts, displaying digital engagement, collaboration, and transaction metrics. The colors grey and blue differentiate between 1Q’19 and 1Q’21. A red banner at the bottom notes data inclusion from specific company divisions. Text boxes highlight key statistics.
Market Analysis and Trends
Financial Services
The purpose of this slide is to present the growth in digital engagement, collaboration, and transactions across an enterprise. It demonstrates the company’s progress in adopting digital tools and enhancing client interaction, which is crucial for staying competitive in the digital age.
Digital engagement, enterprise, collaboration, transactions, digital transformation, growth statistics, client interaction, competitive edge, market trends, digital tools
false
Driving Digital Engagement Across the EnterpriseMorgan Stanley Financials Conference
Multiple Chart
Morgan Stanley
View slide
Bar and line graphs showing investor inflation expectations for the coming years.
Investment Analysis
Financial Services
Details investor expectations on inflation, indicating a prolonged period of elevated levels through 2023.
inflation, investor expectations, economy, stock market, survey, analysis
false
Most investors expect inflation to remain elevated through 2023 year-end, with a median rate of 5.7% expected for year-end 2022 and 3.8% for 2023 and 2024.BCG Investor Perspective Series: Pulse Check #21
Multiple Chart
BCG
View slide
Map layout with labeled regions indicating specific global uncertainties. Uses dashed lines and callout text to highlight issues in different geographic areas.
Risk Assessment and Management
Financial Services
Identifies global uncertainties affecting the financial landscape, including the war in Ukraine, recession in the Eurozone, big tech headwinds in the US, and China’s rebound.
global uncertainties, risk, financial impact, regions, analysis
false
GLOBAL UNCERTAINTIES, PARTICULARLY IN THE US2023 HALF-YEAR RESULTS
Graphic
IPSOS
View slide
Diagram contrasting current monolithic MMIS with future modular MMIS approach. Visual elements include flowcharts and labeled components.
Technology and Digital Transformation
Technology & Software
Presentation of a modular MMIS approach to enable state procurement of "best of breed" functionality, enhancing flexibility and competitive bidding.
Modular MMIS, Architecture, Procurement, Functionality, Bidding
false
Medicaid | MMIS | Modular Architectural OverviewNH DHHS Operations Assessment
Diagram
Alvarez & Marsal
View slide
A visionary slide showcasing futuristic concepts with images and text, focusing on how luxury brands can harness creativity and innovation. It presents a forward-looking perspective with inspirational quotes and graphics.
Strategic Planning
Consumer Goods
This slide envisions the future of the luxury market in 2030, advocating for brands to embrace cultural and creative excellence. It suggests strategies for brands to reimagine their roles through innovation, creativity, and deeper consumer engagement, aiming to drive future growth and market dominance.
future trends, luxury market, innovation, creativity, brand strategy
false
Envisioning 2030 From Luxury to Insurgent Cultural and Creative ExcellenceBAIN-ALTAGAMMA 2020 WORLDWIDE LUXURY MARKET MONITOR
Mixed Chart
Bain
View slide
Slide includes two column charts showing changes in average daily operating hours and monthly sales of MSMEs before and after solar power adoption, along with a pie chart on power reliability improvements.
Market Analysis and Trends
Energy & Utilities
Analyzes the positive impacts of adopting solar power in markets, detailing increased operating hours and sales for MSMEs, reflecting improved economic activities and financial outcomes due to reliable energy.
solar, MSMEs, energy, sales, improvement
false
However, findings show that MSMEs in markets with solar witness 30 – 40% uplift in revenue due to longer operating hours enabled by improved power supply…Socio-economic case for deepening solar PV deployment in Nigeria
Multiple Chart
BCG
View slide
This slide features a combination of a line chart showing a 12-month share price trend and a data table with corporate information. The layout is clear with a concise display of financial data.
Financial Performance
Financial Services
The slide provides a snapshot of the company's financial status as of December 2018, including stock price, market capitalization, and share distribution. It serves as a financial overview for stakeholders.
financials, mining, share price, market capitalization, shareholders, company snapshot
false
Company Snapshot As at 31 December 2018IMDEX Presentation Morgan Stanley Conference
Mixed Chart
Morgan Stanley
View slide
An updated world map from slide 2933, now indicating growth with more markers and comparative data from 1990 to 2019. Same minimal design but with more data points.
Industry Overview
Financial Services
Showcases significant growth in international presence over 29 years with data on revenues, headcount, and offices to depict expansion success.
Global presence, development, business growth, headcount
false
Growth of International FootprintGoldman Sachs Investor Day
Graphic
Goldman Sachs
View slide
Horizontal bar chart showing various perceptions of societal change across different countries with percentages.
Market Analysis and Trends
Government & Public Sector
The slide analyzes global perceptions of societal changes, highlighting variations in attitudes and values across countries.
societal change, global trends, perceptions, attitudes, values
false
Perceptions of societal change are an area where we still see significant variation across the worldA NEW WORLD DISORDER?
Mixed Chart
IPSOS
View slide
The slide contains multiple column charts, each with three groups (Detractors, Passives, Promoters) depicting percentages from 2014 to 2018, reflecting reluctance or recommendation for US businesses expanding in France. Red highlights and quotes complement the data.
Market Analysis and Trends
Professional Services
This slide provides a yearly breakdown of American investor sentiments towards business expansion in France, using Net Promoter Scores to highlight varying levels of enthusiasm or reluctance over five years.
investment, France, business expansion, NPS, American investors
false
Respondents are more reluctant to recommend further expansion of an existing business in France than last year; but the NPS is still higher than its pre-2017 levelAmCham – Bain Barometer 19th Edition
Mixed Chart
Bain
View slide
Column charts illustrating foreign investment projects in various sectors across the top three European economies.
Market Analysis and Trends
Financial Services
This slide highlights the strategic sector leadership of France, UK, and Germany in foreign investment projects.
strategic sectors, economies, investment, Europe, R&D
false
The three largest economies lead in the strategic sectorsHow can Europe turn on the taps of foreign investment?
Multiple Chart
EY
View slide
Detailed slide with multiple bar charts, graphs, and text annotations reviewing SEA's current status and the gap to meeting global emissions targets.
Regulatory and Compliance
Government & Public Sector
Analyzes the shortcomings in SEA's efforts to meet global climate commitments, emphasizing the need for increased action and policy adjustments.
SEA, emissions gap, climate targets, policy adjustments, bar charts
false
However, SEA is not on track, and there is a lot of work to doSoutheast Asia’s Green Economy 2021 Report: Opportunities on the Road to Net Zero
Multiple Chart
Bain
View slide
The slide is split into two main sections. The left side has a text block and an illustration of a stressed individual, while the right side features a column chart depicting stress levels over three time points with gender differentiation. The chart uses green tones for distinction.
Market Analysis and Trends
Technology & Software
The slide addresses the high levels of stress experienced by millennials and Gen Z during the pandemic, with a focus on gender differences. A bar chart compares stress levels across 2020, 2020 Pulse, and 2021, highlighting that women reported higher stress. The content suggests persistent high stress levels and the implications for mental health and workforce management strategies.
Stress, Pandemic, Millennials, Gen Z, Mental Health, Gender, Bar Chart, Workforce Management, Health Trends
false
One of the more concerning insights from last year’s millennial survey was the pre-pandemic finding that 48% of Gen Zs and 44% of millennials felt stressed all or most of the time.The Deloitte Global 2021 Millennial and Gen Z Survey
Mixed Chart
Deloitte
View slide
The layout is a numbered list describing specific actions and the progress made in each area, accompanied by icons. The text is clear, with the use of bullet points for readability.
Human Resources and Talent Management
Professional Services
Discusses initiatives toward racial equity and their progress, suitable for showcasing a company’s commitment to diversity and inclusion.
Racial Equity, Diversity, Inclusion, Corporate Responsibility, Progress
false
Our 10 Actions toward racial equityAccelerating Sustainable and Inclusive Growth
Table
McKinsey
View slide
Includes a column chart showing the percentage usage of AI tools by different types of risks.
Risk Assessment and Management
Technology & Software
Illustrates how AI tools are utilized across various risk types within organizations.
AI tools, risk types, usage, percentage
false
Usage of AI tools by risk typeAI/ML use in Risk Management and Compliance PwC Actuarial, Risk & Quants
Single Chart
PwC/Strategy&
View slide
Slide with number 2, a bar graph showing fraudulent activity levels by country, an inset explaining the fraud index, and summary text highlighting key points.
Risk Assessment and Management
Professional Services
It addresses the issue of online fraud in SEA, quantifying the risk in different countries with a focus on Indonesia, Malaysia, and the Philippines. This data can guide risk management and trust-building strategies for businesses operating online in the region.
fraudulent activity, SEA, risk management, online fraud, Indonesia, Malaysia, Philippines
false
Some SEA countries see a significant amount of fraudulent activity, leading to poor consumer sentimente-Conomy SEA Unlocking the $200 billion digital opportunity in Southeast Asia
Single Chart
Bain
View slide
The slide includes text on the left and a line graph on the right showing the revenue growth gap between leaders and laggards over several years.
Market Analysis and Trends
Financial Services
This slide contrasts the growth rates of leading and lagging organizations, illustrating how leaders have extended their revenue growth advantage over laggards.
revenue growth, leaders, laggards, financial performance, growth rates, post-pandemic recovery
false
Leaders have extended their revenue growth gap over LaggardsMake the leap, take the lead: Tech strategies for innovation and growth
Mixed Chart
Accenture
View slide
Column chart showing the annual total music revenue in Scandinavia, split by physical, live, and digital music from 2014 to 2023.
Market Analysis and Trends
Media & Entertainment
The slide highlights trends in the music industry in Scandinavia, emphasizing the steady growth in live and digital music revenues.
music industry, revenue growth, digital music, Scandinavia
false
Live and digital music will continue to grow and evolve new platformsGlobal Entertainment and Media Outlook 2019-2023
Single Chart
PwC/Strategy&
View slide
A graph displays patent family citations in future mobility against a teal background, accompanied by statistical highlights.
Strategic Planning
Transportation & Logistics
Focuses on Ford's patents in the future of mobility sector, including AI and electric vehicles, with a high percentage of recent patents.
Ford, future of mobility, patents, autonomous, AI, electric vehicles
true
Ford is investing in the future of mobilityThe Economic Impact of Ford and the F-Series
Single Chart
BCG
View slide
Slide shows two column charts comparing the growth of the luxury second-hand market against the total personal luxury market.
Market Analysis and Trends
Retail & E-commerce
Examines the growth of the second-hand luxury market, projecting significant increases and discussing market share.
Second-hand luxury, market growth, market analysis, trends, market share, projections, personal luxury
false
Luxury 2nd-hand market estimated at 22 B€ and growing faster than overall personal luxury...2019 True-Luxury Global Consumer I nsight
Multiple Chart
BCG
View slide
This slide uses a dual-column chart to compare the past and projected revenue against expenditures over several fiscal years, displayed in a clear, linear format with red for expenses and grey for revenues. Each year is labeled at the base, and the values are shown at the top of each column, providing a quick visual assessment of fiscal balance.
Financial Performance
Government & Public Sector
This slide compares historical and projected government revenue and expenditures, illustrating fiscal trends and budgetary balances over time. It is typically used in budget presentations to policymakers or the public to discuss financial management and planning, showcasing how revenue covers or falls short of expenses.
government budget, fiscal trends, revenue, expenditure, projections
false
2021/22 Annual Budget Speech: Revenue vs. ExpenditureDissecting the 2021/22 Annual Budget Speech
Single Chart
PwC/Strategy&
View slide
Features bar charts comparing top origin and destination countries for international migrants.
Market Analysis and Trends
Government & Public Sector
Provides an overview of major migration corridors, focusing on India and the US.
migration, India, US, corridors, global
false
By origin, migrants from India lead in absolute numbers, the US remains overall top destination – Middle East countries host most in relative termsRoland Berger Trend Compendium 2030: Megatrend 1 People & Society
Multiple Chart
Roland Berger
View slide
Data-centric slide with a graph highlighting the relative market share of ecommerce players in Southeast Asia. The design is simple and focused on delivering statistical insights.
Investment Analysis
Retail & E-commerce
Provides an analysis of the ecommerce market in Southeast Asia, illustrating the relative size of market players and highlighting areas with potential for growth. Useful for discussions on investment and market positioning.
ecommerce, market analysis, Southeast Asia, investment opportunities, market positioning, relative market share
false
Steering the futureDigital Consumers of Tomorrow, Here Today: A SYNC SOUTHEAST ASIA REPORT
Multiple Chart
Bain
View slide
Column chart showing spend outlook breakdown by geography, highlighting the most positive outlook from end-users in China
Market Analysis and Trends
Consumer Goods
The slide analyzes long-term spending trends on lighting solutions across regions, with China showing the most positive outlook
spending, regions, outlook, China, trends
false
Long term spending expected to increase across regions end users in China have the most positive outlookProject Spiritus Final report Market Study
Multiple Chart
EY
View slide
Contains bar graphs, and detailed text analysis comparing China, the US, and EU in terms of battery production capabilities. The slide uses a combination of purple, blue, and grey colors.
Competitive Landscape
Energy & Utilities
This slide details the strategic industrial policies of the world's largest economies in the battery sector, focusing on manufacturing capacities and government incentives.
battery industry, China, US, EU, industrial policy, manufacturing capacity, government incentives
false
While China’s battery industries are dominant, the US and EU are adopting strategic industrial development policies to catch upCharging Ahead Australia’s battery powered future
Mixed Chart
Accenture
View slide
This slide includes two column charts displaying median time to trial for family law final order cases over several years. Each chart shows a series of bars grouped by year, indicating an upward trend in the time required for trial.
Regulatory and Compliance
Government & Public Sector
The slide illustrates the increasing median time to trial in family law courts, emphasizing the growing backlog problem. It displays a comparative analysis of the time to trial over five years, signifying challenges in case handling and judicial efficiency.
median time, trial, family law, backlog, efficiency
false
Measures of backlog among courts (con’d)Review of efficiency of the operation of the federal courts
Multiple Chart
PwC/Strategy&
View slide
Diagram integrates circular and connective elements to discuss the relevance of certified second-hand goods for luxury brands and retailers.
Strategic Planning
Retail & E-commerce
Explores the strategic relevance of certified second-hand goods in the luxury market, focusing on brand and retail perspectives.
certified second-hand, luxury market, brand strategy, retail innovation, market trends
false
Why could certified 2nd-hand be relevant for luxury players?2019 True-Luxury Global Consumer I nsight
Vertical Flow
BCG
View slide
Contains multiple column charts comparing labor market parameters (vacancy development, unemployment rate, hourly labor wage growth) across Germany, USA, and China. Includes a line chart showing key supplier performance indicators globally.
Operational Efficiency
Transportation & Logistics
Examines the impact of high inflation and labor shortages on labor costs in the automotive industry. Analyzes different labor market parameters and how they contribute to the overall structural challenges faced by suppliers.
Labor Costs, Inflation, Automotive, Workforce, Performance
false
Labor costs increased significantly because of high inflation in 2022/2023 but also due to a lack of skilled workforce Labor market parametersGlobal Automotive Supplier Study 2023
Multiple Chart
Roland Berger
View slide
This slide is divided into three content blocks, each with icons and bullet points to represent different aspects of business banking growth, like market share and digital engagement.
Market Analysis and Trends
Financial Services
It presents opportunities for growth in business banking, illustrating industry leadership, strong unit economics, and a widespread network. Data points include the formation of 450k small businesses and 80% client digital activity.
Market Leadership, Growth Opportunities, Digital Activity, Small Business, Banking
false
We have a compelling opportunity for continued growthInverstors Day 2023
Table
JP Morgan
View slide
The slide presents a three-column layout with icons and bullet points on the left, a central section with four bar graphs, and a right column showing a list of financial data comparing 2022 to 2017.
Financial Performance
Financial Services
The slide highlights the business strengths, presence, and financial growth of a securities service provider, showing service delivery, client statistics, revenue, and market share among other financial data.
Services, Revenue, Clients, Markets, Growth
false
Securities Services is a leading provider, delivering strong financial performance and consistent market share growthInverstors Day 2023
Table
JP Morgan
View slide
This slide displays comparative column charts of NPL ratios and cost of risk, alongside a map visualization to geographically contextualize the data.
Risk Assessment and Management
Financial Services
It assesses the bank's non-performing loan (NPL) ratio and risk costs across regions, demonstrating a cautious risk profile. Ideal for comparing financial stability across markets.
NPL Ratio, Risk Profile, Geographical Analysis, Financial Stability, Cost of Risk, Comparative Data
false
A Prudent Risk ProfileBBVA - Thinking Ahead Morgan Stanley European Financials Conference 2016
Multiple Chart
Morgan Stanley
View slide
Slide showcases four segments with images and text, highlighting concepts of hyperpersonalization, ultraconvenience, community, and sustainability.
Customer and Market Segmentation
Retail & E-commerce
Discusses the evolving expectations of consumers for personalized and convenient experiences, emphasizing community and sustainability.
hyperpersonalization, ultraconvenience, community, sustainability, consumer behavior, engagement, millennials, Generation Z, demographics, ESG
false
Customers expect hyperpersonalized engagement, ultraconvenience, augmented experiences, community connection, and sustainabilityBCG Executive Perspectives: The Future of Sales and Marketing is Here
Header Horizontal
BCG
View slide
This slide presents column charts comparing economic revenue over three quarters for two consecutive years, with textual annotations and bullet points highlighting key financial figures and percentages. The design includes two shades of blue to distinguish the years and is accompanied by symbols representing different industry sectors and a module. Visual elements are arranged for easy comparison of data points.
Financial Performance
Industrial & Manufacturing
The slide discusses the company's economic revenue and organic growth rate in Q3 2023, with a comparison to the previous year. It shows reported growth, effects of currency devaluation, and the impact of acquisitions. Additionally, it provides a breakdown of growth by industry and modules. This slide is suitable for financial reviews, highlighting performance and growth in specific sectors and overall company health.
Organic Growth, Q3 2023, Revenue, Acquisitions, Industry, Modules, Percentages, Comparative, Financial
false
Group organic growth of +6.5% in Q3 2023 Following strong organic growth of +20.2% in H115TH ANNUAL AUTO CONFERENCE GOLDMAN SACHS
Mixed Chart
Goldman Sachs
View slide
A large multi-colored area graph dominates this slide, charting the increase in daily COVID-19 cases by region from March to December. The background is gray, and each region (like North America, South America) is represented in a different color, with key data points highlighted on the graph.
Strategic Planning
Healthcare & Pharmaceuticals
Details the dramatic increase in COVID-19 cases globally with a focus on recent months. It provides a visual analysis of the pandemic's surge in different regions, emphasizing the growth in cases and the ongoing challenges in managing the spread.
COVID-19, daily cases, global, regions, pandemic, trends, healthcare
false
The last few weeks have witnessed substantial growth in daily cases across regionsCOVID-19 BCG Perspectives State of the World
Single Chart
BCG
View slide
This slide presents a complex layout with a mix of text boxes, icons, and background images, highlighting key mergers and acquisitions (M&A) activities and their strategic importance. It includes timeline elements and bullet-point lists to describe major deals and steps within the company's strategy. The slide has the Michelin logo and uses the company's color scheme.
Strategic Planning
Industrial & Manufacturing
This slide reviews major M&A activities and strategic steps taken by Michelin, focusing on enhancing its portfolio in line with the "Michelin in Motion 2030 strategy." It is likely used in strategic business meetings or investor relations presentations to discuss company growth and strategic direction.
M&A, strategy, Michelin, portfolio, deals, innovation, acquisition, growth, planning, management
false
M&A active portfolio management with three major steps in 9M 2023, reflecting Michelin in Motion 2030 strategyRoad Show US West Coast Morgan Stanley
Pillar
Morgan Stanley
View slide
The slide presents circular diagrams and column charts comparing company sizes and the structure of customer service across different regions and industries. It uses a mix of green, blue, and gray colors for easy differentiation.
Organizational Structure and Change
Professional Services
Analyzes company demographics and customer service structures across various industries, highlighting differences in organization size and service placement. Useful for businesses evaluating their customer service frameworks and considering organizational adjustments for improved performance.
company profiles, organizational structure, customer service, industries, demographics
false
The company profiles size, type of customer service and industriesCustomer Service Excellence 2022
Multiple Chart
Deloitte
View slide
This slide features two graphs tracking the credit ratings of Macquarie Bank against other financial institutions by Standard & Poor’s and Moody’s from 2007. Each graph is color-coded to distinguish rating upgrades, downgrades, and stability. The slide is information-dense yet remains legible and ordered.
Risk Assessment and Management
Financial Services
It presents Macquarie Bank's credit ratings stability compared to other banks, highlighting resilience in ratings through financial events. This slide is likely used to reassure investors of Macquarie's solid standing and risk management over time, especially during economically turbulent periods.
credit ratings, Macquarie Bank, stability, Standard & Poor’s, Moody’s, financial institutions, risk management, long-term analysis
false
Macquarie Bank Limited Long Term Ratings StabilityMorgan Stanley Virtual Hong Kong Summit
Multiple Chart
Morgan Stanley
View slide
This slide presents a column chart and bullet points. There is a balance of text and graphical data. The slide's design is clean, with a structured layout for the charts and bullet points on a white background.
Market Analysis and Trends
Technology & Software
The slide illustrates Singapore's growth trends despite declines in specific sectors like online travel. It also highlights the positive aspects such as being a regional hub for e-commerce and investments in startups. Intended to showcase market resilience.
Singapore, growth, e-commerce, online travel, investments, startups, GMV, regional hub
false
Singapore remains a regional enabler for growth, despite short term GMV decline due to the Online Travel sectore-Conomy SEA 2020 At full velocity: Resilient and racing ahead
Mixed Chart
Bain
View slide
Visual comparison using bar charts to show the cost disparities between generators, solar mini-grids, and grid electricity, alongside another chart depicting the proportion of market fires caused by generators, emphasizing economic and safety impacts.
Regulatory and Compliance
Industrial & Manufacturing
Highlighting the economic and safety challenges posed by generator use in Nigeria, this slide compares their high costs to other energy sources and their significant role in market fires, advocating for safer and more economical alternatives like solar energy.
generators, costs, fires, market safety, energy sources, Nigeria, economic impact, safety
false
Given high running cost, MSME's relying on generators reduce their operating hours to minimise energy spend, resulting in ~USD4-5bn in sales, lost annuallySocio-economic case for deepening solar PV deployment in Nigeria
Multiple Chart
BCG
View slide
Slide contains column charts, and images. It has a dense layout with graphical data.
Financial Performance
Financial Services
Discusses Spain's banking activity, loan loss provisions, and focus on cost control in a low-interest-rate environment.
Banking, provisions, P&L, cost, interest
false
Spain Provisions reduction, as the main P&L driverBBVA - Thinking Ahead Morgan Stanley European Financials Conference 2016
Multiple Chart
Morgan Stanley
View slide
Text-heavy slide detailing privacy engineering and explainable AI, with descriptions and benefits listed.
Technology and Digital Transformation
Technology & Software
Analyzes the role of privacy engineering in data protection and the benefits of explainable AI in making technology trustworthy.
privacy engineering, explainable AI, data privacy, ethical AI, trust in technology
false
What are the most noteworthy technologies? 3McKinsey Technology Trends Outlook 2022 Trust architectures and digital identity
Header Horizontal
McKinsey
View slide
A scatter plot chart showing cumulative number of cases per million population juxtaposed against a ratio of total tests to total cases for various countries, within a gradient green background indicating preparedness.
Market Analysis and Trends
Healthcare & Pharmaceuticals
Analyzes countries' testing rates in relation to COVID-19 cases to evaluate readiness for relaxing lockdown measures, providing insights into public health strategies.
COVID-19, lockdown measures, testing rates, public health, cumulative cases, preparedness, relax lockdown
false
Countries planning to relax lockdown measures and substantially ramp-up testingCOVID-19 BCG Perspectives Publication #5 with a focus on Revamping Organizations for the New Reality
Mixed Chart
BCG
View slide
Two column charts displaying Henry Hub and UK NBP gas price estimates. The charts show bank/broker and consultant ranges from 2020 to 2024.
Market Analysis and Trends
Energy & Utilities
This slide presents higher gas price forecasts for Henry Hub compared to UK NBP. Consultant ranges suggest prices based on sustainable development scenarios.
Gas, price, forecast, Henry Hub, UK NBP, bank, broker, consultant, estimate, range
false
Gas price outlook Consultants predominantly forecast (on average) higher Henry Hub gas prices than banks and brokers.EY Price Point: global oil and gas market outlook Q3 | July 2020
Multiple Chart
EY
View slide
Five sections each with an icon and text: Native tokens, Stablecoins & CBDCs, Governance tokens, NFTs, Tokenized real world assets. Icons represent various digital assets.
Product and Service Analysis
Financial Services
Describes five types of digital assets issued on blockchains: native tokens, stablecoins, governance tokens, NFTs, and tokenized real world assets. For product categorization in blockchain services.
Digital Assets, Blockchain, NFTs, Stablecoins, Governance, Tokenization, Real World Assets
false
Five types of digital assets can be issued on a blockchainBlockchain and Digital Assets
Table
McKinsey
View slide
This slide uses a circular diagram to illustrate key focus areas in cybersecurity. Each segment is color-coded and labeled clearly, enhancing the slide's visual and informational clarity. The overall design is streamlined, with a focus on readability and immediate comprehension of the content.
Strategic Planning
Technology & Software
This slide outlines strategic focus areas in cybersecurity, including building a security culture, managing identity and access, and securing remote work environments. It's useful for strategic discussions on strengthening organizational cybersecurity frameworks and practices.
Cybersecurity, Strategy, Identity Management, Remote Work, Security Culture, Diagram
false
3. Cyber focus areasBoardroom Agenda
Framework
PwC/Strategy&
View slide
The slide features a column chart showing the breakdown of LCOH for the SMR example, including segments for Capex, startup costs, fuel, water, catalysts, labor and overhead, maintenance, insurance, and electricity selling. Each segment's percentage of total LCOH is displayed.
Financial Performance
Energy & Utilities
This slide provides a detailed breakdown of the LCOH for SMR, illustrating the contributions of various cost factors like Capex, fuel, and maintenance to the overall cost. It offers a financial analysis of hydrogen production using SMR.
LCOH, SMR, Cost Breakdown, Hydrogen, Financial Analysis
false
LCOH breakdown: SMR exampleHydrogen applications and business models
Single Chart
Kearney
View slide
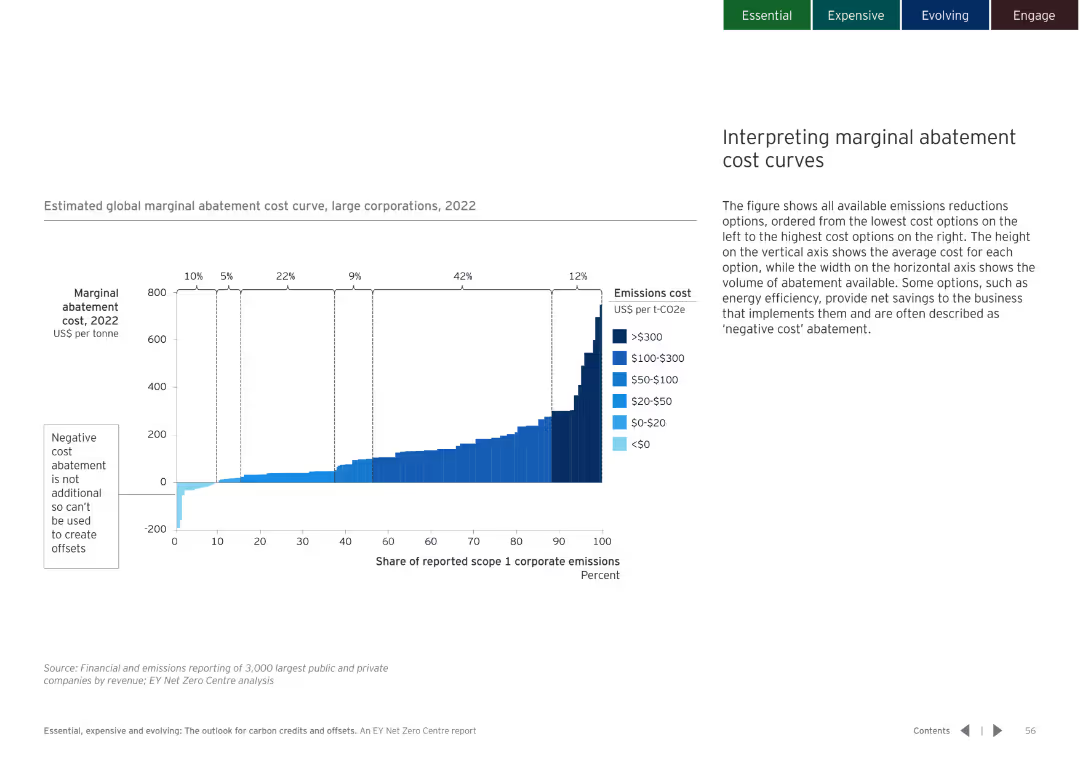
White background with a bar chart showing the marginal abatement cost curve. Clear labeling and color coding for different cost ranges.
Financial Performance
Environmental Services & Sustainability
Explains the interpretation of marginal abatement cost curves and the implications for emissions reduction strategies.
abatement cost curves, emissions reduction, cost interpretation
false
Estimated global marginal abatement cost curve, large corporations, 2022Essential, expensive and evolving: The outlook for carbon credits and offsets
Mixed Chart
EY
View slide
Includes bar charts and a pie chart detailing the adoption of robotic process automation (RPA) within shared services. The layout integrates text and charts smoothly.
Technology and Digital Transformation
Technology & Software
Examines the adoption rates and anticipated benefits of robotic process automation in shared services, highlighting potential savings and operational impacts. This slide is key for discussions on technological advancements in service delivery.
RPA, shared services, technology adoption, operational efficiency, cost savings
false
RPA is a rapidly emerging disruptive technology that dramatically reduces the effort required for routine, labor-intensive tasksGlobal Shared Services 2017 Survey Report
Multiple Chart
Deloitte
View slide
Column charts display trends in net revenues, cost/income ratio, and return on equity for Q1 across two years.
Operational Efficiency
Financial Services
Analyzes early 2023 financial performance, focusing on revenue growth, efficiency improvements, and capital strength despite market volatility.
financial analysis, revenue growth, efficiency, market volatility, 2023, banking
false
Strong start into 2023 despite volatile environmentAccelerated execution of Global Hausbank strategy to drive returns
Multiple Chart
Deutsche Bank
View slide
The slide features a cloud-shaped information hub with people using computer terminals. The layout includes three key points presented in dialogue bubbles on a green background.
Industry Overview
Technology & Software
The slide discusses enabling technology to improve worker performance, using interventions for better human outcomes, and scaling insights for broader impacts.
technology, interventions, scaling, human impact, insights, performance improvement, technology enablement
false
Powering human impact with technology Technology contributes to making work better for humans and making humans better at work™ NEW FUNDAMENTALSDeloitte 2023 Global Human Capital Trends Report: New fundamentals for a boundaryless world
Linear Flow
Deloitte
View slide
Features a vertical bar chart detailing the investment priorities related to in-store/omnichannel and e-commerce technologies.
Technology and Digital Transformation
Retail & E-commerce
Discusses the increase in investment towards enhancing in-store and online shopping experiences, driven by consumer behavior changes during the pandemic.
online shopping, e-commerce, investment, in-store, omnichannel, pandemic, consumer behavior, technology
false
…alongside online shopping platforms, reflecting traction gained during the pandemic2022 retail industry outlook
Single Chart
Deloitte
View slide
The slide features a column chart on the right displaying various reasons for holding stablecoins. The left side includes categories with percentage bars. The layout is moderate in complexity.
Market Analysis and Trends
Financial Services
The slide explains the reasons why people hold stablecoins, with diversification, lower risk, and ease of payment being the top reasons. It targets current crypto asset holders.
stablecoins, crypto, investment, risk, reasons
false
Reason(s) For Holding StablecoinsCRYPTO ASSET SURVEY
Multiple Chart
IPSOS
View slide
The slide offers a comparative analysis using bar charts and color-coded text to differentiate between countries' responses to COVID-19. The "Early China model" and "South Korea model" are contrasted, with testing rates and actions taken highlighted.
Strategic Planning
Healthcare & Pharmaceuticals
It compares strategies of various countries in responding to COVID-19, focusing on movement restriction and testing rates. It's meant to guide strategic planning in immediate containment and scaling up testing.
Containment, Testing, COVID-19, Countries, Strategy
false
Western countries are largely instituting the “Early China model,” focused on immediate containment while ramping up testingCOVID-19: Briefing Note
Header Horizontal
McKinsey
View slide
A slide featuring pie charts that correlate company size with preferred work environment options. It uses a simple color code to differentiate between the types of work environments.
Performance Metrics and KPIs
Professional Services
This slide is likely used in HR and management presentations to discuss how flexible work arrangements can maximize employee performance across different company sizes.
Flexible Work, Employee Performance, Company Size, Work Environment, HR Management
false
Most larger companies believe a more flexible work culture unlocks their employees’ best performance.Future Workplace Index 2.0
Multiple Chart
EY
View slide
The slide features a table summarizing various conditioning and pretreatment technologies and their compatibility with different types of feedstocks. Each technology is listed with symbols indicating detailed, applicable, or optimal conditions.
Technology and Digital Transformation
Energy & Utilities
This slide provides a detailed comparison of conditioning and pretreatment technologies, illustrating their compatibility with various biomass feedstocks, aimed at enhancing conversion efficiency.
conditioning, pretreatment, feedstock compatibility, technologies, biomass, conversion efficiency, detailed comparison
false
Conditioning and pretreatment technologies and feedstock compatibilityDeveloping sustainable carbon circularity Looking at advanced applications and business models
Table
Kearney
View slide
Includes a column chart with a 1.0 and 1.4 ratio, surrounded by a circular arrow diagram, and includes key performance ranks.
Performance Metrics and KPIs
Financial Services
Emphasizes the franchise collaboration model's success and its impact on generating additional revenue from clients.
Client Experience, Collaboration, Revenue Growth, IB Corporate Clients, Multiplier Effect
false
Clients value our powerful franchise collaboration model, and reward us for itInverstors Day 2023
Single Chart
JP Morgan
View slide
The slide features multiple bar graphs and line charts showing percentage changes in IT costs over time. It uses a clean, professional layout with color differentiation for various data points.
Market Analysis and Trends
Technology & Software
The slide analyzes IT cost changes in the technology sector, showing trends in TCO, Opex, and Capex from 2021 to 2026. It indicates how costs are projected to change over time.
IT, TCO, Opex, Capex, technology costs, financial trends
false
Figure 4: Percentage of companies reporting change and average annual % change in in IT total cost of ownership, IT opex and IT capexFrom survive to thrive Achieving tech transformation for communication service providers’ future
Multiple Chart
Accenture
View slide
World map with data points and legends indicating COVID-19 spread and statistics, high visual complexity.
Risk Assessment and Management
Healthcare & Pharmaceuticals
Global dashboard showing the spread and impact of COVID-19, useful for risk assessment and international response planning.
COVID-19, global dashboard, transmission, pandemic, risk management, health crisis, leading indicators
false
COVID-19 leading indicator dashboard Propagation of COVID-19 across new transmission complexesCOVID-19: Briefing Note
Graphic
McKinsey
View slide
Pie charts showing survey results, text with bullet points and manifesto sections
Organizational Structure and Change
Professional Services
Discusses EY's approach to flexible work policies, survey results, and the EYManifesto
Agile work, flexibility, survey, manifesto, EY
false
Flexible and agile workEY Italia for the country system
Multiple Chart
EY
View slide
The slide contains a V-shaped line chart illustrating EBITA over time, two text boxes for past results and forecasts, and a section for quarterly results. Red is used for emphasis.
Market Analysis and Trends
Industrial & Manufacturing
Offers insights into the Space sector's performance, showcasing EBITA trends, with a focus on the manufacturing recovery and satellite service performance.
space, EBITA, manufacturing recovery, satellite services, financial performance, telecommunication business
false
Space Recovery of Manufacturing and confirmed solid performance of Satellite servicesGoldman Sachs Investor Meeting
Single Chart
Goldman Sachs
View slide
The slide includes four line charts, showing quarterly and monthly corporate and individual insolvencies in the UK over different time periods.
Market Analysis and Trends
Financial Services
This slide examines insolvency trends in the UK, comparing corporate and individual insolvencies, useful for assessing economic health and risk factors.
insolvency, corporate, individual, UK, trends
false
UK corporate and consumer insolvency snapshotMonthly Market Insights Banking, Speciality Finance and Capital Markets
Multiple Chart
EY
View slide
This slide presents three column charts comparing waste recycling, product take-back, and recycling percentages at the end of life. The charts are color-coded in blue, distributed evenly across the slide.
Operational Efficiency
Environmental Services & Sustainability
The slide examines the recycling inefficiencies in production and end-of-life product management, emphasizing waste in production, product take-back, and recycling rates. It is likely used for sustainability assessments.
recycling, sustainability, waste management, production, end-of-life, inefficiency, take-back, environmental
false
Inefficiency assessment (4/5)Nordic Circular Economy Playbook 2.0
Multiple Chart
Accenture
View slide
Contains diagrams and text explaining self-sovereign and passwordless identity verification methods.
Technology and Digital Transformation
Technology & Software
Discusses innovative identity verification technologies and their roles in enhancing digital security and user autonomy.
self-sovereign identity, passwordless identity, biometrics, digital security, innovation
false
What are the most noteworthy technologies? 2McKinsey Technology Trends Outlook 2022 Trust architectures and digital identity
Header Horizontal
McKinsey
View slide
Features column charts and a stacked bar chart detailing news access numbers and frequency in Western Europe.
Market Analysis and Trends
Media & Entertainment
Highlights the growth in news readership and frequency of news access in Western Europe, emphasizing an engaged and informed public.
news readership, Western Europe, engagement, frequency, access numbers, growth, public inform, media analysis, trends
false
More Western Europeans are reading the news, and doing so more frequently than in the pastWestern Europe News Media Landscape Trends
Multiple Chart
Accenture
View slide
Two sections with text and images, each section explaining diversity and inclusion and the platform & sharing economy.
Market Analysis and Trends
Consumer Goods
Explains trends in consumer diversity and inclusion, and the growing platform and sharing economy.
Consumerism, diversity, inclusion, platform economy, trends
false
Consumerism 2.0 Diversity & InclusionTrendRadar: The Future Consumer
Multiple Chart
Deloitte
View slide
Contains a two-column layout with a column chart for dividends per year on the left and a block of text with figures on share buybacks on the right.
Financial Performance
Financial Services
Displays dividend payments from 2020 to 2023 and details on share buyback in 2023, emphasizing shareholder value creation through dividends and share buybacks.
dividends, shareholder value, buyback, financials, growth
false
VALUE CREATION FOR OUR SHAREHOLDERSINTRODUCTION TO IPSOS
Mixed Chart
IPSOS
View slide
Utilizes a bar graph to display the growth in the number of categories purchased online by consumers in Southeast Asia, comparing 2019 and 2020 data.
Customer and Market Segmentation
Retail & E-commerce
Demonstrates the broadening of online purchases among Southeast Asian consumers, who are expanding the variety of categories they buy from.
Online purchases, consumer expansion, Southeast Asia, category growth, graph
false
Five years of digital transformation in a single yearDigital Consumers of Tomorrow, Here Today: A SYNC SOUTHEAST ASIA REPORT
Single Chart
Bain
View slide
The slide presents bar charts and timelines, focusing on learning and growth opportunities across various life stages.
Strategic Planning
Education & Training
Discusses the enduring relevance of learning and personal development, with an emphasis on its impact on different generations and industries.
learning, education, personal growth, Gen X, life changes
false
Functional Nextatlas Insight “Never too late” thrives as society acknowledges learning, growth, and change know no age limitDigital Revolution Awards
Multiple Chart
Bain
View slide
The slide has a multicolor action plan list on the left side and a red-highlighted text box on the right emphasizing a key achievement. A gray background distinguishes the bottom section, which details specific program progress.
Operational Efficiency
Industrial & Manufacturing
Presenting the recovery plan for aerostructures, the slide outlines various actions taken and their progress. It emphasizes improvements and milestones, including collaborations and deliveries. It's used for performance reviews and showcasing operational progress in the aerospace sector.
Aerostructures, Recovery Plan, Progress, Operational Efficiency, Milestone
false
Aerostructures recovery plan is on the right wayGoldman Sachs Investor Meeting
Table
Goldman Sachs
View slide
Column chart showing penetration levels of private K-12 education in various cities, with supporting financial data.
Market Analysis and Trends
Education & Training
Provides data on the penetration levels of private K-12 education across major cities and related financial metrics.
penetration, K-12, cities, private, education
false
High barriers to entry and robust business model add to the attractiveness of the private K-12 segment (2/2)Good as Gold: Resilience and Continued Attractiveness of the Global K-12 Sector
Multiple Chart
LEK
View slide
Features a combination of column charts and small text explanations. The design is compact and focused on delivering statistical data effectively.
Investment Analysis
Environmental Services & Sustainability
Highlights the growth in stakeholder engagement in climate actions in SEA, showing statistics on investments and policy changes among corporates, investors, and consumers.
Stakeholders, climate action, SEA, investments, policy changes
false
All stakeholders across SEA are advocating for greater change in climate actionSoutheast Asia’s Green Economy 2022 Report
Mixed Chart
Bain
View slide
Images of batteries, pie chart, partnership flowchart
Strategic Planning
Industrial & Manufacturing
LANXESS's partnership with TINCI in electrolyte production
Electrolyte, Batteries, Partnership, TINCI, Market Leader
false
LANXESS starts electrolyte production for Li Ion batteries in cooperation with market leader TINCILANXESS – Morgan Stanley Cannon Ball Run Field trip
Mixed Chart
Morgan Stanley
View slide
Features three charts: a column chart for y/y real GDP (2021-2025F), a line chart for interest rates (2005-2025F), and a line chart for y/y CPI (2005-2025F).
Market Analysis and Trends
Financial Services
Discusses economic growth prospects in the MENA region, focusing on GDP, interest rates, and inflation trends.
MENA, GDP, Inflation, Interest Rates, 2024
false
Growth in the MENA region is expected to pick up in 2024, following a dip this year, with disinflation underwayGlobal economic outlook: finding balance in 2024
Multiple Chart
EY
View slide
Features column charts and annotations emphasizing the growth in industry gross balances and systematic wallet growth.
Investment Analysis
Financial Services
The slide details the expansion in client financing for equities, highlighting significant increases and revenue gap bridging strategies.
equities, client financing, gross balances, systematic growth, revenue gap, market analysis, investment banking
false
Increase Client Financing in EquitiesGoldman Sachs Investor Day
Multiple Chart
Goldman Sachs
1
...
Next
Load More
Hold On!
We are searching in our database
If nothing, comes up, please try different filters!
Create a FREE account to continue browsing
Receive Instant Access to 8,000+ of the internet's best slides
First Name
Last Name
Email
Password
I agree to all
Terms & Privacy Policy
Thank you! Your submission has been received!
Oops! Something went wrong while submitting the form.
Have an account?
Sign in
Column Chart
Heatmap
Chevron
Org Chart
Infographic
Callouts
Timeline
List
Graphic
Picture
Process Flow
Diagram
Paragraph
Map
Table
Framework
Subtitle
Takeaway Box
Icon
Other Chart
Radar Chart
Waterfall Chart
Mekko Chart
Pie Chart
Scatter Plot
Line Chart
Bar chart
Bullet points