My Account
My Slides
Leave Feedback
Login
Logout
Get Started
Browse all Slides
Browse Slides Pro
Create a FREE Account
Instant access to 1,000+ real slides from top companies like McKinsey, BCG, Goldman Sachs, Google and many more!
First Name
Last Name
Email
Password
I agree to all
Terms & Privacy Policy
Thank you! Your submission has been received!
Oops! Something went wrong while submitting the form.
Have an account?
Sign in
Instant access to the internet's best slides
Get access to 40+ advanced filters and more
Advanced Search and Filters
Access to
8,000+ slides
Access to Category Pages
Save/Bookmark Slides
PowerPoint Template Library (Coming Soon)
Choose your plan
MONTHLY
$12/month
Billed every month, cancel anytime.
YEARLY
$9/month
Billed $108 annually, cancel anytime.
Checkout for $12/month
Checkout for $108/yr
Secured by Stripe | AES-256 bit encryption
Welcome,
Welcome
Upgrade to SlideStart
Pro
Instant access to 8,000+ slides
Show Featured Only
Checkbox 8
Companies
Mckinsey
Bain
BCG
EY
Deloitte
Accenture
PwC/Strategy&
JP Morgan
Goldman Sachs
Morgan Stanley
Citigroup
Deutsche Bank
Barclays
LEK
Kearney
Oliver Wyman
Booz Allen Hamilton
Gartner
IPSOS
Nielsen
Slide type
Header Horizontal
Framework
Vertical Flow
Single Chart
Single Chart
Text Only
Mixed Chart
Header Vertical
Graphic
Pillar
Multiple Chart
Agenda
Title
Table
Linear Flow
Upgrade to SlideStart
Pro
Instant access to 40+ advanced filters
Industry
Upgrade to SlideStart
Pro
Instant access to 40+ advanced filters
Technology
Healthcare
Financial Services
Consumer Goods
Energy & Utilities
Manufacturing
Retail
E-commerce
Logistics
Telecommunications
Real Estate
Professional Services
Education
Media
Entertainment
Hospitatlity
Tourism
Agriculture
Food Production
Government & Public Sector
Environmental
Sustainability
Use Case
Upgrade to SlideStart
Pro
Instant access to 40+ advanced filters
Sales and Business Development
Mergers and Acquisitions
Corporate Finance and Valuation
Performance Metrics and KPIs
Client Case Studies
Competitive Landscape
Product and Service Analysis
Customer and Market Segmentation
Organizational Structure
Human Resources and Talent Management
Industry Overview
Regulatory and Compliance
Risk Assessment and Management
Agriculture & Food Production
Hospitality and Tourism
Government
Environmental
Sustainability
Clear all
Thank you! Your submission has been received!
Oops! Something went wrong while submitting the form.
Show Featured Only
Checkbox 8
Companies
Mckinsey
Bain
BCG
EY
Deloitte
Accenture
PwC/Strategy&
JP Morgan
Goldman Sachs
Morgan Stanley
Citigroup
Deutsche Bank
Barclays
LEK
Kearney
Oliver Wyman
Booz Allen Hamilton
Gartner
IPSOS
Nielsen
Slide type
Text Only
Linear Flow
Vertical Flow
Single Chart
Header Horizontal
Mixed Chart
Header Vertical
Pillar
Multiple Chart
Graphic
Agenda
Title
Table
Framework
Industry
Technology
Healthcare
Financial Services
Consumer Goods
Energy & Utilities
Manufacturing
Retail
E-commerce
Logistics
Telecommunications
Real Estate
Professional Services
Education
Media
Entertainment
Hospitatlity
Tourism
Agriculture
Food Production
Government & Public Sector
Environmental
Sustainability
Use Case
Sales and Business Development
Mergers and Acquisitions
Corporate Finance and Valuation
Performance Metrics and KPIs
Client Case Studies
Competitive Landscape
Product and Service Analysis
Customer and Market Segmentation
Organizational Structure
Human Resources and Talent Management
Industry Overview
Regulatory and Compliance
Risk Assessment and Management
Agriculture & Food Production
Hospitality and Tourism
Government
Environmental
Sustainability
Clear all
Thank you! Your submission has been received!
Oops! Something went wrong while submitting the form.
Tag
View slide
Contains a color-coded map of Australia with detailed GDP uplift and job creation figures for each state and territory. Various colors represent different levels of economic benefit.
Market Analysis and Trends
Telecommunications
Analyzes the economic benefits of the nbn network across Australia, detailing GDP uplift, job creation, and business development in each state and territory from 2012 to 2022.
nbn, Economic, Australia, States, GDP
false
The nbn network is enabling improved economic outcomes across all of Australia’s states and territoriesThe economic and social impact of investment in the nbn network Key Insights Report
Graphic
Accenture
View slide
Contains a variety of graphical elements including bar charts showing economic impact over time, diagrams outlining applications of urban monitoring, and key points in text format. The layout is designed for clarity and focus on data-driven insights.
Strategic Planning
Environmental Services & Sustainability
This slide provides an overview of the economic and strategic benefits of urban monitoring using Copernicus services. It discusses revenue opportunities for service providers and benefits for end users, highlighting the application in urban planning and risk management.
urban monitoring, Copernicus, economic impact, strategic benefits, data services
false
URBAN MONITORING COPERNICUS BENEFITS FOR URBAN MONITORINGCOPERNICUS Market report February 2019
Mixed Chart
PwC/Strategy&
View slide
Dominated by green hues, this slide details the concept of systemic resilience across a multi-point list.
Organizational Structure and Change
Professional Services
It provides a deep dive into building resilience, with six points explaining the approach, including seeking advantage in adversity and valuing diversity.
resilience, collaboration, performance, diversity, change, advantage
false
Building greater systemic resilienceCOVID-19 BCG Perspectives Series Global Restart: Key Dynamics
Boxed
BCG
View slide
This world map slide highlights specific countries like the USA, China, India, and Japan with red pins, indicating a focus on these regions for the survey. It provides a clear global comparison context.
Industry Overview
Professional Services
Offers a global overview of the countries prioritized in the survey, marking them as critical for understanding varying cultural attitudes across different regions.
global survey, cultural study, USA, China, India, Japan
false
1. Overview on countries featured in survey 1 European cultural attitudes are contrasted with the USA, China, India, and JapanGlobal Culture Survey 2021
Graphic
PwC/Strategy&
View slide
Bar and column charts display the perception of digital disruption across different industries and organization types.
Market Analysis and Trends
Technology & Software
Analyzes how different sectors and types of organizations perceive the disruptive potential of digital technology.
digital disruption, industry comparison, business models, organizational types, technology impact
false
The View of Digital Technology as Disruptive Varies by Industry and Organization TypeThe Evolving State of Digital Transformation
Multiple Chart
BCG
View slide
Column charts with blue bars represent the digital economy GMV of SEA countries from 2022 to 2030.
Market Analysis and Trends
Technology & Software
The slide shows projected growth in the digital economy GMV for different SEA countries, highlighting Vietnam and the Philippines.
SEA, digital economy, GMV, growth forecast, Vietnam, Philippines
false
Sustained growth expected across the board, with Vietnam and the Philippines as frontrunners going forwarde-Conomy SEA 2022 Through the waves, towards a sea of opportunity
Multiple Chart
Bain
View slide
The slide features bullet points with brief explanations aligned left, and key economic components of globalization like imports and exports, trade agreements, and cross-border investments.
Market Analysis and Trends
Financial Services
This slide provides a summary of the economic components critical to globalization trends, focusing on aspects like trade and investments, suitable for discussing global market trends and economic integration strategies.
globalization, economy, trade, investments, FDI
false
Despite the controversy over globalization, GDP, exports and FDI flows are expected to grow – Albeit at different ratesRoland Berger Trend Compendium 2030 Megatrend 2 Globalization & future markets
Mixed Chart
Roland Berger
View slide
This slide combines text and a map image. On the left, there are four bullet points highlighting the sponsor's qualifications, including alignment with unitholders and on-ground European teams. On the right, there's a map of Europe indicating the sponsor's office locations with simple icons.
Strategic Planning
Real Estate & Construction
Outlines the Cromwell Property Group's strengths, including investment alignment, local expertise, and European market presence.
European Footprint, Local Expertise, Real Estate Sponsorship, Office Locations, Market Presence, Professional Experience
false
Sponsor’s European footprint and on-the-ground expertiseMorgan Stanley Conference Investor presentation
Table
Morgan Stanley
View slide
Displays a bar chart showing the percentage of international migrants in different regions over time.
Strategic Planning
Professional Services
Discusses the impact of globalization on international migration, emphasizing its significance in socio-political debates and policies.
globalization, migration, international, socio-political impact, migration trends
false
Finally, digitalization and growing global data flows have the potential to change key parameters of globalizationRoland Berger Trend Compendium 2030 Megatrend 2 Globalization & future markets
Mixed Chart
Roland Berger
View slide
Two columns of bulleted lists, contrasting elements of a strategy on the left and its impacts on the right.
Strategic Planning
Professional Services
Explains a strategic growth plan and its operational, technical, and market impacts.
Strategy, growth, performance, innovation, talent retention, market expansion
false
VISION 2020 GROWTH STRATEGYFiscal Year 2021 First Quarter
Header Horizontal
Booz Allen Hamilton
View slide
Bar chart showing various savings goals among Canadians pre-COVID-19. Bars indicate the percentage of respondents with 'Yes', 'No', and 'Not applicable' responses for each savings goal. Dense text at the top explains the context.
Market Analysis and Trends
Financial Services
The slide presents data on the savings goals of Canadian investors before COVID-19, highlighting the percentage contributing to goals such as retirement, travel, and education. It notes gender differences and the high proportion of younger investors saving for these goals.
Savings, Goals, Canadians, Retirement, Travel, Education
false
Canadians’ Savings GoalsINVESTING AND THE COVID-19 PANDEMIC
Mixed Chart
IPSOS
View slide
Graphical representation of income sources with segmented column charts and a comprehensive breakdown of key drivers on the side.
Investment Analysis
Financial Services
Showcases Macquarie Capital’s financial outcomes, particularly the income on equity and debt investments. It serves as an analytical tool for investment performance evaluation, suitable for stakeholders and investment analysts interested in the firm's financial positioning and strategic investment outcomes.
capital, investments, income, analysis, performance
false
Macquarie Capital Result reflects higher income on equity and debt investments and higher fee and commission incomeMorgan Stanley Virtual Hong Kong Summit
Mixed Chart
Morgan Stanley
View slide
Displays a column chart on efficiency ratio and comprehensive tables listing various expense categories with associated financial data.
Operational Efficiency
Financial Services
The slide offers a detailed breakdown of expenses, highlighting changes over time and efficiency ratios. It can be used to discuss operational expenses, budget planning, and financial strategy adjustments based on the illustrated data.
Expenses, Operational, Efficiency Ratio, Compensation, Technology, Clearing, Market Development, Tax Rate, Financial Results, Litigation Provision
false
Expenses Financial ResultsFull Year and Fourth Quarter 2019 Earnings Results Presentation
Mixed Chart
Goldman Sachs
View slide
The slide features a horizontal bar chart showing survey results on opinions about social media power, internet dependency, and technological progress.
Market Analysis and Trends
Technology & Software
The slide presents data on the public's mixed feelings about the power of social media companies, internet reliance, and the impact of technological progress.
Social media, internet, technological progress, public opinion, survey
false
The global public remainsundecided about techA NEW WORLD DISORDER?
Single Chart
IPSOS
View slide
Column chart showing average views on official accounts, image of smartphone usage
Market Analysis and Trends
Media & Entertainment
Discusses the effectiveness of brand accounts on WeChat for engaging consumers
Digital Marketing, Brand Engagement, WeChat, Views
false
Brand Official Account becoming an impactful way to reach and engageChina Luxury Digital Playbook
Single Chart
BCG
View slide
This slide features a simple color-coded design to showcase digital imperative achievements by different countries. Each country is represented with a flag, followed by bullet points outlining key initiatives and progress in digital infrastructure, talent, and other areas. There are no complex graphics, just organized, concise text descriptions.
Industry Overview
Technology & Software
It outlines key digital strategy achievements of various countries, like Thailand's network strategy and Estonia's e-governance. Each section lists specific initiatives, reflecting on how these countries are advancing their digital infrastructures and capabilities, investing in talent, and integrating ICT into education systems to keep pace with global technological imperatives.
Digital Strategy, Global, Thailand, Australia, Estonia, Malaysia, Singapore, South Korea, ICT, Education, Infrastructure, Talent
false
Other countries around the world are also racing to achieve key imperatives.Unlocking the next wave of digital growth: beyond metropolitan Indonesia
Header Vertical
Kearney
View slide
This final slide is simple, with four key points listed across the slide, each accompanied by an icon. The slide is designed to summarize the key messages of the presentation and provide clear takeaways.
Strategic Planning
Financial Services
Serves as a succinct wrap-up of the presentation's core messages, focusing on market positioning, capital preservation, customer commitment, and risk management strategies, aimed at reinforcing the final thoughts for the audience.
summary, conclusion, key points, market position, capital preservation, customer commitment, risk management, strategic summary, final thoughts, presentation wrap-up, core messages
false
Well positioned to withstand market environment with strong balance sheet, robust capital, and ample liquidityFixed Income Investor Presentation
Pillar
Goldman Sachs
View slide
The slide presents future projections using a bar chart showing the digital economy's growth, driven by tier 2 and 3 cities, with accompanying explanatory text.
Market Analysis and Trends
Technology & Software
Forecasts the increasing contribution of tier 2 and 3 cities to Indonesia's digital economy by 2025, indicating significant growth in e-commerce and other sectors.
forecast, digital economy, tier cities, Indonesia, growth, e-commerce, payments
false
By 2025, tier 2 and tier 3 cities will exert their economic power and be key contributors with a larger share of Indonesia’s digital economy.Unlocking the next wave of digital growth: beyond metropolitan Indonesia
Multiple Chart
Kearney
View slide
A bar graph illustrates the retention rate of new digital service users, with consistent high percentages across multiple service categories.
Market Analysis and Trends
Technology & Software
Illustrates the longevity of digital service adoption among new users, indicating a low likelihood of market retraction post-pandemic.
digital services, long-term adoption, user retention, market stability, service categories, post-pandemic
false
Adoption of digital services has been one way, with no signs of reversal - 9 out of 10 new users in 2020 continue to use them in 2021e-Conomy SEA 2021 Roaring 20s: The SEA Digital Decade
Single Chart
Bain
View slide
Diagram showing two proposed tiered waiver approaches with a visual breakdown of support needs and costs.
Strategic Planning
Government & Public Sector
Proposes a tiered service delivery model for waiver programs, outlining two approaches with different tiers for managing support needs and controlling service costs effectively.
tiered waivers, service delivery model, support needs, cost control, waiver program, NH's DD population, strategic planning, funding models
false
DD | 1915(c) Waiver Redesign: Tiered Waivers | Analysis (3 of 6)NH DHHS Operations Assessment
Diagram
Alvarez & Marsal
View slide
There are two sets of dual column charts, displaying trends over a period from 2013 to 2023 in leverage and interest coverage for U.S. investment-grade and loan markets.
Financial Performance
Financial Services
This slide analyzes the leverage and interest coverage in the U.S. loan market, highlighting stability and declines respectively. Suitable for financial review meetings.
leverage, interest, US, market, investment, financial, performance, stability, decline, coverage
false
Fundamentals in IG Stable, While Loan Interest Coverage Has Declined With Higher RatesCredit Market Monitor
Multiple Chart
Morgan Stanley
View slide
The slide presents demographic data for 2023 with icons and percentages for gender, age, household composition, and more.
Customer and Market Segmentation
Financial Services
It details the demographics of Canadians in 2023, including gender, age, education, and employment status.
Demographics, 2023, Canadians, Gender, Age, Household, Education, Employment, Financial, Segmentation
false
Demographics (2023)CRYPTO ASSET SURVEY 2023
Multiple Chart
IPSOS
View slide
Features a central hub-and-spoke diagram linking various strategies and tools aimed at enhancing client coverage, surrounded by relevant data points.
Operational Efficiency
Financial Services
Discusses the development and enhancement of JPMorgan’s client coverage team, emphasizing training, tools, and insights that lead to increased productivity and market understanding.
Client Coverage, Training, Productivity, Banking, Tools, Insights, Market Understanding
false
Building an unmatched client coverage team with data-driven tools, insights and trainingCommercial Banking 2022
Framework
JP Morgan
View slide
This slide contains a pie chart detailing portfolio by industry and a line graph illustrating net charge-off performance, accompanied by text boxes.
Risk Assessment and Management
Financial Services
The slide presents a portfolio summary, market commentary, and performance metrics for commercial and industrial (C&I) lending, discussing risk management and credit performance.
Risk Discipline, C&I Lending, Portfolio, Market Commentary, Performance, Credit Quality
false
Maintaining risk discipline – C&ICOMMERCIAL BANKING 2020
Multiple Chart
JP Morgan
View slide
Features a central triangle with each vertex labeled with a question about work, worker, or workplace. It shows the contrast between future and current work options through a graphical element representing a spectrum.
Strategic Planning
Technology & Software
Examines the disruptors in the future of work, focusing on who can do the work, where, and how. This slide is beneficial for strategic planning regarding workforce evolution.
Disruptors, Future of Work, Strategy, Workforce
false
Disruptors to leverage Future of Work opportunities…Future of Work - How is work delivered?
Diagram
Deloitte
View slide
The slide shows a three-column layout with text and arrows. It details different strategic focuses and projected financial impacts.
Strategic Planning
Financial Services
Explains strategic growth areas, including business diversification and efficiency. Designed for strategy presentations or stakeholder meetings.
Strategic Growth, Business Diversification, Efficiency, Financial Impact, Planning, Stakeholders
false
Clear Strategic Direction Will Drive Business GrowthGoldman Sachs Investor Day
Vertical Flow
Goldman Sachs
View slide
A bar chart comparing different industries' approaches to culture and organizational structure in 2026, using colors to differentiate between 'control', 'hybrid', and 'culture' focused models. The layout is straightforward with clearly labeled categories and percentages, enabling easy comparison across industries.
Market Analysis and Trends
Professional Services
Forecasting future trends, this slide compares industries' approaches to organizational structure for 2026. It reveals preferences for control, hybrid, or culture models within sectors like consumer goods, retail, and media, providing a comprehensive overview of anticipated shifts in organizational strategy influenced by cultural considerations.
organizational culture, 2026 forecast, industry comparison, structure models, consumer goods, retail, media
false
Culture & organizational structure in 2026 by industryConsumers at 250
Single Chart
Kearney
View slide
Slide features two column charts comparing equity value changes and return sensitivities for various investments in Seadrill. Left chart shows equity returns based on asset values, right chart shows return sensitivity based on company names.
Investment Analysis
Financial Services
Analyzes potential returns in a market recovery scenario using asset value increases and sensitivity analysis across different companies, serving as a strategic tool for investors.
Equity, Returns, Investment, Sensitivity, Market Recovery
false
Positioning for the recovery: illustrative returnsSeadrill Investor Presentation Barclays CEO Energy & Power Conference, New York
Multiple Chart
Barclays
View slide
The slide contains a picture of a robot in a store setting and text describing retail robotics. Below the text are trend assessment bars labeled "Watch" with impact on industry and time of mainstream adoption.
Technology and Digital Transformation
Retail & E-commerce
Explains the role of robotics in automating store operations, refilling shelves, and managing inventory, projecting that such technologies will be realized by 2040. It discusses the expected benefits and potential applications in improving retail and food service industries' workflows.
Robotics, Retail, Automation, AI, Technology
false
Data Era & AI Retail RoboticsTrendRadar: The Future Consumer
Mixed Chart
Deloitte
View slide
Combines text sections with check marks and minimalistic design.
Strategic Planning
Financial Services
Describes Goldman Sachs' progress in global banking and markets, asset & wealth management, and strategic initiatives for 2023.
Banking, strategies, Goldman Sachs
false
Solid progress on execution priorities in 2023Full Year and Fourth Quarter 2023 Earnings Results Presentation
Header Horizontal
Goldman Sachs
View slide
Features column charts comparing the proportion of women in managerial positions across various regions and time periods, presented with clear labels and contrasting colors for easy comparison.
Market Analysis and Trends
Professional Services
Highlights the slow progress and continuing challenges in achieving gender parity in managerial roles globally, providing a basis for discussions on gender equity in professional settings.
gender equality, managerial roles, global, trends, workplace, diversity, equity, data, analysis
false
Gender inequality is a global concern: In the workplace, in every region, the gender gap remains significant progress is slow at all levelsRoland Berger Trend Compendium 2030: Megatrend 1 People & Society
Mixed Chart
Roland Berger
View slide
Column chart show Sustainable Finance volumes with targets, accompanied by a detailed list of recent sustainability achievements.
Regulatory and Compliance
Environmental Services & Sustainability
Covers the bank's efforts and achievements in sustainable finance, including partnerships, policies, and financial targets aimed at environmental and corporate governance.
sustainability, finance, corporate governance, environmental, achievements, policies, banking
false
Sustainability at Deutsche Bank Q3 2023 highlights Client & Creditor Overview May 31, 2023
Mixed Chart
Deutsche Bank
View slide
Diagram-centric slide with a detailed circular infographic illustrating the governance structure for ESG topics, complemented by text explanations.
Regulatory and Compliance
Environmental Services & Sustainability
It explains the governance mechanism in place for ESG matters within the company, detailing roles from the Board to specialized committees.
ESG, Governance, Structure, Management, Oversight
false
Managing ESG Topics2022 Environmental, Social, Governance Report
Diagram
Booz Allen Hamilton
View slide
This slide utilizes a two-column layout with a list of capabilities required on the left, paired with key disruption points presented as bullet points on the right. Icons accompany each disruption point for visual emphasis. The slide uses a mix of bullet points and statistics, complemented by a blue and black color scheme.
Regulatory and Compliance
Energy & Utilities
The slide outlines the role of hydrogen-based fuels in transforming the energy sector. It outlines required reductions in production costs, increased production efficiency, and infrastructure development for scaling hydrogen production. The content is critical for understanding the regulatory and compliance aspects within the energy sector, projecting the share of green hydrogen in final energy consumption by 2050 and its impact on decarbonization efforts. Target audiences include industry experts, policymakers, and stakeholders looking at the future role of hydrogen in meeting energy demands and sustainability goals.
hydrogen fuels, production costs, efficiency, infrastructure development, green hydrogen, energy consumption, decarbonization, regulatory, sustainability, industry impact
false
What disruptions could hydrogen enable in the electric power, natural gas, and utilities industry?McKinsey Technology Trends Outlook 2022 Future of clean energy
Boxed
McKinsey
View slide
This is a cover slide with a creative design depicting a world map made of plant leaves on a deep blue background, representing the concept of a 'green' or eco-friendly world. The title is prominently displayed at the top.
Industry Overview
Environmental Services & Sustainability
As the introductory slide, it sets the theme for the presentation, signaling a focus on the costs and benefits of the net-zero transition within the global energy sector.
Net-Zero, Transition, Global Energy, Sustainability, Eco-Friendly, Introduction, McKinsey, 2022, Cover Slide
false
The net-zero transition: What it would cost, what it could bringThe net-zero transition
Title
McKinsey
View slide
Detailed graph showing the maturity curve of organizational levers in the Automotive-OES sector, featuring elements like social media, cloud, digital sales, and various partnerships.
Strategic Planning
Transportation & Logistics
Explains the development stages of organizational capabilities in the Automotive-OES sector, from traditional setups to advanced digital integrations. Focus on technology and leadership.
automotive, technology, digital, leadership, partnerships, maturity, organizational, development, sector
false
Maturity curve of organizational levers in the Automotive – OES sectorAUTOMOTIVE –OES
Single Chart
Accenture
View slide
Features four rounded rectangles, each with a heading and a short text blurb beneath it. The slide is divided into quadrants representing different aspects of work structure and delivery.
Organizational Structure and Change
Professional Services
Encourages thinking about work delivery, organization, employee experience, and enabling work. Useful for initiating discussions on organizational changes needed for the future of work.
Organizational Change, Work, Structure, Planning
true
What do we need to start thinking about? Future of Work - What is the Future of Work?
Pillar
Deloitte
View slide
A bar chart illustrating the perceived effectiveness of various traditional paid media channels like linear TV, radio, and print. Each bar is segmented to show different confidence levels among marketers.
Market Analysis and Trends
Media & Entertainment
This slide presents survey data on marketers' confidence in the effectiveness of traditional paid media channels. It highlights the perceived effectiveness of channels like TV, radio, and print for brand building and consumer acquisition.
Media, Effectiveness, Traditional, Channels, Confidence
false
Perceived effectiveness of primary paid traditional channelsEra of alignment
Mixed Chart
Nielsen
View slide
A horizontal flow chart listing six execution priorities under the vision to create a global wealth manager.
Strategic Planning
Financial Services
Outlines the strategic priorities for Wealth Management, emphasizing integration, growth, and risk management.
strategy, execution priorities, wealth management, global vision, risk management
false
WM has a clear strategy with six execution prioritiesInvestor Deep Dive 2022
Diagram
Credit Suisse
View slide
Features multiple column charts and tables. Charts compare luxury market growth by geography and consumer nationality from 2017 to 2018 with color coding for different regions.
Market Analysis and Trends
Retail & E-commerce
Analyzes the luxury goods market growth in 2018, highlighting the contributions from various geographies and consumer nationalities. It points to significant growth led by Chinese consumers.
Market Growth, Luxury Goods, Geography, Consumer, 2018
false
POSITIVE GROWTH ACROSS THE BOARD IN 2018. CHINA AND CHINESE CONSUMERS LEADING THE GROWTHALTAGAMMA 2018 WORLDWIDE LUXURY MARKET MONITOR
Multiple Chart
Bain
View slide
The slide features a column chart showing the distribution of methane reduction efforts. It includes several text boxes outlining various technologies and solutions to reduce methane production in livestock and waste.
Technology and Digital Transformation
Agriculture & Food Production
This slide discusses strategies to reduce methane emissions in agriculture, focusing on livestock and waste. It details the potential abatement, associated costs, and specific technologies like feed supplements and biogas capture.
Methane reduction, Livestock, Emissions, Technology, Agriculture
false
Methane reductionHow can Australia’s agriculture sector realise opportunity in a low emissions future?
Mixed Chart
EY
View slide
Features two line graphs showing year-over-year industrial production growth in the U.S. and EU. The slide uses red and blue lines against a light green background for clarity.
Operational Efficiency
Industrial & Manufacturing
Discusses recent trends in manufacturing and industrial production in the U.S. and EU, highlighting changes in growth rates. This slide is beneficial for understanding sectoral health and economic conditions.
Manufacturing, Industrial Production, US, EU, Growth Rates
false
U.S. and EU manufacturing industrial production growth has deceleratedDeutsche Bank Global Industrials & Materials
Single Chart
Deutsche Bank
View slide
The slide features a table summarizing various conditioning and pretreatment technologies and their compatibility with different types of feedstocks. Each technology is listed with symbols indicating detailed, applicable, or optimal conditions.
Technology and Digital Transformation
Energy & Utilities
This slide provides a detailed comparison of conditioning and pretreatment technologies, illustrating their compatibility with various biomass feedstocks, aimed at enhancing conversion efficiency.
conditioning, pretreatment, feedstock compatibility, technologies, biomass, conversion efficiency, detailed comparison
false
Conditioning and pretreatment technologies and feedstock compatibilityDeveloping sustainable carbon circularity Looking at advanced applications and business models
Table
Kearney
View slide
Slide displays column charts showing net interest income sensitivity over different years and currencies.
Risk Assessment and Management
Financial Services
This slide analyzes the sensitivity of net interest income to changes in the yield curve for 2023-2025, with breakdowns by currency and highlights the impact of interest rate changes on the bank's income.
net interest income, sensitivity, yield curve, currencies
false
Net interest income sensitivity Hypothetical +/-25bps shift in yield curve, in € mQ1 2023 results
Multiple Chart
Deutsche Bank
View slide
The slide features a mix of tables, column charts, and text boxes to present IPO data across APAC markets.
Market Analysis and Trends
Financial Services
It highlights the number and proceeds of IPOs in the APAC region, focusing on the strong performance of Greater China and South Korea.
APAC, Greater China, South Korea, IPOs, performance
false
APAC held up better due to strong performance from Greater China and South Korea marketsHow can you find the clarity to steer your growth?
Multiple Chart
EY
View slide
A comprehensive dashboard with various metrics presented in tables and small multiple graphs, summarizing global economic, business, and health data as of June 2021.
Financial Performance
Healthcare & Pharmaceuticals
This dashboard compiles critical global data from the pandemic’s impact on economic indicators, business activities, and health statistics.
global data, pandemic impact, economic indicators, business activities, health statistics, summary dashboard
false
Summary dashboard As of 01 June 2021What the Evolution of Travel Means for Business
Mixed Chart
BCG
View slide
The slide shows a technology maturity curve graph, plotting various hydrogen production technologies against time and risk. The chart includes technologies like SMR, Alkaline electrolysis, and Methane cracking, color-coded by thermochemical production, electrolysis production, and others.
Market Analysis and Trends
Energy & Utilities
This slide presents a maturity curve for hydrogen production technologies, categorizing them based on their development stage and associated risks. It highlights the transition from research to deployment phases, illustrating the technological advancements in hydrogen production.
Hydrogen, Technology, Maturity, Production, Risk
false
Hydrogen technology maturity curveHydrogen applications and business models
Single Chart
Kearney
View slide
The slide features two column charts showing the percentages of participants who experienced gains or losses from crypto assets and crypto investment funds.
Financial Performance
Financial Services
This slide provides insights into the financial outcomes (gains or losses) for participants holding crypto assets and investment funds.
Gains, losses, crypto assets, investment funds, financial outcomes
false
Gains / Losses From Crypto Assets / Crypto Investment FundsCRYPTO ASSET SURVEY
Multiple Chart
IPSOS
View slide
This slide features a singular blue line chart tracking the price of Brent crude oil from 2016 to 2023. The layout is clean, with distinct markers for each quarter, and the title prominently displayed at the top.
Market Analysis and Trends
Energy & Utilities
Analyzing the price fluctuations of Brent crude oil, this slide shows a line chart that tracks quarterly data over several years. It can be used to understand trends in the energy sector, make financial predictions, or develop strategies for purchasing and futures contracts in industries like transportation and manufacturing.
Brent crude, oil price, trend analysis, line chart
false
Brent priceRoad Show US West Coast Morgan Stanley
Single Chart
Morgan Stanley
View slide
Depicts twelve key activities grouped under four categories with simple icons and text, laid out evenly across the slide. The design is clean and facilitates easy comprehension of the information.
Operational Efficiency
Media & Entertainment
Discusses twelve key digital marketing activities considered across various maturity stages, categorized under data-driven targeting, automated activation, measurement & attribution, and organizational collaboration. This is valuable for enhancing operational efficiency in digital marketing initiatives.
digital marketing, activities, data-driven targeting, automated activation, measurement, organizational collaboration, operational efficiency, maturity
false
Digital marketing maturity considered across key activitiesUnderstanding the path to digital marketing maturity
Pillar
BCG
View slide
Slide with a vertical column chart showing financial investment breakdown for FY 2023, accompanied by bullet points outlining areas like operational efficiency and business growth. Graphics include icons for visual emphasis.
Investment Analysis
Financial Services
Discusses the bank's investment strategies for FY 2023, highlighting areas of spending such as operational efficiency and business growth initiatives. It outlines strategies to adapt to future challenges and maximize efficiency.
investment, financial planning, operational efficiency, FY 2023, business growth
false
Peak investment year to future proof franchiseQ4 / FY 2023 results
Mixed Chart
Deutsche Bank
View slide
A vibrant graphic representing various diversity dimensions encircles textual explanations, flanked by images portraying diversity in the workplace.
Human Resources and Talent Management
Industrial & Manufacturing
Showcases Michelin's progress in diversity and inclusion for 2022, indicating scores and goals, reinforcing their commitment to a varied and inclusive work environment.
Diversity, Inclusion, Michelin, Work Environment, Corporate Culture, Progress, IMDI Score, Gender Balance, Equal Opportunity, Talent Development
false
Diversity and inclusion: Progress in every dimension in 2022, demonstrating the Group’s commitmentRoad Show US West Coast Morgan Stanley
Framework
Morgan Stanley
View slide
Slide features heatmap showing career aspirations in younger generations.
Market Analysis and Trends
Professional Services
Discusses evolving career aspirations among the next generation, emphasizing non-traditional roles.
future careers, generational change, management roles, aspirations, survey data
false
Next generation no longer sees management as the next role to long forBCG – IPSOS study
Table
BCG
View slide
The layout of this slide is clear, featuring column charts to represent deal values across several years. The design employs shades of blue with clean text to convey the data, ensuring readability and focus.
Investment Analysis
Financial Services
The slide illustrates increasing deal values in the digital financial services and e-commerce sectors, providing a perspective on investment trends. It's a useful tool for identifying where investors are directing their funds and for assessing the vibrancy of the private funding landscape in these sectors.
deal value, DFS, e-commerce, investment trends, Series-C investments
false
Deal value is on the rise, driven by several large Series-C investments in DFS and e-commercee-Conomy SEA 2022 Through the waves, towards a sea of opportunity
Single Chart
Bain
View slide
This slide features three sets of column charts comparing 'Electricity', 'Fuel', and 'Heat' purchased or acquired from 2019 to 2021, in MWh. The charts are placed side by side in a muted color scheme. Each chart has a corresponding table below detailing the exact figures. The overall design is clean, utilizing white space effectively.
Financial Performance
Environmental Services & Sustainability
The slide provides a visual comparison of energy consumption data over three years. It's used for analyzing environmental sustainability efforts, specifically in tracking energy usage trends to inform corporate ESG strategies. It illustrates changes in consumption, which may reflect the effectiveness of conservation measures or shifts in operational scale.
ESG, Sustainability, Energy, Trends, Consumption, Comparison, Data, Corporate, Environment
false
Electricity purchased or acquired MWhAccelerating Sustainable and Inclusive Growth
Multiple Chart
McKinsey
View slide
Header with key message, two bar graphs displaying category switch from online to offline purchase.
Customer and Market Segmentation
Retail & E-commerce
Analysis of consumer trends shifting between online and offline shopping channels post-pandemic.
consumer trends, channel preference, online shopping, offline shopping, post-pandemic
false
Post-pandemic consumers seek the best of both channelsSoutheast Asia's digital consumers: A new stage of evolution
Mixed Chart
Bain
View slide
Slide presents bullet points, check marks for progress, and four circular icons with financial figures for different strategic priorities.
Strategic Planning
Financial Services
Communicates strategic priorities and the progress made in different financial sectors, including international expansion and carbon transition.
Strategic Priorities, Financial Sponsors, Capital, International, Carbon Transition, Progress
false
We have made tangible progress on our strategic prioritiesInverstors Day 2023
Table
JP Morgan
View slide
Contains bar graphs and a column chart, statistical breakdowns of European Earth Observation sales and market share.
Market Analysis and Trends
Technology & Software
Provides detailed insights into the European market for Earth Observation, discussing sales trends and market share.
European market, EO sales, market trends, Earth Observation
false
THE EARTH OBSERVATION UPSTREAM MARKET IN EUROPECOPERNICUS Market report February 2019
Multiple Chart
PwC/Strategy&
View slide
The slide displays a technology maturity curve for bioenergy processing methods, charting the progression from research to mature technology. The curve is segmented into different stages of development and deployment.
Technology and Digital Transformation
Energy & Utilities
This slide outlines the maturity levels of various bioenergy processing technologies, from lab work and pilot scale to large-scale deployment and mature technologies.
bioenergy, technology maturity, processing methods, research, development, deployment, maturity levels
false
Technology maturity curve for bioenergy processing methodsDeveloping sustainable carbon circularity Looking at advanced applications and business models
Single Chart
Kearney
View slide
The slide has a large word cloud in the background with key social issues and three key data points highlighted in red regarding brand preferences among luxury customers.
Market Analysis and Trends
Consumer Goods
Highlights the importance of social responsibility to younger luxury customers, emphasizing a preference for brands that demonstrate social engagement.
social responsibility, luxury brands, consumer preferences, millennials, brand loyalty
false
CUSTOMERS, PARTICULARLY YOUNGER ONES, ARE GLOBALLY EVALUATING BRANDS ON THEIR SOCIAL RESPONSIBILITY COMMITMENTBAIN-ALTAGAMMA 2019 WORLDWIDE LUXURY MARKET MONITOR
Mixed Chart
Bain
View slide
Slide shows stacked column charts comparing regional market outlooks.
Market Analysis and Trends
Financial Services
Compares executive views on market stability in North America, Europe, and Asia from 2023 to 2024, showing increased optimism in Asia and shifts in Europe.
market stability, optimism, executive views, regional comparison
false
Globally, optimism remains steady, with pessimism shifting to neutrality in 2024 relative to 2023The CEO's Guide to Costs and Growth
Multiple Chart
BCG
View slide
Slide includes projected revenue growth using column charts and additional strategic growth measures by division, clearly laid out for comparison and projection.
Strategic Planning
Financial Services
Discusses future revenue targets and strategic measures to achieve these goals across various divisions, suitable for financial planning and forecasting discussions.
revenue, growth, targets, financial, planning, forecasting, strategic, measures, divisions, 2025
false
Revenues planned to reach >€ 30bn by 2025Client & Creditor Overview May 31, 2023
Mixed Chart
Deutsche Bank
View slide
Features a detailed circular diagram looking like a pie chart and text describing various trends within the FoodTech industry.
Investment Analysis
Agriculture & Food Production
Maps the FoodTech ecosystem according to key trends, showing how different players are aligned with these trends.
FoodTech, ecosystem, trends, mapping, alignment
false
The 2021 Ecosystem mapped based on driving trendsThe Swiss FoodTech Ecosystem 2021
Diagram
Accenture
View slide
This slide has two parts: the left side shows pie charts depicting investment intentions for Greece, while the right side lists economic risks in a vertical bar chart.
Risk Assessment and Management
Financial Services
This slide presents survey data on investors' perceptions regarding investment opportunities and economic risks in Greece, highlighting key factors influencing decisions.
investment, Greece, perceptions, risks, survey
false
Geographical distribution of investmentsGreece goes the distance, continuing to win investors’ trust
Graphic
EY
View slide
The slide features a bar chart showing the percentage of total investment value in Indonesia from 2012 to August 2017, with categories such as E-commerce, Transport, Finance, Classified/Directory, Payment, and Others.
Market Analysis and Trends
Retail & E-commerce
This slide highlights that E-commerce and transport sectors heavily dominate investments in Indonesia, accounting for 58% and 38% respectively, followed by minimal investments in other categories.
investment, E-commerce, transport, Indonesia, 2012-2017, finance, directory, payment, top categories
false
E-commerce and transport categories heavily dominate investmentsIndonesia Venture Capital Outlook 2017
Mixed Chart
Kearney
View slide
Two graphs illustrating an increase in time spent online and e-commerce sales, juxtaposed to convey the correlation between digital consumption and retail trends.
Market Analysis and Trends
Retail & E-commerce
Analyzes the rise in digital media consumption and e-commerce growth due to the pandemic, highlighting shifts in consumer behavior and market opportunities.
Digital Consumption, E-commerce Growth, Pandemic Impact, Consumer Behavior, Retail Trends, Marketing Budgets, Digital Sales, ASEAN Market, Online Retail, Marketing Strategy
false
The pandemic has permanently increased time spent online and brought new digital users, accelerating e-commerce growthBCG Executive Perspectives: The Future of Sales and Marketing is Here
Multiple Chart
BCG
View slide
Contains column chart and bullet points demonstrating revenue trajectories and growth drivers for upcoming years. Emphasizes areas like Corporate Bank and Investment Bank, with annotations for projected growth.
Financial Performance
Financial Services
Details the bank's strategic positioning and expected revenue growth, focusing on specific financial services sectors and strategies for diversification and resilience in market positioning.
financial planning, revenue growth, strategic positioning, diversification, banking
false
Strong revenue trajectory supported by resilient and diversified franchise positioningQ4 / FY 2023 results
Mixed Chart
Deutsche Bank
View slide
Multiple pie charts showing the distribution of credit sales by product and by market vertical.
Market Analysis and Trends
Financial Services
Examines how sales diversification across different products and verticals contributes to balanced growth and market expansion.
Sales, Diversification, Credit, Market
false
Sales DiversificationBread Financial: Barclays Global Financial Services Conference
Multiple Chart
Barclays
View slide
Features a central hexagon with various team effectiveness traits surrounded by related icons, a circle graph, and two small bar charts depicting related statistics.
Human Resources and Talent Management
Professional Services
Discussing top team effectiveness, this slide provides a framework for building a capable leadership team aligned with SDG goals. It underscores the importance of strategic alignment, stakeholder perspective, and interpersonal interactions to foster an effective, sustainable leadership environment.
Team Effectiveness, Leadership, SDGs, Strategic Alignment, Stakeholder Engagement
false
To execute the strategy and unleash the energy in your organization, ensure that the top team is set up to deliver on the SDG strategySDG Guide for Business Leaders
Multiple Chart
McKinsey
View slide
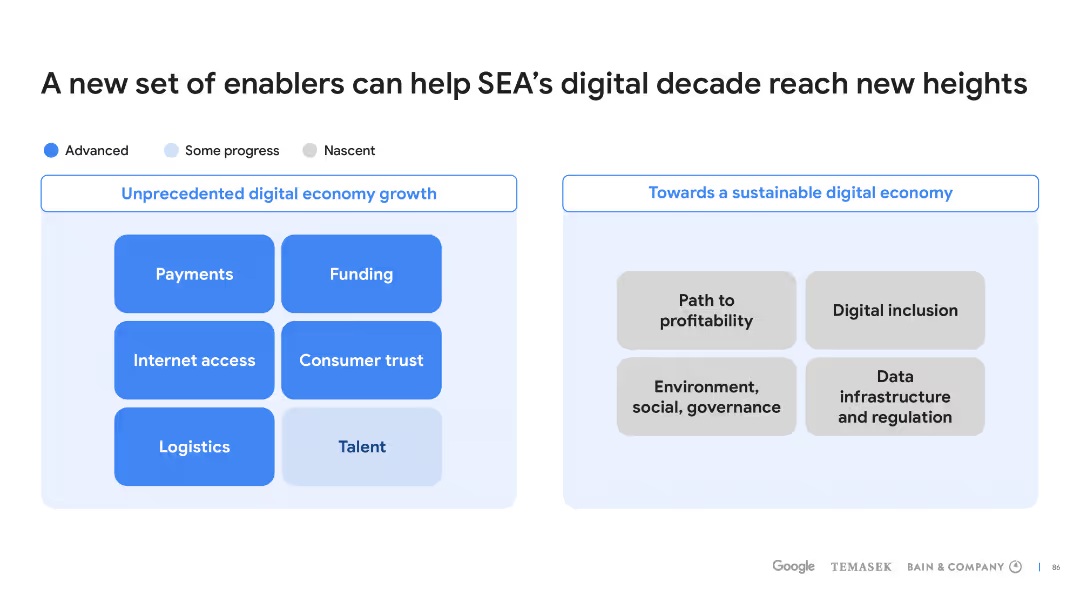
Two sets of bullet points on blue backgrounds, comparing factors for digital economy growth against those for sustainable digital economy.
Strategic Planning
Technology & Software
This slide outlines various enablers that could propel SEA's digital economy to new heights, focusing on growth and sustainability.
digital economy, SEA, enablers, growth, sustainability
false
A new set of enablers can help SEA’s digital decade reach new heightse-Conomy SEA 2022 Through the waves, towards a sea of opportunity
Header Horizontal
Bain
View slide
This slide has a colorful design with hexagonal graphics representing different areas of sustainability, connected by lines to central icons. It is text-heavy, detailing the bank's sustainability strategy with bullet points in each hexagonal section.
Market Analysis and Trends
Financial Services
The slide summarizes Citi Handlowy's sustainable strategy, detailing commitments to ESG products, risk management, and carbon footprint reduction, aiming to incorporate sustainability into business decision-making.
Sustainability, ESG, Strategy, Finance, Risk Management, Green Transformation, Carbon Footprint, Corporate Responsibility, Social Impact, Banking
false
2022 2024 Citi Handlowy sustainable strategy |2022-2024 Bank Handlowy Group Strategy
Framework
Citigroup
View slide
Moderate complexity with bullet points, icons, and text
Technology and Digital Transformation
Environmental Services & Sustainability
This slide showcases examples of companies and technologies that have made a significant impact on sustainable consumption. It is beneficial for discussing successful cases of innovation in sustainability, highlighting how various sectors are integrating green technology.
Innovation, Case Studies, Green Technology, Sustainability, Consumption
false
Who has created impact with technologies enabling sustainable consumption?McKinsey Technology Trends Outlook 2022 Future of sustainable consumption
Header Vertical
McKinsey
View slide
Features a pie chart and a bar chart analyzing the expected impact of climate change on business strategies and operations.
Risk Assessment and Management
Environmental Services & Sustainability
Explores how businesses anticipate climate change will affect their strategy and operations, noting significant concerns about operational disruptions.
climate change, business impact, risk management, strategy, operations, disruption, environmental sustainability
false
Almost all respondents said their companies have been affected by climate changeDeloitte 2022 CxO Sustainability Report
Multiple Chart
Deloitte
View slide
This slide contains column charts and infographics depicting the operational efficiencies achieved by investing in digitization and automation. The design is clean, with icons that help explain the concepts discussed, such as AI digital assistants and modernized operations platforms.
Operational Efficiency
Financial Services
Illustrates Barclays' efforts to improve operational efficiency through digital transformation and automation, detailing the impact on cost reduction and enhanced customer service.
operational efficiency, digitization, automation, cost reduction
false
Simpler: path to improving operational efficiencyFY 2023 Results Announcement
Multiple Chart
Barclays
View slide
Presents data and future strategies in lending market share through various graphs.
Market Analysis and Trends
Financial Services
Discusses strategies to increase lending market share and improve service models.
lending, market share, strategies, service model
false
More balanced: opportunity to grow lending market shareFY 2023 Results Announcement
Linear Flow
Barclays
View slide
Slide includes a column chart with green color highlights. It's structured into sections with clear headers and bullet points for easy reading.
Operational Efficiency
Education & Training
Details the role of community hubs in vocational pathways and employment, highlighting their support in gaining skills and providing training opportunities. It assesses the economic and social benefits provided by these hubs, emphasizing their importance in community development.
vocational training, community development, employment support, skills acquisition
false
Executive Summary | Vocational pathwaysCommunity Hubs Australia
Mixed Chart
Deloitte
View slide
Column chart showing Euro area HICP y/y inflation growth for 2023-24F and a line chart showing Euro area share of product categories by y/y price growth threshold from 2013-23. Moderate complexity, suitable for audiences with some prior knowledge of the topic.
Market Analysis and Trends
Financial Services
This slide analyzes the inflation trends in EU countries, highlighting the differences in inflation rates across countries and projecting future trends. It discusses disinflation processes, the impact of energy prices, and forecasts inflation returning to central bank targets by 2024.
Inflation, EU, HICP, disinflation, energy
false
Most EU economies will see inflation near or at central bank target by the end of 2024 i n CEE, particularly Poland and Hungary, inflation will remain elevated for longerGlobal economic outlook Macroeconomic outlook and impact on businesses
Multiple Chart
EY
View slide
Three column charts showing reductions in credit portfolio exposure, Prime Services credit RWA, and WM Ship Financing credit exposure for 1Q21 vs. 1Q22.
Risk Assessment and Management
Financial Services
Highlights the focused reductions in higher risk areas, including credit portfolio de-risking, Prime Services reduction, and successful repositioning of Ship Finance, showing percentage decreases in risk exposure over time.
risk reduction, credit portfolio, Prime Services, Ship Financing, de-risking
false
The focused reductions have been on higher risk areasInvestor Deep Dive 2022
Multiple Chart
Credit Suisse
View slide
The slide presents a series of column charts with varying shades of blue indicating different sectors such as DFS, E-commerce, and Transport. Each chart corresponds to a year from 2019 to H1 2022 and includes percentages and the private funding value in billions. The layout is well-organized with a clear legend and is titled in large, bold font.
Market Analysis and Trends
Financial Services
This slide analyzes the shift in private funding within various sectors from 2019 to the first half of 2022. DFS has overtaken e-commerce in terms of investment, highlighting significant industry dynamics and investment trends. It can be used for presenting market shifts and predicting future investment focus.
DFS, e-commerce, transport, investment, trends, market shift, funding, analysis, 2019-2022
false
DFS overtakes e-commerce, nabbing nearly half of all funding and raising ~$150M in H1 2022 alonee-Conomy SEA 2022 Through the waves, towards a sea of opportunity
Single Chart
Bain
View slide
The slide contains a text box on the left about transaction factors, with a column chart on the right illustrating the most important factors for managers when considering potential transactions.
Mergers and Acquisitions
Financial Services
This slide examines the key factors managers consider when evaluating potential transactions, emphasizing the importance of deal value and other critical elements.
deal value, transactions, managers, factors, evaluation
false
Deal value is always critical, but numerous factors are important to consider when contemplating a transactionCan resilience shape a shifting landscape?
Mixed Chart
EY
View slide
This slide presents survey data comparing worker and executive opinions on AI's impacts. It uses contrasting colors to differentiate between groups, and includes key statistics for areas like job security and technology understanding.
Strategic Planning
Technology & Software
Highlights differences in perception between executives and workers regarding the impact of AI on job security and workplace integration.
AI, Workers, Executives, Perceptions, Impact, Job Security, Technology, Survey, Professional Services
false
Figure 4. Misaligned perceptions between workers and CxOs on key concerns related to gen AI’s impact on work, the workforce and workersWork, workforce, workers Reinvented in the age of generative AI
Mixed Chart
Accenture
View slide
Slide with a process timeline and funding source breakdown, including bar and line graphics to represent stages from pre-commercial development to market roll-out.
Market Analysis and Trends
Energy & Utilities
Discusses the EU’s support mechanisms for hydrogen technology through various funding stages, from proof of concept to market readiness, highlighting different EU funding sources.
EU, Funding, Hydrogen, Innovation, Scale-up
false
The EU supports hydrogen innovation, demonstration and scale up through different instrumentsChilean Hydrogen Pathway
Linear Flow
McKinsey
View slide
Column chart showing agreement and disagreement percentages on the belief that all diseases will be curable across countries.
Market Analysis and Trends
Healthcare & Pharmaceuticals
The slide examines the belief in the future curability of all medical conditions, with significant variation across countries.
medical advancements, future expectations, public opinion, global health, curability
false
Control over one’s own health is a shared global desireA NEW WORLD DISORDER?
Multiple Chart
IPSOS
View slide
Features multiple pie charts displaying the percentage use of AI in different operational areas.
Operational Efficiency
Technology & Software
Outlines the use of AI in daily operations across various industries, focusing on customer experience and operations, and highlights the sectors and processes where AI has the most significant impact.
AI, operations, customer experience, day-to-day, industries
false
Consumer The consumer industry includes a vast array of business types, ranging from consumer products to hotels, restaurants and airlines.Fueling the AI transformation: Four key actions powering widespread value from AI, right now.
Multiple Chart
Deloitte
View slide
Includes a stacked column chart showing debt maturity by year and a small pie chart detailing credit ratings. Design elements highlight key statistics like '€600mln ESG linked Term Loan' and credit rating changes over time from three agencies.
Financial Performance
Financial Services
The slide emphasizes a balanced debt maturity structure and favorable credit ratings, presenting both historical and current data. This information is critical for investors assessing the company's financial health and risk profile.
debt maturity, credit rating, ESG, financial health
false
Balanced debt maturity profileGoldman Sachs Investor Meeting
Mixed Chart
Goldman Sachs
View slide
The slide shows a detailed value chain diagram for CCUS technologies, covering the entire process from CO2 sources through separation and capture, transport, and utilization/storage. Each segment is clearly labeled and color-coded.
Technology and Digital Transformation
Energy & Utilities
This slide explains the comprehensive value chain of CCUS technologies, detailing each step from CO2 capture to storage and utilization, showcasing the integrated approach needed to abate CO2 emissions.
CCUS, CO2 capture, value chain, transport, utilization, storage
false
CCUS refers to a set of CO2 capture, transport, utilization, and storage technologies combined to abate CO2 emissionsCarbon Capture Utilization and Storage
Linear Flow
Kearney
View slide
This slide includes column charts comparing satellite imagery market worldwide and other diagrams detailing market shares in various segments. The layout is dense with multiple visual elements including charts, legends, and text annotations.
Market Analysis and Trends
Environmental Services & Sustainability
The slide discusses the global market trends in the Earth Observation downstream industry, highlighting market sizes, growth rates, and market shares among major companies and technologies. It’s useful for analyzing market dynamics and predicting future industry movements.
Earth Observation, market trends, satellite imagery, global market, growth rates, market shares
false
THE EARTH OBSERVATION DOWNSTREAM MARKET AT GLOBAL LEVELCOPERNICUS Market report February 2019
Multiple Chart
PwC/Strategy&
View slide
Compares AR and VR technologies, discussing current status and future requirements.
Technology and Digital Transformation
Technology & Software
Evaluates AR and VR's current technological capabilities and the significant advancements needed for widespread adoption.
augmented reality, virtual reality, technology development, immersive experience, industry application
false
What are the most noteworthy technologies? McKinsey Technology Trends Outlook 2022 Immersive-reality technologies
Boxed
McKinsey
View slide
Features two sets of column charts, one showing the reduction in total expenses per account and the other showing productivity across business segments. The slide includes iconographic elements for context.
Operational Efficiency
Financial Services
Showcasing JP Morgan Chase & Co.'s operational efficiencies and cost management, this slide visualizes reductions in expenses and improvements in productivity, likely used in operational reviews and strategy discussions.
operating leverage, cost management, productivity improvements, operational efficiency, JP Morgan Chase, strategy discussions
false
We are generating operating leverage in the businessConsumer & Community Banking
Multiple Chart
JP Morgan
View slide
The slide features a combination of text and graphical data with a large line chart showing the trend of market growth in pet supplies. Icons and small graphics add a visual element to the statistics presented, making the slide engaging and informative.
Market Analysis and Trends
Consumer Goods
Discusses the growth in the pet supplies market through the pandemic and expected post-pandemic trends. It emphasizes increased adoption rates, consumer spending, and the impact of e-commerce on the market dynamics. The slide also projects continued market growth driven by these factors.
pet supplies, market growth, COVID-19, e-commerce, consumer behavior, adoption rates, future trends
false
Pet supplies and services: category emerged as a winner through the pandemic, with sustained postpandemic growth expectedHow COVID-19 Changed the Consumer
Mixed Chart
BCG
1
...
Next
Load More
Hold On!
We are searching in our database
If nothing, comes up, please try different filters!
Create a FREE account to continue browsing
Receive Instant Access to 8,000+ of the internet's best slides
First Name
Last Name
Email
Password
I agree to all
Terms & Privacy Policy
Thank you! Your submission has been received!
Oops! Something went wrong while submitting the form.
Have an account?
Sign in
Column Chart
Heatmap
Chevron
Org Chart
Infographic
Callouts
Timeline
List
Graphic
Picture
Process Flow
Diagram
Paragraph
Map
Table
Framework
Subtitle
Takeaway Box
Icon
Other Chart
Radar Chart
Waterfall Chart
Mekko Chart
Pie Chart
Scatter Plot
Line Chart
Bar chart
Bullet points