My Account
My Slides
Search by Category
Templates
Leave Feedback
Login
Logout
Get Started
Browse all Slides
Browse all Slides
Create a FREE Account
Instant access to 1,000+ real slides from top companies like McKinsey, BCG, Goldman Sachs, Google and many more!
First Name
Last Name
Email
Password
I agree to all
Terms & Privacy Policy
Thank you! Your submission has been received!
Oops! Something went wrong while submitting the form.
Have an account?
Sign in
Instant access to the internet's best slides
Get access to 40+ advanced filters and more
Advanced Search and Filters
Access to
10,000+ slides
Access to Category Pages
Save/Bookmark Slides
PowerPoint Template Library (New)
Choose your plan
MONTHLY
$12/month
Billed every month, cancel anytime.
YEARLY
$9/month
Billed $108 annually, cancel anytime.
Checkout for $12/month
Checkout for $108/yr
Secured by Stripe | AES-256 bit encryption
📢 Ready to start building slides? Check out our new template library
view templates
Welcome,
Welcome
Upgrade to SlideStart
Pro
Instant access to 15,000+ slides
Show Featured Only
Checkbox 8
Companies
Mckinsey
Bain
BCG
EY
Deloitte
Accenture
PwC/Strategy&
JP Morgan
Goldman Sachs
Morgan Stanley
Citigroup
Deutsche Bank
Barclays
LEK
Kearney
Oliver Wyman
Booz Allen Hamilton
Gartner
IPSOS
Nielsen
Slide type
Header Horizontal
Framework
Vertical Flow
Single Chart
Single Chart
Text Only
Mixed Chart
Header Vertical
Graphic
Pillar
Multiple Chart
Agenda
Title
Table
Linear Flow
Upgrade to SlideStart
Pro
Instant access to 40+ advanced filters
Industry
Upgrade to SlideStart
Pro
Instant access to 40+ advanced filters
Technology
Healthcare
Financial Services
Consumer Goods
Energy & Utilities
Manufacturing
Retail
E-commerce
Logistics
Telecommunications
Real Estate
Professional Services
Education
Media
Entertainment
Hospitatlity
Tourism
Agriculture
Food Production
Government & Public Sector
Environmental
Sustainability
Use Case
Upgrade to SlideStart
Pro
Instant access to 40+ advanced filters
Sales and Business Development
Mergers and Acquisitions
Corporate Finance and Valuation
Performance Metrics and KPIs
Client Case Studies
Competitive Landscape
Product and Service Analysis
Customer and Market Segmentation
Organizational Structure
Human Resources and Talent Management
Industry Overview
Regulatory and Compliance
Risk Assessment and Management
Agriculture & Food Production
Hospitality and Tourism
Government
Environmental
Sustainability
Clear all
Thank you! Your submission has been received!
Oops! Something went wrong while submitting the form.
Show Featured Only
Checkbox 8
Companies
Mckinsey
Bain
BCG
EY
Deloitte
Accenture
PwC/Strategy&
JP Morgan
Goldman Sachs
Morgan Stanley
Citigroup
Deutsche Bank
Barclays
LEK
Kearney
Oliver Wyman
Booz Allen Hamilton
Gartner
IPSOS
Nielsen
Slide type
Text Only
Linear Flow
Vertical Flow
Single Chart
Header Horizontal
Mixed Chart
Header Vertical
Pillar
Multiple Chart
Graphic
Agenda
Title
Table
Framework
Industry
Technology
Healthcare
Financial Services
Consumer Goods
Energy & Utilities
Manufacturing
Retail
E-commerce
Logistics
Telecommunications
Real Estate
Professional Services
Education
Media
Entertainment
Hospitatlity
Tourism
Agriculture
Food Production
Government & Public Sector
Environmental
Sustainability
Use Case
Sales and Business Development
Mergers and Acquisitions
Corporate Finance and Valuation
Performance Metrics and KPIs
Client Case Studies
Competitive Landscape
Product and Service Analysis
Customer and Market Segmentation
Organizational Structure
Human Resources and Talent Management
Industry Overview
Regulatory and Compliance
Risk Assessment and Management
Agriculture & Food Production
Hospitality and Tourism
Government
Environmental
Sustainability
Clear all
Thank you! Your submission has been received!
Oops! Something went wrong while submitting the form.
Tag
View slide
This slide features a table layout, contrasting different industries in the first column with the implications of clean-energy technology trends in the second. Each industry is symbolized by an icon. The design is sleek with a black, white, and blue color palette.
Industry Overview
Energy & Utilities
This slide addresses the broader impact of clean-energy technology trends across various industries such as metals and mining, oil and gas, and construction. It discusses the implications of these trends on resource demand and value pools. Ideal for an overview of industry-wide shifts due to clean energy, it is a resource for those assessing strategic planning, investment opportunities, or regulatory impacts across the affected sectors.
clean energy, industry impact, metals and mining, oil and gas, construction, technology trends, electrification, resource demand, strategic planning, value pools
false
What other industries are most affected by the trend?McKinsey Technology Trends Outlook 2022 Future of clean energy
Header Vertical
McKinsey
View slide
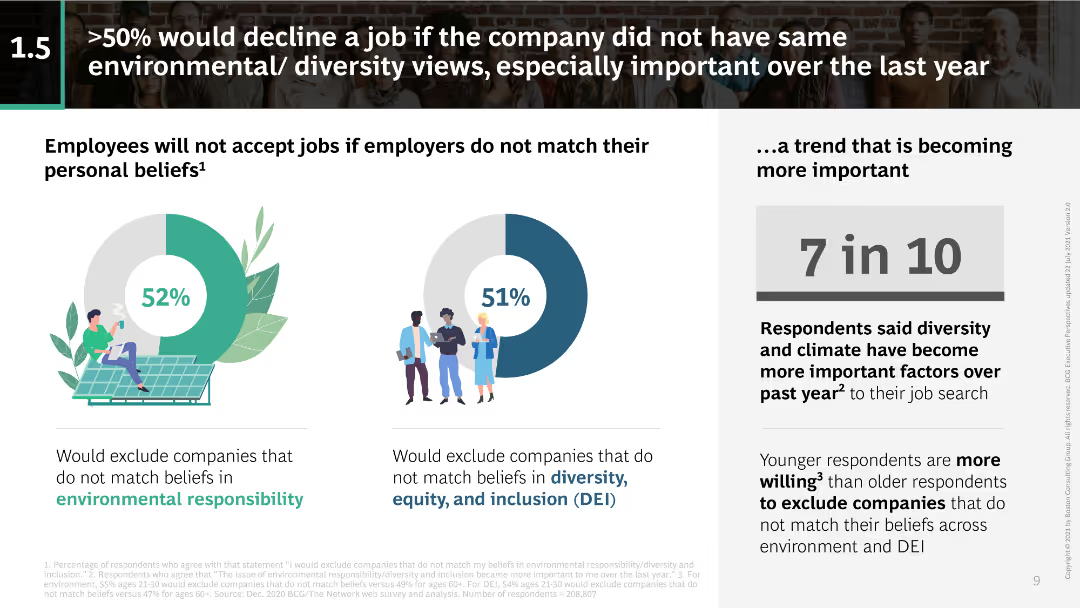
Pie charts showing percentages of employees declining jobs based on environmental and diversity views; text discussing this trend.
Regulatory and Compliance
Professional Services
Discusses the increasing importance of alignment with personal beliefs on environmental and diversity issues in job acceptance decisions.
environmental responsibility, diversity views, job acceptance, employee beliefs, corporate values, DEI, sustainability
false
Employees now rank compensation and flexibility as most important workplace factors>50% would decline a job if the company did not have same environmental/ diversity views, especially important over the last yearInvesting to Win Talent
Multiple Chart
BCG
View slide
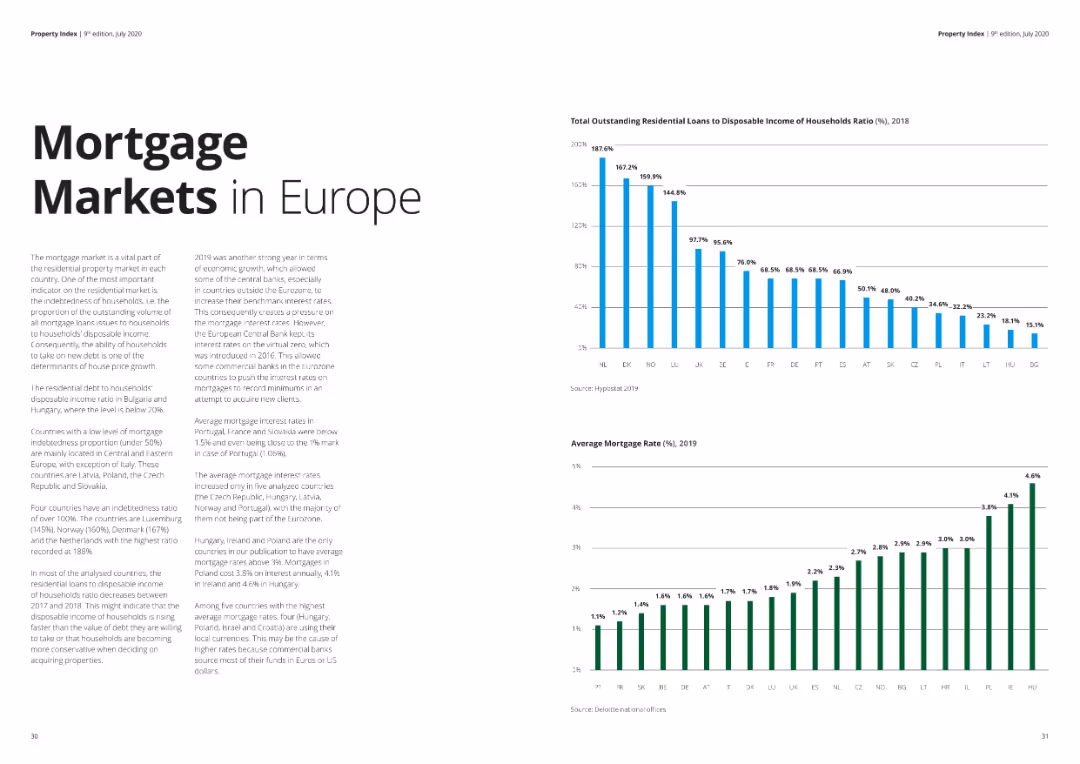
Two column charts: one showing the ratio of outstanding residential loans to household disposable income, another showing mortgage rates.
Market Analysis and Trends
Financial Services
The slide provides data on residential mortgage loans' burden on household income and the average mortgage rates across Europe.
mortgage market, residential loans, household income, mortgage rates, Europe, financial analysis
false
Mortgage Markets in EuropeProperty Index Overview of European Residential Markets
Multiple Chart
Deloitte
View slide
Slide includes a timeline chart tracking technology development from 1950 to 2020, alongside cost comparisons for key technologies like drones and solar energy.
Technology and Digital Transformation
Technology & Software
Explores how combinatory technological advancements have accelerated innovation, with specific examples of technology cost reductions.
technology impact, digital revolution, innovation acceleration, cost reduction, drones, solar energy, technological advancements
false
THE COMBINATORIAL EFFECTS OF TECHNOLOGY ARE ACCELERATING CHANGEDigital Transformation Initiative In collaboration with Accenture
Mixed Chart
Accenture
View slide
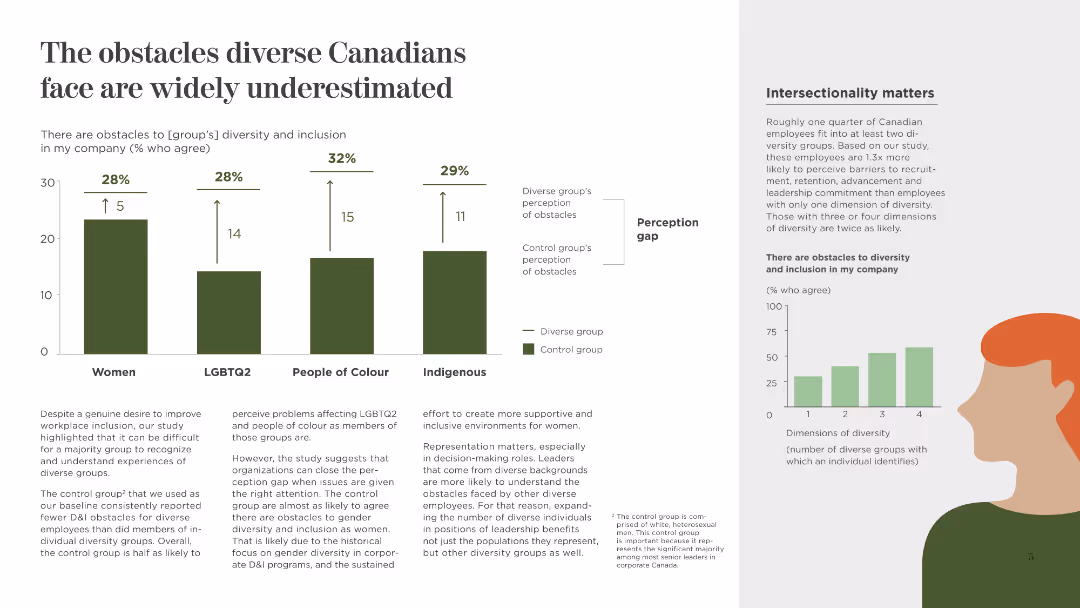
This slide includes a column chart with percentages and a perception gap analysis, using contrasting colors to highlight the differences. It has a moderate density of text and visuals.
Human Resources and Talent Management
Government & Public Sector
The slide focuses on the perception gaps between diverse groups and the control group regarding workplace obstacles, emphasizing the need for better recognition and support for diversity.
Perception Gap, Diversity, Workplace, Recognition, Support, Women, LGBTQ2, People of Colour, Indigenous
false
The obstacles diverse Canadians face are widely underestimatedBeyond good intentions
Multiple Chart
BCG
View slide
Bar chart with response categories about authorized entry routes and corresponding support levels
Regulatory and Compliance
Government & Public Sector
The slide assesses global support for refugee entry methods. While 36% believe existing authorized routes are enough, 31% support expanding legal pathways. A smaller portion (14%) oppose providing any authorized routes. Results show divided views on refugee entry legality.
entry routes, refugee policy, legal migration, Ipsos, global average, access, support levels
false
Q. Which of these statements, if any, do you most agree with regarding refugees’ routes of entry into [COUNTRY]?WORLD REFUGEE DAY
Mixed Chart
IPSOS
View slide
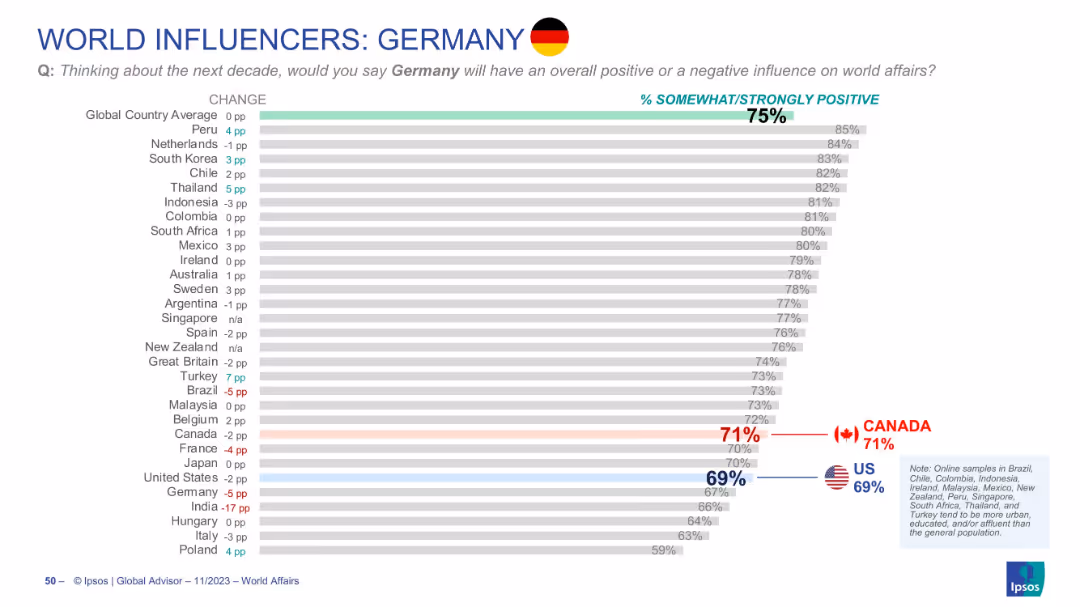
Bar chart with countries’ ratings of Germany's influence; Canada and U.S. shown with red and blue callouts
Market Analysis and Trends
Government & Public Sector
Measures how positively countries view Germany’s future influence. Germany averages 75% globally. Canada (71%) rates Germany above the U.S. (69%). Changes from prior year are also noted for each country.
Germany, influence, global perception, Canada view, US view, Ipsos, bar chart, world affairs, opinion trends, soft power
false
WORLD INFLUENCERS: GERMANY 🇩🇪WORLD AFFAIRS 2023
Single Chart
IPSOS
View slide
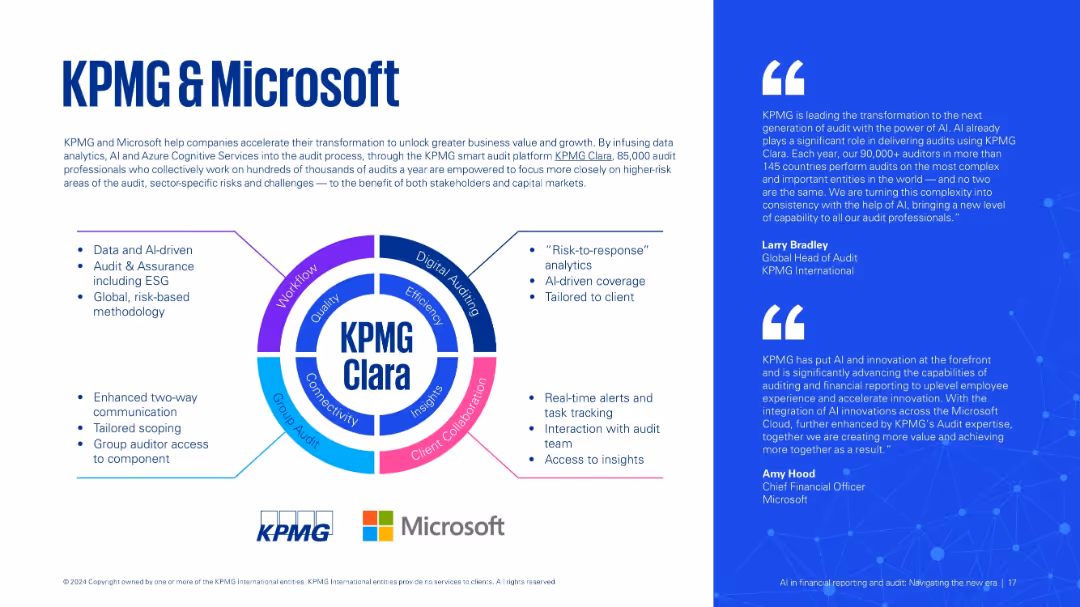
Three-part layout: left with bullet points, center circular infographic labeled "KPMG Clara", right with testimonials. Bright and engaging design.
Strategic Planning
Technology & Software
Describes the KPMG-Microsoft collaboration for AI-powered auditing via the KPMG Clara platform. Focuses on AI-driven insights, real-time tracking, and enhanced communication in audits.
KPMG Clara, Microsoft, audit technology, AI platform, collaboration, data insights
false
KPMG & MicrosoftAI infinancial reporting and audit: Navigating the new era
Boxed
KPMG
View slide
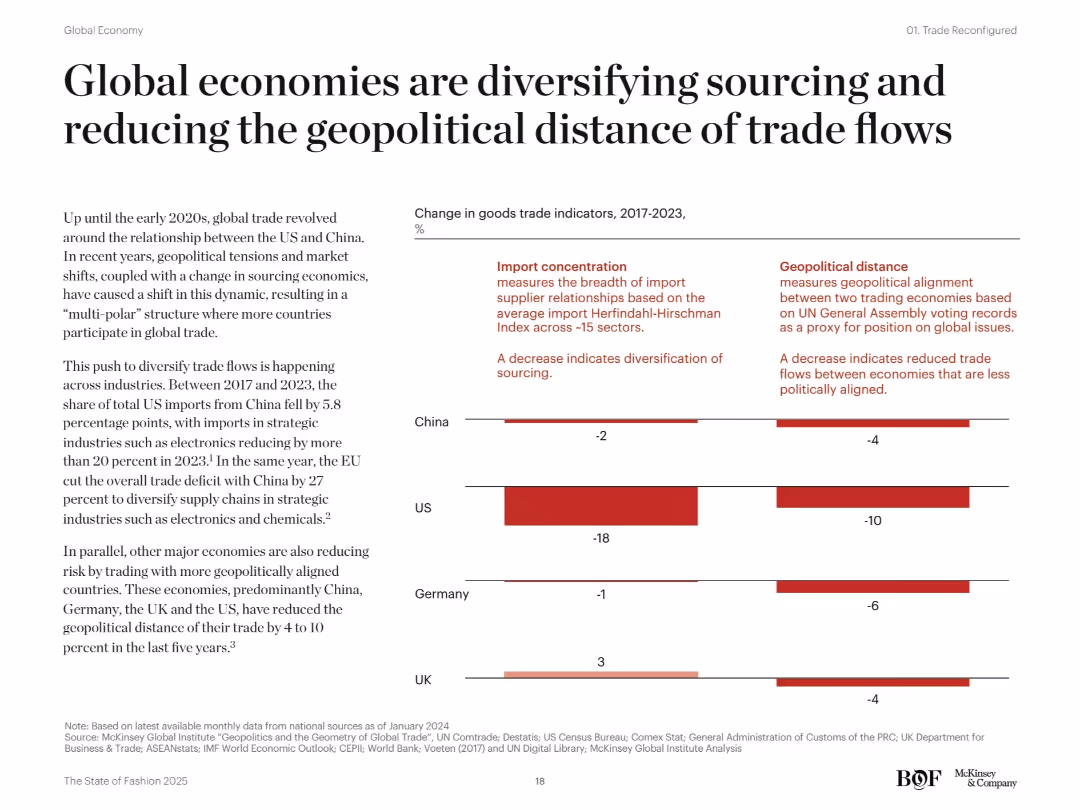
Two-column layout with left-aligned narrative text and a right-side bar chart comparing trade changes across countries (China, US, Germany, UK). Red color-coded bars and labeled metrics.
Market Analysis and Trends
Professional Services
The slide discusses the shift from US-China centric trade to a more diversified and geopolitically aligned global trade structure from 2017 to 2023. It highlights reduced import concentration and geopolitical distance in major economies, emphasizing strategic diversification in sourcing, especially for electronics and chemicals.
global trade, geopolitical distance, import concentration, China, US, EU, diversification, strategic sourcing, supply chain, trade flows
false
Global economies are diversifying sourcing and reducing the geopolitical distance of trade flowsThe State of Fashion 2025
Mixed Chart
McKinsey
View slide
Contains two overlapping line graphs tracking the rate changes over time, complemented by a column chart for annual data. The layout is clean with a clear title.
Market Analysis and Trends
Financial Services
Evaluates insurance rate trends over an extended period, highlighting shifts in the market, with a focus on the direct Energy sector. Provides historical data to assess market conditions.
historical data, insurance rates, market analysis, energy sector, trends
false
What does this look like over a longer period?Lloyd’s and Bermuda
Mixed Chart
PwC/Strategy&
View slide
This slide features graphics showing digital solutions like e-wallet and self-setup for collections, with icons and diagrams that illustrate the flow of operations and processes.
Operational Efficiency
Financial Services
Describes solutions to improve Limpa Nome's collection process, including e-wallet integrations and self-setup modules to expedite and streamline operations.
Digital solutions, e-wallet, finance
false
E-wallet and Self Setup provide solutions to these issues and complete the journey of collection digitisationBarclays Global Credit Bureau Forum
Linear Flow
Barclays
View slide
Highlights the benefits of blockchain through icons and short texts divided into two sections: increased revenue and decreased costs, each listing examples of business benefits like tokenization and transparency.
Technology and Digital Transformation
Financial Services
Examines how blockchain technology can drive business benefits by increasing revenue through authenticity and efficiency, and reducing costs by improving transparency and security. Suitable for business strategy development.
blockchain, business benefits, revenue, costs, efficiency, security
false
Blockchain can add value through driving increased revenue and reducing costsBlockchain and Digital Assets
Diagram
McKinsey
View slide
The slide features three charts: a line chart of the US manufacturing PMI subindexes, a line chart of the Global supply chain pressure index, and a line chart of the Global trade openness index. The layout is clean and uses a consistent blue and white color scheme.
Risk Assessment and Management
Transportation & Logistics
The slide highlights global supply chain vulnerabilities due to pandemic disruptions, geopolitical tensions, and increased international fragmentation, supported by data on US manufacturing PMI, global supply chain pressure, and trade openness.
supply chain, pandemic, geopolitical, fragmentation, trade
false
Supply: Pandemic disruptions, geopolitical tensions, and increased international fragmentation have brought to light global supply chain vulnerabilities2023 Global Macroeconomic Outlook
Multiple Chart
EY
View slide
The slide includes two column charts: one for developed market local interest rates and one for emerging market local interest rates, comparing current rates with rates from the prior year.
Market Analysis and Trends
Financial Services
This slide examines the local interest rates for sovereign currencies in developed and emerging markets, providing a comparative analysis of current and previous year rates.
local interest rates, sovereign currencies, developed markets, emerging markets, analysis
false
Local Sovereign Currency Yields Developed Market Local Interest Rates % (1 Year)Monthly Market Monitor November 2023
Multiple Chart
Morgan Stanley
View slide
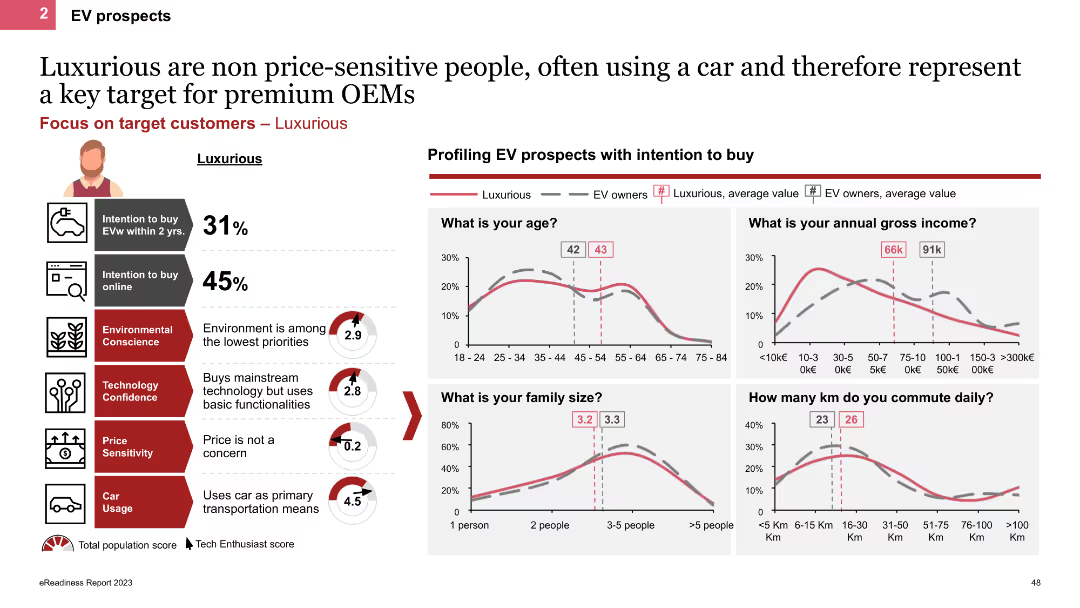
The slide profiles Luxurious personas using line charts and icons, showing demographic details like age, income, and family size. It highlights their high car usage and low price sensitivity, with charts comparing their characteristics to other EV owners.
Customer and Market Segmentation
Transportation & Logistics
This slide describes Luxurious personas, emphasizing their high income, frequent car usage, and lack of price sensitivity. It provides demographic comparisons and insights into their EV purchase behaviors and preferences.
EV prospects, Luxurious, line charts, demographics, high income
false
Luxurious are non price-sensitive people, often using a car and therefore represent a key target for premium OEMs4th edition eReadiness 2023
Multiple Chart
PwC/Strategy&
View slide
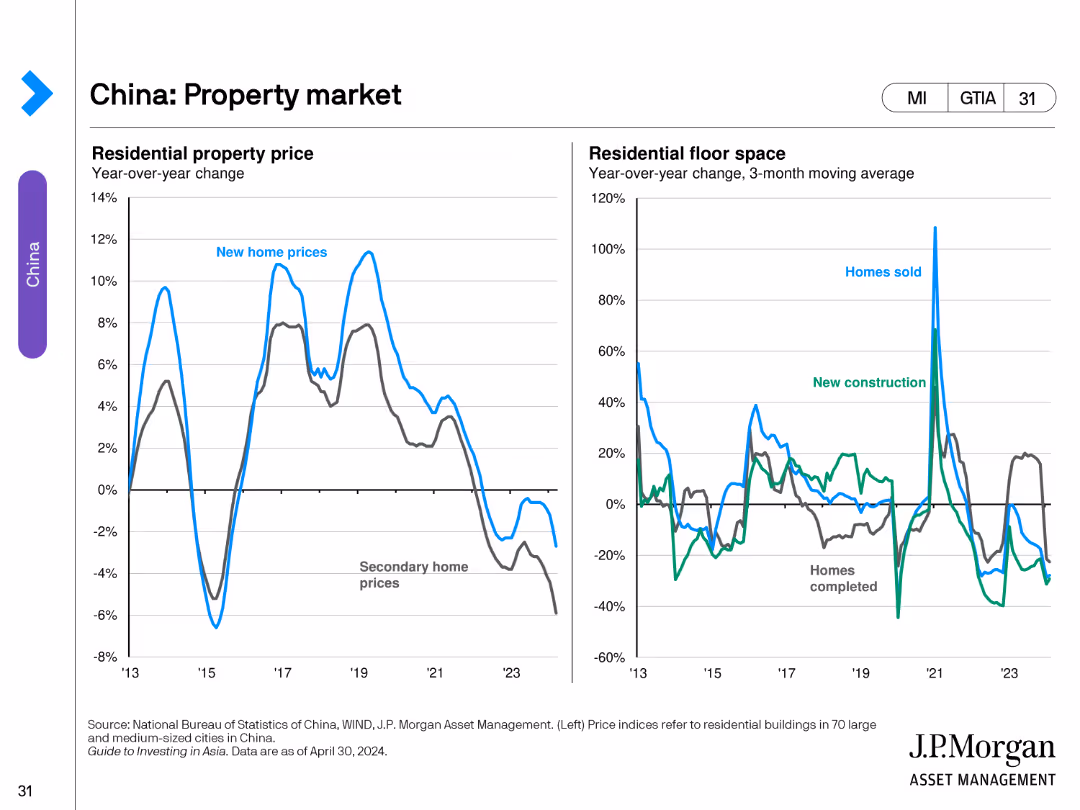
The slide includes two line charts. The left chart shows year-over-year changes in residential property prices. The right chart illustrates year-over-year changes in residential floor space for homes sold and new constructions.
Market Analysis and Trends
Real Estate & Construction
This slide evaluates the property market in China, analyzing trends in residential property prices and residential floor space changes.
Property, Market, China, Prices, Construction
false
China: Property marketGuide to Investing in Asia
Multiple Chart
JP Morgan
View slide
Map of Europe with market analysis coverage in blue; side panel with text insights
Market Analysis and Trends
Transportation & Logistics
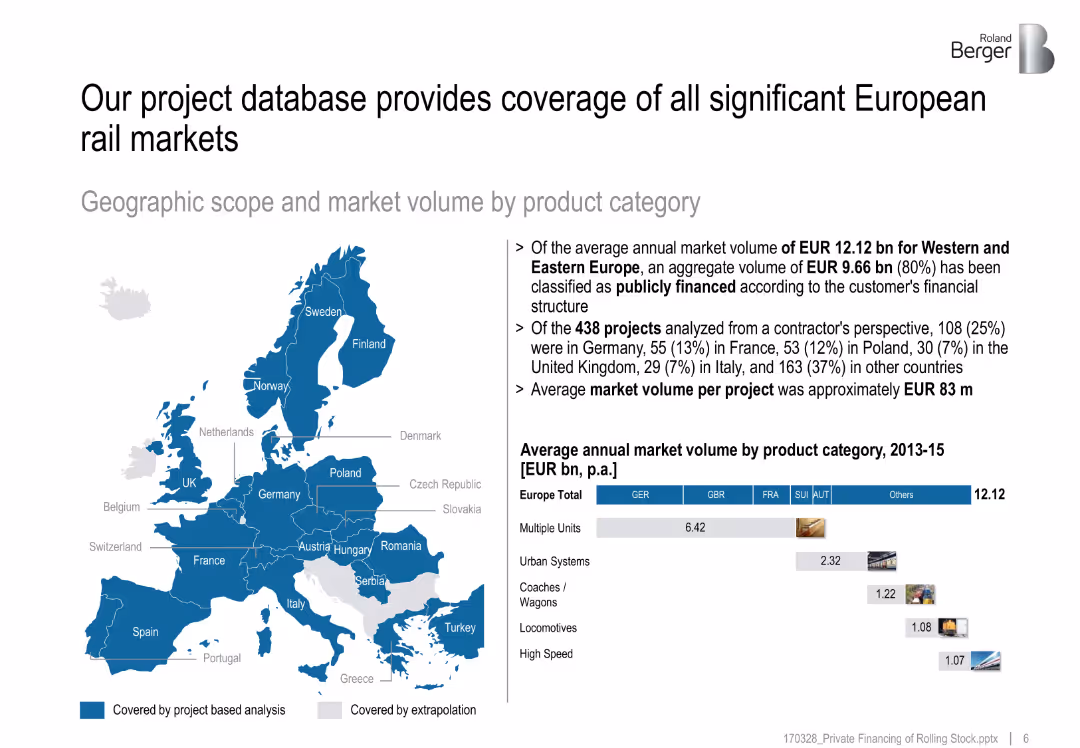
Describes the geographic scope of rail project analysis in Europe, highlighting a market volume of EUR 12.12 bn and top countries by number of analyzed projects.
European rail market, project analysis, market volume, coverage map, public financing
false
Our project database provides coverage of all significant European rail marketsPrivate financing of rolling stock
Multiple Chart
Roland Berger
View slide
Similar design: left-aligned question, right side with bar chart and agree/disagree stats.
Operational Efficiency
Healthcare & Pharmaceuticals
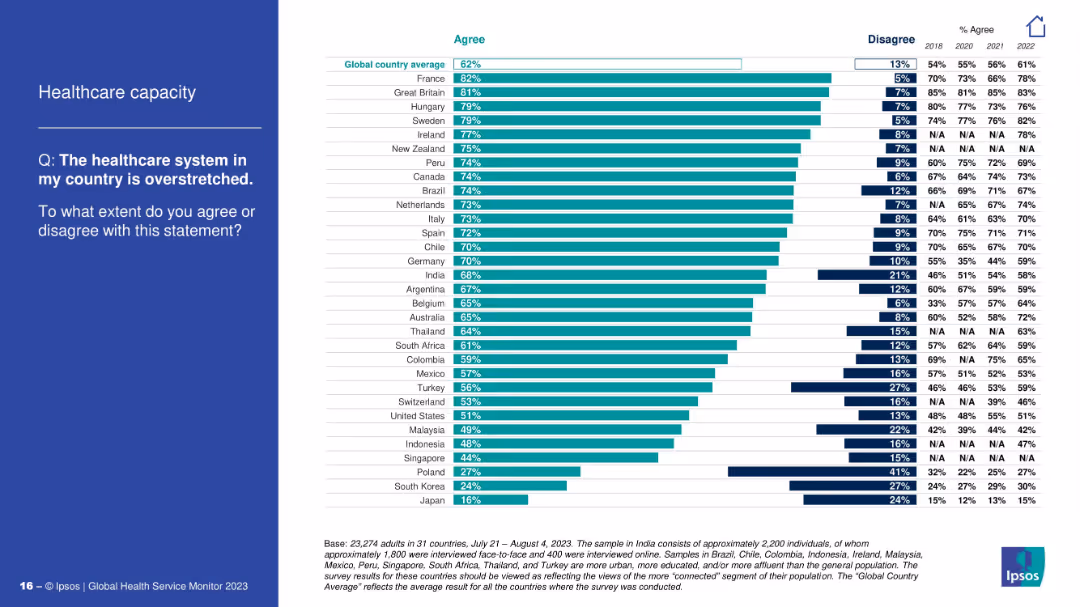
This slide explores how overstretched people perceive their national healthcare systems to be. France and Great Britain have the highest agreement. It tracks opinion shifts since 2018 and identifies which populations feel most strain.
healthcare system, overstretched, survey, operational pressure, Ipsos, public sentiment, capacity, country stats
false
Healthcare capacityIPSOS GLOBAL HEALTH SERVICE MONITOR 2023
Mixed Chart
IPSOS
View slide
Two pie charts illustrating Canadians' knowledge of interest rates, showing the correct response rates and comparisons between 2023 and 2022.
Human Resources and Talent Management
Financial Services
This slide assesses the understanding of interest rates among Canadians, showing the percentage of correct answers and comparing data from 2023 to 2022.
Interest, rate, knowledge, Canadians, 2023, 2022
false
Interest Rate Knowledge 56% of Canadians correctly answered a question about interest rates (higher than in 2022: 52%).CRYPTO ASSET SURVEY 2023
Multiple Chart
IPSOS
View slide
A slide that creatively integrates textual content with imagery, highlighting the company's purpose and core values, alongside an inspiring action shot of an employee.
Strategic Planning
Professional Services
Communicates the company's core values and purpose, linking their aspirations to tangible actions and societal impact.
Purpose, Values, Integrity, Service, Innovation
false
Our Purpose: Empower People to Change the World2022 Environmental, Social, Governance Report
Text Only
Booz Allen Hamilton
View slide
Column chart showing the number of M&A transactions by industrial sector in Mexico from 2013-2023. Sectors are color-coded and detailed in a legend.
Market Analysis and Trends
Financial Services
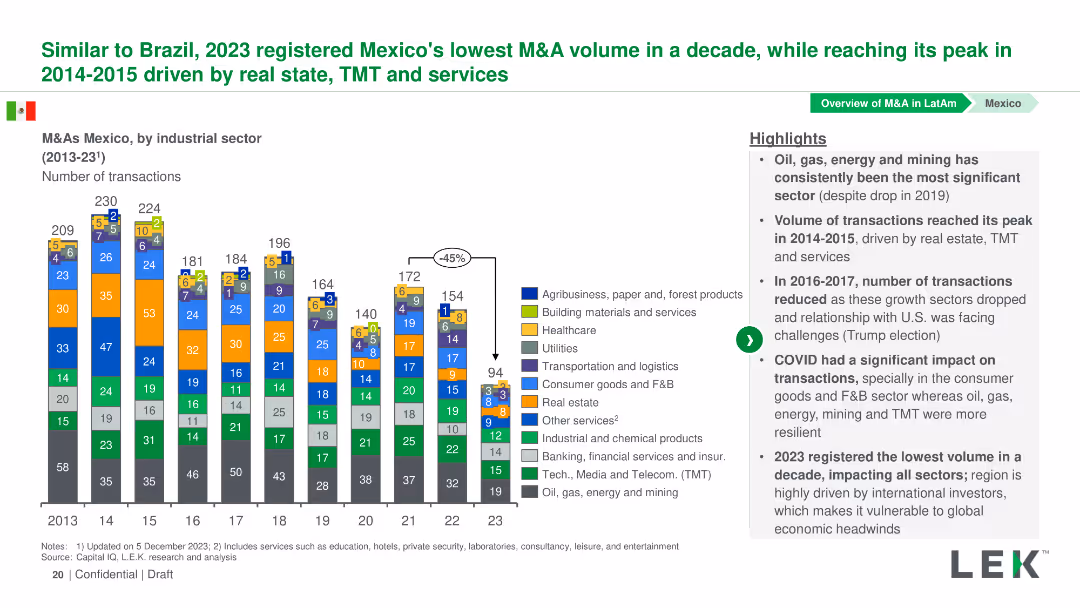
This slide presents the volume of M&A transactions in various industrial sectors in Mexico from 2013-2023, with an analysis of trends and significant changes.
Mexico, M&A, Industrial Sectors, Transactions, Trends
false
Similar to Brazil, 2023 registered Mexico's lowest M&A volume in a decade, while reaching its peak in 2014-2015 driven by real state, TMT and servicesMergers and Acquisitions in LatAm: Evolution and prospects
Mixed Chart
LEK
View slide
Duplicate of slide 18641 but with slight visual formatting changes; layout and content otherwise identical.
Financial Performance
Technology & Software
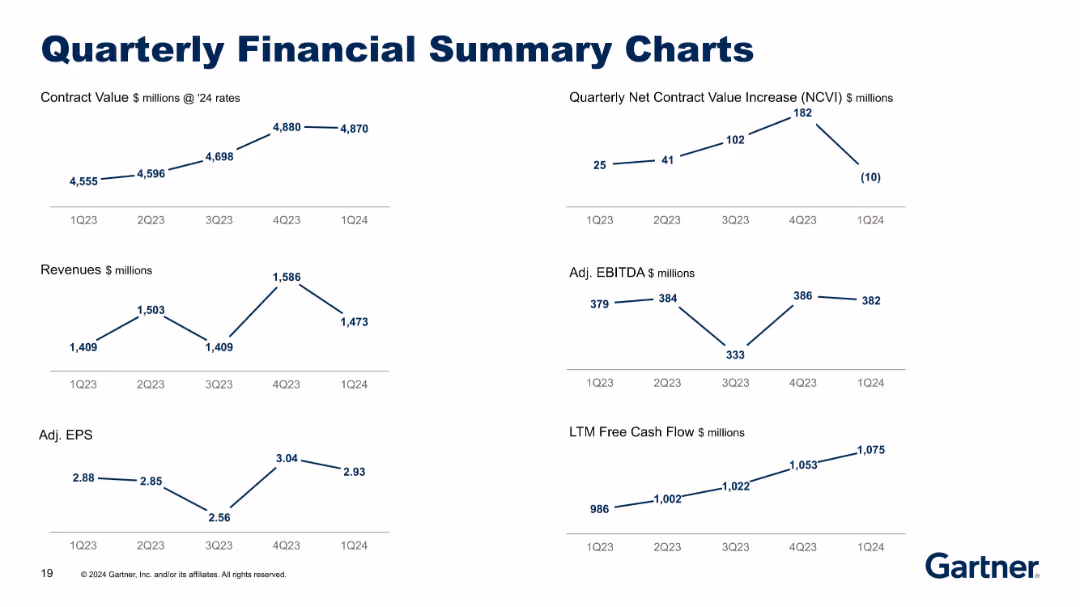
Reiterates financial KPIs from Q1 2023 to Q1 2024, including revenue, contract value, NCVI, EBITDA, EPS, and cash flow. Offers a visual trend summary of quarterly financial evolution using consistent formatting across metrics.
financial summary, contract value, EBITDA, EPS, revenue, quarterly
false
Quarterly Financial Summary ChartsFirst Quarter 2024 Results
Multiple Chart
Gartner
View slide
Contains a regional breakdown of banking operations in Latin America with performance highlights, using icons and a table format to detail country-specific operations.
Financial Performance
Financial Services
Reviews the profitability of banking operations across Latin America, highlighting key markets and strategic positions in retail and wholesale banking sectors.
Latin America, banking, profitability, operations, strategy
false
$0.9bn PBT from Latin America in FY22*; full banking operations in Mexico, Argentina and Uruguay and wholesale businesses in Brazil and ChileHSBC Mexico Barclays Global Financial Services Conference 2023
Table
Barclays
View slide
The slide contains two process flow diagrams, one for post-combustion and one for pre-combustion CO₂ capture systems. Each diagram uses arrows and text boxes to show process steps.
Technology and Digital Transformation
Energy & Utilities
The slide explains CO₂ capture systems divided into post-combustion and pre-combustion processes, detailing the steps and components involved in each method.
CO₂ capture, post-combustion, pre-combustion, processes, energy, utilities, gas separation, thermal power
false
CO2 capture systems may be classified into four categories (1/2)Carbon Capture Utilization and Storage
Linear Flow
Kearney
View slide
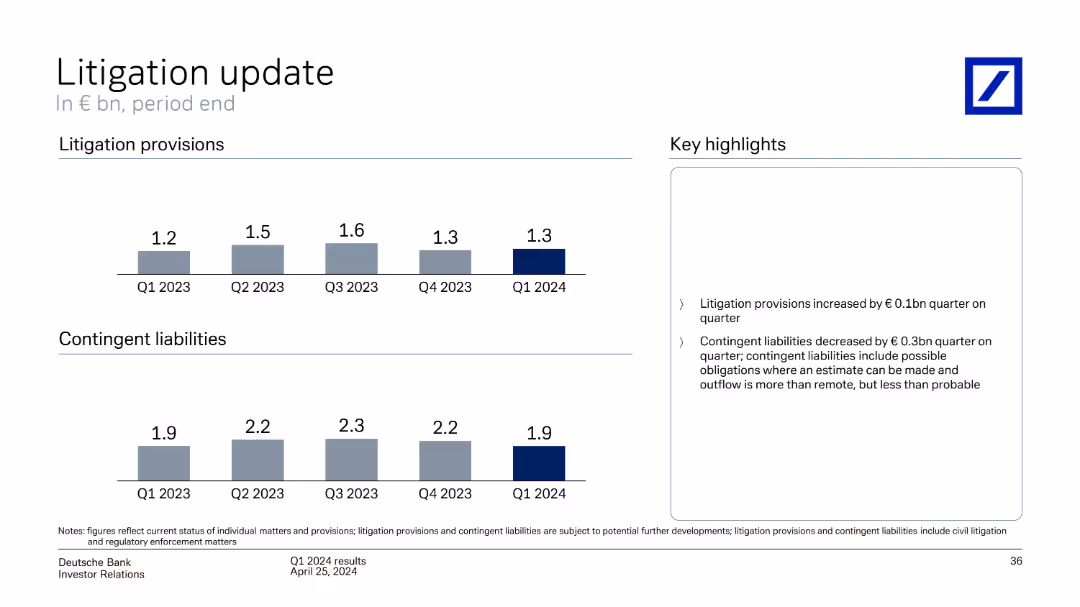
The slide shows two sets of column charts, one for litigation provisions and another for contingent liabilities across different quarters, with a key highlights section.
Risk Assessment and Management
Financial Services
Provides an update on litigation provisions and contingent liabilities over the past five quarters, noting changes and key highlights regarding provisions.
litigation, update, provisions, contingent liabilities, key highlights, risk management
false
Litigation update In € bn, period endQ1 2024 results
Multiple Chart
Deutsche Bank
View slide
A bar chart displaying preferred loan and lease durations for vehicle financing, in shades of blue. Well-organized and easy to interpret.
Financial Performance
Transportation & Logistics
This slide details consumer preferences for the duration of vehicle financing terms, emphasizing a trend towards longer terms for loans and leases to manage monthly payments effectively.
Financing terms, consumer preferences, loan duration, lease duration, financial planning
false
Nearly half of the consumers plan to finance their next vehicle with either a loan or lease contract.2024 Global Automotive Consumer Study
Single Chart
Deloitte
View slide
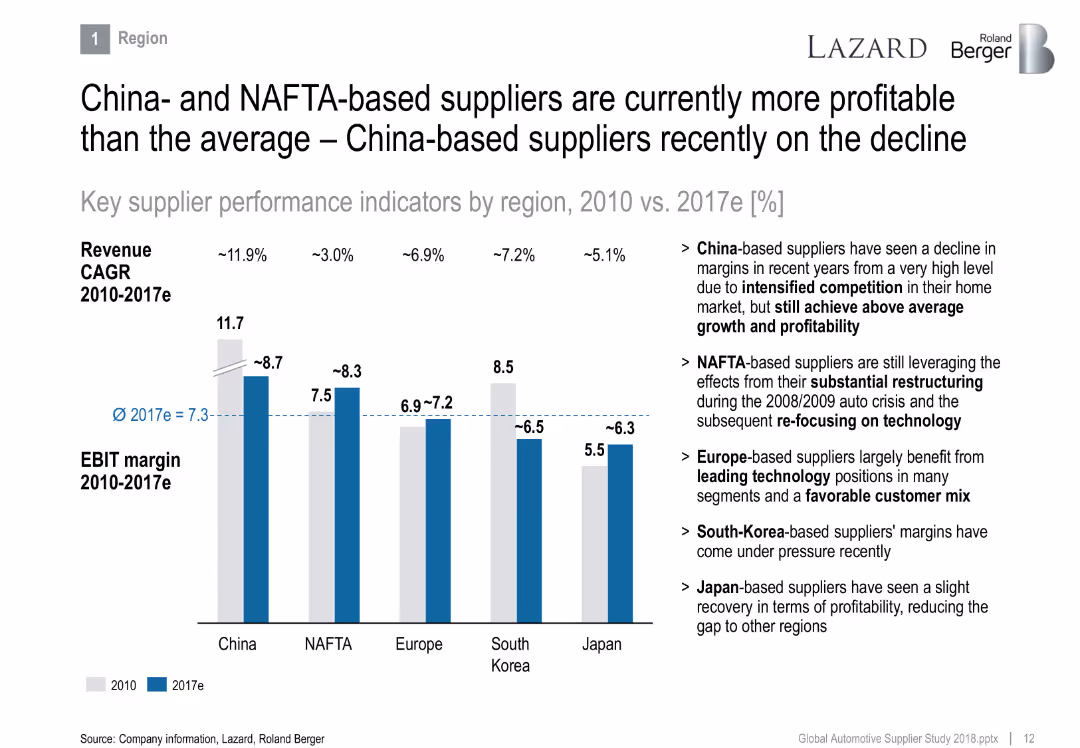
Bar chart comparing EBIT margins and revenue CAGR by region (China, NAFTA, Europe, South Korea, Japan), with explanatory text on the right.
Financial Performance
Industrial & Manufacturing
Compares supplier profitability across global regions from 2010 to 2017e. China and NAFTA regions show higher margins despite challenges, with commentary on competitive dynamics, restructuring effects, and customer mix advantages.
EBIT margin, suppliers, NAFTA, China, profitability, regions, restructuring, competition
false
China- and NAFTA-based suppliers are currently more profitable than the average – China-based suppliers recently on the declineThe overall positive sentiment was also reflected in the supplier valuation levels that still trade above their long-term average
Mixed Chart
Roland Berger
View slide
Depicts a woman and child shopping online, with a bold purple title indicating a focus on COVID-19's impact on retail consumers.
Market Analysis and Trends
Retail & E-commerce
Introduces a report on how COVID-19 has altered consumer behavior, specifically in the retail sector, with data-driven insights.
COVID-19, consumer behavior, retail, market research, data-driven insights, consumer insights
false
How is COVID-19 changing the retail consumer?How is COVID-19 changing the retail consumer?
Title
Accenture
View slide
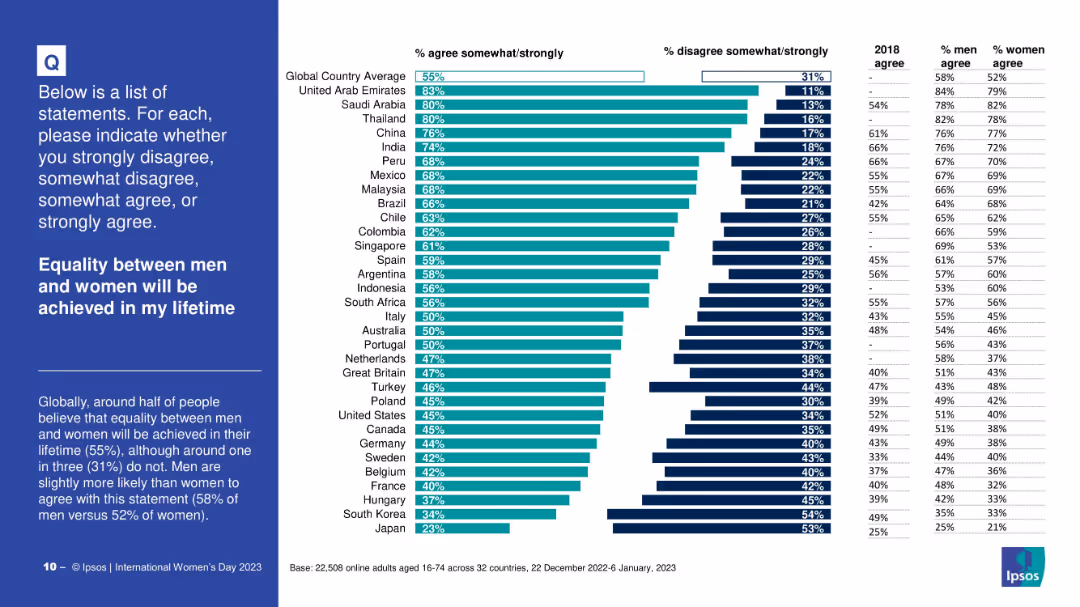
Country-ranked bar chart of % agreeing; includes gender breakdown and historical context.
Human Resources and Talent Management
Government & Public Sector
Depicts belief levels by country on achieving gender equality within one’s lifetime; men generally express more optimism than women.
gender equality timeline, optimism, future vision, gender differences, international comparison, Ipsos
false
Equality between men and women will be achieved in my lifetimeINTERNATIONAL WOMEN'S DAY 2023
Mixed Chart
IPSOS
View slide
The slide shows a balanced layout with text on the left and related hexagonal icons on the right. It details investment approaches like "Equity," "Debt," and "Tax Credit Equity," with impacts such as "Sustainable Transport" and "Communities."
Investment Analysis
Government & Public Sector
This slide is about Goldman Sachs' Urban Investment Group and its commitment to creating commercial opportunities within communities. It is useful for presentations related to urban development, community engagement, and investment impacts on education and sustainable transport.
urban investment, Goldman Sachs, community, sustainability, finance
false
Urban Investment GroupGoldman Sachs Investor Day
Table
Goldman Sachs
View slide
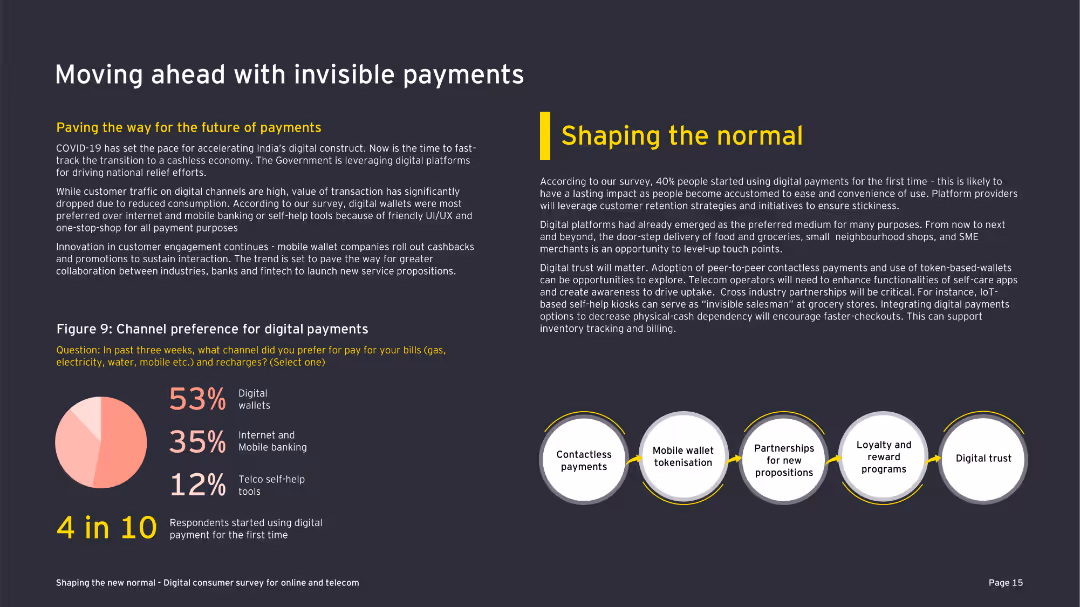
This slide includes a diagram illustrating eight forces influencing consumer behavior, supported by text explanations. The layout is visually complex.
Market Analysis and Trends
Telecommunications
The slide identifies eight key factors shaping the future of consumer behavior in the telecom sector, highlighting driving and restraining forces.
consumer trends, future consumer, telecom, influencing factors, COVID-19, digital adoption, connectivity, technology integration, behavior
false
Moving ahead with invisible paymentsShaping the new normal Digital consumer survey for online and telecom
Mixed Chart
EY
View slide
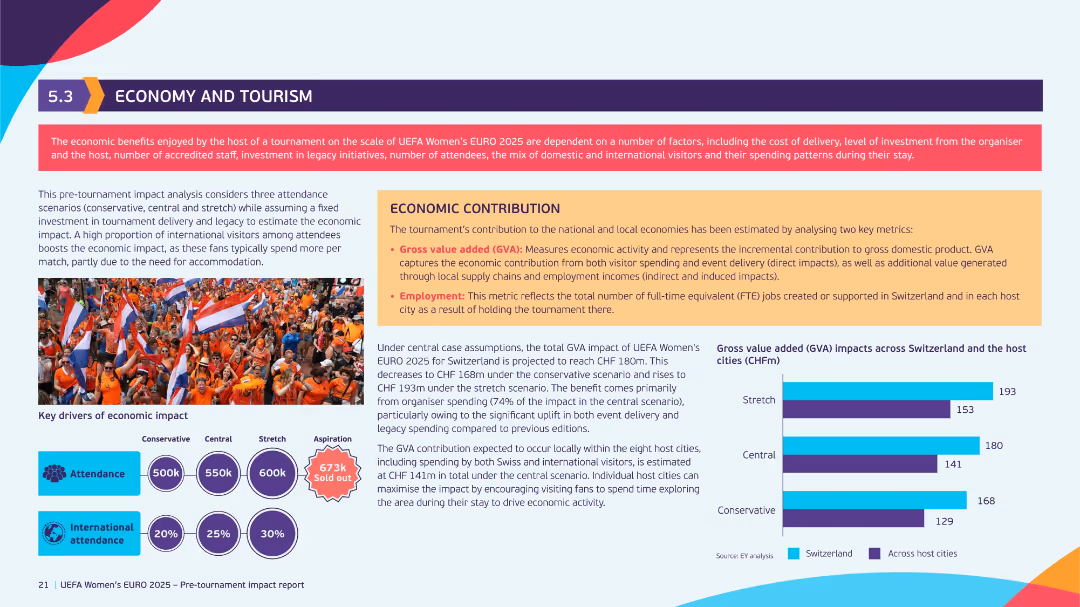
Orange-accented layout with left column on attendance forecasts and right column on economic contribution. Contains bar chart on Gross Value Added (GVA) and colorful infographics.
Investment Analysis
Hospitality & Tourism
This slide assesses the projected economic impact of UEFA Women’s EURO 2025 on Switzerland. It estimates GVA based on three attendance scenarios and outlines benefits including job creation and increased tourist spending. Visuals highlight key economic drivers.
economic impact, tourism, GVA, UEFA, employment, spending patterns, host cities
false
ECONOMY AND TOURISMAPPROACHING THE SUMMIT
Mixed Chart
EY
View slide
The slide features diagrams of powertrain architectures for H2 Internal Combustion Engines, Fuel Cell Electric Vehicles, and Battery Electric Vehicles.
Technology and Digital Transformation
Transportation & Logistics
Explores the main architectures for decarbonizing mobility, comparing H2 ICE, FCEV, and BEV in terms of energy storage, conversion, and power generation.
H2 ICE, FCEV, BEV, powertrain architecture, mobility, decarbonization, energy storage, conversion, power generation
false
To decarbonize mobility, three main architecture are considered: H 2 Internal Combustion Engines, Fuel Cell Electric Vehicles & Battery Electric VehiclesRoland Berger views on H2 market development
Table
Roland Berger
View slide
Contains column charts, textual information, and bullet points highlighting key metrics, with a dashed outline box.
Financial Performance
Financial Services
Slide shows strong performance and inflows in asset and wealth management, with a focus on alternatives fundraising surpassing targets. Likely used in investor relations or financial strategy meetings.
Fundraising, Asset Management, Performance, Inflows
false
Asset & Wealth Management: Client experience and investment performance drive inflowsFull Year and Fourth Quarter 2023 Earnings Results Presentation
Mixed Chart
Goldman Sachs
View slide
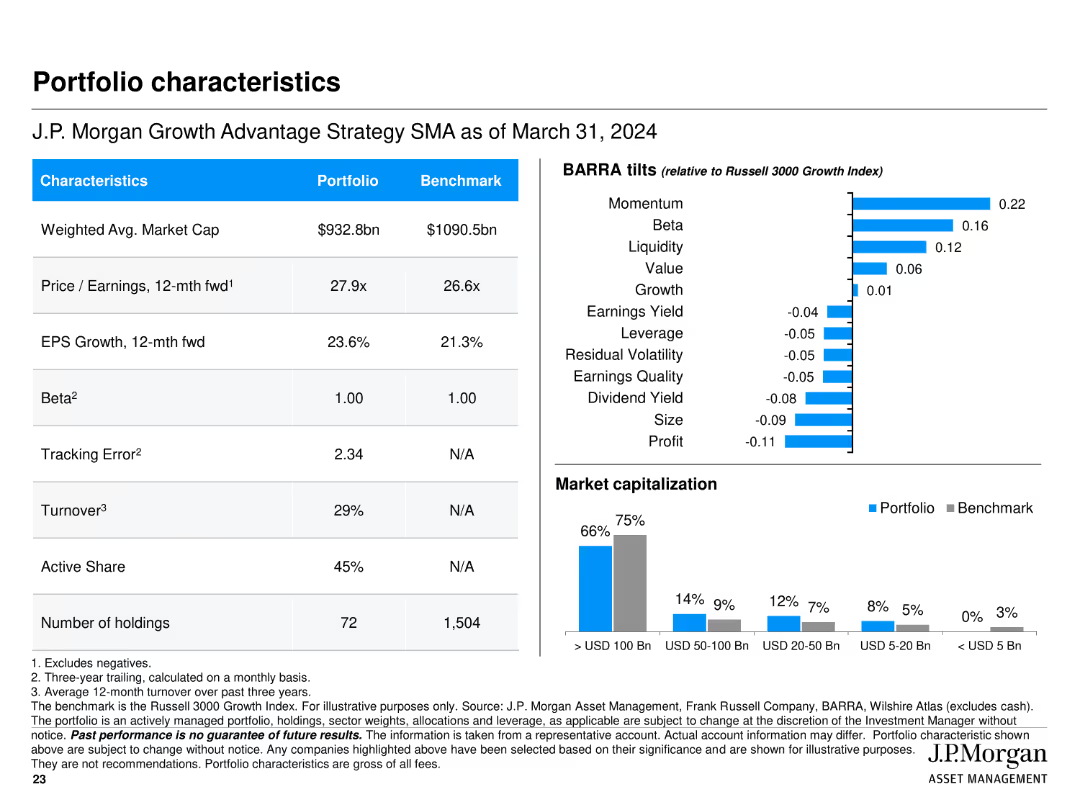
Features multiple tables and bar charts presenting portfolio characteristics such as market cap, P/E ratio, EPS growth, BARRA tilts, and market capitalization breakdown.
Financial Performance
Financial Services
Summarizes key characteristics of J.P. Morgan Growth Advantage Strategy, including market cap, P/E ratio, and EPS growth, along with comparisons to the benchmark.
portfolio, characteristics, market cap, P/E ratio, EPS growth, bar chart, table
false
Portfolio characteristics J.P. Morgan Growth Advantage Strategy SMA as of March 31, 2024J.P. Morgan Growth Advantage Strategy
Multiple Chart
JP Morgan
View slide
The slide features a large column chart on the left, a central section with color-coded contributing factors, and a final column chart on the right, providing a clear comparison of overhead ratios over time.
Operational Efficiency
Financial Services
Demonstrates the improvement in the overhead ratio at JPMorgan Chase & Co., driven by various factors, meant for showcasing efficiency gains to investors.
overhead ratio, efficiency, revenue growth, JPMorgan, investment, expense
false
Overhead ratio – significant improvement driven by revenue growth and expense efficienciesFIRM OVERVIEW 2020
Single Chart
JP Morgan
View slide
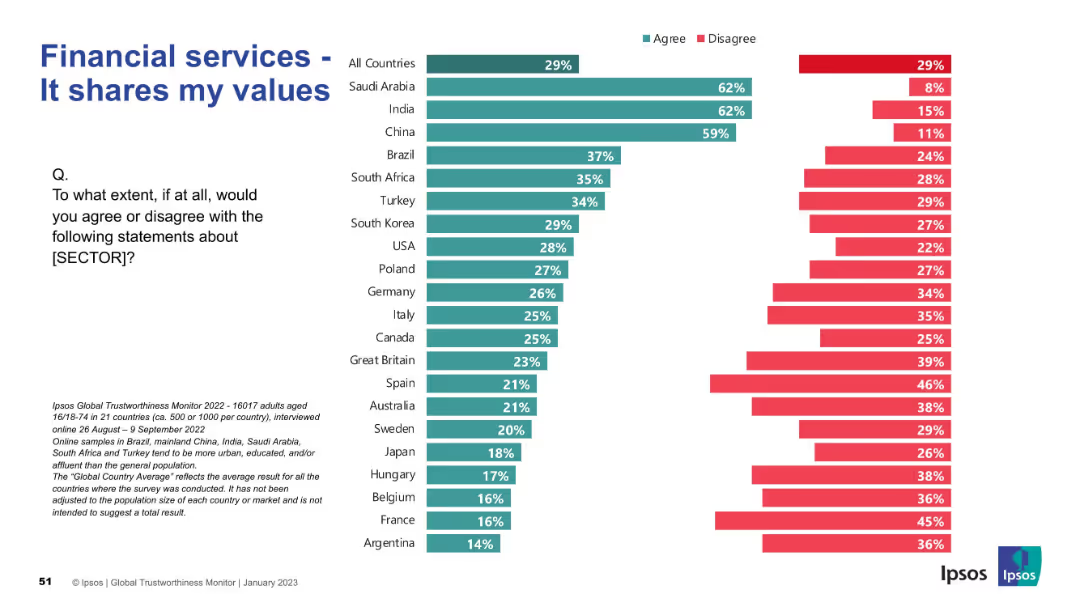
Visual layout consistent with others; stacked bar chart across countries
Customer and Market Segmentation
Financial Services
This slide evaluates alignment of financial services with personal values. High agreement in Saudi Arabia, India, and China contrasts with low agreement in Western countries. Public sentiment varies significantly by region.
values, alignment, customer perception, trust, Ipsos, segmentation, public opinion, financial services
false
Financial services - It shares my valuesIPSOS GLOBAL TRUSTWORTHINESS MONITOR January 2023
Mixed Chart
IPSOS
View slide
Horizontal segmented bar chart on right with varying levels of agreement by country; includes historical comparison columns.
Strategic Planning
Government & Public Sector
This slide measures agreement with the notion that rule-breaking leadership may be necessary for reform. At 49% globally, it's a polarizing concept with wide variation—Thailand and India show high agreement while countries like Germany show low support. The data implies a divide in how reform and leadership style are viewed globally.
rule-breaking, leadership, reform, governance, authoritarianism, Ipsos, public opinion
false
To fix [Country], we need a strong leader willing to break the rulesIPSOS POPULISM SURVEY
Mixed Chart
IPSOS
View slide
Two charts: a bar chart on the left comparing fixed and variable compensation across countries, and a scatter plot on the right showing the relationship between total compensation and fixed compensation percentage.
Market Analysis and Trends
Financial Services
This slide shows how fixed and variable compensation differs for senior executives in various countries, emphasizing that North America tends to have higher variable compensation while other regions favor fixed elements.
Compensation, Fixed, Variable, Markets, Executives
false
For senior executives, the balance between fixed and variable compensation varies significantly across marketsExecutive Compensation at Deloitte Delivering global insight and expertise
Multiple Chart
Deloitte
View slide
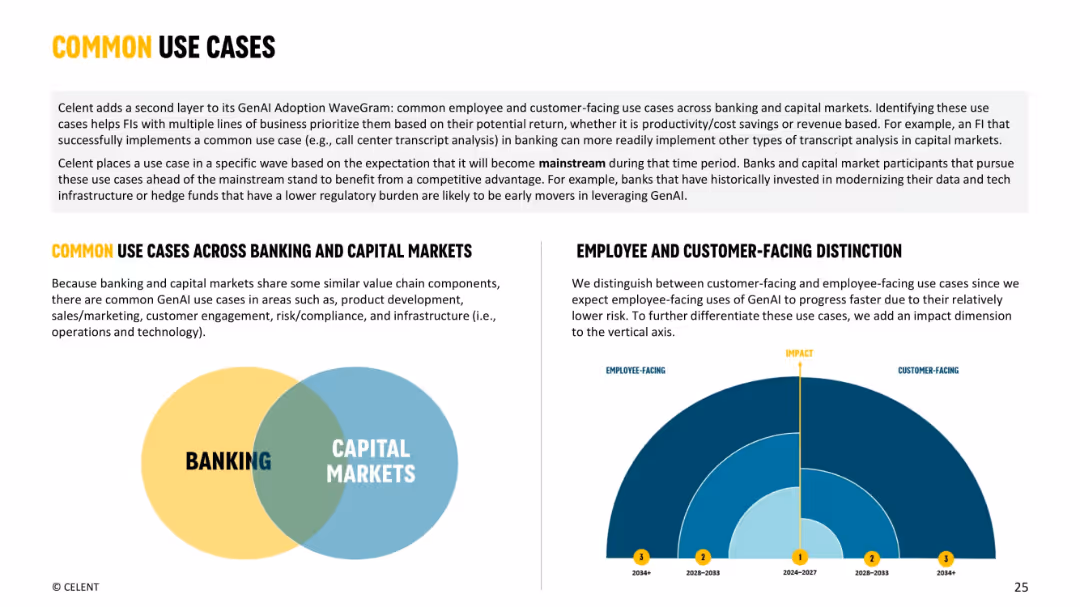
Clean, two-column layout with Venn diagram (Banking & Capital Markets) and semi-circular impact axis (employee vs. customer facing) repeated from slide 1. Uses bold yellow for headings and black for text.
Industry Overview
Financial Services
Highlights common GenAI use cases across banking and capital markets, stressing shared value chain elements and the importance of early GenAI adoption. Describes the wave-based framework and the importance of separating customer-facing and employee-facing use cases based on adoption readiness, impact, and risk profile.
common use cases, banking, capital markets, GenAI, impact, segmentation, value chain
false
COMMON USE CASESGenerative AI Making Waves
Mixed Chart
Oliver Wyman
View slide
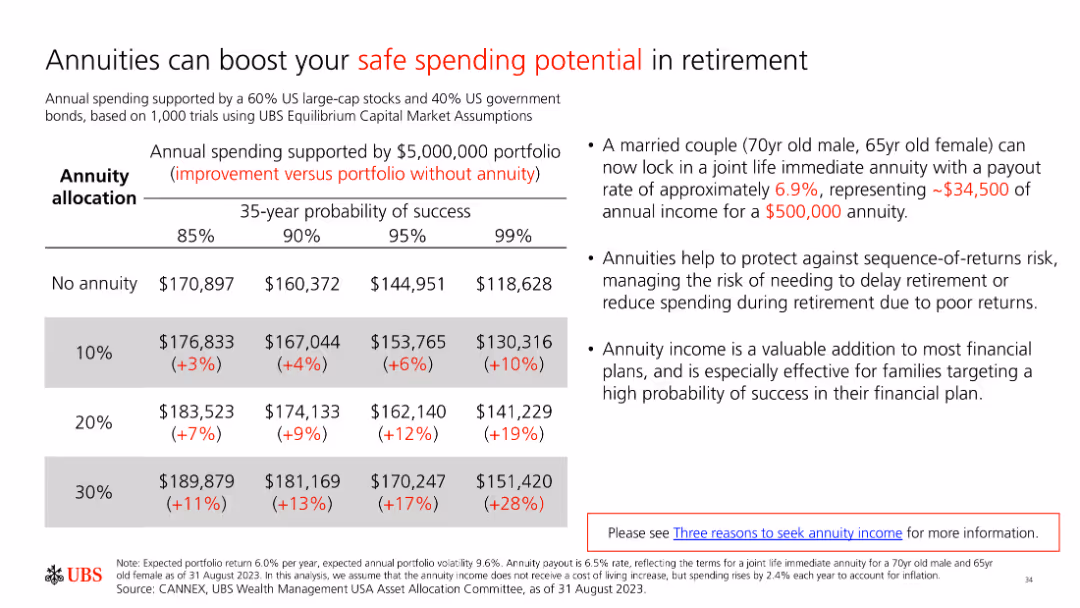
A slide with a table and text explaining how annuities can boost safe spending potential in retirement. The table compares income with and without annuities across different probabilities.
Financial Performance
Financial Services
The slide illustrates the benefits of annuities for enhancing retirement spending potential, using a table to compare income outcomes with and without annuities under various scenarios.
annuities, retirement income, safe spending, financial planning, income stability
false
Annuities can boost your safe spending potential in retirement2024 Retirement guidebook
Table
UBS
View slide
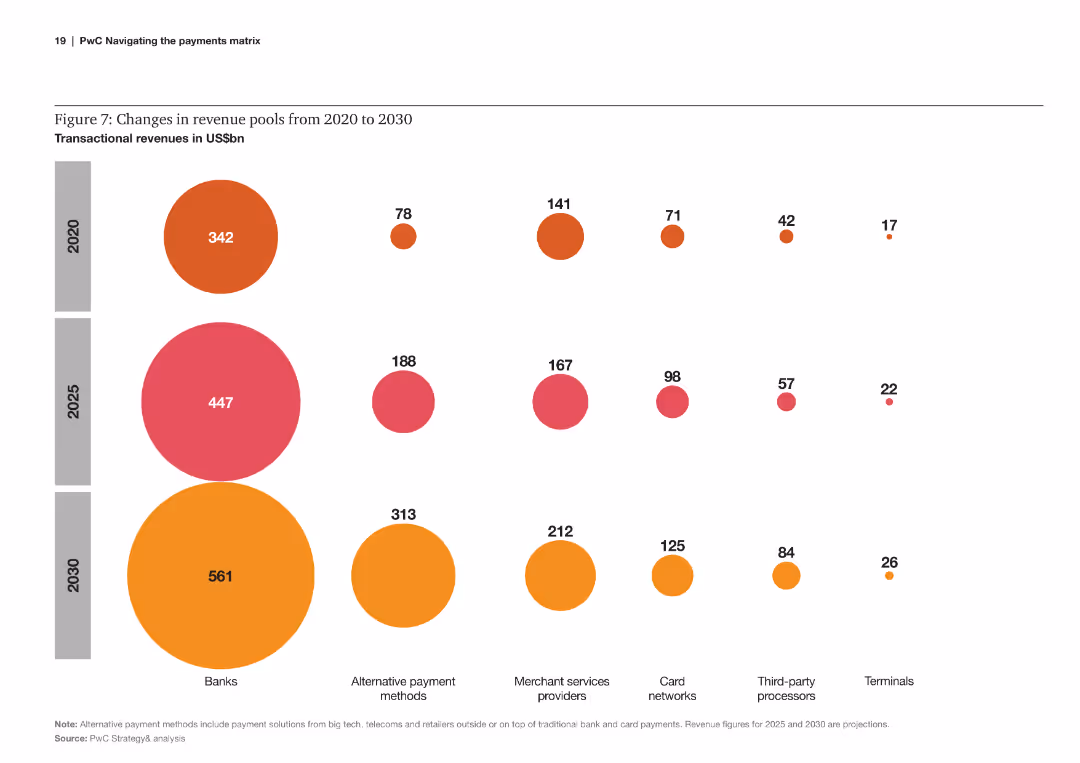
Bubble chart comparing changes in transactional revenues across various payment sectors from 2020 to 2030.
Financial Performance
Financial Services
The slide analyzes the changes in revenue pools within different payment sectors, projecting significant shifts by 2030.
revenue, pools, transactional, changes, payment sectors, 2020, 2030, projections
false
Figure 7: Changes in revenue pools from 2020 to 2030Navigating the payments matrix Charting a course amid evolution and revolution
Multiple Chart
PwC/Strategy&
View slide
Features stacked bar charts comparing centralization of decision support areas between general accounting and strategic support.
Financial Performance
Professional Services
Highlights trends in GBS capability centralization and its impact on decision support effectiveness.
GBS, centralization, capabilities, decision support, trends
false
Which processes to place in the “spokes.”Global Business Services Performance improvement
Mixed Chart
Deloitte
View slide
Full-slide bar chart comparing relative importance of five accelerant categories. Large building image on the left with minimal top-line text. Horizontal bars with yellow and gray sections.
Strategic Planning
Financial Services
This slide conveys the relative importance of five accelerants in creating a world-leading FS hub. Technological infrastructure ranks highest (91%), followed by regulatory frameworks and cross-border trade. It emphasizes prioritization of innovation and legal infrastructure for sector development.
importance, accelerants, FS hub, infrastructure, planning, innovation
false
Survey Results: Relative importance of factors in facilitating the creation of a world-leading financial services hubBuilding a Better Financial Services Ireland: Accelerate to Elevate
Single Chart
EY
View slide
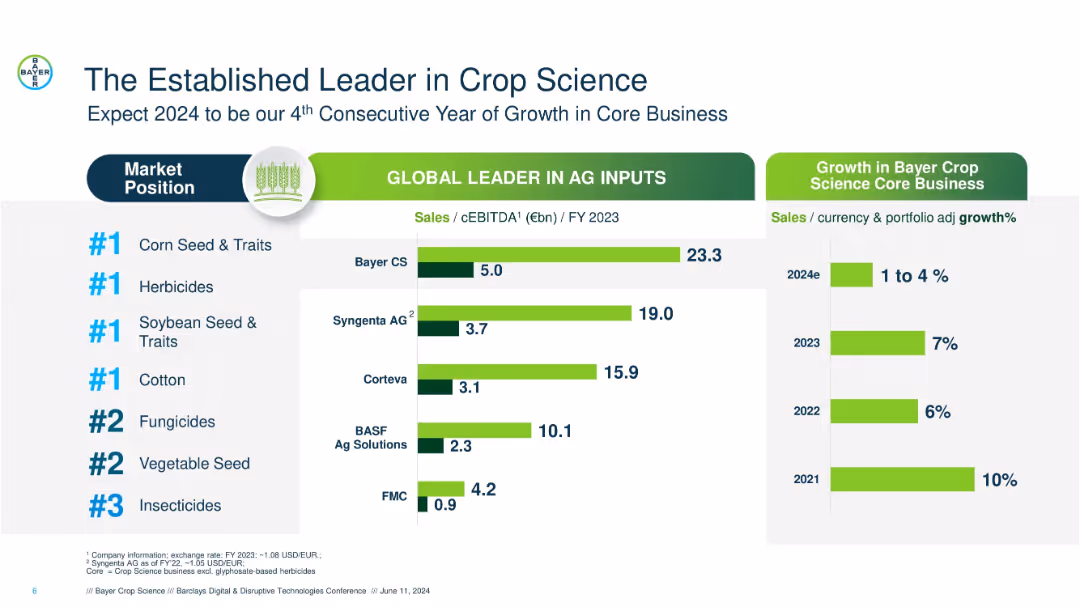
Bar and ranking chart format with green-highlighted bars; left-aligned text, central charts, and minimal icons.
Competitive Landscape
Agriculture & Food Production
Displays Bayer Crop Science’s #1 positions in various crop science segments, compares competitors’ sales and cEBITDA, and shows past and projected growth rates, reinforcing leadership and market confidence.
crop science, market leader, Bayer, Syngenta, growth rate, sales, herbicides, seeds, EBITDA, competitors
false
The Established Leader in Crop ScienceBarclays Digital & Disruptive Technologies Conference
Multiple Chart
Barclays
View slide
Contains bar charts showing the likelihood of quitting by gender, income, generation, and caregiving responsibilities.
Market Analysis and Trends
Professional Services
Discusses the likelihood of employees quitting based on factors like gender, income, generation, and caregiving responsibilities, highlighting differences in flexibility needs.
Likelihood to quit, Gender, Income, Generation, Caregiving responsibilities
false
Additional analysis: Likelihood to quit by gender and income, generation, and caregiving responsibilitiesGlobal Employee Survey - Key findings and implications for ICMIF
Multiple Chart
EY
View slide
The slide includes a title at the top, text on the left, and a column chart on the right, comparing market share growth among all entrants, finalists, and winners.
Financial Performance
Consumer Goods
Discusses market share growth among winners, finalists, and all entrants in a marketing context. Provides data from Effie 2020 entries showing 57% market share growth for winners.
Market Share, Winners, Growth, Marketing, Data
false
Market share gain is most likely to be claimed by winners2020 Effie UK Report • In partnership withIpsos
Mixed Chart
IPSOS
View slide
Diagram with icons representing various economic sectors and interactions. Includes bullet points explaining the model's capabilities and analysis scope.
Strategic Planning
Energy & Utilities
Describes EY's computable general equilibrium model for analyzing economic impacts, detailing its comprehensive regional and sectoral analysis capabilities.
Economic Model, CGE, Industry Impacts, EY, Regional Analysis, Sectoral Analysis, Economic Forecasting
false
Our whole of economy model to examine potential industry impactsThe economic contribution of Western Australia’s oil and gas industry
Diagram
EY
View slide
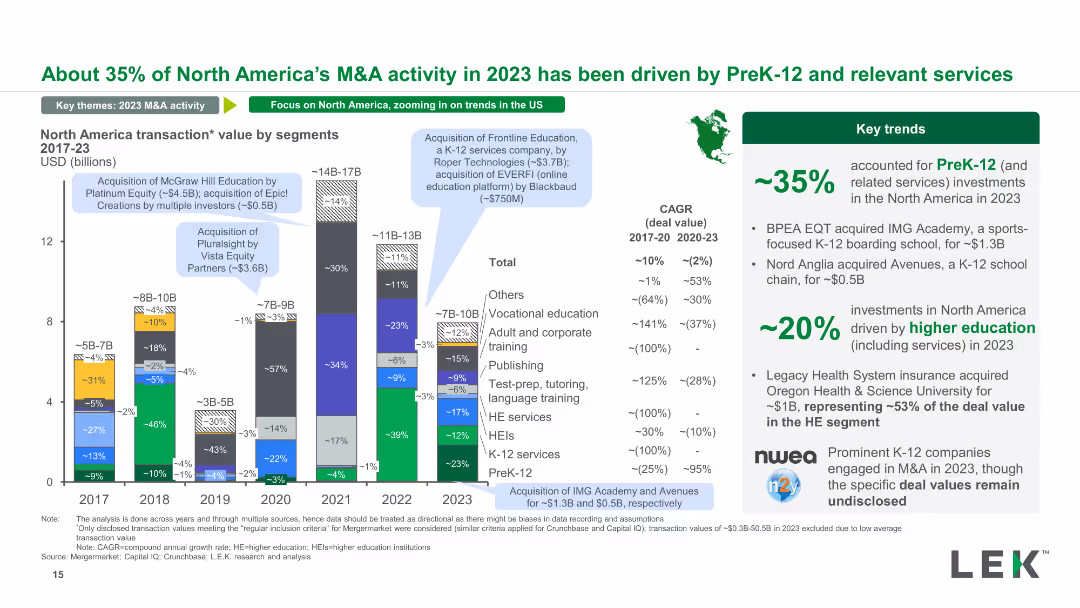
A stacked column chart showing North America's transaction value in education by segments from 2017 to 2023. The chart includes annotations for significant acquisitions and trends in various educational services.
Market Analysis and Trends
Education & Training
This slide provides an overview of North America's transaction values by educational segments, highlighting key transactions and trends within K-12, higher education, and other segments over the years.
North America, transaction value, education segments, major acquisitions, investment trends
false
About 35% of North America’s M&A activity in 2023 has been driven by PreK-12 and relevant servicesEducation: 2023 M&A Deal Roundup and Trends to Watch Out for in 2024
Mixed Chart
LEK
View slide
Contains column charts and pie charts showing the development of assets under management, segmented by asset class over time.
Financial Performance
Financial Services
Reviews the asset management performance, focusing on quarterly growth and composition changes in assets under management.
assets, management, financial, growth, quarterly, asset class, banking, performance
false
Assets under management – Asset Management In € bn, unless stated otherwiseQ2 2023 results
Multiple Chart
Deutsche Bank
View slide
Slide presents bullet points, check marks for progress, and four circular icons with financial figures for different strategic priorities.
Strategic Planning
Financial Services
Communicates strategic priorities and the progress made in different financial sectors, including international expansion and carbon transition.
Strategic Priorities, Financial Sponsors, Capital, International, Carbon Transition, Progress
false
We have made tangible progress on our strategic prioritiesInverstors Day 2023
Table
JP Morgan
View slide
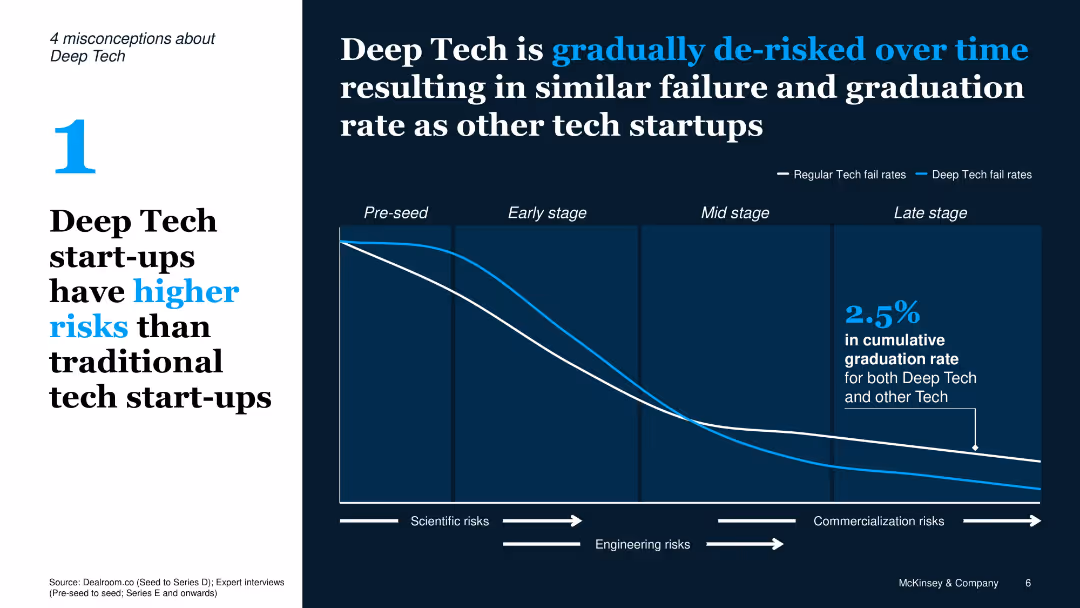
Split layout with misconception text on left and chart on right; line graph comparing fail rates of Deep Tech vs traditional tech over lifecycle stages
Risk Assessment and Management
Artificial Intelligence
Refutes the notion that Deep Tech has higher failure rates by showing it becomes de-risked over time; line graph compares failure rates of tech startups through different stages.
Deep Tech, risks, failure rate, tech lifecycle, de-risked, chart, misconception
false
Deep Tech is gradually de risked over time resulting in similar failure and graduation rate as other tech startupsEuropean Deep Tech – Opportunities and Discoveries
Single Chart
McKinsey
View slide
A complex circular diagram dominates the slide, illustrating the 'source-to-consume' life cycle with icons and text. Surrounding the cycle are boxes detailing megatrends and profiles for producers and consumers.
Investment Analysis
Agriculture & Food Production
This slide offers an intricate look at the agriculture industry's complexity, showing the various players and stages from production to consumption, alongside influential megatrends.
agriculture, industry lifecycle, megatrends, production, consumption, producers, consumers
false
Agriculture industry overviewEY-Parthenon Perspectives: Investing in the agricultural crop industry
Linear Flow
EY
View slide
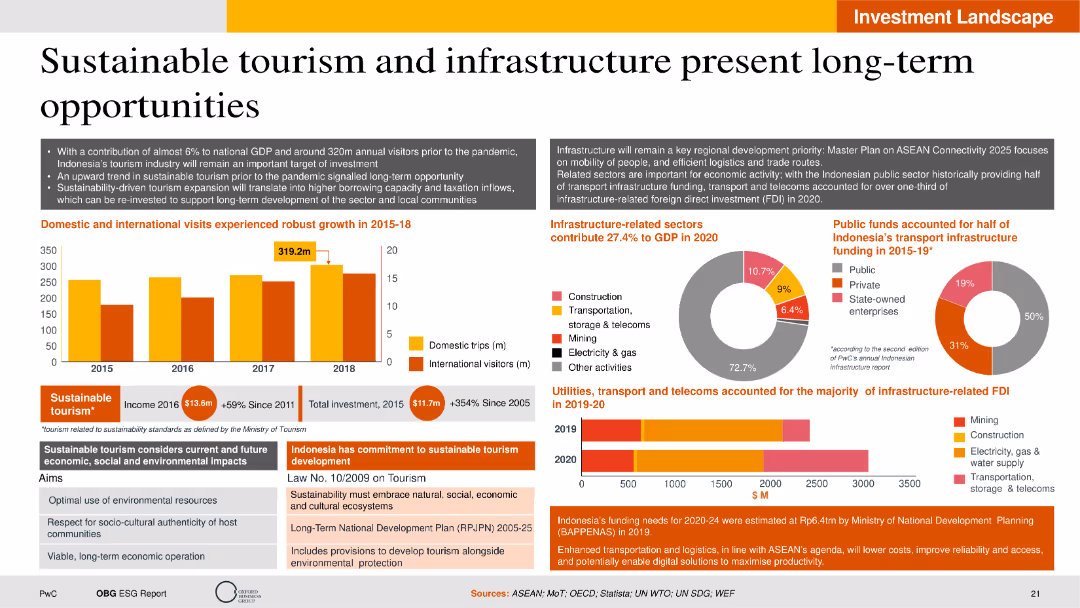
The slide features a combination of column charts, pie charts, and text boxes with a balanced layout. Visual elements highlight domestic and international tourism growth, sector contributions to GDP, and public funding distribution.
Strategic Planning
Hospitality & Tourism
The slide discusses the potential long-term opportunities in sustainable tourism and infrastructure in Indonesia. It presents data on tourism growth, contributions to GDP, and infrastructure-related FDI. The slide also covers Indonesia's commitment to sustainable tourism development, infrastructure-related sector performance, and future investment strategies.
Sustainable tourism, infrastructure, GDP contribution, FDI, development strategy
false
Sustainable tourism and infrastructure present long-term opportunitiesIndonesia’s Sustainable Transformation
Multiple Chart
PwC/Strategy&
View slide
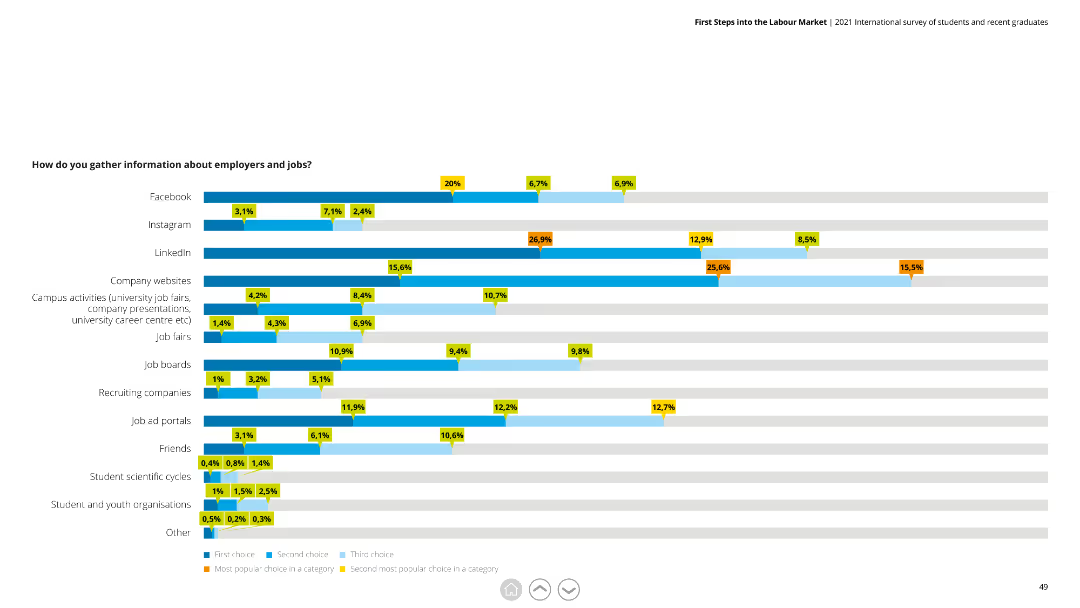
The slide includes a horizontal bar chart displaying different sources used by respondents to gather information about employers and jobs, with categories like Facebook, LinkedIn, and job fairs.
Market Analysis and Trends
Professional Services
The slide shows various sources for job information gathering, highlighting social media platforms and company websites as major sources. It is useful for analyzing job search behaviors.
Job search, information sources, survey, social media, employment
false
How do you gather information about employers and jobs?First Steps into the Labour Market 2021 International survey of students and recent graduates
Single Chart
Deloitte
View slide
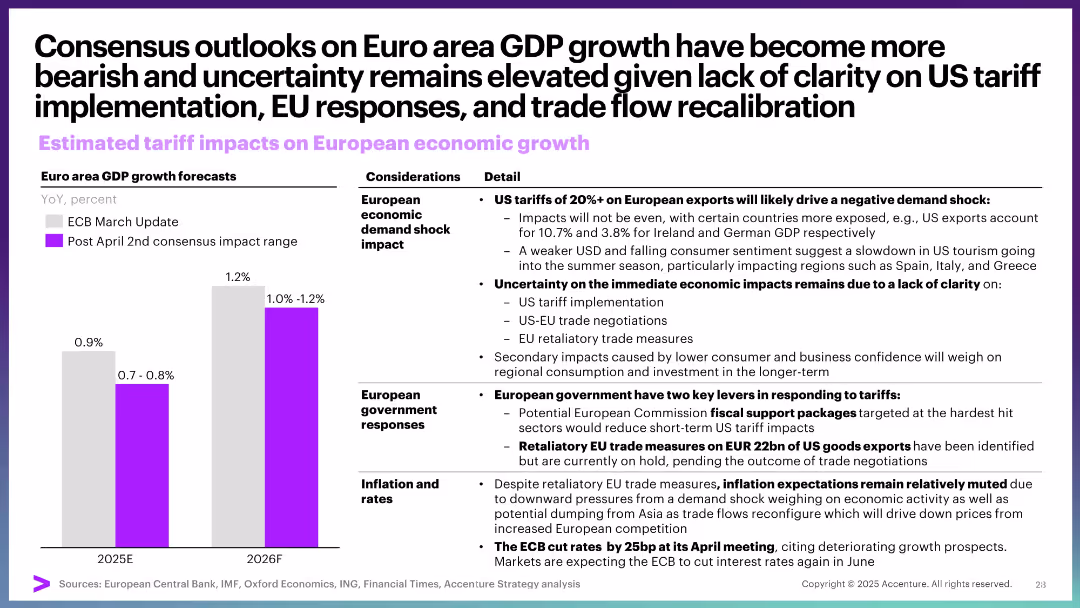
Bar chart for GDP forecasts; detailed text columns on economic shock, EU responses, and inflation. Structured layout.
Market Analysis and Trends
Government & Public Sector
This slide covers expected negative effects of US tariffs on EU economic growth, emphasizing demand shock, lack of clarity on implementation, and EU response options. Inflation expectations remain muted due to broader economic weakening.
Eurozone, GDP, tariffs, economic growth, inflation, trade negotiation, EU response
false
Consensus outlooks on Euro area GDP growth have become more bearish and uncertainty remains elevated given lack of clarity on US tariff implementation, EU responses, and trade flow recalibrationApril Macro Brief: Special edition Tariff distress
Mixed Chart
Accenture
View slide
Featuring a straightforward layout with a bar chart, this slide examines the financial impact of delayed technology adoption on business agility and growth. It shows the percentage of revenue change against the backdrop of technology investment in different years, providing a stark comparison of business performance with and without adequate tech support.
Technology and Digital Transformation
Technology & Software
This slide illustrates the detrimental financial effects of postponing technological advancements within organizations. It compares revenue growth and tech debt levels, providing a clear argument for why timely technological updates are essential for maintaining competitiveness and fostering growth in today's digital economy.
technology transformation, delayed investment, financial impact, tech debt, competitiveness, column chart
false
The cost of delayed technology transformationFrom survive to thrive Achieving tech transformation for communication service providers’ future
Mixed Chart
Accenture
View slide
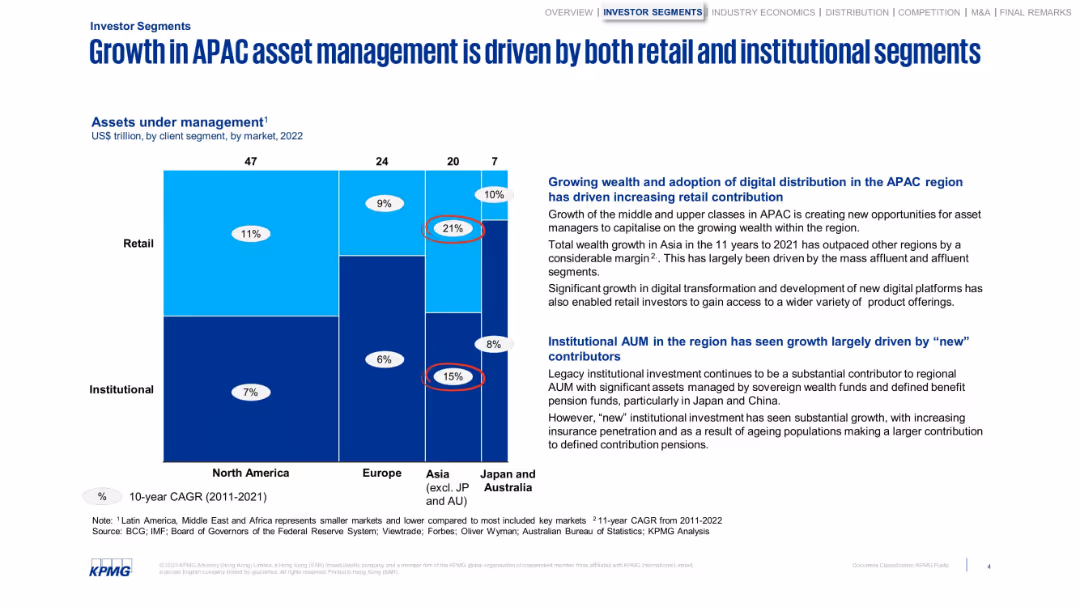
Grid visualization by region and client segment, supported by side analysis text.
Customer and Market Segmentation
Financial Services
Visualizes how APAC asset management benefits from both institutional and retail contributions. Points out rising digital access and growing affluence as retail drivers, with institutional strength from sovereign and pension funds.
retail, institutional, asset management, APAC, digital, pensions
false
Growth in APAC asset management is driven by both retail and institutional segmentsGrowing in a Turbulent World
Mixed Chart
KPMG
View slide
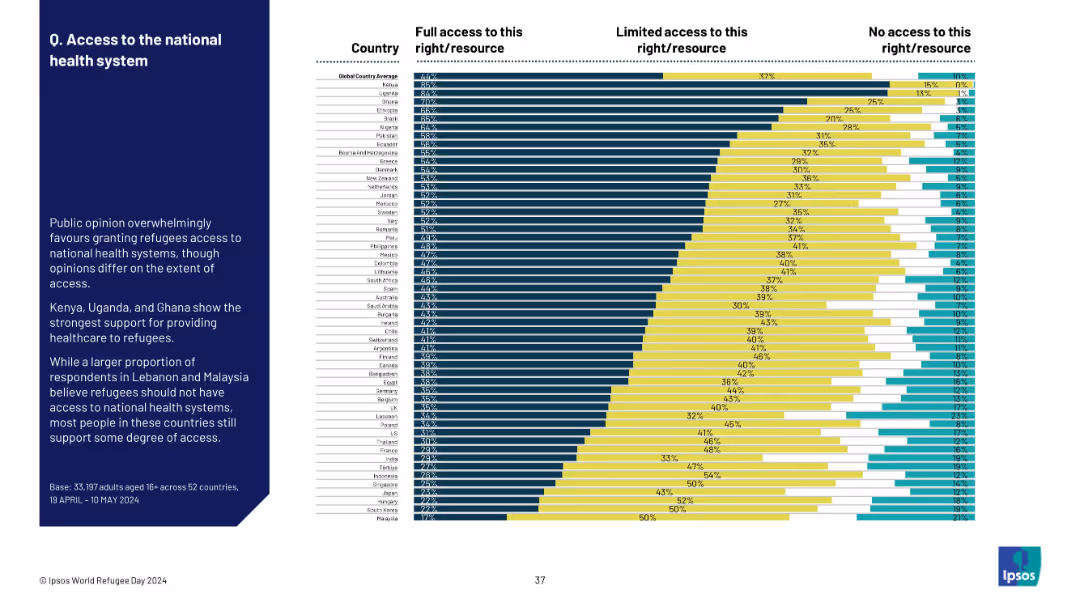
Bar chart by country showing sentiment on health system access; divided into full, limited, and no access.
Regulatory and Compliance
Government & Public Sector
The slide indicates strong global support for allowing refugees access to national healthcare, though countries differ on whether this should be full or limited. Kenya and Uganda lead in support, while Malaysia shows more resistance.
refugees, healthcare access, national systems, global opinion, full vs limited access, sentiment, public services, policy support
false
Q. Access to the national health systemWORLD REFUGEE DAY
Mixed Chart
IPSOS
View slide
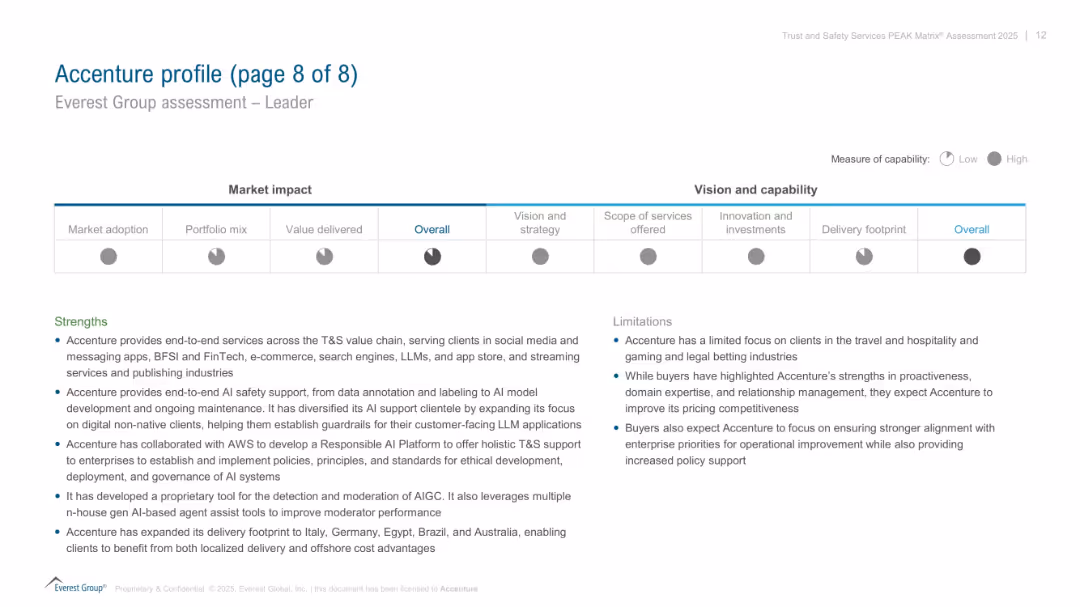
Split layout: radar-style visual for capabilities (top), text sections for strengths and limitations (bottom); corporate and professional style.
Competitive Landscape
Technology & Software
Final profile summary of Accenture in the PEAK Matrix assessment. Visualizes its performance across several dimensions (vision, services, investments). Text highlights Accenture’s strengths in AI safety and end-to-end solutions, with noted client and pricing focus limitations.
Accenture, PEAK Matrix, AI safety, capabilities, limitations, client focus, strengths
false
Accenture profile (page 8 of 8)Everest Group Trust and Safety Services PEAK Matrix Assessment 2025
Mixed Chart
Accenture
View slide
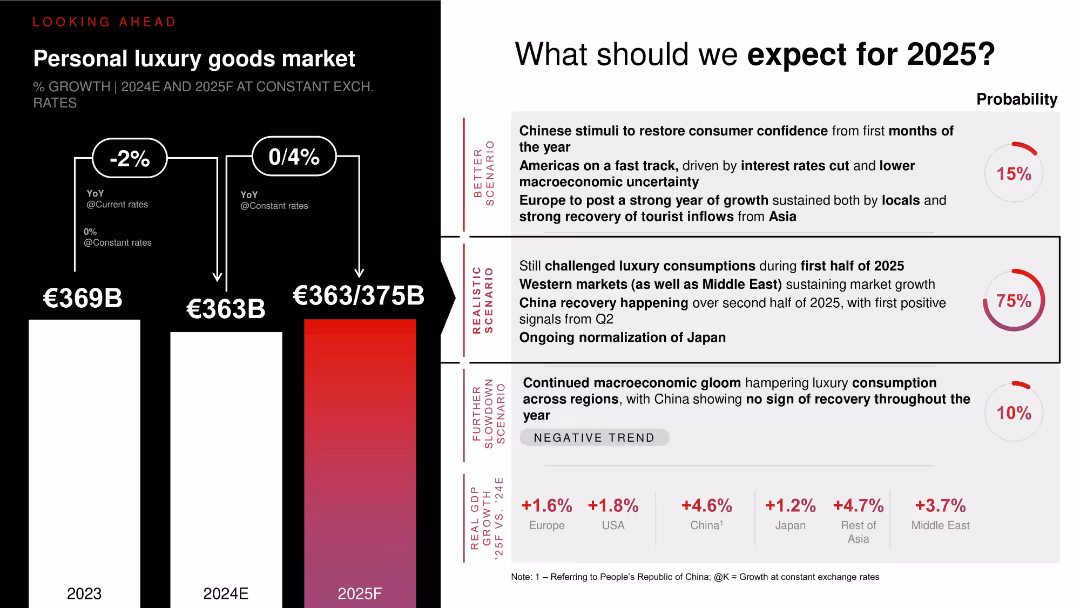
Vertical bar chart projecting 2025 scenarios with arrows and probability indicators (realistic, better, worse). Accompanied by scenario descriptions and macro trends.
Market Analysis and Trends
Consumer Goods
Outlines three potential scenarios for personal luxury goods market growth in 2025, with a realistic scenario (75% probability) expecting recovery led by China, Western markets, and Japan. Charts suggest flat to moderate growth (€363–375B). Also includes economic growth rates across regions to support expectations.
2025 forecast, luxury market, scenario planning, China recovery, global consumption trends
false
Personal luxury goods marketGood times for a change
Multiple Chart
Bain
View slide
The slide has three sections detailing growth, margin expansion, and free cash flow, with icons and bullet points highlighting key financial metrics and strategies.
Investment Analysis
Financial Services
It explains why investors value Gartner, focusing on growth, margin expansion, and free cash flow as key financial performance indicators and investment attractions.
Gartner, investors, growth, margin expansion, free cash flow, financial performance
false
Investors value Gartner for growth, margin expansion, and free cash flowGartner Introduction
Pillar
Gartner
View slide
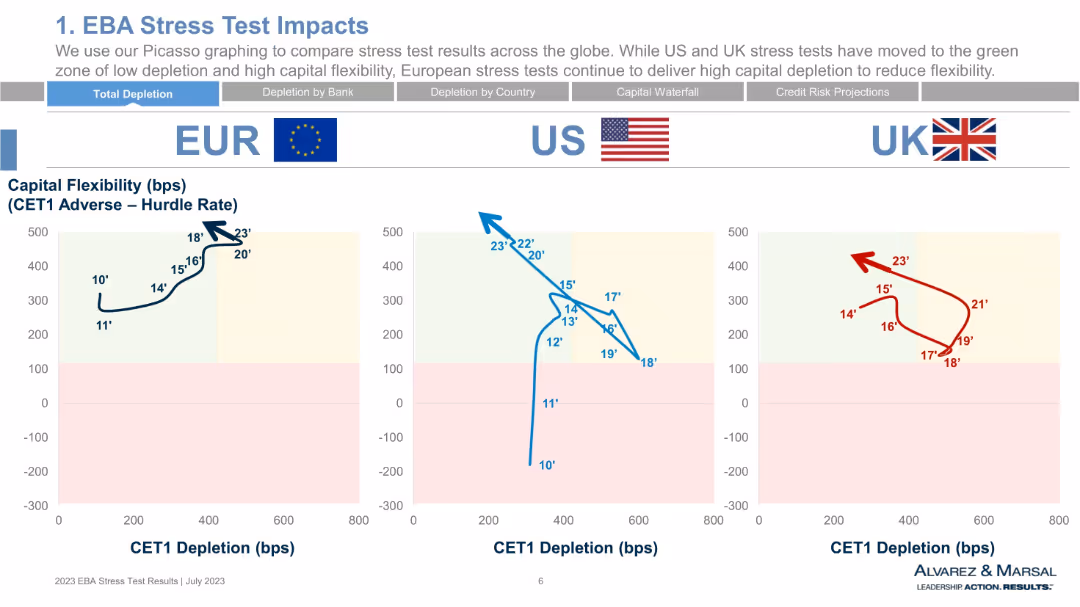
Line chart comparisons across EUR, US, and UK regions with national flags and CET1 depletion vs. capital flexibility axes. Uses color-coded backgrounds for impact zones.
Risk Assessment and Management
Financial Services
This slide compares CET1 depletion and capital flexibility by region (EU, US, UK) from 2010 to 2023. It shows regional trends and positions banks in “green” or “red” zones based on stress test outcomes. The EU shows high capital flexibility with moderate depletion, unlike the UK and US.
CET1, capital flexibility, EU vs US vs UK, stress testing, depletion, risk zones
false
We use our Picasso graphing to compare stress test results across the globe. While US and UK stress tests have moved to the green zone of low depletion and high capital flexibility, European stress tests continue to deliver high capital depletion to reduce flexibility.2023 EU Wide EBA Stress Test Our First Glance at Results
Single Chart
Alvarez & Marsal
View slide
Slide includes a column chart and a circular diagram detailing global and country-specific data on internally displaced people due to conflict or disasters, supplemented with textual analysis and icons.
Market Analysis and Trends
Government & Public Sector
This slide discusses trends in internal displacement driven by conflict and disasters, providing data to understand regional and global scales of the issue and to support humanitarian and policy responses.
displacement, conflict, disaster, data, global, regional, humanitarian, policy, statistics
false
Displaced in their own country due to conflict, violence or disaster: In 2019, the number of IDPs reached a new high of over 50 millionRoland Berger Trend Compendium 2030: Megatrend 1 People & Society
Multiple Chart
Roland Berger
View slide
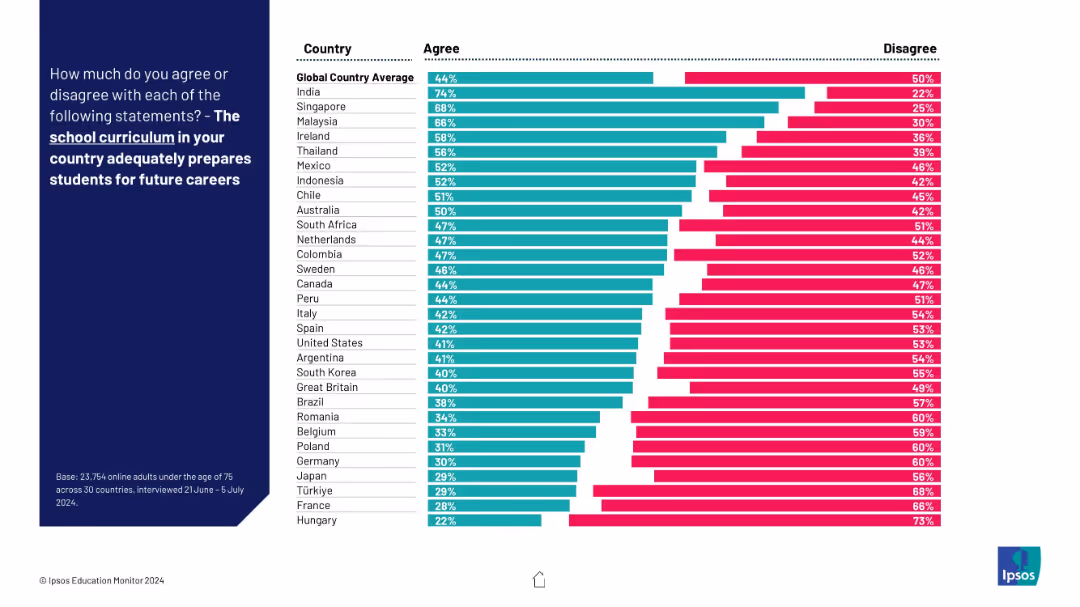
Country comparison bar chart with clear contrast in agree/disagree segments. Layout is consistent with other slides.
Strategic Planning
Education & Training
The slide illustrates perceptions of school curriculum adequacy by country. India and Singapore show highest confidence, while Hungary scores lowest. The global average is 44% agreement.
curriculum effectiveness, future career readiness, international comparison, school systems
false
How much do you agree or disagree with each of the following statements? - The school curriculum in your country adequately prepares students for future careersIPSOS EDUCATION MONITOR 2024
Mixed Chart
IPSOS
View slide
Horizontal bar chart ranked by country; “Likely” vs “Unlikely” opinions; placeholder [COUNTRY] in title
Regulatory and Compliance
Government & Public Sector
This slide surveys global expectations for bans on under-14 social media use. India and Malaysia show highest belief in such regulation; global average is 28%.
social media, regulation, youth, child safety, digital access, parental control, policy, internet usage, Ipsos
false
Children under 14 in [COUNTRY] will be banned from using social mediaPREDICTIONS 2025 REPORT
Mixed Chart
IPSOS
View slide
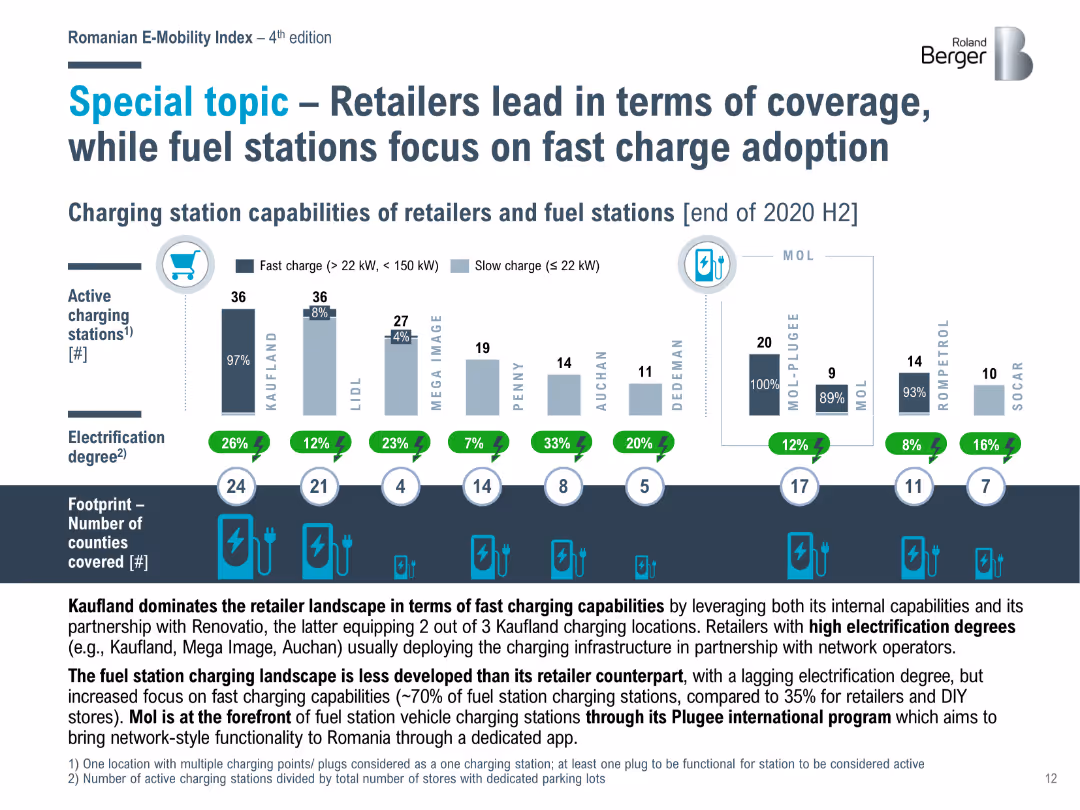
Bar chart comparing the charging station capabilities of retailers and fuel stations in Romania at the end of 2020 H2, highlighting the focus on fast charging.
Market Analysis and Trends
Energy & Utilities
Examines the leadership of retailers in charging station coverage in Romania, with fuel stations focusing on adopting fast charging technologies to meet increasing demand.
charging stations, retailers, fuel stations, Romania, fast charging
false
Special topic – Retailers lead in terms of coverage, while fuel stations focus on fast charge adoptionRomanian E Mobility Index REI 4 (Fourth Edition)
Mixed Chart
Roland Berger
View slide
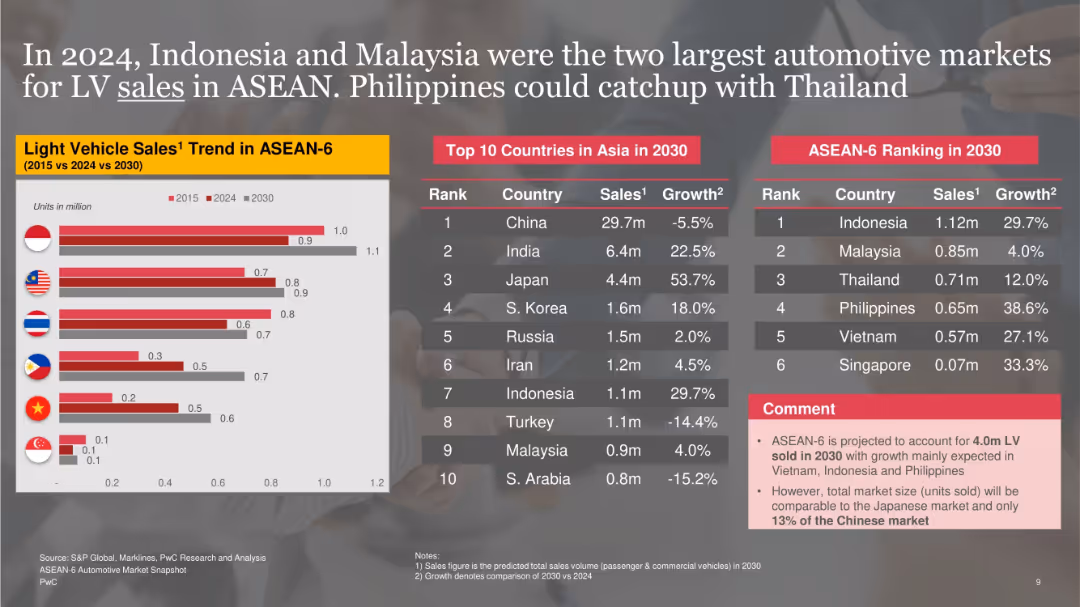
Left bar chart compares 2015, 2024, and 2030 projections for ASEAN-6 countries; right side has two ranking tables and a comment box on sales volume trends.
Market Analysis and Trends
Industrial & Manufacturing
Compares historic, current, and projected light vehicle sales in ASEAN-6. Indonesia and Malaysia remain top markets in 2024, with the Philippines expected to catch up with Thailand by 2030. Comments highlight that the region's market will remain much smaller than China’s despite internal growth.
light vehicle sales, projections, ASEAN-6, Indonesia, Malaysia, 2030, automotive market
false
In 2024, Indonesia and Malaysia were the two largest automotive markets for LV sales in ASEAN. Philippines could catchup with ThailandOverview of the ASEAN-6 Automotive Market
Mixed Chart
PwC/Strategy&
View slide
Contains dense texts and a bar chart illustrating the dominant technology philosophy among investment providers, with a focus on trends over the past three years and future expectations. The layout is comprehensive and well-detailed.
Technology and Digital Transformation
Financial Services
Discusses the shift towards making technology a core competence within the financial services sector, reflecting on strategies firms might adopt in their IT transformations.
technology adoption, IT strategies, financial services, core competence, future trends
false
Technology is becoming a core competence for providersBuilding a Future-Ready Investment Firm
Mixed Chart
Deloitte
View slide
This slide is split into two sections: left side features a quote on a teal background, right side shows a vertical dot plot chart with green bubbles representing percentages over various years.
Technology and Digital Transformation
Technology & Software
Explores how organizations develop AI solutions over time, detailing the percentages of methods adopted based on their experience with AI, from in-house development to purchasing packaged solutions and consuming services. Discusses insights from a sector expert.
AI, solutions, development, in-house, packaged solutions, services
false
How do organizations achieve AI solutions by AI experience?Fueling the AI transformation: Four key actions powering widespread value from AI, right now.
Mixed Chart
Deloitte
View slide
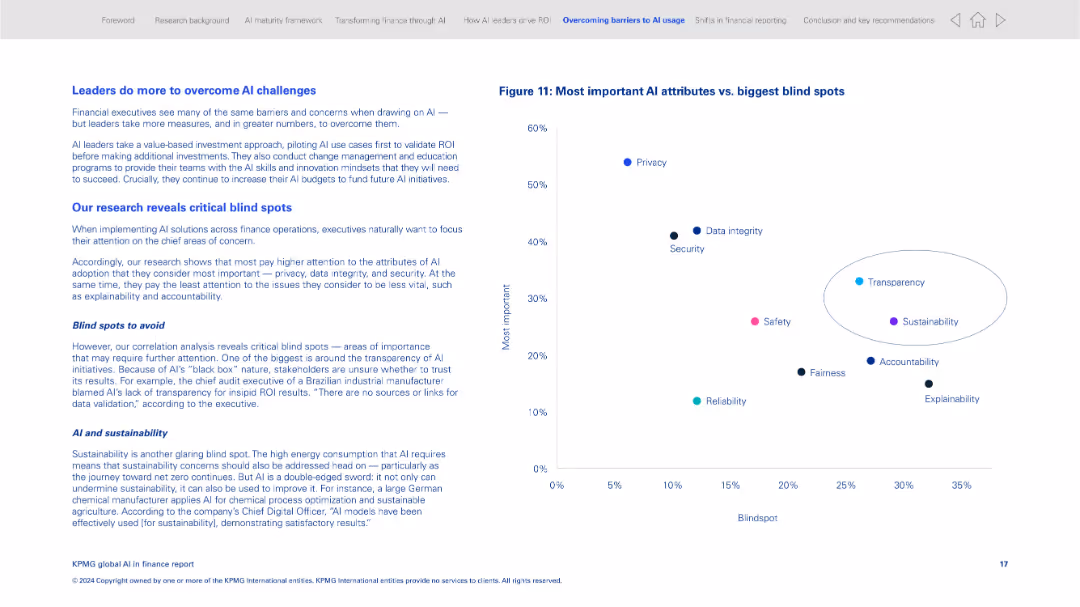
Text on left and a quadrant-style scatter plot on the right; white background with blue and purple accents
Risk Assessment and Management
Financial Services
The slide presents research findings on AI adoption in finance, focusing on which AI attributes executives prioritize (e.g., privacy, security) and which ones they tend to overlook (e.g., transparency, sustainability). The plot visualizes importance versus blind spot percentage.
AI attributes, blind spots, transparency, sustainability, finance risk, executive perception, scatter plot
false
Figure 11: Most important AI attributes vs. biggest blind spotsKPMG global AI in finance report
Mixed Chart
KPMG
View slide
Slide includes bar graphs showing a decrease in reserve strength and increased numbers of firms with "no margin".
Risk Assessment and Management
Financial Services
Discusses the declining margin within reserves at Lloyd's, emphasizing the potential risks and future implications for reserve releases and financial stability.
Reserves, Margin, Decline, Financial, Risk
false
Prior year reserve releases have hit reserve strengthLloyd’s and Bermuda
Mixed Chart
PwC/Strategy&
View slide
Includes a bar chart comparing EV and ICE performance across temperatures.
Operational Efficiency
Transportation & Logistics
Discusses how different cell types and vehicle configurations impact EV performance.
EV, performance challenges, temperature, cell types, vehicle configuration
false
Wide array of cell types , vehicle-level configurations, different cooling technologies add to performance challenges at an integrated levele-mobility in India Market paradigms and ways to play
Mixed Chart
PwC/Strategy&
View slide
The slide presents a detailed text description of Booz Allen's ESG strategy, highlighting internal and external drivers, impact pillars, and goals, with a focus on sustainability.
Strategic Planning
Professional Services
This slide describes Booz Allen's environmental, social, and governance (ESG) strategy, emphasizing their goals, internal and external drivers, and impact pillars for sustainable growth.
Booz Allen, ESG strategy, sustainability, impact pillars, internal drivers
false
OUR ESG STRATEGY We are creating a more secure, resilient, and equitable future for all through our efforts to empower diverse talent, make innovation accessible to all, and drive community resilience.2023 ENVIRONMENTAL, SOCIAL, GOVERNANCE REPORT
Pillar
Booz Allen Hamilton
View slide
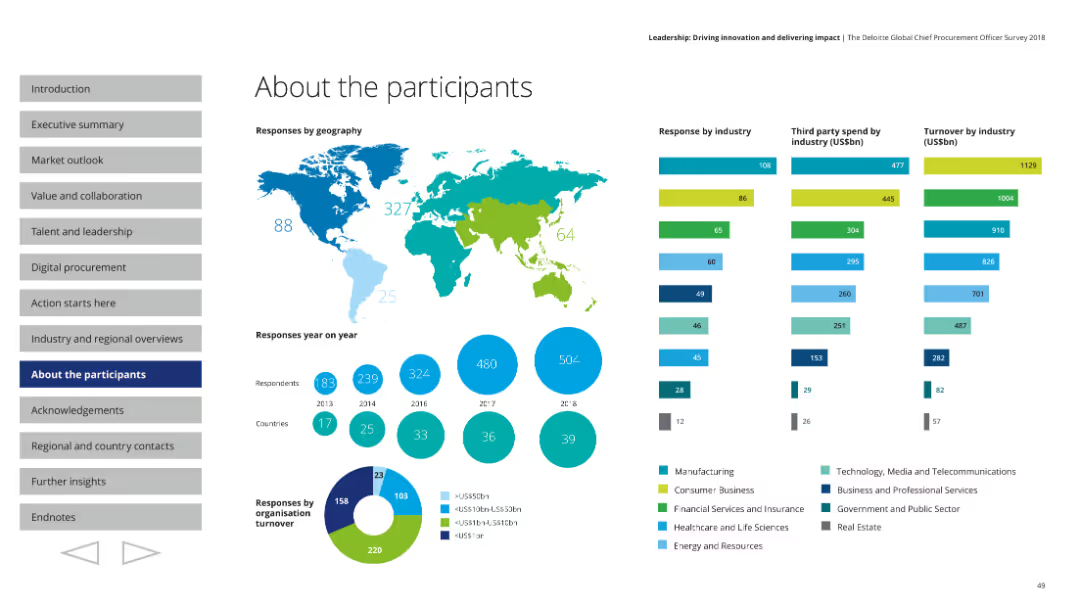
This slide contains various visual elements including a world map, column charts, pie charts, and segmented bars, with detailed information on participant demographics.
Market Analysis and Trends
Professional Services
The slide details the demographic breakdown of survey participants, including their geographic locations, industry sectors, and organizational turnover. It features visual data representations to illustrate responses by geography, industry, third-party spend, and turnover.
Participants, demographics, world map, industry sectors, survey data
false
About the participants Responses by geographyLeadership: Driving innovation and delivering impact The Deloitte Global Chief Procurement Officer Survey 2018
Multiple Chart
Deloitte
View slide
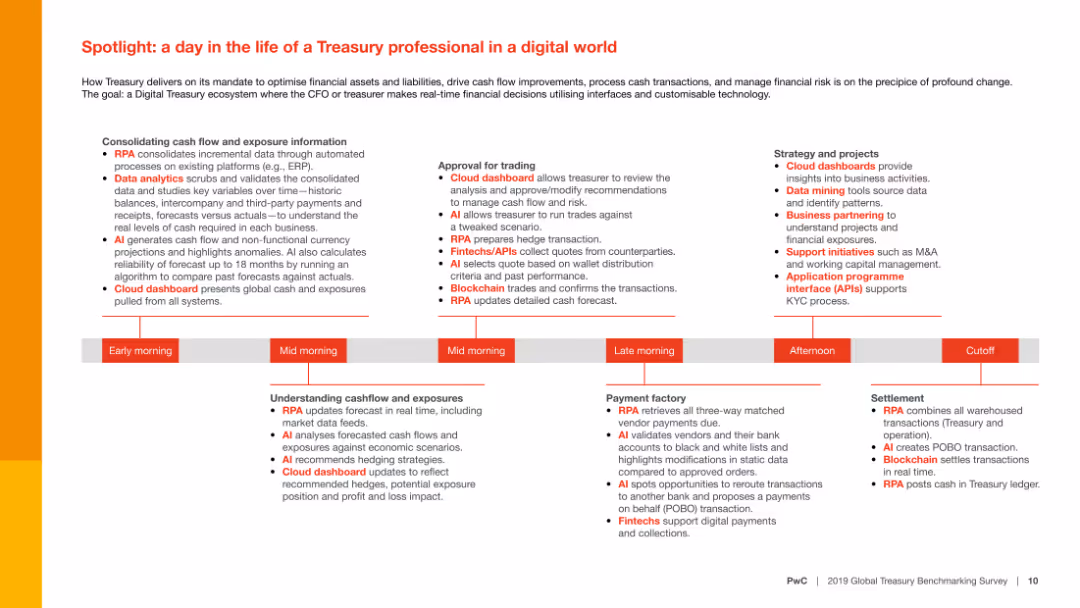
Detailed text with a timeline outlining a typical day of a treasury professional, highlighting the use of technologies like RPA, AI, and cloud dashboards in different tasks.
Operational Efficiency
Financial Services
The slide provides a detailed timeline of a treasury professional's daily tasks, showcasing how various digital tools and technologies streamline financial operations and decision-making.
Treasury professional, digital tools, RPA, AI, cloud dashboards
false
Spotlight: a day in the life of a Treasury professional in a digital worldDigital Treasury-It takes two to tango 2019 Global Treasury Benchmarking Survey
Linear Flow
PwC/Strategy&
View slide
Diagram explaining a holistic approach to managing financial crime, using four icons linked by arrows to represent different areas of focus: anti-bribery, anti-money laundering, anti-tax evasion, and sanctions.
Regulatory and Compliance
Financial Services
The slide describes Barclays' integrated strategy for financial crime prevention, emphasizing the synergy between different compliance areas and highlighting the supporting global finance function.
compliance, financial crime, anti-bribery, AML
false
Barclays has adopted a holistic approach to Financial CrimeFY23 ESG Investor Presentation
Diagram
Barclays
View slide
Displays column charts and maps illustrating the old-age dependency ratio and median age by region for 2020 and 2050.
Market Analysis and Trends
Government & Public Sector
Focuses on the increasing old-age dependency ratio worldwide, particularly in developed regions, and discusses the challenges and policy implications for healthcare, pensions, and labor markets.
aging, dependency ratio, policy, healthcare, demographics
false
All regions are aging, with fewer people of working age having to support more older people Interregional differences remain significantRoland Berger Trend Compendium 2030: Megatrend 1 People & Society
Multiple Chart
Roland Berger
View slide
Two donut charts comparing podcast ad revenue by different pricing models between 2017 and 2018, highlighted with colors.
Market Analysis and Trends
Media & Entertainment
Discusses the dominant pricing models for podcast advertising, pointing out the sustained lead of cost per thousand and the decline of cost per acquisition.
Podcast, Advertising, Pricing Models, Cost Per Thousand, 2017, 2018
false
Revenue by Pricing Model – 2017 to 2018IAB FY 2018 Podcast Ad Revenue Study
Multiple Chart
PwC/Strategy&
View slide
Two bar charts comparing job vulnerability by income bands, with a side bar chart showing the percentage of vulnerable jobs in each income bracket.
Risk Assessment and Management
Financial Services
Presents the proportion of vulnerable jobs within various income bands during the COVID-19 crisis.
income, job vulnerability, COVID-19, financial analysis, risk management
false
Seventy-four percent of vulnerable jobs pay less than $40,000 a yearResponding to COVID-19: Addressing the economic impact of the crisis
Multiple Chart
McKinsey
View slide
This slide provides an overview of the investment landscape in Italy, using maps to depict the distribution and growth of startups, along with future market predictions.
Market Analysis and Trends
Technology & Software
Discusses the current and projected state of the startup ecosystem in Italy, emphasizing investment trends, challenges, and the growth potential within the European Union.
startups, Italy, investment, innovation, EU market, growth potential
false
European and Italian startup landscapeDigital Revolution Awards
Graphic
Bain
View slide
The slide includes a line chart comparing geological storage costs for CO2 in onshore and offshore sites.
Financial Performance
Energy & Utilities
This slide compares the costs of geological storage for CO2 in depleted oil and gas fields and saline aquifers.
CO2 storage, geological, costs, onshore, offshore
false
Geological storage cost comparison with uncertainty range1Carbon Capture Utilization and Storage
Mixed Chart
Kearney
View slide
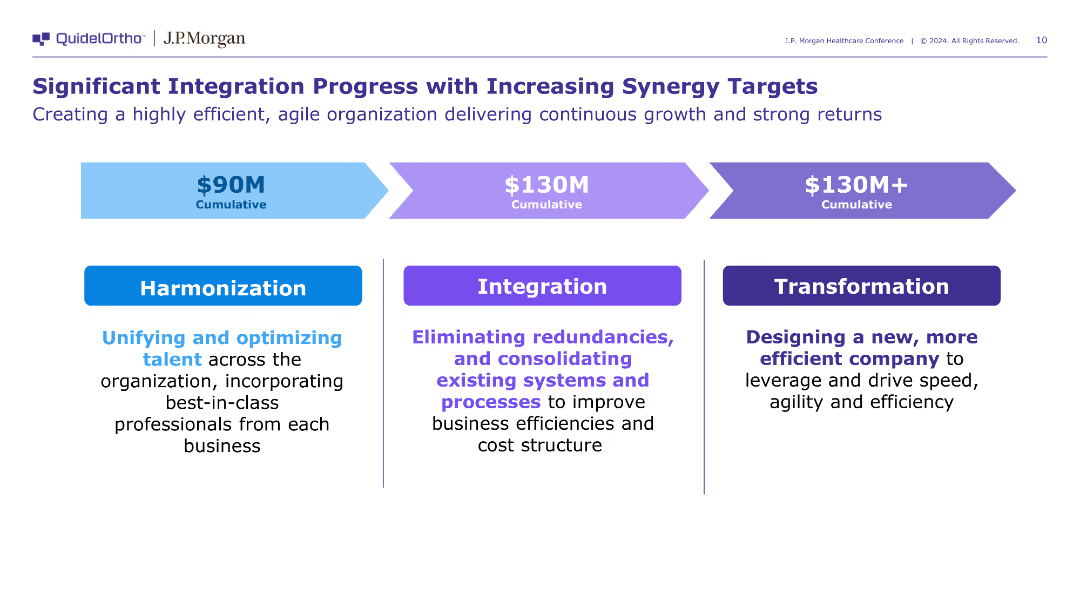
The slide includes three blocks detailing the stages of integration: Harmonization, Integration, and Transformation, each with specific actions and cumulative synergy targets. The design is clear and structured.
Operational Efficiency
Healthcare & Pharmaceuticals
The slide outlines the progress and targets of QuidelOrtho's integration efforts, focusing on harmonizing talent, eliminating redundancies, and transforming the company for better efficiency.
integration, synergy, transformation
false
Significant Integration Progress with Increasing Synergy TargetsJ.P. Morgan 42nd Annual Healthcare Conference
Linear Flow
JP Morgan
View slide
Continues from the previous slide, adding further technological innovations and their implications for various sectors.
Technology and Digital Transformation
Technology & Software
Continues to detail emerging space technologies, including laser communications, edge computing, and in-orbit servicing capabilities.
space technologies, communications, digital capabilities, deep-space exploration
false
What are the most noteworthy technologies? (continued)McKinsey Technology Trends Outlook 2022 Future of space technologies
Header Horizontal
McKinsey
View slide
Slide with a pie chart and world map indicating market share and growth expectations. Use of icons and color-coding for regions.
Market Analysis and Trends
Financial Services
Analyzes global ultra-high net worth investable assets with goals for hiring wealth advisors and regional growth percentages.
wealth management, market share, UHNW, global assets, growth expectations, private wealth advisors, regional analysis, hiring goals, strategy
false
Unique Wealth Management Capabilities with Room to Increase ShareGoldman Sachs Investor Day
Mixed Chart
Goldman Sachs
View slide
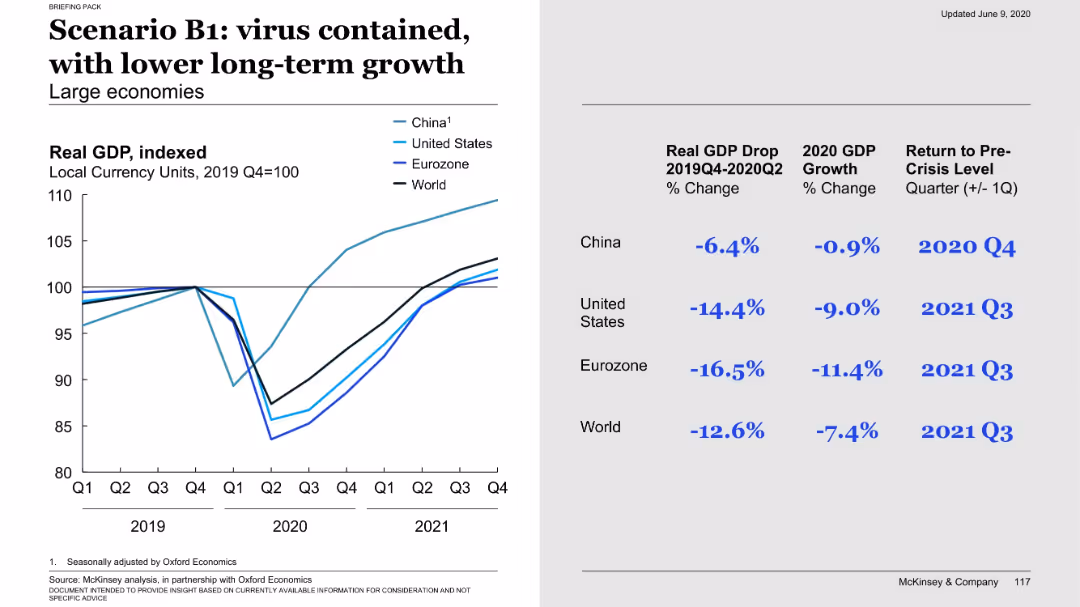
Left graph shows recovery followed by slower long-term trend; right side presents GDP drop and recovery timing across regions.
Financial Performance
Government & Public Sector
The B1 scenario anticipates virus containment but at the cost of sustained economic damage. Though a recovery occurs, long-term growth remains below previous levels. Data highlights severe GDP drops in US and Eurozone with recovery by Q3 2021.
B1, virus containment, long-term growth, GDP impact, economic damage, recovery timing, scenario
false
Scenario B1: virus contained, with lower long-term growthCOVID-19: Briefing materials
Mixed Chart
McKinsey
View slide
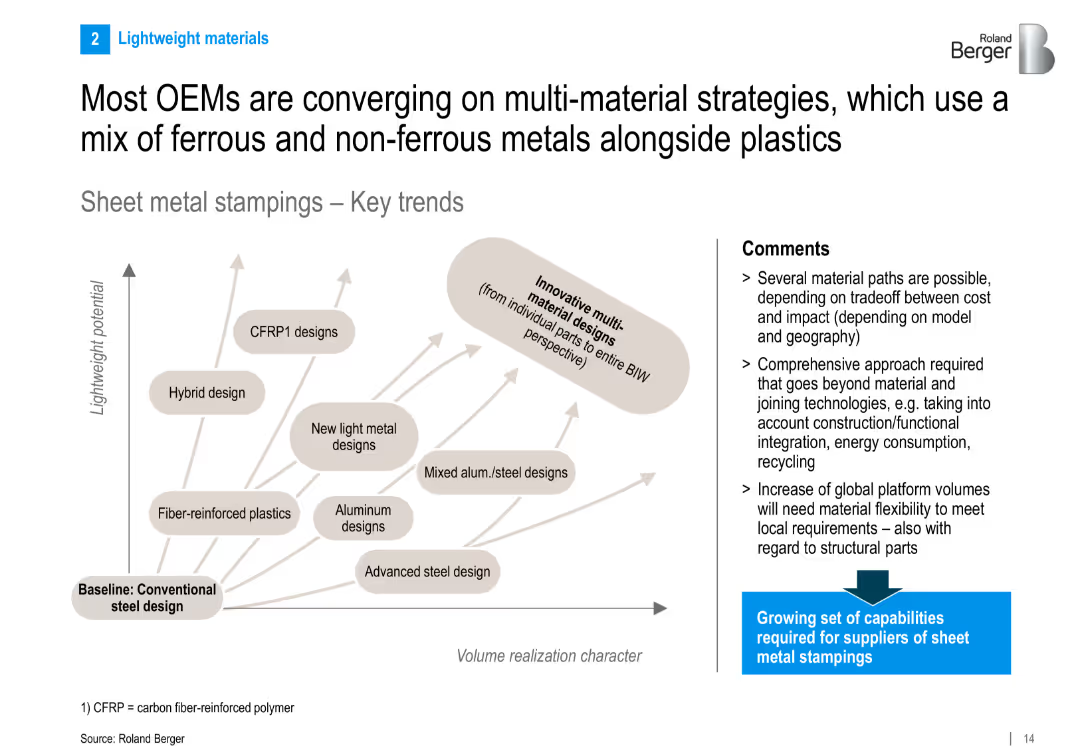
Split layout: left side has a 2D graph plotting material types (e.g., CFRP, aluminum) by lightweight potential and volume realization; right side includes bullet-point comments; overall clean, minimalistic design
Strategic Planning
Industrial & Manufacturing
Highlights the trend among OEMs toward using multi-material designs, mixing ferrous, non-ferrous metals and plastics to optimize cost, weight, and performance. Emphasizes the need for suppliers to broaden their capabilities in sheet metal stamping.
OEMs, CFRP, material mix, sheet metal, lightweight, stamping, aluminum, steel, BIW, trends
false
Most OEMs are converging on multi-material strategies, which use a mix of ferrous and non-ferrous metals alongside plasticsAutomotive metal components for car bodies and chassis
Diagram
Roland Berger
View slide
The slide is text-heavy with a series of bullet points on the left, complemented by labeled graphs on the right. The design is minimalist with a white background and uses contrasting black and blue text for emphasis.
Risk Assessment and Management
Financial Services
Outlines potential economic scenarios resulting from COVID-19's spread, public health responses, and policy decisions. It's a tool for assessing risks and planning for various outcomes in the financial sector.
Economic Scenarios, COVID-19, Health Response
false
Scenarios for the economic impact of the COVID-19 crisis GDP impact of COVID-19 spread, public health response, and economic policiesCOVID-19: Briefing Note
Table
McKinsey
View slide
A structured diagram categorizes the bank's divisions into five focused areas with additional descriptive text.
Organizational Structure and Change
Financial Services
This slide outlines the bank’s divisional reorganization into five focused areas, aimed at streamlining operations and enhancing efficiency.
restructuring, divisions, organizational, business model, efficiency
false
Simpler business: five focused divisionsFY 2023 Results Announcement
Diagram
Barclays
View slide
The slide includes column charts comparing the levelized cost of mobility per passenger for ICE buses, fuel cell buses, and BEV buses under different scenarios.
Operational Efficiency
Energy & Utilities
The slide compares the levelized cost of mobility per passenger for internal combustion engine buses, fuel cell buses, and battery electric buses, noting the higher cost for H2 buses.
LCOM, H2 buses, BEV, cost, passenger
false
Levelized cost of mobility3 per passengerHydrogen applications and business models
Mixed Chart
Kearney
1
...
Next
Load More
Hold On!
We are searching in our database
If nothing, comes up, please try different filters!
Create a FREE account to continue browsing
Receive Instant Access to 1,000+ slides from companies like McKinsey, Google, and Goldman Sachs
First Name
Last Name
Email
Password
I agree to all
Terms & Privacy Policy
Thank you! Your submission has been received!
Oops! Something went wrong while submitting the form.
Have an account?
Sign in
Column Chart
Heatmap
Chevron
Org Chart
Infographic
Callouts
Timeline
List
Graphic
Picture
Process Flow
Diagram
Paragraph
Map
Table
Framework
Subtitle
Takeaway Box
Icon
Other Chart
Radar Chart
Waterfall Chart
Mekko Chart
Pie Chart
Scatter Plot
Line Chart
Bar chart
Bullet points


![Q. Which of these statements, if any, do you most agree with regarding refugees’ routes of entry into [COUNTRY]?](https://cdn.prod.website-files.com/654e70fb59937215cac87b19/6899ca47f5e72ed50e4a7c9c_LtfIhc9_rP5OCy_vUh4AN9JaocGaYLnkXzNRD8FSO1s.avif)


![To fix [Country], we need a strong leader willing to break the rules](https://cdn.prod.website-files.com/654e70fb59937215cac87b19/6899bd4617bfc679827cbe95_Gz734YNy4LWd8fPpTh0S1zTZmn4d87OgCc0eZa-zm50.avif)


![Children under 14 in [COUNTRY] will be banned from using social media](https://cdn.prod.website-files.com/654e70fb59937215cac87b19/6899b95ee44404f6f3c16dbd_qROGhk2ldmPp3HP2t1lKIRGByOAa2DXOUUaKEJG1Brc.avif)