My Account
My Slides
Search by Category
Templates
Leave Feedback
Login
Logout
Get Started
Browse all Slides
Browse all Slides
Create a FREE Account
Instant access to 1,000+ real slides from top companies like McKinsey, BCG, Goldman Sachs, Google and many more!
First Name
Last Name
Email
Password
I agree to all
Terms & Privacy Policy
Thank you! Your submission has been received!
Oops! Something went wrong while submitting the form.
Have an account?
Sign in
Instant access to the internet's best slides
Get access to 40+ advanced filters and more
Advanced Search and Filters
Access to
10,000+ slides
Access to Category Pages
Save/Bookmark Slides
PowerPoint Template Library (New)
Choose your plan
MONTHLY
$12/month
Billed every month, cancel anytime.
YEARLY
$9/month
Billed $108 annually, cancel anytime.
Checkout for $12/month
Checkout for $108/yr
Secured by Stripe | AES-256 bit encryption
📢 Ready to start building slides? Check out our new template library
view templates
Welcome,
Welcome
Upgrade to SlideStart
Pro
Instant access to 15,000+ slides
Show Featured Only
Checkbox 8
Companies
Mckinsey
Bain
BCG
EY
Deloitte
Accenture
PwC/Strategy&
JP Morgan
Goldman Sachs
Morgan Stanley
Citigroup
Deutsche Bank
Barclays
LEK
Kearney
Oliver Wyman
Booz Allen Hamilton
Gartner
IPSOS
Nielsen
Slide type
Header Horizontal
Framework
Vertical Flow
Single Chart
Single Chart
Text Only
Mixed Chart
Header Vertical
Graphic
Pillar
Multiple Chart
Agenda
Title
Table
Linear Flow
Upgrade to SlideStart
Pro
Instant access to 40+ advanced filters
Industry
Upgrade to SlideStart
Pro
Instant access to 40+ advanced filters
Technology
Healthcare
Financial Services
Consumer Goods
Energy & Utilities
Manufacturing
Retail
E-commerce
Logistics
Telecommunications
Real Estate
Professional Services
Education
Media
Entertainment
Hospitatlity
Tourism
Agriculture
Food Production
Government & Public Sector
Environmental
Sustainability
Use Case
Upgrade to SlideStart
Pro
Instant access to 40+ advanced filters
Sales and Business Development
Mergers and Acquisitions
Corporate Finance and Valuation
Performance Metrics and KPIs
Client Case Studies
Competitive Landscape
Product and Service Analysis
Customer and Market Segmentation
Organizational Structure
Human Resources and Talent Management
Industry Overview
Regulatory and Compliance
Risk Assessment and Management
Agriculture & Food Production
Hospitality and Tourism
Government
Environmental
Sustainability
Clear all
Thank you! Your submission has been received!
Oops! Something went wrong while submitting the form.
Show Featured Only
Checkbox 8
Companies
Mckinsey
Bain
BCG
EY
Deloitte
Accenture
PwC/Strategy&
JP Morgan
Goldman Sachs
Morgan Stanley
Citigroup
Deutsche Bank
Barclays
LEK
Kearney
Oliver Wyman
Booz Allen Hamilton
Gartner
IPSOS
Nielsen
Slide type
Text Only
Linear Flow
Vertical Flow
Single Chart
Header Horizontal
Mixed Chart
Header Vertical
Pillar
Multiple Chart
Graphic
Agenda
Title
Table
Framework
Industry
Technology
Healthcare
Financial Services
Consumer Goods
Energy & Utilities
Manufacturing
Retail
E-commerce
Logistics
Telecommunications
Real Estate
Professional Services
Education
Media
Entertainment
Hospitatlity
Tourism
Agriculture
Food Production
Government & Public Sector
Environmental
Sustainability
Use Case
Sales and Business Development
Mergers and Acquisitions
Corporate Finance and Valuation
Performance Metrics and KPIs
Client Case Studies
Competitive Landscape
Product and Service Analysis
Customer and Market Segmentation
Organizational Structure
Human Resources and Talent Management
Industry Overview
Regulatory and Compliance
Risk Assessment and Management
Agriculture & Food Production
Hospitality and Tourism
Government
Environmental
Sustainability
Clear all
Thank you! Your submission has been received!
Oops! Something went wrong while submitting the form.
Tag
View slide
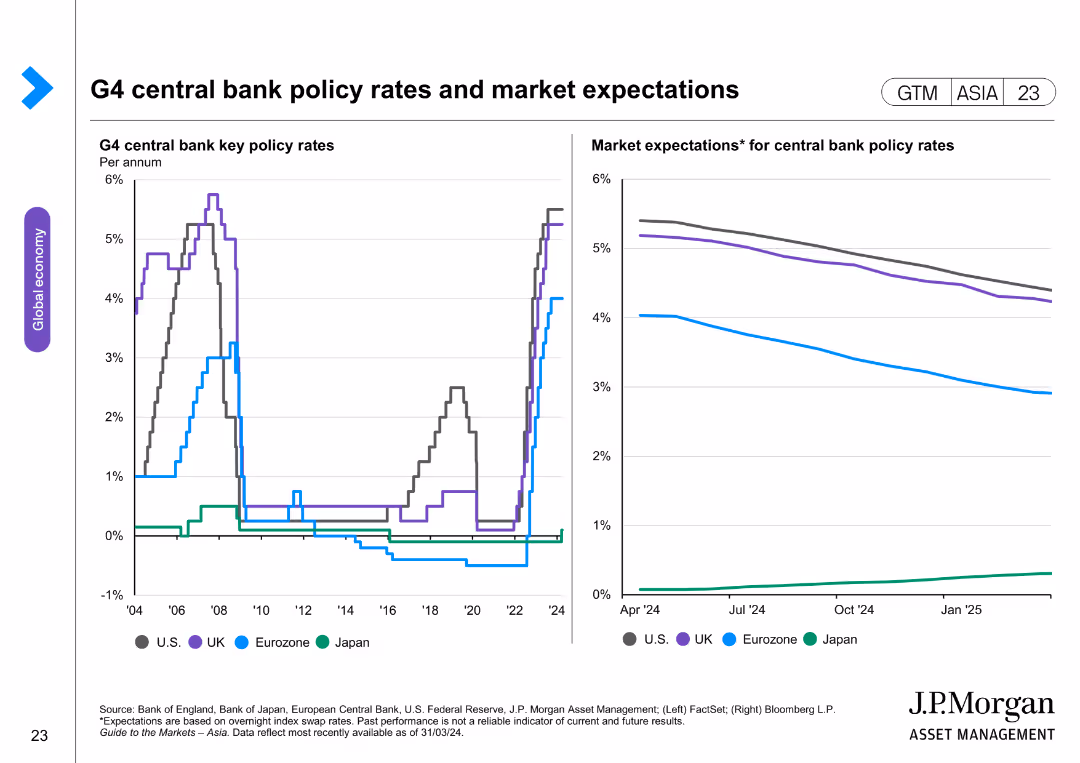
The slide features two line charts. The left chart displays key policy rates of G4 central banks (US, UK, Eurozone, Japan) over time. The right chart shows market expectations for these policy rates, with forecasted trends.
Market Analysis and Trends
Financial Services
The slide provides an analysis of G4 central bank policy rates and market expectations, highlighting monetary policy trends. It is used for financial market analysis and strategic planning.
G4 central banks, policy rates, market expectations, US, UK, Eurozone, Japan, monetary trends, financial analysis
false
G4 central bank policy rates and market expectationsGuide to the Markets Asia | 2Q 2024
Multiple Chart
JP Morgan
View slide
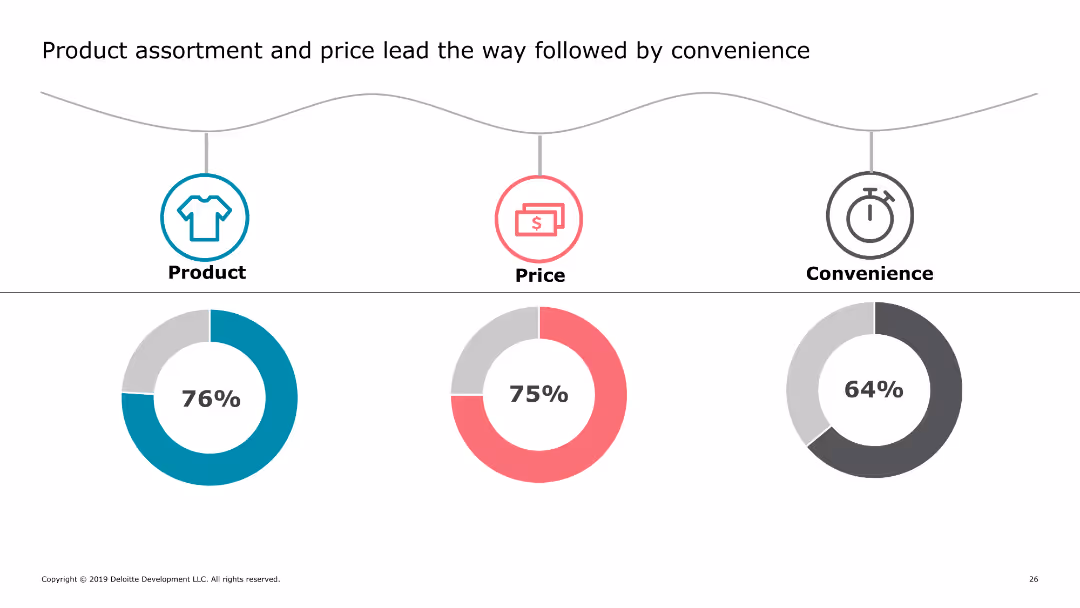
This slide includes three circular icons representing product, price, and convenience, each with a corresponding percentage below it. The icons are color-coded and arranged horizontally across the slide.
Market Analysis and Trends
Retail & E-commerce
The slide highlights key factors influencing consumer purchasing decisions, showing that product assortment, price, and convenience are the top priorities for shoppers.
consumer priorities, product assortment, pricing, convenience, shopping factors
false
Product assortment and price lead the way followed by convenience2019 Holiday Survey of Consumers Keeping the good times rolling
Multiple Chart
Deloitte
View slide
The slide contains a column chart showing the importance of various aspects like family, work, hobbies, and exercise to Gen Zs and Millennials. It uses a clear layout with balanced text and visual elements.
Human Resources and Talent Management
Professional Services
This slide emphasizes the importance of work in the identity of Gen Zs and Millennials while highlighting the paramount importance of achieving work/life balance. It presents data on what aspects are most important to their sense of identity.
Work identity, balance, Gen Z, Millennials, importance
false
Work is central to Gen Zs and millennials’ identity, but achieving balance is paramount2023 Gen Z and Millennial Survey
Mixed Chart
Deloitte
View slide
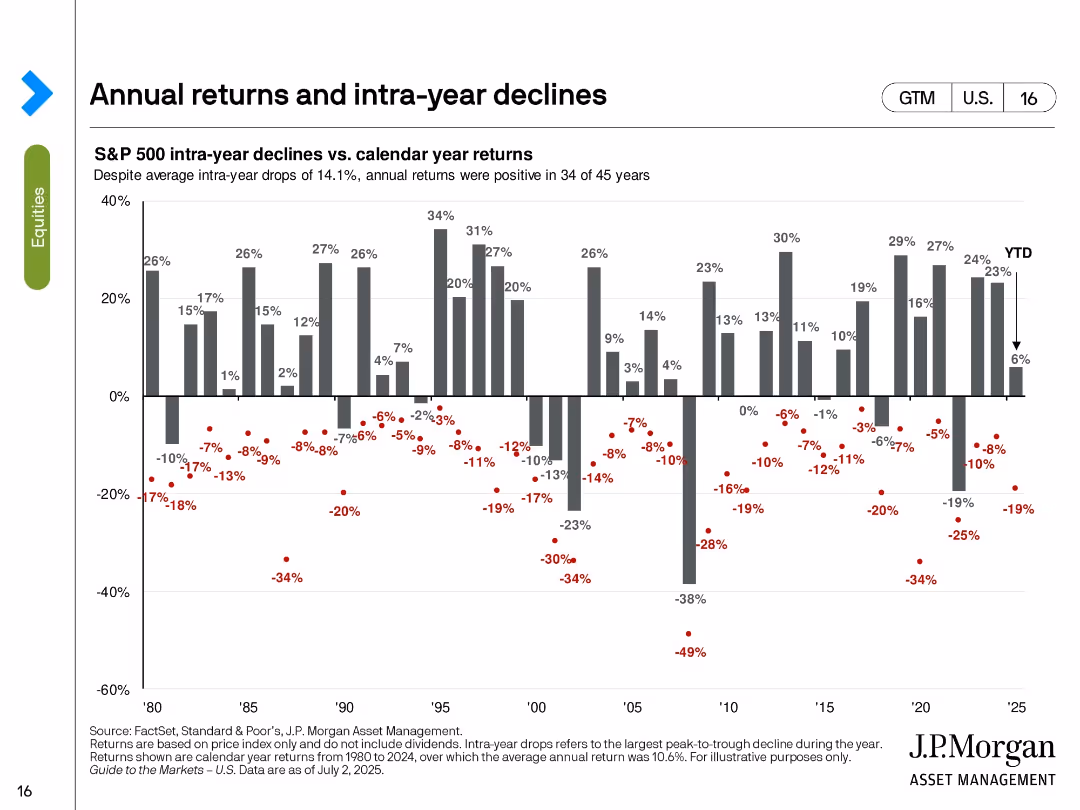
Vertical bar chart of calendar year returns with red dots showing intra-year drawdowns for each year from 1980 to 2025.
Risk Assessment and Management
Financial Services
This slide visualizes the volatility of annual S&P 500 returns by overlaying intra-year declines. Despite average intra-year drops of 14.1%, positive returns occurred in 34 of 45 years. The chart reinforces the notion that temporary declines do not always derail full-year performance.
S&P 500, intra-year decline, calendar return, volatility, drawdown, annual performance, investment risk, market resilience
false
Annual returns and intra-year declinesGuide to the Markets U.S. 3Q 2025
Single Chart
JP Morgan
View slide
Slide showcases a three-column list categorizing achievements in Strategy, Transformation, and Culture and Talent, with check marks indicating progress.
Strategic Planning
Financial Services
Reflects on the yearly achievements across strategy, transformation, and talent management in the banking industry.
Strategy, Transformation, Culture, Talent Management, Achievements, Yearly Review
false
Significant Progress in Year OneCITY 2022 Investor Day
Header Horizontal
Citigroup
View slide
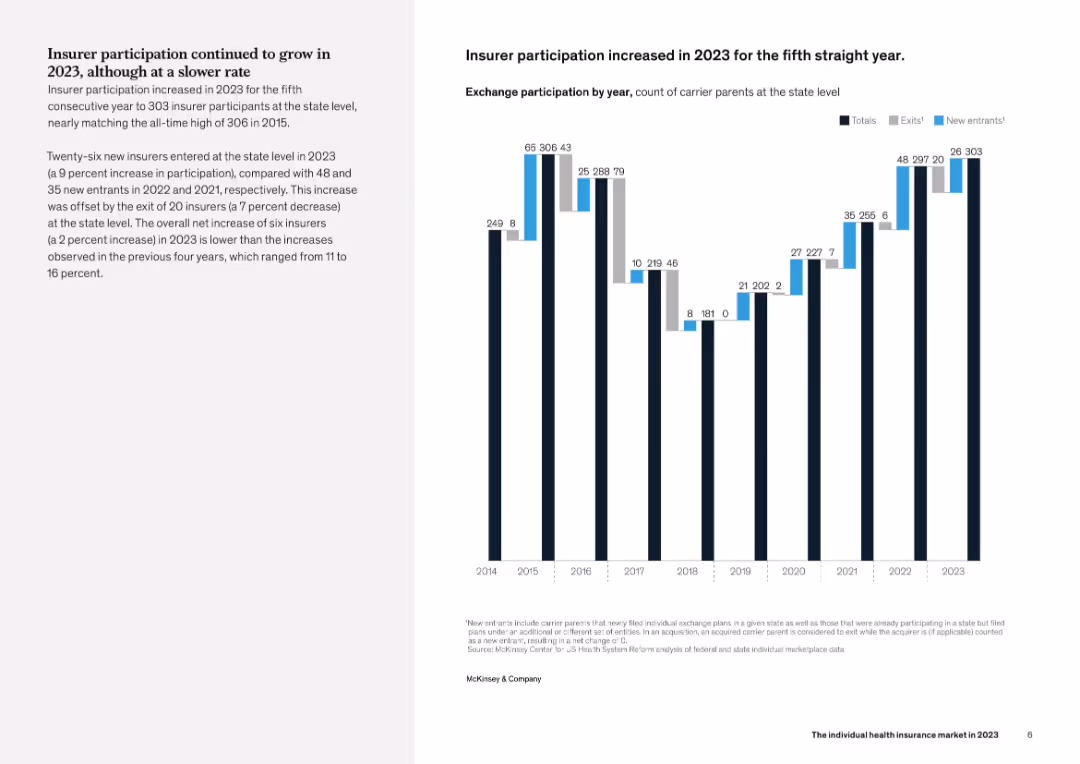
Left-aligned explanatory text with a vertical bar chart on the right showing the number of insurer participants, new entrants, and exits from 2014 to 2023. Visual style is consistent and clean with focus on quantitative trends.
Industry Overview
Healthcare & Pharmaceuticals
This slide details insurer participation trends in the individual health insurance market, showing a net increase in 2023 for the fifth consecutive year. Although the growth rate slowed compared to 2022, new entries still outpaced exits, nearly matching the participation peak seen in 2015.
insurer participation, healthcare, trends, new entrants, exits
false
Insurer participation increased in 2023 for the fifth straight yearThe individual health insurance market in 2023
Mixed Chart
McKinsey
View slide
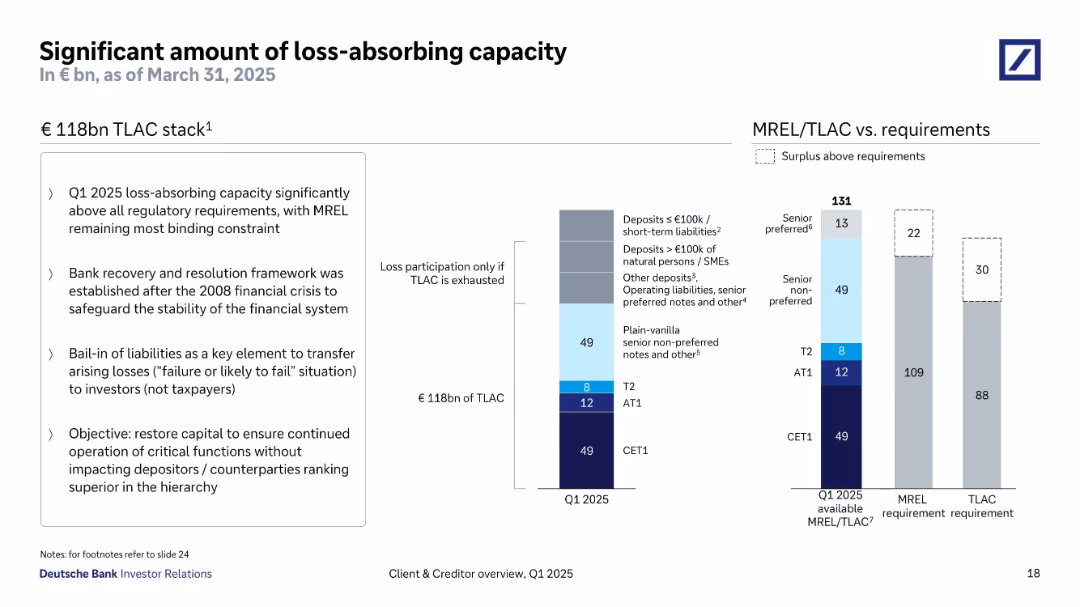
Split into three sections: left text box with bullet points, center TLAC breakdown bar chart, right MREL/TLAC requirement vs. actual chart. Clean and structured with consistent typography and muted color palette.
Risk Assessment and Management
Financial Services
Highlights Deutsche Bank’s €118bn TLAC stack as of Q1 2025, well above regulatory requirements. Emphasizes the importance of bail-in capital, regulatory compliance post-2008, and the preservation of senior claims in the capital hierarchy.
TLAC, MREL, bail-in, financial stability, capital stack, regulation
false
Significant amount of loss-absorbing capacityClient & Creditor Overview
Multiple Chart
Deutsche Bank
View slide
A list detailing NFT use cases across industries like Digital Art, Sports, Music, Real Estate, Gaming, and Finance. Each has icons and descriptions.
Industry Overview
Media & Entertainment
Outlines various NFT applications across multiple sectors, emphasizing the breadth of NFT adoption and its impact on different industries. Essential for industry overview presentations on NFTs.
NFTs, Use Cases, Digital Art, Sports, Music, Real Estate, Gaming, Finance
false
Use cases for NFTs have proliferated across industriesBlockchain and Digital Assets
Table
McKinsey
View slide
The slide features a column chart showing preferences for purchasing, leasing, or subscribing to cars in Germany, the US, and China, with percentage bars for each option.
Market Analysis and Trends
Transportation & Logistics
The slide indicates that purchasing new or used cars is the dominant preference among respondents, but interest in car subscription models is growing, especially in China.
car purchase, leasing, subscription, Germany, US, China, consumer preferences, automotive, market trends
false
Majority of respondents prefer to purchase a new or used car; but car subscription models are attracting interestDigital Auto Report 2023 What consumers really want
Multiple Chart
PwC/Strategy&
View slide
Column charts and pie charts showing private banking and asset management metrics, including AuM, PTI, and industry growth.
Strategic Planning
Financial Services
Presents IWM’s performance in wealth and asset management, highlighting industry growth, assets under management, and profitability.
Wealth management, asset management, IWM, AuM, PTI
false
IWM – an attractive wealth and asset management franchiseCredit Suisse Investor Day 2019 Growth in Wealth Management
Multiple Chart
Credit Suisse
View slide
This slide includes flow diagrams, a column chart, and textual explanations to describe the factors influencing system-wide deposit levels and their interaction.
Financial Performance
Financial Services
It illustrates the impact of quantitative tightening and the reverse repurchase agreement operations on deposit levels, along with customer behavior patterns.
quantitative tightening, deposit levels, reverse repurchase agreements, customer behavior, flow diagram, column chart, financial system
false
System wide deposit levels will depend on how QT interacts with RRP and customer behaviorInverstors Day 2023
Mixed Chart
JP Morgan
View slide
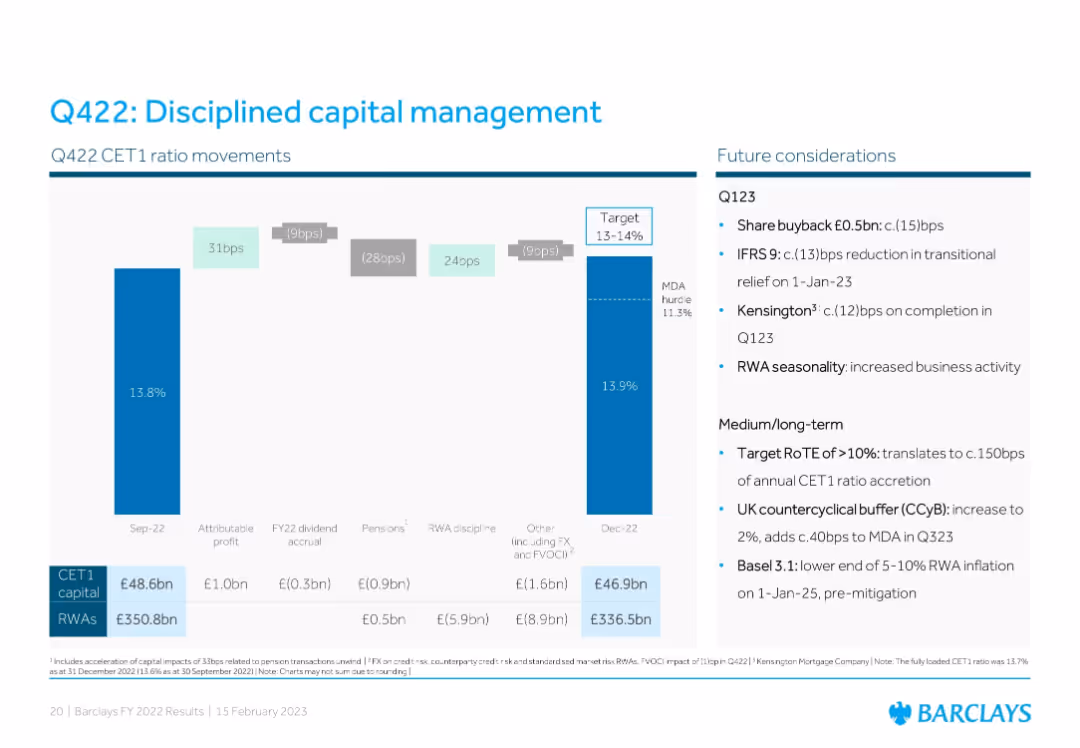
Left: CET1 ratio movement chart; Right: bullet points of future capital considerations. Color-coded waterfall bars represent capital impacts, with numeric annotations.
Corporate Finance and Valuation
Financial Services
Describes CET1 ratio changes in Q422, detailing capital impacts and management strategies. Lists future considerations including share buybacks, buffer increases, IFRS 9 adjustments, and medium-term capital planning targets.
capital management, CET1 ratio, IFRS 9, share buyback, buffers, risk-weighted assets, Q422, Barclays
false
Q422: Disciplined capital managementBarclays PLC FY 2022 Results
Mixed Chart
Barclays
View slide
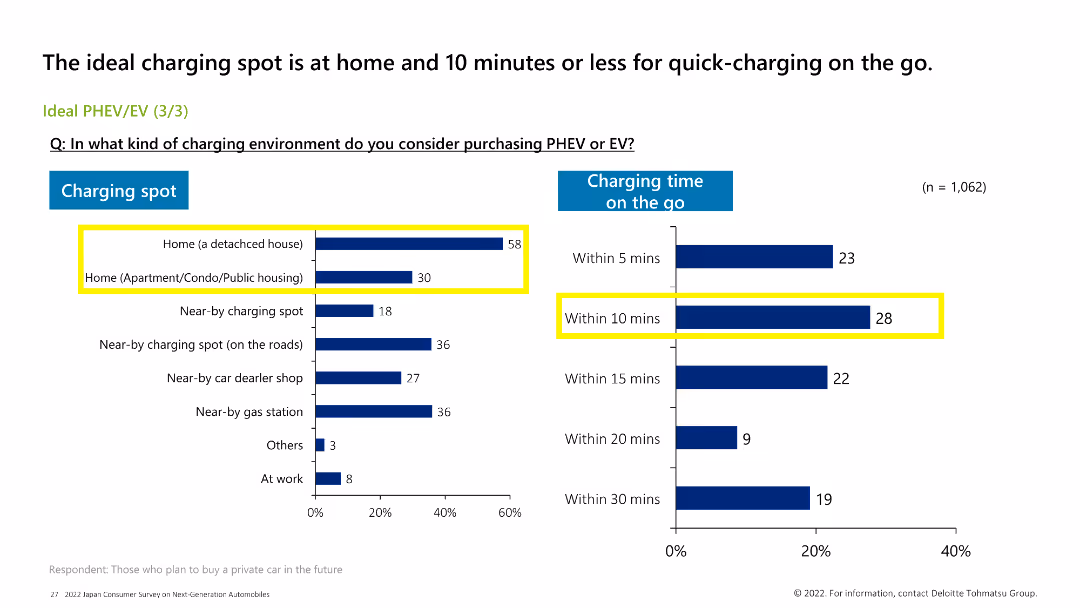
The slide features a bar chart on the left showing preferred charging spots, and a column chart on the right showing preferred charging times on the go. Color coding differentiates the data.
Market Analysis and Trends
Transportation & Logistics
The slide highlights the preferred charging locations for PHEV/EV and the desired charging times, with the most preferred location being at home and the preferred charging time within 10 mins.
PHEV, EV, charging spot, charging time, consumer preferences
false
The ideal charging spot is at home and 10 minutes or less for quick-charging on the go.2022 Japan Consumer Survey on Next-Generation Automobiles
Multiple Chart
Deloitte
View slide
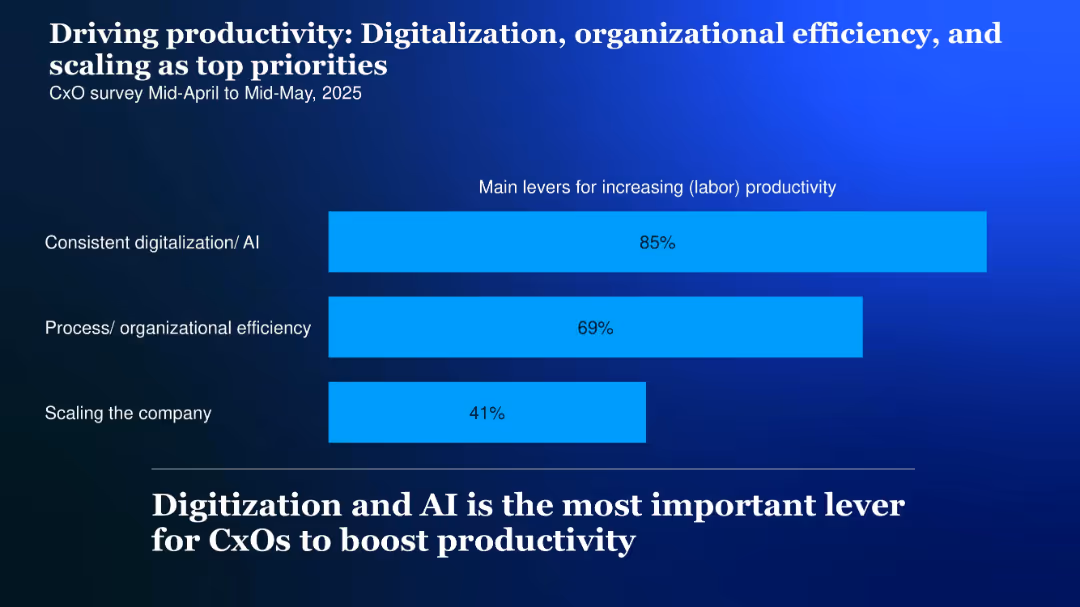
Horizontal bar chart with three bars showing productivity drivers, labeled on the left; high-contrast background and bold headline
Performance Metrics and KPIs
Technology & Software
CxOs cite digitalization and AI (85%), organizational efficiency (69%), and company scaling (41%) as top productivity levers for 2025.
Productivity, digitalization, AI, scaling, efficiency, levers, 2025
false
Driving productivity: Digitalization, organizational efficiency, and scaling as top prioritiesA pivot for Germany
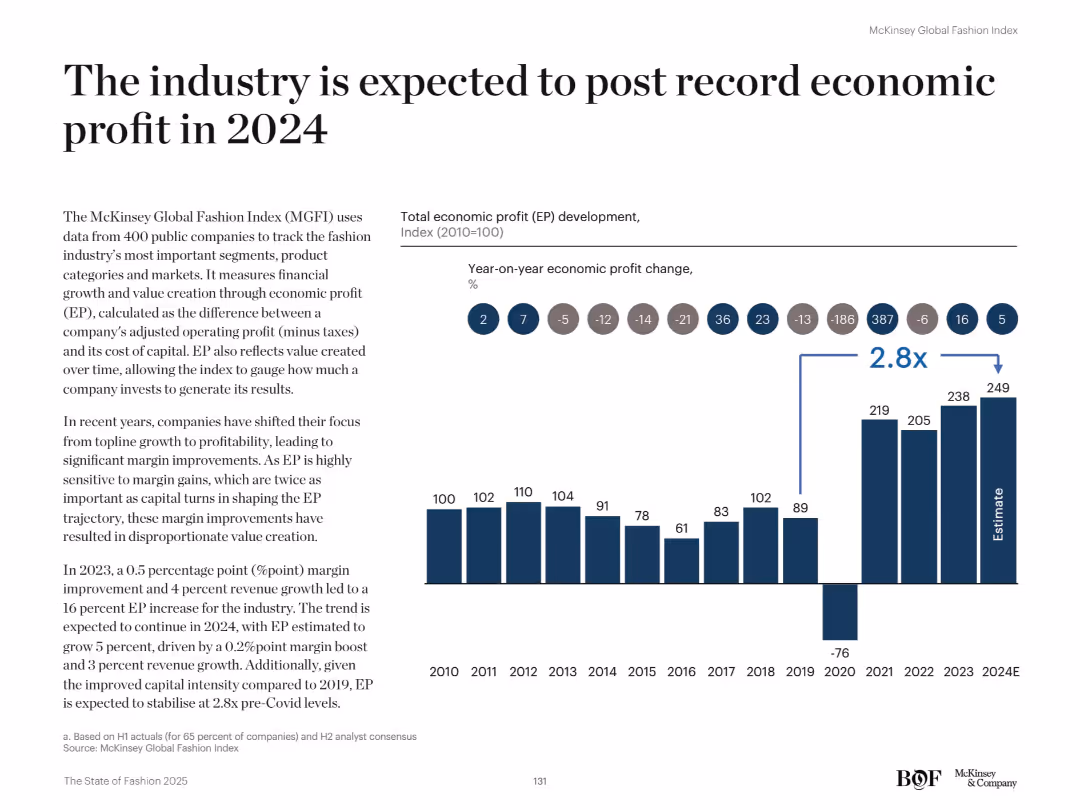
Single Chart
McKinsey
View slide
Left-aligned explanatory text with a right-side bar chart showing economic profit (EP) from 2010 to 2024E.
Financial Performance
Retail & E-commerce
The slide forecasts record-high economic profit (EP) in 2024 for the fashion industry, highlighting a 2.8x increase over pre-pandemic levels. It attributes this to margin improvements and improved capital intensity despite slower topline growth.
Economic profit, EP, financial growth, fashion index, profitability, capital intensity, 2024 forecast, margin gains, industry outlook, revenue
false
The industry is expected to post record economic profit in 2024The State of Fashion 2025
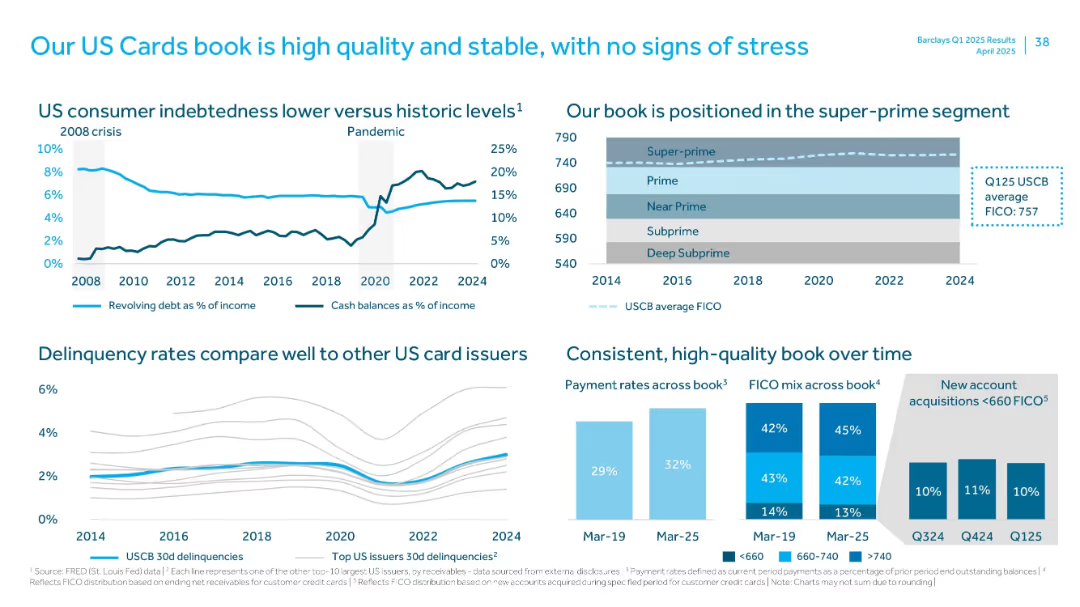
Mixed Chart
McKinsey
View slide
Multi-panel layout with line charts, bar graphs, and a FICO score distribution visual
Customer and Market Segmentation
Financial Services
Highlights the strength of the US cards portfolio, with high FICO score concentration, low delinquency rates, favorable payment rates, and a comparative view versus other issuers, indicating credit quality and stability.
FICO, delinquency, payment rate, super-prime, US cards
false
Our US Cards book is high quality and stableQ1 2025 Results Presentation
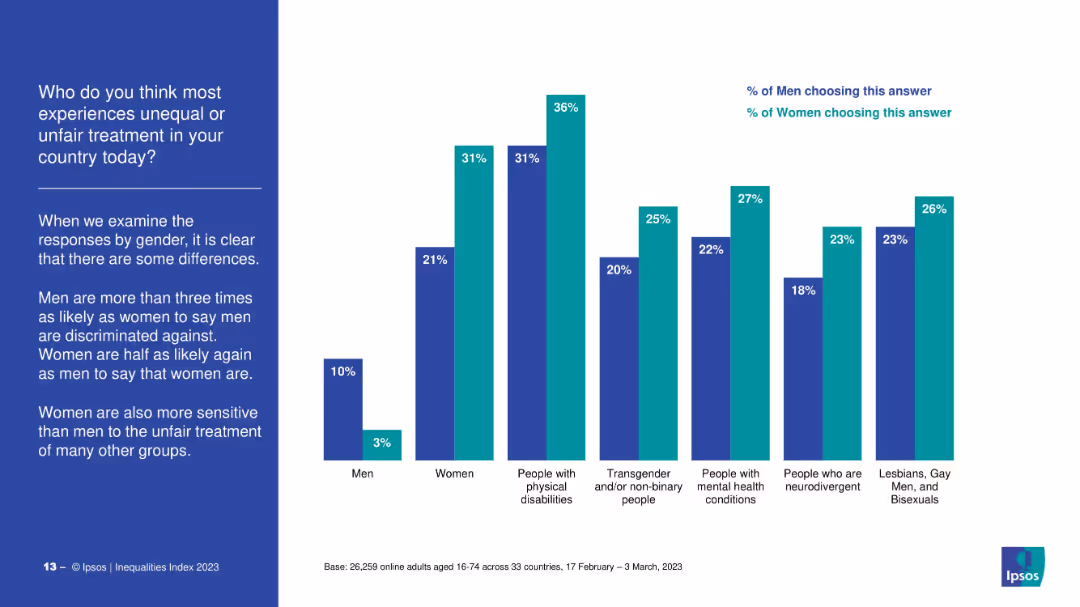
Multiple Chart
Barclays
View slide
Bar chart comparison of men’s and women’s survey responses across various groups (e.g., people with disabilities, LGBTQ+, neurodivergent individuals). Left-side commentary explains gender differences in perceptions.
Market Analysis and Trends
Government & Public Sector
The slide contrasts how men and women perceive discrimination faced by various groups. Women show higher sensitivity to the unfair treatment of others, while men are more likely to believe that men face discrimination. Significant gender gaps are noted across most categories.
discrimination, gender gap, minorities, disability, LGBTQ+, survey results, public perception, inequality, Ipsos
false
Who do you think most experiences unequal or unfair treatment in your country today?IPSOS EQUALITIES INDEX 2023
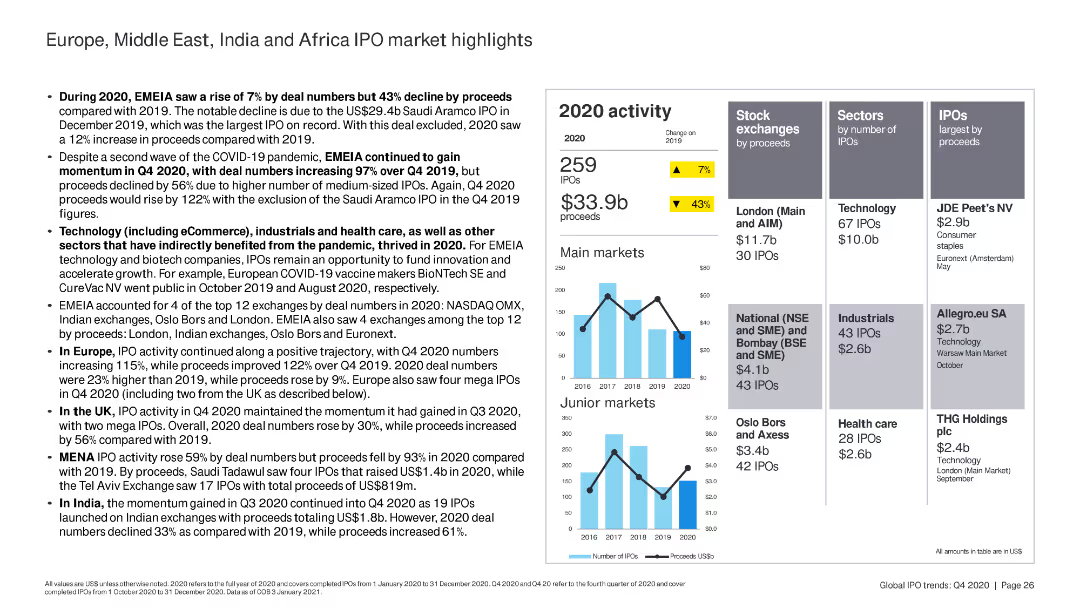
Mixed Chart
IPSOS
View slide
The slide features a column chart with data on 2020 IPO activity in main and junior markets. It also includes a text section summarizing IPO trends across EMEIA regions, with key statistics and sector analysis.
Market Analysis and Trends
Financial Services
Provides an overview of IPO market trends in EMEIA for 2020, noting a decline in proceeds despite an increase in deal numbers. Highlights sector performance and regional market activities.
IPO, EMEIA, market trends, sectors, 2020, financial services, Europe, Middle East, India, Africa
false
Europe, Middle East, India and Africa IPO market highlightsIs your business model resilient enough to weather any storm?
Multiple Chart
EY
View slide
The slide features a bar chart showing the potential impact of the vacant home tax with categories: won’t impact at all, sell my investment property, and have tenants rent from me.
Regulatory and Compliance
Real Estate & Construction
This slide evaluates how a vacant home tax would impact investment property decisions, showing different responses from investors.
vacant home tax, property sale, investment, regulatory impact, bar chart, investor response
false
Potential Impact of Vacant Home TaxMarket Year in Review and Outlook 2021
Single Chart
IPSOS
View slide
The slide has five vertical sections each with a distinct color header, icons, and lists. It visually outlines strategic areas of growth for asset and wealth management, including expanding the global private bank and scaling asset management, among others. Each section has a number, an icon, and bullet points detailing strategic actions.
Strategic Planning
Financial Services
This slide discusses strategic growth drivers over the next decade in asset and wealth management, like expanding global reach and executing mergers and acquisitions, aimed at financial and investment professionals. It might be used in strategic planning or investor relations meetings.
wealth management, asset management, growth drivers, strategy
false
AWM growth drivers for the next decadeAsset & Wealth Management 2022
Pillar
JP Morgan
View slide
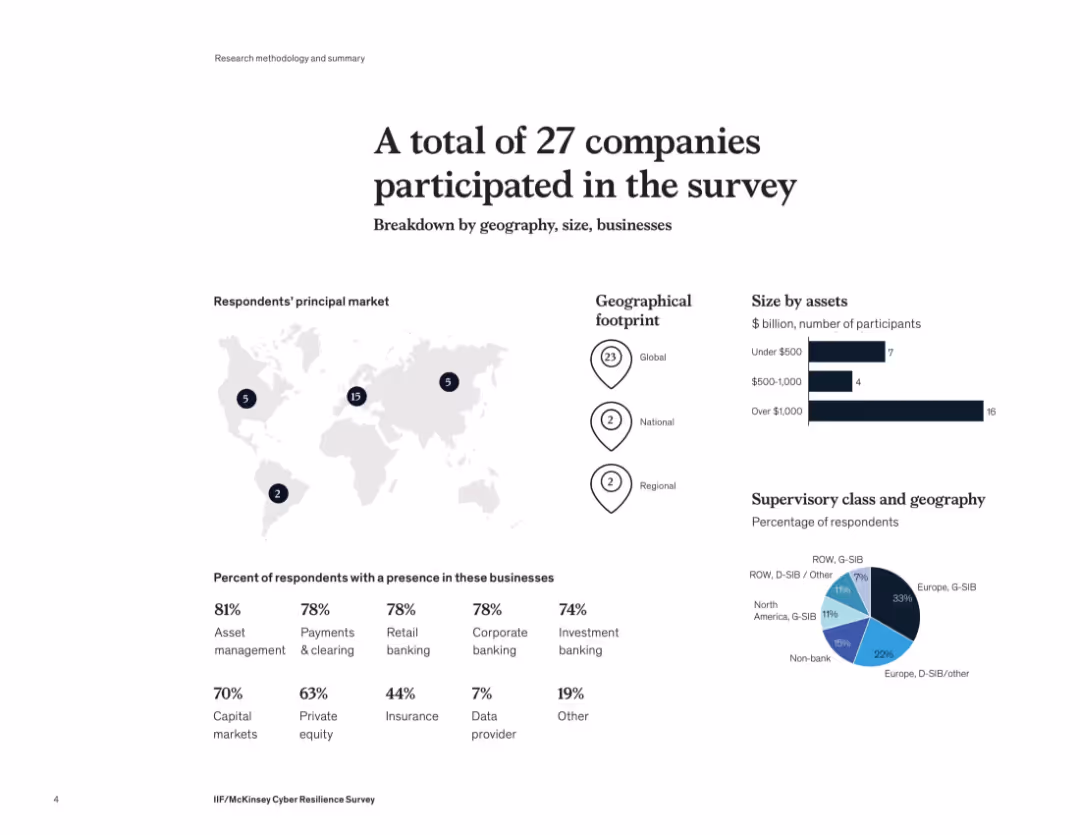
Infographic layout with maps, bar charts, and pie charts showing company distribution by geography, size, and business sector. Clean and visually segmented layout with dark blue icons and map markers.
Industry Overview
Financial Services
This slide summarizes participant demographics in a McKinsey cyber resilience survey. The 27 companies surveyed span global to regional operations, mostly with over $1B in assets. Key sectors represented include asset management, retail banking, investment banking, and private equity. A geographic breakdown highlights strong European participation.
cyber resilience, financial services, global footprint, asset size, banking, survey demographics
false
A total of 27 companies participated in the surveyIIF/McKinsey Cyber Resilience Survey
Multiple Chart
McKinsey
View slide
The slide shows two horizontal bar charts comparing how CFOs spend their time on different objectives and in practice, split between formal and informal settings. It also includes a quote from a private equity investor.
Financial Performance
Financial Services
Details the allocation of CFOs' time across various functions, emphasizing differences between formal and informal practices. Highlights the importance of flexibility and adaptability in CFO roles, supported by a quote from a private equity investor discussing the need for versatile financial leadership.
CFO, Time Allocation, Financial Management, Leadership, Priorities
false
Chart 3 – How CFOs spend their time – in their objectives and in practiceThe importance of being human in a digital world
Mixed Chart
Deloitte
View slide
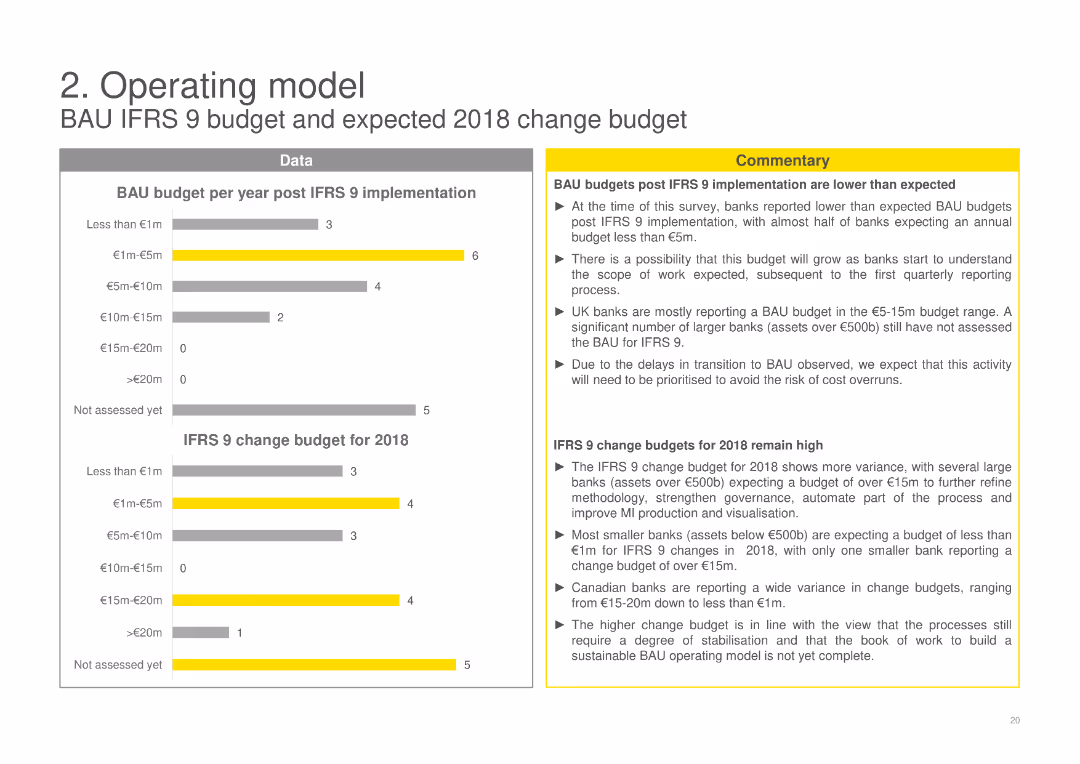
Contains column charts showing the BAU budget per year post-IFRS 9 implementation and the IFRS 9 change budget for 2018, with commentary discussing the variances in budget expectations and actual allocations among banks.
Operational Efficiency
Financial Services
Discusses the budget allocations for BAU post-IFRS 9 and change budgets for 2018, highlighting variances and expectations among banks, and the impact on financial planning and budgeting post-implementation.
BAU budget, IFRS 9, financial planning, budget variance, financial services
false
BAU IFRS 9 budget and expected 2018 change budgetEY IFRS 9 Impairment Banking Survey
Multiple Chart
EY
View slide
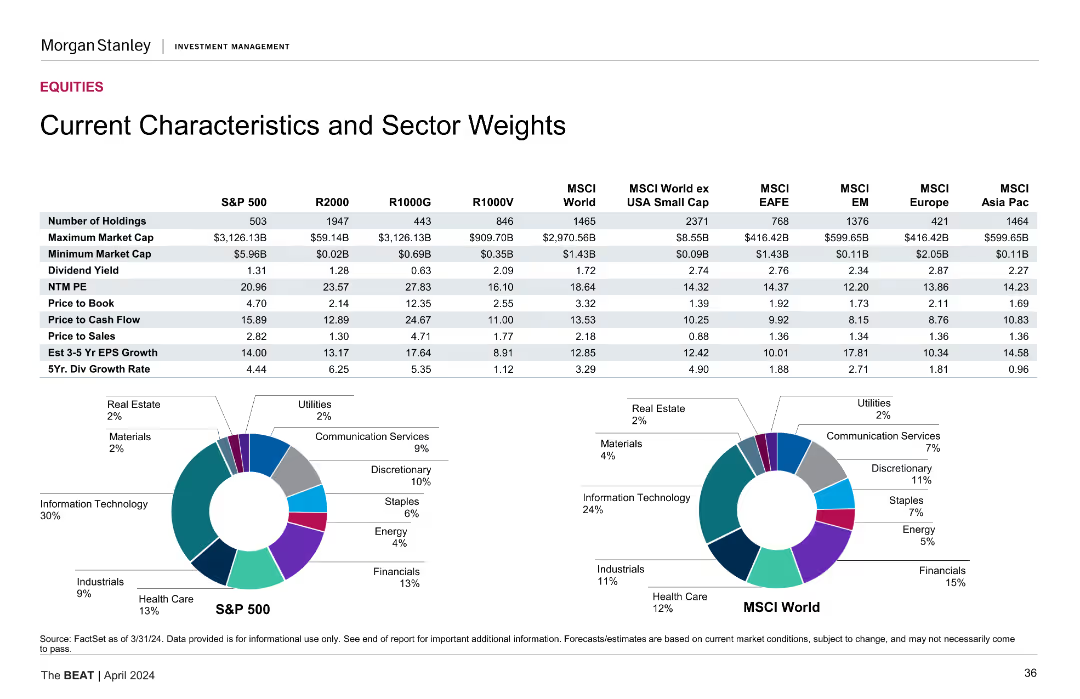
The slide includes a detailed table listing various characteristics and sector weights of different indices, along with two pie charts showing sector weights distribution.
Market Analysis and Trends
Financial Services
It provides detailed data on the characteristics and sector weights of several indices, such as S&P 500, R2000, MSCI, highlighting differences in market cap, P/E, etc.
sector weights, indices, financial characteristics, market cap
false
Current Characteristics and Sector WeightsThe BEAT April 2024
Multiple Chart
Morgan Stanley
View slide
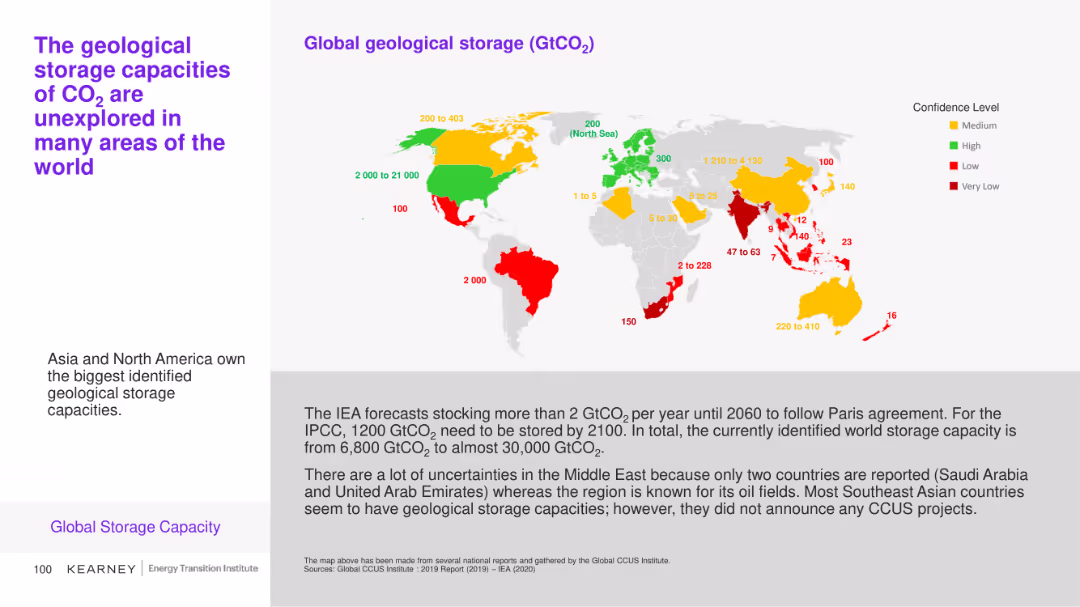
This slide includes a map and a bar chart illustrating the global geological storage capacities of CO2 with varying confidence levels across different regions. Color coding (green, yellow, red) indicates confidence levels.
Market Analysis and Trends
Environmental Services & Sustainability
The slide explores the identified geological storage capacities for CO2 globally, emphasizing areas with the highest potential and the uncertainties in certain regions like the Middle East.
CO2 storage, geological capacity, global map, confidence levels
false
Global geological storage (GtCO2)Carbon Capture Utilization and Storage
Graphic
Kearney
View slide
The slide is divided into six sections, each describing different services PwC offers: acquisition strategy, M&A advisory, operational assessment, tax support, post-acquisition support, and value identification.
Strategic Planning
Professional Services
The slide outlines PwC's comprehensive service offerings to support clients before, during, and after deals. Services include strategy development, M&A advisory, operational improvements, tax and legal support, and post-acquisition integration.
PwC, services, strategic planning, advisory, support
false
How can PwC Help?2nd Global Crypto M&A and Fundraising Report
Pillar
PwC/Strategy&
View slide
Displays a table comparing sin tax rates for various products over two years, alongside an illustrative crowd of diverse people.
Regulatory and Compliance
Government & Public Sector
Provides details on the adjustments in sin tax rates for alcoholic beverages and cigarettes in Namibia, reflecting policy changes in consumer taxation.
sin taxes, tax rates, Namibia, alcoholic beverages, cigarettes, consumer taxation
false
Sin TaxesBudget on a plate 2019/2020
Table
PwC/Strategy&
View slide
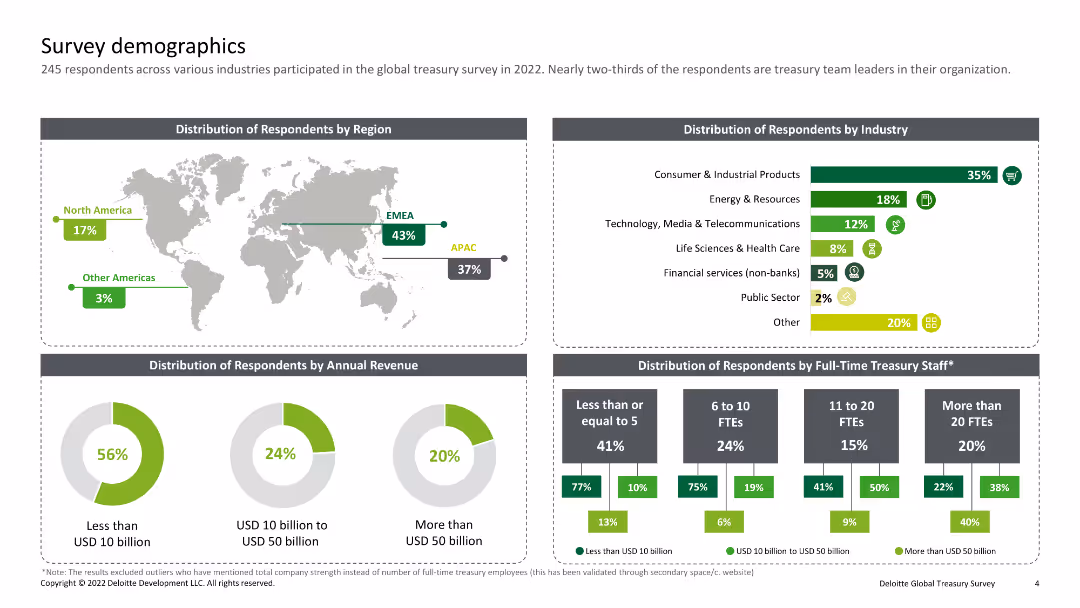
Combination of a world map and several pie charts and bar charts. Displays the distribution of survey respondents by region, industry, annual revenue, and full-time treasury staff.
Market Analysis and Trends
Professional Services
This slide presents the demographics of survey respondents, detailing their geographical distribution, industry sectors, company revenue sizes, and the number of full-time treasury staff employed.
Survey, Demographics, Region, Industry, Revenue
false
Survey demographics 245 respondents across various industries participated in the global treasury survey in 2022. Nearly two-thirds of the respondents are treasury team leaders in their organization.Deloitte Global Treasury Survey
Multiple Chart
Deloitte
View slide
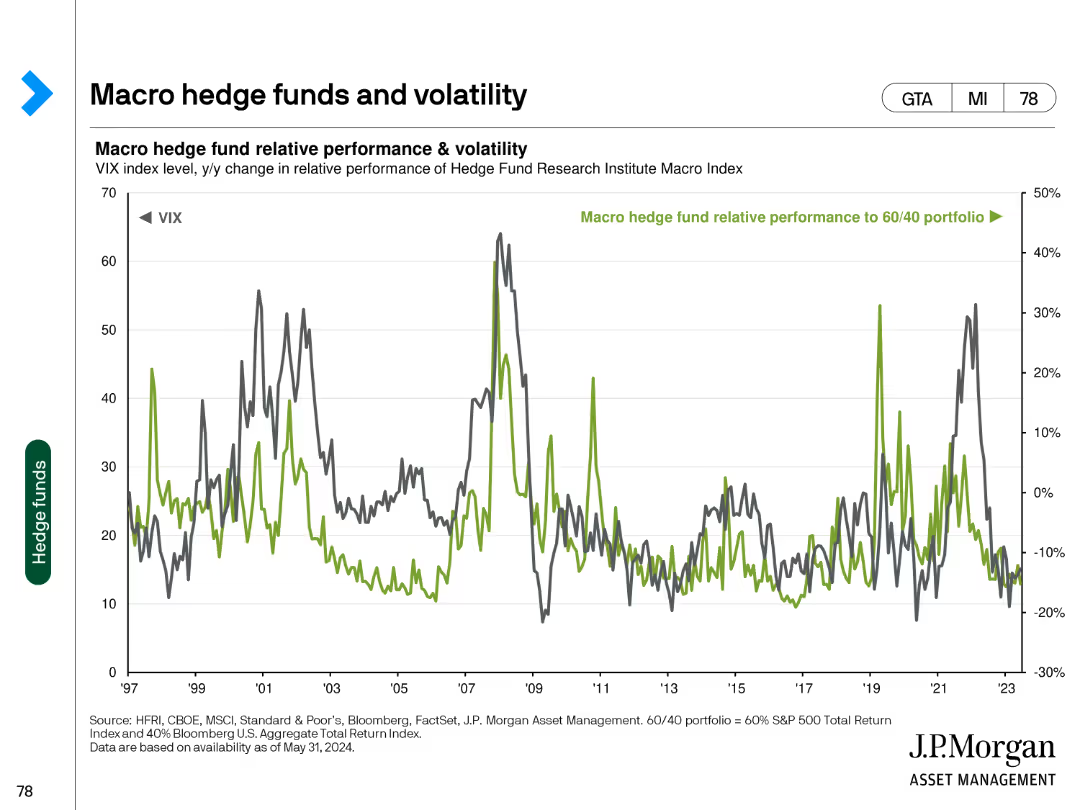
This slide features a line chart showing macro hedge fund relative performance and volatility, measured against the VIX index and a 60/40 portfolio from 1997 to 2023.
Risk Assessment and Management
Financial Services
The slide assesses the performance and volatility of macro hedge funds, comparing them to market volatility (VIX) and a traditional investment portfolio.
hedge funds, macro, volatility, VIX, performance
false
Macro hedge funds and volatilityGuide to Alternatives
Single Chart
JP Morgan
View slide
Four icons with corresponding text blocks outlining strategic concepts, set against a background with an organizational image.
Strategic Planning
Financial Services
Outlines a strategic framework for an operating model in finance, touching on client relations, global principles, and sustainability.
Strategy, operating model, client focus, global, diversified, scale, financial services
false
We have a proven operating model that is supported by a consistent strategic frameworkInverstors Day 2023
Pillar
JP Morgan
View slide
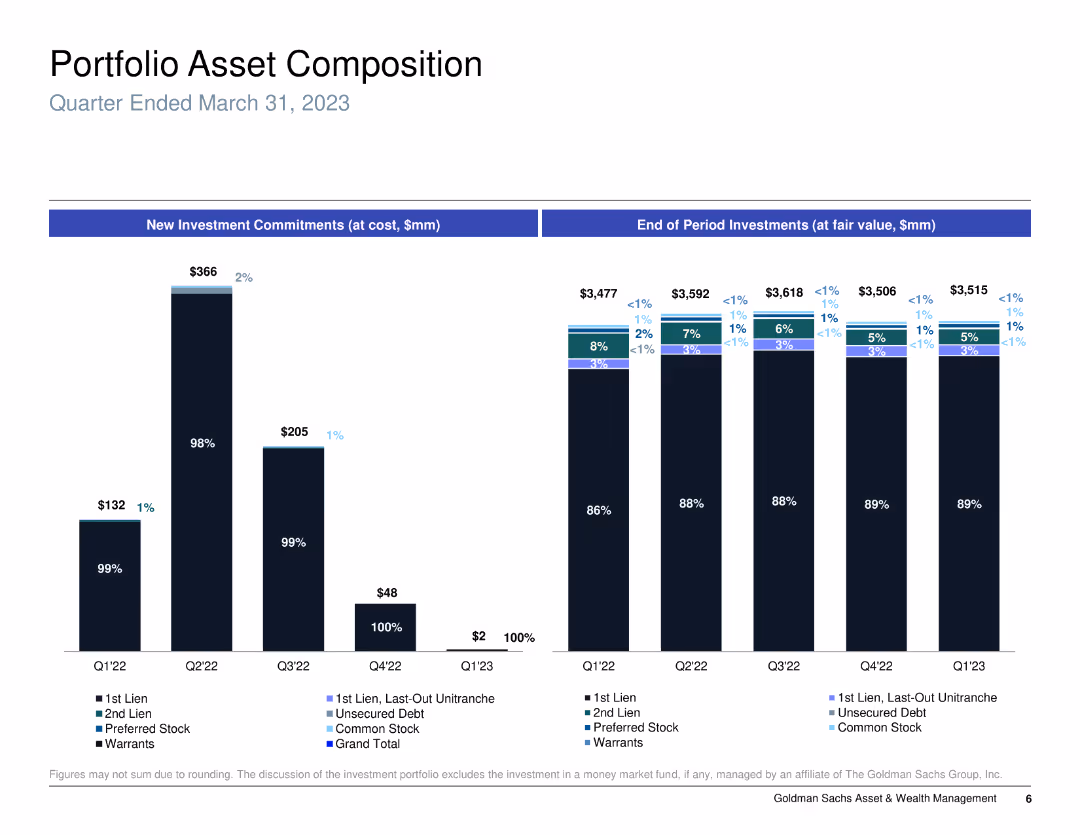
Column chart showing new investment commitments and end of period investments, categorized by type of asset.
Investment Analysis
Financial Services
Analyzes the portfolio asset composition for a specific period, detailing types of investments and their changes over time.
portfolio, assets, investment, commitments
false
Portfolio Asset Composition Quarter Ended March 31, 2023Goldman Sachs BDC, Inc. Investor Presentation
Multiple Chart
Goldman Sachs
View slide
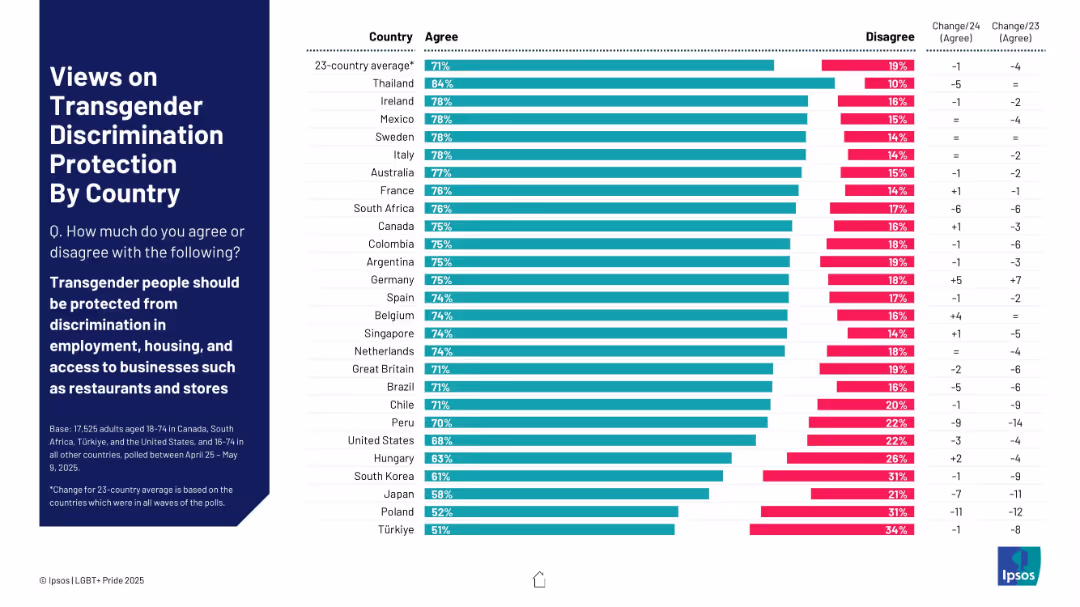
Horizontal bar chart by country; comparison of agreement/disagreement levels
Market Analysis and Trends
Government & Public Sector
This slide examines public agreement on protecting transgender individuals from discrimination in work and business settings. Thailand shows the highest agreement (84%), while Türkiye and Poland have the lowest (51%–52%). Changes over two years reflect regional policy shifts and public sentiment evolution.
transgender rights, discrimination, workplace, agreement, international, social attitudes, Ipsos
false
Views on Transgender Discrimination Protection...IPSOS LGBT+ PRIDE REPORT 2025
Mixed Chart
IPSOS
View slide
A column chart displaying Nestlé's market share in terms of consumer expenditure across various countries, emphasizing both developed and emerging markets.
Market Analysis and Trends
Consumer Goods
Evaluates Nestlé's current market share in consumer expenditure, suggesting growth opportunities in large markets. This slide is intended for strategizing market penetration and investment decisions.
market share, consumer expenditure, growth opportunities, Nestlé, emerging markets
false
Significant opportunity to increase share of stomach in large marketsDeutsche Bank 2023 Leveraging emerging market opportunities
Single Chart
Deutsche Bank
View slide
The slide features a bar chart showing coverage ratios of NPLs across CEE countries, along with a text block summarizing the current status and outlook. The left side contains a graph of loan moratoria across CEE.
Risk Assessment and Management
Financial Services
The slide provides a detailed view of NPL coverage ratios across CEE countries, discussing the implications and future outlook, and includes an overview of loan moratoria in the region.
NPL, coverage ratios, loan moratoria, CEE, outlook
false
Coverage Ratios of NPLs Across CEE (%)Deleveraging Europe
Multiple Chart
Deloitte
View slide
Slide displays a bar chart listing top investors in Manchester tech companies, with counts of equity deals from 2011–2020, alongside descriptive text.
Investment Analysis
Technology & Software
Reviews major tech investors in Manchester, showing the number of deals each investor has completed, indicating a strong investment landscape.
Manchester, investors, tech companies, equity deals, investment trends, Mercia Asset Management, Growth Company Angels, Northern Powerhouse, business funding
false
Manchester: Tech investorsUnlocking growth: Creating tech ecosystems to stimulate local economies
Mixed Chart
Barclays
View slide
The slide is segmented into two vertical sections, each with blue-toned headers and a list of bullet points with subtext. It features no charts or graphs but uses bold text and strategic use of whitespace for emphasis.
Client Case Studies
Financial Services
This slide provides insights into client engagement and execution metrics, highlighting increased digital engagement and robust trading volumes. It might be used in stakeholder meetings to discuss client relationship management.
client engagement, digital engagement, trading volumes, risk intermediation, asset inflows, customer service, disruption management, Goldman Sachs, performance metrics
false
Clients Turn to Goldman Sachs During Times of DisruptionGoldman Sachs Presentation to Bank of America Merrill Lynch Future of Financials Conference
Table
Goldman Sachs
View slide
Column chart showing the number of issuances and redemptions, accompanied by a table with details of 9M23 redemptions including ISIN, instrument, and more.
Financial Performance
Financial Services
Details the bond redemptions by UBS in 2023, providing specific data points for financial analysis and performance review.
Redemptions, Bonds, Financial Data, UBS, 2023
false
Year-to-date redemptionsThird quarter 2023 Fixed Income investor presentation
Mixed Chart
UBS
View slide
Features a divided column chart and a stacked bar chart with legends and percentages. The layout is clear, directing focus to the composition changes over time.
Risk Assessment and Management
Financial Services
Focuses on liquidity levels and high-quality liquid assets (HQLA), useful in discussions about financial stability and risk management.
liquidity, HQLA, stability, financial management
false
Liquidity – level of HQLA has remained stable, while composition has changedFIRM OVERVIEW 2020
Single Chart
JP Morgan
View slide
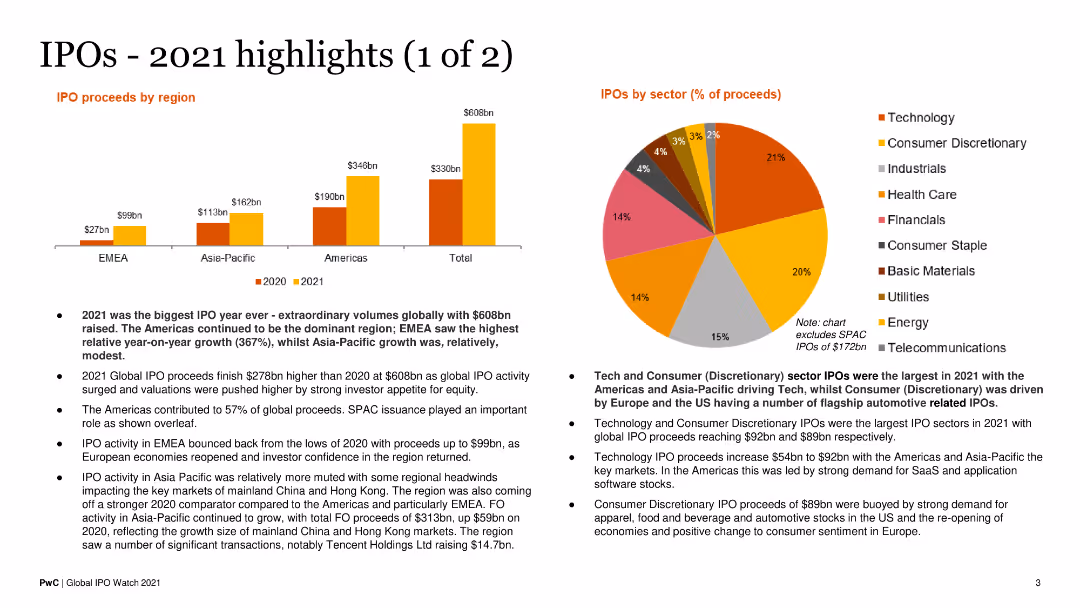
This slide includes a bar chart showing IPO proceeds by region and a pie chart for sector-wise proceeds. Text blocks explain key highlights. The layout is colorful and data-centric.
Financial Performance
Financial Services
It highlights the record-breaking IPO activity in 2021 across different regions and sectors, detailing the financial performance and growth trends.
IPO Proceeds, Regional Analysis, Sector Analysis, 2021 Highlights, Financial Trends
false
IPOs 2021 highlights (1 of 2)Global IPO Watch 2021 A PwC Global IPO Centre publication
Multiple Chart
PwC/Strategy&
View slide
The slide has three key sections with check marks, column charts showing revenue targets, and partnership logos for Apple and GM. The design is blue and white with teal highlights.
Market Analysis and Trends
Financial Services
This slide presents projected financial growth, emphasizing the market size, customer increase, and partnerships. It aims to showcase a long-term growth strategy using visual data representations, highlighting partnerships with major brands and future financial targets.
growth, market size, customers, partnerships, revenue
false
Consumer: Significant Long-Term Growth Opportunity at ScaleGoldman Sachs Strategic Update
Multiple Chart
Goldman Sachs
View slide
The slide contains a column chart comparing the importance of on-demand car functions between experts and consumers in Germany, the US, and China, with flags representing each country.
Market Analysis and Trends
Transportation & Logistics
The slide shows that experts in Germany and the US rate automated driving functions higher than consumers, emphasizing features like traffic jam pilot and battery range extension.
automated driving, on-demand functions, Germany, US, China, experts, consumers, battery range, traffic jam pilot, automotive
false
Experts in Germany / US attach even more importance than consumers to automated driving function attractivenessDigital Auto Report 2023 What consumers really want
Multiple Chart
PwC/Strategy&
View slide
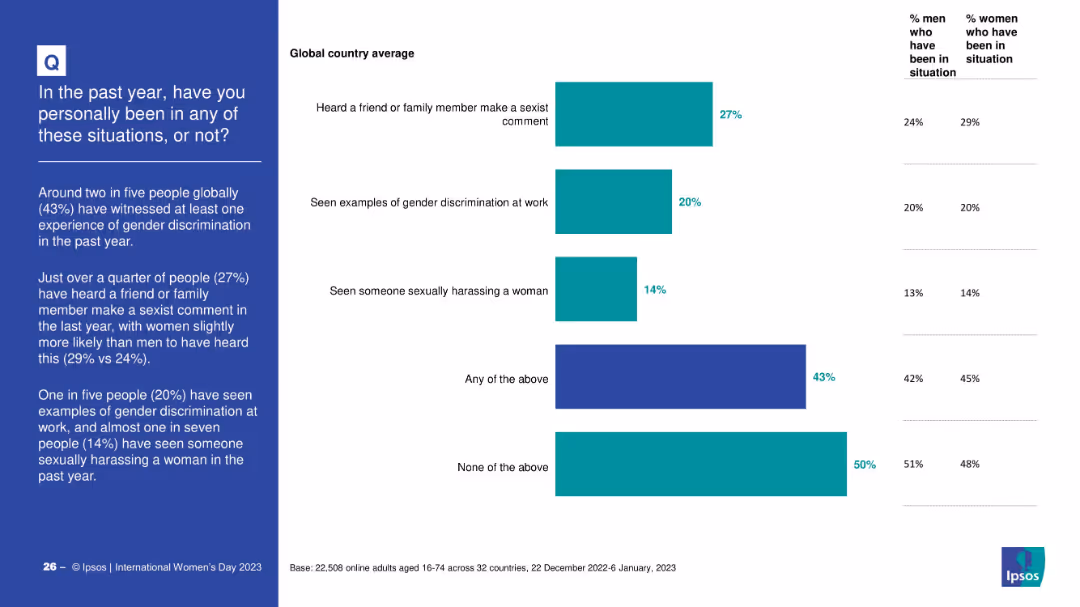
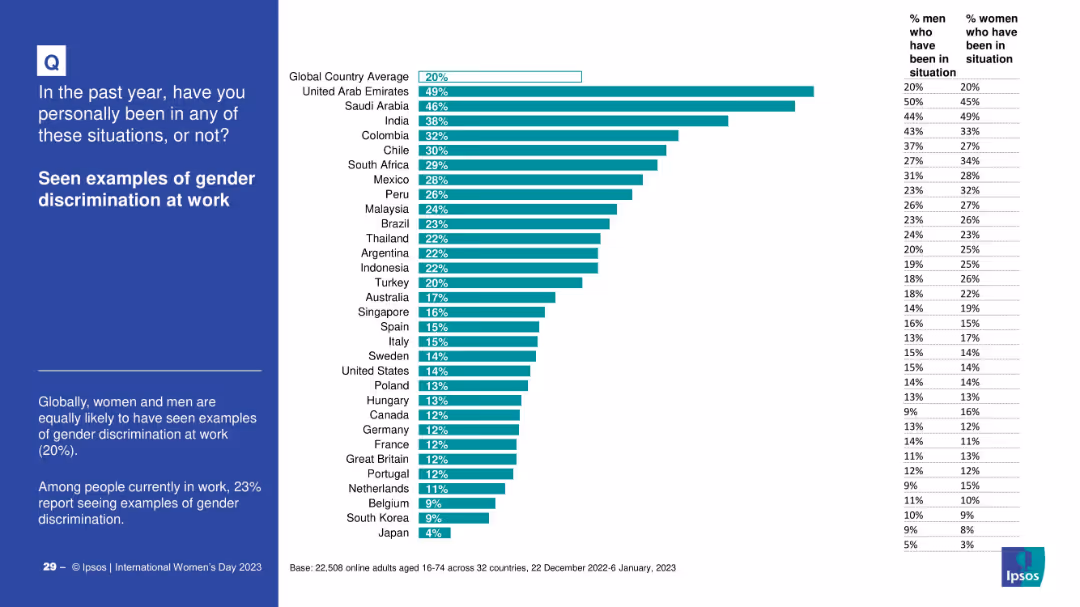
Horizontal bar chart displaying percentage of people who experienced or witnessed gender discrimination-related scenarios. Gender breakdown included. Left-aligned narrative explains key findings.
Risk Assessment and Management
Government & Public Sector
This slide reports global statistics on firsthand experiences of gender discrimination, including sexist comments, workplace discrimination, and sexual harassment. It notes a 43% incidence rate for any of these experiences and provides gender-specific comparisons.
gender bias, workplace discrimination, sexual harassment, global average, social behavior, lived experiences
false
Witnessing Gender Discrimination – Global OverviewINTERNATIONAL WOMEN'S DAY 2023
Mixed Chart
IPSOS
View slide
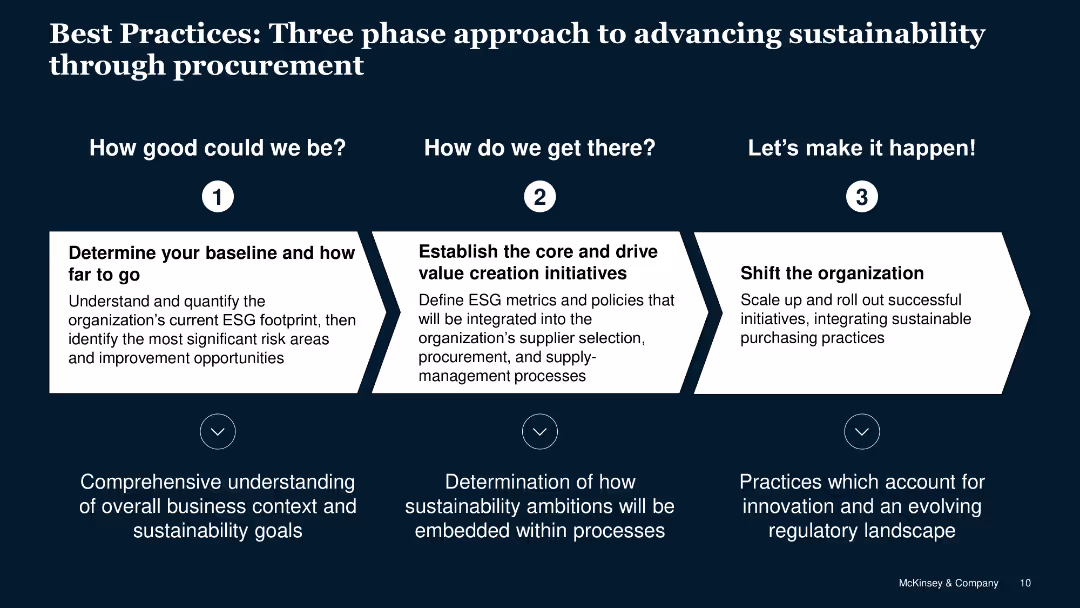
Step-by-step flow for advancing sustainability through procurement with detailed text descriptions.
Strategic Planning
Professional Services
Outlines a three-phase approach to integrating sustainable practices into procurement strategies.
best practices, sustainability, procurement, approach, phases
false
Best Practices: Three phase approach to advancing sustainability through procurementBest Practices in Private Sector Sustainable Procurement
Linear Flow
McKinsey
View slide
A column chart on the slide displays top ESG characteristics included in investment decisions. An image of a green building is on the left.
Market Analysis and Trends
Financial Services
Investigates which ESG characteristics investors consider in their decision-making process, highlighting governance, climate risk, and other factors.
ESG, characteristics, governance, climate risk, investors, investment decisions, green building, analysis
false
Investor demand for ESG solutions is growing, with governance and climate risk the top areas of interestCan resilience shape a shifting landscape?
Mixed Chart
EY
View slide
The slide outlines team, category, and supplier excellence pillars with icons and a diagram of Kearney's House of Purchasing and SupplySM.
Human Resources and Talent Management
Professional Services
It describes the pillars for sustained procurement performance, highlighting the roles of team excellence, category excellence, and supplier excellence.
Team excellence, category excellence, supplier excellence, procurement, performance, talent
false
2. Capabilities – Team, Category and Supplier excellence are the pillars for sustained performanceExcellence in Procurement
Header Vertical
Kearney
View slide
Features a complex, colorful circular diagram appearing like a pie chart representing different sectors within the FoodTech industry.
Market Analysis and Trends
Agriculture & Food Production
Maps the key players in the 2021 FoodTech ecosystem, highlighting their focus areas and contributions.
FoodTech, ecosystem, mapping, industry, trends
false
The 2021 Ecosystem mapped across the driving trendsThe Swiss FoodTech Ecosystem 2021
Diagram
Accenture
View slide
Title slide with a cityscape background, introducing a talk on the impact of Fintech on the financial services industry.
Industry Overview
Financial Services
Sets the stage for a presentation on Fintech’s influence on financial services, likely opening a detailed discussion.
Fintech, Financial Services, Industry Change, Innovation, Strategic Partnerships
false
How Fintech has changed the Financial Services IndustryHow Fintech has changed the Financial Services Industry
Title
Citigroup
View slide
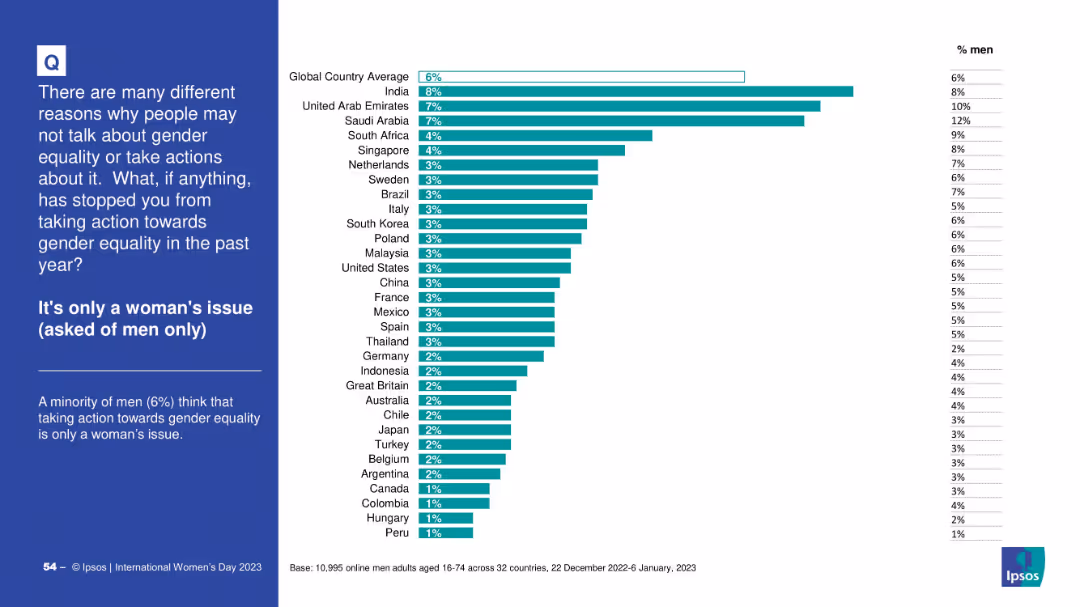
Men-only bar chart indicating belief that gender equality is a women’s issue; consistent design with previous charts; note on sample base at bottom.
Customer and Market Segmentation
Government & Public Sector
The chart focuses on male respondents who see gender equality as solely a women’s issue. The global average is 6%, with India and UAE leading. It reflects cultural and gendered perceptions of responsibility.
men, women's issue, gender equality, segmentation, Ipsos, perception
false
It's only a woman's issue (asked of men only)INTERNATIONAL WOMEN'S DAY 2023
Mixed Chart
IPSOS
View slide
A highlighted map of Europe with key strategy points listed to the left, and a descriptive heading at the top. Neat layout with icons and colored text boxes.
Strategic Planning
Financial Services
Focuses on the growth and strategic positioning within the developed European markets, outlining opportunities and initiatives to strengthen the company's presence.
Strategy, Europe, market growth, development, positioning
false
Substantial and Growing Footprint in Developed MarketsGoldman Sachs Investor Day
Table
Goldman Sachs
View slide
Central diagram with radiating points to highlight connections.
Technology and Digital Transformation
Professional Services
Explores various components of HR transformation, emphasizing technology and strategy for future workforce development.
HR, Innovation, Technology, Workforce, Strategy
false
What is the Future of HR?Future of Work - How work is enabled?
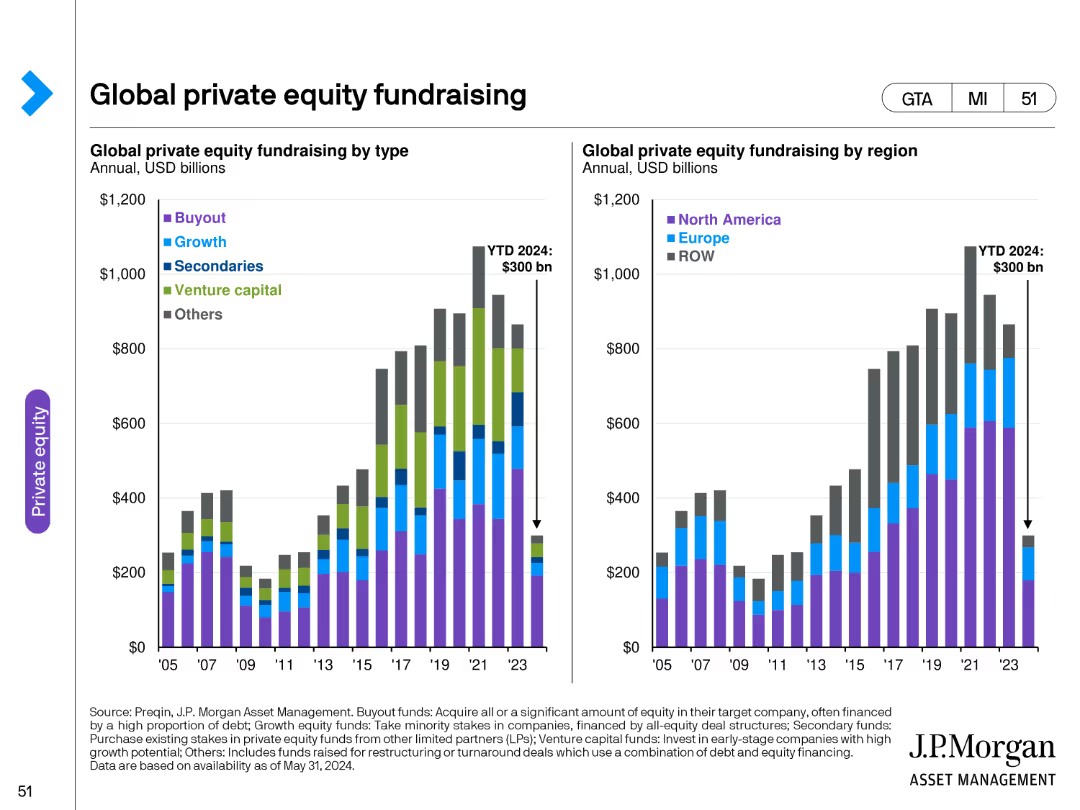
Single Chart
Deloitte
View slide
The slide contains two column charts: one showing global private equity fundraising by type and the other by region, with clear color coding for different types.
Investment Analysis
Financial Services
It offers a detailed overview of global private equity fundraising activities, breaking down the data by types and regions to highlight trends and market dynamics.
private equity, fundraising, global, type, region, data analysis, trends, investment, financial
false
Global private equity fundraisingGuide to Alternatives
Multiple Chart
JP Morgan
View slide
The slide has a text box with key recommendations, each accompanied by a relevant icon. The background is green with white text.
Strategic Planning
Professional Services
The slide offers strategic recommendations for marketers, emphasizing consumer trust, the power of influencers, and brand safety in their marketing strategies.
recommendations, marketers, strategy, influencers, brand safety
false
Key recommendations for marketers Make a promise to consumersEra of alignment
Header Vertical
Nielsen
View slide
Presents a column chart tracking investor priorities for financially healthy companies over time, shown in a green gradient, highlighting shifts in investor focus during the COVID-19 pandemic.
Investment Analysis
Financial Services
Details the changing investment priorities among investors, particularly the balance between long-term growth and short-term performance expectations in response to global economic shifts.
investment priorities, COVID-19, long-term growth, short-term performance
false
In making investment decisions and recommendations, investors prioritize long-term growth, followed by FCF generation, return on capital, and margin potentialBCG Investor Perspectives Series
Multiple Chart
BCG
View slide
Contains three column and icons representing different strategic areas like "Ecosystem co-innovation", "Transition support", and "Regional collaboration". It includes quotes and a brief analysis of SEA's current status in green initiatives.
Strategic Planning
Environmental Services & Sustainability
Discusses strategies for expanding the green economy in SEA through collaboration and innovation across various sectors, emphasizing the need for transition support and regional cooperation to address environmental challenges.
green economy, SEA, innovation, collaboration, sustainability
false
Ultimately, scaling SEA’s green economy will need collective action…Southeast Asia’s Green Economy 2021 Report: Opportunities on the Road to Net Zero
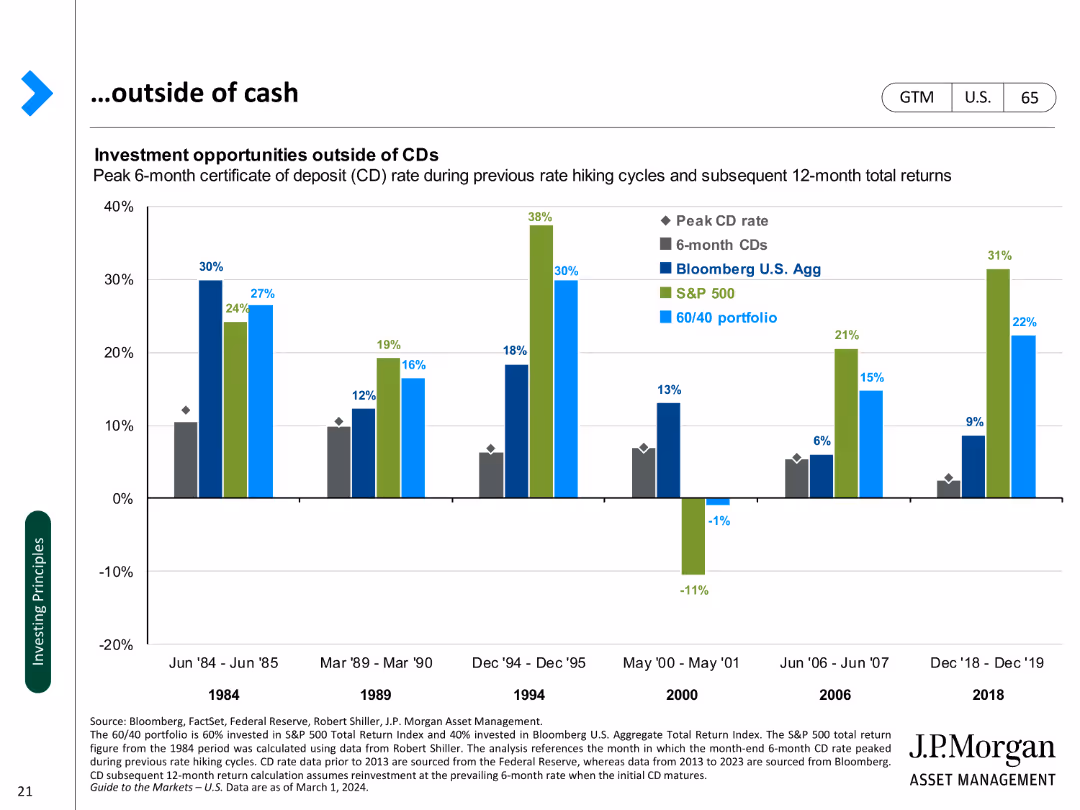
Pillar
Bain
View slide
A column chart comparing investment returns of CDs, bonds, and portfolios during past rate hiking cycles.
Investment Analysis
Financial Services
Analyzes investment opportunities beyond cash, focusing on CDs, bonds, and portfolio performance during rate hikes.
Investment, CDs, bonds, portfolios, rate hikes, performance, analysis, opportunities, returns
false
…outside of cashGuide to the Markets U.S. | 1Q 2024
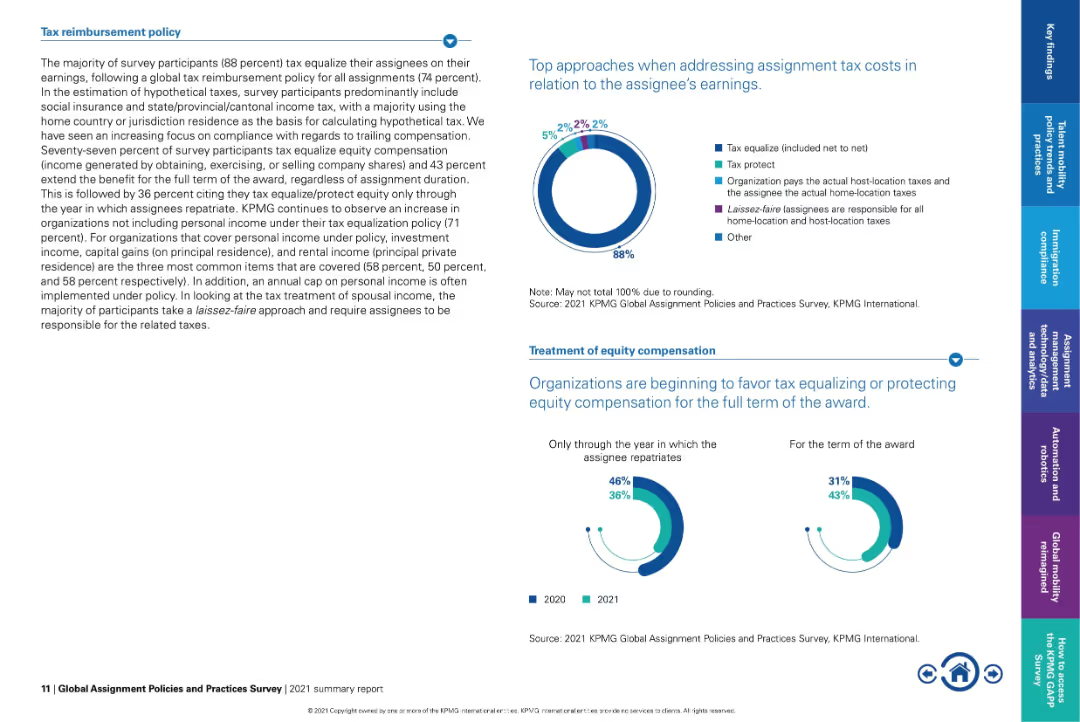
Single Chart
JP Morgan
View slide
Left-heavy text panel with explanatory text; right side contains donut charts and dual-year bar charts.
Regulatory and Compliance
Financial Services
Describes how organizations manage tax reimbursement for assignees, showing 88% use tax equalization. Discusses equity compensation treatment trends and highlights a shift towards full-term protection of awards rather than just through repatriation.
tax equalization, equity compensation, global assignments, tax policy, compliance, KPMG, expat tax treatment
false
Tax reimbursement policyGlobal Assignment Policies and Practices Survey
Multiple Chart
KPMG
View slide
The slide is dense with a mix of column charts and a data table. On the left, a table lists financial metrics with percentages. On the right, a column chart compares the efficiency ratio between 2023 and 2022, below which is a bullet point list of expense highlights.
Financial Performance
Financial Services
The slide presents a detailed financial analysis of quarterly expenses including compensation, transaction fees, and various operational costs, contrasted against previous quarters and years. An efficiency ratio graph highlights improvements in operational costs. This slide could be used in a financial review meeting to discuss cost management strategies and efficiency gains.
Expenses, Financial, Analysis, Efficiency, Cost Management, Operational, Quarterly, Comparison
false
ExpensesFull Year and Fourth Quarter 2023 Earnings Results Presentation
Mixed Chart
Goldman Sachs
View slide
The slide features a detailed case study on the renewable diesel market in the US, covering the description, process characteristics, global market overview, and drivers/barriers. It includes a column chart showing renewable diesel production from 2007 to 2018.
Client Case Studies
Energy & Utilities
This slide provides an in-depth analysis of the renewable diesel market in the US, detailing the production process, market potential, and the benefits and challenges of developing renewable diesel as a competitive alternative to biodiesel.
renewable diesel, US, case study, process description, market overview, drivers, barriers, production
false
Renewable diesel is mostly produced in the US and Western Europe and is competing with biodiesel1Developing sustainable carbon circularity Looking at advanced applications and business models
Mixed Chart
Kearney
View slide
Column chart showing the number of deals in Africa by education segment and total disclosed deal value.
Market Analysis and Trends
Education & Training
This slide provides an overview of investment deals in the education sector in Africa from 2014-2018.
education, investment, Africa, deals, chart
false
Core delivery sectors lead the wayEducation: Mega Trends and Opportunities in Africa
Mixed Chart
LEK
View slide
Title at the top, three-column format with text and checkmarks. The first column lists monetary targets, the second lists client propositions with checkmarks, and the third outlines progress with investment platforms.
Investment Analysis
Financial Services
Highlights the 5-year opportunity and strong client value propositions in third-party alternative investments, including capital reduction, franchise development, and capital efficiency optimization.
Investments, Capital, Alternatives, Efficiency, Multi-Asset Class
false
Grow Third Party AlternativesGoldman Sachs Investor Day
Table
Goldman Sachs
View slide
Slide presents a series of blue column charts tracking EBIT Margin Benefit from Cost Savings over several years.
Financial Performance
Consumer Goods
This slide demonstrates the company’s financial efficiency over time, highlighting consistent cost savings as reflected in EBIT margin improvements.
cost savings, EBIT margin, financial, yearly, analysis
false
Strong Track Record of Cost SavingsBarclays Global Consumer Staples Conference
Single Chart
Barclays
View slide
This slide features a comparative graph with a blue and grey color scheme, highlighting various risks associated with climate change in SEA compared to other regions. It includes elements like GDP impact, extreme weather risk, adaptive capacity, and an overall climate economic index.
Market Analysis and Trends
Environmental Services & Sustainability
Highlights SEA's vulnerability to climate change risks, contrasting it with other global regions and focusing on economic impacts, weather challenges, and adaptive capacity.
climate change, SEA, risks, consequences, GDP impact, extreme weather, adaptive capacity, economic index
false
Environment: SEA is one of the most heavily exposed regions to the risks and consequences of climate changee-Conomy SEA 2022 Through the waves, towards a sea of opportunity
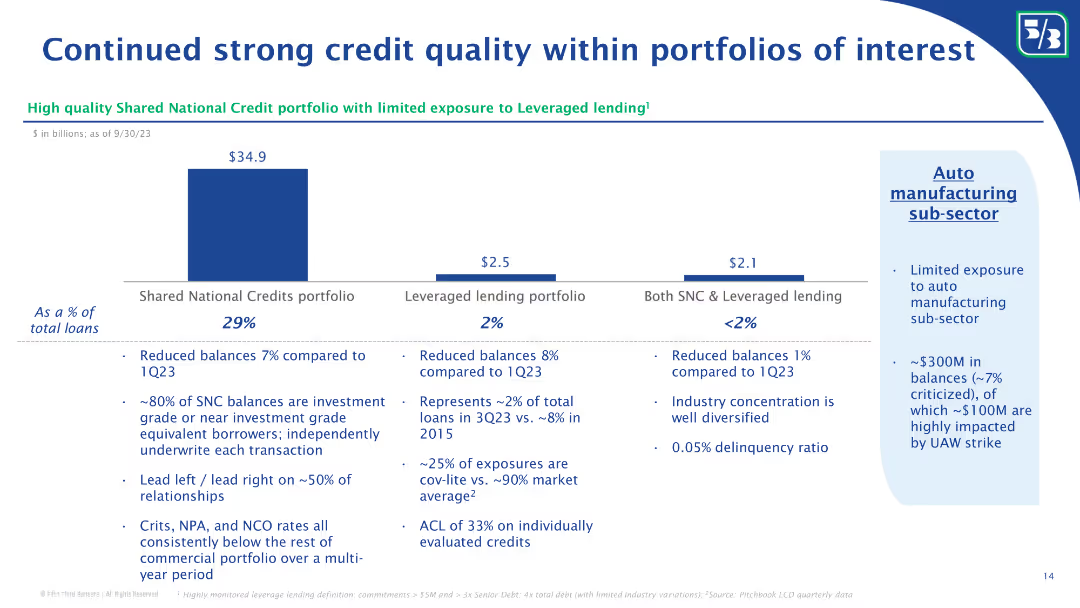
Table
Bain
View slide
This slide features a column chart with three columns representing different portfolios. The layout includes text boxes and numerical data.
Risk Assessment and Management
Financial Services
The slide analyzes the credit quality of different loan portfolios, highlighting their exposure to leveraged lending and the auto manufacturing sub-sector.
credit quality, loan portfolio, leveraged lending, exposure, auto manufacturing, sub-sector, column chart, financial analysis
false
Continued strong credit quality within portfolios of interestGoldman Sachs U.S. Financial Services Conference
Mixed Chart
Goldman Sachs
View slide
Utilizes boxes with numbers and a comparison table of mineral reserves by country to show Australia's resource wealth.
Market Analysis and Trends
Energy & Utilities
Highlights Australia's significant reserves of critical battery minerals, positioning it as a leader in lithium production.
lithium production, Australia, mineral reserves, critical resources
false
Australia has significant reserves of all critical battery minerals, and is the global leader in lithium productionCharging Ahead Australia’s battery powered future
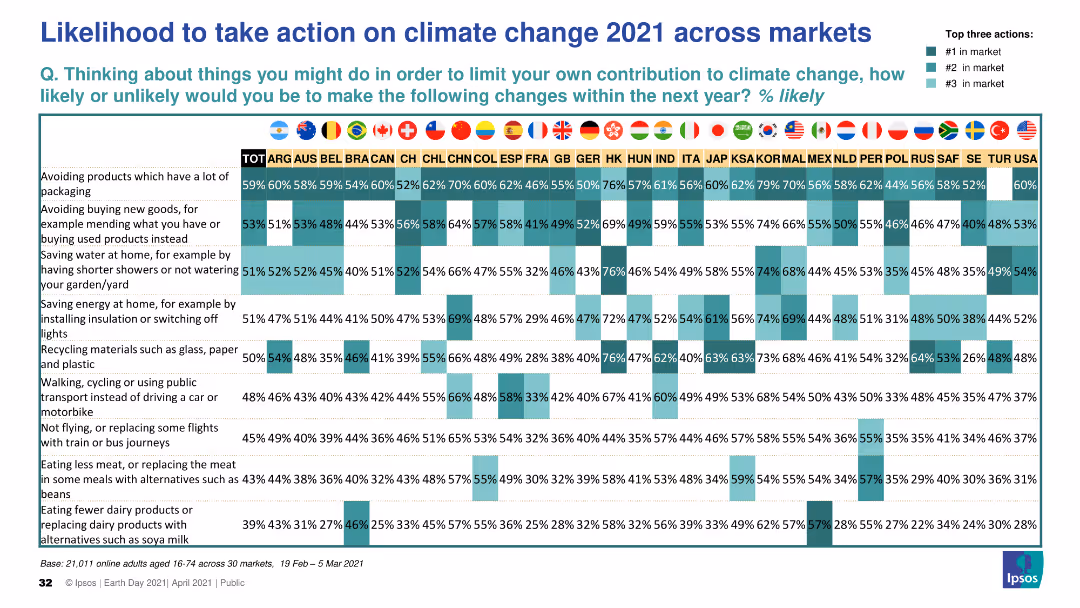
Table
Accenture
View slide
This slide presents a matrix chart displaying the likelihood of taking various climate change actions across multiple global markets in 2021. The chart uses color coding to indicate the likelihood and highlights top three actions per market.
Market Analysis and Trends
Environmental Services & Sustainability
The slide shows a comprehensive comparison of the likelihood of individuals taking specific climate change actions in 2021 across different global markets, with top actions highlighted for each market.
climate change, actions, likelihood, global markets, 2021
false
Likelihood to take action on climate change 2021 across marketsEARTH DAY 2021 GLOBAL ADVISOR https://www.ipsos.com/en/earth-day-2021-globally-people-wonder-whats-plan-tackle-climate-change Public opinion and action on climate change
Table
IPSOS
View slide
The slide displays three bar graphs comparing the importance of ESG considerations in VC investments across environmental, social, and governance aspects. Commentary text is placed to the right. The graphs use a grey-blue palette, maintaining a professional appearance.
Investment Analysis
Financial Services
The slide examines how venture capital investors rate the importance of ESG dimensions in their investment processes, with additional insights provided on the slide. This can be used in discussions about investment strategies and sustainability practices in the VC industry.
ESG, VC investment, importance rating, environmental, social, governance
false
Investors: Still in the early stages of wrapping ESG considerations into VC investment processese-Conomy SEA 2022 Through the waves, towards a sea of opportunity
Mixed Chart
Bain
View slide
Includes pie charts and circle diagrams illustrating capital allocation and generation.
Investment Analysis
Financial Services
Analyzes the distribution and generation of capital, highlighting areas of investment focus through 2026.
capital, investment, 2026, distribution, focus
false
Capital distributions: greater free capital available to shareholdersFY 2023 Results Announcement
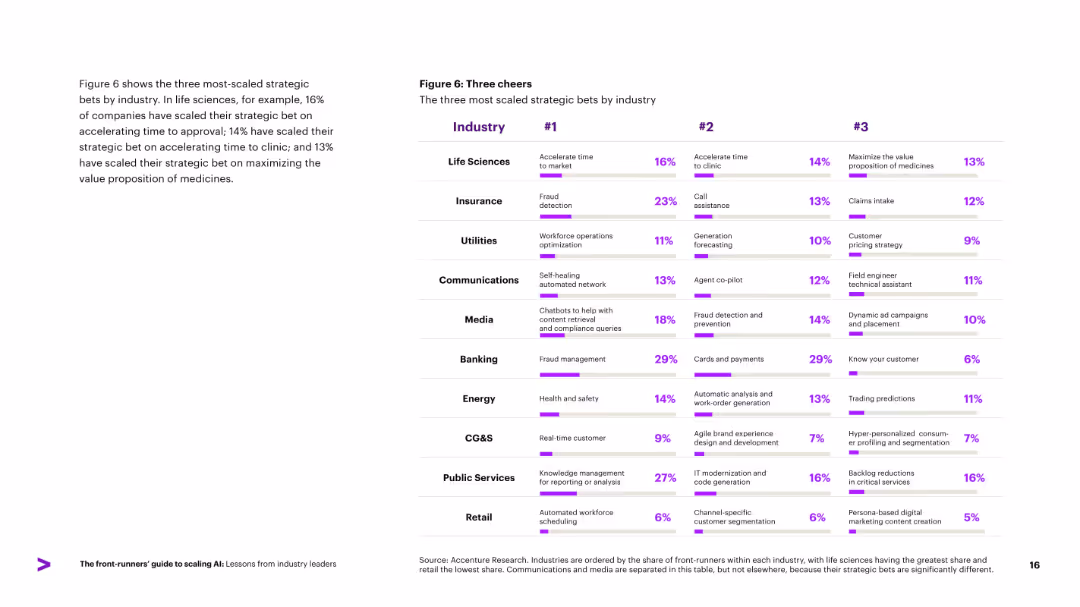
Single Chart
Barclays
View slide
Table listing the top three most-scaled strategic bets by industry. Percentages shown next to each bet. Left column includes explanatory text.
Strategic Planning
Artificial Intelligence
Outlines the top strategic bets being scaled in different industries, such as fraud detection in insurance and accelerating drug approval in life sciences. Percentages reveal where companies are focusing AI investments to achieve competitive advantage and industry-specific innovation.
strategic bets, scaling, industry focus, fraud detection, AI investment
false
Figure 6: Three cheersThe front-runners’ guide to scaling AI Lessons from industry leaders
Mixed Chart
Accenture
View slide
The slide features a world map showing bioenergy primary energy demand by continent for 2017 and 2040 under a stated policies scenario. Each continent's demand is displayed in terms of traditional biomass and advanced biomass.
Market Analysis and Trends
Energy & Utilities
This slide presents the primary energy demand for bioenergy by continent, comparing the data from 2017 and projections for 2040, highlighting the contributions of traditional and advanced biomass to the overall energy mix.
bioenergy demand, primary energy, continent, traditional biomass, advanced biomass, 2017, 2040, world map
false
Bioenergy primary energy demand by continentDeveloping sustainable carbon circularity Looking at advanced applications and business models
Multiple Chart
Kearney
View slide
Bar charts compare expectations and realities of office work, accompanied by text outlining best practices for flexible work arrangements, using a clean layout with a blue and teal color scheme.
Human Resources and Talent Management
Professional Services
Analyzes employee preferences for work flexibility, offering best practices for managing such arrangements, relevant to HR policy making and organizational development.
flexible work, employee preference, best practices, HR policy, organizational development, startups, work arrangements
false
The majority of employees across startup stages and countries still prefer flexible working arrangements; 5 best practices are recommended to handle flexible work appropriately ASEAN Growth and Scale Talent Playbook
Multiple Chart
Kearney
View slide
Visually vibrant slide with icons representing each of the UN Sustainable Development Goals, accompanied by descriptive texts highlighting their importance and goals.
Market Analysis and Trends
Government & Public Sector
Provides an overview of the UN Sustainable Development Goals, highlighting their scope and the global consensus on values aimed at achieving a sustainable future for all.
UN, SDGs, global, development, goals, sustainability, future, consensus, values, society
false
UN Sustainable Development Goals 2030 are broadening the global consensus on values A challenging blueprint for a better future for allRoland Berger Trend Compendium 2030: Megatrend 1 People & Society
Table
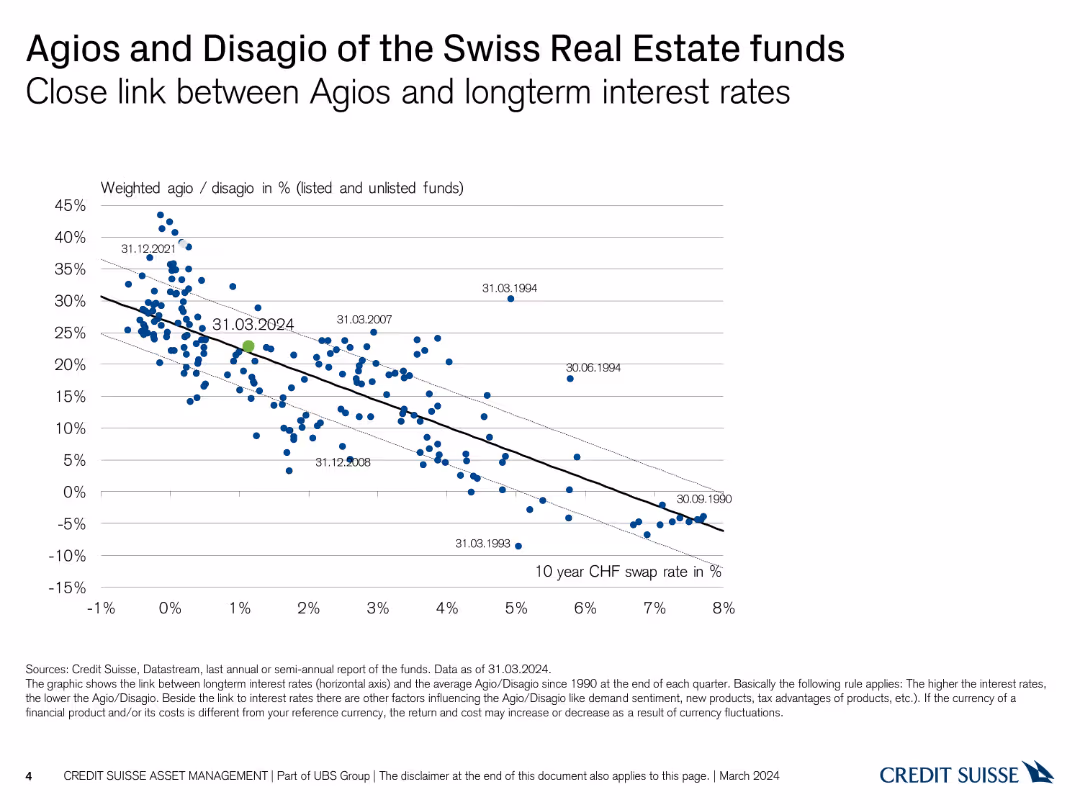
Roland Berger
View slide
The slide shows a scatter plot with a trend line, displaying the relationship between agios/disagio and long-term interest rates from 1990 to 2024. The data points are in blue.
Financial Performance
Real Estate & Construction
This slide analyzes the correlation between agios/disagio rates of Swiss Real Estate funds and long-term interest rates. It is used to assess the impact of interest rates on fund performance.
agios, disagio, interest rates, real estate, trend line
false
Agios and Disagio of the Swiss Real Estate funds Close link between Agios and longterm interest ratesSwiss Real Estate Funds At a glance Switzerland March 2024
Single Chart
Credit Suisse
View slide
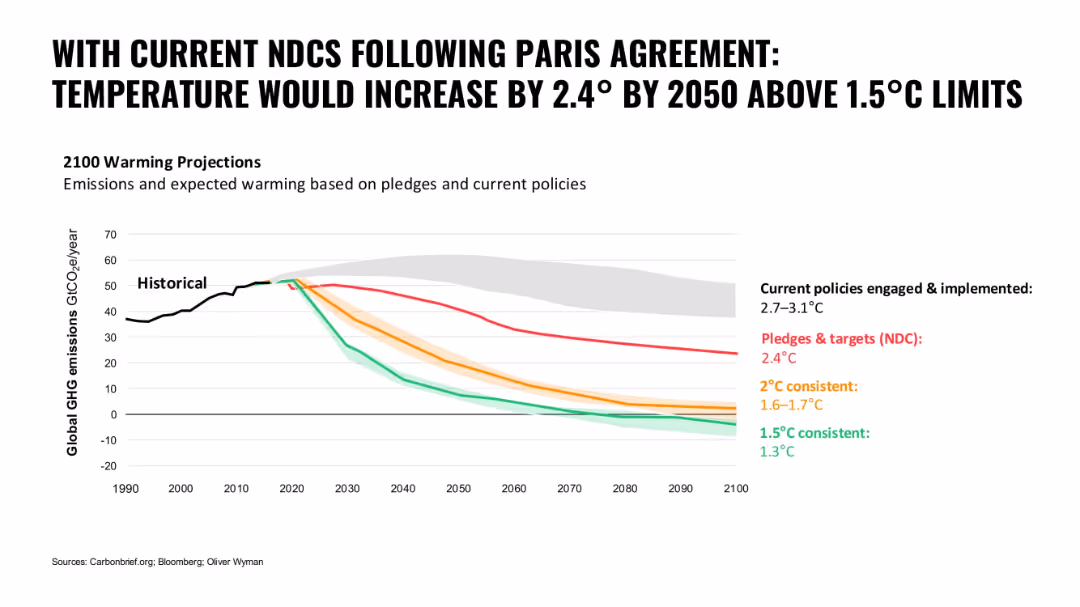
Line graph with colored paths representing different emission scenarios; bold black title and clean white background
Regulatory and Compliance
Environmental Services & Sustainability
The slide illustrates global warming projections based on current NDCs and policies versus different consistency targets. It shows the gap between policy implementation and climate goals.
climate change, NDCs, Paris Agreement, emissions, global warming, policy gap, temperature projection
false
WITH CURRENT NDCS FOLLOWING PARIS AGREEMENT: TEMPERATURE WOULD INCREASE BY 2.4° BY 2050 ABOVE 1.5°C LIMITSOUR 5 URGENT ACTS
Single Chart
Oliver Wyman
View slide
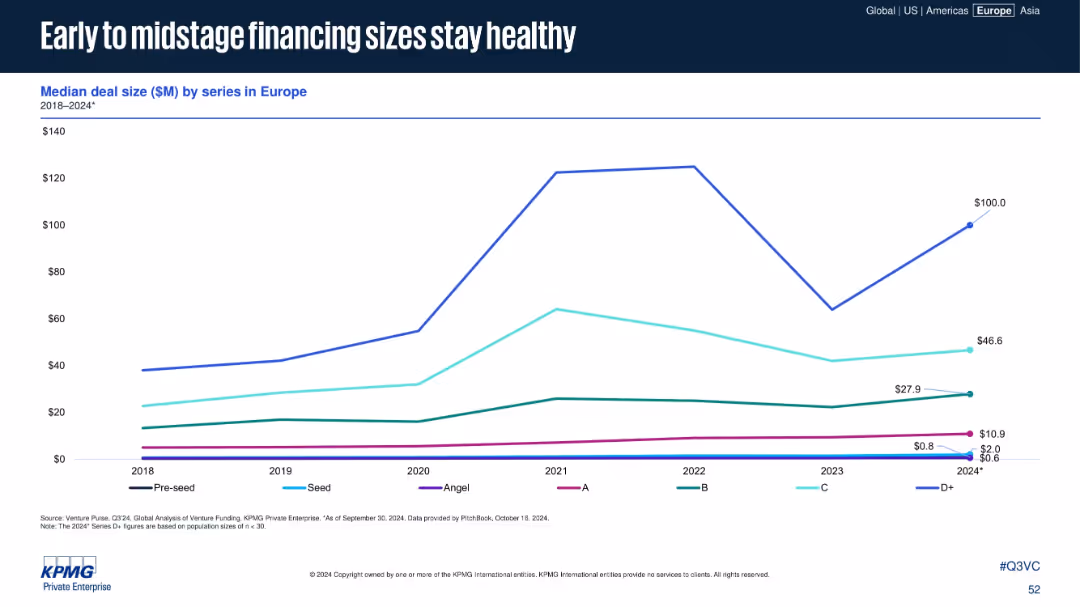
Line chart showing deal size by funding series (Pre-seed to D+) from 2018 to 2024
Performance Metrics and KPIs
Financial Services
This slide tracks the median deal size by funding series in Europe, with strong growth in D+ rounds rebounding in 2024. Early and mid-stage rounds (Series A to C) maintain consistent or growing deal sizes, signaling investor confidence.
Series A, Series B, VC financing, deal size, startup growth
false
Early to midstage financing sizes stay healthyVenture Pulse Q3 2024
Single Chart
KPMG
View slide
Contains two column charts detailing the impact of increased solar penetration on electricity generation and GHG emissions from household fuel generators. Each chart is complemented by annotations and a decrease marker, highlighting the reductions in emissions and fuel usage.
Regulatory and Compliance
Energy & Utilities
This slide quantifies the impact of solar adoption on reducing reliance on household fuel generators in Nigeria by 2030. It demonstrates a notable decrease in both electricity generated from these generators and associated GHG emissions, underscoring solar's environmental and health benefits.
solar, impact, electricity, generators, GHG emissions, reduction, 2030, Nigeria, energy
false
…thereby reducing generator usage and cutting emissions by up to 5 Million tonnesSocio-economic case for deepening solar PV deployment in Nigeria
Multiple Chart
BCG
View slide
Line charts showing average spread and annual default rate for high yield and investment grade corporate bonds.
Market Analysis and Trends
Financial Services
Provides update on corporate bond markets with focus on high yield and investment grade bonds, showing spreads and default rates, aiding investment decisions.
Corporate bonds, default rates, spreads
false
Corporate Bond Market Update HY Corporate 442 403 463 405Monthly Market Monitor November 2023
Multiple Chart
Morgan Stanley
View slide
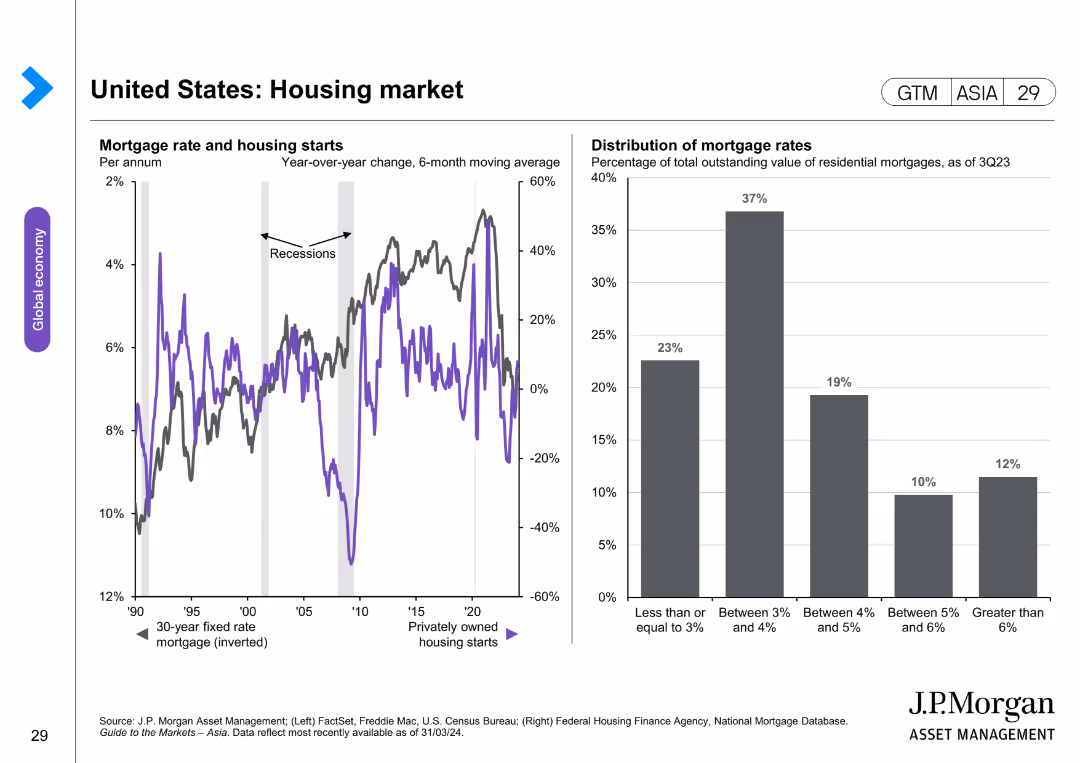
The slide has two charts: a line chart showing mortgage rates and housing starts, and a column chart showing the distribution of mortgage rates. The layout is detailed.
Market Analysis and Trends
Real Estate & Construction
This slide analyzes the housing market by examining mortgage rates and housing starts, along with the distribution of current mortgage rates across various ranges.
housing market, mortgage rates, housing starts, market analysis, real estate trends
false
United States: Housing marketGuide to the Markets Asia | 2Q 2024
Multiple Chart
JP Morgan
View slide
Bar chart showing reported workplace gender discrimination across countries. Gender-specific stats are included in tabular form.
Risk Assessment and Management
Government & Public Sector
This slide focuses on perceptions and experiences of gender discrimination in the workplace. The UAE and Saudi Arabia show the highest incidence, with men and women reporting equal likelihood globally.
workplace bias, gender discrimination, international comparison, employment issues, equal opportunity
false
Gender Discrimination at Work – By CountryINTERNATIONAL WOMEN'S DAY 2023
Mixed Chart
IPSOS
View slide
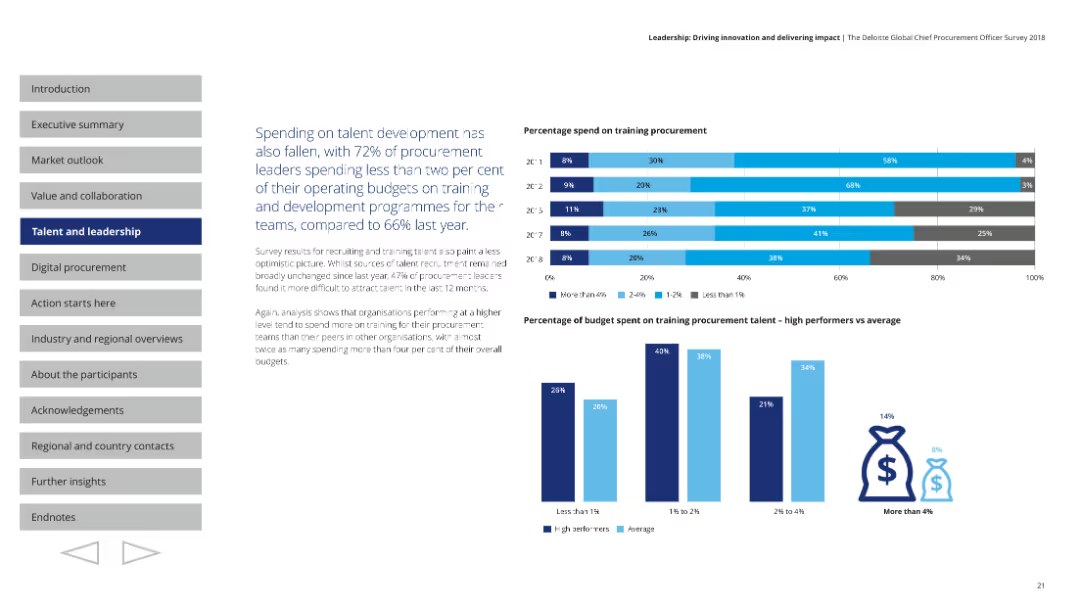
Horizontal bar charts showing the percentage of operating budget spent on training procurement talent. Additional charts compare high performers vs. average in spending. The layout uses blue shades and clear sections for easy comparison.
Human Resources and Talent Management
Professional Services
Discusses the decline in spending on talent development, with 72% of leaders spending less than 2% of their budgets on training. Highlights the disparity in spending between high performers and average organizations, emphasizing the need for better investment in talent.
talent development, procurement, training, budget, investment
false
Percentage spend on training procurementLeadership: Driving innovation and delivering impact The Deloitte Global Chief Procurement Officer Survey 2018
Multiple Chart
Deloitte
View slide
This slide features a column chart on the left showing EBITDA uplift from Digital & Analytics, and a list of top 5 challenges on the right.
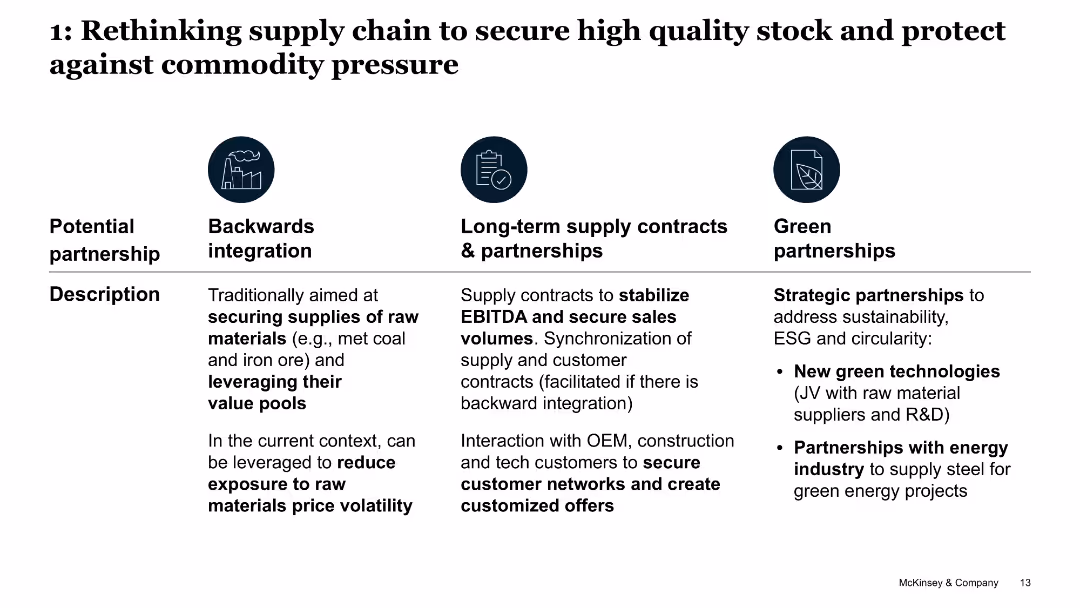
Operational Efficiency
Industrial & Manufacturing
The slide explains how steel companies face challenges in digital transformation, highlighting issues in business, organization, and technology.
digital transformation, pilot trap, EBITDA, challenges, steel industry
false
1: Rethinking supply chain to secure high quality stock and protect against commodity pressureThe future trends in ASEAN steel market
Pillar
McKinsey
View slide
Slide features heatmap showing career aspirations in younger generations.
Market Analysis and Trends
Professional Services
Discusses evolving career aspirations among the next generation, emphasizing non-traditional roles.
future careers, generational change, management roles, aspirations, survey data
false
Next generation no longer sees management as the next role to long forBCG – IPSOS study
Table
BCG
View slide
This slide features a column chart showing NPL sales volume from 2010 to 2023 with historical and projected values. It uses different colors to represent various growth scenarios.
Market Analysis and Trends
Financial Services
This slide projects the expected growth in NPL sales volumes in Turkey from 2010 to 2023, highlighting historical growth rates and various future scenarios based on economic conditions.
NPL, growth, Turkey, projections, economic scenarios
false
Exhibit 22 NPL Sales Total Volume Expected Growth [TRY bn, 2010-23]Turkish NPL Purchasing Market Overview and the way forward
Mixed Chart
PwC/Strategy&
View slide
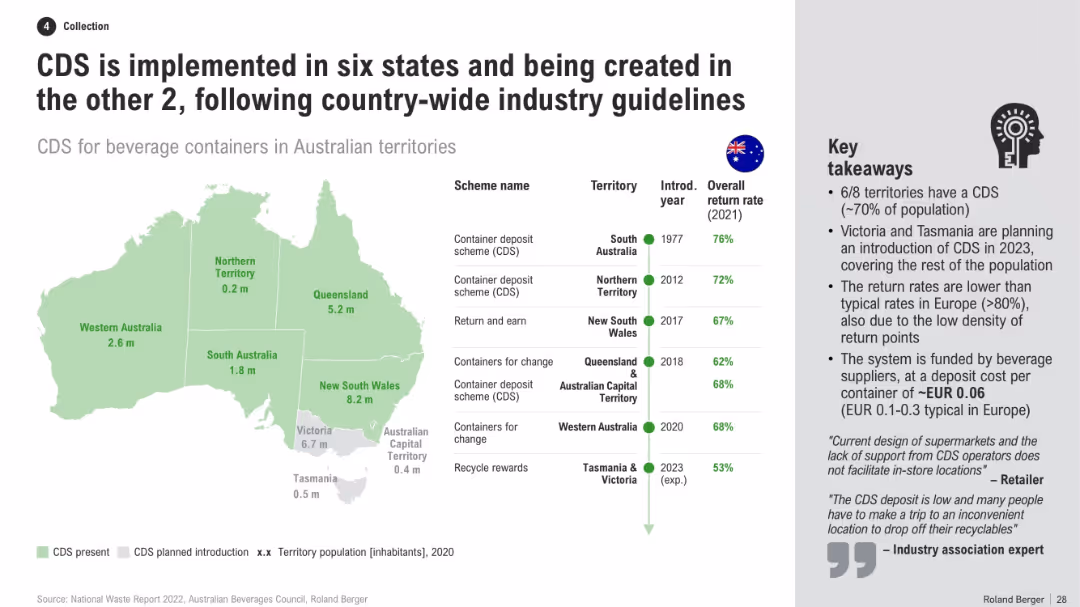
Australia map with CDS presence by state, table of schemes and return rates, and a list of key takeaways
Regulatory and Compliance
Environmental Services & Sustainability
This slide presents a national overview of CDS adoption across Australian territories, including return rates, scheme names, and timelines. It notes that Victoria and Tasmania will close remaining gaps, while explaining reasons for lower return rates vs. Europe.
CDS implementation, Australia map, recycling policy, return rates, state programs, container scheme, beverage recycling
false
CDS is implemented in six states and being created in the other 2, following country-wide industry guidelinesAluminum Cans Market Assessment - Australia
Mixed Chart
Roland Berger
View slide
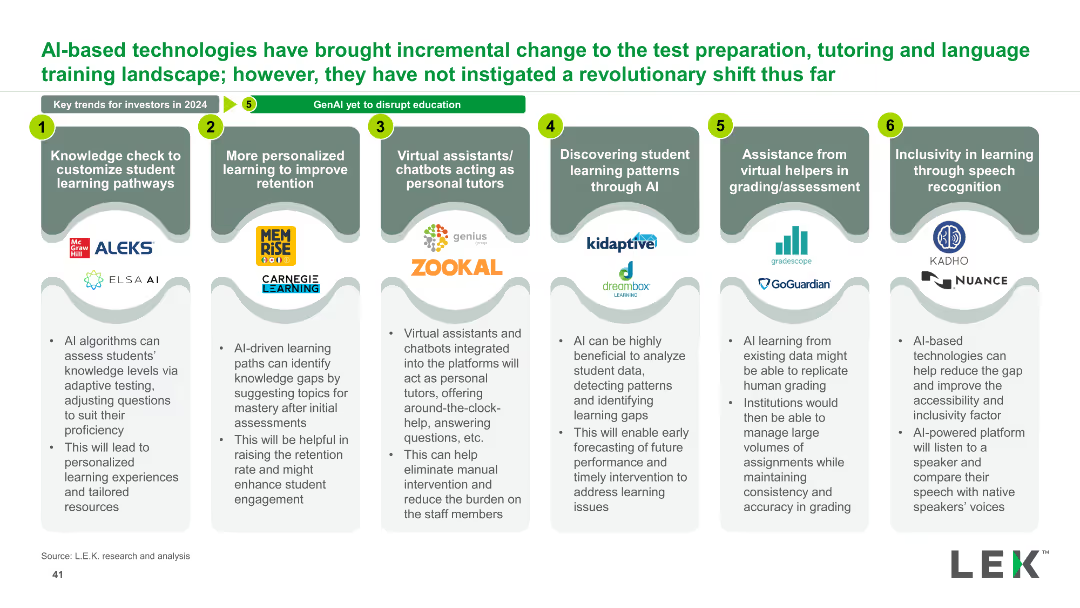
The slide has six sections, each with a heading, a description, and logos. Sections are aligned horizontally with numbers 1 to 6. Visuals include icons and logos.
Market Analysis and Trends
Education & Training
Discusses incremental changes brought by AI-based technologies in education, including personalized learning, virtual tutors, AI learning patterns, and inclusivity through speech recognition.
AI, education, personalized learning, virtual tutors, speech recognition, incremental change
false
AI-based technologies have brought incremental change to the test preparation, tutoring and language training landscape; however, they have not instigated a revolutionary shift thus farEducation: 2023 M&A Deal Roundup and Trends to Watch Out for in 2024
Pillar
LEK
View slide
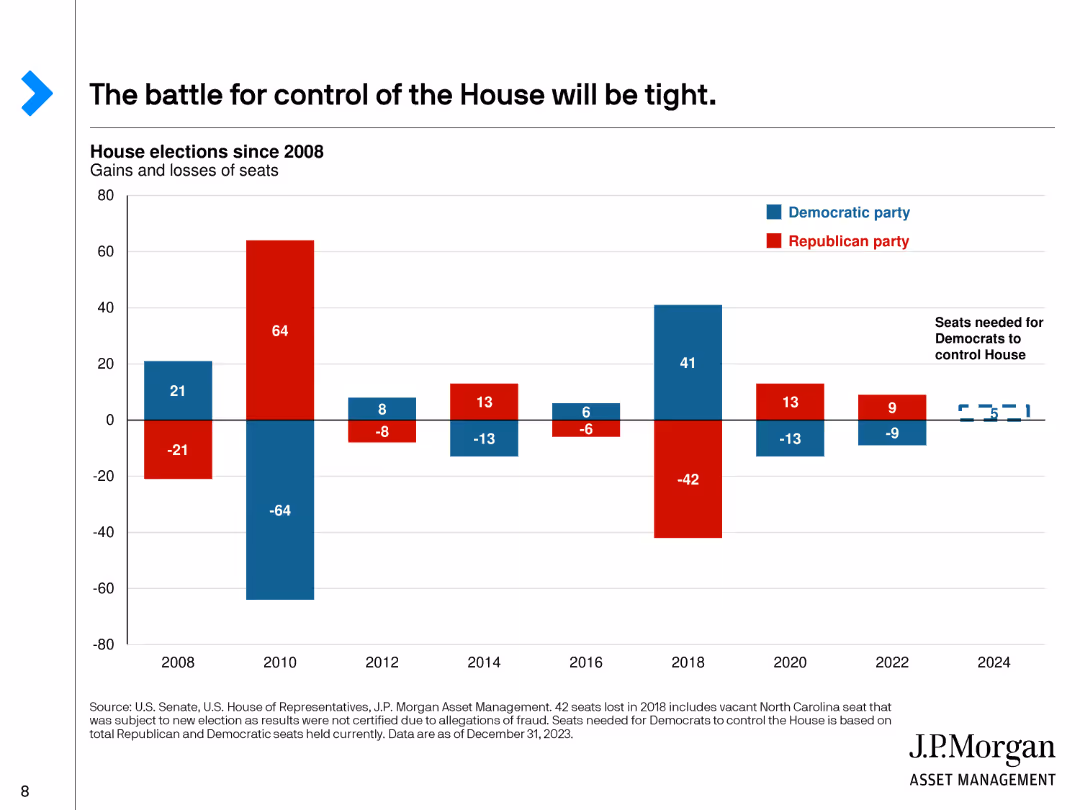
This slide features a bar chart showing the gains and losses of seats in the House of Representatives by party since 2008, with red for Republicans and blue for Democrats.
Market Analysis and Trends
Government & Public Sector
Discusses the competitive nature of the House of Representatives elections, showing historical gains and losses for each party and the current balance of power.
House, Representatives, Elections, Gains, Losses
false
The battle for control of the House will be tight.2024 Election
Single Chart
JP Morgan
View slide
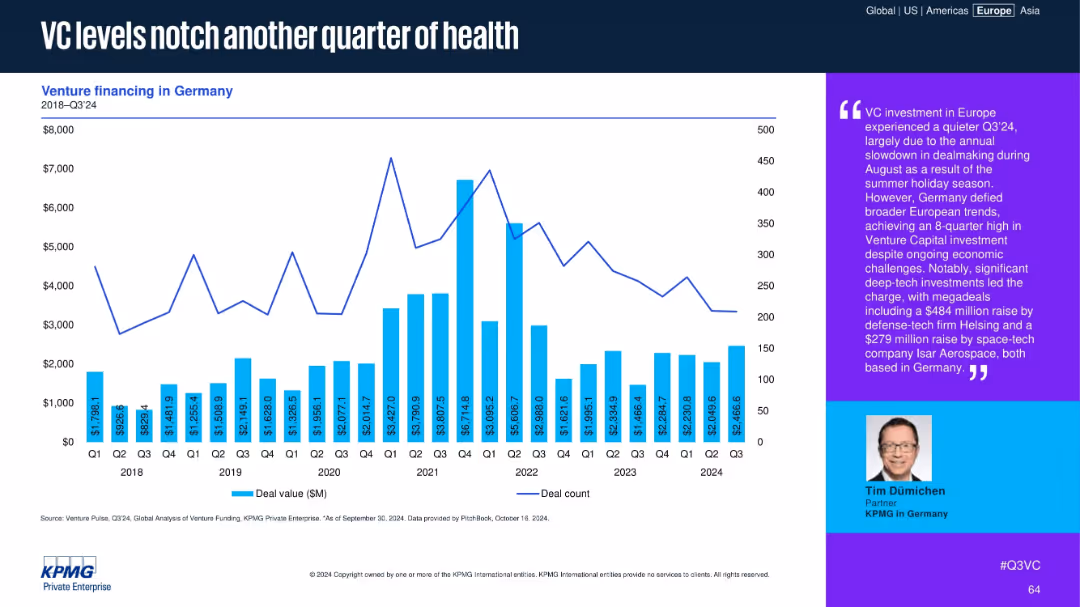
Chart with VC deal values and counts in Germany from 2018–Q3 2024. Commentary emphasizes deep-tech investments.
Market Analysis and Trends
Financial Services
Germany continues to show strong VC activity in Q3 2024, with deal volumes sustained by major investments in defense-tech and space-tech. The commentary notes an 8-quarter high despite broader European slowdowns due to summer seasonality.
Germany, VC investment, defense-tech, space-tech, deal value, Q3 2024, funding resilience, deep tech, European trend
false
VC levels notch another quarter of healthVenture Pulse Q3 2024
Mixed Chart
KPMG
View slide
Utilizing a line graph, this slide compares the perceived I&D maturity level across different demographics within HR, highlighting differences between minority and non-minority women.
Strategic Planning
Professional Services
Analyzing perceptions of inclusion and diversity maturity within HR, this slide compares assessments between minority and non-minority women in HR roles, illustrating differences in viewpoints.
HR, Women, Minority, Non-minority, Perceptions, Inclusion, Diversity, Maturity, Assessments
false
HOWEVER EVALUATION OF PROGRESS VARIES DEPENDING ON WHO YOU ASKInclusion and Diversity Survey MAKE IT MORE THAN A MANTRA
Single Chart
Accenture
View slide
Two charts: one displays UK real wage growth with a forecast, and the other shows UK mortgages exposed to higher rates categorized by fixed and floating rates.
Risk Assessment and Management
Financial Services
The slide focuses on the sensitivity of the UK economy to interest rate changes, detailing real wage growth trends and the exposure of UK mortgages to higher rates. Used for economic impact analysis and risk assessment.
Interest rate, wage growth, mortgages, UK
false
UK focus: Interest rate sensitivityGuide to the Markets UK | Q2 2024
Multiple Chart
JP Morgan
View slide
The slide includes several pie charts showing the willingness of different age groups to share their digital size and fit details with brands.
Customer and Market Segmentation
Retail & E-commerce
This slide presents data on online shoppers' willingness to share digital size and fit details with brands, highlighting generational differences.
online shoppers, digital size, fit details, brands, retail
false
7. Most online shoppers would be willing to share their digital size and fit details with brands and retail platforms for a digital avatarSolving fashion’s product returns
Multiple Chart
Roland Berger
View slide
Slide features two line charts tracking budget changes for customer relationship management and brand building over several years, indicating recent trends and future predictions.
Strategic Planning
Professional Services
Analyzing the budget trends for customer relationship management and brand building, the slide shows increasing investment in these areas.
CRM, brand building, budgets, trends, planning
false
Expected increase in customer relationship management and brand building, budgets hit historic highThe CMO Survey The Highlights and Insights Report February 2022
Single Chart
Deloitte
1
...
Next
Load More
Hold On!
We are searching in our database
If nothing, comes up, please try different filters!
Create a FREE account to continue browsing
Receive Instant Access to 1,000+ slides from companies like McKinsey, Google, and Goldman Sachs
First Name
Last Name
Email
Password
I agree to all
Terms & Privacy Policy
Thank you! Your submission has been received!
Oops! Something went wrong while submitting the form.
Have an account?
Sign in
Column Chart
Heatmap
Chevron
Org Chart
Infographic
Callouts
Timeline
List
Graphic
Picture
Process Flow
Diagram
Paragraph
Map
Table
Framework
Subtitle
Takeaway Box
Icon
Other Chart
Radar Chart
Waterfall Chart
Mekko Chart
Pie Chart
Scatter Plot
Line Chart
Bar chart
Bullet points


![Exhibit 22 NPL Sales Total Volume Expected Growth [TRY bn, 2010-23]](https://cdn.prod.website-files.com/654e70fb59937215cac87b19/6877e212f9a180cbc7298040_L52_Oa3wTN6SGsqWKzp8NZrmC8r3tL5qZ_X5VbS8Ai0.avif)