My Account
My Slides
Search by Category
Templates
Leave Feedback
Login
Logout
Get Started
Browse all Slides
Browse all Slides
Create a FREE Account
Instant access to 1,000+ real slides from top companies like McKinsey, BCG, Goldman Sachs, Google and many more!
First Name
Last Name
Email
Password
I agree to all
Terms & Privacy Policy
Thank you! Your submission has been received!
Oops! Something went wrong while submitting the form.
Have an account?
Sign in
Instant access to the internet's best slides
Get access to 40+ advanced filters and more
Advanced Search and Filters
Access to
10,000+ slides
Access to Category Pages
Save/Bookmark Slides
PowerPoint Template Library (New)
Choose your plan
MONTHLY
$12/month
Billed every month, cancel anytime.
YEARLY
$9/month
Billed $108 annually, cancel anytime.
Checkout for $12/month
Checkout for $108/yr
Secured by Stripe | AES-256 bit encryption
📢 Ready to start building slides? Check out our new template library
view templates
Welcome,
Welcome
Upgrade to SlideStart
Pro
Instant access to 15,000+ slides
Show Featured Only
Checkbox 8
Companies
Mckinsey
Bain
BCG
EY
Deloitte
Accenture
PwC/Strategy&
JP Morgan
Goldman Sachs
Morgan Stanley
Citigroup
Deutsche Bank
Barclays
LEK
Kearney
Oliver Wyman
Booz Allen Hamilton
Gartner
IPSOS
Nielsen
Slide type
Header Horizontal
Framework
Vertical Flow
Single Chart
Single Chart
Text Only
Mixed Chart
Header Vertical
Graphic
Pillar
Multiple Chart
Agenda
Title
Table
Linear Flow
Upgrade to SlideStart
Pro
Instant access to 40+ advanced filters
Industry
Upgrade to SlideStart
Pro
Instant access to 40+ advanced filters
Technology
Healthcare
Financial Services
Consumer Goods
Energy & Utilities
Manufacturing
Retail
E-commerce
Logistics
Telecommunications
Real Estate
Professional Services
Education
Media
Entertainment
Hospitatlity
Tourism
Agriculture
Food Production
Government & Public Sector
Environmental
Sustainability
Use Case
Upgrade to SlideStart
Pro
Instant access to 40+ advanced filters
Sales and Business Development
Mergers and Acquisitions
Corporate Finance and Valuation
Performance Metrics and KPIs
Client Case Studies
Competitive Landscape
Product and Service Analysis
Customer and Market Segmentation
Organizational Structure
Human Resources and Talent Management
Industry Overview
Regulatory and Compliance
Risk Assessment and Management
Agriculture & Food Production
Hospitality and Tourism
Government
Environmental
Sustainability
Clear all
Thank you! Your submission has been received!
Oops! Something went wrong while submitting the form.
Show Featured Only
Checkbox 8
Companies
Mckinsey
Bain
BCG
EY
Deloitte
Accenture
PwC/Strategy&
JP Morgan
Goldman Sachs
Morgan Stanley
Citigroup
Deutsche Bank
Barclays
LEK
Kearney
Oliver Wyman
Booz Allen Hamilton
Gartner
IPSOS
Nielsen
Slide type
Text Only
Linear Flow
Vertical Flow
Single Chart
Header Horizontal
Mixed Chart
Header Vertical
Pillar
Multiple Chart
Graphic
Agenda
Title
Table
Framework
Industry
Technology
Healthcare
Financial Services
Consumer Goods
Energy & Utilities
Manufacturing
Retail
E-commerce
Logistics
Telecommunications
Real Estate
Professional Services
Education
Media
Entertainment
Hospitatlity
Tourism
Agriculture
Food Production
Government & Public Sector
Environmental
Sustainability
Use Case
Sales and Business Development
Mergers and Acquisitions
Corporate Finance and Valuation
Performance Metrics and KPIs
Client Case Studies
Competitive Landscape
Product and Service Analysis
Customer and Market Segmentation
Organizational Structure
Human Resources and Talent Management
Industry Overview
Regulatory and Compliance
Risk Assessment and Management
Agriculture & Food Production
Hospitality and Tourism
Government
Environmental
Sustainability
Clear all
Thank you! Your submission has been received!
Oops! Something went wrong while submitting the form.
Tag
View slide
Features diagrams and bar graphs displaying the number of Tier 1 suppliers across different industries and major companies.
Operational Efficiency
Industrial & Manufacturing
Details the extent of reliance on Tier 1 suppliers in large companies, highlighting the vast networks involved and the industries most dependent on these suppliers for operations.
Suppliers, Industries, Supply Chain, Tier 1, Companies
false
Large companies rely on hundreds of suppliersCovid 19: Briefing Materials
Multiple Chart
McKinsey
View slide
Line chart showing the trend of key interest rates (overnight lending rate and five-year government bond yield) from January 2009 to a forecast in July 2021.
Market Analysis and Trends
Real Estate & Construction
This slide forecasts the continuation of low borrowing costs into 2021, based on trends in key interest rates.
borrowing costs, interest rates, forecast, 2021, trends, overnight lending rate, government bond yield
false
Low Borrowing Costs will Continue in 2021Market Year in Review and Outlook 2021
Single Chart
IPSOS
View slide
Gartner Hype Cycle diagram for the digital workplace in 2020, showing different stages from innovation trigger to plateau of productivity.
Technology and Digital Transformation
Technology & Software
The slide presents the Gartner Hype Cycle for the digital workplace, illustrating the impact of the pandemic on accelerating digitalization. It highlights the various stages of workplace technologies and the future expectations for innovations that could enhance productivity and collaboration.
Digital Workplace, Pandemic, Hype Cycle
false
Workplaces have experienced a push to digitalization due to the pandemic Other innovations are yet to impact our working lifeMegatrend 5 - Technology & Innovation
Mixed Chart
Roland Berger
View slide
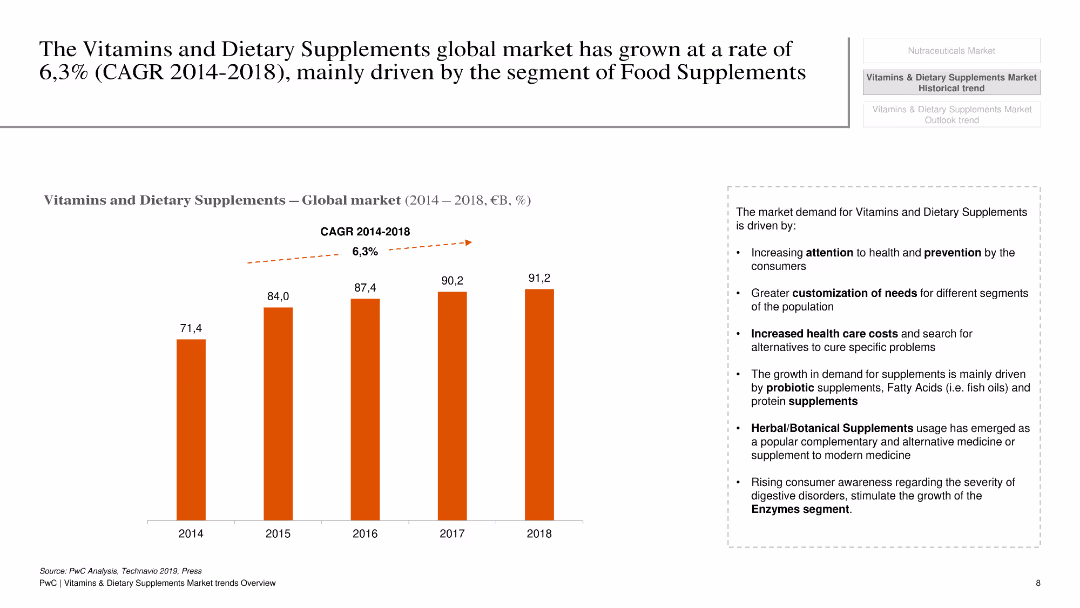
The slide has a white background with a column chart showing global market growth of vitamins and dietary supplements from 2014 to 2018.
Market Analysis and Trends
Healthcare & Pharmaceuticals
This slide presents the growth rate of the global market for vitamins and dietary supplements, highlighting the CAGR and key growth drivers.
Vitamins, dietary supplements, market growth, CAGR, global, healthcare, pharmaceuticals, trends, analysis
false
The Vitamins and Dietary Supplements global market has grown at a rate of 6,3% (CAGR 2014-2018), mainly driven by the segment of Food SupplementsVitamins & Dietary Supplements Market trends - Overview
Mixed Chart
PwC/Strategy&
View slide
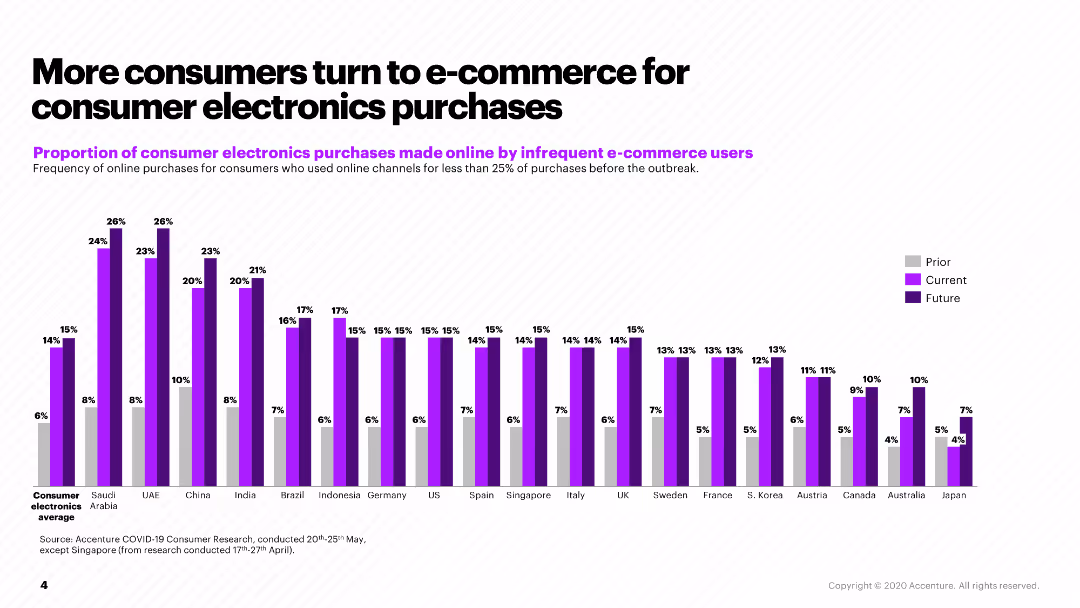
The slide features a column chart displaying the proportion of consumer electronics purchases made online by infrequent e-commerce users across various countries.
Market Analysis and Trends
Retail & E-commerce
The slide discusses the increased shift to e-commerce for consumer electronics, comparing purchase frequencies prior to, during, and expected post-COVID-19 trends.
e-commerce, consumer electronics, online purchases, COVID-19, market trends
false
More consumers turn to e commerce for consumer electronics purchasesHow will COVID-19 change the consumer?
Single Chart
Accenture
View slide
This slide features multiple line charts displaying year-on-year changes in credit card sales across various retail sectors. The layout includes two main sections for short-term impacts and recovery paths, with annotations and a clear color-coded legend.
Market Analysis and Trends
Retail & E-commerce
This slide analyzes the short-term impact of the COVID-19 pandemic on different retail sectors and predicts their recovery paths. It highlights the contrast between essential and non-essential retailers, using data-driven insights to project future industry trends.
Retail, COVID-19, Recovery, Online Sales, Impact Analysis
false
Retail: Impacts and recovery vary among essential vs. non-essential retailers and depend on physical vs. online channelNY COVID-19 Preliminary Economic Impact Assessment
Multiple Chart
BCG
View slide
Structured layout with three sections, bulleted lists of digital innovations, and images of diverse working settings.
Technology and Digital Transformation
Professional Services
Data on digital innovation adoption for workplace flexibility, wellbeing, and collaboration, emphasizing hybrid technologies and health certifications.
Hybrid Work, Wellbeing, Digital Innovation, Collaboration
false
Technology priorities are targeted to flexibility, wellbeing and collaboration.Future Workplace Index 2.0
Header Horizontal
EY
View slide
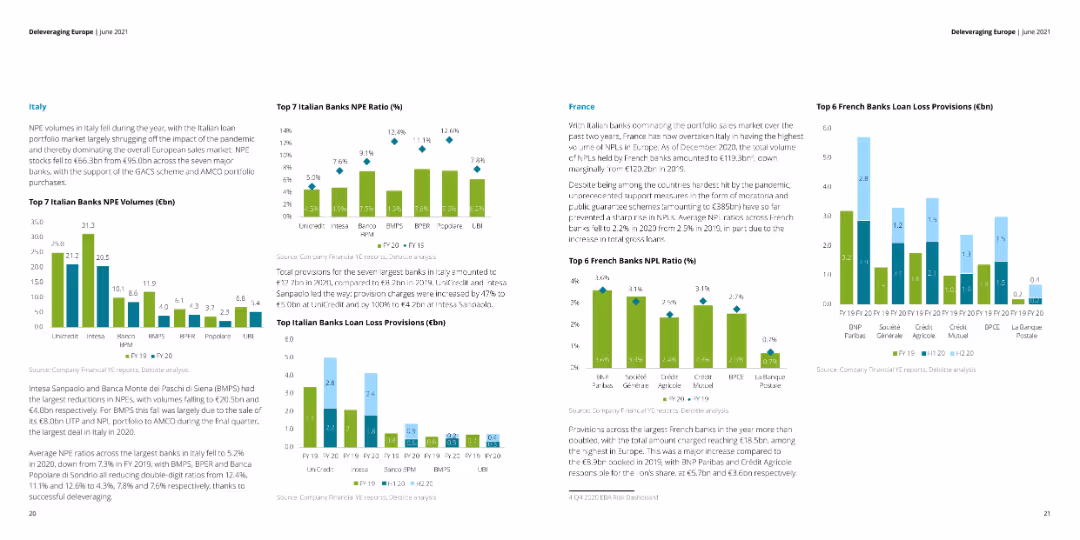
The slide features multiple column charts showing NPE volumes, NPE ratios, and loan loss provisions for top banks in Italy and France. Text sections provide detailed explanations of the charts.
Financial Performance
Financial Services
This slide analyzes the NPE volumes, NPE ratios, and loan loss provisions for the top banks in Italy and France. It discusses the impact of the pandemic and government support schemes on the financial metrics.
NPE volumes, NPE ratios, loan loss, Italy, France
false
Top 7 Italian Banks NPE Ratio (%)Deleveraging Europe
Multiple Chart
Deloitte
View slide
The slide has a bar chart showing the progression of current and future FinTech users, including lapsed users and anticipated future users.
Market Analysis and Trends
Financial Services
The slide forecasts that FinTech adoption will surpass 50%, showing a detailed breakdown of user categories and predicting significant future growth.
FinTech, adoption, forecast, user categories, future
false
FinTechadoption is expected to surpass 50%Insights from the EY FinTech Adoption Index and EY FinTech Australia Census
Mixed Chart
EY
View slide
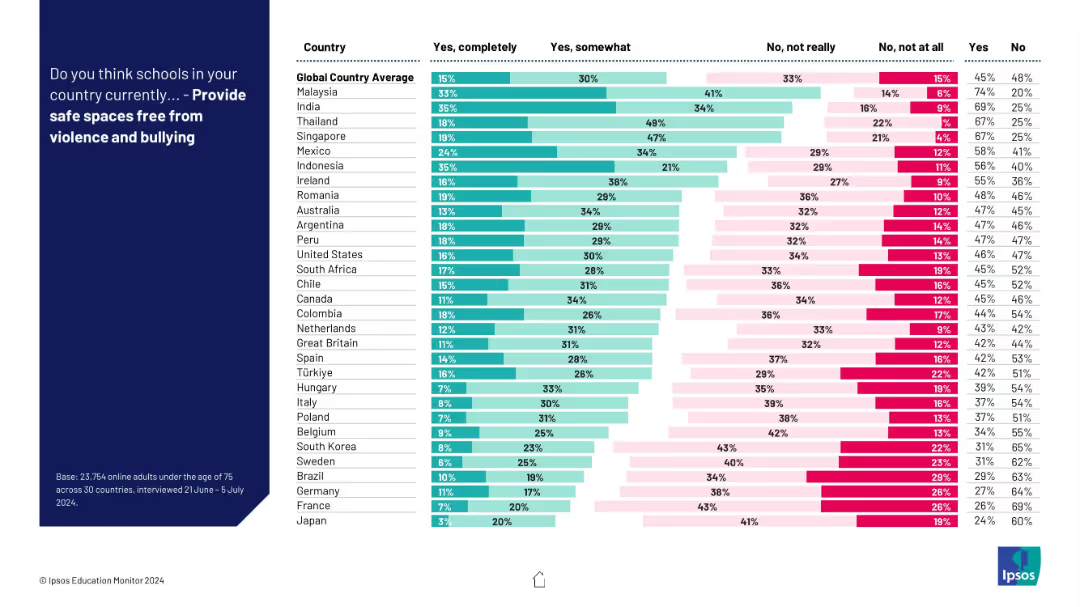
Horizontal stacked bar chart with four response categories per country; includes “Yes completely” to “No, not at all”; clean layout with legend.
Risk Assessment and Management
Education & Training
This slide visualizes opinions on whether schools provide safe spaces. Confidence is relatively low across many countries, with large portions of respondents saying “not really” or “not at all.”
safety, bullying, schools, environment, education, risk, perception, country comparison, survey
false
Provide safe spaces free from violence and bullyingIPSOS EDUCATION MONITOR 2024
Mixed Chart
IPSOS
View slide
This slide features a three-column layout with icons and bullet points under each column. The icons are simple and relevant to the respective themes.
Market Analysis and Trends
Healthcare & Pharmaceuticals
This slide summarizes the findings on financial outlook, operation priorities, and digitalization in hospitals, highlighting key points under each theme.
financial outlook, operation priorities, digitalization, hospitals, summary
false
We explore three key themes: financial outlook, operation priorities, and digitalization2023 APAC Hospital Insights Survey Findings for Healthcare Providers
Pillar
LEK
View slide
Contains a table and icons representing various countries with national flags, detailing measures to diversify supply chains.
Market Analysis and Trends
Government & Public Sector
This slide provides an overview of different national strategies to reduce dependency on Chinese manufacturing amidst rising geopolitical tensions.
supply chains, geopolitics, diversification, China
false
High supply chain concentration and rising geopolitical turbulence is prompting a new approach to ChinaCharging Ahead Australia’s battery powered future
Table
Accenture
View slide
Horizontal bar chart showing various perceptions of societal change across different countries with percentages.
Market Analysis and Trends
Government & Public Sector
The slide analyzes global perceptions of societal changes, highlighting variations in attitudes and values across countries.
societal change, global trends, perceptions, attitudes, values
false
Perceptions of societal change are an area where we still see significant variation across the worldA NEW WORLD DISORDER?
Mixed Chart
IPSOS
View slide
The slide contains several rectangular callout boxes with icons, a column chart, and text descriptions. It uses a blue and white color palette and has a balanced distribution of visuals and text.
Strategic Planning
Financial Services
Outlines a strategic plan for a wealth franchise, detailing service offerings like full-service, remote advice, and self-directed investing. It serves to illustrate the comprehensive approach to client service across multiple channels, aimed at capturing a larger share of the investment wallet.
Wealth franchise, Strategic plan, Service offerings, Investment, Channels
false
Looking ahead, we are creating a wealth franchise to best serve clients across all channelsConsumer & Community Banking
Mixed Chart
JP Morgan
View slide
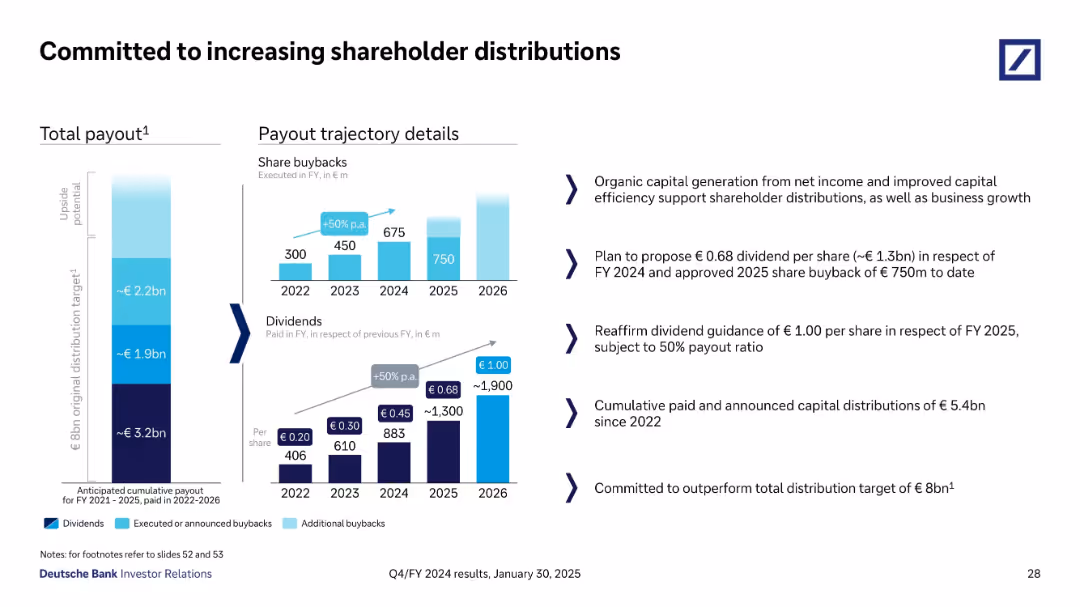
Split layout with vertical payout chart, bar charts of buybacks/dividends, and strategy bullet points
Strategic Planning
Financial Services
This slide outlines Deutsche Bank’s strategy to increase shareholder distributions through dividends and share buybacks. It shows a trajectory aiming for €8bn in distributions from FY 2021–2026, including a proposed €0.68 dividend for FY 2024 and €750m in buybacks for 2025.
Shareholder Return, Dividends, Buybacks, Strategy, FY2024, FY2025
false
Committed to increasing shareholder distributionsQ4/FY 2024 results
Multiple Chart
Deutsche Bank
View slide
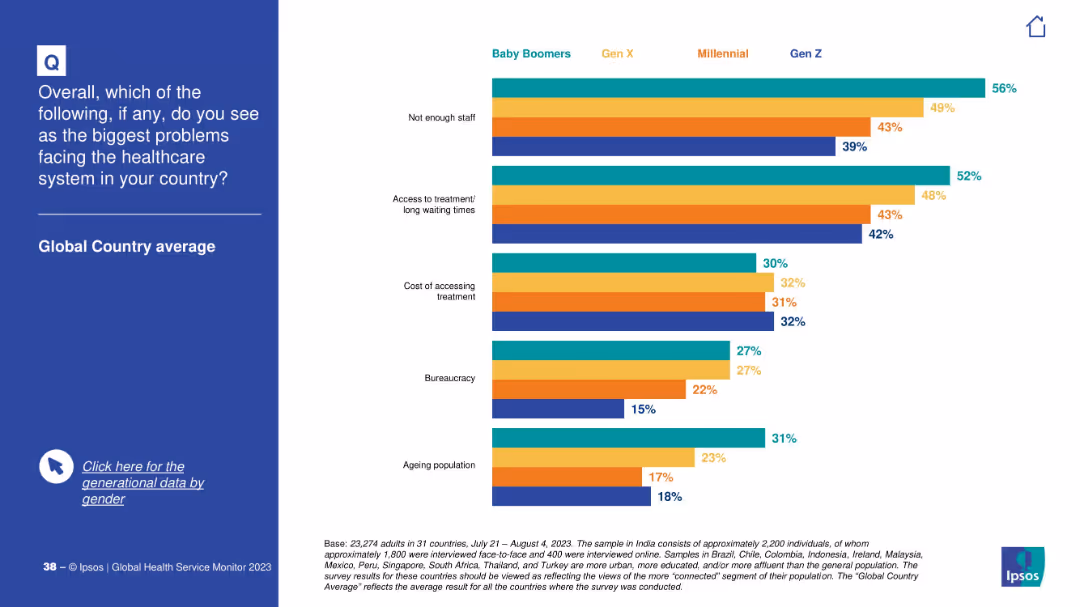
Simplified version of previous slide with consolidated generational data only, without gender breakdown.
Market Analysis and Trends
Healthcare & Pharmaceuticals
This slide presents generational comparisons for perceived major healthcare system problems, such as staffing shortages and long wait times. Baby Boomers are most concerned about staffing, while Gen Z notes cost and bureaucracy.
healthcare concerns, generational view, staff shortage, treatment access, cost, bureaucracy, perceptions, Ipsos
false
Healthcare challengesIPSOS GLOBAL HEALTH SERVICE MONITOR 2023
Mixed Chart
IPSOS
View slide
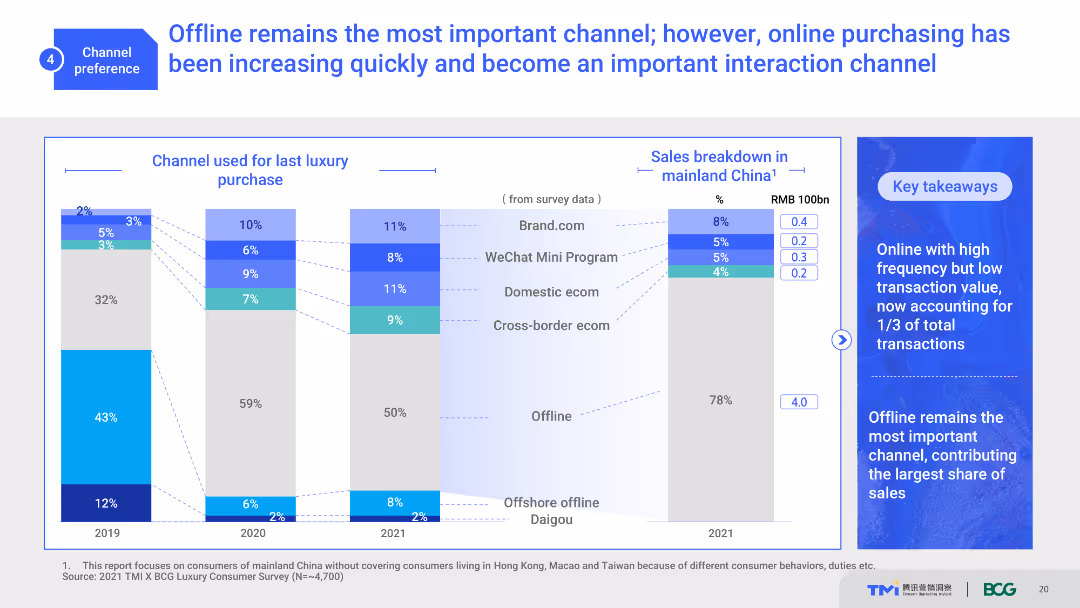
The slide uses a combination of stacked bar charts and text boxes to illustrate the importance of offline and online channels for luxury purchases. It shows channel usage trends from 2019 to 2021 and a sales breakdown in mainland China. The visual complexity is moderate with clear data presentation.
Market Analysis and Trends
Retail & E-commerce
This slide highlights the shifting consumer preferences between offline and online channels for luxury purchases. It shows historical trends and current channel usage, emphasizing the growing importance of online interactions.
channel preference, offline, online, luxury purchases, consumer behavior
false
Offline remains the most important channel; however, online purchasing has been increasing quickly and become an important interaction channelA New Generation of Chinese Consumers Reshaping the Luxury Market
Multiple Chart
BCG
View slide
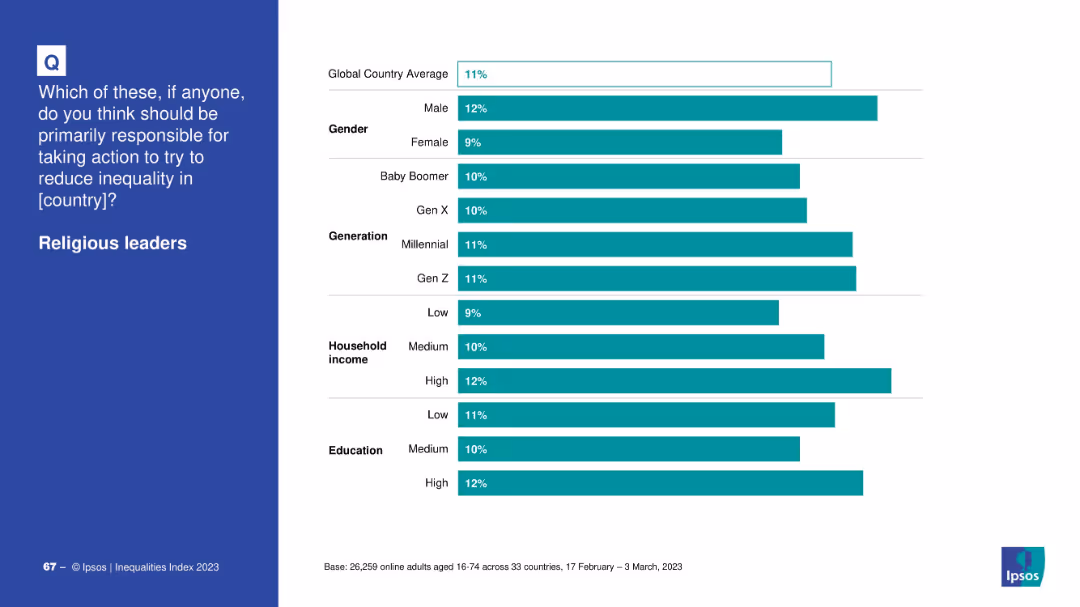
Horizontal bar chart segmented by demographic groups (gender, generation, income, education) with a left-side blue question prompt.
Market Analysis and Trends
Government & Public Sector
This slide shows a demographic breakdown of those who believe religious leaders should address inequality, noting slight gender and income-level differences.
inequality, demographics, religious responsibility, gender, income, education, generational views
false
Religious leadersIPSOS EQUALITIES INDEX 2023
Mixed Chart
IPSOS
View slide
This slide features two line charts. The first chart shows TOPIX earnings and performance over time. The second chart compares TOPIX and the yen vs. the US dollar over time.
Market Analysis and Trends
Financial Services
The slide examines the TOPIX earnings performance and the exchange rate trends between the yen and the US dollar, offering market insights.
Japan, equity, market, currency, TOPIX, performance, yen, US dollar
false
Japan equity market and currencyGuide to the Markets UK | Q2 2024
Multiple Chart
JP Morgan
View slide
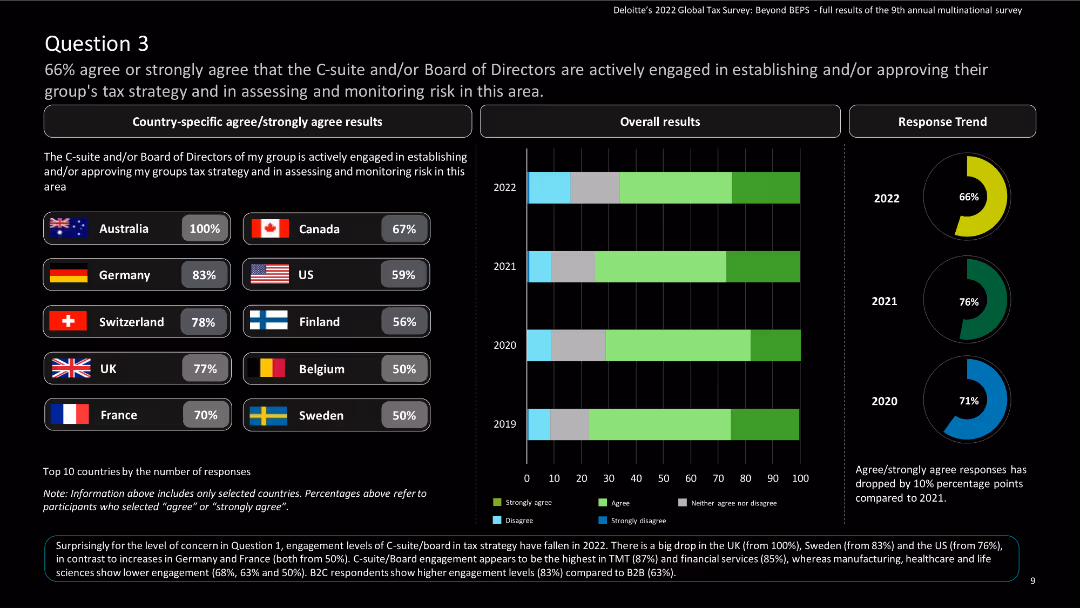
The slide features country-specific results and a column chart showing overall and response trend results over the years.
Regulatory and Compliance
Financial Services
The slide highlights C-suite and board engagement in tax strategy and monitoring risk, indicating high engagement in most countries.
Tax strategy, risk monitoring, C-suite, board engagement, global tax, Deloitte, agree, strongly agree, survey, multinational
false
Question 3 66% agree or strongly agree that the C suite and/or Board of Directors are actively engaged in establishing and/or approving the ir group's tax strategy and in assessing and monitoring risk in this area.Deloitte’s 2022 Global Tax Survey: Beyond BEPS
Multiple Chart
Deloitte
View slide
Slide with a vertical column chart showing financial investment breakdown for FY 2023, accompanied by bullet points outlining areas like operational efficiency and business growth. Graphics include icons for visual emphasis.
Investment Analysis
Financial Services
Discusses the bank's investment strategies for FY 2023, highlighting areas of spending such as operational efficiency and business growth initiatives. It outlines strategies to adapt to future challenges and maximize efficiency.
investment, financial planning, operational efficiency, FY 2023, business growth
false
Peak investment year to future proof franchiseQ4 / FY 2023 results
Mixed Chart
Deutsche Bank
View slide
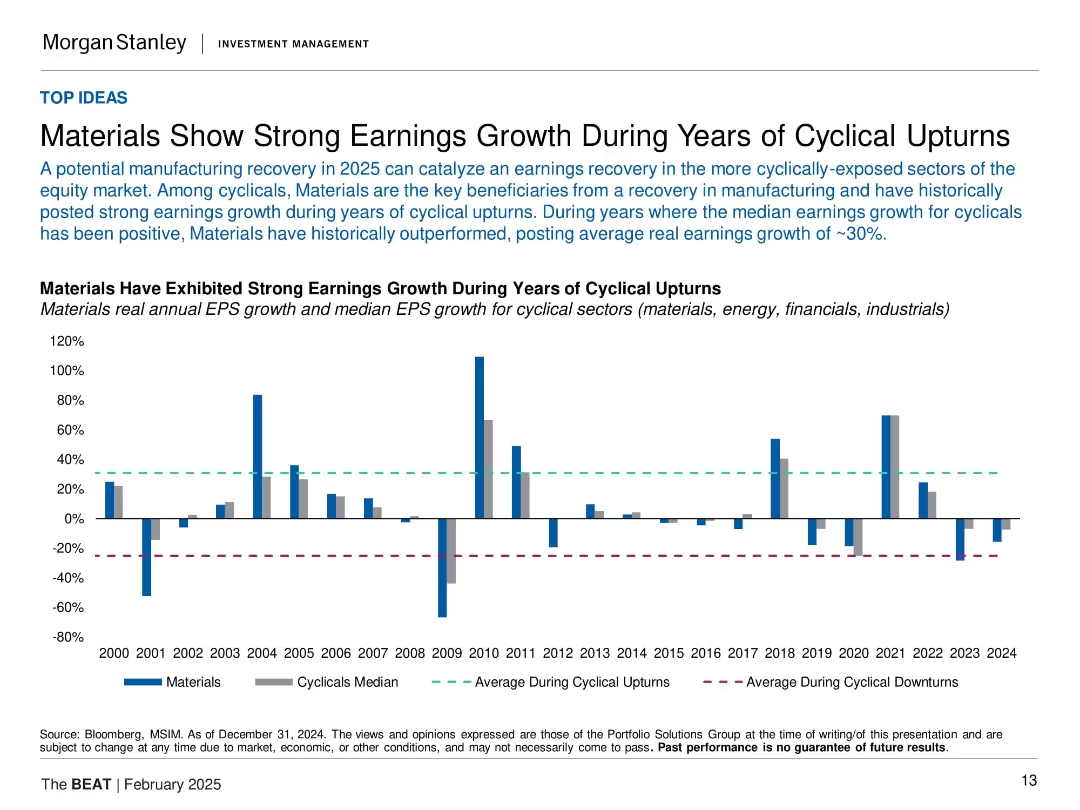
Bar chart (2000–2024) showing EPS growth for materials vs. cyclicals median. Includes dashed lines for upturn and downturn averages.
Financial Performance
Industrial & Manufacturing
The slide presents materials as a high-performing sector during cyclical economic recoveries. It includes EPS growth data, contrasting materials performance against other cyclicals and highlighting that in years of economic upturns, materials often post above-average earnings. The visual underscores the strategic importance of timing in sector allocation.
materials sector, earnings growth, cyclicals, economic cycle, EPS, upturn, industrials, recovery investing
false
Materials Show Strong Earnings Growth During Years of Cyclical UpturnsThe BEAT February 2025
Single Chart
Morgan Stanley
View slide
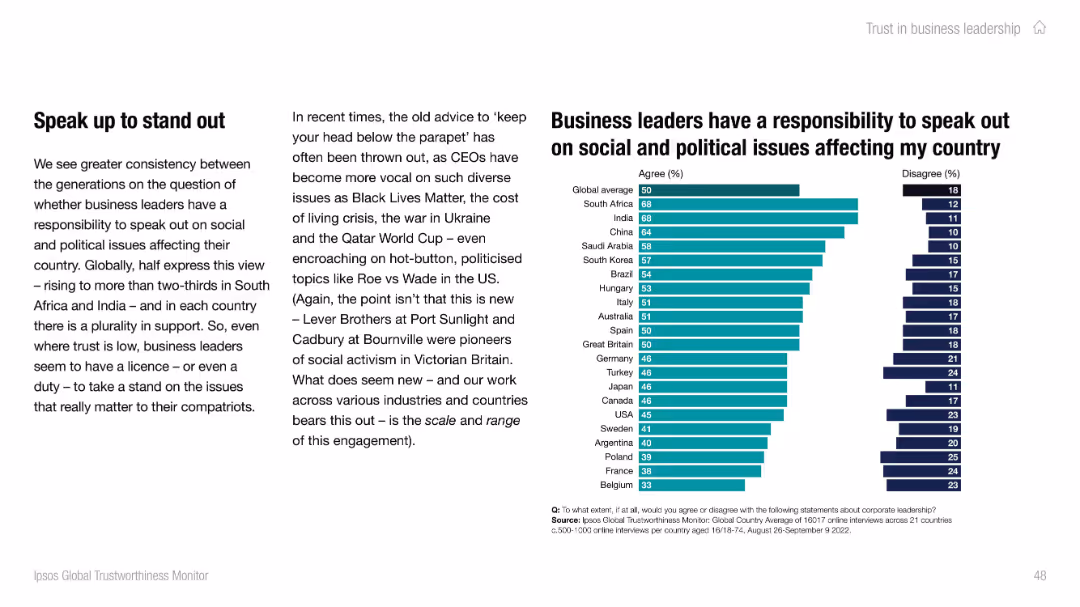
Left text explains trend toward corporate activism; right-side bar chart shows agreement levels across countries. Uses teal and navy for agree/disagree.
Strategic Planning
Professional Services
Illustrates global attitudes about business leaders’ responsibility to address social and political issues. Over two-thirds in South Africa and India agree with this role. Slide notes the growing visibility and expectation of activism among CEOs across regions.
corporate activism, leadership, Ipsos, social issues, responsibility, global sentiment
false
Business leaders have a responsibility to speak outIPSOS GLOBAL TRUSTWORTHINESS MONITOR
Mixed Chart
IPSOS
View slide
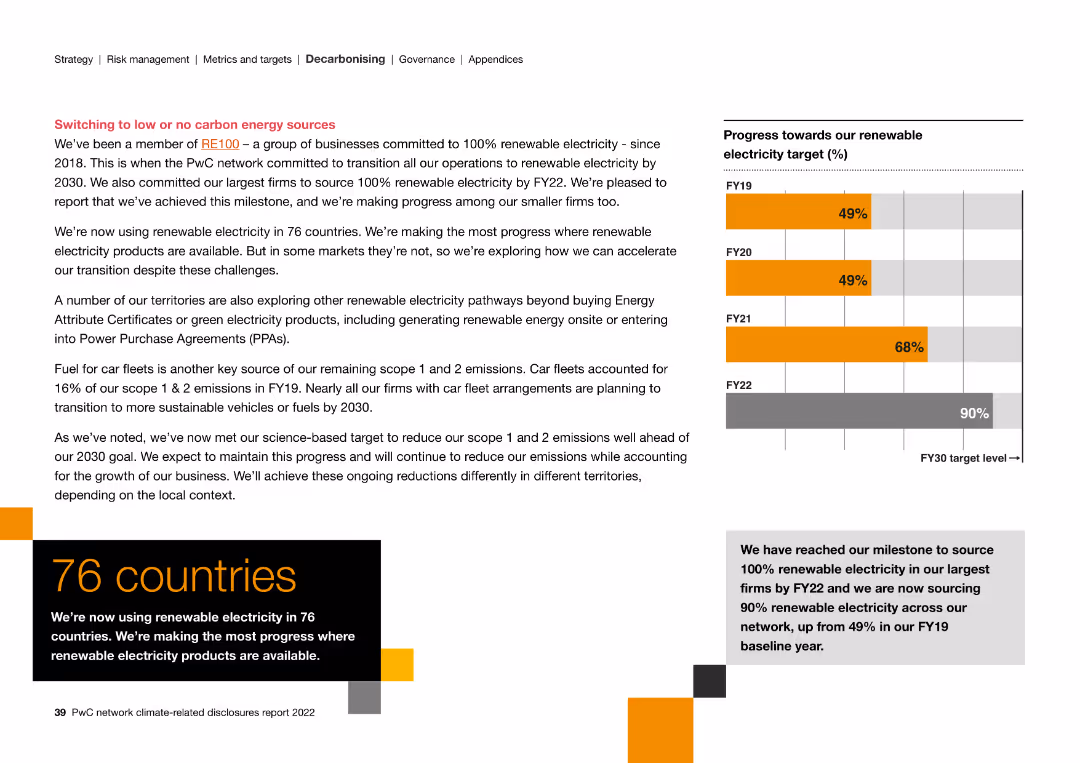
The slide contains a column chart and text, illustrating progress towards renewable electricity targets and exploring alternative energy sources.
Strategic Planning
Energy & Utilities
The slide discusses the transition to 100% renewable electricity, highlighting achievements in 76 countries and exploring further renewable energy pathways.
renewable electricity, carbon energy, transition, targets, achievements, alternative energy
false
Switching to low or no carbon energy sourcesPwC Network Climate-related disclosures report
Mixed Chart
PwC/Strategy&
View slide
A simple design with four separate sections, each with an icon and a brief description underneath.
Regulatory and Compliance
Government & Public Sector
This slide provides principles for the disbursement of relief funds from a fiscal perspective. It’s meant for leaders to ensure efficient and targeted use of resources, focusing on speed, protection of the vulnerable, liquidity, and compliance.
funds, principles, fiscal, aid, efficiency
false
States may consider potential guiding principles for disseminating federal funds and aid to state agencies, third parties, and individuals1Responding to COVID-19: Addressing the economic impact of the crisis
Header Horizontal
McKinsey
View slide
This slide features multiple line charts tracking performance forecasts across three categories: passenger cars/light trucks, trucks, and specialties. Each chart includes two lines representing the years 2022 and 2023 with shaded areas between them, illustrating projections and past performance. Icons represent each category and textual annotations provide additional context and previous forecast comparisons.
Market Analysis and Trends
Transportation & Logistics
The slide presents a market scenario for fiscal year 2023, with slight improvements in passenger cars/light trucks and ongoing destocking in trucks. It includes a detailed analysis of trends in various sub-categories of the tire industry such as mining, aircraft, and two-wheel tires. It aims to provide an updated market outlook and forecast changes, suggesting industry trends and market conditions.
market, forecast, tires, performance, trend, passenger, truck, specialty, projections, destocking
false
2023 FY markets scenario: slight market improvement in PC/LT, ongoing destocking in TruckRoad Show US West Coast Morgan Stanley
Multiple Chart
Morgan Stanley
View slide
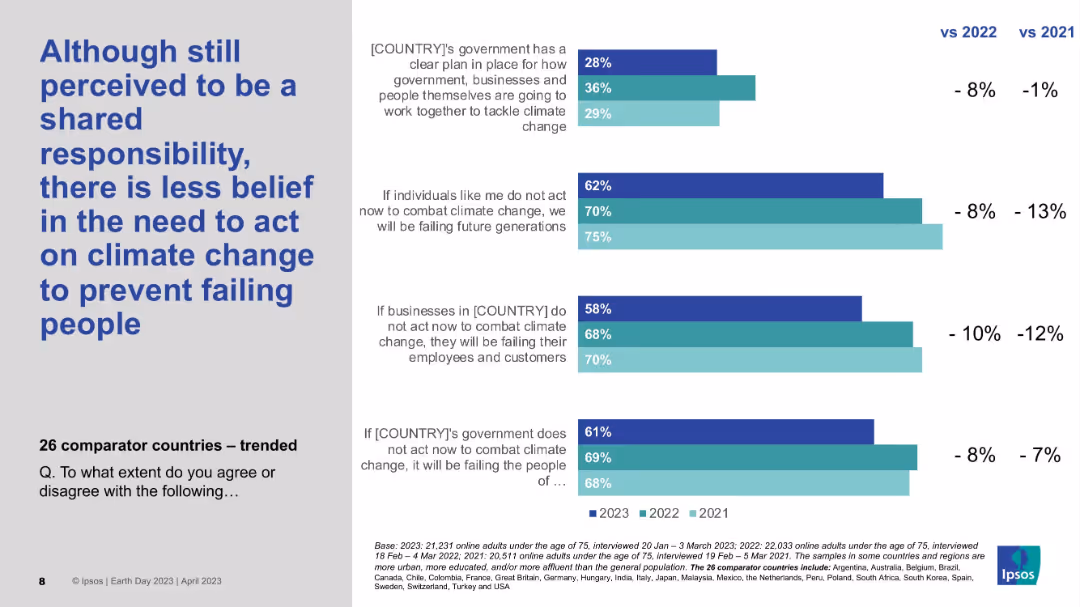
Clustered bar chart with trend lines for 2021–2023; left-aligned bold title; text clarifies survey statements.
Market Analysis and Trends
Environmental Services & Sustainability
Despite remaining a shared responsibility, public belief in urgent action against climate change is declining across years. The chart tracks falling agreement percentages from 2021 to 2023 across individuals, businesses, and governments.
Climate action, Survey trends, Ipsos, Time comparison, Shared responsibility
false
Although still perceived to be a shared responsibility...EARTH DAY 2023
Mixed Chart
IPSOS
View slide
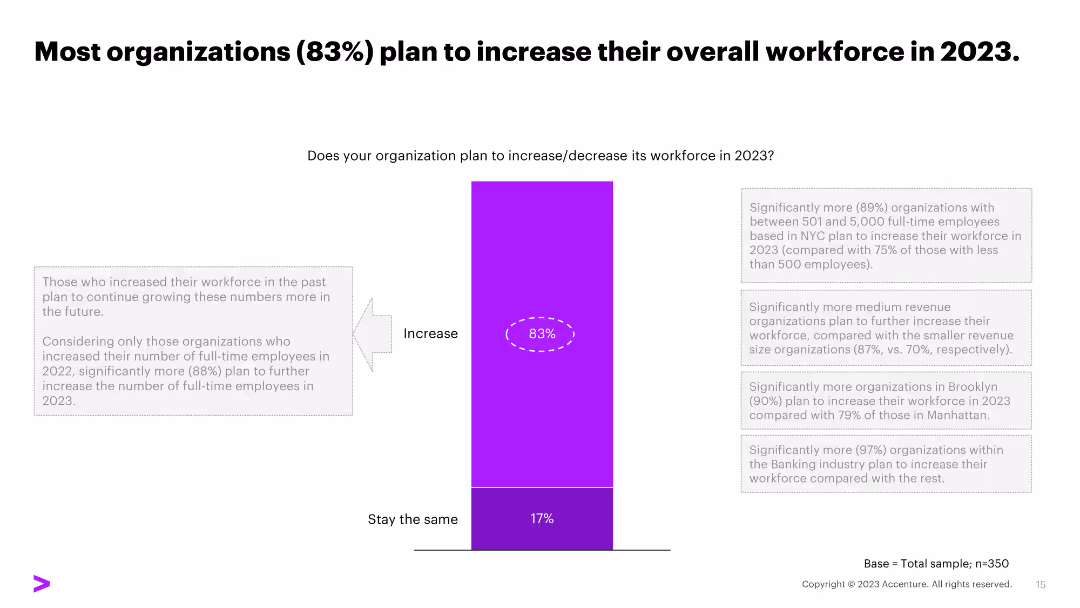
A slide with a title and a column chart showing the percentage of organizations planning to increase, decrease, or maintain their workforce in 2023.
Strategic Planning
Professional Services
Most organizations (83%) plan to increase their workforce in 2023, with insights into the trends among organizations with varying employee sizes and revenue.
workforce, plans, 2023, increase, organizations
false
Most organizations (83%) plan to increase their overall workforce in 2023.Tech Talent Hiring Trends Survey
Mixed Chart
Accenture
View slide
Slide with a column chart comparing podcast ad revenue shares by content genre from 2020 to 2021, highlighting top genres like News, Comedy, and Society & Culture.
Market Analysis and Trends
Media & Entertainment
Reviews the popularity and revenue generation of different podcast genres, noting significant growth in ad revenue for sports post-COVID.
Podcast, Genres, Revenue, Trends, Sports
false
News, Comedy and Society & Culture continue to be the top 3 podcast genresU.S. Podcast Advertising Revenue Study
Single Chart
PwC/Strategy&
View slide
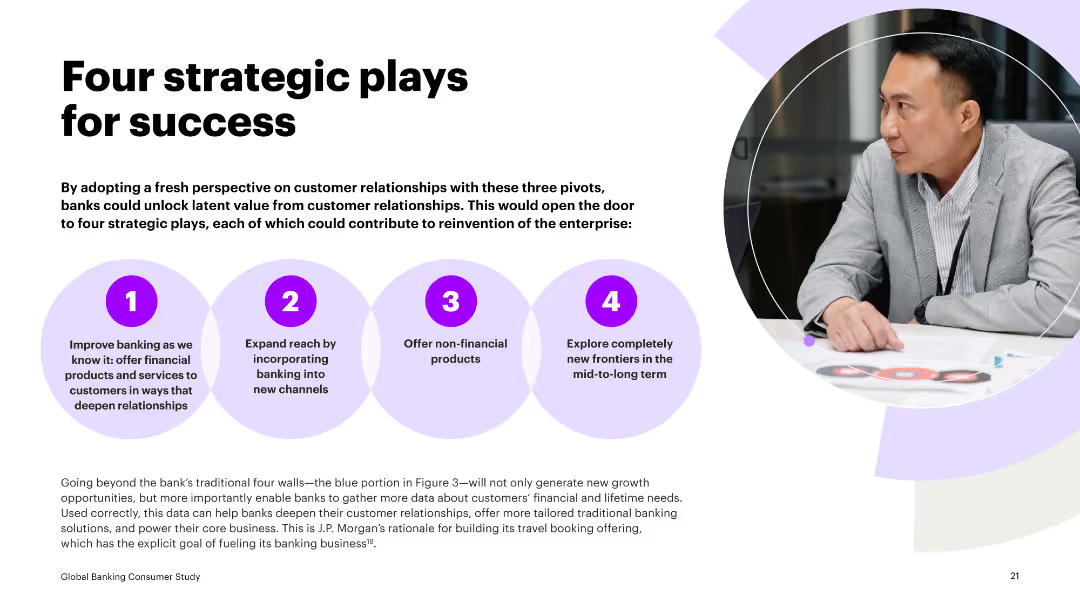
Circular diagram showing percentage agreement across age groups for the preference of having local bank branches, accompanied by textual insights.
Customer and Market Segmentation
Financial Services
Discusses consumer preference for local bank branches and the role they play in stability and personal service, supported by age group data.
bank branches, consumer preference, age groups, local branches, stability, personal service, insights, survey
false
Four strategic plays for successGlobal Banking Consumer Study Reignite human connections to discover hidden valu
Linear Flow
Accenture
View slide
Uses bar chart with segmented opinions and historical comparison table.
Market Analysis and Trends
Government & Public Sector
Suggests 49% of respondents across 28 countries agree that rule-breaking strong leaders are needed for reform. Thailand and India show the highest support. The chart highlights a willingness to bypass traditional norms to enable change.
strong leader, reform, authoritarianism, political sentiment, rule-breaking
false
To fix [Country], we need a strong leader willing to break the rulesPOPULISM IN 2024
Mixed Chart
IPSOS
View slide
Diagrammatic slide showcasing the new financial reporting structure of Citibank across various business segments. Color-coded for clarity.
Organizational Structure and Change
Financial Services
Organizes Citibank's business segments into a clear structure, highlighting changes in reporting and operational focus areas. Essential for discussions on corporate strategy and organizational changes.
financial structure, Citibank, organizational change, reporting segments, business segments
false
New Financial Reporting Structure As Of End Of 4Q23Third Quarter 2023 Earnings Results Presentation
Diagram
Citigroup
View slide
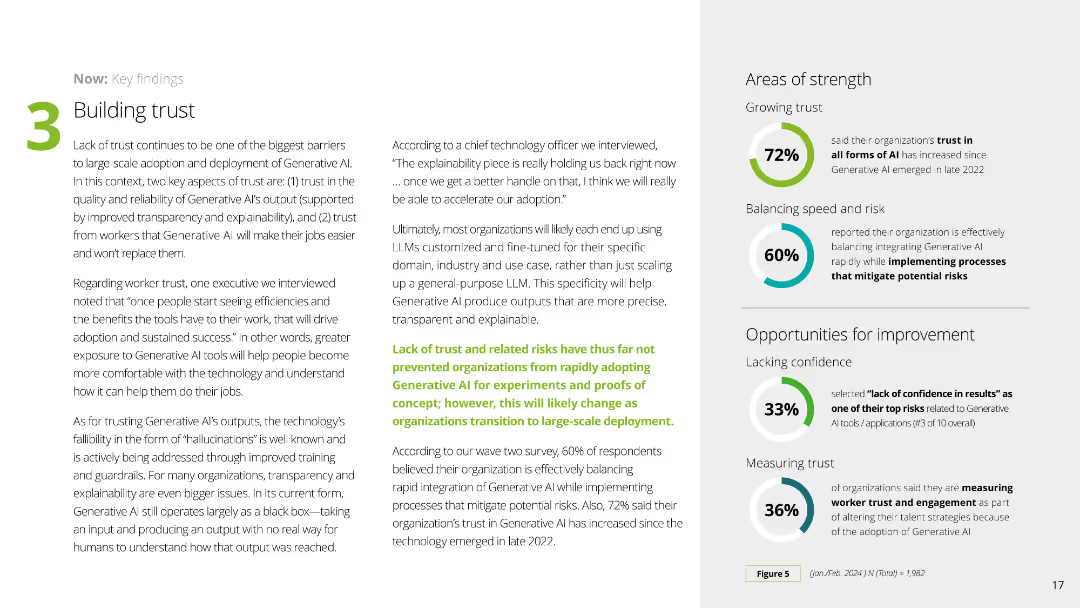
This slide contains a mix of text and percentage graphics to discuss the importance of building trust in Generative AI. The layout is structured with clear sections and supportive color elements for visual appeal.
Technology and Digital Transformation
Technology & Software
It addresses the barriers to Generative AI adoption related to trust, emphasizing the need for transparency, explainability, and worker trust, along with key statistics on organizational trust levels and risk management.
trust, Generative AI, adoption, barriers, transparency
false
Now: Key findings 3 Building trustNow decides next: Getting real about Generative AI
Multiple Chart
Deloitte
View slide
Slide includes column charts and a summary section.
Financial Performance
Financial Services
Summarizes Q4 financial highlights and divisional revenues.
Q4, revenue, financial, highlights
false
Q4 2023 highlightsQ4 / FY 2023 results
Mixed Chart
Deutsche Bank
View slide
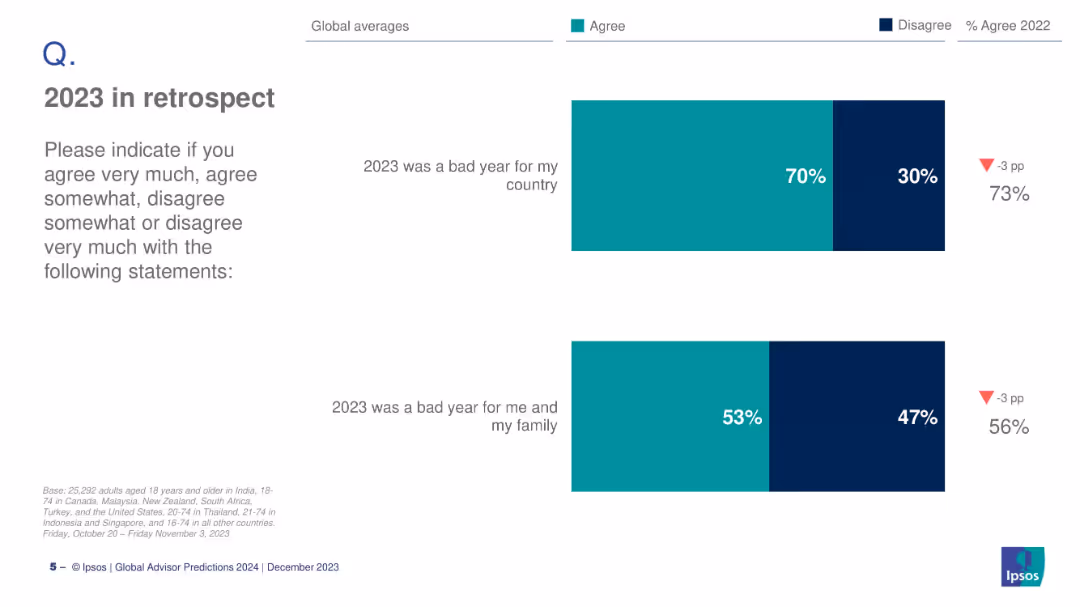
Horizontal bar charts with survey data on public sentiment about 2023.
Market Analysis and Trends
Government & Public Sector
The slide presents global survey results showing that 70% believe 2023 was a bad year for their country, and 53% for their family. It reflects public sentiment and perceived socio-economic challenges.
public sentiment, 2023 review, Ipsos, survey data, global averages, country outlook, personal impact, socio-economic sentiment
false
2023 in retrospectGLOBAL ADVISOR 2024 PREDICTIONS
Mixed Chart
IPSOS
View slide
The slide presents multiple donut charts comparing the return on equity and asset growth across different banking divisions, with textual analysis on the side.
Financial Performance
Financial Services
This slide analyzes the capital allocation and returns on equity across various banking divisions, projecting significant financial growth and detailing the drivers behind these projections, which are essential for understanding strategic financial management within the bank.
Capital, RoTE, Banking Divisions, Growth, Assets
false
Capital allocation to our highest returning divisionsFY 2023 Results Announcement
Multiple Chart
Barclays
View slide
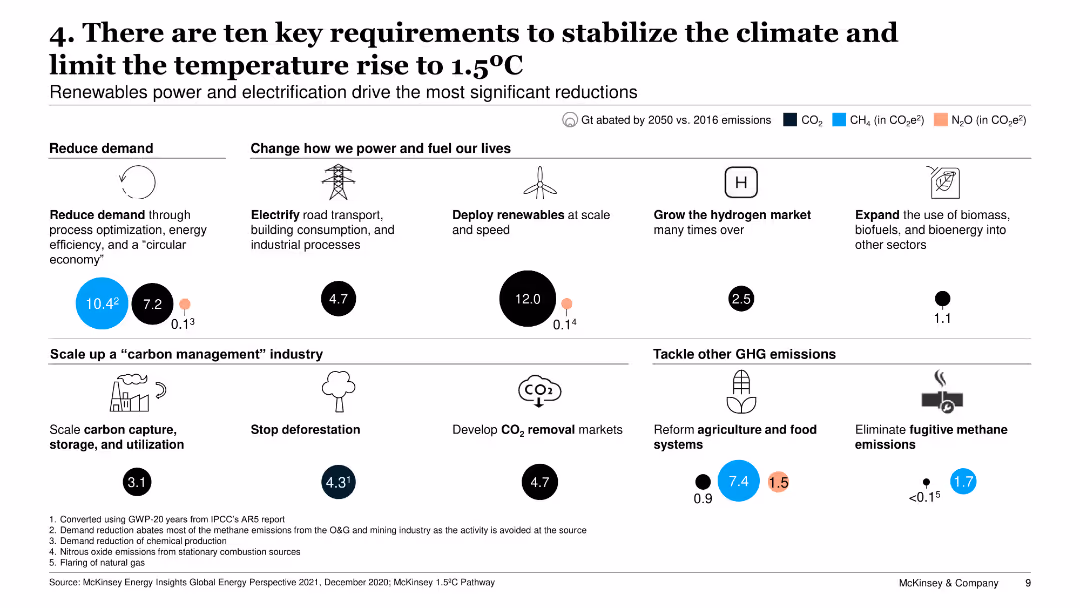
The slide uses icons and text to outline ten key strategies for climate stabilization, including demand reduction, electrification, renewables deployment, and carbon management.
Strategic Planning
Environmental Services & Sustainability
It describes the essential strategies to limit global temperature rise, focusing on renewable energy, carbon management, and changes in power consumption.
climate, temperature, stabilization, renewables, carbon management
false
4. There are ten key requirements to stabilize the climate and limit the temperature rise to 1.5ºCGlobal Energy Perspective 2021
Multiple Chart
McKinsey
View slide
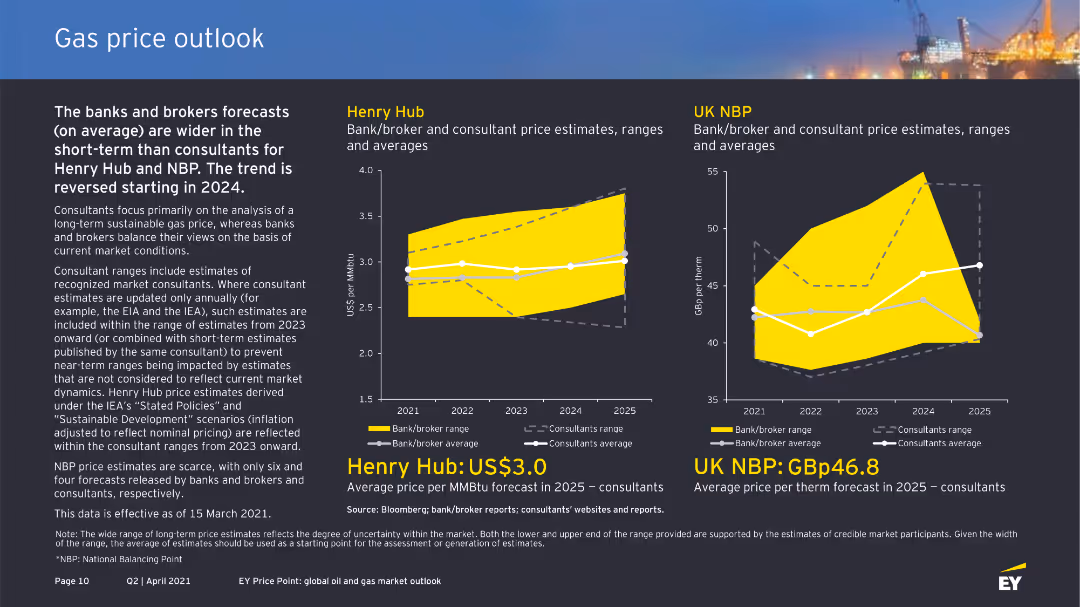
The slide shows column charts for Henry Hub and UK NBP gas price estimates by banks/brokers and consultants. It uses clear color coding and labels for different forecast ranges and averages.
Market Analysis and Trends
Energy & Utilities
This slide compares gas price forecasts for Henry Hub and UK NBP by banks, brokers, and consultants, noting a wider forecast range in the short term for banks and brokers and trend reversals starting in 2024.
gas price, Henry Hub, UK NBP, forecast, consultants
false
Gas price outlook The banks and brokers forecasts (on average) are wider in the short term than consultants for Henry Hub and NBP. The trend is reversed starting in 2024.EY Price Point: global oil and gas market outlook Q2 | April 2021
Multiple Chart
EY
View slide
Comprises pie charts showing employee distribution by function, gender, and region. The design is simple, focusing on the company's workforce structure.
Human Resources and Talent Management
Financial Services
Highlights the company's human resources, emphasizing world-class engineering and development capabilities, and employee diversity. It can be used to discuss human capital and development within the company.
employees, engineering, diversity, human resources, development, mining
false
Our People World-class engineering and development capabilitiesIMDEX Presentation Morgan Stanley Conference
Multiple Chart
Morgan Stanley
View slide
The slide features a bar chart showing percentages of respondents' management of their primary investment accounts. Each bar represents a different management method.
Investment Analysis
Financial Services
The slide presents survey data on how respondents manage their primary investment accounts, including using advisors, self-directed investment, and online advisors.
investment, advisor, portfolio, self-directed, online
false
Management of Primary Investment Account I work with, or have, an advisor or portfolio managerINVESTING AND THE COVID-19 PANDEMIC
Single Chart
IPSOS
View slide
Features a circular diagram centered around "Consumer Banking" with associated sectors and icons, as well as a bar chart for statistical representation.
Industry Overview
Financial Services
Outlines the cross-product engagement of consumer banking customers, showcasing the interconnectivity of different banking services and their contribution to the firm's value.
consumer banking, cross-product, engagement, financial services, business banking, wealth management, home lending, credit card, customer relationships
false
~50% of Consumer Banking primary customers are engaged across productsInverstors Day 2023
Diagram
JP Morgan
View slide
A column chart showing confidence levels in securing tech skills from NYC's talent pool, with categories "Very confident," "Confident," and "Somewhat confident."
Human Resources and Talent Management
Professional Services
The slide presents confidence levels among organizations about securing tech skills in 2023, illustrating high confidence in the NYC talent pool.
tech skills, talent pool, confidence, survey, NYC
false
Almost all (99%) are confident/very confident that their organization will be able to secure the tech skills needed in 2023 from the talent pool in NYC.Tech Talent Hiring Trends Survey
Mixed Chart
Accenture
View slide
Donut chart showing health-related costs as part of climate change adaptation. Sidebar lists sources of health-related costs.
Strategic Planning
Healthcare & Pharmaceuticals
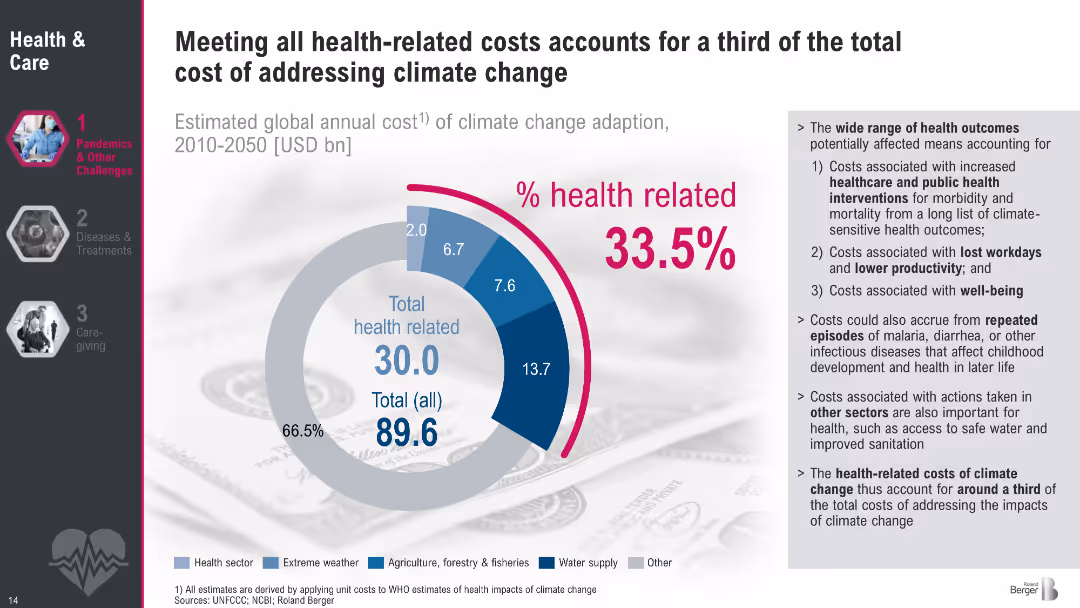
This slide presents a financial analysis of health-related costs within the broader climate adaptation budget. It reveals that health-related interventions comprise 33.5% of total adaptation costs from 2010–2050. It breaks down contributing factors such as healthcare interventions, productivity loss, and indirect costs from repeated infectious diseases and sanitation issues.
Health spending, climate adaptation, costs, interventions, sanitation, productivity, global health
false
Meeting all health related costs accounts for a third of the total cost of addressing climate changeMegatrend 2 Health & Care
Mixed Chart
Roland Berger
View slide
This slide presents four pie charts and a small table. Two charts show US Credit Cards Portfolio for 2017 and 3Q22, and one displays ICG Exposure By Region and By Grade Rating. The color scheme is blue and white.
Financial Performance
Financial Services
The slide compares credit card portfolio distributions over time and across regions and credit ratings, focusing on changes in US credit cards and total loans. It's suitable for financial reviews, strategic planning, or investor presentations to illustrate credit exposure and performance metrics.
Credit, Exposure, Portfolio, Regions, Rating, Financial, Comparison, Loans, ICG, PBWM
false
Credit and Exposure OverviewEarnings Results Presentation Third Quarter 2022
Multiple Chart
Citigroup
View slide
Text explaining the acquisition's impact on payment capabilities, graphs displaying revenue and growth projections, and logos of payment services. An image of the Newline™ service by Fifth Third.
Investment Analysis
Financial Services
Discusses the impact of the Rize acquisition on enhancing embedded payment capabilities and growth projections. Used for investor communications and showcasing digital transformation in payments.
acquisition, payments, digital transformation, fintech, growth projection, technology
false
Rize acquisition accelerates long standing embedded payments capabilitiesMorgan Stanley US Financials, Payments, & CRE Conference
Mixed Chart
Morgan Stanley
View slide
Four column charts compare investment-grade and high-yield ratings, with up/down ratios across U.S., European, and EM corporates.
Investment Analysis
Financial Services
Slide showcases rating trends and the predominance of upgrades over downgrades in high-yield ratings, essential for investment decision-making.
ratings, high-yield, investment, US, Europe, EM, trends, corporates, analysis, Q4
false
US High-Yield Ratings Upgrades Outpaced Downgrades in Q4Credit Market Monitor
Multiple Chart
Morgan Stanley
View slide
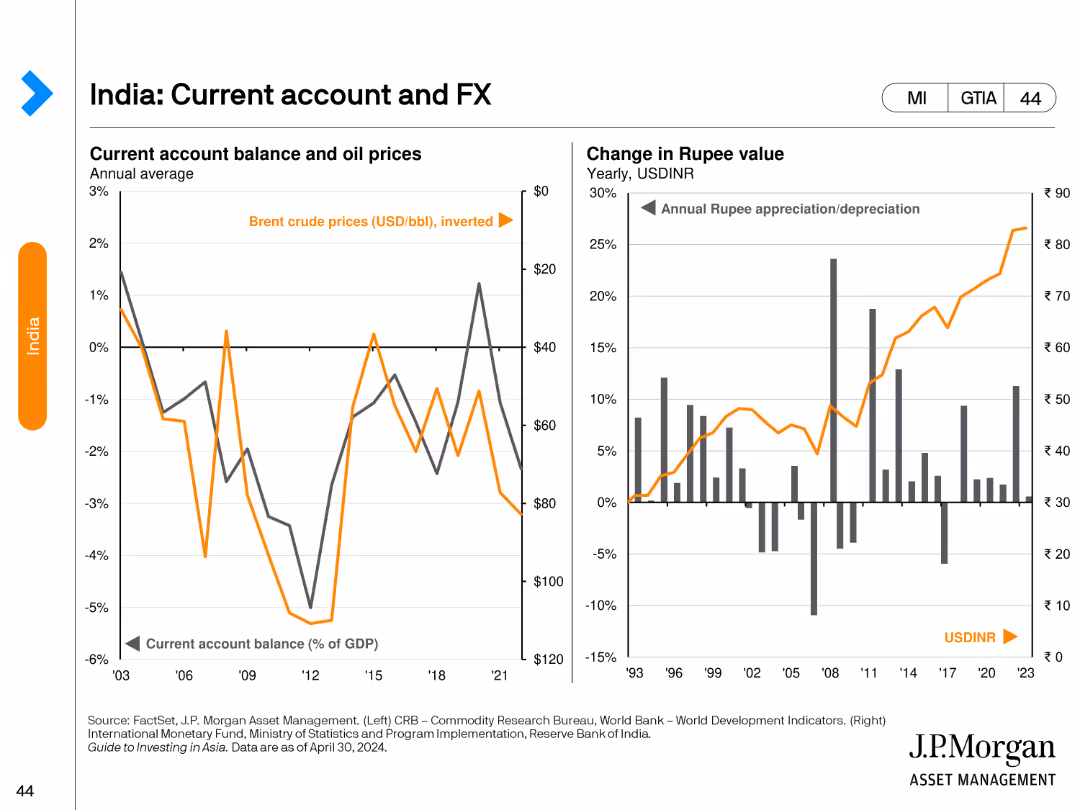
The slide features two line charts. The left chart compares India's current account balance as a percentage of GDP with Brent crude oil prices (inverted). The right chart shows the annual rupee appreciation/depreciation against USD from 1993 to 2023.
Financial Performance
Financial Services
This slide provides an analysis of India's current account balance in relation to oil prices and tracks the historical changes in the rupee's value against the US dollar.
India, current account, FX, rupee value, oil prices
false
India: Current account and FXGuide to Investing in Asia
Multiple Chart
JP Morgan
View slide
Visual with numbered icons and bullet points describing five trends.
Strategic Planning
Industrial & Manufacturing
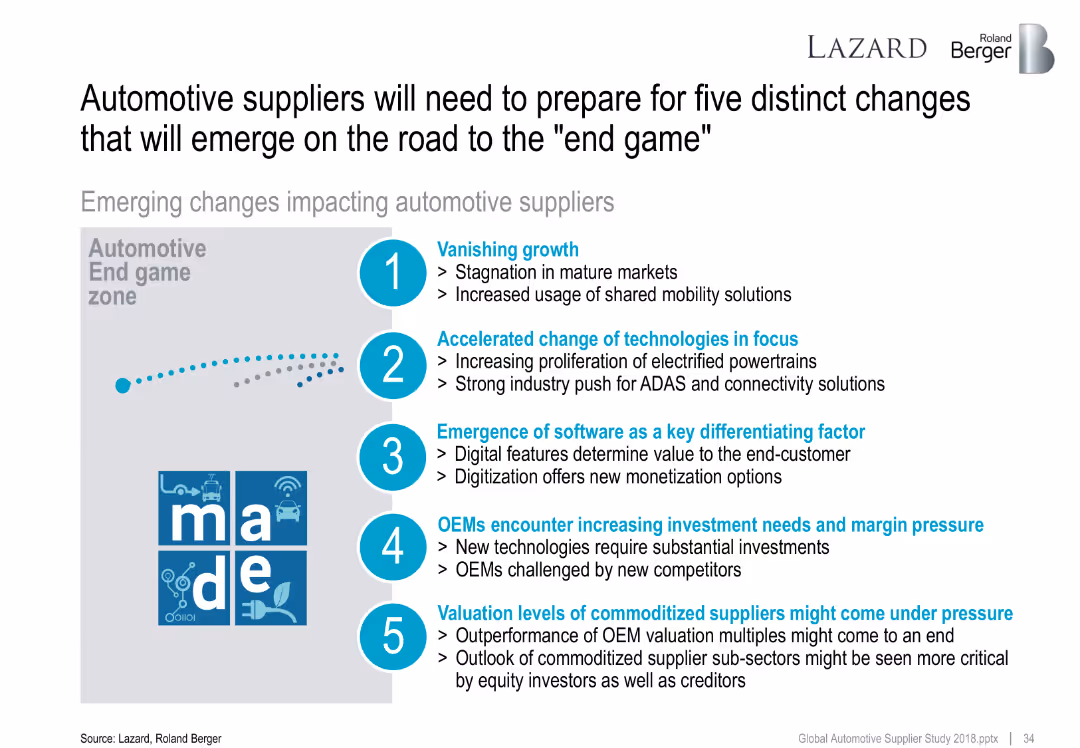
Outlines five major shifts impacting automotive suppliers, including stagnating growth, tech transitions, software focus, capex needs, and valuation pressure.
automotive suppliers, transformation, disruption, trends, future
false
Automotive suppliers will need to prepare for five distinct changes that will emerge on the road to the "end game"The overall positive sentiment was also reflected in the supplier valuation levels that still trade above their long-term average
Vertical Flow
Roland Berger
View slide
Incorporates icons and split arrows to visualize proposed changes in tax regulations for 2018, focusing on manufacturing, economic zones, and individual tax brackets.
Regulatory and Compliance
Government & Public Sector
Details proposed tax amendments in Namibia and their expected revenue impacts, essential for stakeholders in policy-making and fiscal planning. The slide outlines changes aimed at enhancing revenue through adjustments in tax structures.
Tax, Amendments, Revenue, Policy, Law
false
Preferential Tax Treatment - ManufacturerRe-Imagine the Possible 2018/2019
Framework
PwC/Strategy&
View slide
A world map highlighting preferred locations for SSCs with colored blocks indicating percentages. Right side contains bullet points summarizing the key insights.
Market Analysis and Trends
Professional Services
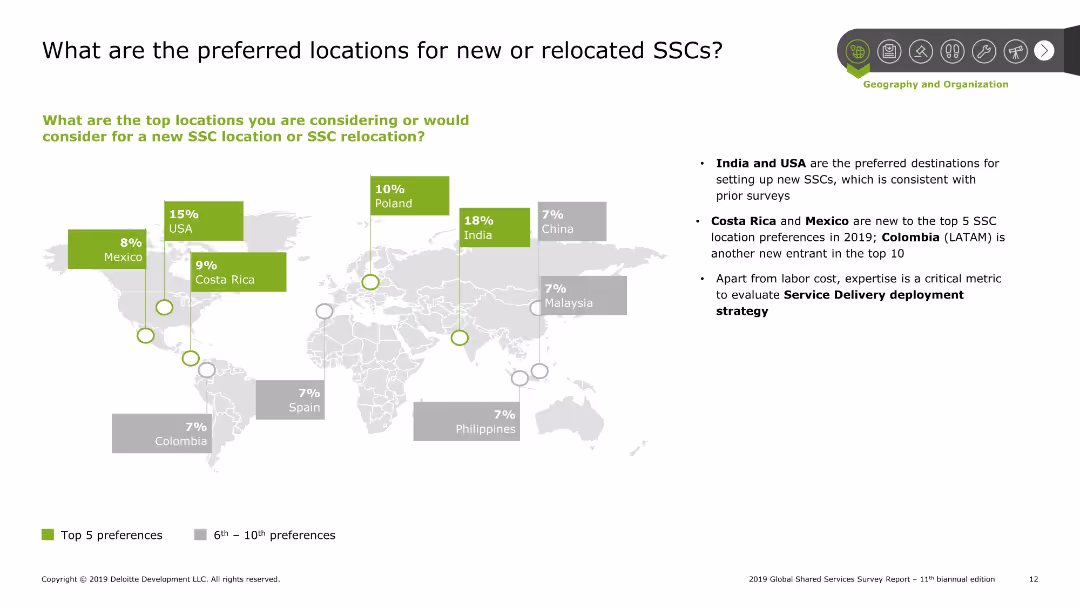
The slide shows the preferred locations for new or relocated SSCs with India, USA, and Costa Rica being the top choices. It includes a world map with highlighted countries and percentage preferences. Additional bullet points summarize trends and insights.
SSC, preferred locations, market trends, insights, geography
false
What are the preferred locations for new or relocated SSCs?2019 Global Shared Services Survey Report 11th biannual edition
Graphic
Deloitte
View slide
This slide includes two main visual elements: a column chart detailing the share of total exports to Ukraine, Russia, and Belarus from 2015-2021, and a column chart depicting trade in goods from January to April in billion ISK at constant exchange rates from 2018-2022. Both charts use distinct colors to represent different commodities and metrics.
Market Analysis and Trends
Financial Services
Analyzes the direct effects of the Ukraine conflict on Iceland's exports, particularly focusing on commodities like seafood and aluminum. It indicates minimal impact on the overall trade, supported by high production prices, and provides a yearly and monthly breakdown of trade volumes and values in the context of geopolitical tensions.
Ukraine, exports, trade, seafood, aluminum, geopolitical impact
false
The war in Ukraine has limited direct effectsArion Bank Fireside chat
Multiple Chart
Deutsche Bank
View slide
A detailed slide with a column chart showing annual global entertainment and media revenue from 2016-2025, with a red line depicting year-on-year growth percentage.
Market Analysis and Trends
Media & Entertainment
This slide analyzes the decline in global entertainment and media revenue in 2020 due to pandemic impacts, with projections up to 2025.
E&M industry, revenue impact, pandemic, global trends, 2020, projections, annual growth
false
Total Global E&M revenue in 2020 was impacted by -3.8% on 2019 levels i.e., from US$2.1trn to US$2.0trnGlobal & Entertainment Media Outlook 2021-2025
Single Chart
PwC/Strategy&
View slide
Sectioned text blocks discussing major trends in food technology, alongside relevant imagery and bullet points.
Technology and Digital Transformation
Agriculture & Food Production
Explores the key trends driving innovation in the Swiss FoodTech industry, focusing on sustainability, transparency, and efficiency.
FoodTech, trends, innovation, sustainability, transparency
false
What is driving innovation in FoodTech?The Swiss FoodTech Ecosystem 2021
Header Vertical
Accenture
View slide
Multiple sections with text and a small bar chart showing renewable energy capacity additions.
Strategic Planning
Energy & Utilities
Discusses Turkey's shift towards domestic renewable energy sources and the consistent increase in renewable energy generation.
Transition, Renewable, Energy, Domestic, Growth
false
Energy transition to renewable energy supports Turkey’s goals to shift into domestic sources of energy in the long term.Turkey power generation evolution and top 100 players by capacity
Multiple Chart
Kearney
View slide
A column chart illustrating the reduction in operating expenses in millions, with percentage changes and explanatory side notes.
Operational Efficiency
Financial Services
The slide discusses the execution of cost-reduction strategies, resulting in a 5% decrease in underlying operating expenses quarter-over-quarter.
operating expenses, cost reduction, QoQ, efficiency, financial strategy
false
Executing on cost ambitions with underlying operating expenses down 5% QoQFirst quarter 2024 Financial results
Mixed Chart
UBS
View slide
The slide presents a linear progression of trends and impacts in a data-driven format. Key trends and challenges are highlighted with icons and brief descriptions, each marked with a red dot. The red-to-black gradient emphasizes the flow from current trends to delayed impacts.
Risk Assessment and Management
Professional Services
This slide is utilized to describe the current macroeconomic challenges and uncertainties. It emphasizes trends like natural resource shortages, global food pricing disruption, and financial market instability, leading to potential delayed impacts such as technological disruption and geopolitical realignment.
Macro Environment, Challenges, Trends, Uncertainty, Risks, Geopolitical, Technological, Economic Slowdown
false
The current macro environment poses a range of significant challenges and continued uncertainty2023 Global Private Equity Report
Linear Flow
Bain
View slide
This slide includes a text section on the left discussing carbon pricing as a commodity and two column charts on the right. One chart shows trades in CO2 emissions, and the other displays CO2 emissions intensity by region, both with clear color distinctions.
Market Analysis and Trends
Government & Public Sector
It argues for the benefits of treating carbon as a tradable commodity to drive global emissions reduction. The slide presents data on CO2 trades between regions and the carbon intensity of goods production, highlighting how regions can leverage carbon pricing to achieve more significant environmental and economic benefits.
Carbon Pricing, CO2 Emissions, Trades, Commodity, Intensity
false
The case for pricing carbon as a commodity in the long termThe green transition
Multiple Chart
EY
View slide
This slide includes a map of Australia showing grain production regions and a list of major crops with percentages of total production.
Industry Overview
Agriculture & Food Production
The slide provides an overview of grain production in Australia, emphasizing that wheat is the predominant crop and detailing the production regions and other major crops.
Wheat, Grain, Production, Australia, Crops
false
Wheat accounts for c.54% of total grain production and is predominantly grown in WA, the eastern states, and SAInternational Comparison of Australia’s Freight and Supply Chain Performance
Graphic
LEK
View slide
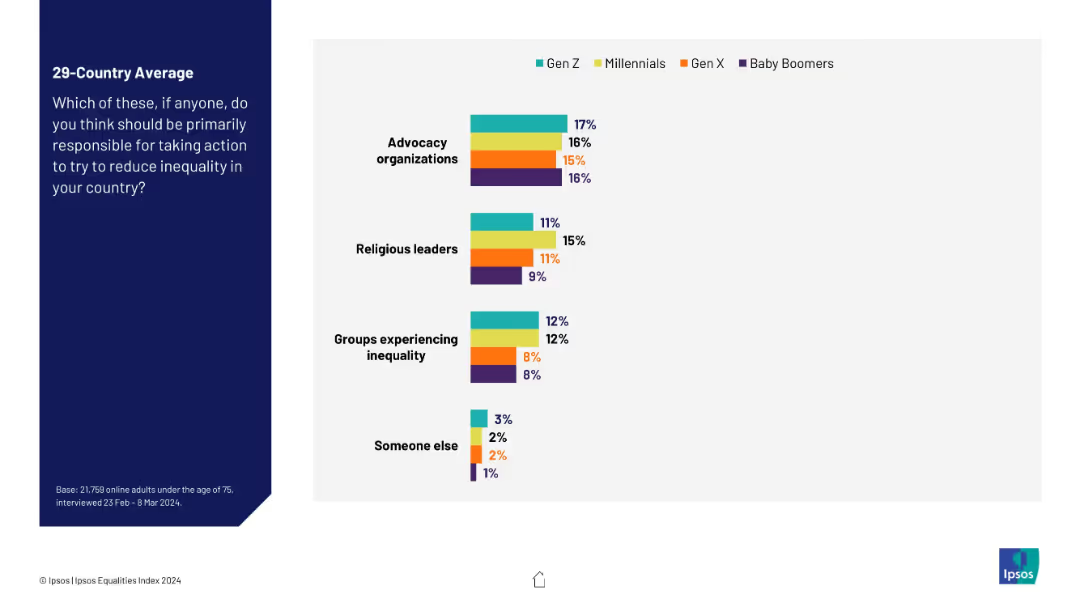
Continuation of 19345 with less commonly chosen actors (advocacy, religious leaders, etc.), horizontal grouped bar chart. Consistent design.
Strategic Planning
Government & Public Sector
This slide expands on slide 19345 by showing lesser-chosen actors for inequality reduction. Advocacy organizations and religious leaders receive moderate to low attribution, while “someone else” and “groups experiencing inequality” score lowest. Generational variance is moderate.
public opinion, minority voices, responsibility, inequality, Ipsos, generational divide, advocacy, religion
false
Who should be primarily responsible… to reduce inequality in your country?IPSOS EQUALITIES INDEX 2024
Mixed Chart
IPSOS
View slide
This slide features a column chart showing the percentage of brands in different stages of digital marketing maturity, with statistical data on each stage.
Market Analysis and Trends
Professional Services
Discusses the low percentage of brands in Australia and New Zealand that fully utilize data-driven marketing techniques.
digital marketing, data-driven, Australia, New Zealand, brands, statistics, analysis
false
Only 2% of Australian & New Zealand brands are realising the full potential of data-driven marketingUnderstanding the path to digital marketing maturity
Single Chart
BCG
View slide
This slide presents three column charts comparing waste recycling, product take-back, and recycling percentages at the end of life. The charts are color-coded in blue, distributed evenly across the slide.
Operational Efficiency
Environmental Services & Sustainability
The slide examines the recycling inefficiencies in production and end-of-life product management, emphasizing waste in production, product take-back, and recycling rates. It is likely used for sustainability assessments.
recycling, sustainability, waste management, production, end-of-life, inefficiency, take-back, environmental
false
Inefficiency assessment (4/5)Nordic Circular Economy Playbook 2.0
Multiple Chart
Accenture
View slide
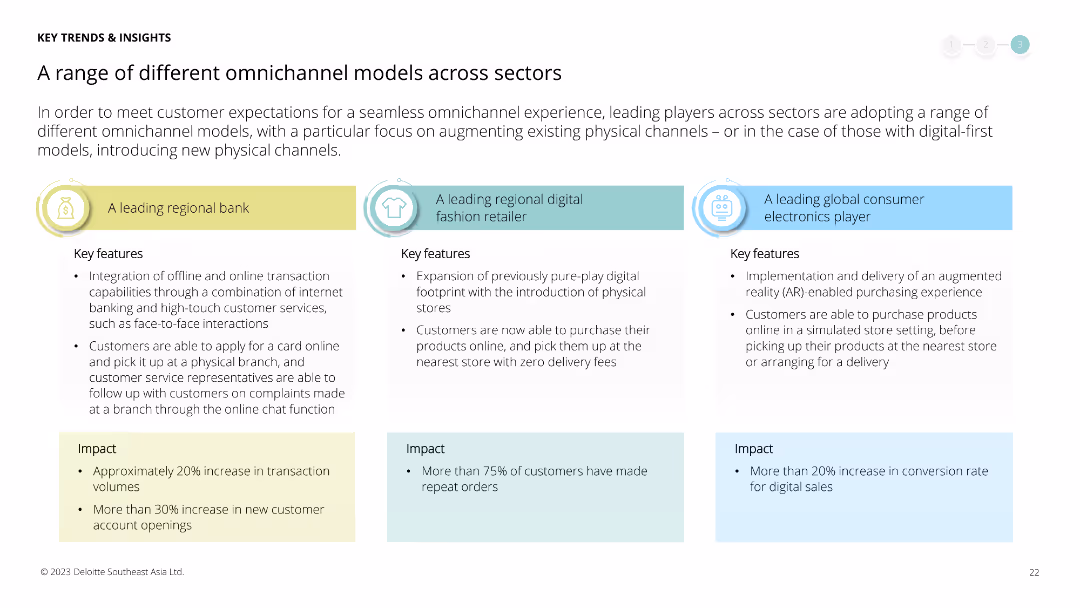
Comparative analysis of three omnichannel models used by a regional bank, a digital fashion retailer, and a global consumer electronics player. Text boxes explain key features and impacts for each.
Operational Efficiency
Retail & E-commerce
Provides case studies of omnichannel strategies across different sectors, comparing their implementation and impact on transaction volumes and customer engagement.
omnichannel, case study, retail, banking, fashion, consumer electronics, digital commerce, customer engagement, impact
false
A range of different omnichannel models across sectorsThe consumer industry’s journey towards digital maturity
Pillar
Deloitte
View slide
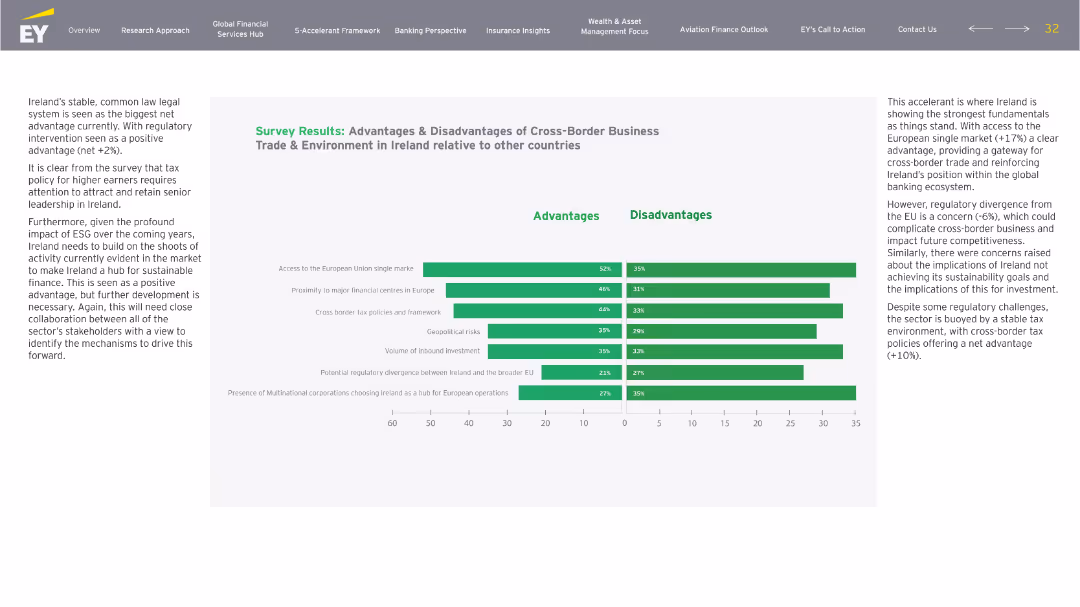
Side-by-side bar chart analysis with descriptive paragraph to the left and horizontal bar charts in green to the right. Advantages and disadvantages split, same categories reused from earlier.
Market Analysis and Trends
Financial Services
Expands on the earlier trade slide with more granular survey data. Reinforces Ireland’s edge in EU access and global HQ proximity, but flags regulatory divergence and sustainability gaps as concerns. Presents stakeholders’ feedback for future policy alignment.
cross-border, EU, trade, sustainability, regulation, investment
false
Survey Results: Advantages & Disadvantages of Cross-Border Business Trade & Environment in Ireland relative to other countriesBuilding a Better Financial Services Ireland: Accelerate to Elevate
Mixed Chart
EY
View slide
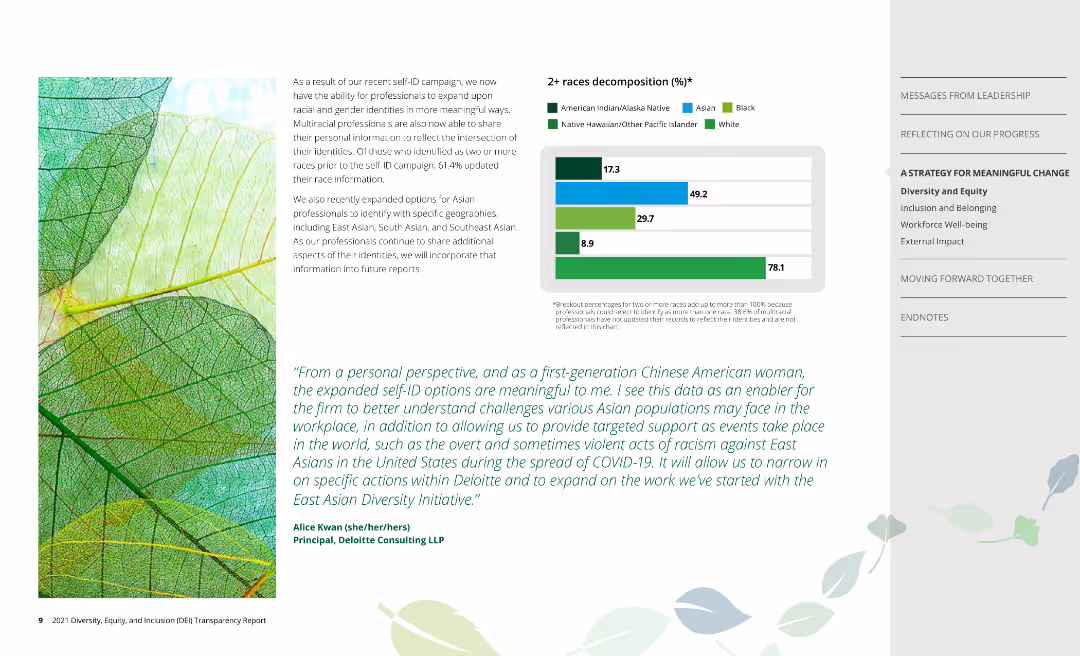
The slide features a bar chart decomposing the 2+ races demographic, with additional text explaining the significance of expanded self-ID options and personal perspectives from employees.
Human Resources and Talent Management
Professional Services
The slide highlights the impact of expanded self-identification options on the company's understanding of racial and gender identities, supported by personal perspectives and detailed demographic data on professionals identifying as 2+ races.
Self-ID, diversity, racial identity, gender identity, demographics
false
2+ races decomposition (%)*2021 Diversity, Equity, and Inclusion (DEI) Transparency Report
Mixed Chart
Deloitte
View slide
Horizontal bar chart of country rankings with color-coded segments indicating opinions
Strategic Planning
Government & Public Sector
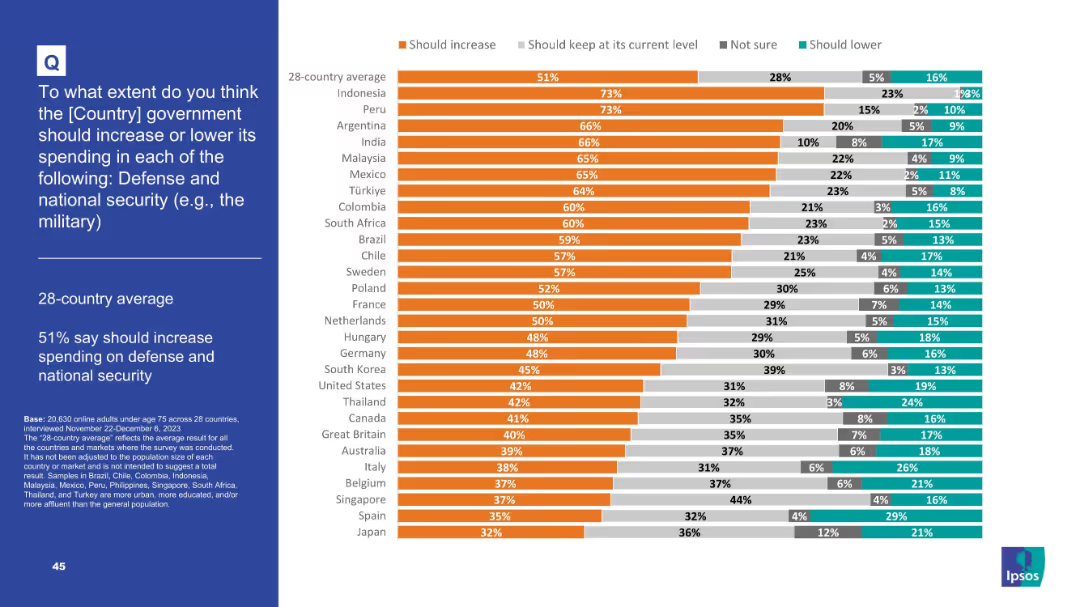
This slide compares how people in 28 countries feel about increasing or maintaining military/defense spending. While 51% on average favor an increase, support is highest in Indonesia and Peru (73%). Japan has the lowest at 32%.
Military, defense spending, national security, global opinion, survey, public policy, bar chart, Ipsos, government priorities, strategic investment
false
Defense and National Security SpendingPOPULISM IN 2024
Mixed Chart
IPSOS
View slide
The slide presents icons showing different fears affecting innovators, with comparative intensity levels among average and leading innovators.
Human Resources and Talent Management
Professional Services
Explores common fears among innovators, comparing how these fears vary between average and leading innovators and their impact on innovation efficiency.
innovation, fears, impact, career, outcomes, criticism, comparison
false
What kind of fears are we talking about?Driving innovation at scale
Pillar
McKinsey
View slide
The slide is text-centric with a table format highlighting stages of the software development life cycle (SDLC) and corresponding technologies. Each technology is paired with a real-world company example, and the layout is direct with a clear delineation of information, utilizing minimal design elements for clarity.
Technology and Digital Transformation
Technology & Software
Highlighting successful industry applications of next-gen software development tools, this slide gives examples of companies like Decathlon and Atlassian leveraging technologies such as infrastructure-as-code and AI-based reviews. It serves as a practical insight into how these tools are applied in business contexts.
SDLC, Case Studies, Software Development, Infrastructure-as-Code, AI, Atlassian, Decathlon
false
Who has successfully created impact with next-generation software development?McKinsey Technology Trends Outlook 2022 Next-generation software development
Header Vertical
McKinsey
View slide
Five icons representing different factors such as 'Technical feasibility', 'Cost of labor', and 'Regulatory and social factors', each with a descriptive subheading and arranged in a clean, circular layout.
Strategic Planning
Technology & Software
Outlines the major factors that influence the pace and extent of AI and automation adoption in industries, discussing technical, economic, and regulatory considerations.
AI, Automation, Factors, Adoption, Industry
false
Several factors affect the pace and extent of AI and automationA FUTURE THAT WORKS: AI, AUTOMATION, EMPLOYMENT, AND PRODUCTIVITY
Pillar
McKinsey
View slide
Text on left; bar and donut charts on right showing tool usage and future plans.
Technology and Digital Transformation
Technology & Software
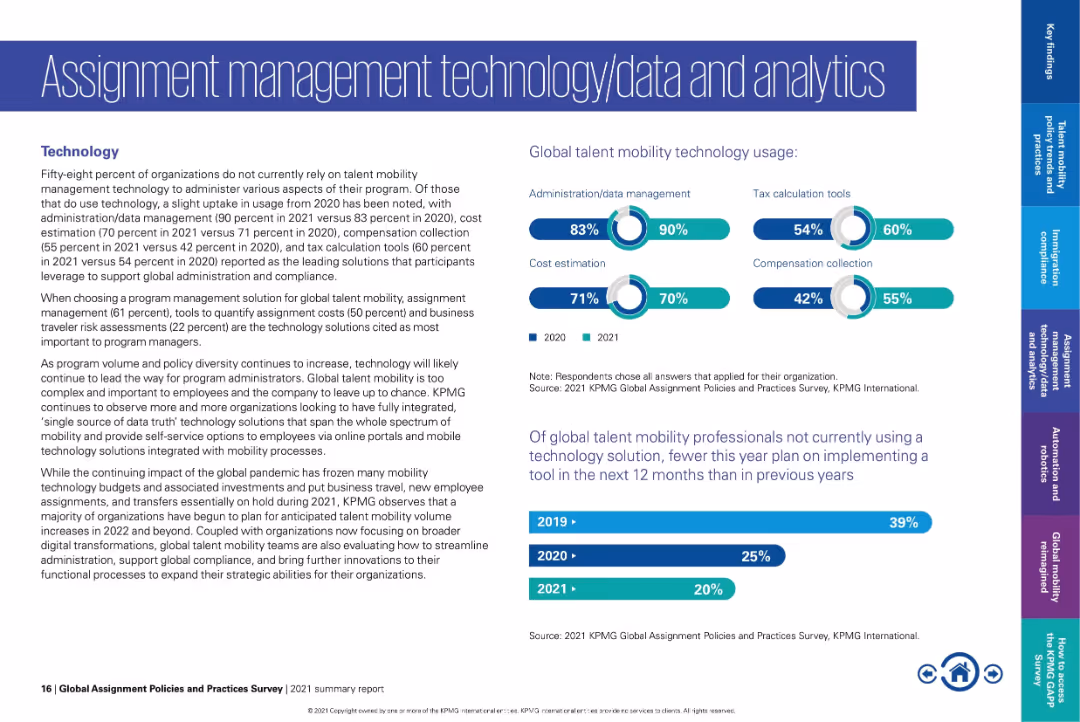
Shows usage statistics for global mobility technologies, with highest adoption in admin/data management and tax tools. Notes declining intent to adopt new tech and highlights trends in integrating systems for better data transparency.
mobility technology, admin tools, tax tools, cost estimation, data management, digital transformation
false
Assignment management technology/data and analyticsGlobal Assignment Policies and Practices Survey
Multiple Chart
KPMG
View slide
Matrix diagram detailing transaction structures by company size for referral deals, disposals, and mergers.
Operational Efficiency
Financial Services
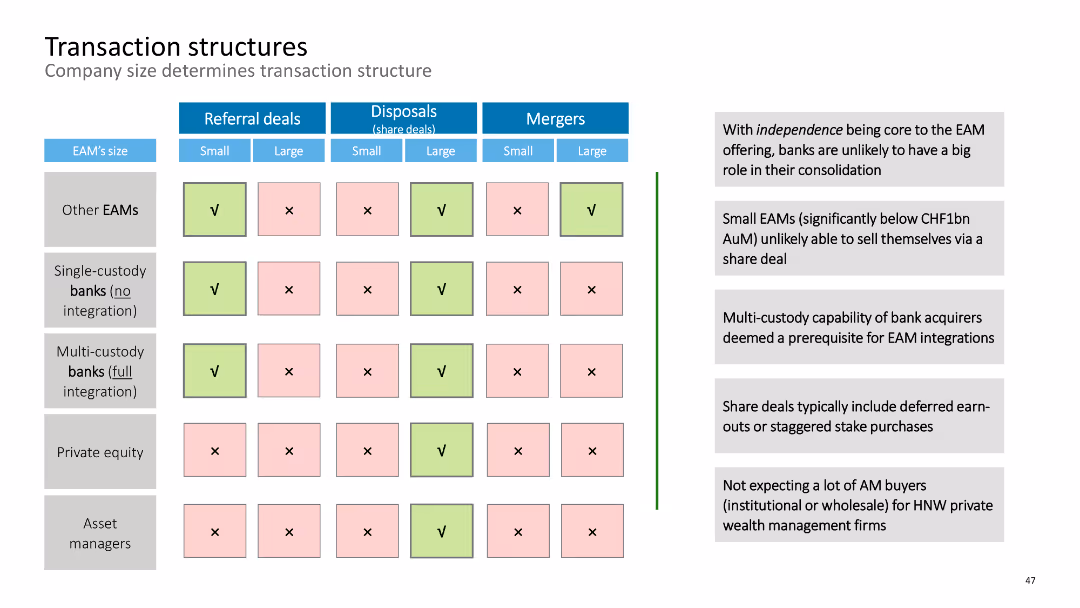
This slide outlines various transaction structures in the financial sector, considering company size and deal type.
transaction structures, referral deals, disposals, mergers, financial services, company size
false
Transaction structures Company size determines transaction structureExternal Asset Manager (EAM) Conference
Table
Deloitte
View slide
Bar chart by country; uses teal and navy bars to represent likely/unlikely; legend and changes from 2023 on right
Risk Assessment and Management
Environmental Services & Sustainability
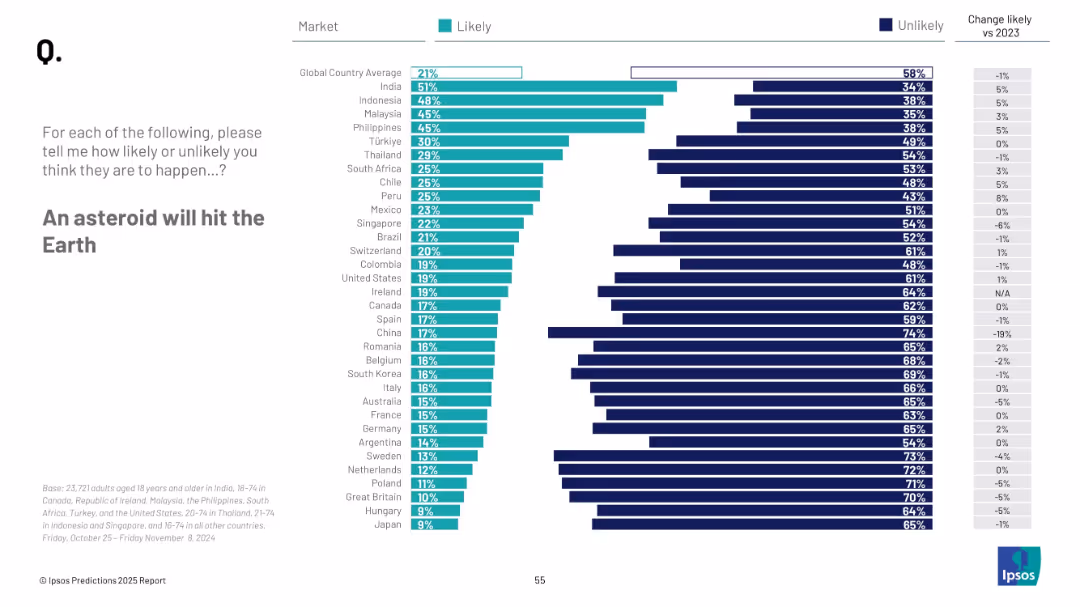
This slide highlights global beliefs about the chance of an asteroid impact on Earth. It compares perceived likelihood across countries, with average trends and year-over-year changes.
asteroid impact, global fears, natural disaster, public sentiment, 2025, survey, likelihood, Ipsos
false
An asteroid will hit the EarthPREDICTIONS 2025 REPORT
Mixed Chart
IPSOS
View slide
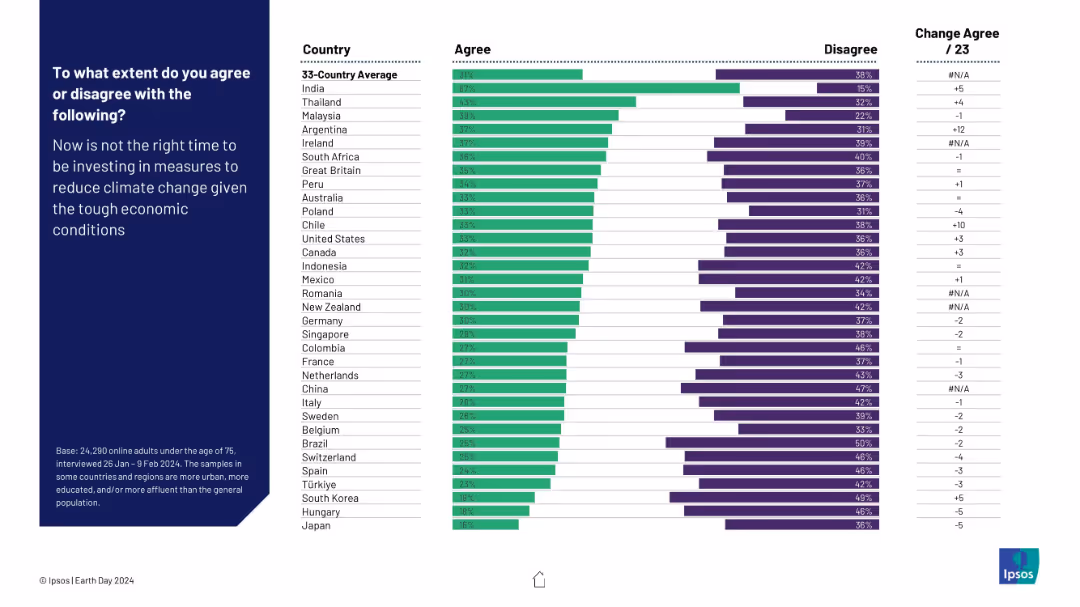
Horizontal bar chart showing agreement/disagreement percentages by country regarding investment in climate measures during economic hardship. Change from 2023 included.
Market Analysis and Trends
Environmental Services & Sustainability
This slide illustrates global sentiment on delaying climate investments due to economic constraints. India leads in agreement (67%), indicating greater economic prioritization over climate action. The data reveals varying levels of urgency or resistance to climate spending depending on national economic outlooks.
climate investment, economic hardship, climate policy, public opinion, country comparison, environmental spending, Ipsos, Earth Day, green economy
false
To what extent do you agree or disagree with the following?EARTH DAY 2024
Mixed Chart
IPSOS
View slide
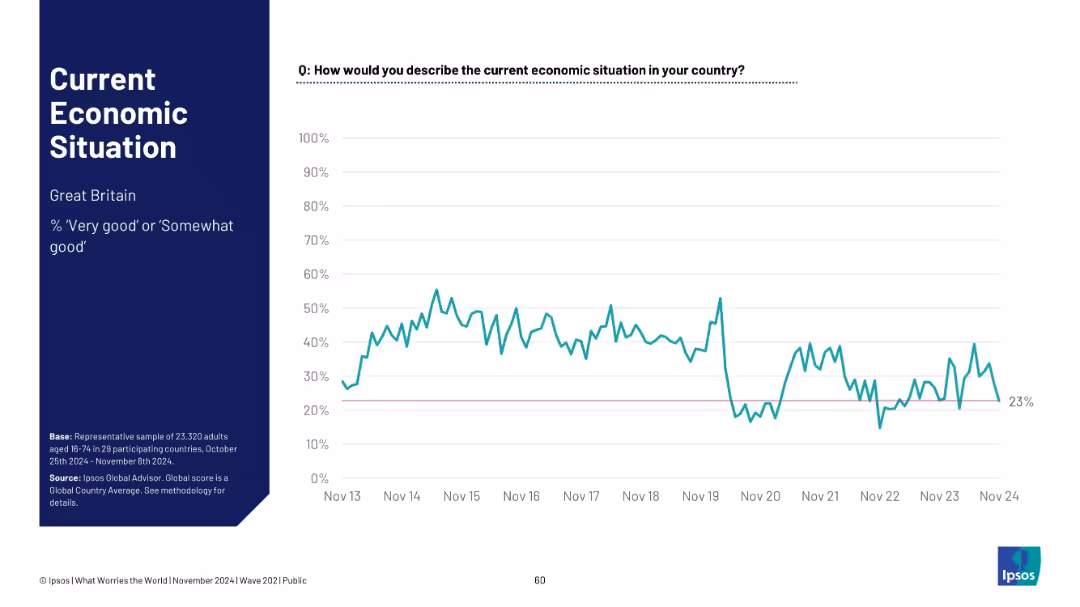
Layout mirrors previous slides; data for Great Britain. Title and summary left; sentiment trend graph right
Market Analysis and Trends
Government & Public Sector
Economic sentiment in Great Britain currently stands at 23%. The line graph shows significant fluctuation, with a major dip around 2020 and partial recovery in recent years.
Great Britain, economy perception, public sentiment, Ipsos report, economic evaluation, trend chart, UK economy
false
Current Economic SituationWhat Worries the World
Single Chart
IPSOS
View slide
The slide shows a dark theme with two divided column charts comparing the unsecured funding mix between years. Text blocks detail the growth in deposits and total assets in bank entities.
Financial Performance
Financial Services
Aimed at depicting the funding strategy improvement over time, the slide contrasts the wholesale unsecured and deposit percentages from 2019 to 2022.
Funding, Liquidity, Deposits, Unsecured, Assets, Banks, Growth, Strategy
false
Actively Managing Our Funding and Liquidity ProfileFinancial Roadmap
Mixed Chart
Goldman Sachs
View slide
This slide displays a column chart showing global visibility into ad content placement across different regions with corresponding percentages. Text on the right.
Market Analysis and Trends
Professional Services
The slide shows the percentage of visibility into ad content placement globally, broken down by region (APAC, EMEA, North America, LATAM) and different levels of visibility.
ad placement, visibility, global analysis, column chart, advertising
false
Global visibility into ad content placement is highEra of alignment
Mixed Chart
Nielsen
View slide
Features a line graph comparing trends in residential and nonresidential construction spending in the U.S. The slide is detailed with continuous data lines in different colors for distinction.
Market Analysis and Trends
Real Estate & Construction
Reviews trends in U.S. construction spending, highlighting the growth in residential and nonresidential sectors. This slide is useful for market analysis in real estate and construction sectors, offering insights into economic health and development opportunities.
Construction, Real Estate, US, Spending Trends, Growth Analysis
false
U.S. construction spending growth remains solid…Deutsche Bank Global Industrials & Materials
Single Chart
Deutsche Bank
View slide
The slide features a two-column, three-row structure. Each cell contains a dark blue header, a thematic icon, and two bullet points in white font. A numerical page indicator is present in the bottom right corner.
Industry Overview
Financial Services
This slide lists nine themes central to the presenter's sustainable finance commitment. These include clean energy, sustainable transport, and accessible healthcare, among others. Each theme is supported by specific goals, like reducing energy consumption or increasing the affordability of healthcare. It's a strategic overview that can be used to communicate the company's priorities in sustainability to stakeholders or in corporate strategy meetings.
Sustainability, Finance, Healthcare, Clean Energy, Transport, Education, Community, Inclusion, Growth
false
Nine Themes Driving Our Sustainable Finance CommitmentSustainability: Our Issuance Framework
Table
Goldman Sachs
View slide
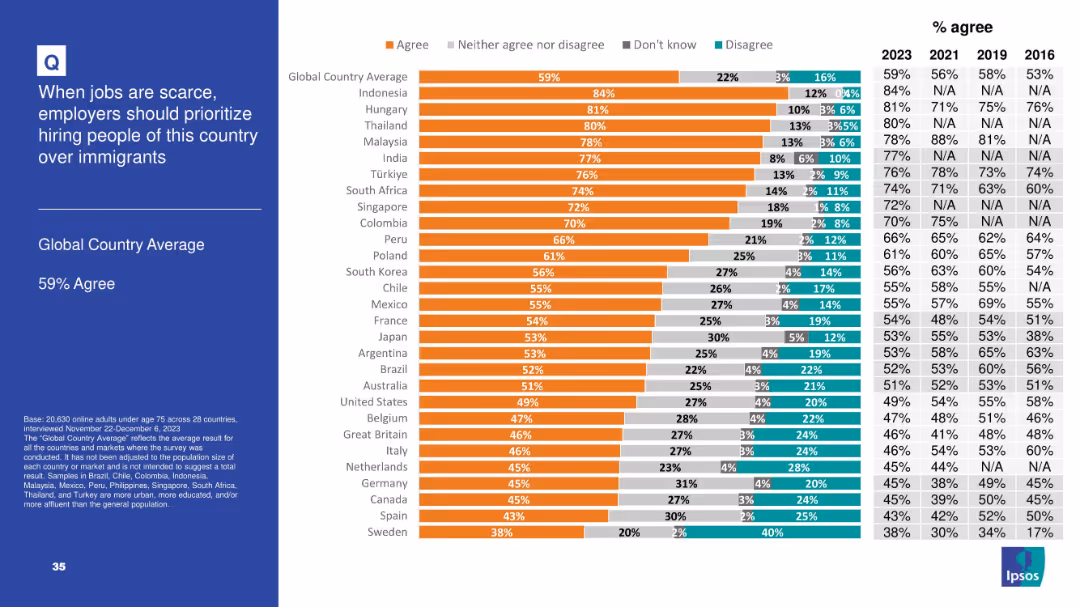
Horizontal bar chart with segmented agreement levels by country; includes historical comparison table (2016–2023) on the right and a bolded left-side title panel
Market Analysis and Trends
Government & Public Sector
The slide shows the level of agreement in 28 countries with the idea that employers should prioritize hiring nationals over immigrants when jobs are scarce. 59% globally agree, with particularly high support in Indonesia, Hungary, and Thailand.
immigration, employment, public opinion, nationalism, workforce, Ipsos, survey, global comparison, job scarcity, hiring priorities
false
When jobs are scarce, employers should prioritize hiring people of this country over immigrantsIPSOS POPULISM SURVEY
Mixed Chart
IPSOS
View slide
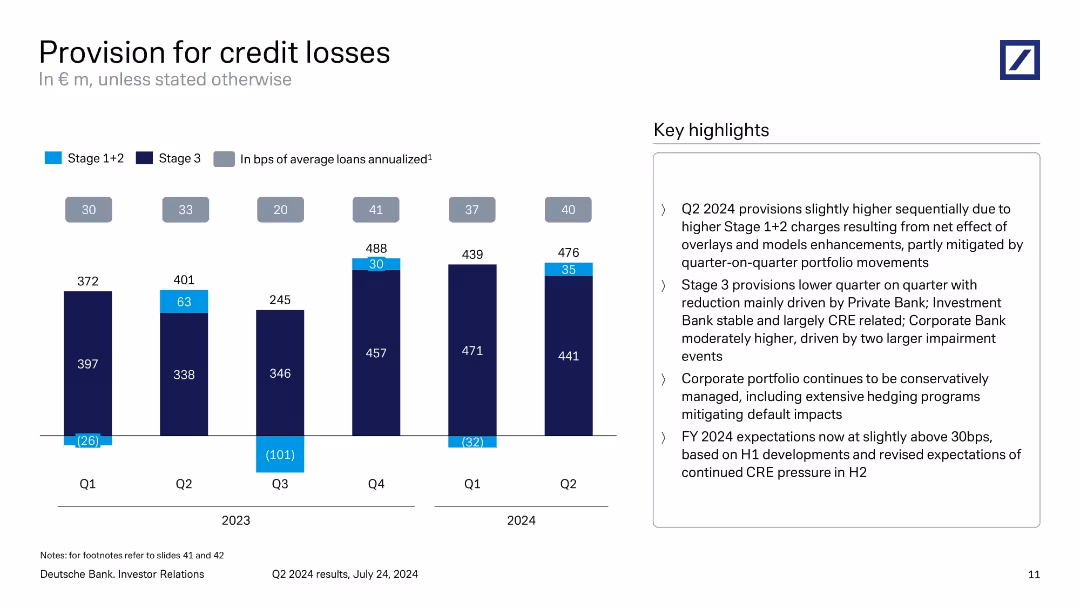
Vertical bar chart over 6 quarters, split by stages 1+2 and 3, with bps overlay and commentary box on the right.
Risk Assessment and Management
Financial Services
Depicts provision for credit losses over recent quarters, segmented by impairment stage. Notes elevated provisions in Q2 2024, driven by overlays, model changes, and impairment events. Commentary includes outlook for FY 2024 provisions and continued conservative risk management.
credit losses, provision, impairment, risk management, Stage 3, CRE, Deutsche Bank
false
Provision for credit lossesQ2 2024 results
Mixed Chart
Deutsche Bank
View slide
This slide features a bar graph showing the net present value (NPV) build-up for the H-vision project, including revenue, costs, and subsidies required for profitability.
Investment Analysis
Energy & Utilities
The slide illustrates the financial requirements and expected profitability of the H-vision project in the reference scenario, highlighting the need for a €0.7 billion subsidy and the avoided cost of ETS certificates to achieve economic viability.
H-vision, subsidy, NPV, investment, profitability
false
H-vision project NPV build-upHydrogen applications and business models
Mixed Chart
Kearney
View slide
The slide features a column chart showing the theoretical, technical, and sustainable feedstock energy potential by feedstock type for the year 2060. The chart uses various shades of purple to represent different types of feedstock, including energy crops, municipal solid waste, forestry residues, agricultural residues, and animal waste.
Market Analysis and Trends
Energy & Utilities
This slide illustrates the potential energy that could be derived from various types of biomass feedstock by 2060. It emphasizes the portion of feedstock not gathered or collected and the competition for feedstock with other uses.
feedstock, biomass, energy, potential, 2060, theoretical, technical, sustainable, agricultural residues, energy crops
false
Feedstock energy potential by feedstock type World, 2060, % of theoretical potential, Mtoe1Developing sustainable carbon circularity Looking at advanced applications and business models
Single Chart
Kearney
View slide
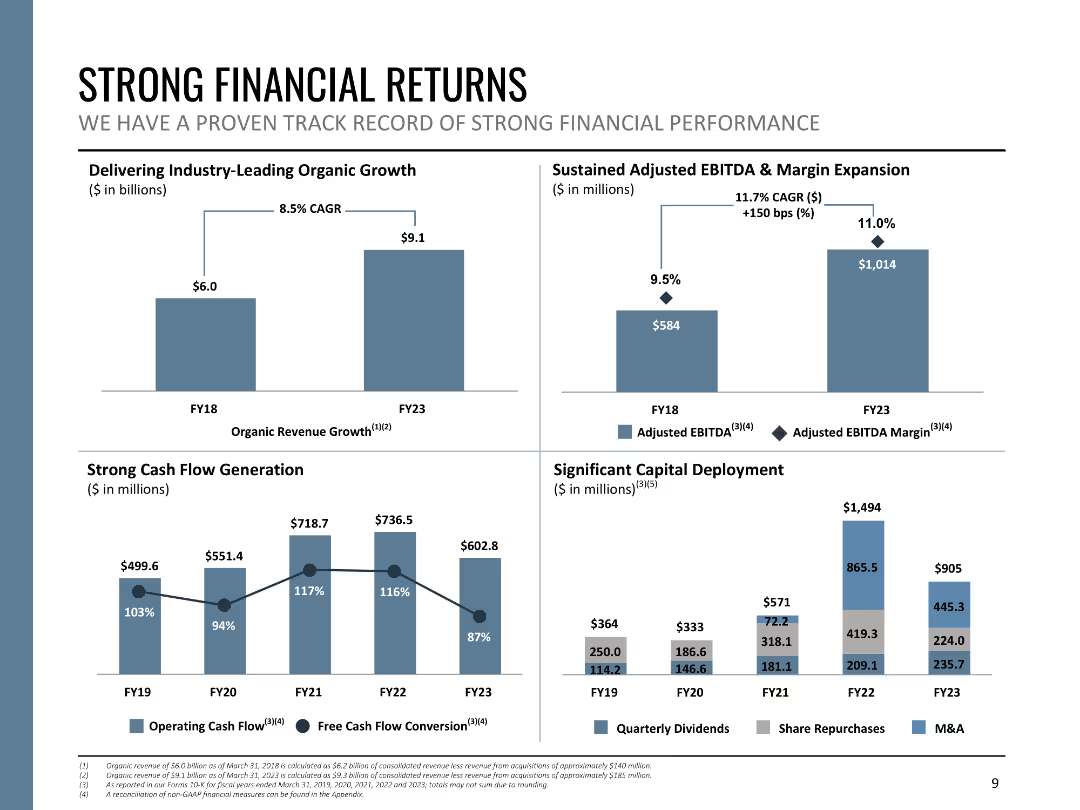
The slide includes four column charts displaying financial metrics such as organic revenue growth, adjusted EBITDA, cash flow generation, and capital deployment from FY18 to FY23. Each chart is clearly labeled with distinct colors and values.
Financial Performance
Financial Services
This slide presents Booz Allen's financial performance, showcasing strong organic growth, EBITDA margin expansion, cash flow generation, and significant capital deployment. It demonstrates the company's robust financial health and strategic investments.
financial returns, growth, EBITDA, cash flow, capital deployment
false
STRONG FINANCIAL RETURNS WE HAVE A PROVEN TRACK RECORD OF STRONG FINANCIAL PERFORMANCEInvestor Presentation Deck
Multiple Chart
Booz Allen Hamilton
View slide
Features a combination of column charts and line graphs in grayscale and green, highlighting brand popularity in the second-hand market.
Market Analysis and Trends
Retail & E-commerce
Analyzes brand performance in the second-hand luxury market versus new goods market, with specific focus on brands like Alexander McQueen.
brand popularity, second-hand market, luxury goods, market analysis, brand performance
false
Popularity of brands in 2nd-hand market disproportionate to share of 1st-hand sales2019 True-Luxury Global Consumer I nsight
Single Chart
BCG
View slide
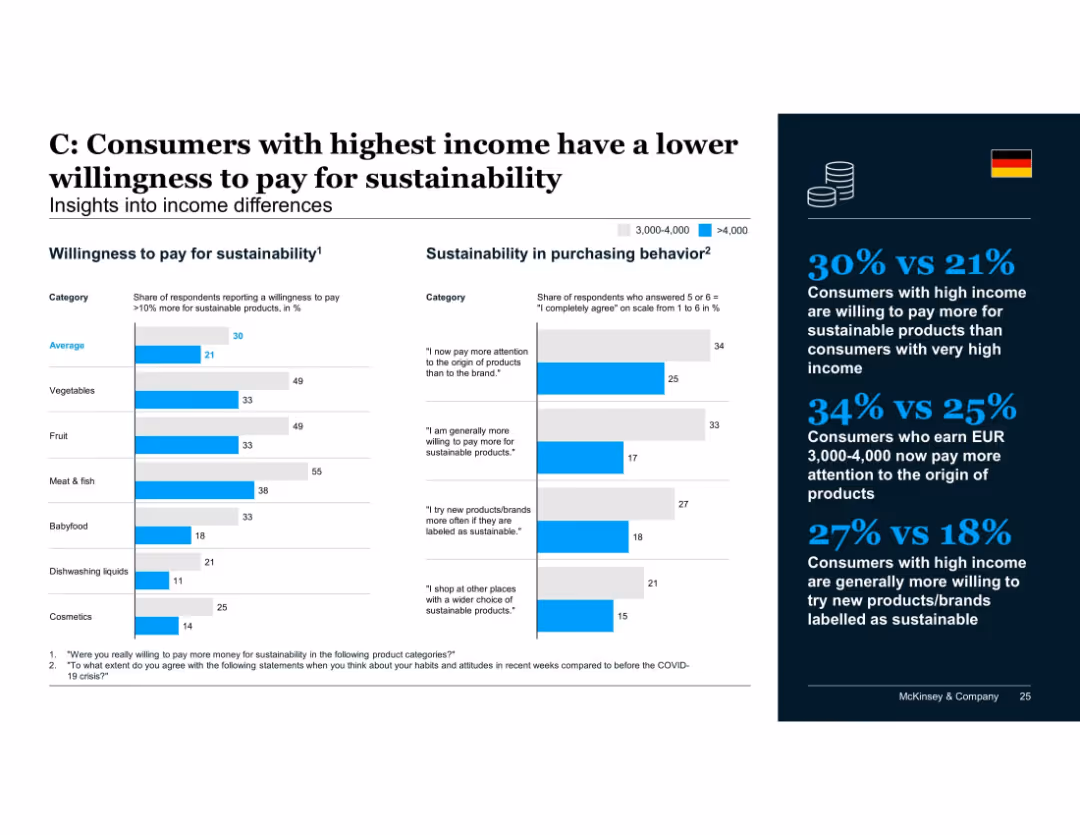
Income-based comparison using two bar charts: one for % willing to pay >10% more and one for agreement with sustainability-related statements; summary on the right.
Customer and Market Segmentation
Consumer Goods
Consumers with the highest income levels show less willingness to pay premiums for sustainability than those earning slightly less. However, middle-high income groups show higher engagement in paying attention to product origin and trying new sustainable products.
income levels, sustainability, willingness to pay, consumer behavior, purchasing patterns, high-income consumers
false
C: Consumers with highest income have a lower willingness to pay for sustainabilityConsumers' sustainability sentiment and behavior before, during and after the COVID-19 crisis
Mixed Chart
McKinsey
View slide
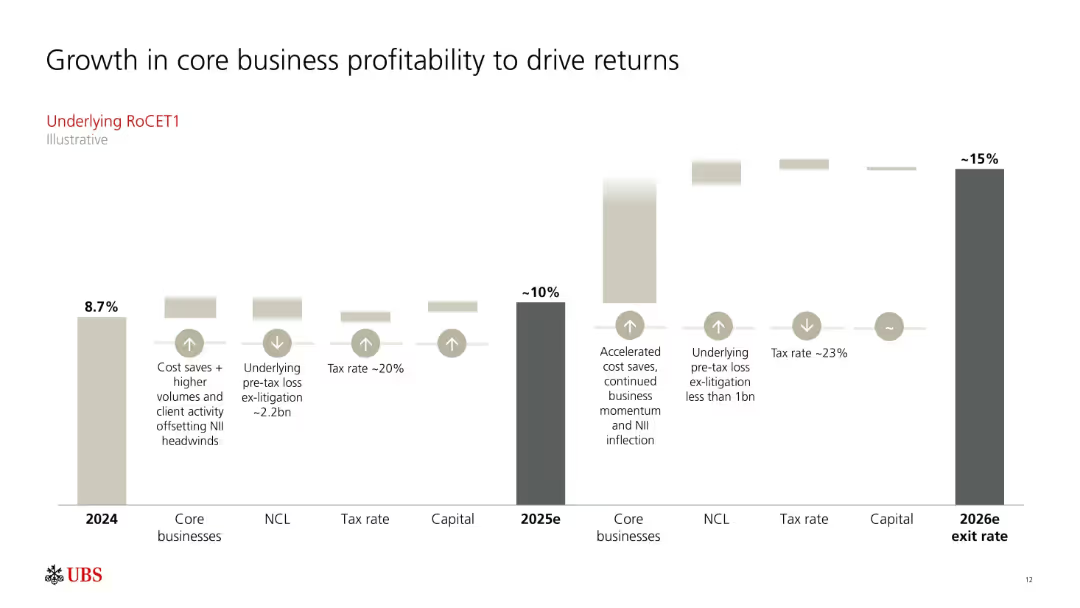
Waterfall-style chart projecting RoCET1 progression from 2024 (8.7%) to 2026 (~15%) exit rate with factors contributing to growth.
Strategic Planning
Financial Services
Illustrates UBS’s planned increase in underlying RoCET1 to ~15% by 2026 through core business growth, cost savings, and tax management. Each driver is annotated with expected quantitative and qualitative impacts.
UBS, RoCET1, profitability, growth drivers, core business, tax rate, financial return, 2026 projection
false
Growth in core business profitability to drive returnsFull-year and fourth quarter 2024 Fixed Income investor presentation
Single Chart
UBS
View slide
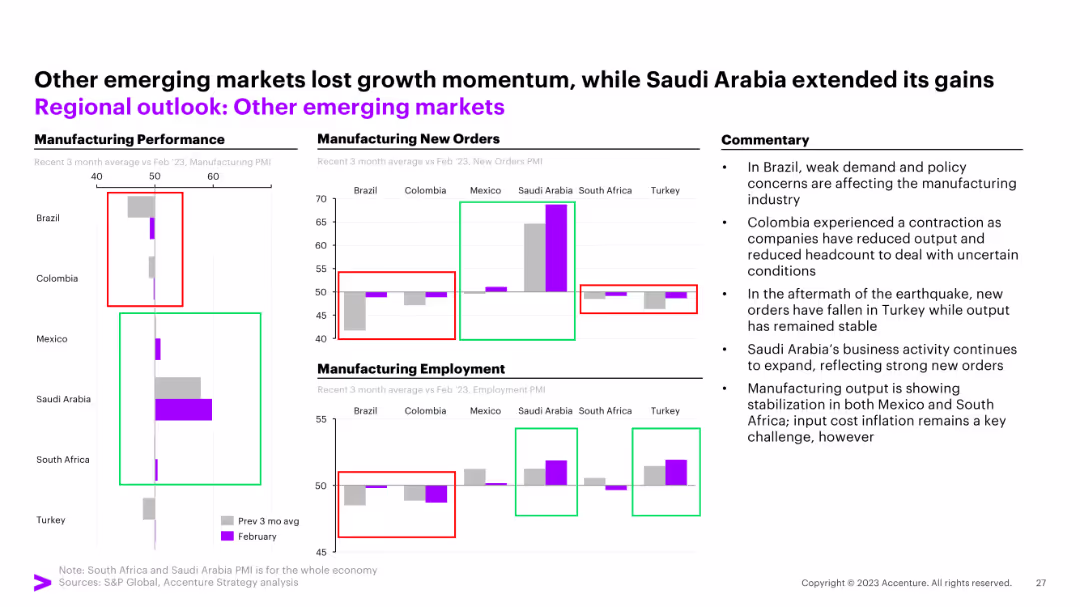
Combination of bar charts and column charts for manufacturing performance, new orders, and employment
Market Analysis and Trends
Financial Services
This slide focuses on other emerging markets, detailing manufacturing performance, new orders, and employment trends.
emerging markets, manufacturing performance, new orders, employment trends
false
Other emerging markets lost growth momentum, while Saudi Arabia extended its gainsMarch Macro Brief Financial fissures emerge
Multiple Chart
Accenture
View slide
Includes a textual section and a dot matrix chart that visually represents the level of agreement with statements regarding regulation and collaboration in AI. The design is clean, with green dots signifying the percentage agreement.
Regulatory and Compliance
Government & Public Sector
The slide highlights the desire for more government regulation and global collaboration on AI technologies. It presents data showing a significant majority of business leaders advocating for these measures to manage the unique risks of generative AI, raising concerns about leaving regulation solely to individual organizations.
AI, regulation, collaboration, government, leaders, risks, technology
false
Leaders are looking for more regulation and collaboration globally.Insights from the leading edge of generative AI adoption
Mixed Chart
Deloitte
View slide
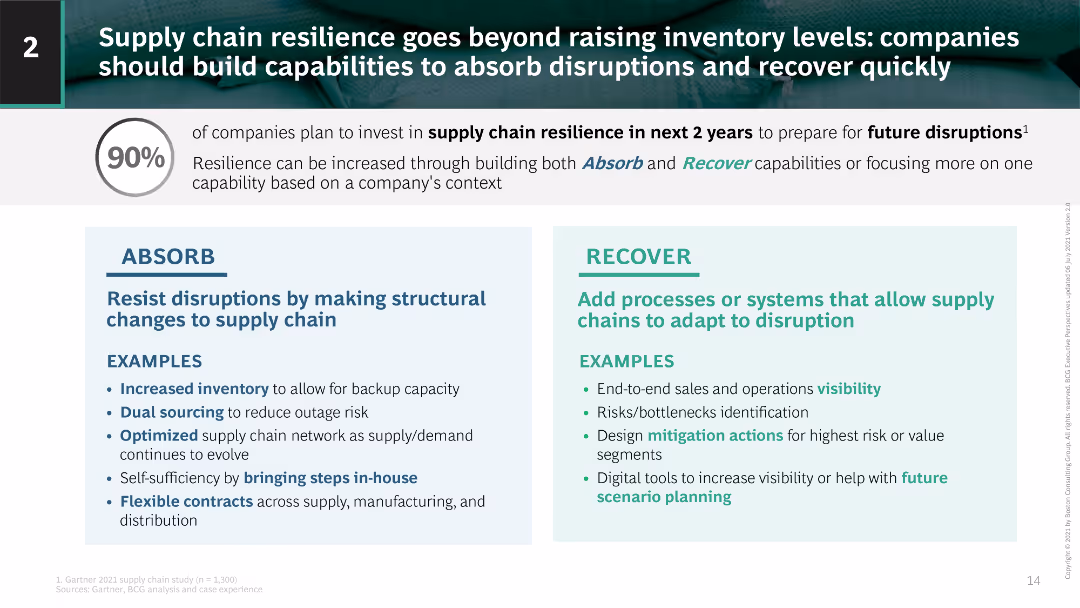
This slide has a dual-column layout with text explaining strategies to increase supply chain resilience. Left column focuses on absorbing disruptions, right column on recovery strategies.
Operational Efficiency
Industrial & Manufacturing
The slide outlines strategies for companies to build supply chain resilience, focusing on both structural changes and adaptive processes to handle future disruptions effectively.
supply chain, resilience, disruptions, recovery, strategies
false
Supply chain resilience goes beyond raising inventory levels: companies should build capabilities to absorb disruptions and recover quicklyAchieving Supply Chain Resilience in a Volatile World
Boxed
BCG
View slide
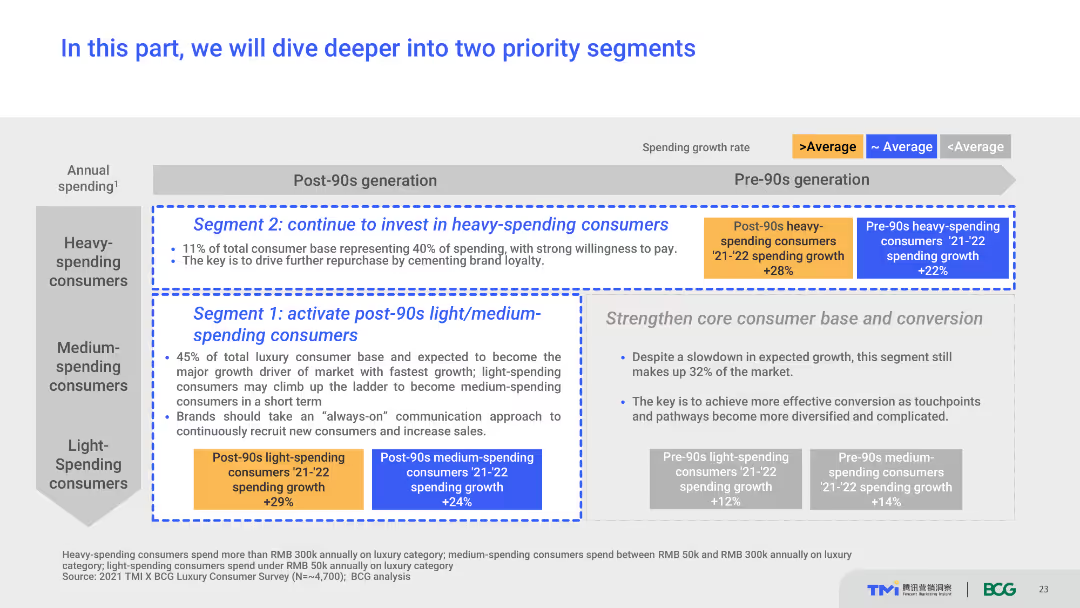
The slide serves as a section header, introducing detailed analysis of two priority consumer segments. It uses a simple layout with text boxes, segment titles, and growth rate indicators. The visual complexity is basic, focusing on text to transition into the next part of the presentation.
Strategic Planning
Consumer Goods
This slide introduces the focus on two priority segments: post-90s light/medium-spending consumers and heavy-spending consumers. It provides a brief overview of the segment characteristics and their significance for the market.
consumer segments, strategic planning, market focus, growth rates, priorities
false
Consumers expect to increase their spending more on Brand.com and WeChat Mini Program; WeChat Mini Program shoppers spend the mostA New Generation of Chinese Consumers Reshaping the Luxury Market
Table
BCG
View slide
Includes column charts and bar graphs detailing the growth and segmentation of SEA’s carbon market, highlighted with annotations for clarity.
Market Analysis and Trends
Environmental Services & Sustainability
Analyzes the growth trends of the voluntary carbon market in SEA, emphasizing forestry credits and future projections, useful for investors and policy makers in environmental sectors.
SEA, carbon market, growth, voluntary, forestry credits, projections, column charts, bar graphs, annotations, investment
false
SEA voluntary carbon markets are nascent but growing quicklySoutheast Asia’s Green Economy 2021 Report: Opportunities on the Road to Net Zero
Multiple Chart
Bain
1
...
Next
Load More
Hold On!
We are searching in our database
If nothing, comes up, please try different filters!
Create a FREE account to continue browsing
Receive Instant Access to 1,000+ slides from companies like McKinsey, Google, and Goldman Sachs
First Name
Last Name
Email
Password
I agree to all
Terms & Privacy Policy
Thank you! Your submission has been received!
Oops! Something went wrong while submitting the form.
Have an account?
Sign in
Column Chart
Heatmap
Chevron
Org Chart
Infographic
Callouts
Timeline
List
Graphic
Picture
Process Flow
Diagram
Paragraph
Map
Table
Framework
Subtitle
Takeaway Box
Icon
Other Chart
Radar Chart
Waterfall Chart
Mekko Chart
Pie Chart
Scatter Plot
Line Chart
Bar chart
Bullet points


![To fix [Country], we need a strong leader willing to break the rules](https://cdn.prod.website-files.com/654e70fb59937215cac87b19/6899be2f75b0eec59aa53bda__f1yGTLQcvEobAXZiFDH0F8j5QImR-J20KLBLYJml0E.avif)