My Account
My Slides
Search by Category
Templates
Leave Feedback
Login
Logout
Get Started
Browse all Slides
Browse all Slides
Create a FREE Account
Instant access to 1,000+ real slides from top companies like McKinsey, BCG, Goldman Sachs, Google and many more!
First Name
Last Name
Email
Password
I agree to all
Terms & Privacy Policy
Thank you! Your submission has been received!
Oops! Something went wrong while submitting the form.
Have an account?
Sign in
Instant access to the internet's best slides
Get access to 40+ advanced filters and more
Advanced Search and Filters
Access to
10,000+ slides
Access to Category Pages
Save/Bookmark Slides
PowerPoint Template Library (New)
Choose your plan
MONTHLY
$12/month
Billed every month, cancel anytime.
YEARLY
$9/month
Billed $108 annually, cancel anytime.
Checkout for $12/month
Checkout for $108/yr
Secured by Stripe | AES-256 bit encryption
📢 Ready to start building slides? Check out our new template library
view templates
Welcome,
Welcome
Upgrade to SlideStart
Pro
Instant access to 15,000+ slides
Show Featured Only
Checkbox 8
Companies
Mckinsey
Bain
BCG
EY
Deloitte
Accenture
PwC/Strategy&
JP Morgan
Goldman Sachs
Morgan Stanley
Citigroup
Deutsche Bank
Barclays
LEK
Kearney
Oliver Wyman
Booz Allen Hamilton
Gartner
IPSOS
Nielsen
Slide type
Header Horizontal
Framework
Vertical Flow
Single Chart
Single Chart
Text Only
Mixed Chart
Header Vertical
Graphic
Pillar
Multiple Chart
Agenda
Title
Table
Linear Flow
Upgrade to SlideStart
Pro
Instant access to 40+ advanced filters
Industry
Upgrade to SlideStart
Pro
Instant access to 40+ advanced filters
Technology
Healthcare
Financial Services
Consumer Goods
Energy & Utilities
Manufacturing
Retail
E-commerce
Logistics
Telecommunications
Real Estate
Professional Services
Education
Media
Entertainment
Hospitatlity
Tourism
Agriculture
Food Production
Government & Public Sector
Environmental
Sustainability
Use Case
Upgrade to SlideStart
Pro
Instant access to 40+ advanced filters
Sales and Business Development
Mergers and Acquisitions
Corporate Finance and Valuation
Performance Metrics and KPIs
Client Case Studies
Competitive Landscape
Product and Service Analysis
Customer and Market Segmentation
Organizational Structure
Human Resources and Talent Management
Industry Overview
Regulatory and Compliance
Risk Assessment and Management
Agriculture & Food Production
Hospitality and Tourism
Government
Environmental
Sustainability
Clear all
Thank you! Your submission has been received!
Oops! Something went wrong while submitting the form.
Show Featured Only
Checkbox 8
Companies
Mckinsey
Bain
BCG
EY
Deloitte
Accenture
PwC/Strategy&
JP Morgan
Goldman Sachs
Morgan Stanley
Citigroup
Deutsche Bank
Barclays
LEK
Kearney
Oliver Wyman
Booz Allen Hamilton
Gartner
IPSOS
Nielsen
Slide type
Text Only
Linear Flow
Vertical Flow
Single Chart
Header Horizontal
Mixed Chart
Header Vertical
Pillar
Multiple Chart
Graphic
Agenda
Title
Table
Framework
Industry
Technology
Healthcare
Financial Services
Consumer Goods
Energy & Utilities
Manufacturing
Retail
E-commerce
Logistics
Telecommunications
Real Estate
Professional Services
Education
Media
Entertainment
Hospitatlity
Tourism
Agriculture
Food Production
Government & Public Sector
Environmental
Sustainability
Use Case
Sales and Business Development
Mergers and Acquisitions
Corporate Finance and Valuation
Performance Metrics and KPIs
Client Case Studies
Competitive Landscape
Product and Service Analysis
Customer and Market Segmentation
Organizational Structure
Human Resources and Talent Management
Industry Overview
Regulatory and Compliance
Risk Assessment and Management
Agriculture & Food Production
Hospitality and Tourism
Government
Environmental
Sustainability
Clear all
Thank you! Your submission has been received!
Oops! Something went wrong while submitting the form.
Tag
View slide
A bar chart comparing PMI survey scores for manufacturing and services across different countries, and a line chart showing composite scores over time for various economies.
Market Analysis and Trends
Professional Services
This slide presents a snapshot of PMI survey results, indicating sluggish economic activity in most major economies by the end of 2023, with some improvement in China and the US showing resilience.
PMI, Economic Activity, Manufacturing, Services, Global
false
Most major economies closed out 2023 with sluggish activity momentum, though there was some notable improvement in China and the UK and continued resilience in the USJanuary Macro Brief Special edition: 2024 outlook and top 10 macro trends
Multiple Chart
Accenture
View slide
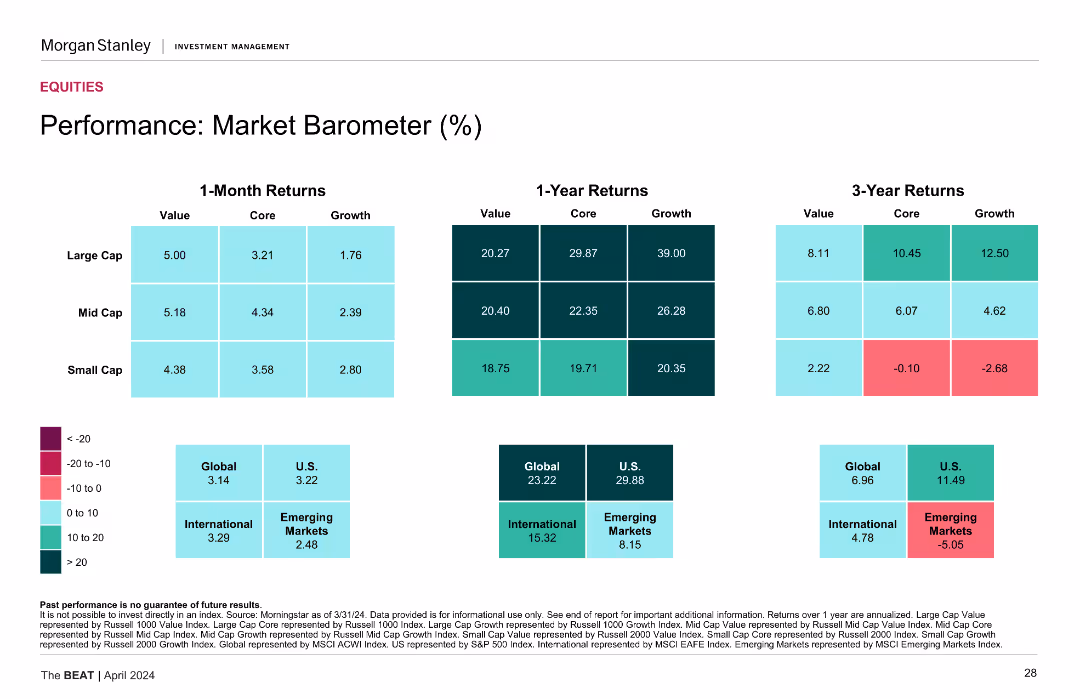
Heatmaps displaying returns by value, core, and growth for large, mid, and small cap stocks over different time periods.
Performance Metrics and KPIs
Financial Services
Measures market performance, showing returns over 1-month, 1-year, and 3-year periods for various stock categories.
Market Performance, Stock Returns, Value Stocks, Growth Stocks, Financial Metrics
false
Performance: Market Barometer (%) Large Cap 5.00 3.21 1.76The BEAT April 2024
Table
Morgan Stanley
View slide
Slide includes a combination of imagery and column icons, presenting investment data and trends.
Investment Analysis
Agriculture & Food Production
Analyzes recent investment trends in the FoodTech sector, discussing shifts in focus and investment distribution.
Investment, FoodTech, trends, growth, sustainability
false
European FoodTechThe Swiss FoodTech Ecosystem 2021
Header Vertical
Accenture
View slide
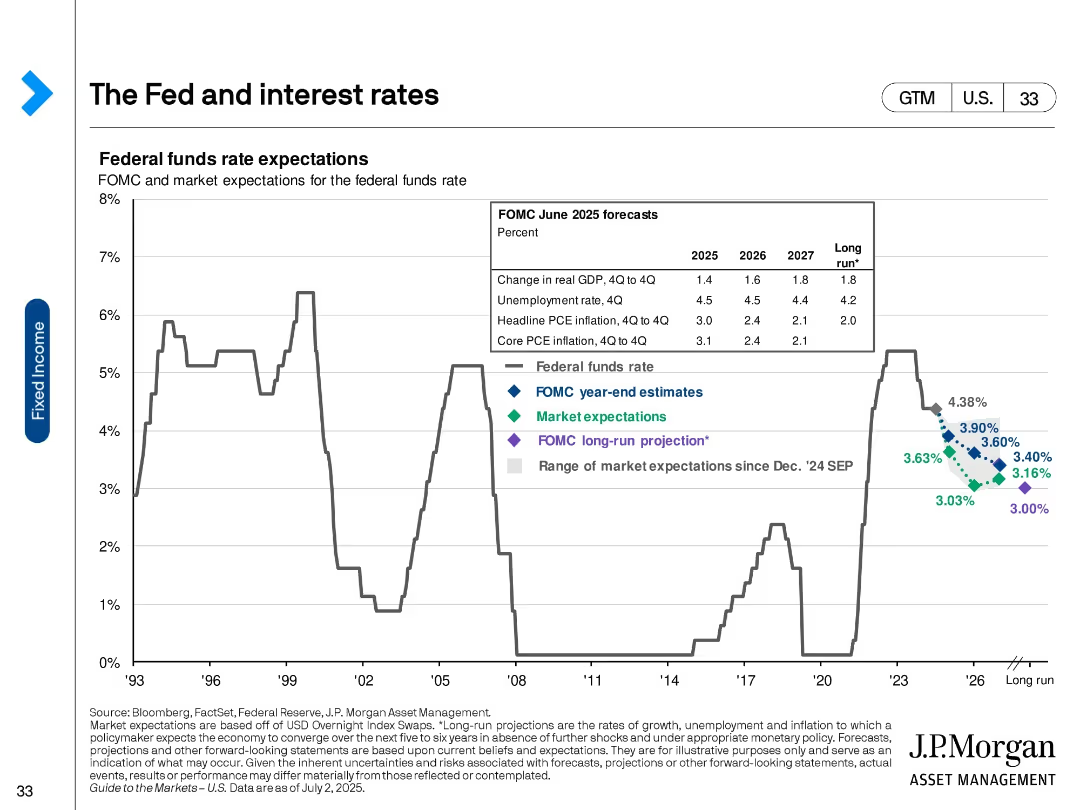
Historical line chart of the federal funds rate with forecasted paths and projections from the FOMC and markets; inset with macroeconomic forecasts.
Investment Analysis
Financial Services
The slide outlines past and expected future federal funds rates, including FOMC year-end estimates, market expectations, and long-run projections. It includes accompanying forecasts for inflation, unemployment, and GDP growth.
Fed funds rate, inflation, GDP forecast, interest rate policy, FOMC, projections
false
The Fed and interest ratesGuide to the Markets U.S. 3Q 2025
Single Chart
JP Morgan
View slide
Slide includes multiple column charts and bullet points comparing various financial metrics like revenue CAGR, CIR development, RoTE development, and CET1 ratio across different quarters.
Performance Metrics and KPIs
Financial Services
This slide presents key performance indicators for a bank, highlighting trends in revenue, costs, returns on equity, and capital ratios, essential for financial analysis and strategic planning.
Revenue, CIR, RoTE, CET1, financial analysis
false
Key performance indicators In % Revenue CAGR1 Q1 2023 LTM vs FY 2021Q1 2023 results
Multiple Chart
Deutsche Bank
View slide
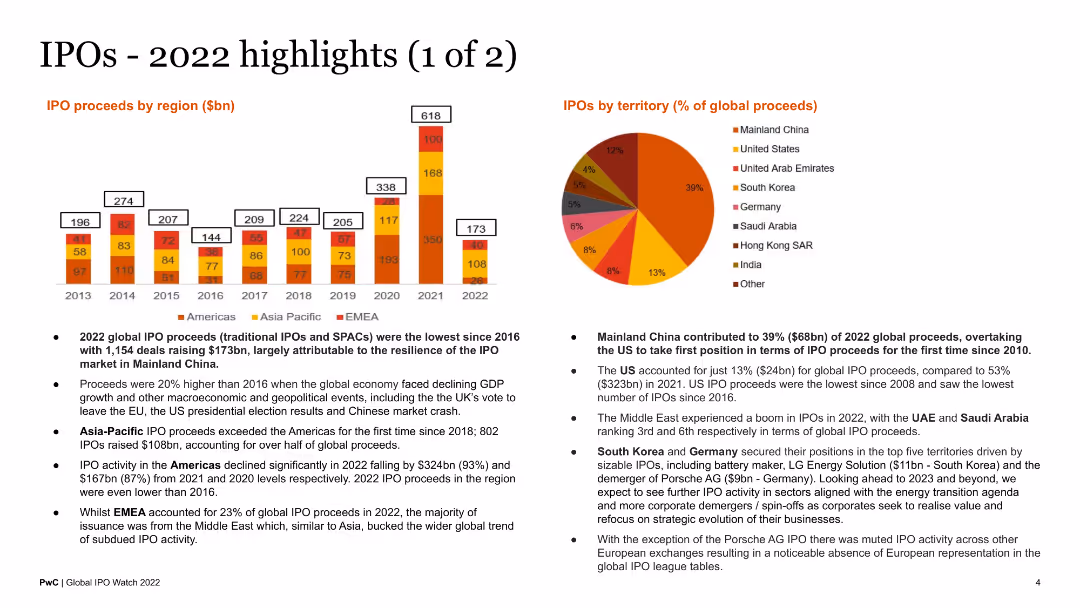
The slide showcases a column chart of IPO proceeds by region from 2013 to 2022 and a pie chart of IPO proceeds by territory for 2022. It is visually dense with a mix of charts and bullet points summarizing the highlights.
Market Analysis and Trends
Financial Services
This slide highlights key data points and trends in global IPO activity for 2022, breaking down proceeds by region and territory. It serves as an informative summary for investors and financial professionals.
IPO highlights, global proceeds, 2022, regional analysis, territory
false
IPOs - 2022 highlights (1 of 2)Global IPO Watch 2022
Multiple Chart
PwC/Strategy&
View slide
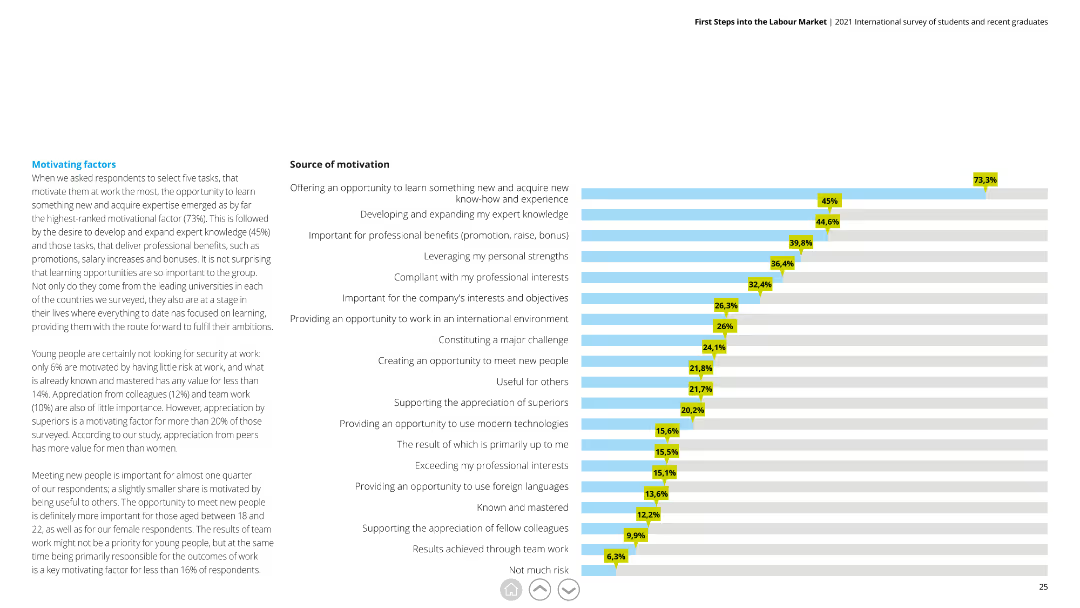
Horizontal bar chart depicting different motivating factors with percentages, alongside detailed text explaining the significance of each factor.
Human Resources and Talent Management
Education & Training
This slide highlights key factors that motivate young professionals, emphasizing learning opportunities, professional development, and appreciation from peers.
motivation, learning, professional development, appreciation, young professionals
false
Motivating factors When we asked respondents to select five tasks, that motivate them at work the most,First Steps into the Labour Market 2021 International survey of students and recent graduates
Mixed Chart
Deloitte
View slide
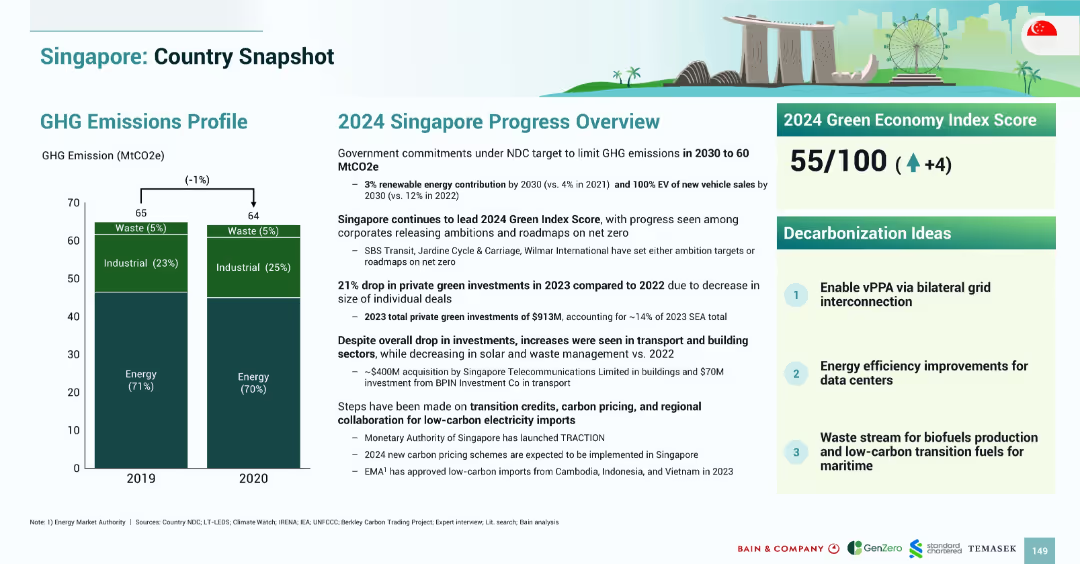
Bar chart on left showing GHG trends; progress summary on right includes text blocks, Green Index Score, and decarbonization ideas in numbered blocks.
Strategic Planning
Government & Public Sector
Singapore aims to cut emissions to 60 MtCO2e by 2030. It leads SEA in Green Index Score (55/100). 2023 saw a drop in private green investments, but building and transport sectors saw gains. Key strategies include vPPA, data center efficiency, and waste-to-fuel transitions.
Singapore, emissions, decarbonization, energy, transport, data centers, vPPA, 2024
false
Singapore: Country SnapshotSOUTHEAST ASIA’S GREEN ECONOMY 2024
Mixed Chart
Bain
View slide
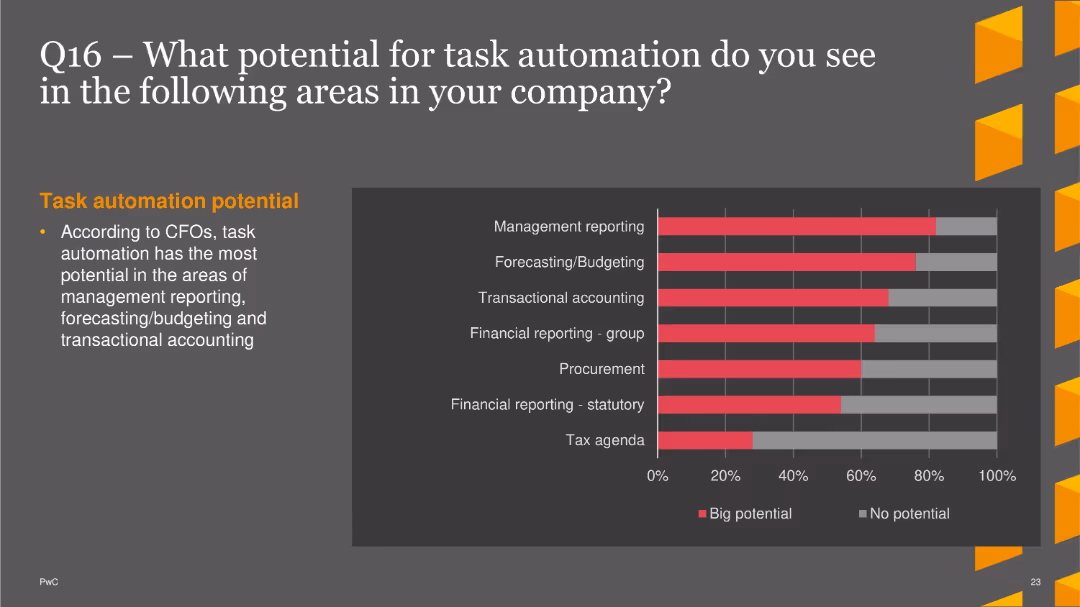
The slide displays a column chart indicating the potential for task automation in various company areas. Areas include management reporting, forecasting/budgeting, transactional accounting, financial reporting (group and statutory), procurement, and tax agenda. The potential is categorized as big potential (red) and no potential (gray). A short text section on the left side explains task automation potential according to CFOs.
Operational Efficiency
Financial Services
This slide shows survey data on the perceived potential for task automation in different company functions, with management reporting and forecasting/budgeting identified as areas with the highest potential. It provides insights for companies looking to enhance operational efficiency through automation.
task automation, management reporting, forecasting, transactional accounting, finance
false
Q16 – What potential for task automation do you see in the following areas in your company?PwC CFO Insights Survey 2022
Single Chart
PwC/Strategy&
View slide
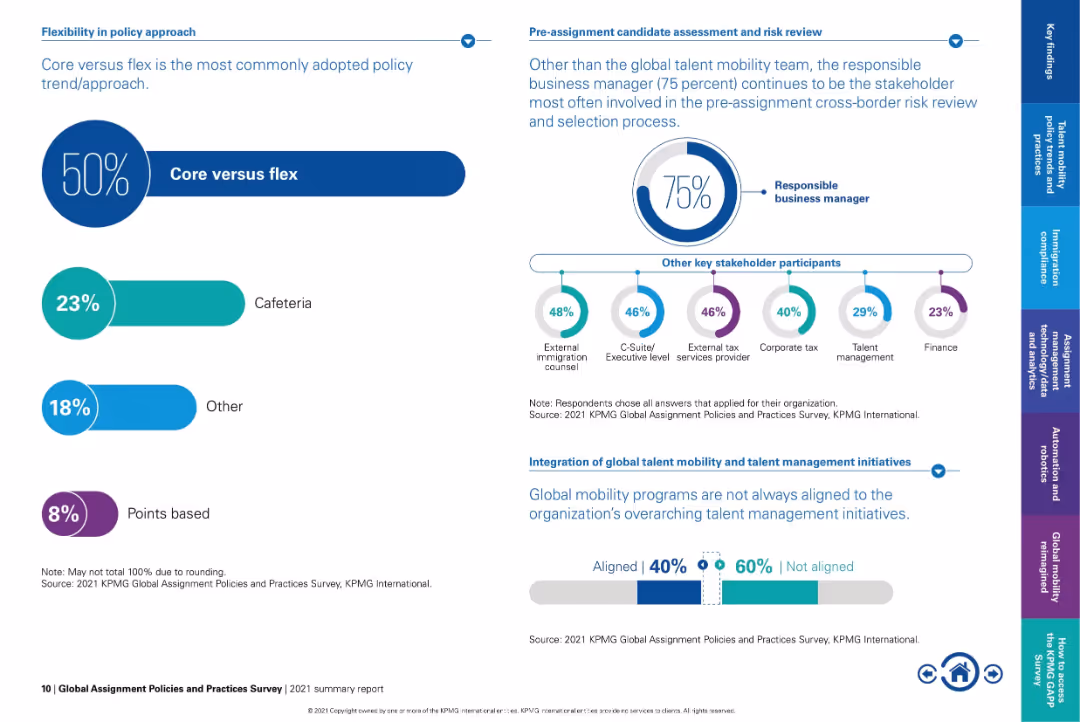
Dual-panel layout: left side uses percentage bars, right side uses circular infographic and icon chart.
Organizational Structure and Change
Professional Services
Highlights the growing preference for the "core versus flex" approach in mobility policy, with 50% of organizations adopting it. Also shows stakeholder involvement in risk review and notes the lack of integration between mobility and talent management initiatives.
core vs flex, stakeholder roles, mobility policy, risk review, talent alignment, global mobility strategy, executive involvement
false
Flexibility in policy approachGlobal Assignment Policies and Practices Survey
Multiple Chart
KPMG
View slide
Slide displays two line graphs comparing S&P 500 returns with dividend inclusion and equity index returns versus volatility.
Investment Analysis
Financial Services
Provides strategies for outperforming the broad market by focusing on consistent dividend growth and stock selection within growing industries.
dividend growth, stock selection, S&P 500, market outperformance, investment strategies
false
How to potentially outperform broad markets…Citi Global Wealth Investments OUTLOOK 2022
Multiple Chart
Citigroup
View slide
Six icons representing megatrends from 1 to 6, each with a brief description and keywords below: People & Society, Health & Care, Environment & Resources, Economics & Business, Technology & Innovation, Politics & Governance.
Strategic Planning
Financial Services
The slide outlines six major trends that will shape global development until 2050, covering areas such as society, health, environment, economy, technology, and politics. It highlights the importance of these trends for strategic planning and long-term forecasting in various industries.
Megatrends, 2050, Strategic Planning
false
… and covers six megatrends that shape the future development of our world until 2050Megatrend 5 - Technology & Innovation
Pillar
Roland Berger
View slide
The slide features a circular diagram representing Booz Allen's ESG governance structure, including roles of the Board of Directors, ESG Committee, ESG Council, and ESG Team.
Regulatory and Compliance
Professional Services
This slide explains Booz Allen's ESG governance, detailing the roles and responsibilities of the Board of Directors, ESG Committee, ESG Council, and ESG Team in managing ESG topics.
Booz Allen, ESG governance, ESG Committee, Board of Directors, compliance
false
MANAGING ESG TOPICS Our formal ESG governance includes oversight by our Board of Directors and the executive management-level ESG Committee, operational responsibility by the ESG Council, and enterprise-wide strategic direction by a dedicated team within the Office of the Corporate Secretary.2023 ENVIRONMENTAL, SOCIAL, GOVERNANCE REPORT
Diagram
Booz Allen Hamilton
View slide
Features a column chart depicting growth dynamics from 2001 to 2030, with annotations on key events impacting the automotive industry. Text discusses coping with thinner margins and financial health of suppliers.
Financial Performance
Transportation & Logistics
Discusses the financial challenges faced by automotive suppliers, including reduced margins and increased costs. Emphasizes the need for new skills and transformation to new powertrains to maintain profitability.
Financial Health, Margins, Automotive, Growth, Industry
false
Automotive suppliers' financial health Coping with structurally thinner marginsGlobal Automotive Supplier Study 2023
Mixed Chart
Roland Berger
View slide
Slide with number 2, a large column chart comparing the percentage of unbanked adults in various countries, with text annotations for additional context.
Market Analysis and Trends
Financial Services
Highlighting financial inclusion issues, this slide compares the proportion of adults without bank accounts in SEA countries to the global average. It focuses on Vietnam, Philippines, and Indonesia, signaling market challenges and opportunities in financial services.
unbanked, SEA, financial inclusion, Vietnam, Philippines, Indonesia, adult population
false
>150m adults 25+ in SEA are unbanked, with >100m existing in Vietnam, Philippines, and Indonesiae-Conomy SEA Unlocking the $200 billion digital opportunity in Southeast Asia
Single Chart
Bain
View slide
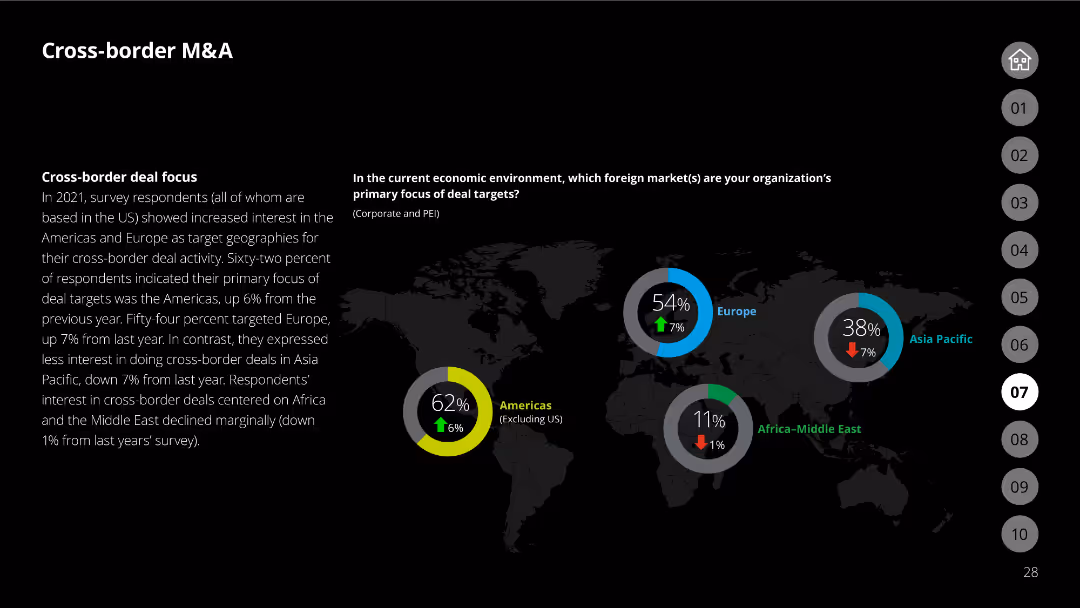
The slide includes a world map indicating the primary focus of deal targets in various regions, with percentages showing the focus in the Americas, Europe, Asia Pacific, and Africa-Middle East.
Mergers and Acquisitions
Financial Services
Discusses the regional focus of cross-border M&A activities, highlighting survey results on which foreign markets organizations are targeting most for their deals.
cross-border M&A, regional focus, foreign markets, survey results, deal targets
false
Cross-border deal focusThe future of M&A 2022 M&A Trends Survey
Multiple Chart
Deloitte
View slide
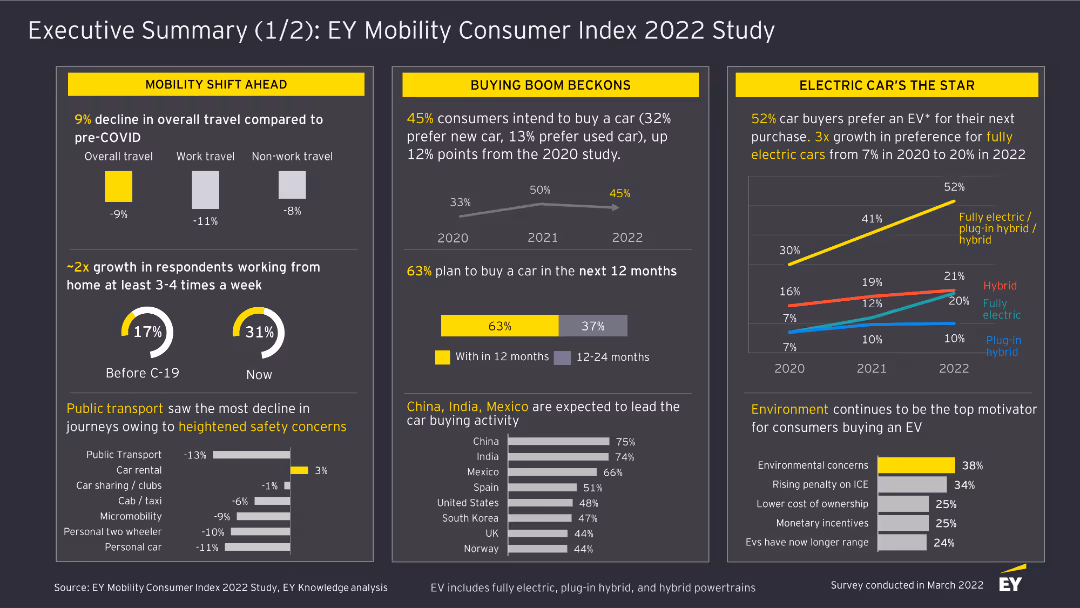
This slide includes column charts and textual highlights. It covers the shift in mobility trends, car buying intentions, and the rise of electric vehicles based on survey responses.
Market Analysis and Trends
Transportation & Logistics
The slide provides a summary of mobility trends, including changes in travel behavior, car buying intentions, and the increasing preference for electric vehicles among consumers in the EY Mobility Consumer Index 2022 Study.
Mobility, Consumer Trends, Electric Vehicles, Survey, Transportation, 2022, Car Buying, Market Analysis, Travel Behavior
false
Executive Summary (1/2): EY Mobility Consumer Index 2022 StudyEY Mobility Consumer Index (MCI) 2022 study
Multiple Chart
EY
View slide
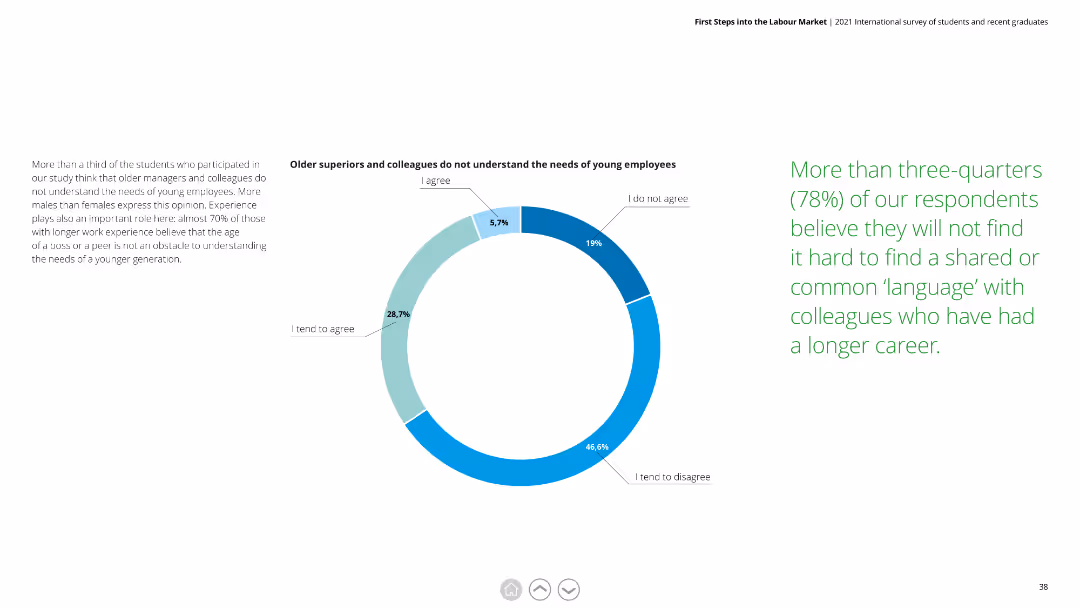
This slide features a pie chart with blue and green segments. Text is divided into three columns, explaining the findings. There is minimal graphical clutter, making the data easy to interpret.
Human Resources and Talent Management
Professional Services
Analyzes the perception that older managers do not understand the needs of young employees. Highlights gender differences and the importance of experience.
young employees, older managers, needs, perception, gender differences, experience
false
Older superiors and colleagues do not understand the needs of young employeesFirst Steps into the Labour Market 2021 International survey of students and recent graduates
Mixed Chart
Deloitte
View slide
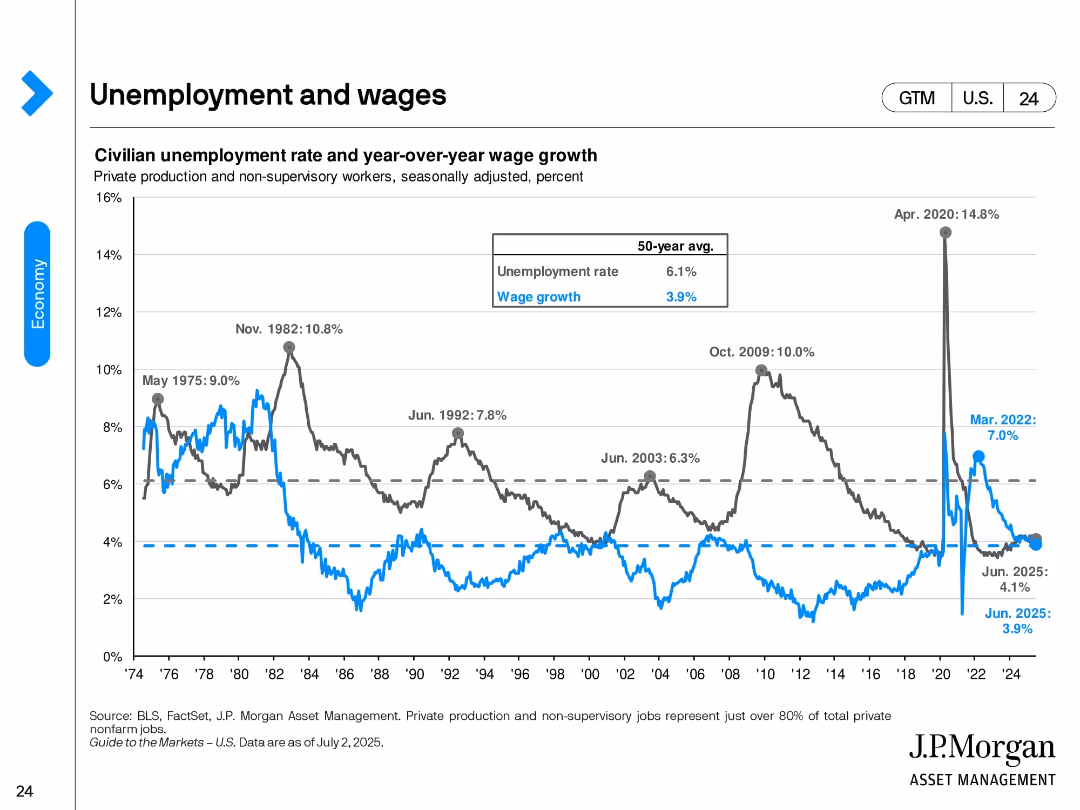
Dual-axis line chart tracking unemployment rate and wage growth since 1974. Historical peaks and the 50-year average are annotated. The chart ends in June 2025, showing recent trends stabilizing.
Performance Metrics and KPIs
Financial Services
This slide contrasts the historical and recent dynamics of unemployment and wage growth. It highlights key peaks like the 2020 COVID spike and notes June 2025 values: 4.1% unemployment and 3.9% wage growth, near long-term averages.
unemployment, wage growth, labor market, historical trends, 2025, recession indicators, labor cost
false
Unemployment and wagesGuide to the Markets U.S. 3Q 2025
Single Chart
JP Morgan
View slide
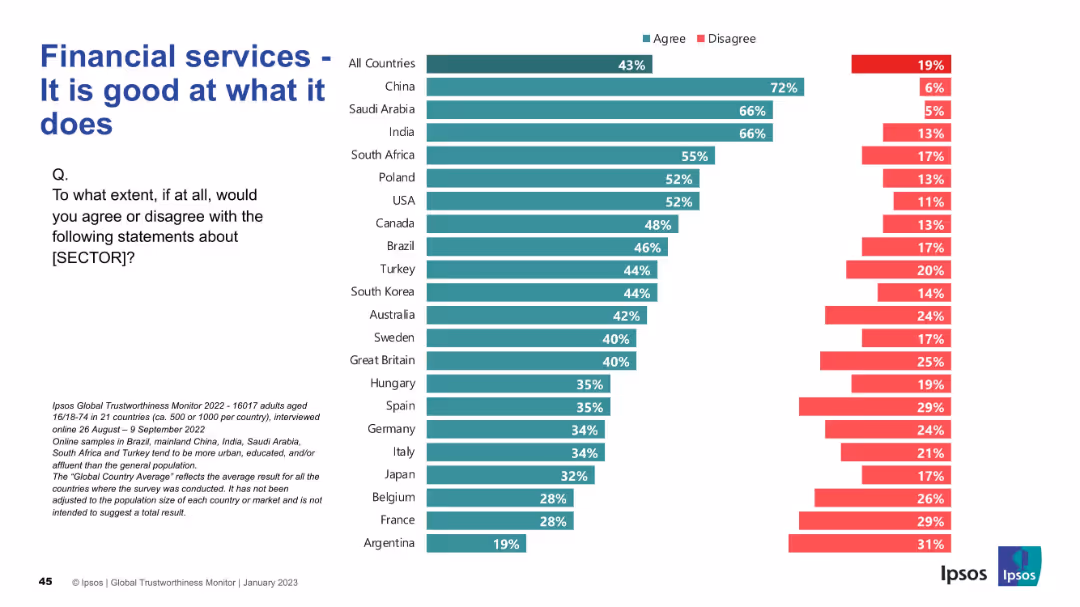
Bar chart split by "Agree" and "Disagree" responses by country; simple layout with clean segmentation
Strategic Planning
Financial Services
This slide presents a global perception of the financial services sector’s competence. China, India, and Saudi Arabia have high agreement (66–72%), indicating strong regional trust. The average global agreement is 43%.
financial services, competence, trust, international, agreement, Ipsos, bar chart, perception, countries
false
Financial services - It is good at what it doesIPSOS GLOBAL TRUSTWORTHINESS MONITOR January 2023
Mixed Chart
IPSOS
View slide
Split layout with text on the left and pie charts on the right showing various factors influencing healthcare choices by consumers.
Market Analysis and Trends
Healthcare & Pharmaceuticals
Describes the evolving preferences of consumers across different ages, emphasizing the importance of convenience and affordability in medical care decisions.
preferences, healthcare, transformation, convenience, choices
false
EVOLVING PREFERENCES ACROSS ALL AGES SHOW A NEED FOR TRANSFORMATIONTODAY'S CONSUMERS REVEAL THE FUTURE OF HEALTHCARE
Multiple Chart
Accenture
View slide
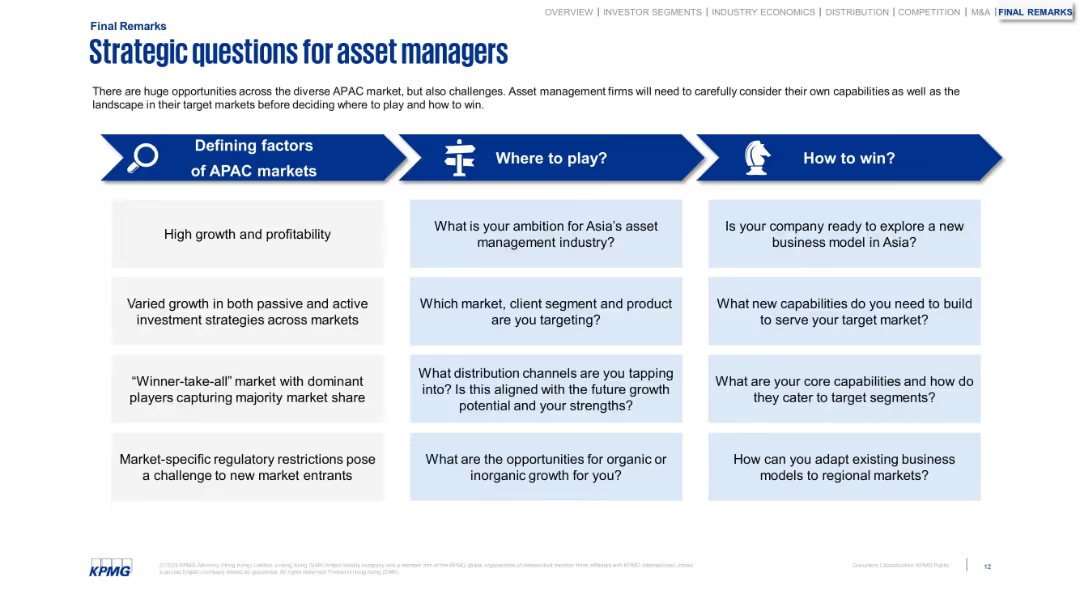
Three-column horizontal layout with categorized questions under: Defining factors, Where to play?, and How to win? Blue and white color scheme with icons for each category.
Strategic Planning
Financial Services
This slide presents strategic considerations for asset managers exploring the APAC market. It breaks down market dynamics and internal capability questions to help firms define entry and success strategies, considering regulation, client targeting, and competitive edge.
strategy, APAC, asset management, market entry, business model, capabilities, targeting, growth, regulation
false
Strategic questions for asset managersGrowing in a Turbulent World
Table
KPMG
View slide
Includes several line graphs showing predicted infection paths under different immunity and infection rate scenarios, annotated for clarity and comparison.
Strategic Planning
Healthcare & Pharmaceuticals
Analyzes potential COVID-19 infection trajectories for Austria under various public health response scenarios, aiding in policy decision-making and strategy adjustment.
COVID-19, Austria, scenario analysis, infection rates, public health response, policy planning
false
Paths diverge materially in shape and infection rates (based on current parameter settings)Covid 19: Briefing Materials
Multiple Chart
McKinsey
View slide
An image showing a diamond-shaped diagram with four core areas of Goldman Sachs, flanked by a sidebar detailing a partnership with Spotify, illustrating a case study approach.
Strategic Planning
Financial Services
This slide represents the integrated approach of Goldman Sachs, displaying its main operational divisions and highlighting a collaboration with Spotify. It details the multifaceted partnership encompassing investment, advisory, and wealth management, thus exemplifying the strategic relationships and comprehensive services the firm offers to its clients.
Integration, Operational Divisions, Spotify, Case Study, Investment, Advisory, Wealth Management
false
Deliver the Firm: One Goldman SachsGoldman Sachs Investor Day
Text Only
Goldman Sachs
View slide
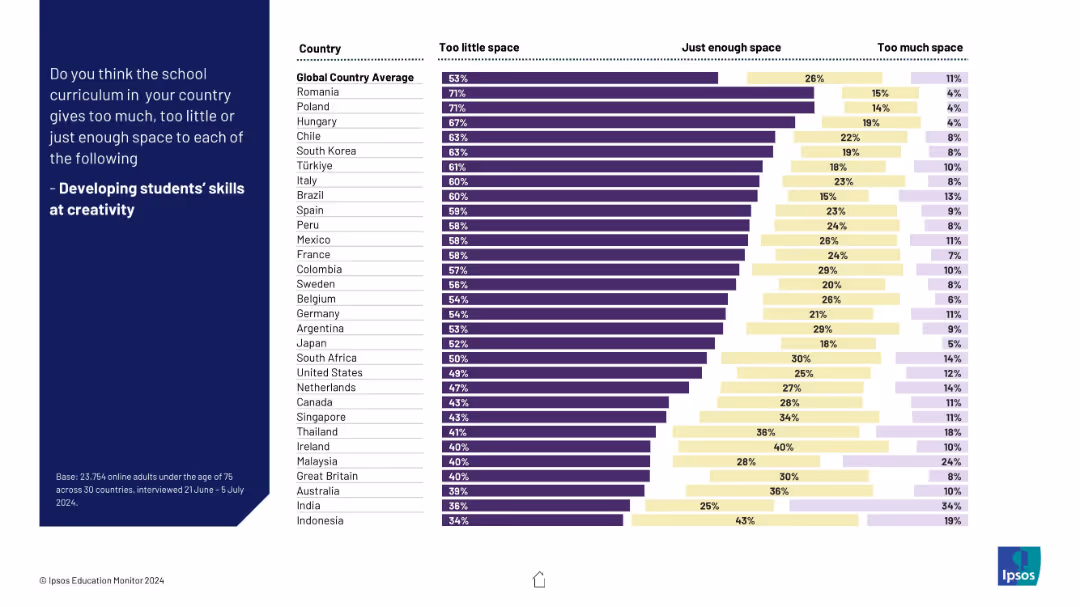
Consistent bar chart layout with responses per country; visualizes views on curriculum space for creativity; organized into three sections.
Human Resources and Talent Management
Education & Training
This slide investigates how well schools promote creativity. Respondents in many countries believe creativity receives too little attention, with Romania and Poland showing the strongest concern.
creativity, student skills, curriculum, innovation, global education, survey data, learning gaps
false
Developing students’ skills at creativityIPSOS EDUCATION MONITOR 2024
Mixed Chart
IPSOS
View slide
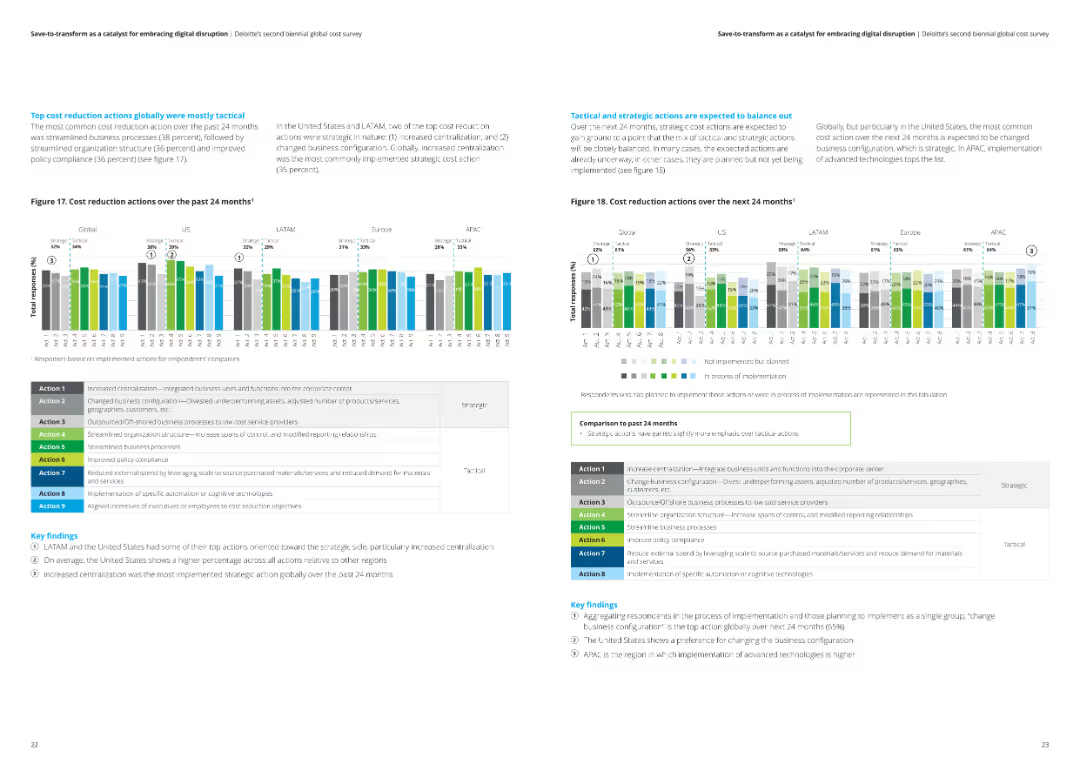
The slide features two column charts showing cost reduction actions over the past and next 24 months across different regions. Key findings are included in text boxes.
Operational Efficiency
Financial Services
The slide details tactical and strategic cost reduction actions taken in various regions over the past 24 months and projected for the next 24 months.
Cost reduction, tactical actions, strategic actions, analysis, financial services
false
Top cost reduction actions globally were mostly tactical The most common cost reduction action over the past 24 months was streamlined business processes (38 percent),Save-to-transform as a catalyst for embracing digital disruption Deloitte’s second biennial global cost survey
Multiple Chart
Deloitte
View slide
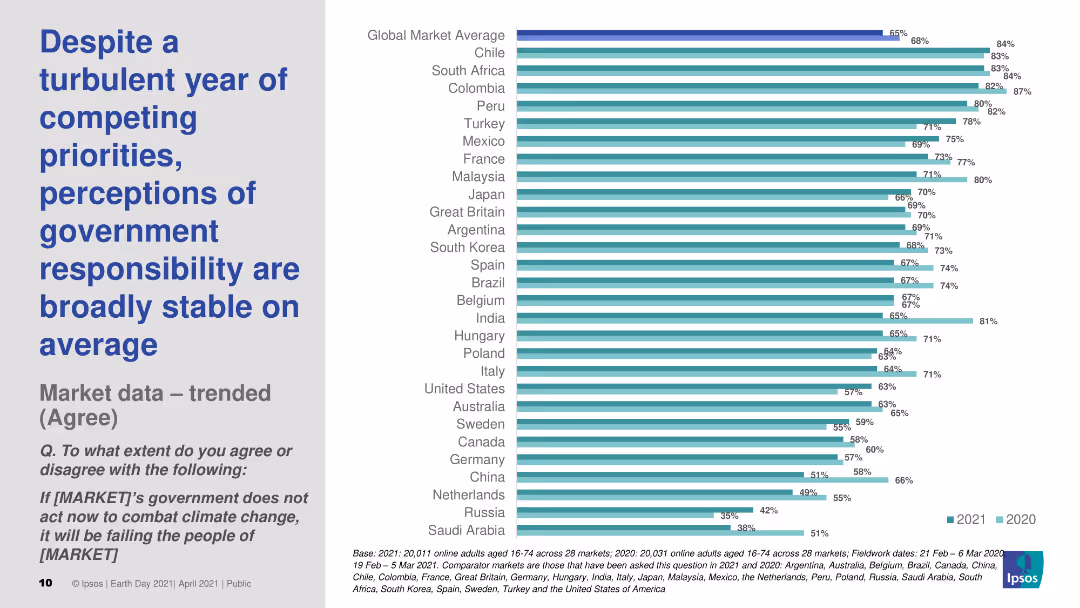
Contains a horizontal bar chart displaying the stability of public perceptions of government responsibility for climate action across multiple markets in 2020 and 2021.
Market Analysis and Trends
Government & Public Sector
Analyzes the stability of public perceptions of government responsibility for climate action despite competing priorities and a turbulent year.
climate action, government, public perception, stability, trends
false
Despite a turbulent year of competing priorities, perceptions of government responsibility are broadly stable on averageEARTH DAY 2021 GLOBAL ADVISOR https://www.ipsos.com/en/earth-day-2021-globally-people-wonder-whats-plan-tackle-climate-change Public opinion and action on climate change
Mixed Chart
IPSOS
View slide
Displays characteristics of blockchain like decentralization and encryption, using icons and short text blocks arranged around a central circular graphic that symbolically represents a blockchain network.
Technology and Digital Transformation
Technology & Software
Highlights the essential attributes of blockchain technology, including security, flexibility, and its decentralized nature. Suitable for discussions on how blockchain can be integrated into various business or technology solutions.
blockchain, decentralization, encryption, data security, flexibility
false
A blockchain is....Blockchain and Digital Assets
Diagram
McKinsey
View slide
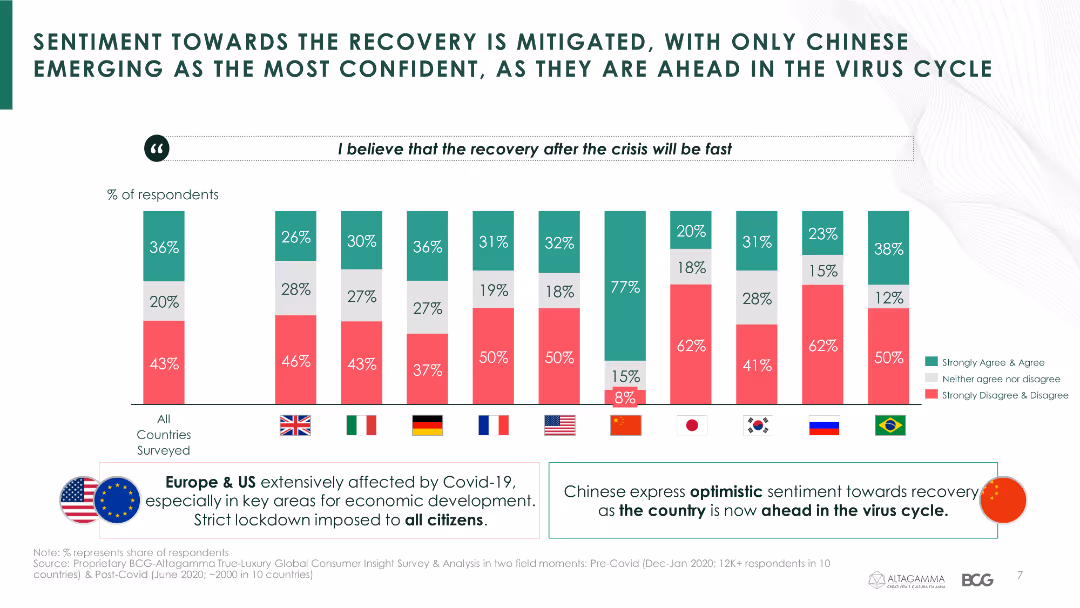
The slide contains a column chart comparing sentiment towards recovery after the crisis across different countries, with a focus on Chinese confidence levels.
Market Analysis and Trends
Consumer Goods
It discusses the differing levels of confidence in economic recovery among luxury consumers in various countries, emphasizing China's optimistic outlook.
sentiment, recovery, confidence, luxury consumers, economic impact, COVID-19, country comparison
false
SENTIMENT TOWARDS THE RECOVERY IS MITIGATED, WITH ONLY CHINESE EMERGING AS THE MOST CONFIDENT, AS THEY ARE AHEAD IN THE VIRUS CYCLETrue-Luxury Global Consumer Insights 7th Edition
Mixed Chart
BCG
View slide
Column chart showing GMV growth of the Farfetch platform from 2015 to 2018 with CAGR.
Financial Performance
Retail & E-commerce
Depicts the rapid growth of the Farfetch platform in comparison to the online luxury market, emphasizing a 55% CAGR.
Farfetch, GMV, luxury market, growth, CAGR
false
Farfetch Platform Growing 2x as Fast as the Online Luxury MarketDeutsche Bank Media, Internet & Telecom Conference
Single Chart
Deutsche Bank
View slide
Slide includes an area chart showing marketing budget allocation over time with a prediction for the future. Title and data points are clearly labeled.
Market Analysis and Trends
Professional Services
This slide analyzes marketing budget trends targeting China, illustrating past allocations and future predictions, useful for strategy planning in technology and financial sectors.
marketing, budget, China, prediction, technology, financial, trend, strategy, allocation, planning
false
Marketing spend targeting China expected to double over the next three years, but nowhere near pre-pandemic predictionsThe CMO Survey The Highlights and Insights Report February 2022
Mixed Chart
Deloitte
View slide
Features a title at the top, two bar graphs in the center comparing consumer habits, and a quote on the right side.
Market Analysis and Trends
Retail & E-commerce
Highlights increasing consumer preference for local products and brands during the pandemic, backed by quantitative data and a personal quote.
consumer trends, local brands, shopping habits, data analysis, pandemic impact, testimonial
false
Demand for local goods—and local brands—is growingHow is COVID-19 changing the retail consumer?
Multiple Chart
Accenture
View slide
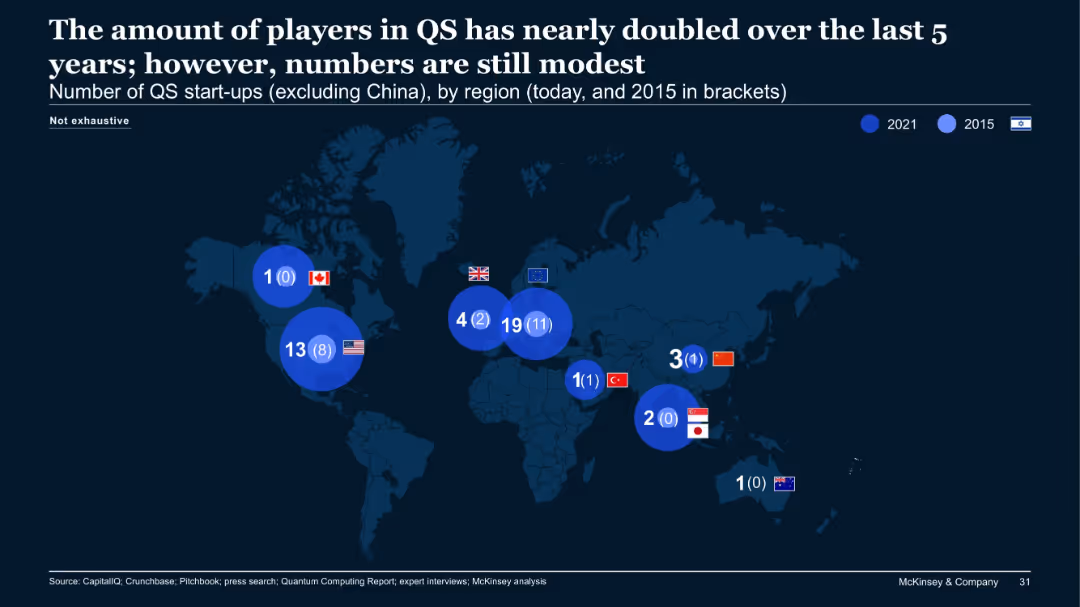
World map illustrating QS (quantum sensing) start-ups per region in 2021 and 2015, excluding China.
Market Analysis and Trends
Technology & Software
The number of quantum sensing (QS) start-ups has almost doubled over five years, though the overall volume remains modest. The EU leads with 19 in 2021 (up from 11), followed by the US. The map emphasizes regional differences and emerging interest in QS.
QS, quantum sensing, start-ups, growth, global, EU, map
false
The amount of players in QS has nearly doubled over the last 5 years; however, numbers are still modestThe Quantum Technology Monitor September 2021
Single Chart
McKinsey
View slide
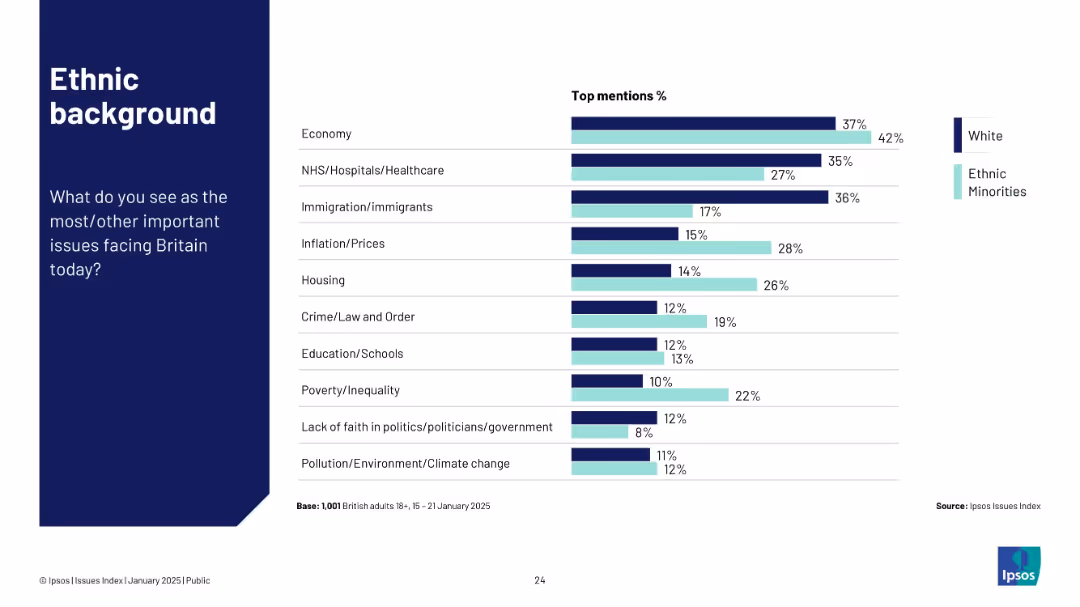
Horizontal bar chart comparing White and Ethnic Minority groups on top national issues.
Customer and Market Segmentation
Government & Public Sector
This slide compares ethnic backgrounds on top concerns in the UK. Ethnic minorities place higher emphasis on housing, inflation, and crime than White respondents. Economy remains a key issue across both groups.
ethnicity, public opinion, inflation, housing, crime, Ipsos
false
Ethnic backgroundIpsos Issues Index January 2025
Mixed Chart
IPSOS
View slide
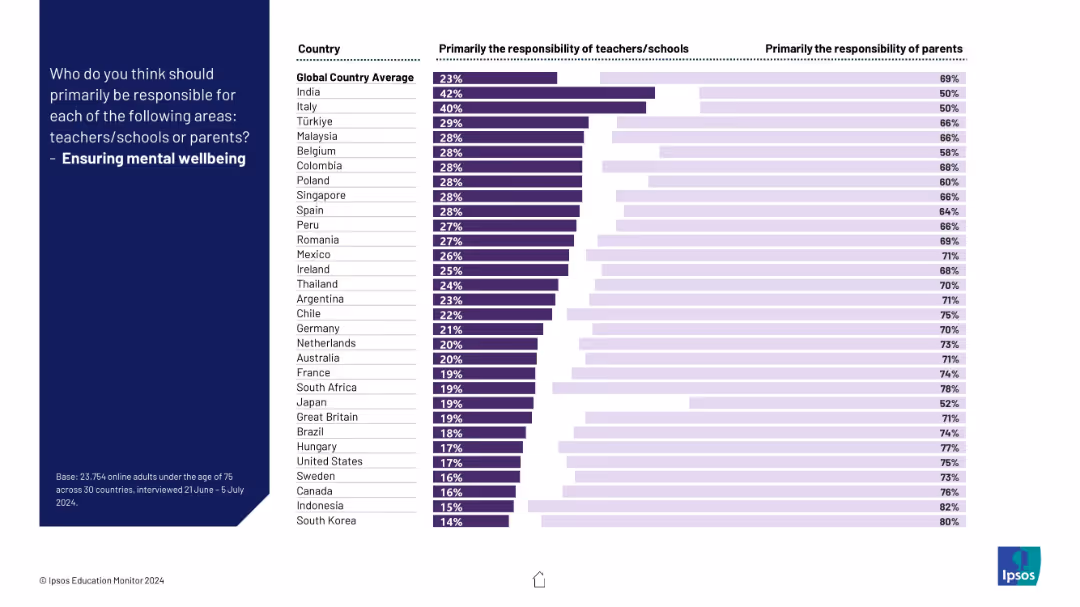
Chart showing a strong parental skew in responsibility for children's mental wellbeing across most countries; dark and light bars contrast responses.
Risk Assessment and Management
Healthcare & Pharmaceuticals
This slide reports global attitudes on mental wellbeing responsibility. Parents are overwhelmingly considered primary caretakers, with schools playing a lesser role.
mental health, wellbeing, responsibility, parents, education, children, support, global survey, Ipsos, emotional health
false
Ensuring mental wellbeingIPSOS EDUCATION MONITOR 2024
Mixed Chart
IPSOS
View slide
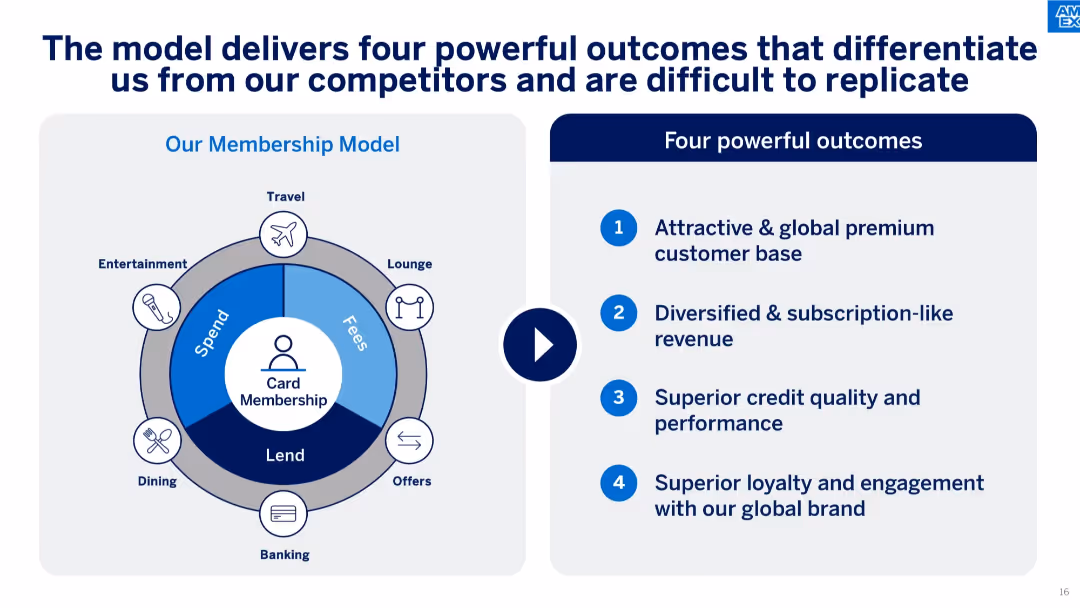
Split layout with a circular membership model diagram on the left and four listed outcomes on the right. Blue tones, icons, and structured text.
Strategic Planning
Financial Services
Highlights how the company's membership model delivers four distinct competitive advantages: a premium customer base, subscription-like revenue, strong credit quality, and brand loyalty. Visual emphasizes ecosystem of services contributing to this model.
membership model, brand loyalty, subscription revenue, premium customers, competitive advantage, financial model, ecosystem, spend, fees, lending, card membership
false
The model delivers four powerful outcomes that differentiate us from our competitors and are difficult to replicateAmerican Express Investor Day 2024
Boxed
McKinsey
View slide
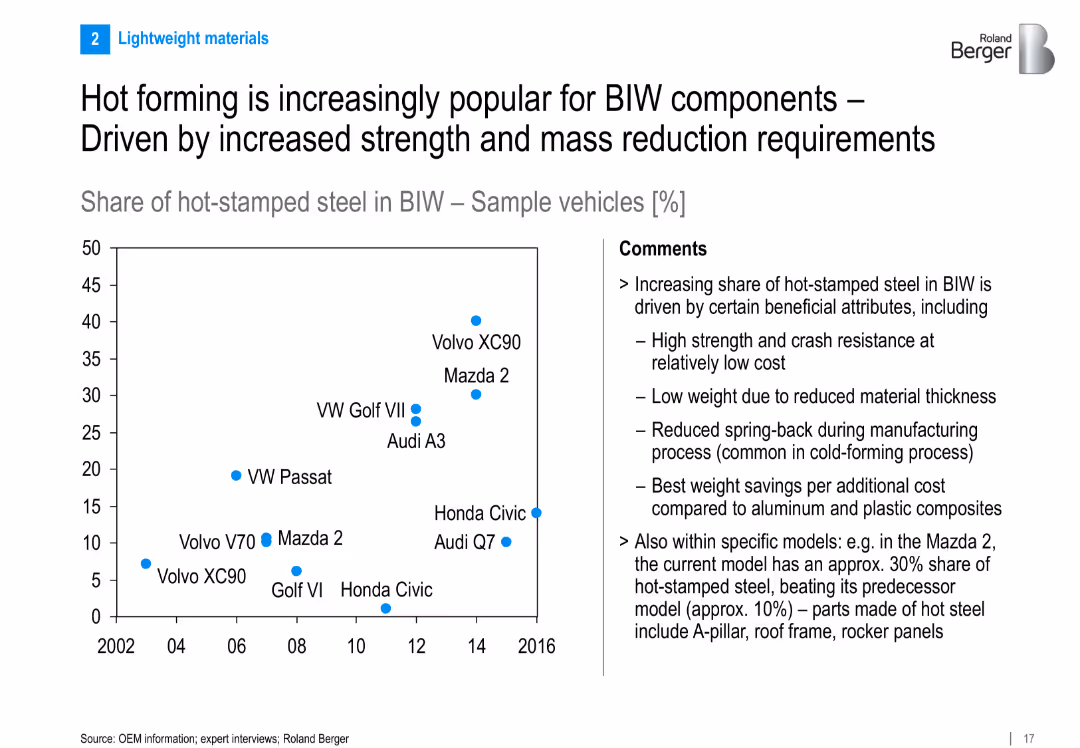
Left side: scatter plot showing hot-stamped steel share in BIW across vehicles and years; right side: comments explaining benefits; clean layout with a focus on data
Market Analysis and Trends
Industrial & Manufacturing
Shows the rising adoption of hot-stamped steel in Body-in-White (BIW) components. Benefits include strength, reduced weight, and low cost. Includes example models like Mazda 2 and Audi Q7 with increasing hot-stamp usage.
hot forming, BIW, hot-stamped steel, vehicle weight, OEMs, trend, body structure, strength, mass reduction
false
Hot forming is increasingly popular for BIW components – Driven by increased strength and mass reduction requirementsAutomotive metal components for car bodies and chassis
Mixed Chart
Roland Berger
View slide
Uses statistics and infographic elements to discuss the behaviors and preferences of digital consumers across different age groups.
Market Analysis and Trends
Technology & Software
Analyzes emerging digital consumer segments and their potential impact on the market, highlighting their preferences and behaviors.
digital consumers, market impact, consumer behavior, e-commerce, online shopping, demographics, consumer preferences, market segmentation
false
Consider too, across the eight countries we studied, 98% of Gen Zers with internet access are active social media users who spend an average of four hours and 14 minutes online on their smartphones every day, over an hour more than other generations.4,5The next billion consumers
Mixed Chart
Accenture
View slide
Slide presents multiple column charts comparing manager demographics and distribution by company type across several countries, using flags for identification.
Market Analysis and Trends
Professional Services
Offers a comparative analysis of demographics, company types, and sectors across countries, useful for understanding corporate and workforce distributions in various regions.
demographics, managers, company types, countries, bar chart, column chart, workforce analysis, sector data, comparative analysis
false
Sample statistics Managers ManagedBCG – IPSOS study
Multiple Chart
BCG
View slide
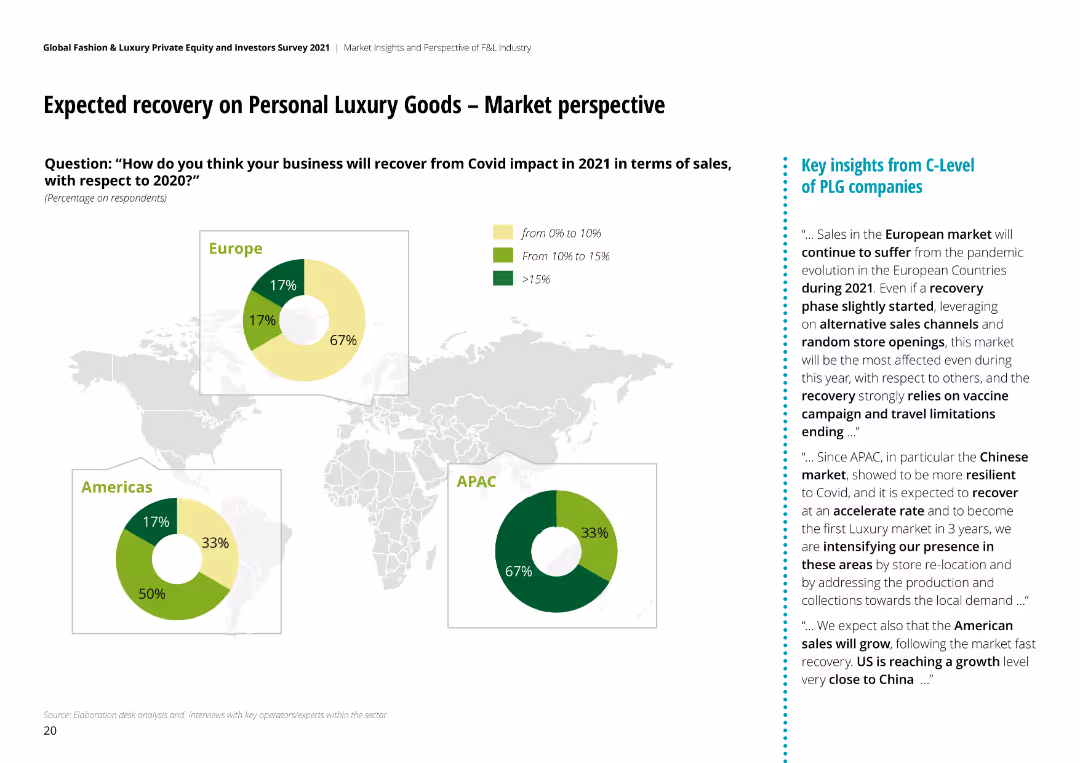
The slide contains a world map with three pie charts representing Europe, Americas, and APAC. Each pie chart shows percentage recovery expectations.
Market Analysis and Trends
Consumer Goods
It discusses the expected recovery of personal luxury goods across different regions, with key insights from C-Level executives highlighted on the right.
Recovery, Luxury Goods, Europe, Americas, APAC, Covid
false
Expected recovery on Personal Luxury Goods – Market perspectiveGlobal Fashion & Luxury Private Equity and Investors Survey 2021
Multiple Chart
Deloitte
View slide
This slide presents column charts comparing sector and regional financial data, with a focus on technology and China from 2015 to 2019.
Financial Performance
Financial Services
The slide shows financial performance variability across sectors and regions, highlighting opportunities for capturing market share.
Sector Wallet, Regional Wallet, Financial Data, Bar Chart, Technology, China, Market Share, Opportunities
false
Continuity and completeness in coverage allows us to capture opportunity across sectors, regions, and productsCORPORATE & INVESTMENT BANK 2020
Multiple Chart
JP Morgan
View slide
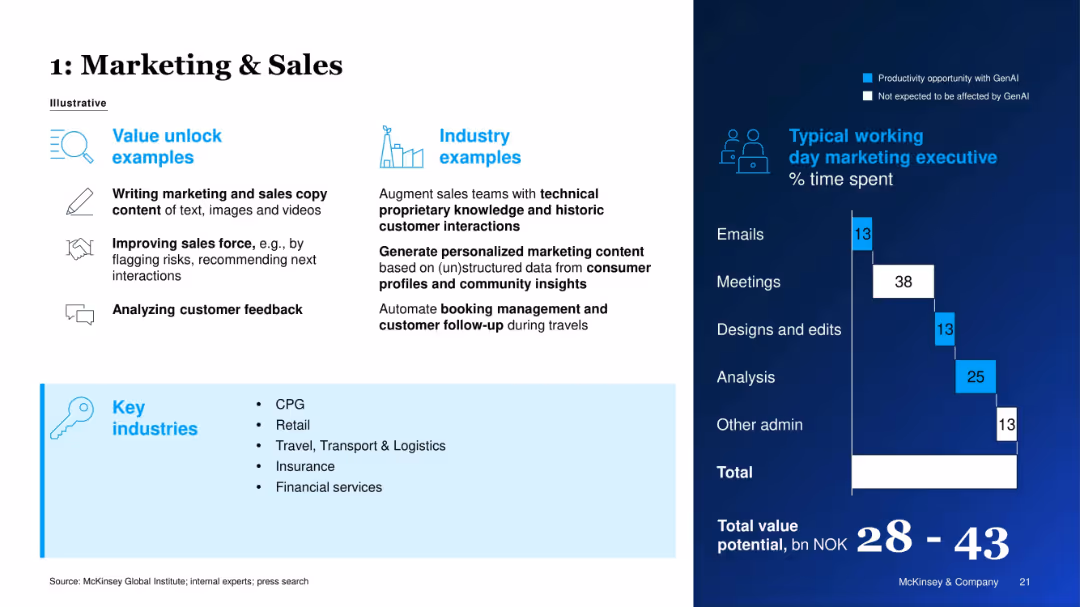
Two-column layout with value unlock examples and industry examples on the left; right side shows time allocation bar chart.
Sales and Business Development
Retail & E-commerce
The slide presents GenAI applications in marketing and sales, including content creation and customer feedback analysis. A time breakdown of a marketing executive’s typical day highlights productivity gains achievable through GenAI. Key industries benefiting include CPG, retail, and financial services.
Marketing, Sales Automation, GenAI Use Case, Productivity, Retail, Time Allocation, Personalization, Industry Application
false
1: Marketing & Sales Source: McKinsey Global Institute; internal experts; press search Not expected to be affected by GenAI ProductivityThe economic potential of Generative AI in Norway
Mixed Chart
McKinsey
View slide
The slide uses a dark background with a yellow-highlighted quote. It includes a question and four circular charts with percentages showing consumer responses.
Customer and Market Segmentation
Healthcare & Pharmaceuticals
The slide presents data on Canadian consumers' willingness to switch to virtual consultations for reasons like prescription renewal and discussing test results.
Virtual consultations, healthcare, convenience, consumer behavior, Canada
false
‘I would switch to virtual consultations for minor matters or greater convenience.’ Consumers: CanadaHealth care consumer views on value
Mixed Chart
EY
View slide
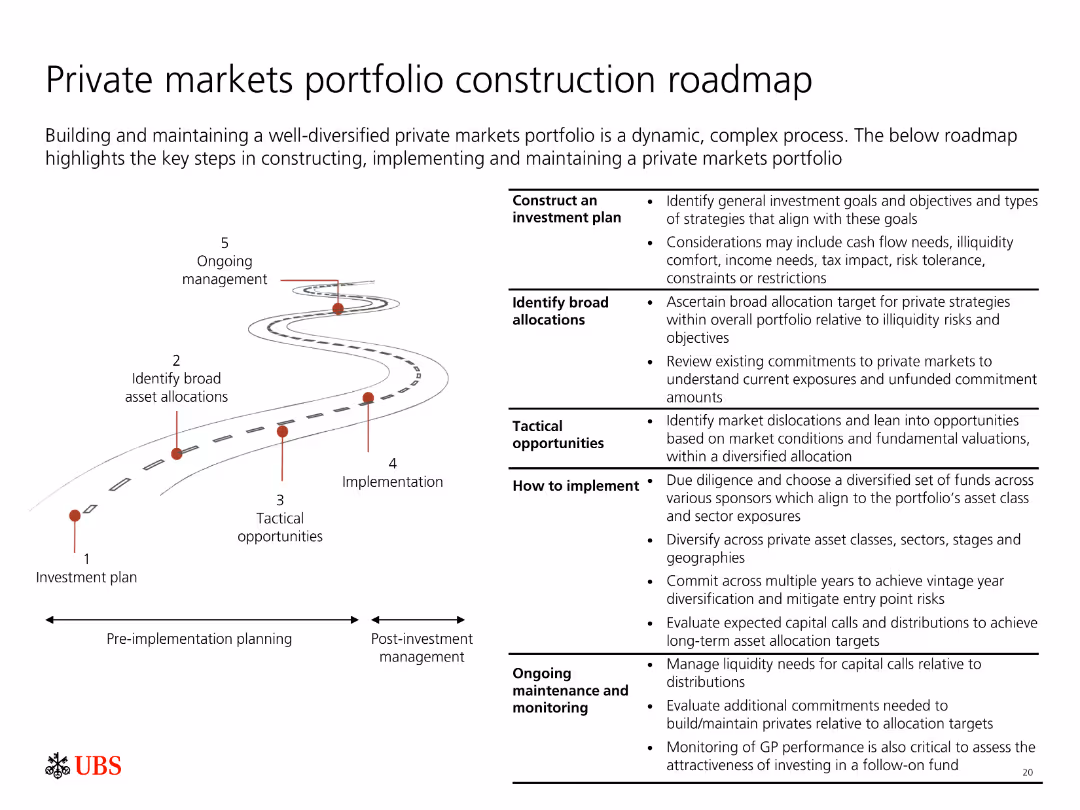
Depicts a roadmap with five key steps for constructing and maintaining a diversified private markets portfolio, from investment plan to ongoing management.
Strategic Planning
Financial Services
Outlines the process of building a private markets portfolio, including investment planning, asset allocation, tactical opportunities, implementation, and management.
Portfolio construction, private markets, roadmap, investment planning, management
false
Private markets portfolio construction roadmapPrivate markets asset allocation guide
Linear Flow
UBS
View slide
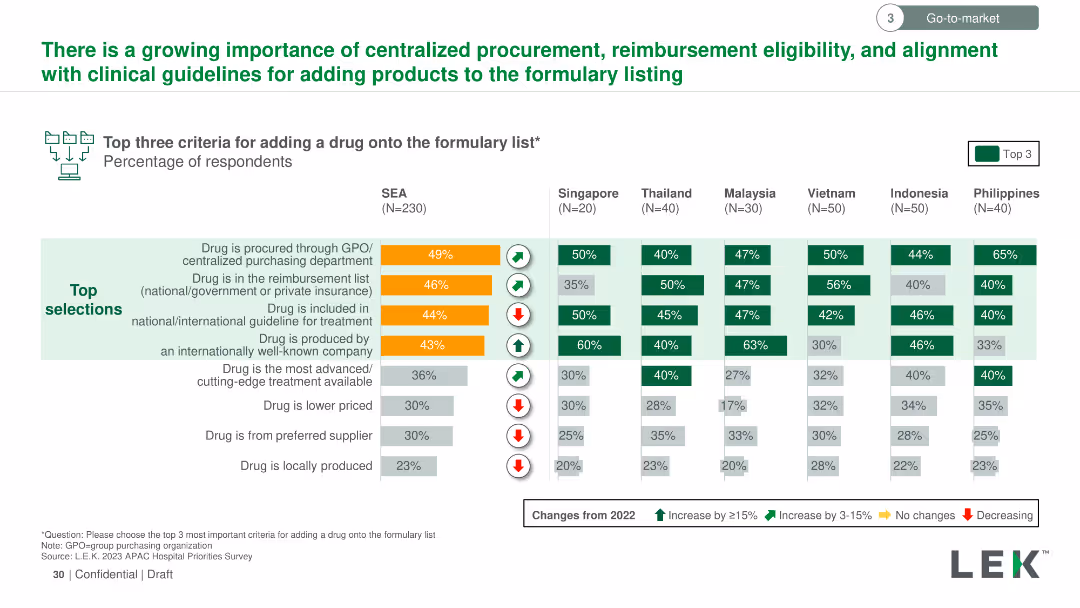
Vertical column chart showing the top three criteria for adding a drug to the formulary list across SEA countries. Criteria are color-coded and ranked by importance.
Regulatory and Compliance
Healthcare & Pharmaceuticals
Details the most important criteria for adding drugs to formulary lists in SEA, such as procurement through GPO, reimbursement status, and inclusion in treatment guidelines, with regional variations in importance.
formulary list, drug addition, criteria, GPO, reimbursement, treatment guidelines, SEA
false
There is a growing importance of centralized procurement, reimbursement eligibility, and alignment with clinical guidelines for adding products to the formulary listing2023 SEA Hospital Insights Survey Findings Summary materials
Multiple Chart
LEK
View slide
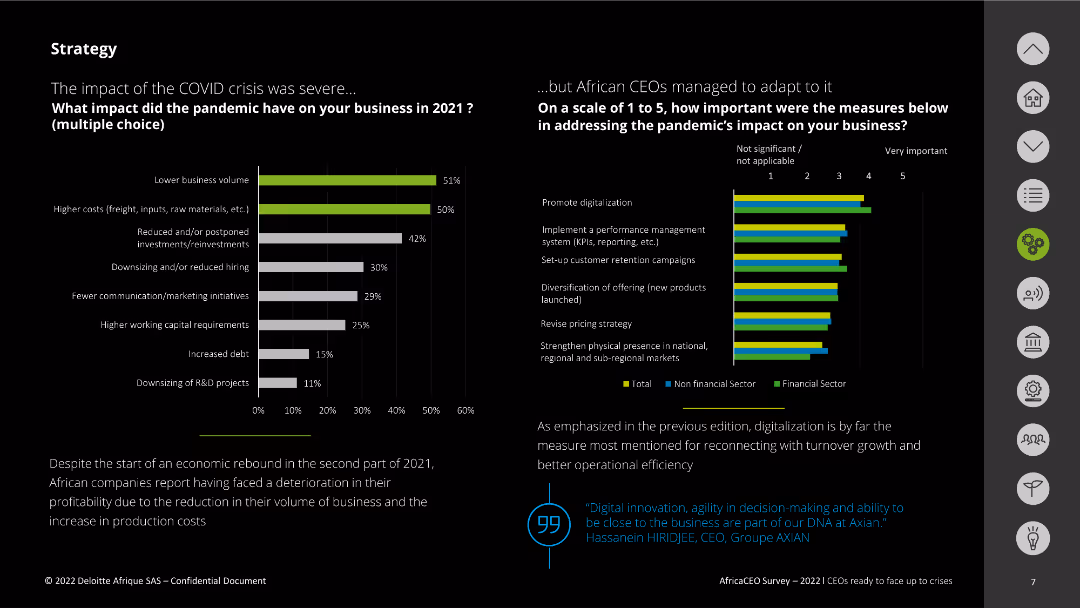
The slide contains two column charts comparing the impact of the pandemic on businesses and the importance of various measures to adapt. The charts are colored green and gray for different sectors, with key points highlighted in text below.
Risk Assessment and Management
Professional Services
This slide presents the impact of the COVID-19 pandemic on businesses in 2021 and the measures African CEOs took to adapt. It shows the effects on business volume and costs and highlights digitalization as a key adaptation strategy.
COVID-19, business impact, adaptation, digitalization, measures
false
Strategy The impact of the COVID crisis was severeCEOs ready to face up to crises
Multiple Chart
Deloitte
View slide
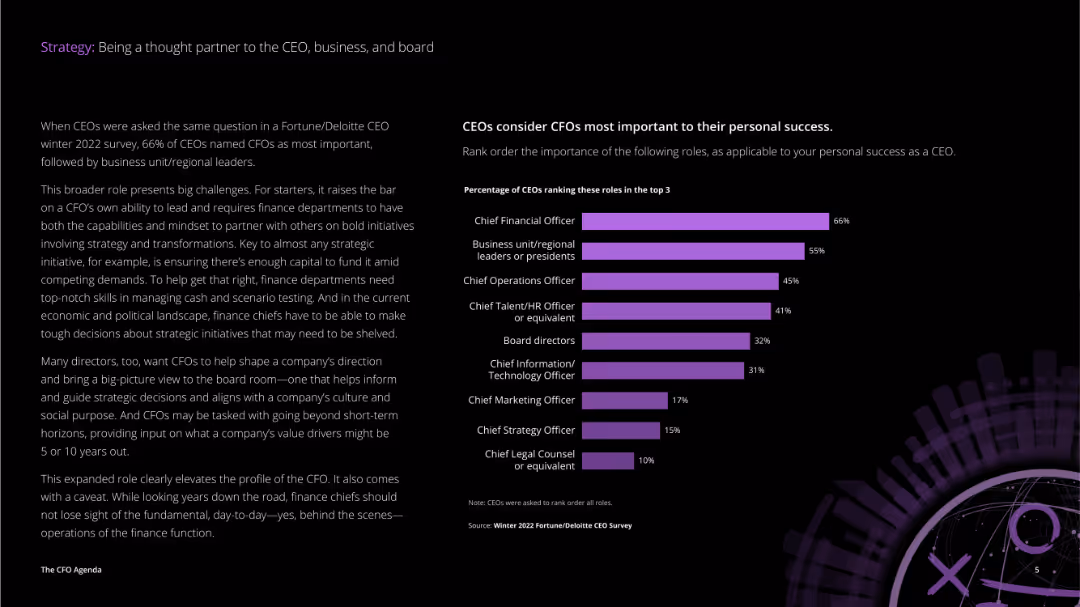
This slide includes a detailed text on the left explaining CFO roles and a column chart on the right showing the importance of different roles to CEOs' success.
Strategic Planning
Professional Services
The slide explains the critical roles CFOs play in business strategy and decision-making, emphasizing the importance of their relationships with CEOs and other business leaders to their success.
strategy, CFO, CEO, business, board, roles, success, importance, relationships, strategic partner
false
CEOs consider CFOs most important to their personal success.The CFO Agenda 2023
Mixed Chart
Deloitte
View slide
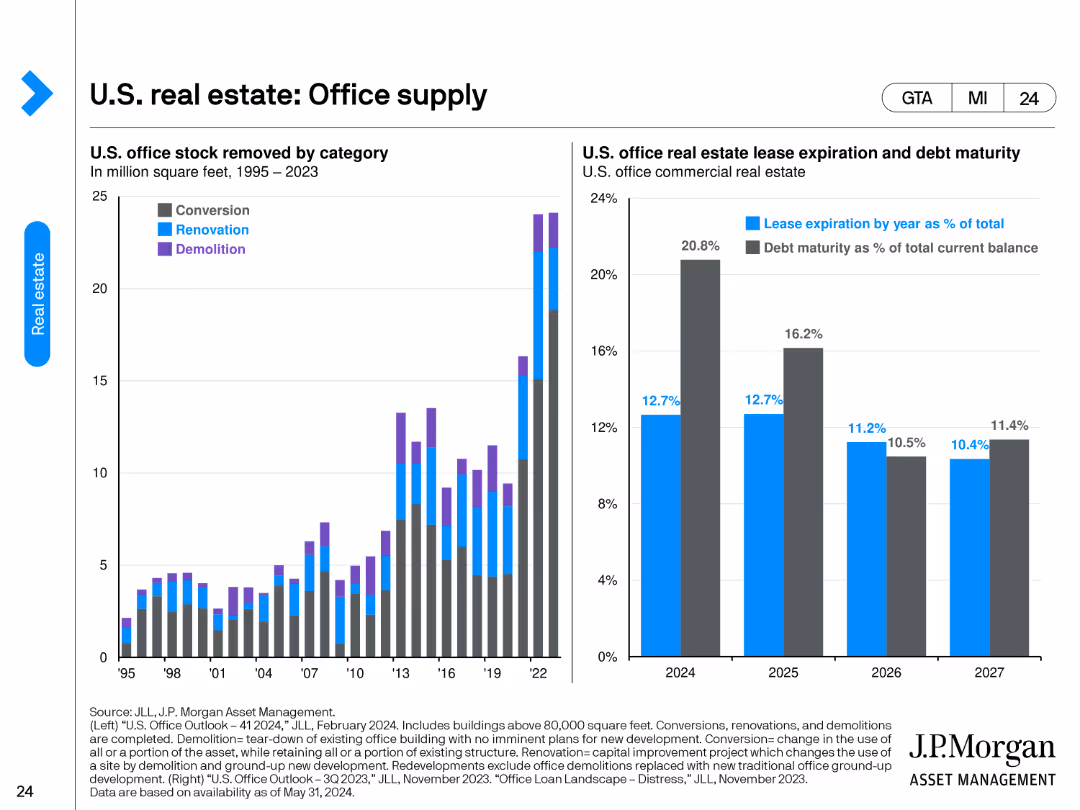
The slide features two charts. The left chart categorizes U.S. office stock removed by conversion, renovation, and demolition from 1995 to 2023. The right chart presents U.S. office real estate lease expiration and debt maturity as percentages of total current balance from 2024 to 2027.
Market Analysis and Trends
Real Estate & Construction
The slide provides an overview of the changes in U.S. office supply through different removal methods and outlines the lease expiration and debt maturity schedules for office real estate. It's useful for understanding supply dynamics and future lease/debt obligations.
office supply, lease expiration, debt maturity, conversion, renovation, demolition
false
U.S. real estate: Office supplyGuide to Alternatives
Multiple Chart
JP Morgan
View slide
Features a column charts with a key findings section to the left. The chart displays the efforts in recruitment, education, and reskilling due to generative AI's impact. The colors green and teal denote different levels of expertise.
Human Resources and Talent Management
Technology & Software
The slide assesses efforts made by organizations in preparing their workforce for the advent of generative AI. It emphasizes the proactive steps taken in hiring, educating, and reskilling employees and compares these efforts with the perceived expertise in generative AI within the organizations.
generative AI, recruitment, education, reskilling, workforce, efforts, expertise, preparation
false
Against this backdrop, some respondents reported making a high or very high effort to: recruit and hire technical talent to drive their generative AI initiatives (42%), educate the workforce about generative AI (40%)Insights from the leading edge of generative AI adoption
Mixed Chart
Deloitte
View slide
Line chart comparing societal metrics over a decade, focusing on marketing and ecological impact. Accompanied by insights on industry ratings.
Customer and Market Segmentation
Environmental Services & Sustainability
Reviews long-term trends in societal impacts of marketing, especially in pharmaceuticals and finance, noting minimal change in ecological impact ratings.
societal impact, marketing, ecological, decade, trends, pharmaceuticals, finance, environmental sustainability
false
Societal metrics show no change over a decadeThe CMO Survey The Highlights and Insights Report February 2022
Mixed Chart
Deloitte
View slide
The slide uses a split design with a gray-blue color scheme. It contains icons, flowchart elements, and numerical data highlighting key risk management areas.
Risk Assessment and Management
Financial Services
Emphasizes the critical nature of risk and control management in finance, detailing operational security, legal, and compliance structures.
risk management, control, compliance, security, finance, operational resilience, KYC, AML
false
Fortress risk and control management are non-negotiableFirm Overview 2022
Framework
JP Morgan
View slide
Slide with a timeline graph, text, and color-coded phases representing pandemic response strategies.
Market Analysis and Trends
Government & Public Sector
Analyzes strategies for dealing with COVID-19's impact over time, including flattening the curve and economic recovery.
Pandemic Recovery, COVID-19, Flatten, Fight, Future, Economic Impact, Government Policy
true
The COVID-19 recovery will be driven by disease progression, de-averaged economic impact, government policies, and business and public responsesCOVID-19 BCG Perspectives Series Global Restart: Key Dynamics
Linear Flow
BCG
View slide
Includes two column charts showing GVA and employment growth in major cities for 2024-2026.
Strategic Planning
Government & Public Sector
Details medium-term growth prospects for major cities, emphasizing sector specialisms and differential growth rates across regions.
medium-term growth, major cities, sector specialism, GVA, employment, column chart
false
This trend is less evident for the medium-term growth prospects of major cities ...EY ITEM Club UK Regional Economic Forecast
Multiple Chart
EY
View slide
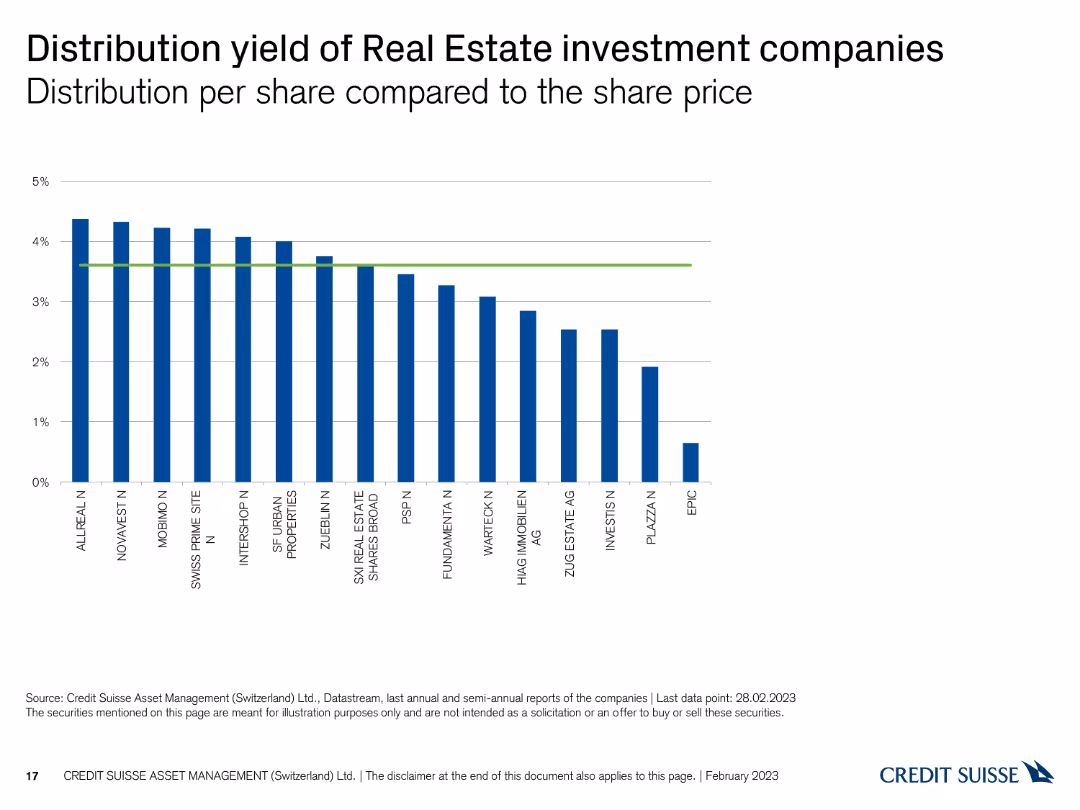
This slide displays a column chart showing the distribution yield per share for Swiss real estate investment companies, with vertical bars representing yield percentages and a green reference line.
Financial Performance
Real Estate & Construction
The slide presents the distribution yields of real estate investment companies, comparing their returns. It is used for evaluating income potential and investment performance.
Real estate, distribution yield, investment companies, returns, comparison
false
Distribution yield of Real Estate investment companies Distribution per share compared to the share priceSwiss Real Estate Funds At a glance February 2023
Single Chart
Credit Suisse
View slide
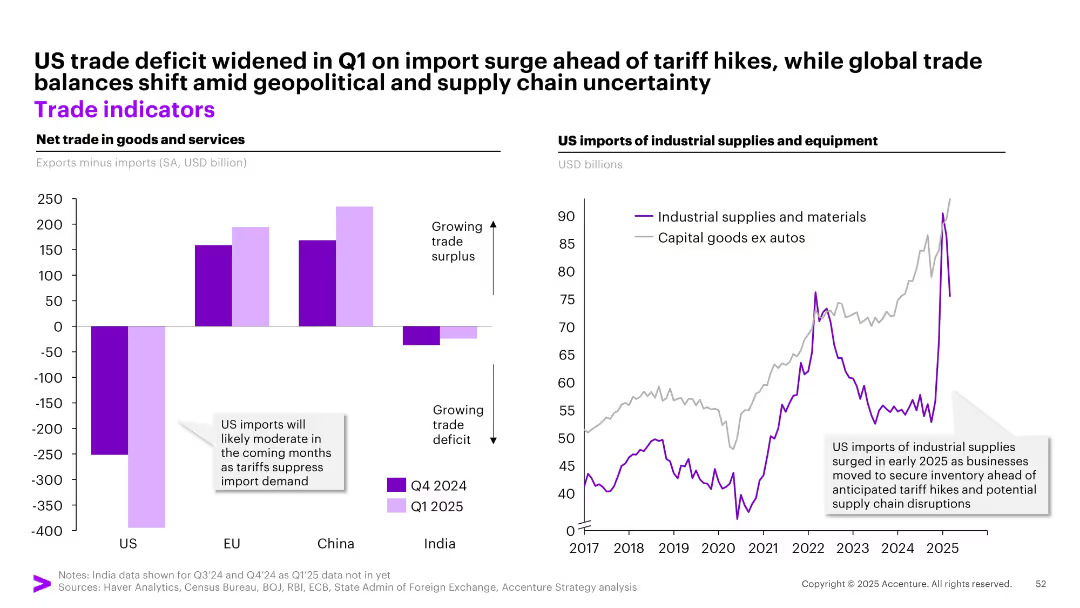
Dual-panel chart: left = net trade by region (bar chart), right = US imports of industrial supplies (line chart)
Market Analysis and Trends
Transportation & Logistics
This slide shows the widening US trade deficit in early 2025 due to an import surge ahead of tariff hikes, while other regions like China and EU maintain trade surpluses. It also depicts a rise in US industrial supply imports, driven by businesses stockpiling before anticipated tariff impacts.
trade deficit, US imports, industrial supplies, tariffs, supply chain, global trade
false
US trade deficit widened in Q1 on import surge ahead of tariff hikes, while global trade balances shift amid geopolitical and supply chain uncertaintyMay Macro Brief Consumer spending in flux
Multiple Chart
Accenture
View slide
This slide contains multiple column charts across a timeline from 1996 to 2019, separated into phases labeled "Sortie du temple," "Democratization," "Crisis," and others.
Market Analysis and Trends
Consumer Goods
The slide presents a timeline of the luxury goods market growth from 1996 to 2019, highlighting various market phases and projecting growth. It is used to analyze market trends.
Luxury goods, Market growth, Crisis, Projection
false
THE PERSONAL LUXURY GOODS MARKET IS EXPECTED TO CONTINUE ITS GROWTH TRAJECTORY IN 2019BAIN-ALTAGAMMA 2019 WORLDWIDE LUXURY MARKET MONITOR
Single Chart
Bain
View slide
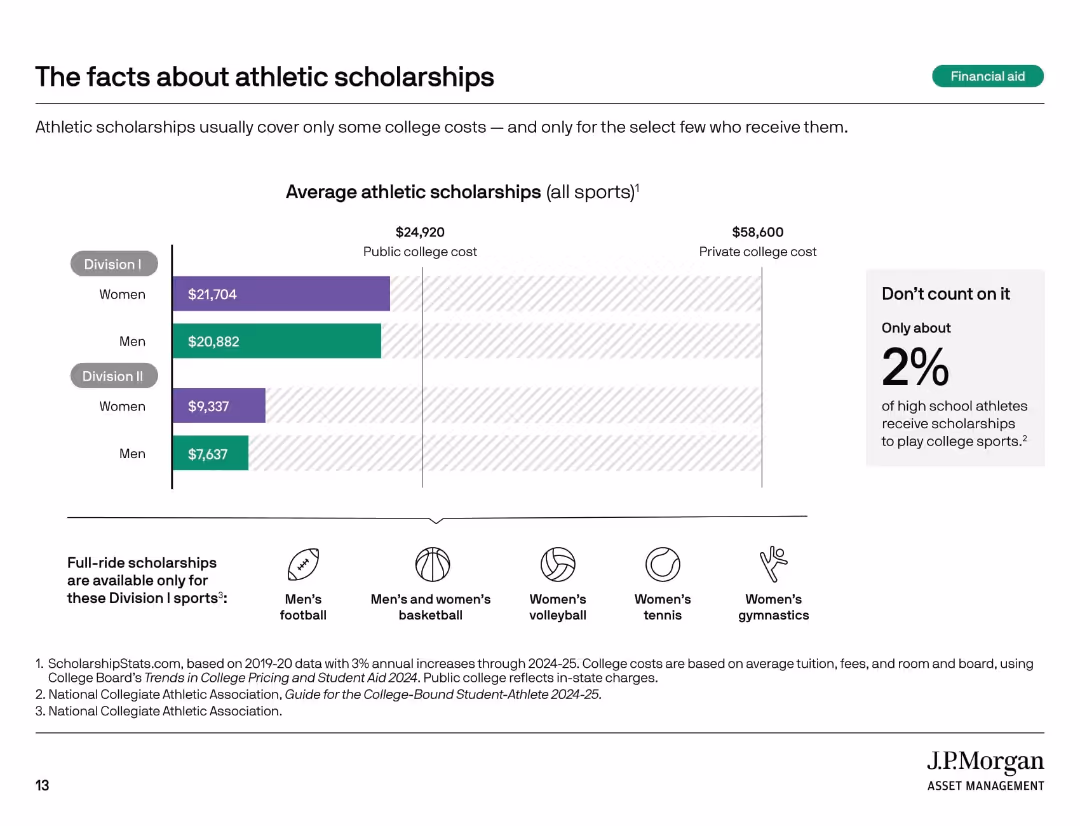
Horizontal bar chart by gender/division with icon row below; sidebar text in light gray box.
Market Analysis and Trends
Education & Training
This slide addresses common misconceptions about athletic scholarships, showing average scholarship values by division and gender, while stressing their rarity. Only about 2% of high school athletes receive these scholarships. It also identifies sports eligible for full-ride scholarships.
athletic scholarships, Division I, Division II, college costs, sports
false
The facts about athletic scholarshipsCollege Planning Essentials A comprehensive guide to saving and investing
Mixed Chart
JP Morgan
View slide
Two-column layout with bullet points on awareness building and freight group formation; large central logo and iconography.
Strategic Planning
Transportation & Logistics
This slide outlines the dual pillars of the UIC action plan: communication and creation of a Central Asia rail freight group. It highlights tasks like lobbying, transparency, regulatory support, and technical standardization to drive regional freight development.
communication, freight group, UIC, Central Asia, regulation, strategy, awareness
false
Stakeholder communication and new CA rail freight group as key pillars for UIC CA action planRAIL FREIGHT IN CENTRAL ASIA AND MIDDLE EAST
Framework
Roland Berger
View slide
Two-part slide; the left discusses the Multi-Earner Era with line graphs on search trends, the right examines Obesity x Social Media with a spike graph and thematic analysis.
Market Analysis and Trends
Financial Services
The slide examines the rise of the multi-earner era due to AI advancements and the impact of social media on obesity-related product growth, relevant for market strategists and health industry analysts.
Multi-earner, generative AI, social media, obesity, market trends, health products, AI impact, search trends, health industry analysis, product growth
false
Theme 9: Multi-Earner Era10 Themes for 2023 –Q1 Progress Report
Mixed Chart
Morgan Stanley
View slide
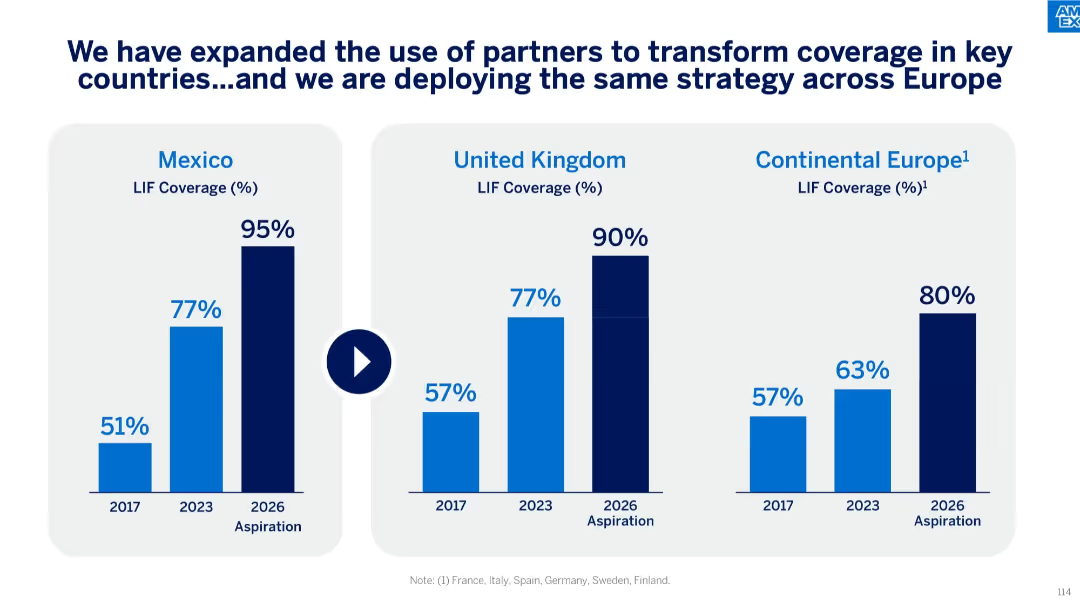
Side-by-side bar charts for Mexico, UK, and Continental Europe, highlighting LIF coverage from 2017 to 2026 aspirational targets.
Market Analysis and Trends
Financial Services
This slide compares LIF coverage improvements over time across Mexico, the UK, and key European countries. It shows historical coverage data, recent progress, and 2026 aspirations, emphasizing partnership strategies to drive growth.
Mexico, UK, Europe, LIF coverage, aspirational goals, strategic partners, Amex growth, regional analysis
false
We have expanded the use of partners to transform coverage in key countries…and we are deploying the same strategy across EuropeAmerican Express Investor Day 2024
Single Chart
McKinsey
View slide
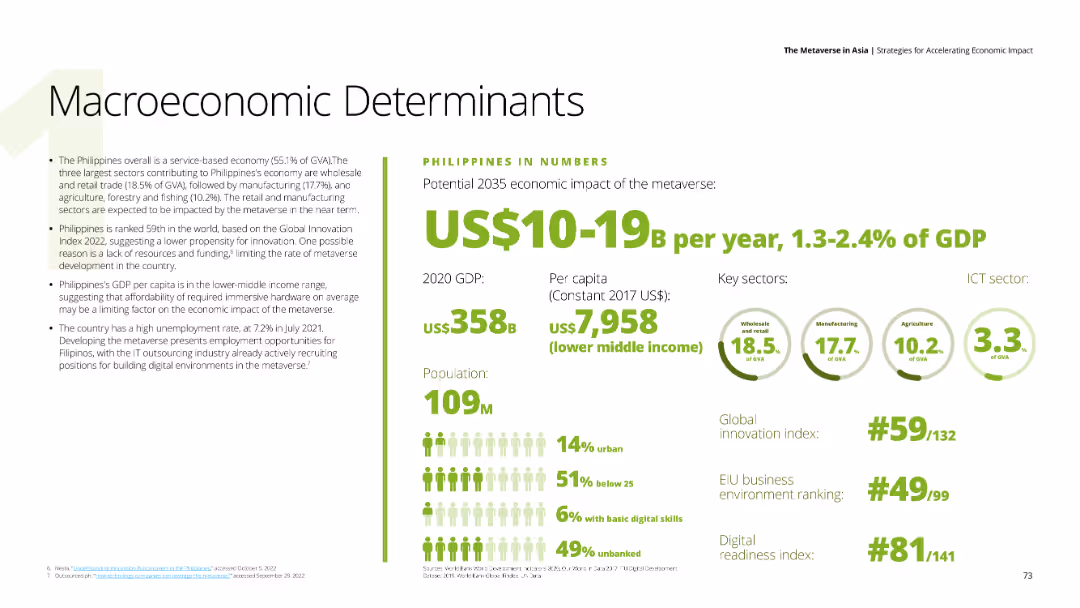
Text describing the Philippines' economic impact of the metaverse, with data on GDP, per capita income, and key sectors such as wholesale trade, manufacturing, and agriculture. Background is white with green and black text.
Market Analysis and Trends
Financial Services
Discusses the Philippines' economic conditions and metaverse impact, focusing on GDP, innovation index ranking, and challenges such as unemployment and limited digital readiness.
Philippines, metaverse, economic impact, wholesale trade, innovation
false
Macroeconomic Determinants PHILIPPINES IN NUMBERSThe Metaverse in Asia Strategies for Accelerating Economic Impact
Mixed Chart
Deloitte
View slide
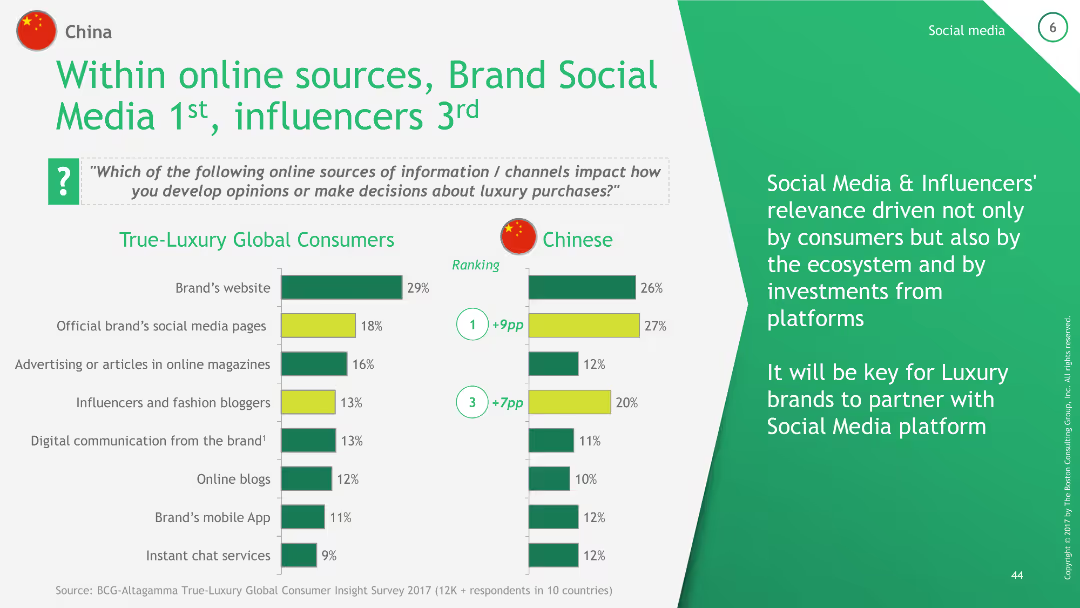
The slide contains a column chart comparing the relevance of various online sources of information for luxury purchases between True-Luxury Global Consumers and Chinese consumers. It ranks Brand's website, Official brand's social media pages, Advertising in online magazines, and Influencers.
Technology and Digital Transformation
Consumer Goods
This slide compares the relevance of different online sources of information for luxury purchases, emphasizing the higher importance of social media and influencers for Chinese consumers compared to global consumers.
China, social media, influencers, online sources, luxury
false
Within online sources, Brand Social Media 1st, influencers 3rd2018 True-Luxury Global Consumer Insight
Multiple Chart
BCG
View slide
Complex line chart tracking U.S. leadership behaviors in I&D across various strategic levels, with color differentiation for regional and demographic distinctions.
Strategic Planning
Professional Services
Highlights critical views of U.S. leadership in I&D practices, showing lower favorable assessments compared to global standards.
leadership, I&D, U.S., line chart, assessment, strategic levels, unfavorable comparisons, global standards
false
U.S. ASSESSMENT OF I&D IS SIGNIFICANTLY LESS FAVORABLE ACROSS MOST AREAS OF LEADERSHIP BEHAVIORInclusion and Diversity Survey MAKE IT MORE THAN A MANTRA
Mixed Chart
Accenture
View slide
Includes multiple column charts assessing the effectiveness of various health safety measures in encouraging the use of public and shared transport modes.
Market Analysis and Trends
Transportation & Logistics
Evaluates the effectiveness of health safety measures on public and shared transport usage.
health safety, transportation, measures, effectiveness
false
Shared and public transport are currently not considered as safe for healthCOVID-19 Auto & Mobility Consumer Insights
Single Chart
McKinsey
View slide
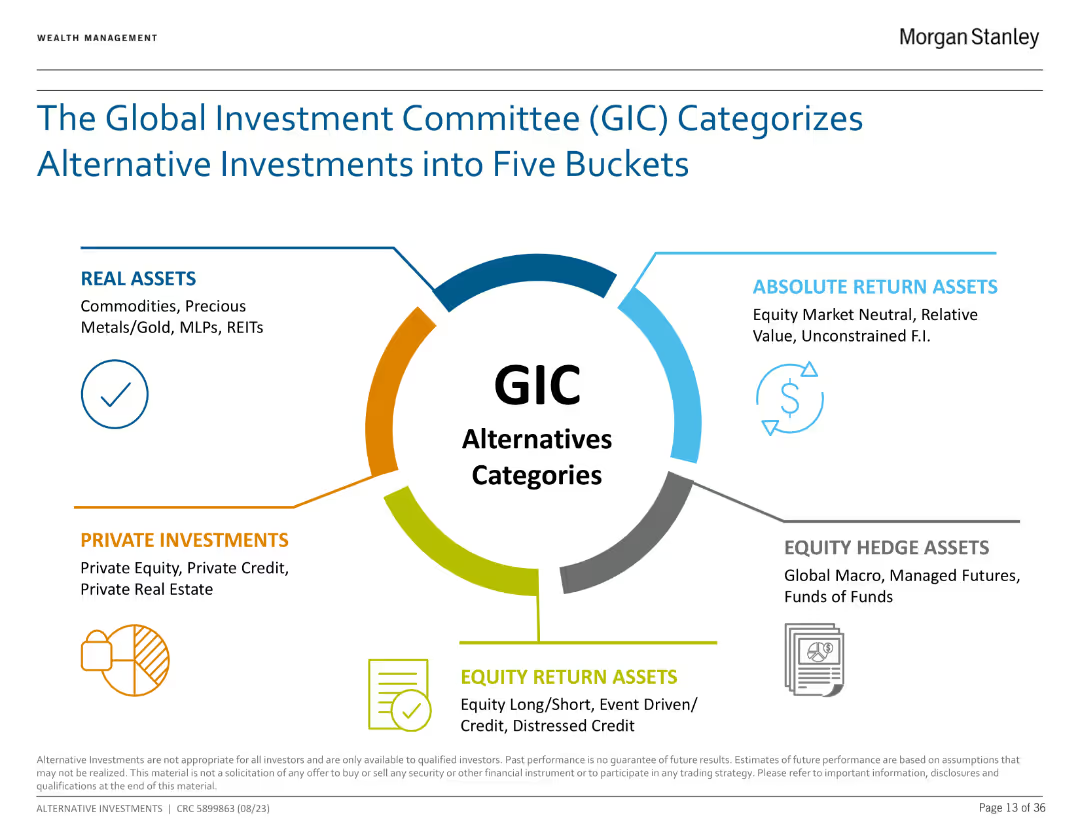
The slide features a circular diagram with five sections representing different categories of alternative investments, each with brief descriptions.
Investment Analysis
Financial Services
The slide explains the five categories of alternative investments as defined by the Global Investment Committee (GIC): Real Assets, Absolute Return Assets, Equity Hedge Assets, Private Investments, and Equity Return Assets.
Alternative Investments, GIC, Real Assets, Equity, Investment Analysis
false
The Global Investment Committee (GIC) Categorizes Alternative Investments into Five BucketsWealth Management Perspectives
Framework
Morgan Stanley
View slide
The slide features a circular diagram representing global forces with different areas like 'business fragmentation' and 'individualism'. Each segment has brief descriptors and the design is color-coded for clarity.
Strategic Planning
Professional Services
This appendix slide offers a conceptual framework for understanding the forces influencing global business and people management. It associates various global trends with potential impacts on business structures and decision-making, providing a reference point for considering future scenarios in a corporate context.
Global forces, business trends, people management, conceptual framework
false
AppendixThe future of work: A journey to 2022
Framework
PwC/Strategy&
View slide
Three-column layout with icons and callout text in white on a dark background. Focused action points on AI strategy, data standardization, and technology pilots.
Strategic Planning
Professional Services
Encourages firms to act by developing AI-based strategies, standardizing data, and testing technologies before scaling. Practical advice is visualized clearly for quick interpretation.
AI strategy, data, standardization, pilots, transformation, M&A
false
Call to actionUnlocking alpha in deals
Linear Flow
Accenture
View slide
Contains column charts to display financial targets and current metrics.
Financial Performance
Financial Services
Provides an overview of financial metrics and future targets for 2026.
financials, targets, growth, assets, performance
false
Today’s financials and 2026 targetsFY 2023 Results Announcement
Multiple Chart
Barclays
View slide
A two-section slide with text on the left explaining the foundational role of technology in business transformation. The right side features a bar graph, "Technology is foundational," detailing the percentage of executives agreeing with technology's critical role in their organization's reinvention strategies.
Technology and Digital Transformation
Technology & Software
The slide asserts the strategic importance of technology in contemporary business, offering insights on executive perceptions regarding technology as a cornerstone for innovation and growth. It could serve as an argument for increasing tech investments and prioritizing digital transformation initiatives.
technology, enabler, digital transformation, business strategy, executive insights
false
Technology is foundationalTotal Enterprise Reinvention
Multiple Chart
Accenture
View slide
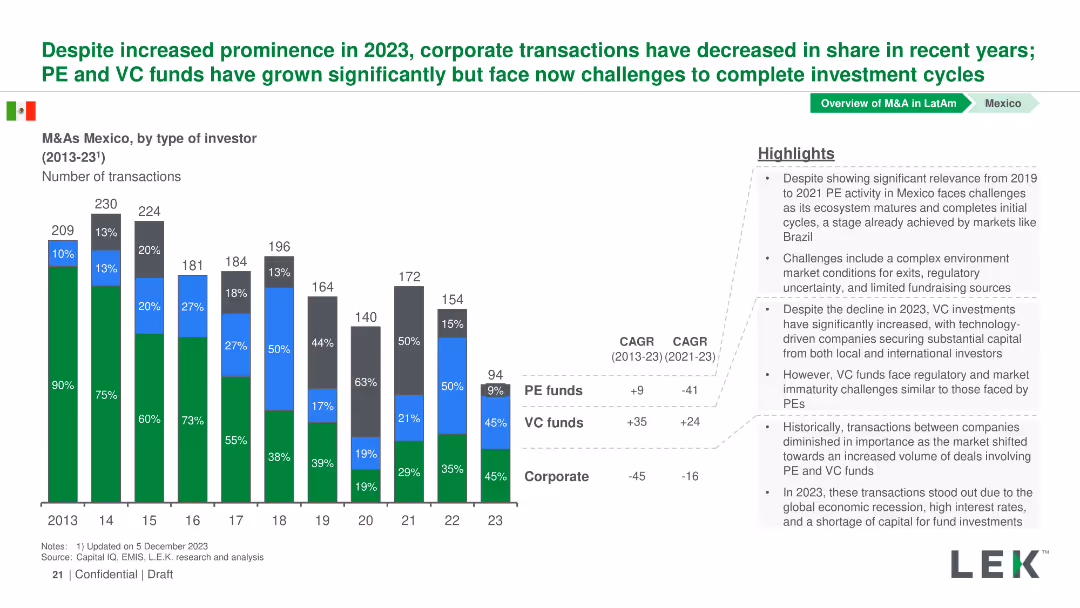
Column chart displaying the number of M&A transactions by type of investor in Mexico from 2013-2023, with investors categorized into PE funds, VC funds, and Corporate.
Market Analysis and Trends
Financial Services
This slide shows trends in M&A transactions in Mexico categorized by type of investor from 2013-2023, highlighting the growth of PE and VC funds compared to Corporate.
Mexico, M&A, Investors, Private Equity, Venture Capital
false
Despite increased prominence in 2023, corporate transactions have decreased in share in recent years; PE and VC funds have grown significantly but face now challenges to complete investment cyclesMergers and Acquisitions in LatAm: Evolution and prospects
Mixed Chart
LEK
View slide
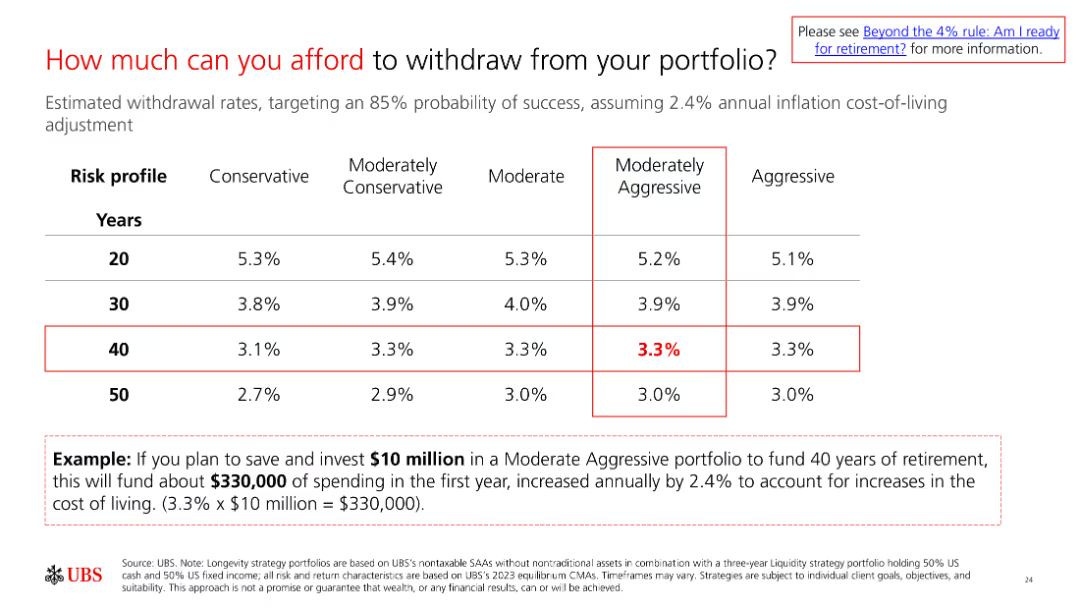
A slide with a table showing withdrawal rates for different risk profiles and time horizons. The example at the bottom illustrates how to apply the rates to determine affordable withdrawals.
Financial Performance
Financial Services
The slide explains how much individuals can afford to withdraw from their portfolios based on their risk profile and time horizon, with an example for clarity.
withdrawal rates, portfolio management, retirement planning, financial strategy, risk management
false
How much can you afford to withdraw from your portfolio?2024 Retirement guidebook
Table
UBS
View slide
Column charts and stats about income levels and sources of financial support for refugees.
Financial Performance
Government & Public Sector
Reviews financial conditions of refugees and the support they receive.
refugees, income, financial support, Poland
false
Financial resources is the top rated need of respondents. Taking into account income from work and other sources, most respondents are barely coping financially:Ukraine Refugee Pulse
Multiple Chart
Deloitte
View slide
Contains two pie charts comparing GDP percentage and market capitalization across countries, indicating the distribution of global equity allocations.
Investment Analysis
Financial Services
Highlights the disproportionate allocation of global equity towards the U.S., illustrated by its GDP versus market capitalization share, significant for strategic investment planning.
equity allocation, GDP, market capitalization, strategic planning, investment, USA dominance, global distribution
false
U.S. Dominates Global Equity AllocationsMonthly Market Monitor November 2023
Multiple Chart
Morgan Stanley
View slide
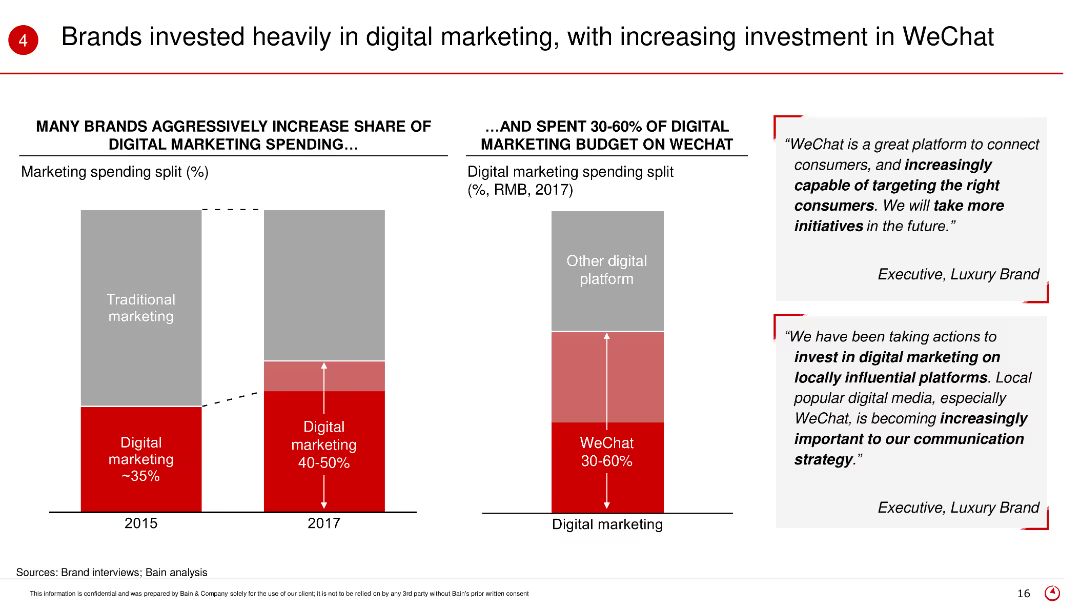
The slide shows bar charts comparing traditional and digital marketing spending in 2015 and 2017, and the proportion of digital marketing budget spent on WeChat. Text boxes include quotes from executives.
Market Analysis and Trends
Retail & E-commerce
This slide highlights the shift in marketing strategies among brands towards digital marketing, particularly emphasizing the significant investment in WeChat as a key platform for engagement.
Digital marketing, WeChat, marketing investment, traditional marketing, brand strategies
false
Brands invested heavily in digital marketing, with increasing investment in WeChat2017 China Luxury Market Study
Multiple Chart
Bain
View slide
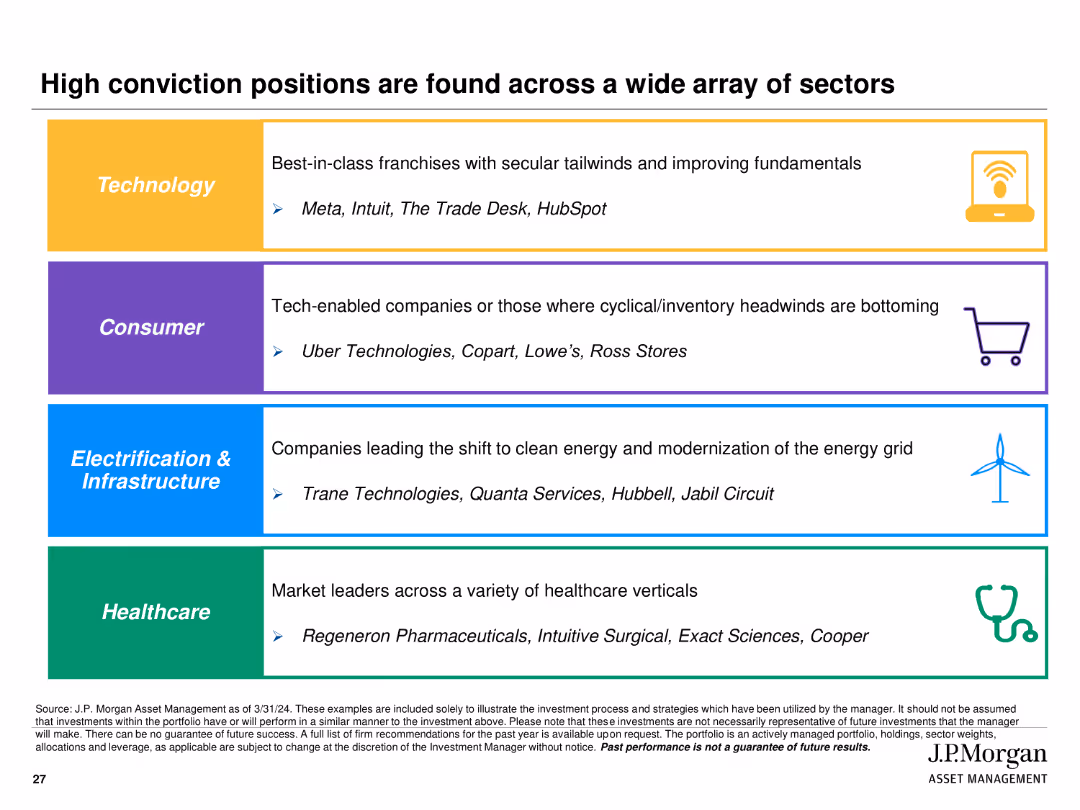
Utilizes colored sections with icons and text to highlight high conviction positions in Technology, Consumer, Electrification & Infrastructure, and Healthcare sectors.
Investment Analysis
Financial Services
Identifies and highlights key high conviction investment positions across various sectors, providing examples of companies within each sector.
high conviction, positions, sectors, technology, consumer, infrastructure, healthcare
false
High conviction positions are found across a wide array of sectorsJ.P. Morgan Growth Advantage Strategy
Table
JP Morgan
View slide
Similar layout to previous slide, now segmented by procurement categories; stacked bar chart on right with color-coded severity levels by category.
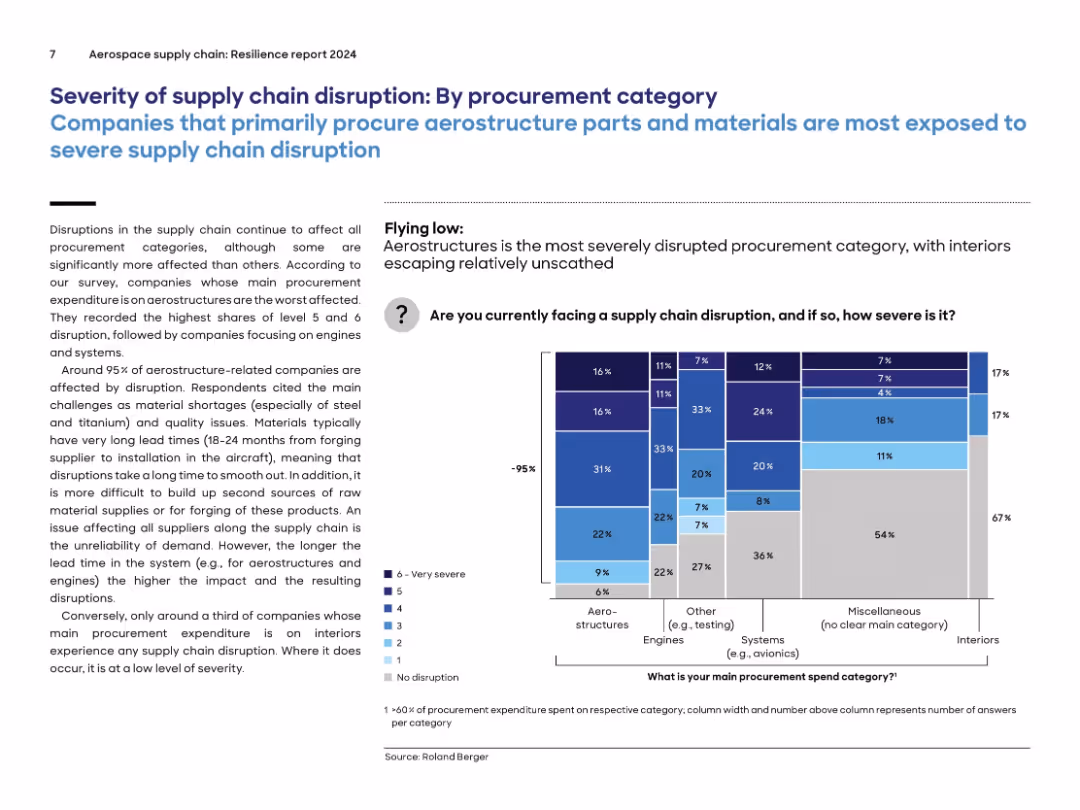
Risk Assessment and Management
Environmental Services & Sustainability
Aerostructure-related procurement is the most disrupted category, with 95% of companies affected. Disruptions are driven by material shortages (e.g., steel, titanium), long lead times, and quality issues. By contrast, interiors experience far fewer disruptions. The chart compares severity of supply chain disruption across categories like engines, systems, and miscellaneous.
procurement, aerostructures, supply chain, engines, severity, disruption, lead time, materials
false
Severity of supply chain disruption: By procurement categoryAerospace supply chain: Resilience report 2024
Mixed Chart
Roland Berger
View slide
Slide features a vertical bar chart showing percentages of anticipated workforce shortages in various operational areas such as retail, supply chain, and IT.
Human Resources and Talent Management
Retail & E-commerce
This slide predicts significant workforce shortages in retail operations and supply chain, highlighting urgent areas for strategic human resource planning in the industry.
workforce, shortage, retail, supply chain, operations, human resources, strategic planning, anticipates
false
Executives anticipate workforce shortage in areas such as retail store and supply chain operations2022 retail industry outlook
Single Chart
Deloitte
View slide
This slide has four column charts showing the Gross Merchandise Value (GMV) across different sectors in the Philippines from 2015 with projections to 2025, a title, and source citations.
Market Analysis and Trends
Technology & Software
It analyzes the GMV in the e-commerce, transport, travel, and media sectors, emphasizing the growth in e-commerce and media, which compensates for declines in other areas, useful for sectoral investment insights.
Sector, GMV, E-commerce, Media, Transport, Food, Travel
false
Philippines e-Commerce and Media offsets contraction in Transport & Food and Travele-Conomy SEA 2020 At full velocity: Resilient and racing ahead
Multiple Chart
Bain
View slide
Pie chart displaying the distribution of approaches to ML governance among various firms.
Regulatory and Compliance
Technology & Software
Provides an overview of how different organizations are handling ML governance and framework adaptation.
ML governance, framework, adaptation, distribution
false
What others are doing - ML GovernanceAI/ML use in Risk Management and Compliance PwC Actuarial, Risk & Quants
Single Chart
PwC/Strategy&
View slide
Side-by-side bar charts and bullet points showing revenue growth opportunities for Private Clients and Corporate & Institutional Clients.
Strategic Planning
Financial Services
Highlights strategies for driving revenue growth through recurring commissions, fees, and transaction-based revenues.
Revenue growth, Private Clients, Corporate Clients, strategy, commissions
false
Opportunity to drive revenue growthCredit Suisse Investor Day 2019 Growth in Wealth Management
Multiple Chart
Credit Suisse
View slide
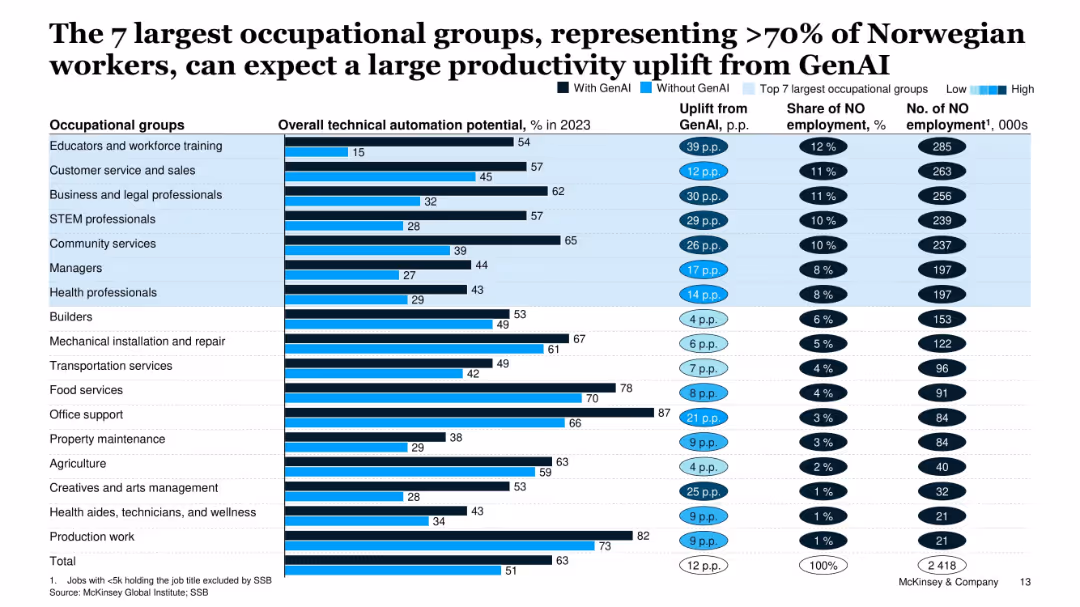
Extensive table layout showing automation potential uplift for major job groups, with % automation, employment share, and uplift from GenAI.
Human Resources and Talent Management
Artificial Intelligence
The slide evaluates the impact of GenAI on the top 7 occupational groups in Norway, which comprise over 70% of the workforce. It shows varying automation potentials and expected productivity gains.
GenAI, occupational groups, productivity uplift, automation, employment, Norway, workforce
false
The 7 largest occupational groups, representing >70% of Norwegian workers, can expect a large productivity uplift from GenAIThe economic potential of Generative AI in Norway
Single Chart
McKinsey
View slide
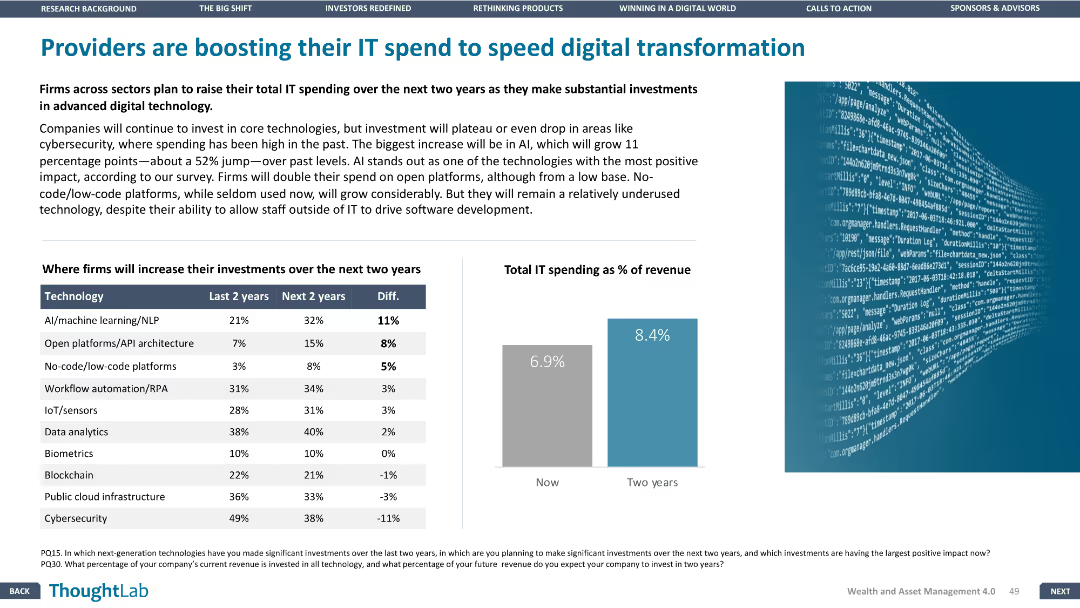
The slide has a column chart and a bar chart, with a focus on the differences in IT spending over the last two years and the next two years. The layout is moderately dense.
Technology and Digital Transformation
Financial Services
The slide discusses the planned increase in IT spending by firms over the next two years, particularly in advanced digital technologies like AI, open platforms, and workflow automation.
IT spending, digital transformation, advanced technologies, AI, workflow automation
false
Providers are boosting their IT spend to speed digital transformationWealth and asset management 4.0
Mixed Chart
Deloitte
View slide
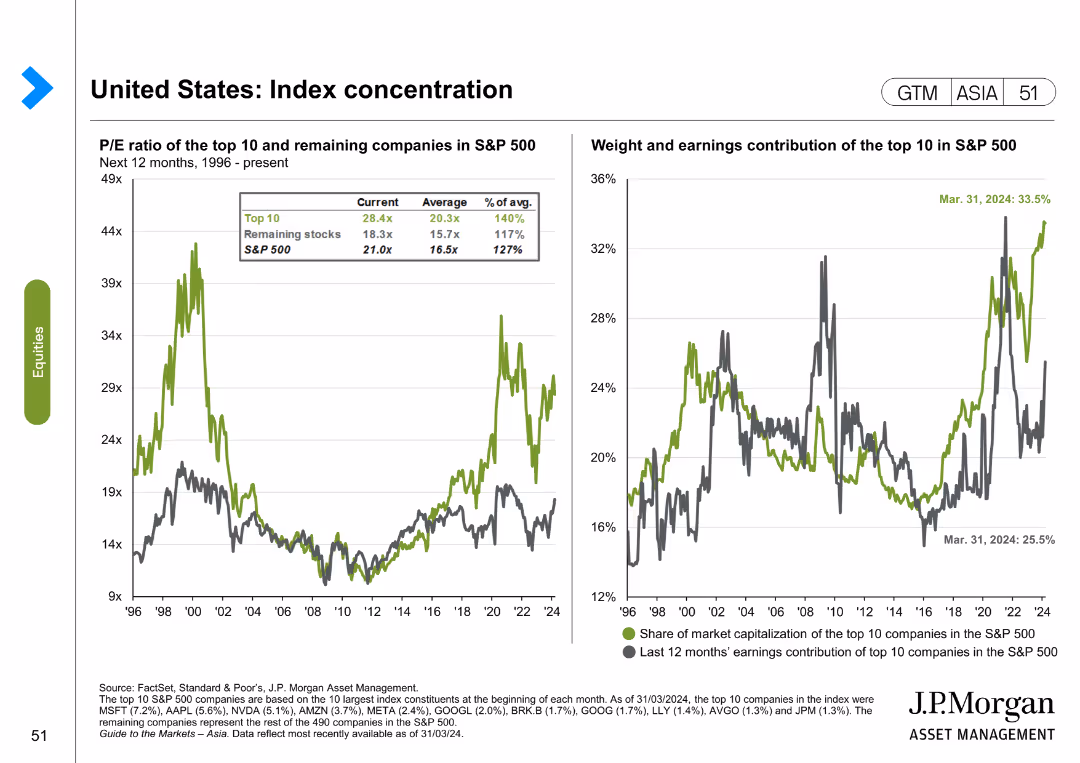
The slide features two line charts. The first chart shows the P/E ratio of the top 10 and remaining companies in the S&P 500 from 1996 to the present. The second chart shows the weight and earnings contribution of the top 10 in the S&P 500.
Market Analysis and Trends
Financial Services
The slide analyzes index concentration in the United States, focusing on the P/E ratio and earnings contribution of the top 10 companies in the S&P 500. It is used for market analysis and investment decision-making.
United States, index concentration, S&P 500, P/E ratio, earnings contribution, market analysis
false
United States: Index concentrationGuide to the Markets Asia | 2Q 2024
Multiple Chart
JP Morgan
View slide
The slide includes a column chart comparing 2017 use and future use projections for different FinTech categories.
Strategic Planning
Financial Services
The slide predicts growth in smaller FinTech categories like financial planning and borrowing, suggesting that these areas will drive future growth.
FinTech, adoption, growth, categories, future use
false
Accelerating adoption in smaller categories will fuel growthInsights from the EY FinTech Adoption Index and EY FinTech Australia Census
Single Chart
EY
View slide
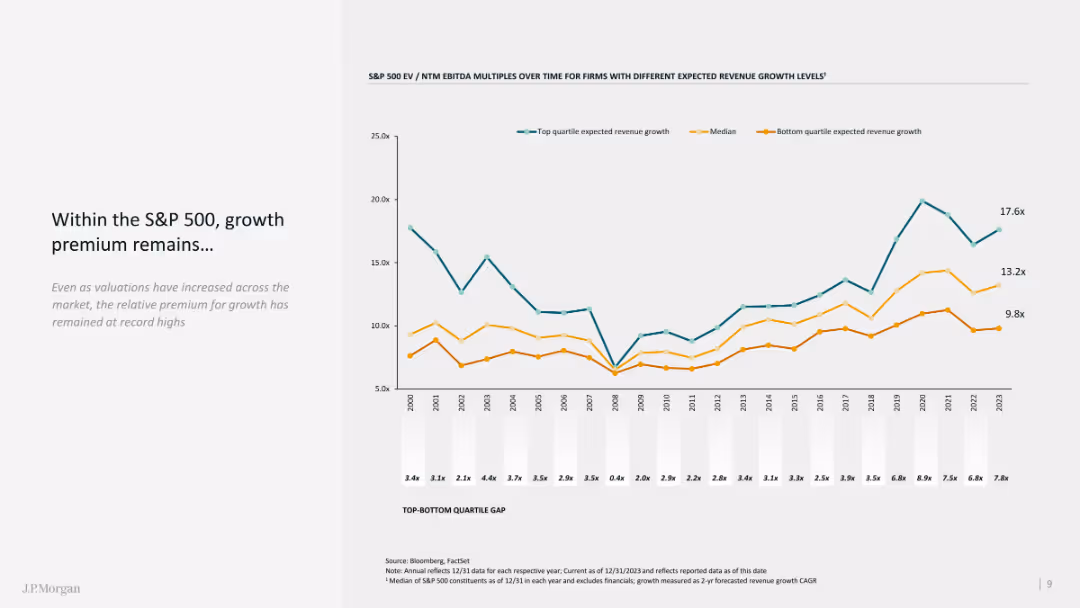
The slide features a line chart showing growth premiums within the S&P 500 over time, with comparative quartiles.
Market Analysis and Trends
Financial Services
The slide analyzes the growth premium in the S&P 500, emphasizing historical data and current valuation metrics.
S&P 500, growth premium, line chart, comparative analysis, historical data
false
S&P 500 EV / NTM EBITDA MULTIPLES OVER TIME FOR FIRMS WITH DIFFERENT EXPECTED REVENUE GROWTH LEVELS¹12th IBA European Corporate and Private M&A Conference J.P. Morgan 2024 Global M&A Roadmap
Mixed Chart
JP Morgan
View slide
The slide features a donut chart, column charts, and text blocks. The left side shows job satisfaction ratings, and the right side displays retention likelihood.
Performance Metrics and KPIs
Professional Services
Explains job satisfaction and retention likelihood based on survey results. Includes Net Promoter Score and likelihood of staying for 12 months.
job satisfaction, retention, survey, Net Promoter Score, employee sentiment
false
In spite of the challenges posed by the pandemic, employees remain positive about their work and will stay for 12 monthsGlobal Employee Survey - Key findings and implications for ICMIF
Mixed Chart
EY
View slide
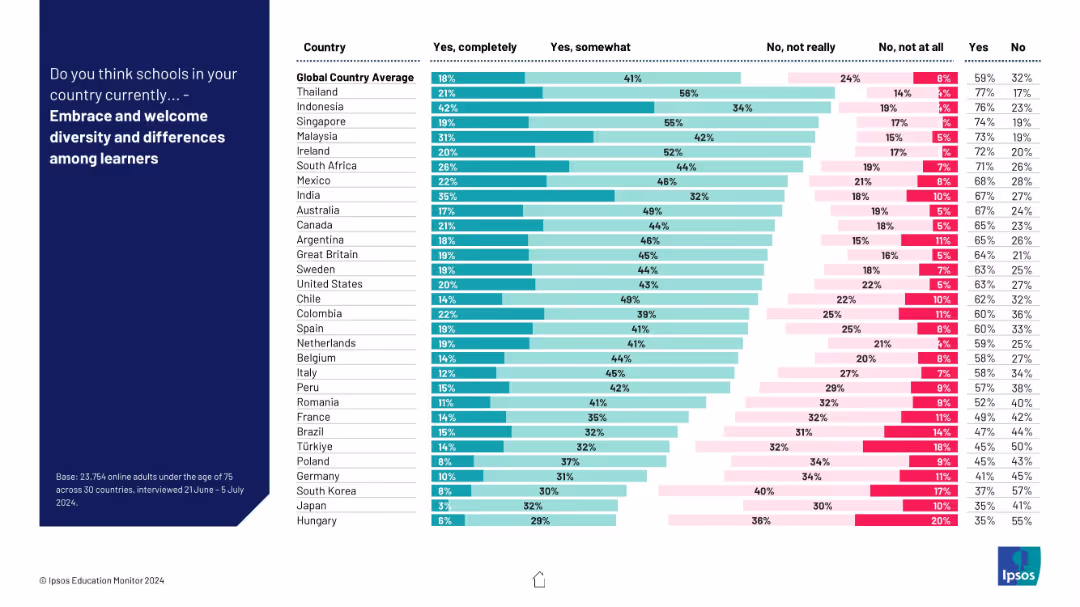
Horizontal stacked bar chart by country; categories range from “Yes completely” to “No, not at all”; teal and pink color coding.
Human Resources and Talent Management
Education & Training
This chart explores public perceptions of how well schools embrace diversity. There is substantial variation, but a general positive trend is seen in countries like Indonesia, Singapore, and Malaysia.
diversity, inclusion, schools, survey, global education, learner differences, perception, cultural context
false
Embrace and welcome diversity and differences among learnersIPSOS EDUCATION MONITOR 2024
Mixed Chart
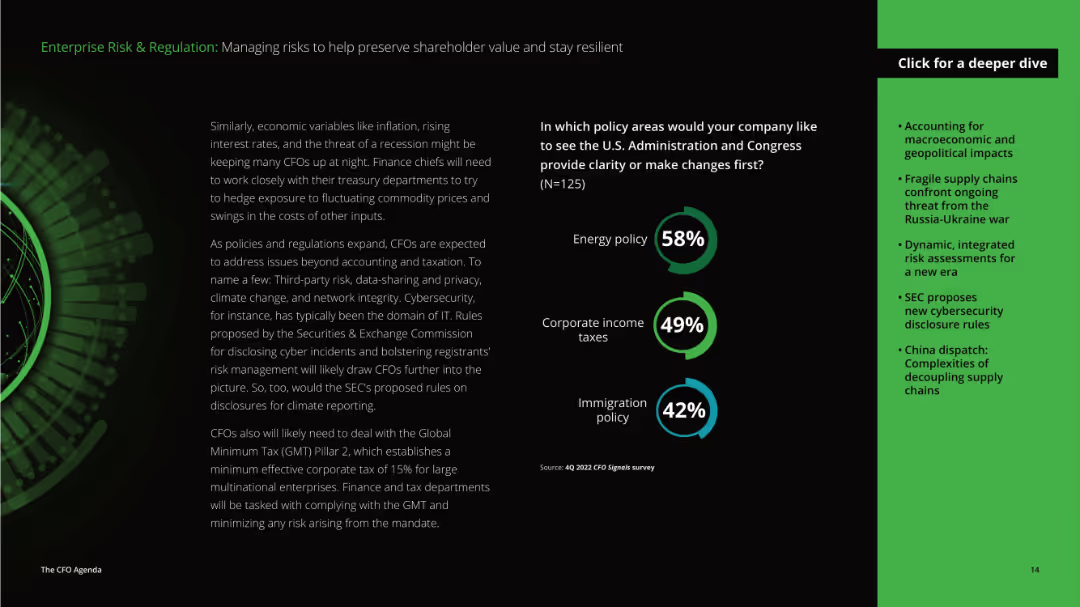
IPSOS
View slide
The slide has detailed text on the left discussing economic variables and policies affecting CFOs, and a column chart on the right showing policy areas needing clarity or changes.
Risk Assessment and Management
Professional Services
This slide focuses on managing risks and regulatory challenges, emphasizing the importance of clarity in energy policy, corporate income taxes, and immigration policy for CFOs to preserve shareholder value and resilience.
risk management, regulation, economic variables, policies, energy policy, corporate taxes, immigration policy, CFO, shareholder value, resilience
false
In which policy areas would your company like to see the U.S. Administration and Congress provide clarity or make changes first?The CFO Agenda 2023
Mixed Chart
Deloitte
View slide
Features tables and a timeline with financial data, alongside color-coded status labels for clarity on a blue and white theme.
Financial Performance
Financial Services
This slide examines the profit and loss contributions from legacy franchises and outlines the estimated timelines for market exits. It is a strategic resource for financial services professionals tracking the transition and financial impacts of legacy operations.
legacy franchises, P&L, timelines, market exit, strategic planning
false
Legacy Franchise: P&L Contribution And Estimated TimelinesEarnings Results Presentation Second Quarter 2023
Table
Citigroup
View slide
A bar chart depicts consumer expectations for BEV driving range, categorized by urban and sub-urban/rural responses, showing varying preferences.
Market Analysis and Trends
Transportation & Logistics
Discusses consumer expectations for battery electric vehicle (BEV) driving ranges, essential for understanding market needs and vehicle design in the automotive sector.
BEV, driving range, consumer expectations, urban, rural, market needs, vehicle design, automotive trends
false
Only one in four non-BEV intenders surveyed would consider a fully charged BEV with a driving range below 400 kms as a viable option for their next vehicle.2024 Global Automotive Consumer Study
Single Chart
Deloitte
1
...
Next
Load More
Hold On!
We are searching in our database
If nothing, comes up, please try different filters!
Create a FREE account to continue browsing
Receive Instant Access to 1,000+ slides from companies like McKinsey, Google, and Goldman Sachs
First Name
Last Name
Email
Password
I agree to all
Terms & Privacy Policy
Thank you! Your submission has been received!
Oops! Something went wrong while submitting the form.
Have an account?
Sign in
Column Chart
Heatmap
Chevron
Org Chart
Infographic
Callouts
Timeline
List
Graphic
Picture
Process Flow
Diagram
Paragraph
Map
Table
Framework
Subtitle
Takeaway Box
Icon
Other Chart
Radar Chart
Waterfall Chart
Mekko Chart
Pie Chart
Scatter Plot
Line Chart
Bar chart
Bullet points