My Account
My Slides
Search by Category
Templates
Leave Feedback
Login
Logout
Get Started
Browse all Slides
Browse all Slides
Create a FREE Account
Instant access to 1,000+ real slides from top companies like McKinsey, BCG, Goldman Sachs, Google and many more!
First Name
Last Name
Email
Password
I agree to all
Terms & Privacy Policy
Thank you! Your submission has been received!
Oops! Something went wrong while submitting the form.
Have an account?
Sign in
Instant access to the internet's best slides
Get access to 40+ advanced filters and more
Advanced Search and Filters
Access to
10,000+ slides
Access to Category Pages
Save/Bookmark Slides
PowerPoint Template Library (New)
Choose your plan
MONTHLY
$12/month
Billed every month, cancel anytime.
YEARLY
$9/month
Billed $108 annually, cancel anytime.
Checkout for $12/month
Checkout for $108/yr
Secured by Stripe | AES-256 bit encryption
📢 Ready to start building slides? Check out our new template library
view templates
Welcome,
Welcome
Upgrade to SlideStart
Pro
Instant access to 15,000+ slides
Show Featured Only
Checkbox 8
Companies
Mckinsey
Bain
BCG
EY
Deloitte
Accenture
PwC/Strategy&
JP Morgan
Goldman Sachs
Morgan Stanley
Citigroup
Deutsche Bank
Barclays
LEK
Kearney
Oliver Wyman
Booz Allen Hamilton
Gartner
IPSOS
Nielsen
Slide type
Header Horizontal
Framework
Vertical Flow
Single Chart
Single Chart
Text Only
Mixed Chart
Header Vertical
Graphic
Pillar
Multiple Chart
Agenda
Title
Table
Linear Flow
Upgrade to SlideStart
Pro
Instant access to 40+ advanced filters
Industry
Upgrade to SlideStart
Pro
Instant access to 40+ advanced filters
Technology
Healthcare
Financial Services
Consumer Goods
Energy & Utilities
Manufacturing
Retail
E-commerce
Logistics
Telecommunications
Real Estate
Professional Services
Education
Media
Entertainment
Hospitatlity
Tourism
Agriculture
Food Production
Government & Public Sector
Environmental
Sustainability
Use Case
Upgrade to SlideStart
Pro
Instant access to 40+ advanced filters
Sales and Business Development
Mergers and Acquisitions
Corporate Finance and Valuation
Performance Metrics and KPIs
Client Case Studies
Competitive Landscape
Product and Service Analysis
Customer and Market Segmentation
Organizational Structure
Human Resources and Talent Management
Industry Overview
Regulatory and Compliance
Risk Assessment and Management
Agriculture & Food Production
Hospitality and Tourism
Government
Environmental
Sustainability
Clear all
Thank you! Your submission has been received!
Oops! Something went wrong while submitting the form.
Show Featured Only
Checkbox 8
Companies
Mckinsey
Bain
BCG
EY
Deloitte
Accenture
PwC/Strategy&
JP Morgan
Goldman Sachs
Morgan Stanley
Citigroup
Deutsche Bank
Barclays
LEK
Kearney
Oliver Wyman
Booz Allen Hamilton
Gartner
IPSOS
Nielsen
Slide type
Text Only
Linear Flow
Vertical Flow
Single Chart
Header Horizontal
Mixed Chart
Header Vertical
Pillar
Multiple Chart
Graphic
Agenda
Title
Table
Framework
Industry
Technology
Healthcare
Financial Services
Consumer Goods
Energy & Utilities
Manufacturing
Retail
E-commerce
Logistics
Telecommunications
Real Estate
Professional Services
Education
Media
Entertainment
Hospitatlity
Tourism
Agriculture
Food Production
Government & Public Sector
Environmental
Sustainability
Use Case
Sales and Business Development
Mergers and Acquisitions
Corporate Finance and Valuation
Performance Metrics and KPIs
Client Case Studies
Competitive Landscape
Product and Service Analysis
Customer and Market Segmentation
Organizational Structure
Human Resources and Talent Management
Industry Overview
Regulatory and Compliance
Risk Assessment and Management
Agriculture & Food Production
Hospitality and Tourism
Government
Environmental
Sustainability
Clear all
Thank you! Your submission has been received!
Oops! Something went wrong while submitting the form.
Tag
View slide
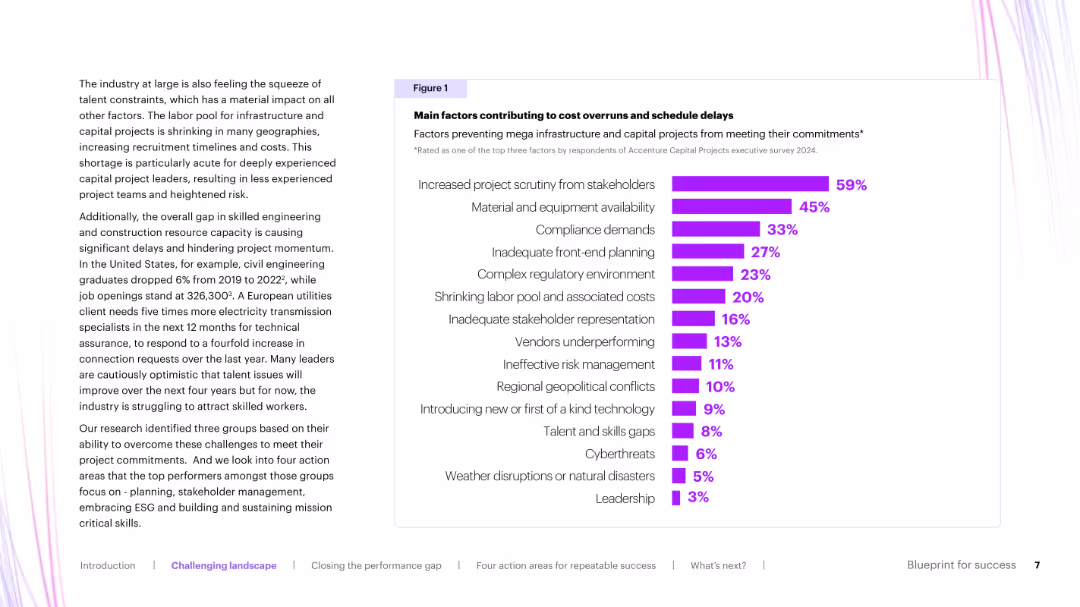
Split layout with left-aligned text and a right-side horizontal bar chart in purple showing ranked causes of delays in capital projects.
Risk Assessment and Management
Real Estate & Construction
The slide identifies and quantifies the primary factors that contribute to schedule delays and cost overruns in mega infrastructure projects. Top issues include stakeholder scrutiny, compliance, and material availability.
capital projects, risk factors, delays, overruns, stakeholder scrutiny
false
Main factors contributing to cost overruns and schedule delaysBlueprint for success
Mixed Chart
Accenture
View slide
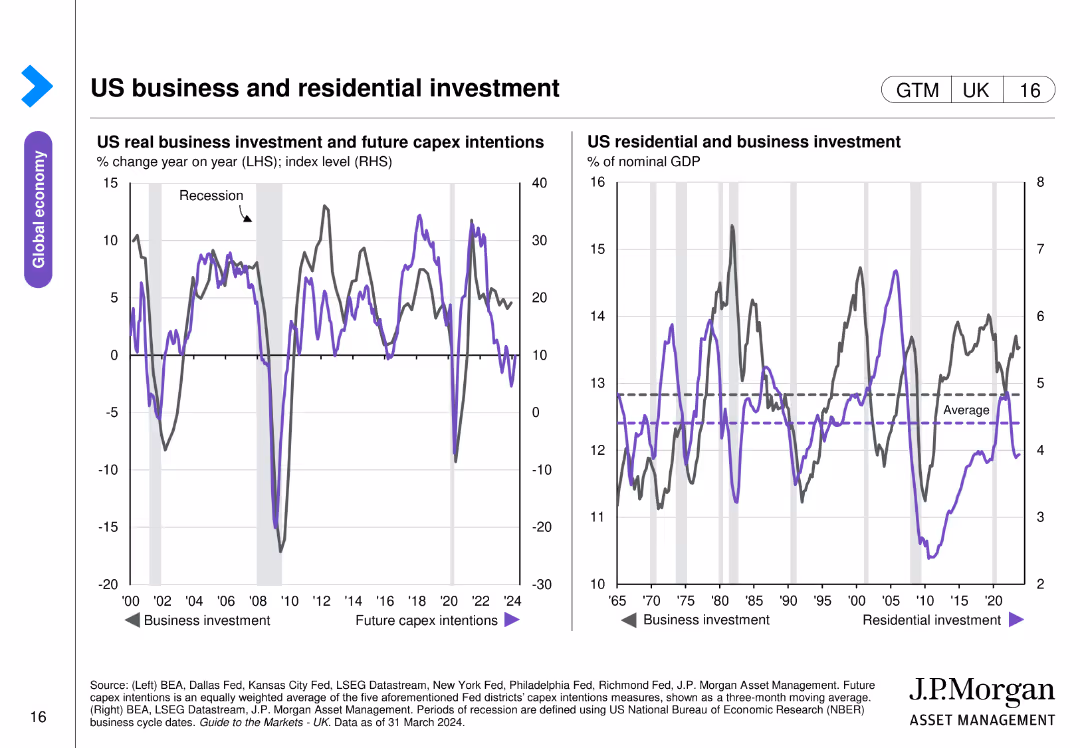
Two line charts side by side, showing trends in business investment and residential investment in the US. Uses color coding for different data series.
Market Analysis and Trends
Financial Services
Analyzes trends in US real business investment, future capex intentions, and residential investment over time, indicating periods of recession.
business, investment, residential, US, GDP
false
US business and residential investmentGuide to the Markets UK | Q2 2024
Multiple Chart
JP Morgan
View slide
Slide shows a complex graphical representation of impact distribution across various infrastructure elements like buildings, power plants, and air conditioning systems. The use of color coding helps distinguish between different sources of impact.
Product and Service Analysis
Environmental Services & Sustainability
This slide examines the specific environmental impacts attributed to various infrastructure components of Kiruna-1, focusing on mineral resource use and toxicity.
environmental, infrastructure, resource use, toxicity, satellite, color-coded graphs, sustainability, impact distribution
false
Lead acid batteries constitute a significant impact to mineral resource use, and the relatively “small” 15m antenna contributes less than 20% of impacts on the indicators of interest.Ground Station Life Cycle Assessment
Single Chart
Deloitte
View slide
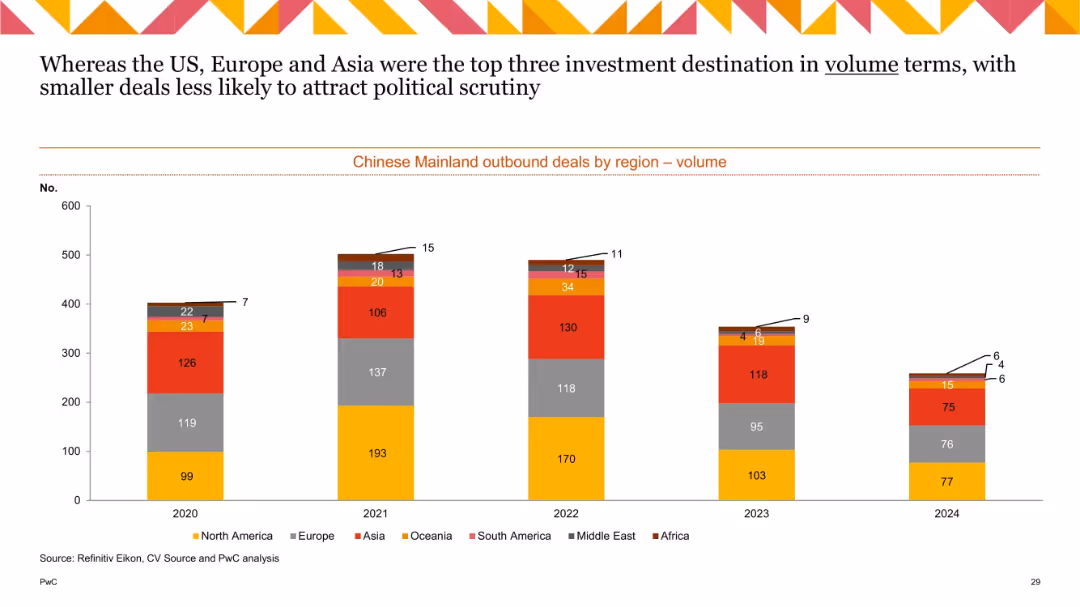
Bar chart with stacked color segments by region across five years (2020–2024); minimalist layout with vertical bars
Market Analysis and Trends
Financial Services
This slide presents a multi-year comparison of outbound investment deal volumes from China by region. It emphasizes that smaller deals draw less scrutiny, and US, Europe, and Asia dominate as destinations.
investment volume, outbound deals, regions, China, trends, 2020–2024, North America, Europe, Asia, PwC
false
Whereas the US, Europe and Asia were the top three investment in destination in volume termsChina M&A 2024 Review and Outlook
Single Chart
PwC/Strategy&
View slide
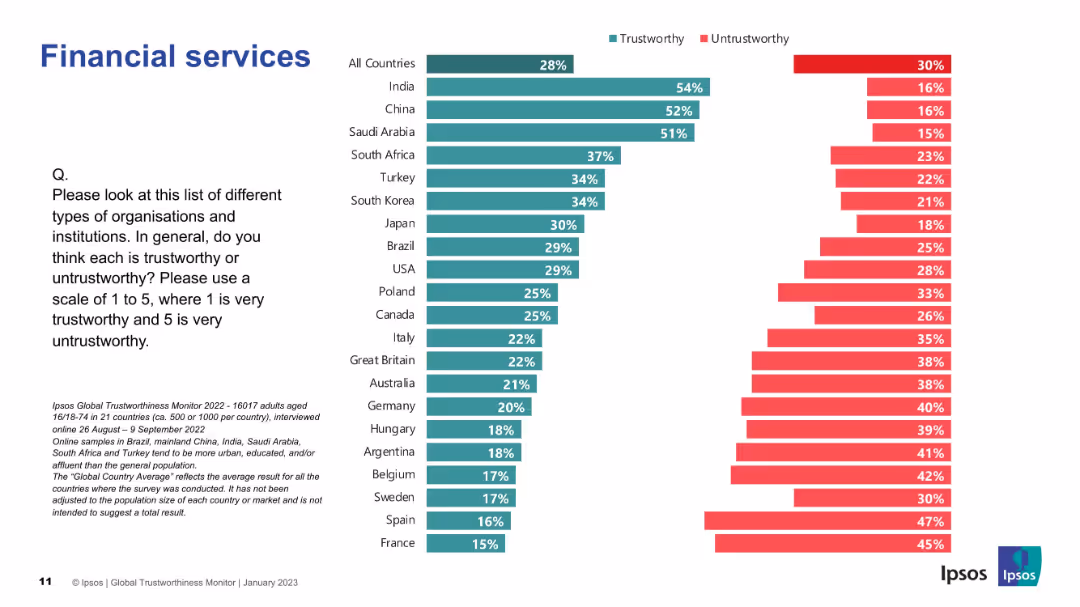
Bar chart with two-color bars (green for trustworthy, red for untrustworthy); countries ranked vertically; title on top left.
Market Analysis and Trends
Financial Services
The slide shows the perceived trustworthiness of financial services across 21 countries, with India, China, and Saudi Arabia ranking highest in trust.
trust, financial services, perception, Ipsos, global, trustworthiness, survey, countries, data, chart
false
Financial servicesIPSOS GLOBAL TRUSTWORTHINESS MONITOR January 2023
Mixed Chart
IPSOS
View slide
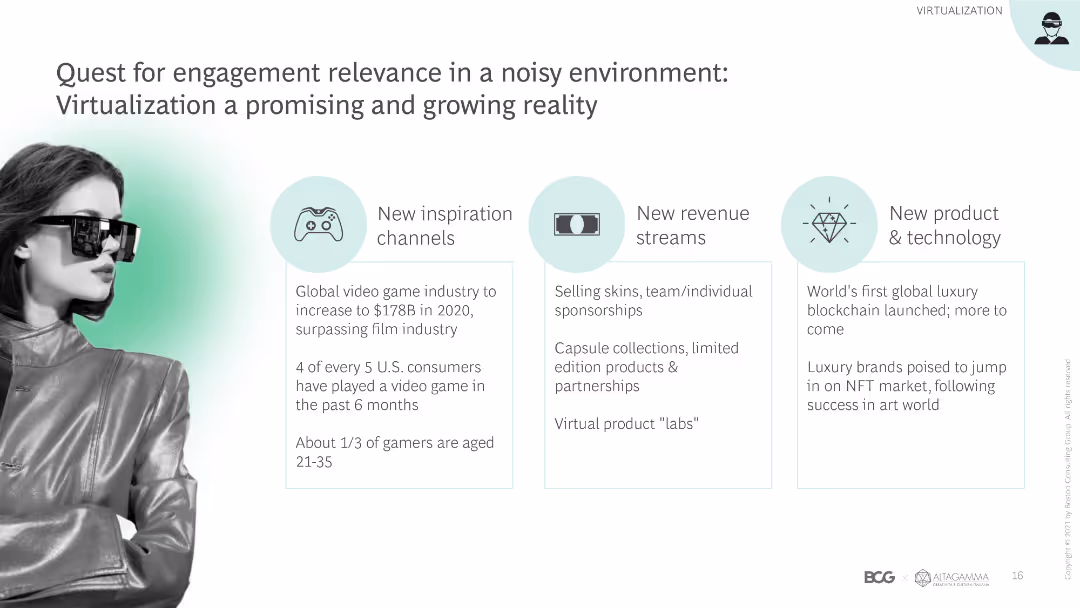
This slide has a content layout with sections on new inspiration channels, revenue streams, and products & technology, featuring relevant icons and brief text descriptions.
Technology and Digital Transformation
Retail & E-commerce
The slide explores the importance of engagement relevance through virtualization, highlighting new channels, revenue streams, and technological advancements in the luxury market.
Engagement relevance, virtualization, new channels, revenue streams, technology, luxury market, digital transformation, innovation, market trends
false
Quest for engagement relevance in a noisy environment: Virtualization a promising and growing realityTrue-Luxury Global Consumer Insights 8th Edition
Pillar
BCG
View slide
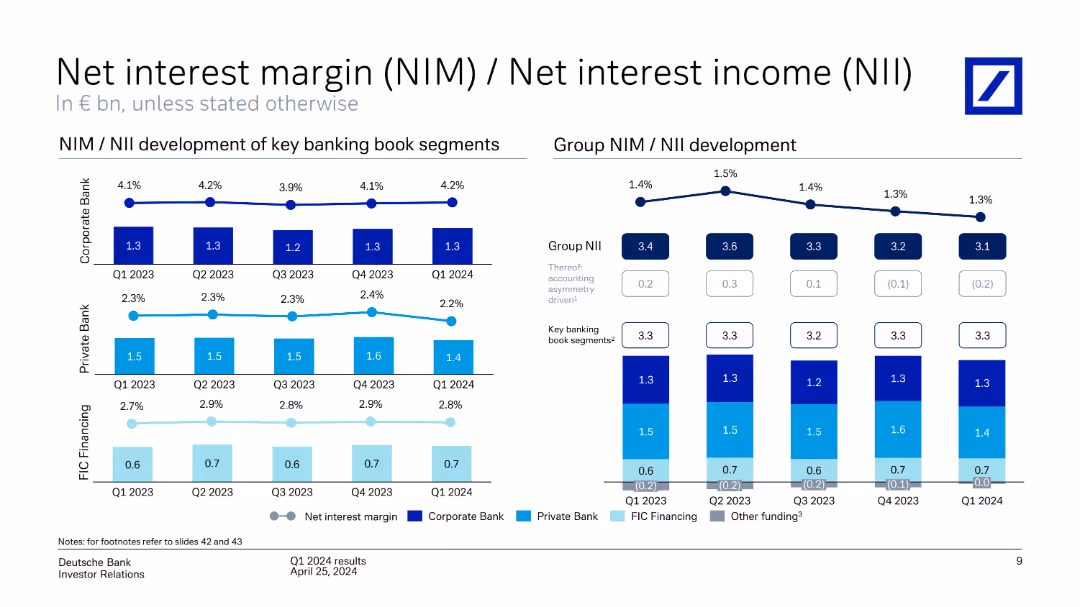
Contains multiple line charts and column charts showing NIM and NII development for key banking segments and overall group. The slide is detailed with several visual elements and annotations.
Financial Performance
Financial Services
The slide shows the development of NIM and NII for Deutsche Bank across key banking segments and the group, highlighting trends over different quarters.
Net interest margin, net interest income, banking segments, quarterly trends
false
Net interest margin (NIM) / Net interest income (NII) In € bn, unless stated otherwiseQ1 2024 results
Multiple Chart
Deutsche Bank
View slide
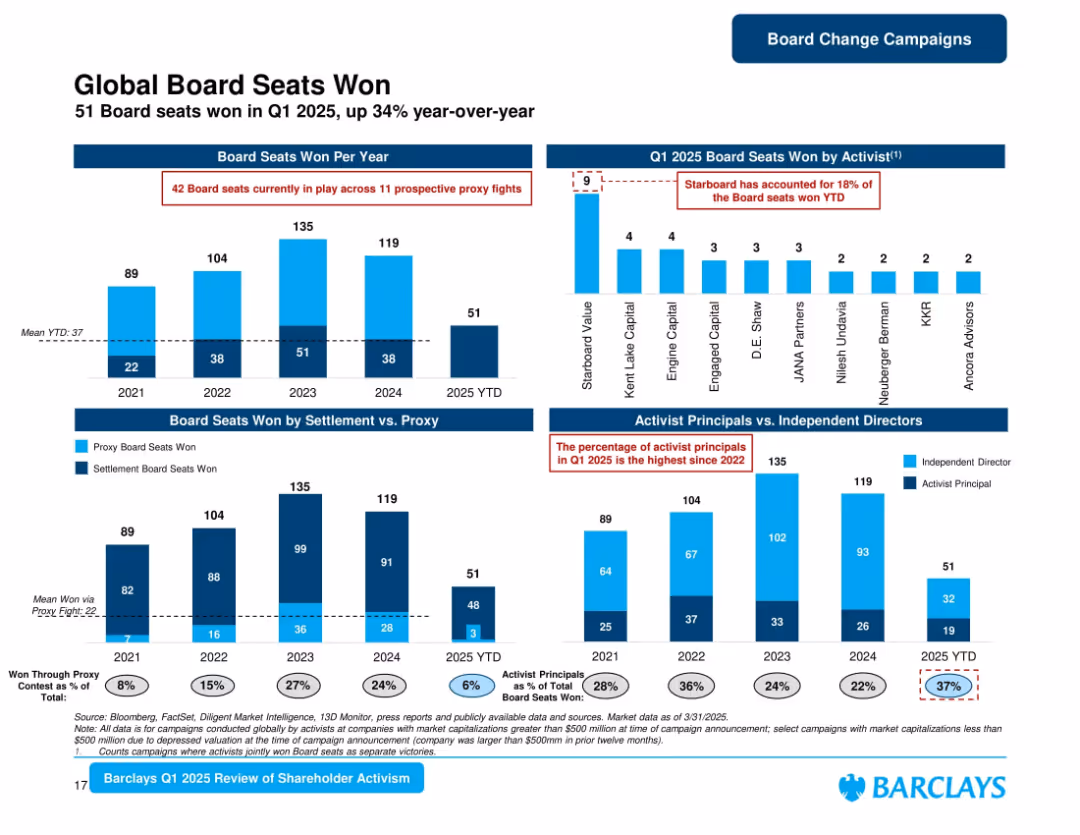
Bar charts split into annual and YTD views, proxy vs. settlement wins, and principal types. Logos and stats for top activists.
Organizational Structure and Change
Financial Services
Analyzes board seats won through shareholder activism, with a 34% increase in 2025 YTD. Starboard Value leads YTD wins. Includes detailed breakdowns of seats by win method and activist type (principal vs. independent director).
Board Seats, Proxy, Activists, Shareholder, Settlements, YTD, 2025, Governance
false
Global Board Seats WonBarclays Shareholder Advisory Group
Multiple Chart
Barclays
View slide
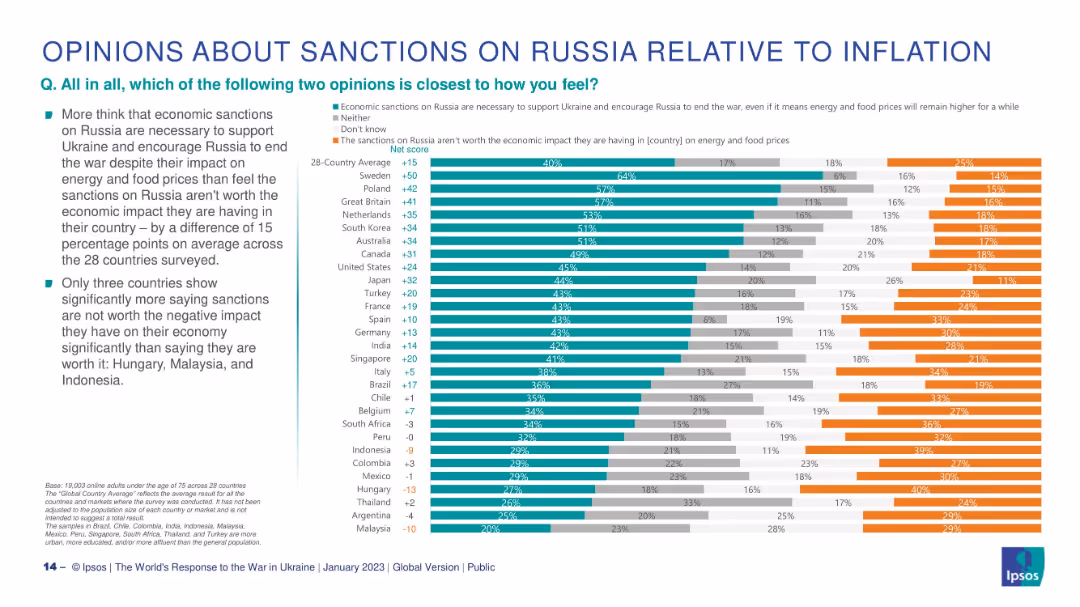
Horizontal stacked bar chart per country; green = pro-sanctions, orange = anti-sanctions, gray = neutral/don’t know.
Pricing Strategies
Government & Public Sector
This slide explores whether citizens think economic sanctions on Russia are justified despite inflation. It shows a 28-country net score comparison with only 3 countries (Hungary, Malaysia, Indonesia) predominantly opposing sanctions due to economic consequences.
sanctions, inflation, economic impact, Ukraine, public opinion, Ipsos, international response
false
OPINIONS ABOUT SANCTIONS ON RUSSIA RELATIVE TO INFLATIONTHE WORLD’S RESPONSE TO THE WAR IN UKRAINE
Mixed Chart
IPSOS
View slide
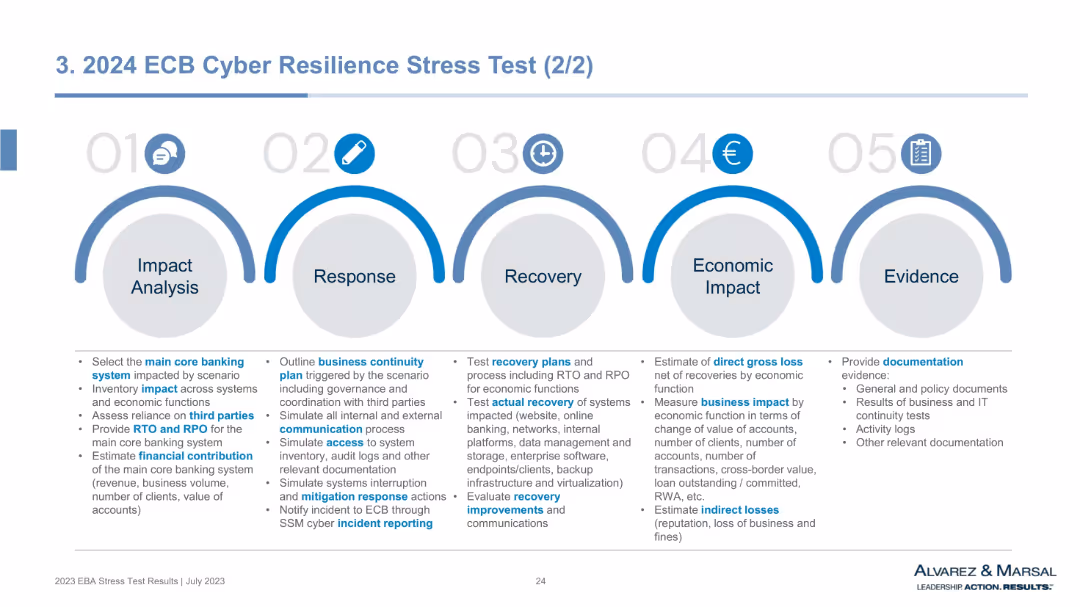
Horizontal infographic with 5 blue arc-shaped sections labeled 01–05 for stages from Impact Analysis to Evidence. Each section contains bullet-point lists.
Risk Assessment and Management
Financial Services
This slide outlines the framework for the ECB's cyber resilience stress test. It maps the response process across five steps—from identifying core banking system impacts to evaluating economic damage and providing audit evidence. The format emphasizes operational preparedness, continuity, recovery, and communication under cyberattack scenarios.
cyber resilience, ECB stress test, business continuity, recovery planning, impact analysis, cyber risk, documentation, RTO, RPO
false
3. 2024 ECB Cyber Resilience Stress Test (2/2)2023 EU Wide EBA Stress Test Our First Glance at Results
Pillar
Alvarez & Marsal
View slide
This slide has a three-column layout with icons at the top, text in the middle, and a blue color scheme. Each column has a bullet list. The slide title is at the top with a subtitle beneath.
Strategic Planning
Financial Services
The slide presents a three-pillar strategy for client services in securities. It includes technological investments, leveraging the corporate and investment bank's power, and delivering front-to-back integrated solutions. It suggests a comprehensive, connected, and automated approach to managing clients' investment portfolios.
securities, strategy, technology, investment, efficiency, automation, solutions, clients
false
Securities Services is uniquely positioned to help our clients achieve their goalsCORPORATE & INVESTMENT BANK 2020
Pillar
JP Morgan
View slide
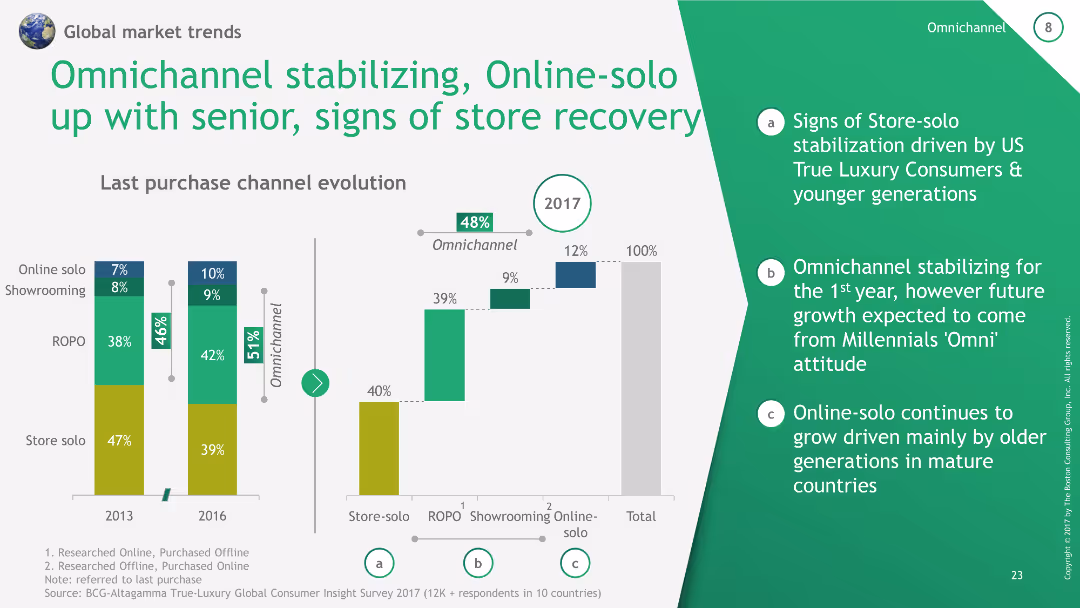
The slide contains a column chart showing last purchase channel evolution from 2013 to 2017, with annotations explaining the trends.
Market Analysis and Trends
Retail & E-commerce
The slide discusses the stabilization of omnichannel and the growth of online-solo purchases among seniors, highlighting store recovery signs.
Omnichannel, Online-solo, Store recovery, Trends, Retail
false
Omnichannel stabilizing, Online-solo up with senior, signs of store recovery2018 True-Luxury Global Consumer Insight
Multiple Chart
BCG
View slide
The slide includes a map of Asia with annotations and percentages indicating market positions and growth. Awards and key strengths are listed on the right side.
Market Analysis and Trends
Financial Services
This slide showcases the company's strong regional footprint in Asia, highlighting market positions, growth percentages, and recent awards, emphasizing strengths in APAC IBCM and PB.
Regional Growth, APAC, Market Position, Awards, Strengths
false
Broad-based regional footprint positions us for growthCredit Suisse Investor Day 2019 An effective approach: 3 case studies
Graphic
Credit Suisse
View slide
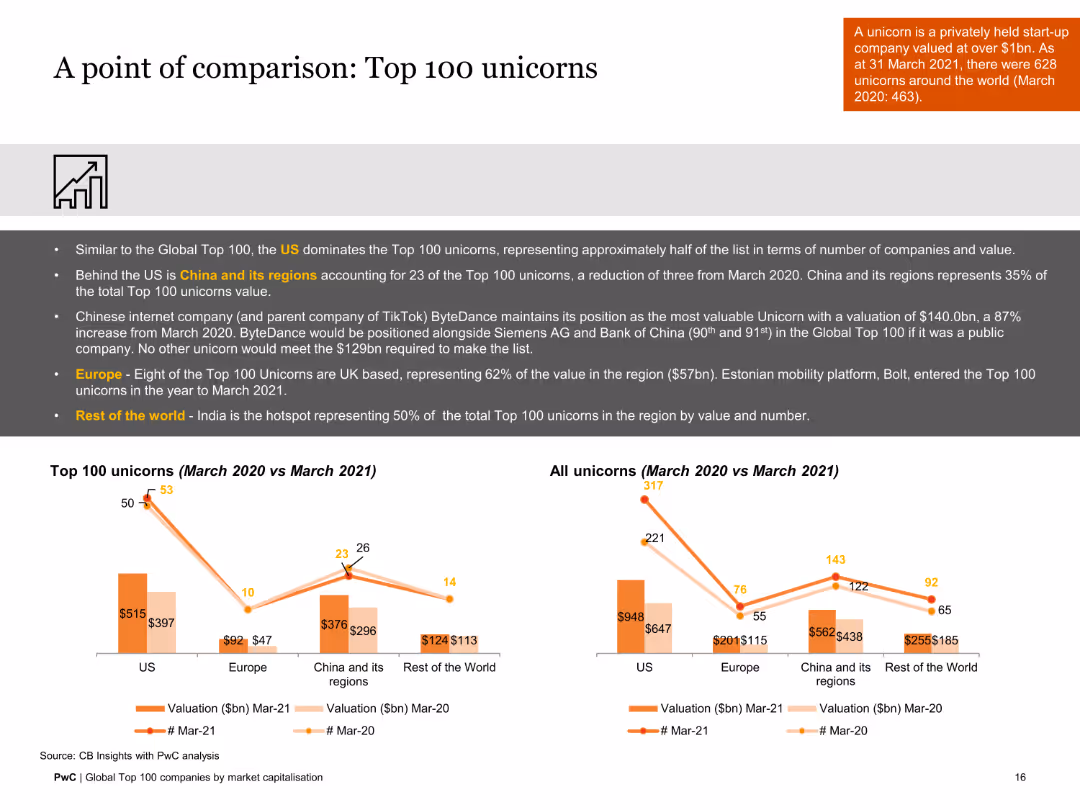
This slide includes a column chart and a comparative table showing data on the top 100 unicorns. The design is moderately complex with comparative visual elements.
Market Analysis and Trends
Financial Services
The slide compares the top 100 unicorns from March 2020 to March 2021, highlighting key changes in valuations and number of companies across different regions.
unicorns, valuation, comparative analysis, 2020-2021, regional data, financial trends
false
A point of comparison: Top 100 unicornsGlobal Top 100 companies by market capitalisation
Multiple Chart
PwC/Strategy&
View slide
Consists of a world map, key facts list, and a pie chart showing sales distribution. The slide is visually dense with a high level of detail.
Operational Efficiency
Technology & Software
Provides an overview of Clarion's global presence, focusing on sales by region and the distribution of its manufacturing and development centers, emphasizing the company's operational scope.
Clarion, global, sales, manufacturing, development, automotive
false
Clarion profileDeutsche Bank Global Auto Industry Conference
Mixed Chart
Deutsche Bank
View slide
The slide features a line chart showing the volume of raised investment in QT start-ups from 2001 to 2022, with a spike around 2022. Includes text highlighting $2.35B and 75% investment in quantum computing players.
Investment Analysis
Financial Services
This slide discusses the record high of QT start-up investments in 2022, which grew only 1% year-over-year, highlighting the dominance of quantum computing players in investment.
investment, quantum computing, start-ups, annual growth, financial trends
false
level of all-time, though it grew only 1% year over year.¹ McKinsey & Company Total annual QT start-up investment hit the highest level of all-time, though it grew 1 percent year over year.Quantum Technology Monitor
Mixed Chart
McKinsey
View slide
The slide features a column chart comparing lost time injury frequency rates (LTIFR) in the cement industry between Australia and France over several years. Bullet points discuss injury rate trends.
Risk Assessment and Management
Industrial & Manufacturing
It compares injury rates in the Australian cement industry with those in France, discussing factors contributing to the rates and the implications for safety practices and reporting transparency.
injury rates, cement industry, Australia, France, LTIFR, safety
false
Australian injury rates in the cement industry are similar to FranceInternational Comparison of Australia’s Freight and Supply Chain Performance Final Report - Cement
Mixed Chart
LEK
View slide
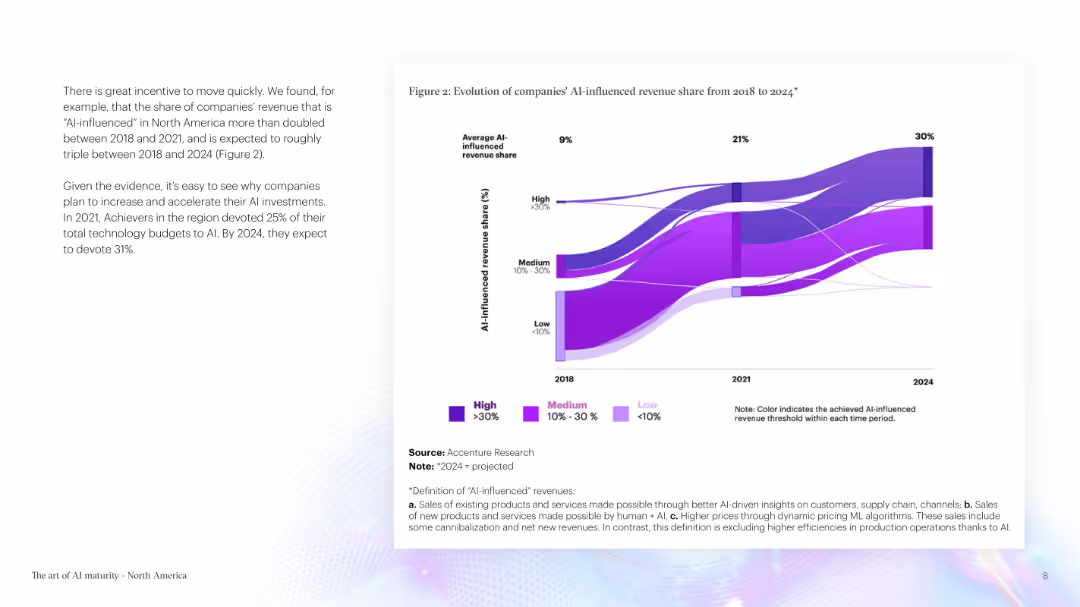
The slide includes text and a flow chart displaying the evolution of AI-influenced revenue share. The color scheme is purple and white.
Technology and Digital Transformation
Technology & Software
The slide highlights the increasing influence of AI on company revenue, presenting projected data on AI investments and their expected impact by 2024.
AI Revenue, AI Influence, Technology Investment, Projected Data, Revenue Growth, Technology
false
Figure 2: Evolution of companies' AI-influenced revenue share from 2018 to 2024*The art of AI maturity Advancing from practice to performance North America
Mixed Chart
Accenture
View slide
The slide includes multiple column charts and text blocks. The left side presents index scores by generation and work location, and the right side shows scores by sector.
Performance Metrics and KPIs
Professional Services
Provides index scores for remote work preferences by generation, work location, and sector, based on survey results. Highlights differences in remote readiness.
index scores, generation, work location, sector, survey
false
Index scores by generation, work location and sectorGlobal Employee Survey - Key findings and implications for ICMIF
Multiple Chart
EY
View slide
A line chart showing the difference between central bank policy rates and banks' average deposit rates in the Euro area and the UK over time, with commentary on the right.
Market Analysis and Trends
Financial Services
This slide explains the impact of central bank policy rate changes on bank deposit rates in Europe and the UK, highlighting implications for corporate cash balances and bank earnings.
Deposit pricing, central bank rates, Euro area, UK, bank earnings, corporate implications
false
European banks have been slow to pass on interest rate increases to their depositors, but this dynamic could now change as competition for deposits intensifiesMarch Macro Brief Financial fissures emerge
Mixed Chart
Accenture
View slide
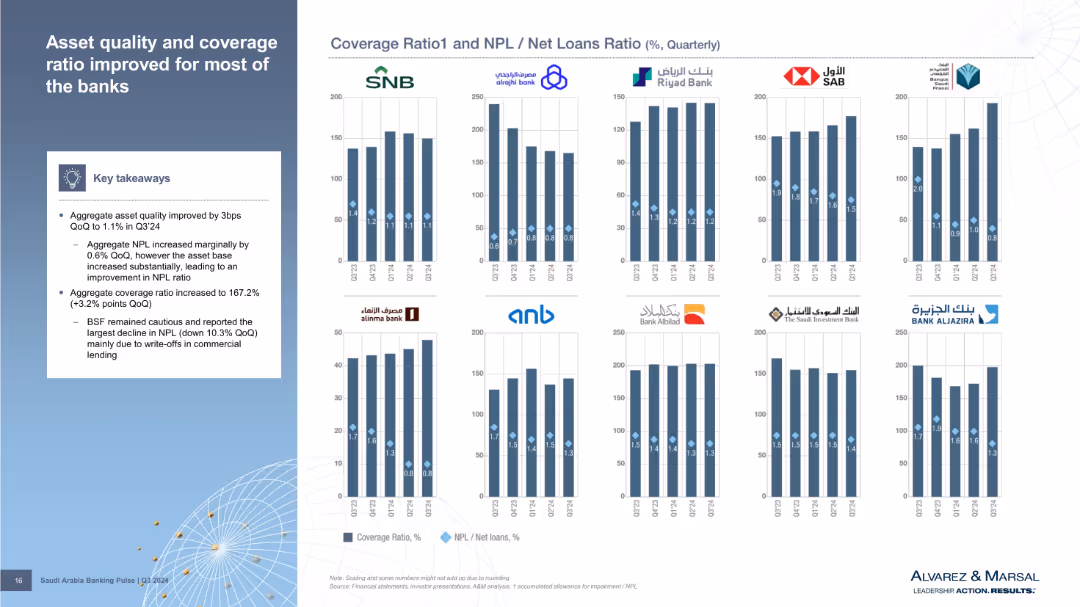
Grid of small bar charts per bank comparing Coverage Ratio and NPL/Net Loans across five quarters. Key takeaways box on the left with summary trends. Blue and diamond markers distinguish different metrics.
Risk Assessment and Management
Financial Services
Shows improved asset quality and higher coverage ratios among most banks. Although NPLs rose slightly, a larger asset base improved ratios. BSF saw the largest NPL drop due to commercial loan write-offs. Data is visually segmented per bank to show individual performance.
asset quality, NPL, coverage ratio, Q3 2024, bank performance, write-offs
false
Asset quality and coverage ratio improved for most of the banksSaudi Arabia Banking Pulse
Mixed Chart
Alvarez & Marsal
View slide
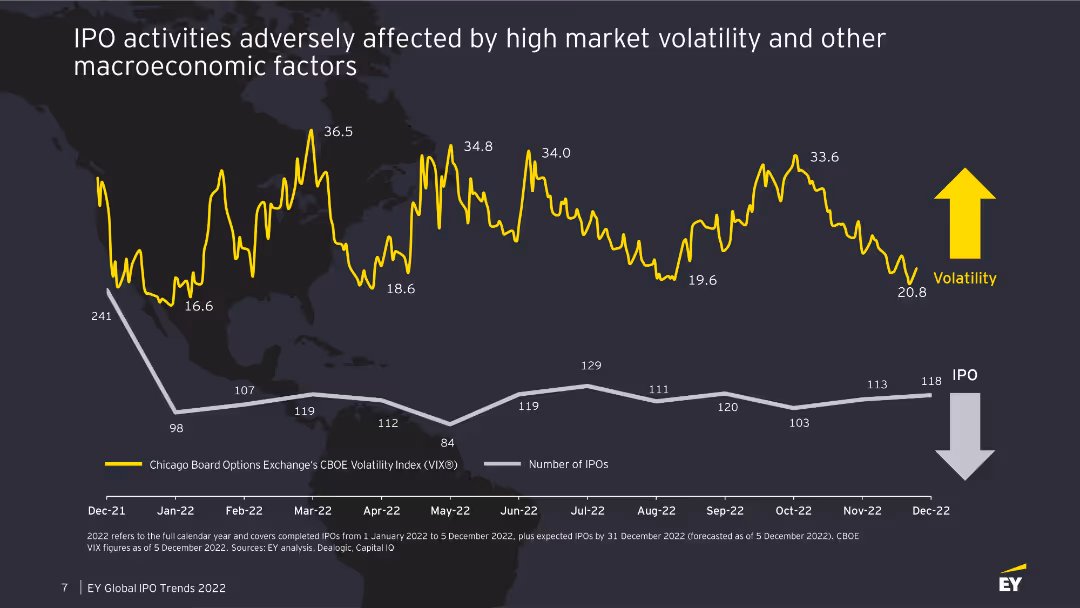
The slide features a line chart tracking the volatility index and the number of IPOs over time, with key data points highlighted. The background is a world map, adding a global context.
Market Analysis and Trends
Financial Services
The slide examines how high market volatility and macroeconomic factors have adversely affected IPO activities, showing a correlation between the volatility index and the number of IPOs from December 2021 to December 2022.
IPO, market volatility, VIX, macroeconomic factors
false
IPO activities adversely affected by high market volatility and other macroeconomic factorsHow can you prepare to seize the right moment?
Single Chart
EY
View slide
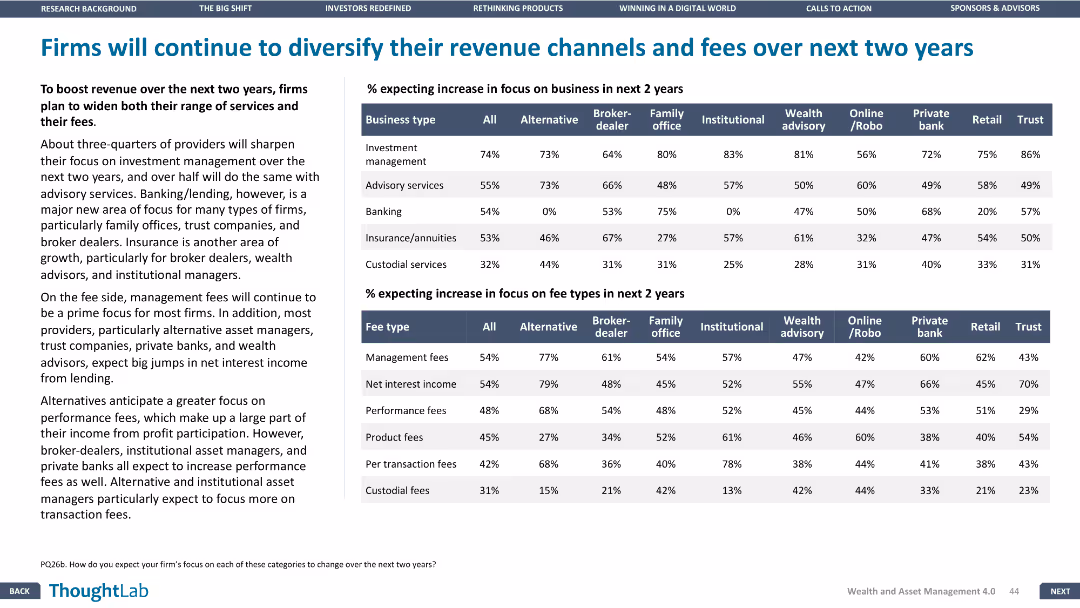
This slide features two tables and a column chart. The layout is dense and information-heavy, showing multiple data points about expected increases in business focus and fee types over the next two years.
Strategic Planning
Financial Services
The slide projects how firms plan to diversify their revenue channels and fees in the next two years, with data on the expected increase in focus on various business types and fee types.
Revenue diversification, fee types, future planning, business focus, projections
false
Firms will continue to diversify their revenue channels and fees over next two yearsWealth and asset management 4.0
Header Vertical
Deloitte
View slide
Features a column chart detailing SEA transport GMV ($B) with projected figures from 2019 to 2025 and accompanying CAGR. A blue and white design, text is arranged in bullet points next to yellow markers for easy reading.
Market Analysis and Trends
Transportation & Logistics
Discusses the post-pandemic recovery of the SEA transport sector, emphasizing the uptick in mobility and associated profitability, with strategic insights on overcoming market challenges and achieving growth.
SEA, transport, recovery, mobility, profitability, supply shortages, penetration, urbanization
false
Transport: Strong recovery expected as opportunities unlock but hurdles aplentye-Conomy SEA 2022 Through the waves, towards a sea of opportunity
Mixed Chart
Bain
View slide
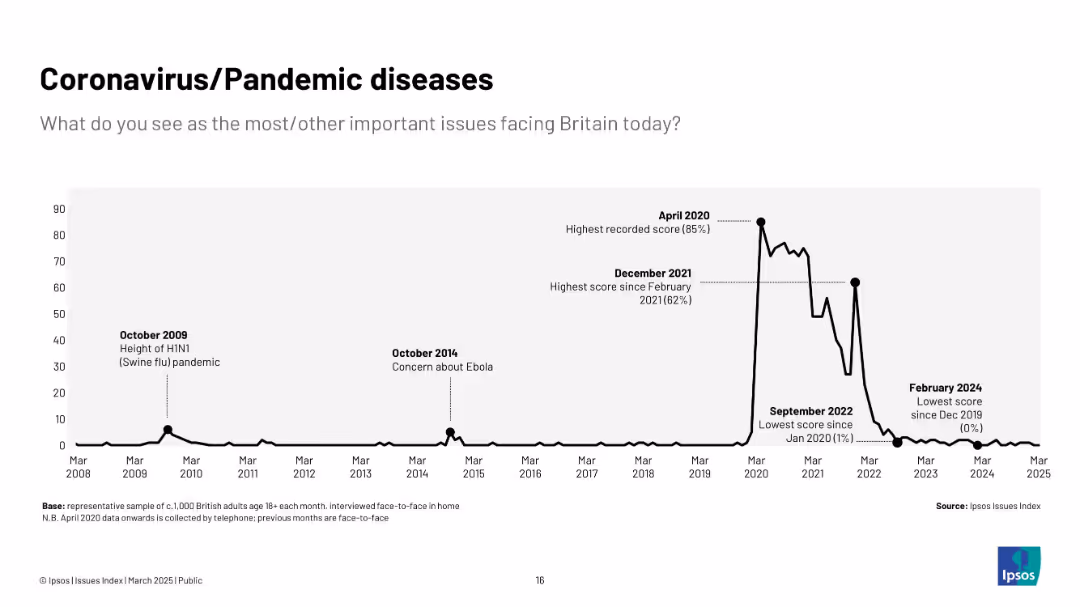
Black line graph with time axis from 2008 to 2025; notable spikes in 2009 (Swine flu) and 2020–2021.
Market Analysis and Trends
Healthcare & Pharmaceuticals
Tracks public concern over pandemics, with a dramatic peak in April 2020 during COVID-19. Smaller peaks correspond to Ebola and swine flu. Concern plummets post-2022.
COVID-19, pandemic, healthcare, public opinion, Ipsos, H1N1, Ebola, virus, disease, health concern
false
Coronavirus/Pandemic diseasesIpsos Issues Index March 2025
Single Chart
IPSOS
View slide
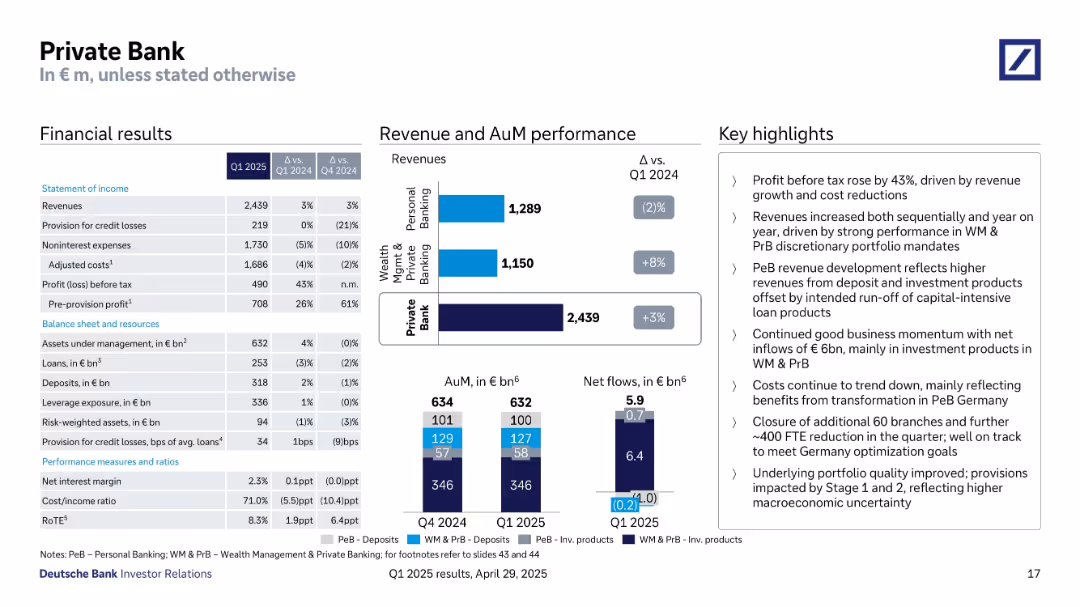
Three-column format: detailed financials, revenue & AuM breakdown with bar charts, and textual highlights.
Financial Performance
Financial Services
Q1 2025 Private Bank results include a 3% revenue increase, significant cost reductions, and a 43% rise in pre-tax profit. Revenue gains from Wealth Management offset Personal Banking declines. Net inflows of €6B indicate positive momentum.
private bank, wealth management, net inflows, revenue performance, loans, deposits, discretionary portfolio
false
Private BankQ1 2025 results
Multiple Chart
Deutsche Bank
View slide
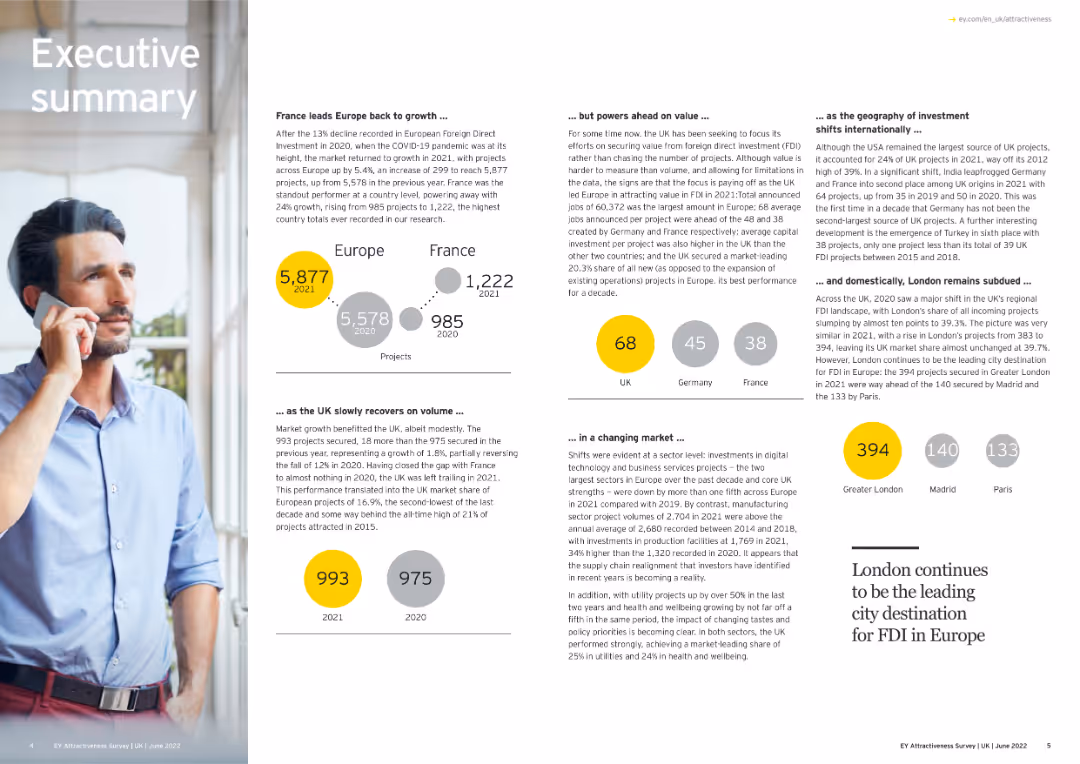
The slide combines text and visuals to summarize key points about Europe's FDI growth and shifts.
Strategic Planning
Financial Services
This executive summary slide provides an overview of FDI growth in Europe, highlighting France's lead, UK's recovery, and shifts in investor focus and market dynamics. It includes visual elements like project numbers and geographical investment distribution.
FDI, Europe, Investment Trends, Market Dynamics
false
France leads Europe back to growth …Adapting to a changed world EY Attractiveness Survey
Multiple Chart
EY
View slide
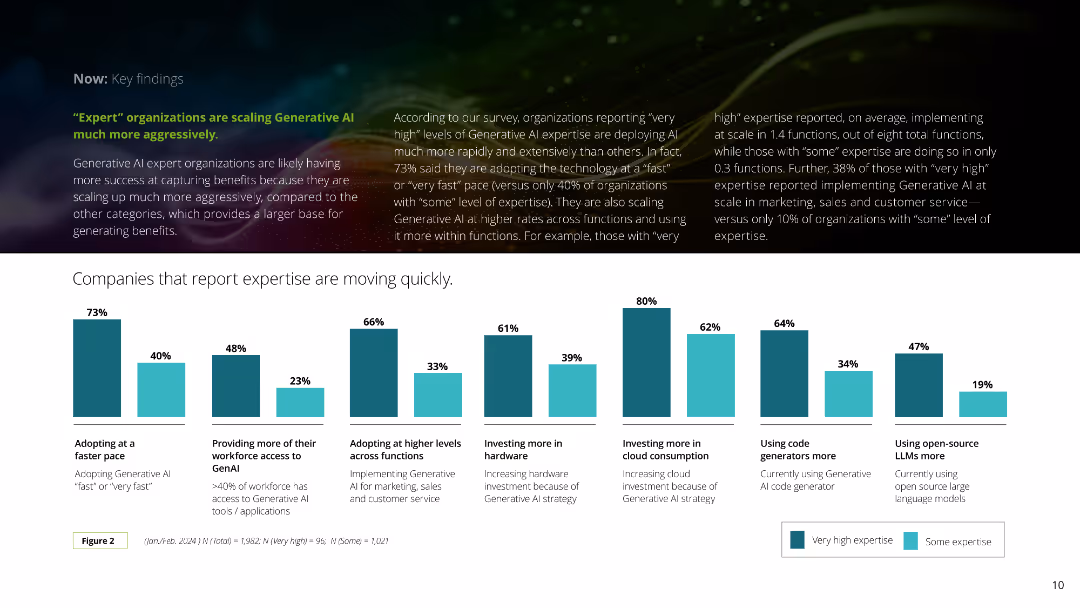
The slide displays a series of vertical bar charts comparing the pace of Generative AI adoption and the scope of its application across various business functions. The bars are in shades of blue and green for clarity.
Technology and Digital Transformation
Technology & Software
It highlights that organizations with high expertise in Generative AI are adopting and scaling the technology more rapidly and extensively, investing in various areas like hardware, cloud, and code generators.
AI adoption, scaling, expertise, investment, chart
false
“Expert” organizations are scaling Generative AI much more aggressively.Now decides next: Getting real about Generative AI
Mixed Chart
Deloitte
View slide
The slide features a vertical column chart illustrating the progress towards a 15% return on CET1 capital by 2026.
Financial Performance
Financial Services
This slide describes the target of achieving a 15% RoCET1, outlining steps and expected financial outcomes.
RoCET1, CET1 capital, financial targets, cost savings, capital returns
false
Working towards ~15% RoCET1Third quarter 2023 Fixed Income investor presentation
Mixed Chart
UBS
View slide
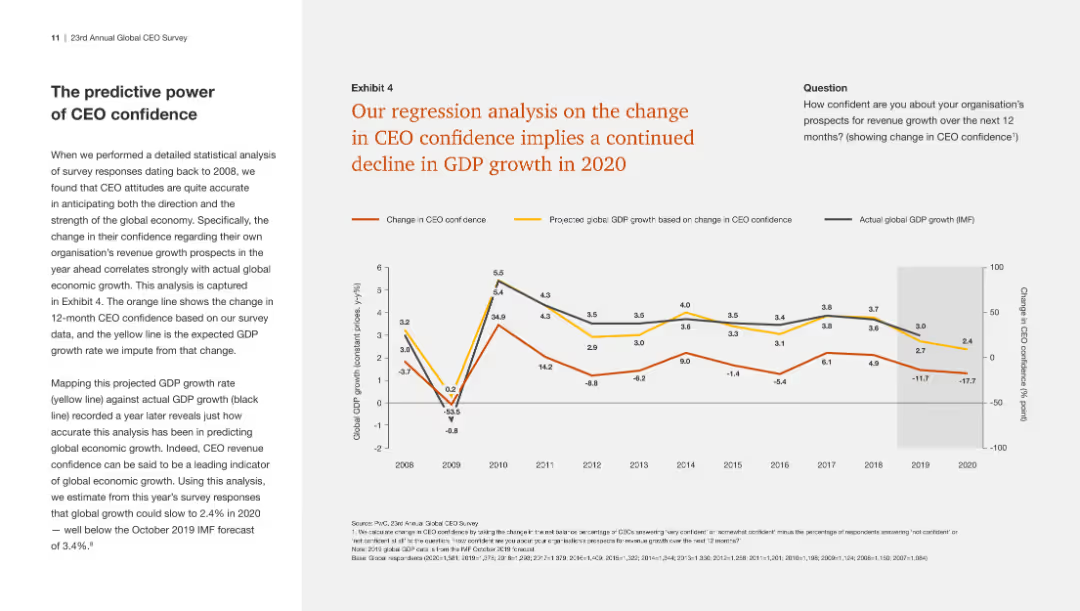
The slide has a line chart showing a regression analysis of CEO confidence and projected GDP growth, indicating a continued decline in GDP growth based on changing confidence.
Market Analysis and Trends
Financial Services
This slide presents a regression analysis showing a direct correlation between declining CEO confidence and projected GDP growth, predicting further economic downturn in 2020.
CEO confidence, GDP growth, regression analysis, economic projection
false
Exhibit 4 Our regression analysis on the change in CEO confidence implies a continued decline in GDP growth in 202023rd Annual Global CEO Survey Navigating the rising tide of uncertainty
Mixed Chart
PwC/Strategy&
View slide
This slide has a dark background with teal and white text. It features a donut chart showing the expected impact of climate change, and text discussing strategies.
Market Analysis and Trends
Environmental Services & Sustainability
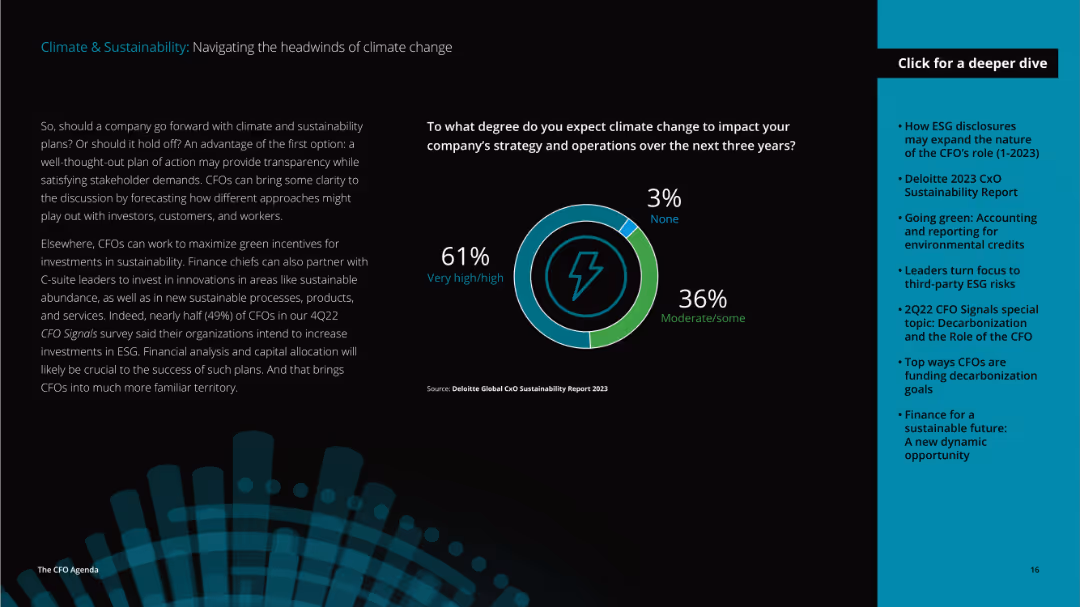
Explores if companies should proceed with climate and sustainability plans, highlights investment in ESG, and presents expected climate change impact on company strategies.
climate, sustainability, ESG, investment, strategy
false
To what degree do you expect climate change to impact your company’s strategy and operations over the next three years?The CFO Agenda 2023
Mixed Chart
Deloitte
View slide
Bar chart showing percentage agreement/disagreement by country that waiting times are too long; includes yearly trend data.
Risk Assessment and Management
Healthcare & Pharmaceuticals
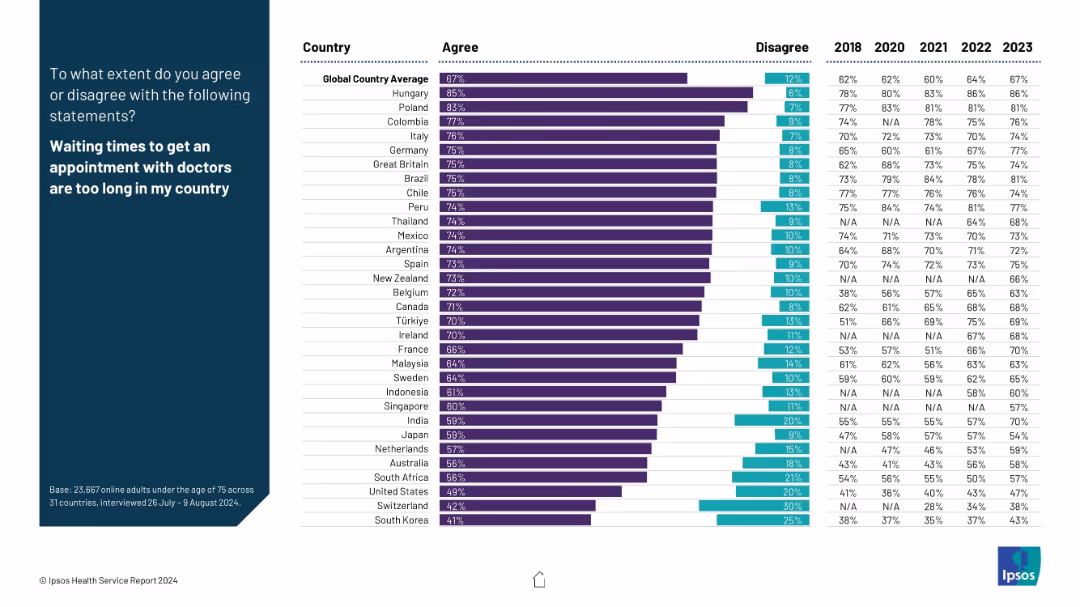
Respondents shared opinions on doctor appointment wait times. Hungary and Poland show the highest dissatisfaction. This data can signal accessibility issues and efficiency concerns in health systems worldwide.
healthcare access, waiting times, dissatisfaction, efficiency, survey
false
Long wait times for doctor appointmentsIPSOS HEALTH SERVICE REPORT 2024
Mixed Chart
IPSOS
View slide
Five sections each with an icon and text: Native tokens, Stablecoins & CBDCs, Governance tokens, NFTs, Tokenized real world assets. Icons represent various digital assets.
Product and Service Analysis
Financial Services
Describes five types of digital assets issued on blockchains: native tokens, stablecoins, governance tokens, NFTs, and tokenized real world assets. For product categorization in blockchain services.
Digital Assets, Blockchain, NFTs, Stablecoins, Governance, Tokenization, Real World Assets
false
Five types of digital assets can be issued on a blockchainBlockchain and Digital Assets
Table
McKinsey
View slide
The slide shows a timeline of newspaper revenue from 2003 to 2019 in Western Europe, with stacked column charts depicting revenue sources such as print and online. The decline in total revenue is clearly marked, showing a significant reduction over the years.
Industry Overview
Media & Entertainment
Analyzes the decline in newspaper revenues in Western Europe, focusing on changes in revenue sources such as print and online advertising. This information is critical for understanding the shifting landscape of the media industry and could influence strategic decisions in media management and business model adaptation.
media trends, revenue decline, print advertising, online growth, market analysis
false
Western European newspaper revenues have declined significantly over the last two decadesWestern Europe News Media Landscape Trends
Mixed Chart
Accenture
View slide
Column charts showing top sectors by value and number of deals for 2020-2022.
Market Analysis and Trends
Financial Services
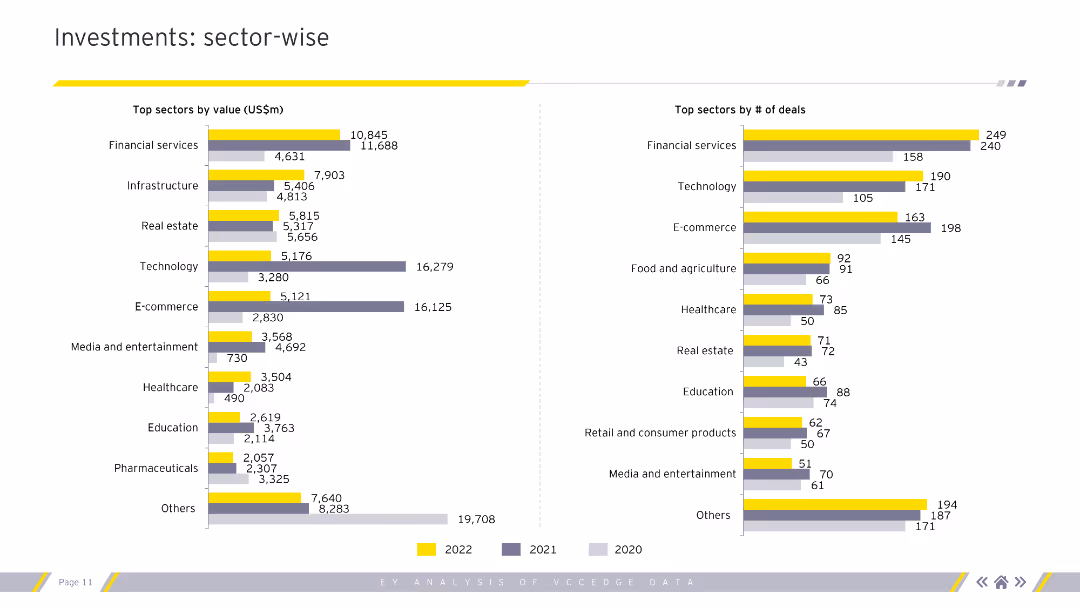
Sector-wise analysis of investments by value and number of deals, highlighting top-performing sectors.
sectors, investments, value, deals, analysis
false
Investments: sector-wise Top sectors by value (US$m)Is private equity rewriting what value means? Explore the emergence of NextWaveprivate equity and its impact on the economy and society
Multiple Chart
EY
View slide
The slide features two scatter plots showing asset class returns after rate hikes and rate cuts, segmented by different periods.
Market Analysis and Trends
Financial Services
The slide analyzes the impact of policy rate cycles on various asset classes, comparing returns following rate hikes and rate cuts across different periods.
policy rates, market performance, rate hikes, rate cuts, asset class returns
false
Policy rate cycles and market performanceGuide to the Markets Asia | 2Q 2024
Multiple Chart
JP Morgan
View slide
Features concentric pie charts detailing the equity and CIE portfolios, with additional charts breaking down the data by geography and sector.
Investment Analysis
Financial Services
The slide presents the equity balance sheet for asset management, showcasing the distribution of investments by type, region, and sector. It's valuable for reviewing asset allocations and identifying trends in private equity investments.
Asset Management, Equity Balance, Private Equity, Real Estate, TMT, Healthcare, Consumer, Financials, Geography, Vintage, Sector Distribution
false
Asset Price: Asset Management Equity Balance SheetFixed Income Investor Presentation
Multiple Chart
Goldman Sachs
View slide
The slide features a pie chart showing exposure by type within the commercial real estate sector and a bar chart on customer loans.
Risk Assessment and Management
Real Estate & Construction
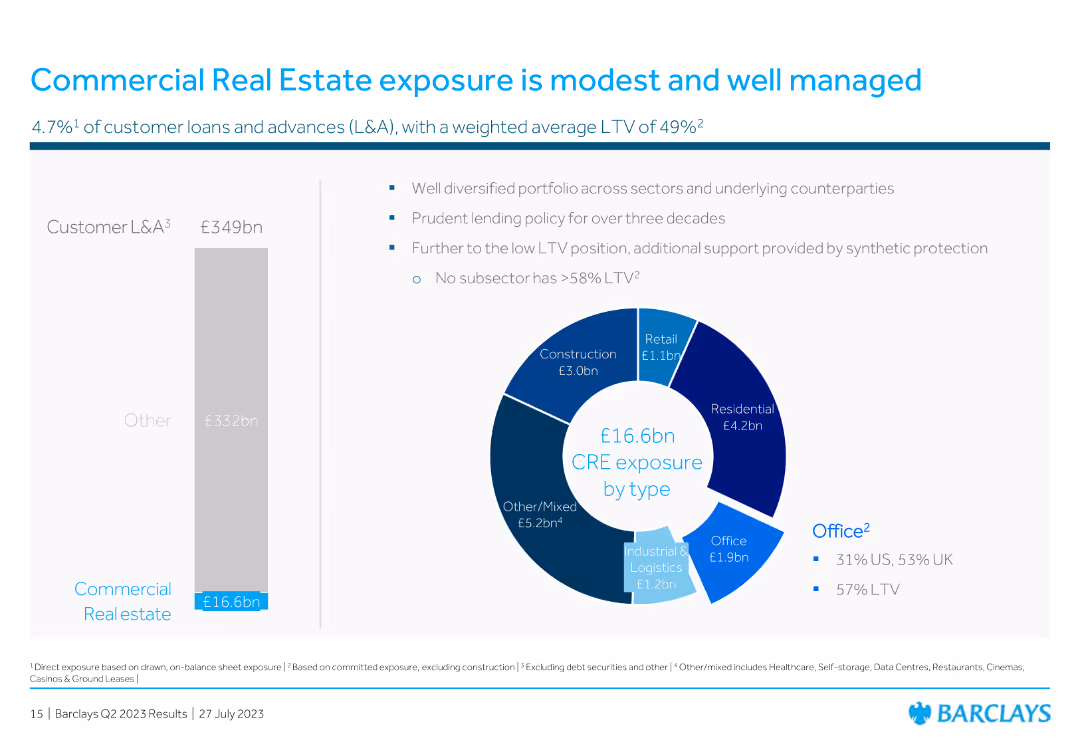
This slide details the exposure to commercial real estate, demonstrating a modest and well-managed portfolio with specific breakdowns by property type and average LTV.
real estate, commercial, exposure, loans, LTV, portfolio, financial, pie chart, bar chart, management
false
Commercial Real Estate exposure is modest and well managedBarclays PLC Q2 2023 Results Presentation
Multiple Chart
Barclays
View slide
Dual pie chart-style graphics with brief explanations; simple layout with bold percentage visuals; header emphasizes future expectations.
Investment Analysis
Artificial Intelligence
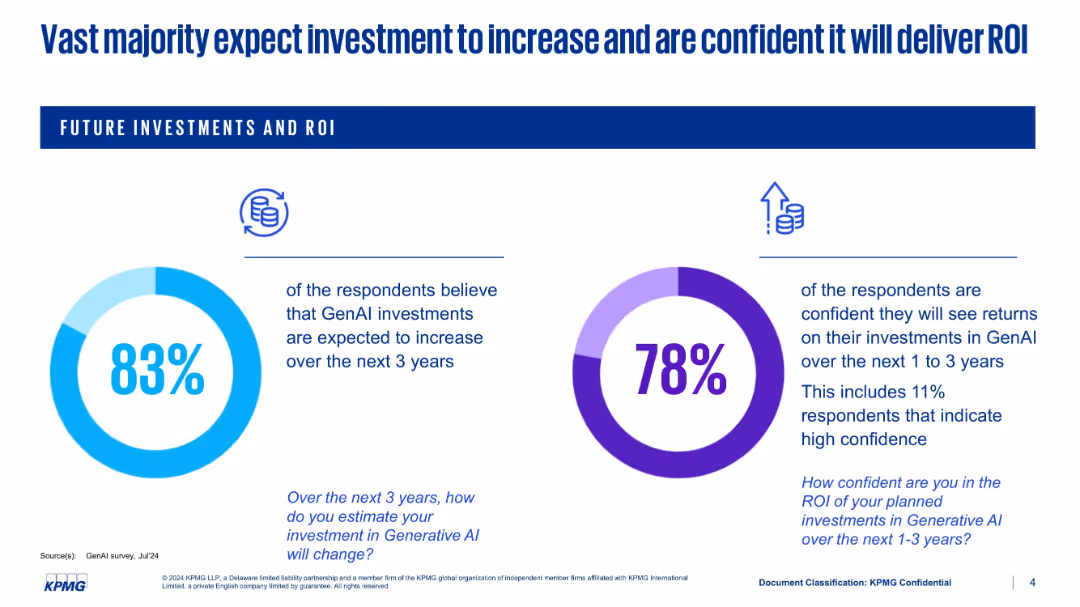
Presents optimism surrounding GenAI investments. 83% believe investments will increase over 3 years; 78% are confident in achieving ROI. Shows growing strategic confidence in the value proposition of GenAI amid rising enterprise focus.
GenAI investment, ROI, future planning, strategic confidence, AI return, tech funding, survey results
false
Vast majority expect investment to increase and are confident it will deliver ROIGenAI Survey –2024 Key insights
Single Chart
KPMG
View slide
Similar split layout as 19061. Bar chart ranks countries by support for increasing government spending on poverty and inequality.
Market Analysis and Trends
Government & Public Sector
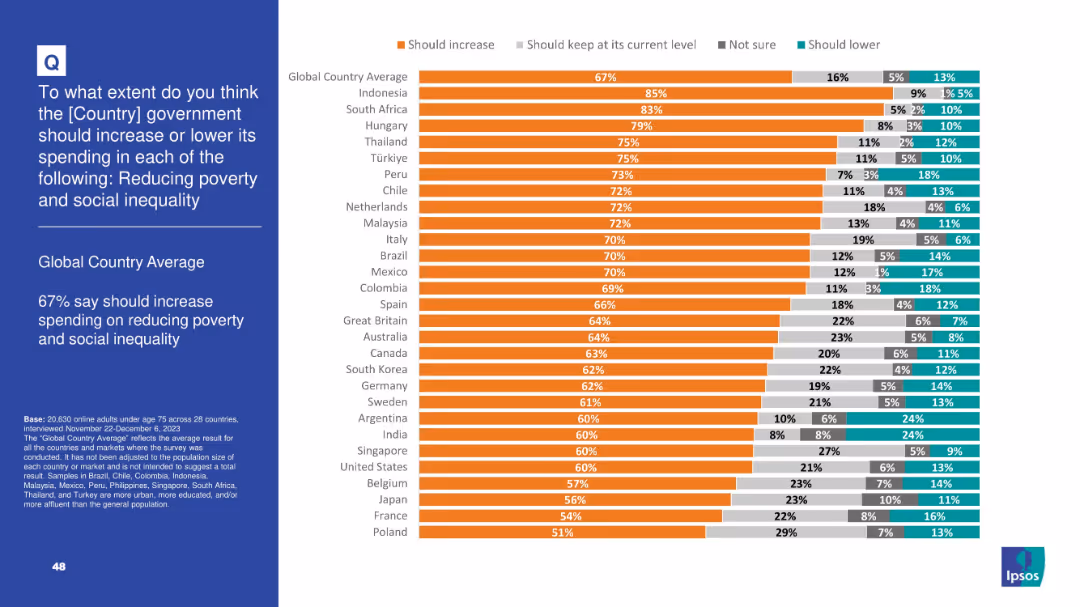
This slide presents survey results from 28 countries regarding support for government spending to reduce poverty and social inequality. Globally, 67% support more spending. The chart illustrates national variations in opinion.
inequality, poverty, public spending, survey, country ranking, economic policy, Ipsos, social policy, bar chart, global attitudes
false
Reducing Poverty and InequalityIPSOS POPULISM SURVEY
Mixed Chart
IPSOS
View slide
The slide features a column chart with horizontal bars indicating working capital change in various industries from 2013 to 2017. The bars are color-coded to show improving and deteriorating metrics. Icons representing different industries are aligned on the left of the chart.
Operational Efficiency
Industrial & Manufacturing
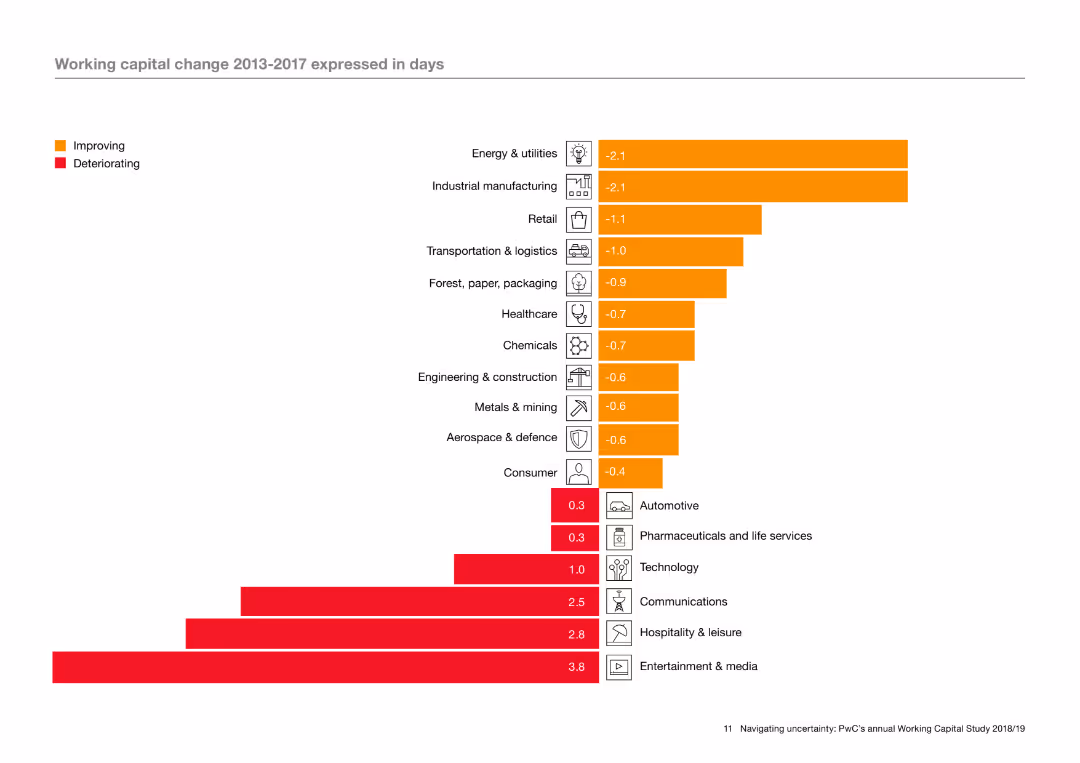
The slide analyzes working capital changes across different industries over a five-year period, using a column chart to illustrate which industries have seen improvements or deteriorations. The analysis highlights trends in operational efficiency within these sectors.
Working capital, operational efficiency, industry trends, improvement, deterioration, column chart
false
Working capital change 2013-2017 expressed in daysNavigating uncertainty: PwC’s annual global Working Capital Study
Single Chart
PwC/Strategy&
View slide
Slide with split design, left side features a bold percentage number and right side pie charts, minimal text, strong contrasting colors (green, purple), clear fonts.
Human Resources and Talent Management
Technology & Software
Discusses the influence of AI on job security and skills enhancement, highlighting differing perceptions among employees and leaders.
AI, jobs, upskilling, workforce, technology
false
36% of respondents think that their job is likely to be eliminated by AIAI at Work: What People Are Saying
Multiple Chart
BCG
View slide
Bar charts of procedure volume and installed base; global clearance timeline
Product and Service Analysis
Healthcare & Pharmaceuticals
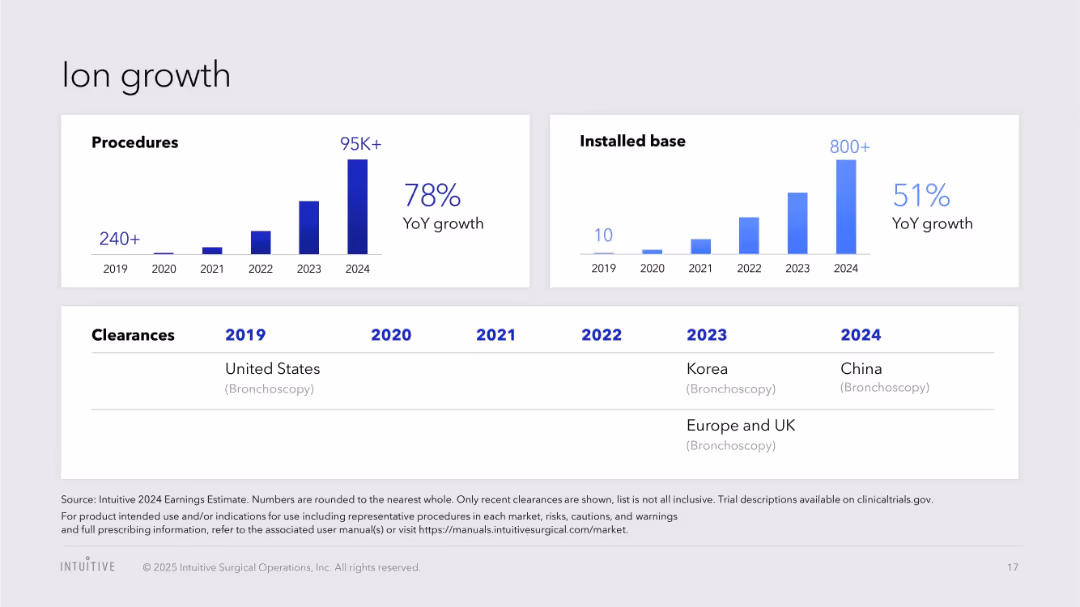
Demonstrates rapid growth of Ion system adoption with rising procedures and installations, highlighting international clearances since 2019.
Ion, bronchoscopy, system growth, global market, installations, clearances, robotic surgery
false
Ion growthJ.P. Morgan Healthcare Conference 2025
Multiple Chart
JP Morgan
View slide
A complex visual with text blocks and a large pie chart detailing the distribution of investments in resiliency across sectors like automation and digitization.
Strategic Planning
Industrial & Manufacturing
The slide provides an analysis of the overall investment strategy by companies to enhance resilience, highlighting how funds are allocated across various activities such as resourcing, industrial automation, and digitization.
investment, strategy, resilience, automation, business analysis
false
Figure 8: Companies are enhancing their resilience by investing in relocation, automation and digitization.Resiliency in the making
Mixed Chart
Accenture
View slide
Map of the United States showcasing the distribution of solar, wind, and geothermal projects with corresponding icons, plus a case study with text on the right.
Market Analysis and Trends
Energy & Utilities
This slide features a geographic overview and case study on JPMorgan Chase’s renewable energy projects, useful for discussions on sustainability and clean energy initiatives.
renewable energy, sustainability, solar, wind, geothermal, JPMorgan Chase, clean energy, geography, case study
false
Geography of Solar, Wind and Geothermal Projects2021 ENVIRONMENTAL SOCIAL & GOVERNANCE REPORT
Boxed
JP Morgan
View slide
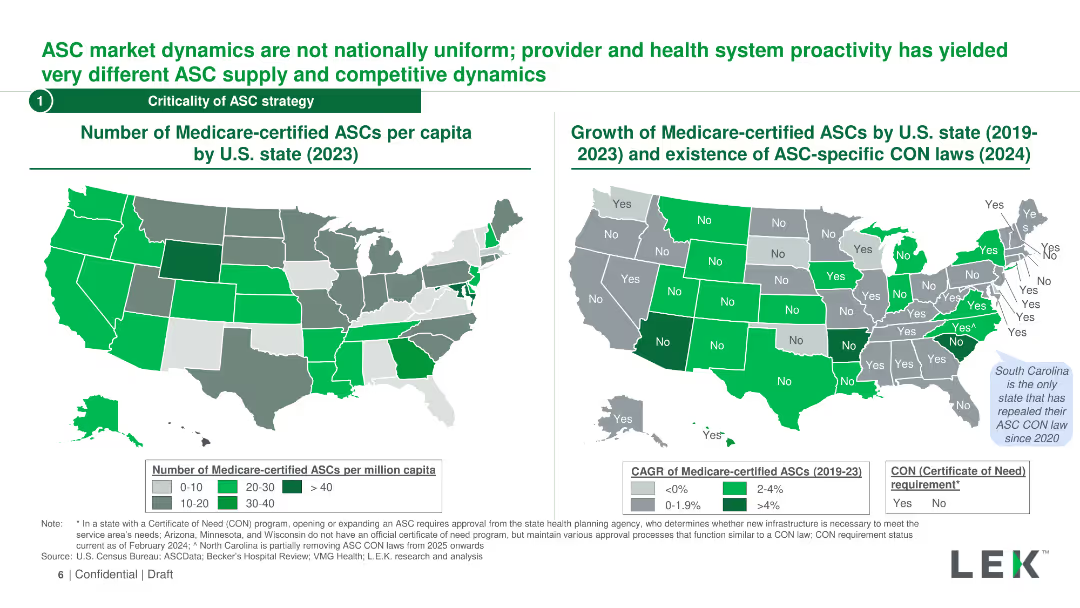
The slide displays two maps of the US, one showing the number of Medicare-certified ASCs per capita by state, and the other showing growth and CON laws from 2019-2023.
Market Analysis and Trends
Healthcare & Pharmaceuticals
This slide explores the geographic dynamics of the ASC market in the US, including the number of Medicare-certified ASCs per capita and the impact of CON laws on growth.
ASC market dynamics, Medicare, certified ASCs, CON laws, state comparisons
false
ASC market dynamics are not nationally uniform; provider and health system proactivity has yielded very different ASC supply and competitive dynamicsL.E.K.’s 2024 ASC Insights Study Key takeaways for provider organizations
Graphic
LEK
View slide
This slide features a series of column charts against a blue and white background, illustrating the steep growth projections for digital financial services in the Philippines across four categories: digital payments, digital lending, digital insurance, and digital wealth. The layout is clean, with each category distinctly separated and annotated to show the projected growth rate from 2021 to 2030.
Investment Analysis
Financial Services
The slide outlines the projections for steep growth in digital financial services in the Philippines, indicating significant opportunities for investment and development within digital payments, lending, insurance, and wealth sectors. It is intended for financial service professionals, investors, and market analysts to gauge the potential for expansion in the Philippines' digital finance sector.
DFS, Philippines, Digital Payments, Lending, Insurance, Wealth, Growth, Projections, Investment, Analysis
false
Philippines Steep DFS growth projected to continue from a low basee-Conomy SEA 2023 report: Philippines
Multiple Chart
Bain
View slide
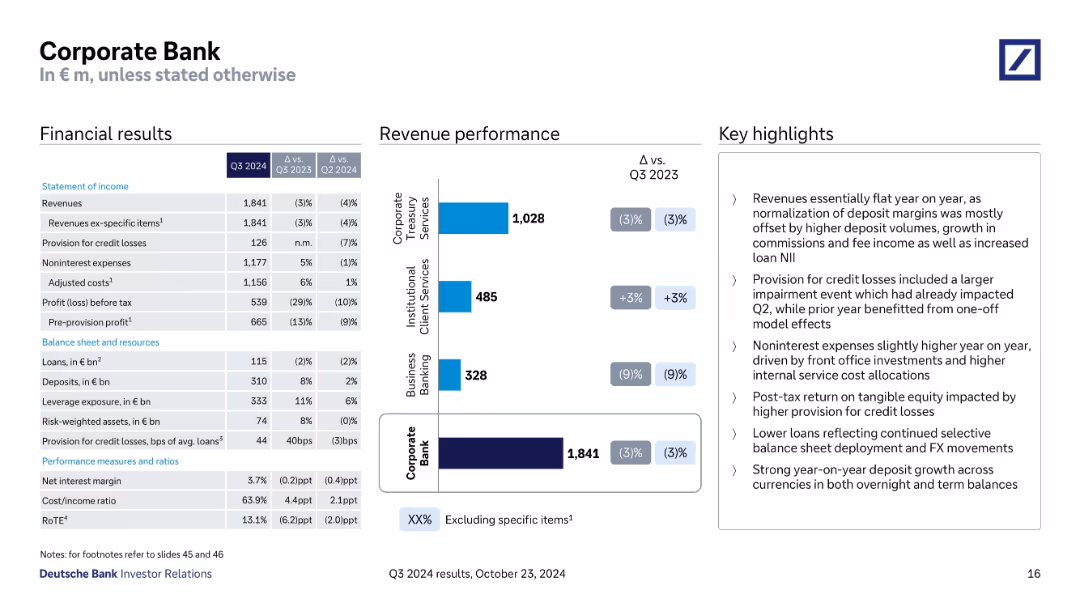
Split into financial results table, revenue chart, and highlights; detailed KPI breakdown.
Financial Performance
Financial Services
Covers Q3 2024 performance of the Corporate Bank, including revenue declines, cost management, credit loss provisions, and segment revenue breakdown. Discusses deposit growth, margin normalization, and internal service cost increases.
Corporate Bank, deposit growth, credit losses, revenue mix, RoTE
false
Corporate BankQ3 2024 results
Mixed Chart
Deutsche Bank
View slide
Map and text slide providing an overview of A.T. Kearney’s global presence, client base, and team structure.
Industry Overview
Professional Services
Provides an overview of A.T. Kearney's global scale in consulting across various industries, functions, and geographies, with significant client and team details.
consulting, global, industries, clients, team
false
A.T. Kearney is a globally recognized consulting firm offering scale in industries, functions, and geographiesThe Future of Procurement: Why is Technology Lagging Behind?
Graphic
Kearney
View slide
Diagram and text outlining IT functional vacancy rates over time. Specific IT vacancies are highlighted in an organizational chart.
Human Resources and Talent Management
Technology & Software
Analysis of IT functional vacancy rates within NH DHHS, showing increased vacancies impacting strategic decision-making and planning, especially during COVID-19.
IT Vacancies, DHHS, Staffing, Organizational Chart, COVID-19
false
Staffing Review | Vacancies | ITNH DHHS Operations Assessment
Header Horizontal
Alvarez & Marsal
View slide
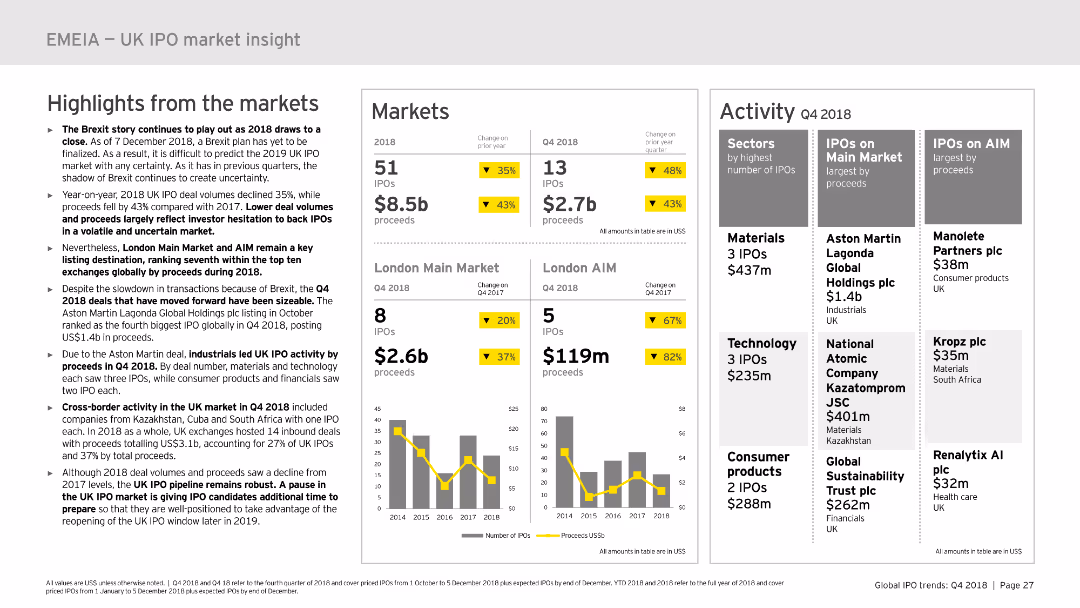
This slide includes multiple sections: highlights from the market, markets, and activity. It uses column charts and data tables to present IPO data and market performance in the UK. The layout is detailed, offering a clear and structured overview of the market insights.
Market Analysis and Trends
Financial Services
Provides insights into the UK IPO market in 2018, including market highlights, performance data, and activity details. Useful for market analysis and strategic planning in the financial sector.
UK, IPO, market insight, performance, trends
false
Highlights from the markets The Brexit story continues to play out as 2018 draws to a close.Big vs agile? Global IPO trends: Q4 2018 Mega and unicorn IPOs characterize 2018 deal landscape; trend to continue in 2019
Multiple Chart
EY
View slide
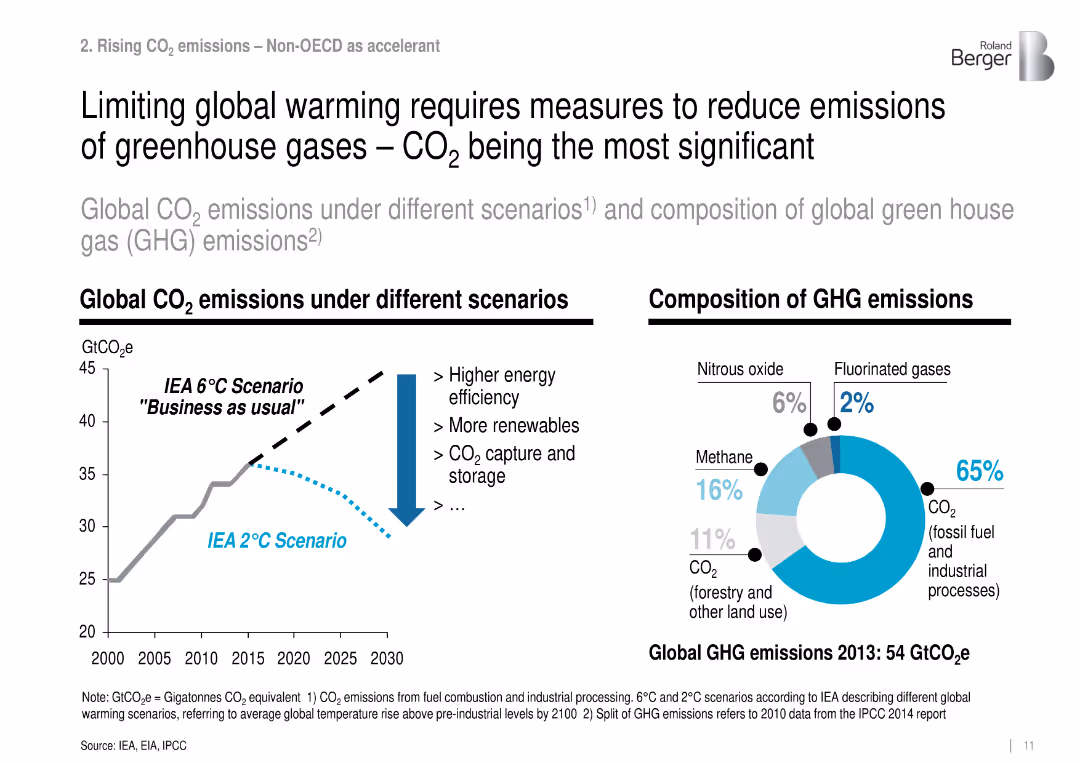
Dual-panel layout: line chart of CO₂ scenarios and donut chart of 2013 GHG composition.
Regulatory and Compliance
Environmental Services & Sustainability
Illustrates the need to reduce global CO₂ emissions by comparing a 2°C vs. 6°C scenario and shows GHG breakdown, with fossil CO₂ making up 65% of emissions.
CO₂ emissions, climate scenarios, GHG, mitigation, fossil fuel
false
Limiting global warming requires measures to reduce emissions of greenhouse gases – CO2 being the most significantRoland Berger Trend Compendium 2030 Megatrend 4 Climate change & ecosystem at risk
Multiple Chart
Roland Berger
View slide
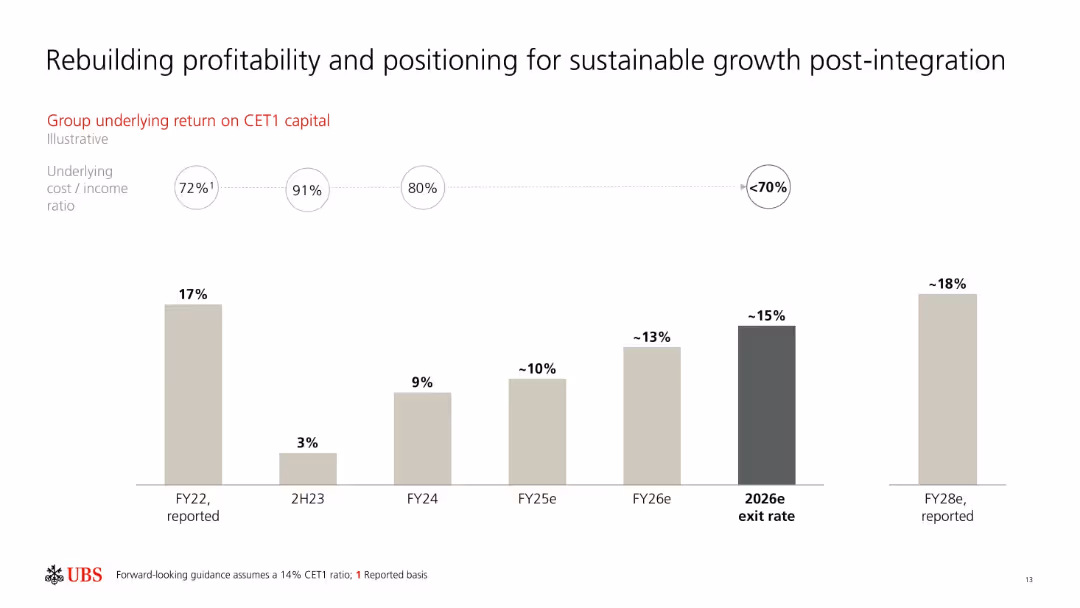
Column chart showing RoCET1 progression from FY22 to FY28e with cost/income ratios labeled above. Monochromatic beige and gray tones.
Strategic Planning
Financial Services
Tracks UBS’s RoCET1 from 17% in FY22 to a projected 18% in FY28. Emphasizes recovery from a dip in 2H23 and the role of integration in supporting long-term sustainable growth and lower cost/income ratios.
UBS, RoCET1, integration, growth, profitability, FY28, cost/income, return on capital, financial forecast
false
Rebuilding profitability and positioning for sustainable growth post-integrationFull-year and fourth quarter 2024 Fixed Income investor presentation
Single Chart
UBS
View slide
This slide provides a timeline from the 1980s to the 2010s, detailing the evolution of services with a blue and white color scheme.
Organizational Structure and Change
Financial Services
This slide could be used to depict the growth and diversification of a company's services over decades, emphasizing its established presence in the industry.
Evolution, Services, Growth, Diversification, Decades, Fixed Income, Equity, Advisory, ESG, Real Estate Credit
false
Franchise Built Over 30+ Years; Difficult to Replicate Breadth and DepthGoldman Sachs Investor Day
Linear Flow
Goldman Sachs
View slide
Column charts for revenues, detailed text boxes with key financials
Financial Performance
Financial Services
Results and highlights for personal banking and wealth management sectors
Personal Banking, Wealth Management, Revenue, Column Chart, Financials
false
Personal Banking and Wealth Management ResultsEarnings Results Presentation
Mixed Chart
Citigroup
View slide
Multiple pie charts and column charts showing deposit base breakdown and liquidity ratios with future targets.
Operational Efficiency
Financial Services
Discusses the diversified funding and robust liquidity position of Deutsche Bank, with an emphasis on stability and targets.
funding, liquidity, operational, stability, banking, pie charts, bar graphs, deposits, ratios, targets
false
Funding and liquidity 22 In € bn, unless stated otherwise, as of June 30, 2023Client & Creditor Overview August 2023
Multiple Chart
Deutsche Bank
View slide
A line graph depicting the trend in debt leverage over several fiscal quarters with targets set for future ratios.
Financial Performance
Financial Services
Describes the company's efforts in reducing debt to maintain a healthy leverage ratio, aiming for investment-grade status.
debt reduction, leverage ratio, financial health, investment grade, line graph
false
DEBT REDUCTIONBARCLAYS GLOBAL CONSUMER STAPLES CONFERENCE
Single Chart
Barclays
View slide
Purple background with white text and a column chart. Includes text on the value of platform strategies
Competitive Landscape
Technology & Software
The slide explains the value of platform strategies, citing examples like Shell and American Express
Platform, Ecosystem, Value, Collaboration, Technology
false
Platform companies have a more visible approach to collective valueLevel Up: Elevate Your Business With a Platform Strategy
Mixed Chart
Accenture
View slide
Features two line graphs showing year-over-year industrial production growth in the U.S. and EU. The slide uses red and blue lines against a light green background for clarity.
Operational Efficiency
Industrial & Manufacturing
Discusses recent trends in manufacturing and industrial production in the U.S. and EU, highlighting changes in growth rates. This slide is beneficial for understanding sectoral health and economic conditions.
Manufacturing, Industrial Production, US, EU, Growth Rates
false
U.S. and EU manufacturing industrial production growth has deceleratedDeutsche Bank Global Industrials & Materials
Single Chart
Deutsche Bank
View slide
The slide features a red and green column chart showing U.S. market podcast revenue growth projections from 2019 to 2024, with figures in millions and percentage growth noted.
Financial Performance
Media & Entertainment
This slide presents the projected tripling of podcast revenues in the U.S. market over five years, highlighting significant growth from 2019 to 2024.
Podcast, Revenue, Growth, Media, Projections, U.S.
false
Revenues are forecasted to almost triple to $4.2B over the next 3 yearsU.S. Podcast Advertising Revenue Study
Single Chart
PwC/Strategy&
View slide
The slide features a diagram illustrating Ipsos's reputation and policy legislation intelligence platform, highlighting data sources, analytics, and actionable alerts.
Technology and Digital Transformation
Technology & Software
It details Ipsos’s AI and advanced analytics platforms, explaining how they help clients sense and respond in real time using various data sources and technologies.
AI, analytics, Ipsos, data, real-time response
false
IPSOS AI AND ADVANCED ANALYTICS PLATFORMS HELP CLIENTS TO SENSE AND RESPOND IN REAL TIMEIpsos 2025 Growth Plan: The Heart of Science and Data
Linear Flow
IPSOS
View slide
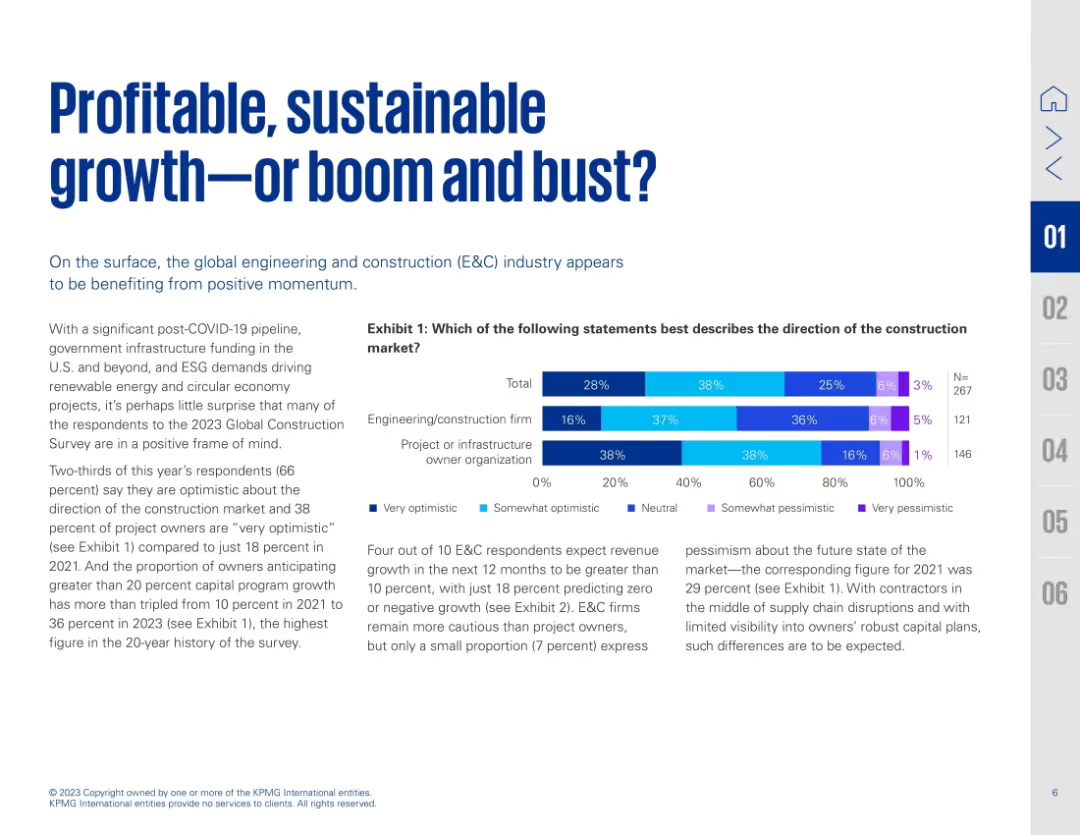
Title-heavy layout with dual-column structure and horizontal bar chart on optimism levels in construction market
Industry Overview
Real Estate & Construction
Discusses the outlook of the global engineering and construction industry post-COVID. Most respondents optimistic, especially infrastructure owners. Chart shows varying levels of optimism by organization type.
construction outlook, optimism, ESG, growth sentiment, infrastructure, bar chart, KPMG survey, post-COVID
false
Profitable, sustainable growth—or boom and bust?Familiar challenges - new approaches
Mixed Chart
KPMG
View slide
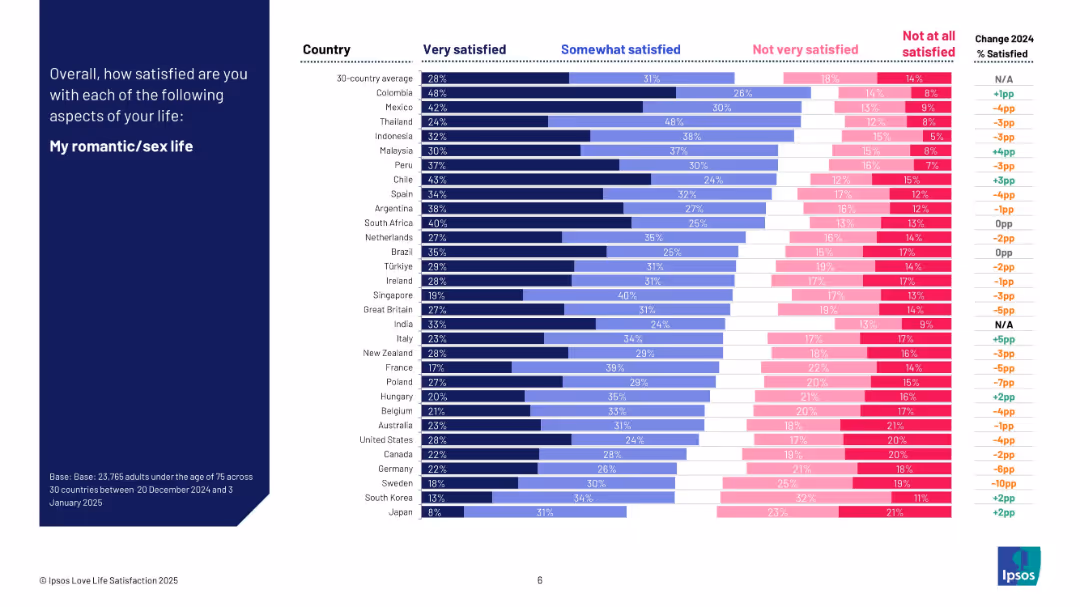
Similar design to 19467; focuses on satisfaction with romantic/sex life across countries with satisfaction changes over time.
Human Resources and Talent Management
Professional Services
This slide presents satisfaction levels with respondents' romantic and sex lives, segmented by country and level of satisfaction. Colombia, Mexico, and Thailand lead in satisfaction, while Japan and South Korea report the lowest levels. Includes 2024 to 2025 change data.
romantic life, sex life, satisfaction, love life, cross-cultural comparison, survey, emotional well-being, Ipsos
false
My romantic/sex lifeIPSOS LOVE LIFE SATISFACTION 2025
Mixed Chart
IPSOS
View slide
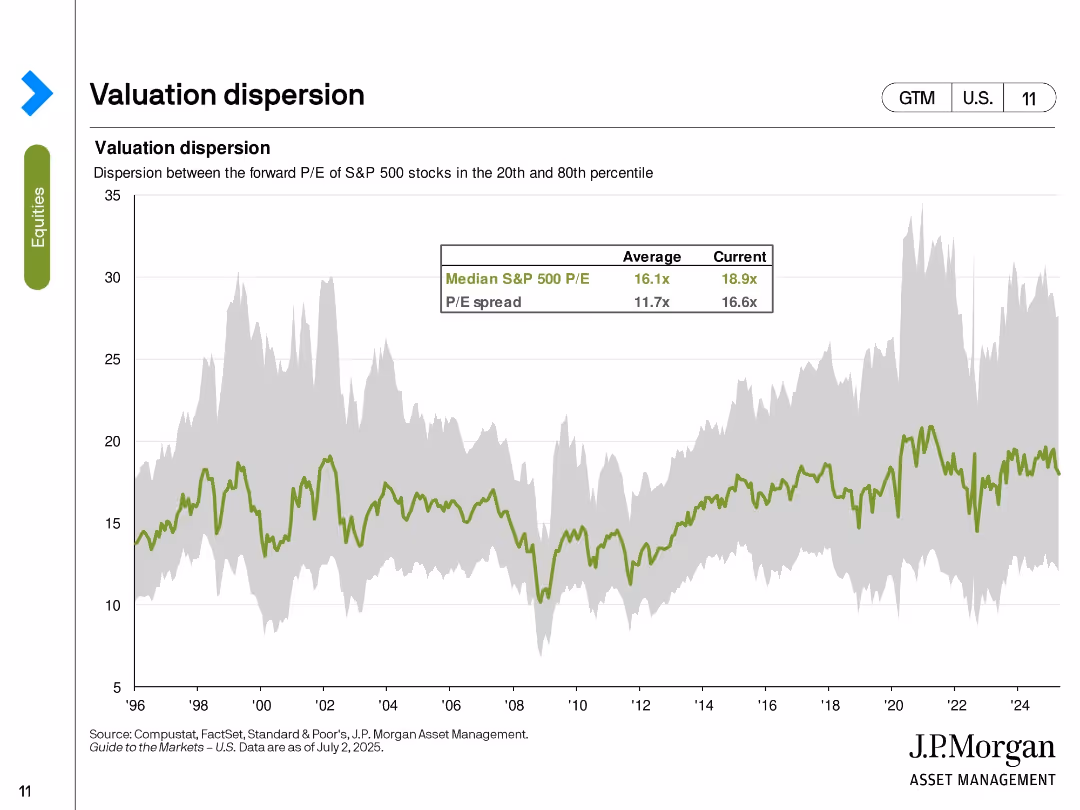
Area chart showing the P/E spread between the 20th and 80th percentile S&P 500 stocks with overlaid median P/E.
Risk Assessment and Management
Financial Services
This slide highlights valuation dispersion within the S&P 500, emphasizing how wide the spread is between high- and low-valued stocks. The current P/E spread (16.6x) is above the historical average, indicating elevated disparity in investor valuations. Median P/E has also risen to 18.9x.
valuation dispersion, S&P 500, P/E spread, percentile, median valuation, equity risk, market breadth, investor sentiment
false
Valuation dispersionGuide to the Markets U.S. 3Q 2025
Single Chart
JP Morgan
View slide
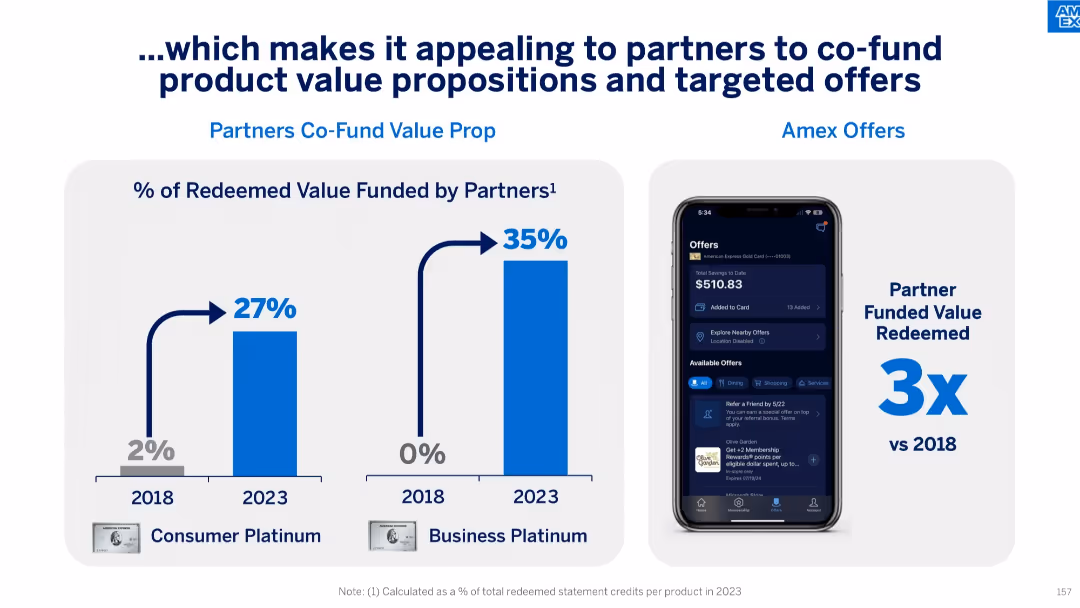
Split panel slide: bar charts on left showing rise in partner-funded redeemed value (2018–2023), right showing Amex Offers UI on phone and 3x increase in partner-funded value.
Product and Service Analysis
Financial Services
This slide illustrates how growing partner engagement has increased the share of redeemed value they fund—27% for Consumer Platinum and 35% for Business Platinum in 2023—up from 2% and 0% respectively in 2018. It supports the effectiveness of co-funded offers and digital engagement tools.
partner funding, value proposition, targeted offers, consumer engagement, co-funded redemption, Amex Offers, digital interface
false
…which makes it appealing to partners to co-fund product value propositions and targeted offersAmerican Express Investor Day 2024
Mixed Chart
McKinsey
View slide
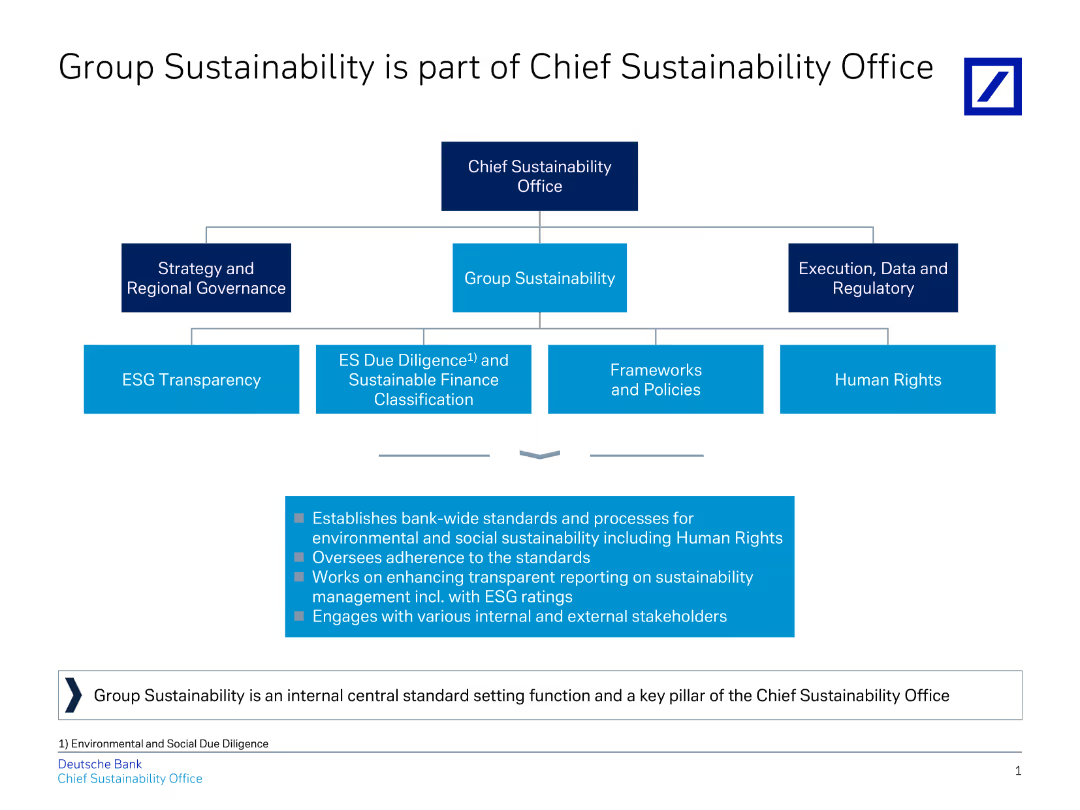
The slide presents an organizational structure chart of the Chief Sustainability Office, detailing its various divisions and responsibilities.
Strategic Planning
Financial Services
This slide outlines the components and functions of Deutsche Bank's Chief Sustainability Office, emphasizing their role in setting and maintaining sustainability standards.
Sustainability, structure, governance, transparency, policies, human rights, ESG, banking, strategy, organization
false
Group Sustainability is part of Chief Sustainability OfficeInsights into our sustainable finance governance and processes
Diagram
Deutsche Bank
View slide
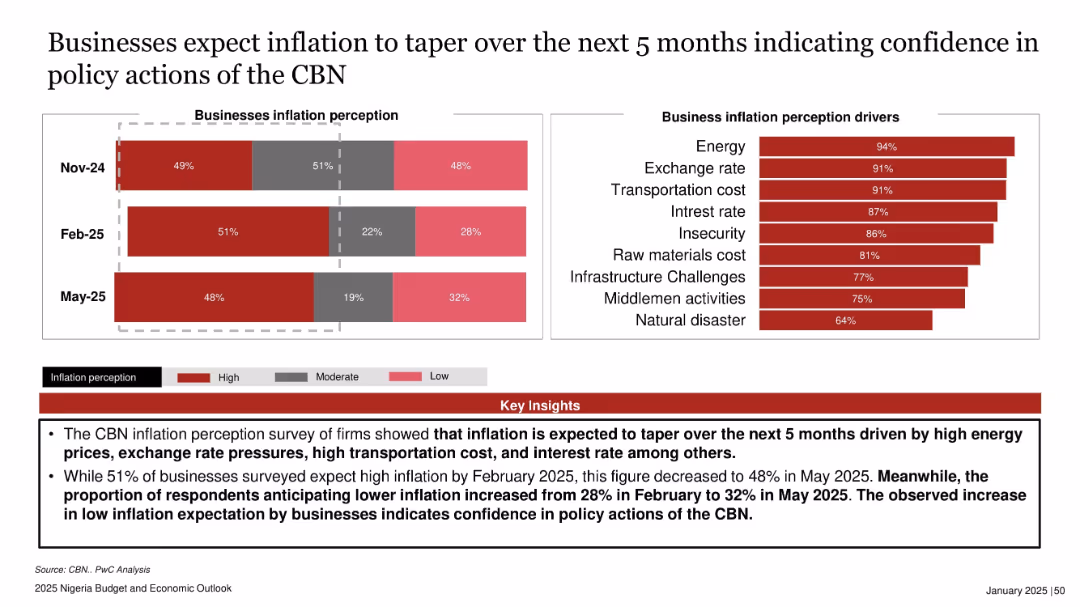
Bar chart showing inflation perception over three months on the left and another showing drivers on the right. Bottom section contains red key insights box.
Market Analysis and Trends
Financial Services
The slide presents businesses’ inflation expectations, indicating a decline in high inflation sentiment from Feb to May 2025. Increased optimism in policy actions by the Central Bank of Nigeria (CBN) is evident, driven by major cost factors like energy and exchange rates.
business inflation, perception, CBN, energy costs, Nigeria, confidence, inflation drivers, May 2025
false
Businesses expect inflation to taper over the next 5 months indicating confidence in policy actions of the CBN2025 Nigeria Budget and Economic Outlook
Multiple Chart
PwC/Strategy&
View slide
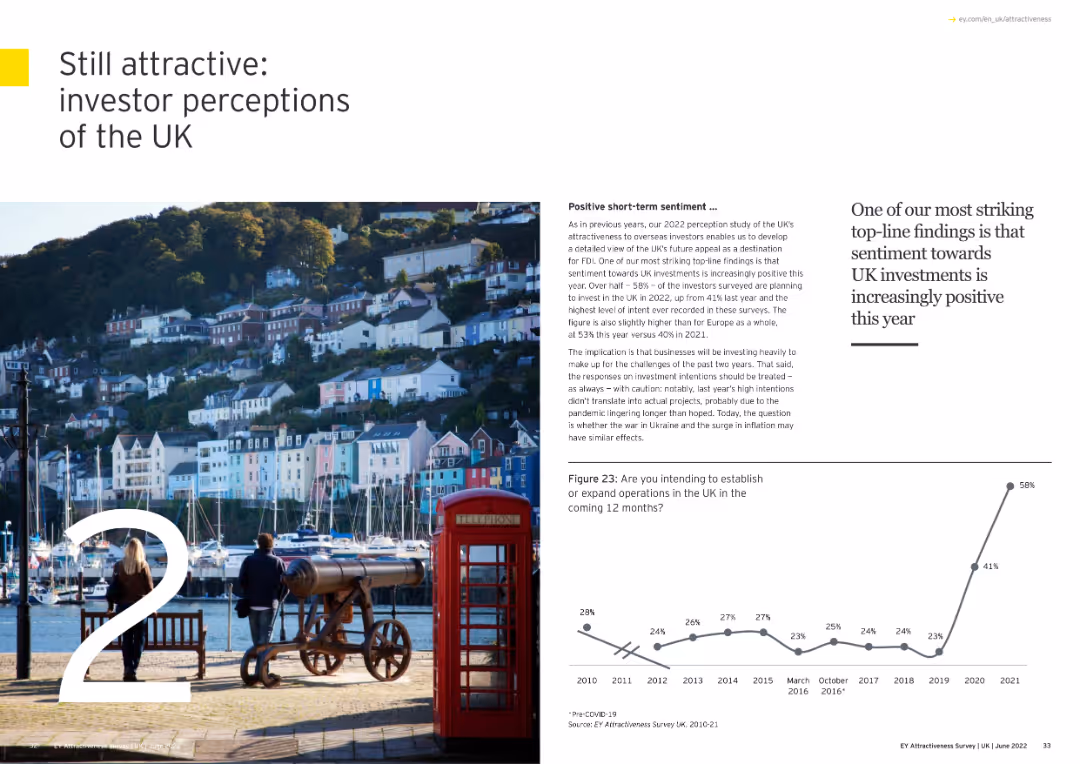
The slide includes a line chart comparing UK-EU investment flows from 2012 to 2021, showing investments to and from the EU.
Market Analysis and Trends
Financial Services
It examines the flow of investments between the UK and EU over the years, showing trends in cross-border investments and economic relationships.
investment flows, UK, EU, 2012-21, line chart
false
Still attractive: investor perceptions of the UKAdapting to a changed world EY Attractiveness Survey
Mixed Chart
EY
View slide
The slide features two column charts comparing the number and proceeds of IPOs across various sectors for Q1 2023 and Q1 2022. Colors differentiate the years, with specific focus on technology and energy sectors.
Market Analysis and Trends
Financial Services
The slide presents a comparison of IPO activities across different sectors in Q1 2023 versus Q1 2022, highlighting the dominance of the energy sector in proceeds despite fewer deals.
IPOs, sectors, technology, energy, Q1 2023, column charts, market trends, financial services, comparison, proceeds
false
Energy stayed ahead by proceeds, with four of the top 10 IPOs in Q1 2023How ready are you to go public when the opportunity arises? EY Global IPO Trends Q1 2023
Multiple Chart
EY
View slide
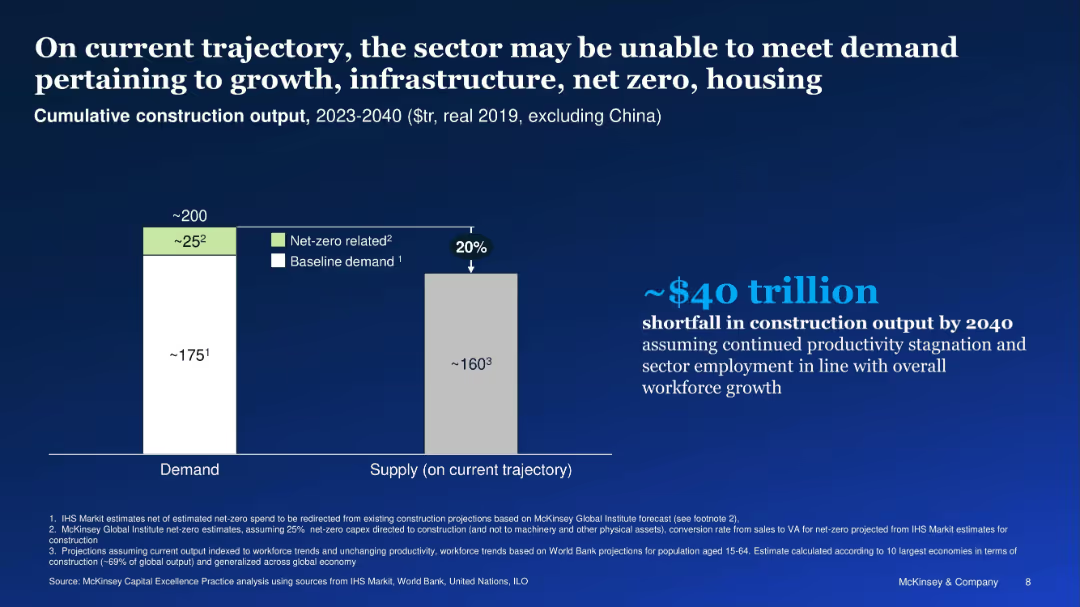
Bar chart comparing projected demand and supply; $40T gap highlighted
Strategic Planning
Real Estate & Construction
The slide forecasts a $40 trillion construction shortfall by 2040 if productivity and workforce trends do not improve. Demand for net-zero and infrastructure exceeds supply by ~20%, creating major output gaps.
construction gap, net-zero, demand vs. supply, productivity, output gap
false
On current trajectory, the sector may be unable to meet demand pertaining to growth, infrastructure, net zero, housingDelivering on construction productivity is no longer optional
Mixed Chart
McKinsey
View slide
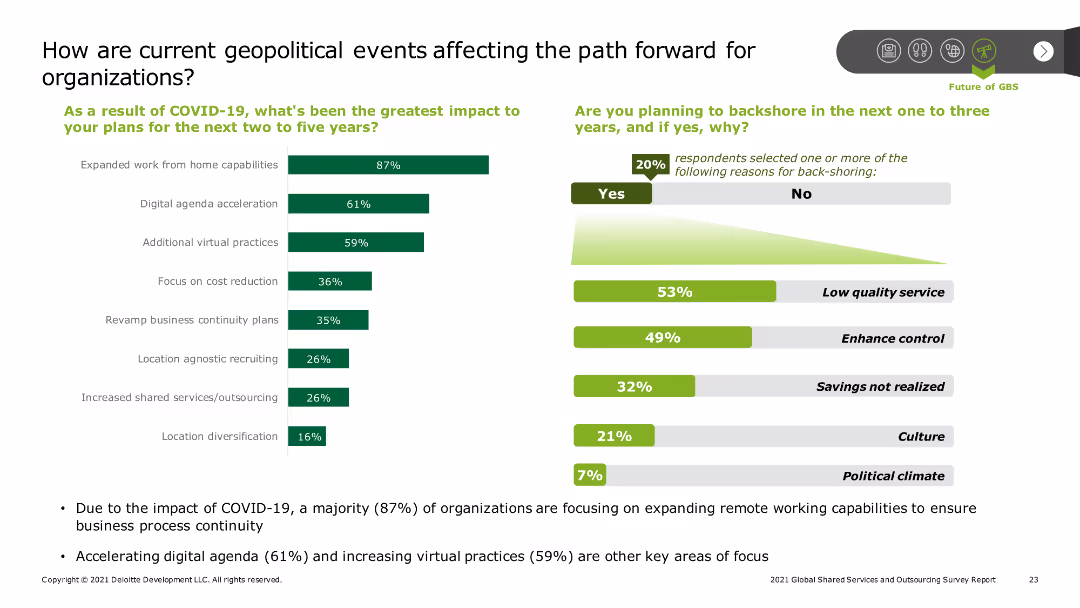
The slide includes a bar chart showing the greatest impacts of COVID-19 on organizational plans, such as expanded remote work and digital acceleration. Additional text covers backshoring plans and reasons, with key statistics highlighted.
Risk Assessment and Management
Professional Services
The slide explores how geopolitical events, particularly COVID-19, have impacted organizational strategies, emphasizing remote work capabilities and digital acceleration, as well as the rationale behind potential backshoring decisions.
Geopolitical impact, COVID-19, remote work, digital acceleration, backshoring
false
How are current geopolitical events affecting the path forward for organizations?2021 Global Shared Services and Outsourcing Survey Report
Multiple Chart
Deloitte
View slide
This slide includes multiple column charts comparing various factors influencing investment decisions, marked with changes from a previous survey and indicators for significant trends.
Investment Analysis
Financial Services
Analyzes priority factors for investors when making recommendations, focusing on long-term growth, FCF generation, and business strategy, useful in investor relations and strategic planning.
investment decisions, growth, FCF generation, business strategy, long-term focus
false
In making investment decisions and recommendations, investors prioritize long-term growth, followed by FCF generation and business strategyBCG Investor Perspectives Series Q4 2023
Multiple Chart
BCG
View slide
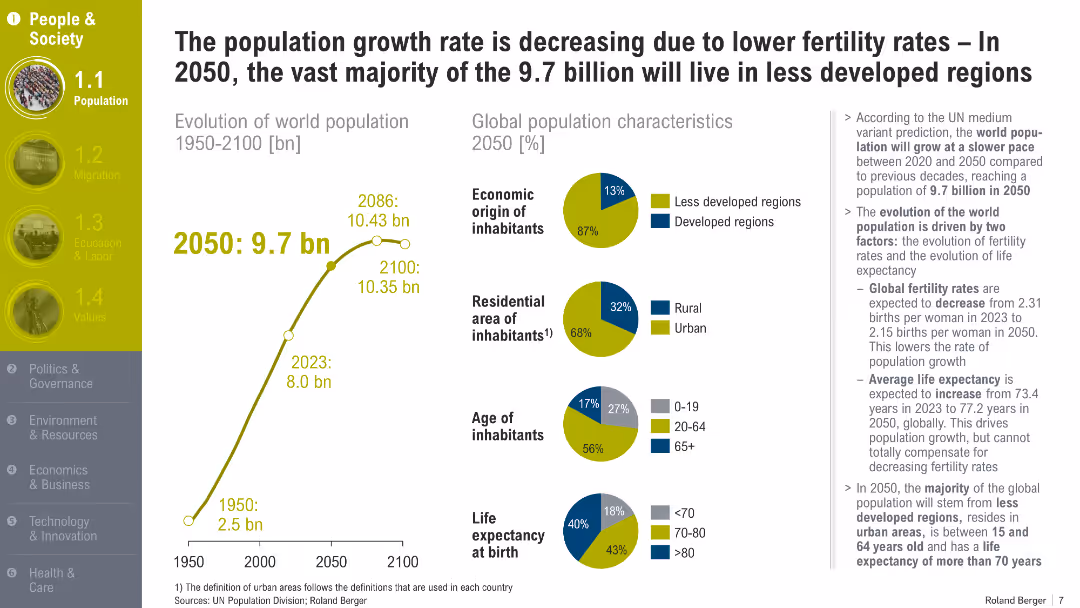
Split layout with population growth chart (1950–2100) and pie charts for population characteristics in 2050; includes key demographic insights
Market Analysis and Trends
Government & Public Sector
This slide discusses slowing population growth due to declining fertility rates and increasing life expectancy. It forecasts that by 2050, most of the 9.7 billion global population will live in less developed regions and be primarily urban.
Population Growth, Fertility Rate, Demographics, 2050, Urbanization, Global Trends, Life Expectancy
false
The population growth rate is decreasing due to lower fertility rates – In 2050, the vast majority of the 9.7 billion will live in less developed regionsTrend Compendium 2050 Six megatrends that will shape the world
Multiple Chart
Roland Berger
View slide
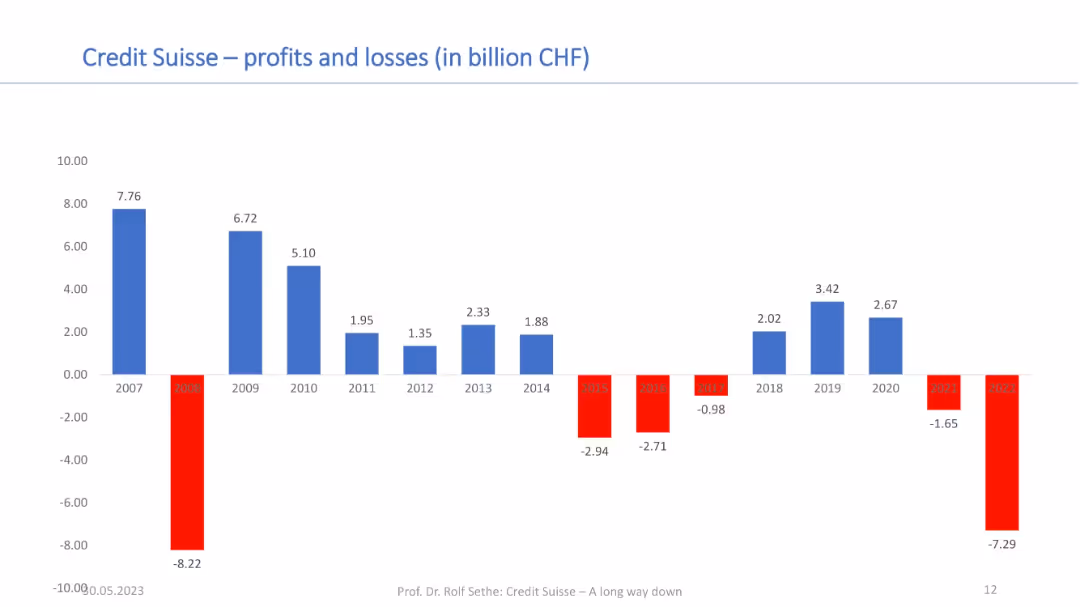
Bar chart showing annual profits and losses from 2007–2022; red bars for losses and blue for profits; financial axis in CHF.
Financial Performance
Financial Services
This chart tracks Credit Suisse’s profitability over 15 years, illustrating sharp fluctuations and sustained losses in recent years. It provides context for the bank’s financial instability and contributes to understanding its acquisition by UBS.
profits, losses, Credit Suisse, annual results, financial performance, CHF, long-term trend, UBS acquisition
false
Credit Suisse – profits and losses (in billion CHF)A LONG WAY DOWN
Single Chart
Credit Suisse
View slide
Bar graph on the slide represents global capital spending as a percentage of GDP, with an increasing trend shown in different shades of blue. Annotations provide a year-by-year breakdown.
Investment Analysis
Environmental Services & Sustainability
Describes the front-loaded nature of investment in the net-zero transition, with spending rising to a peak percentage of global GDP by 2030 before reducing again. Indicates the importance of initial investment to facilitate long-term change.
Global GDP, Capital Spending, Net-Zero, Transition, Investment, 2030
false
3 Front-loadedThe net-zero transition
Single Chart
McKinsey
View slide
The slide presents a column chart with different income sources, highlighting year-on-year income growth percentages.
Financial Performance
Financial Services
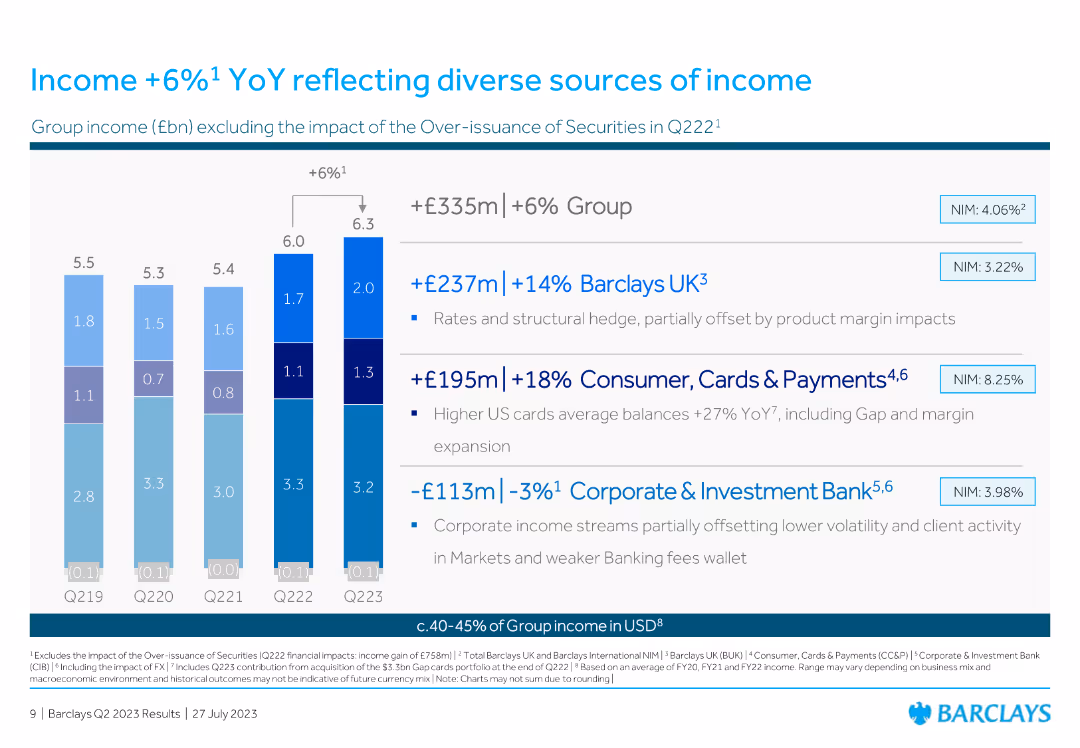
This slide shows the income growth by various sources within the group, indicating a 6% overall increase year-on-year, and breaks down contributions by segments.
income, growth, financial, performance, sources, column chart, YoY, percentage, segment, diverse
false
Income +6%1 YoY reflecting diverse sources of incomeBarclays PLC Q2 2023 Results Presentation
Mixed Chart
Barclays
View slide
A bubble chart showing the human capital index vs. real GDP per capita and a bar chart showing the index of economic freedom by country.
Market Analysis and Trends
Financial Services
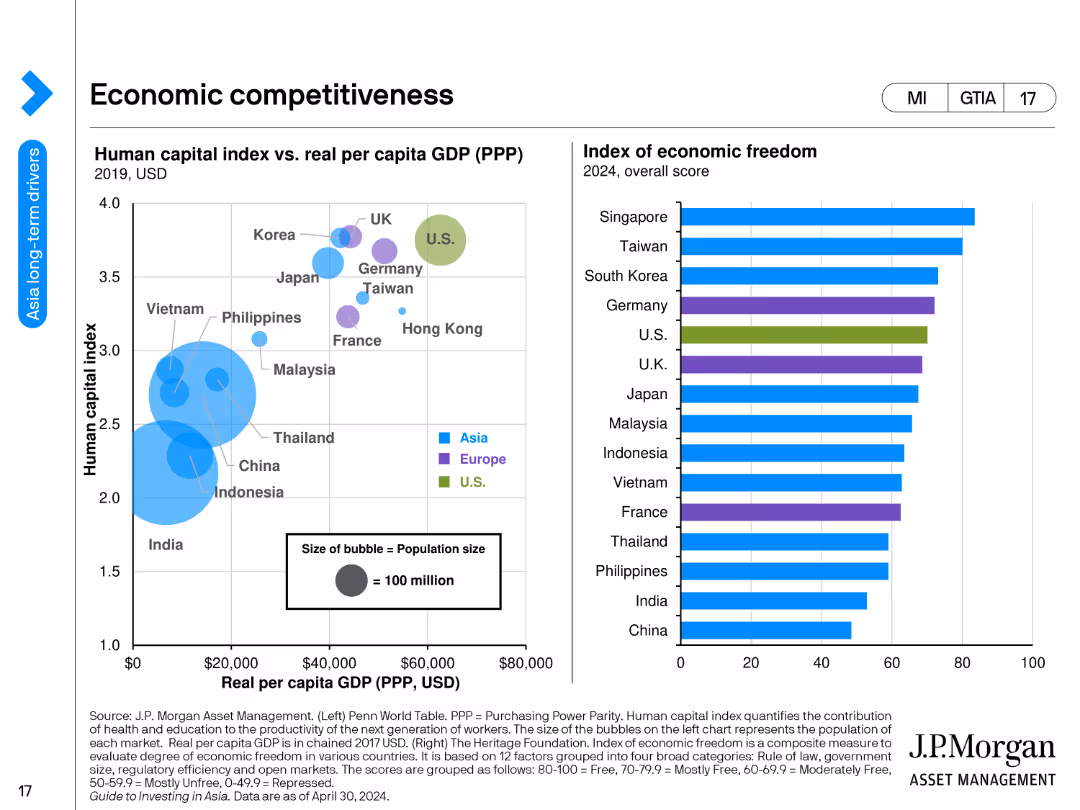
The slide compares countries' economic competitiveness through human capital indices and real GDP per capita, and presents an index of economic freedom scores for 2024.
economic competitiveness, human capital, GDP per capita, economic freedom, countries, financial analysis, indices, economic trends, development, financial insights
false
Economic competitivenessGuide to Investing in Asia
Multiple Chart
JP Morgan
View slide
The slide has bullet points in a two-column layout with icons, set against a subtle red patterned background. A man seems to be typing or reading, suggesting thought or analysis.
Strategic Planning
Professional Services
Outlines strategies for businesses to manage uncertainties, such as identifying industry forces, embracing alternative futures, and resource allocation for adaptation.
uncertainties, strategies, industry forces, alternative futures, resource allocation
false
Despite the looming unknown, steps can be taken in the face of these changes:Southeast Asia's digital consumers: A new stage of evolution
Header Vertical
Bain
View slide
The slide has icons and horizontal bar charts showing opinions on the future of the EU post-Brexit, with categories such as integration and decentralization.
Regulatory and Compliance
Government & Public Sector
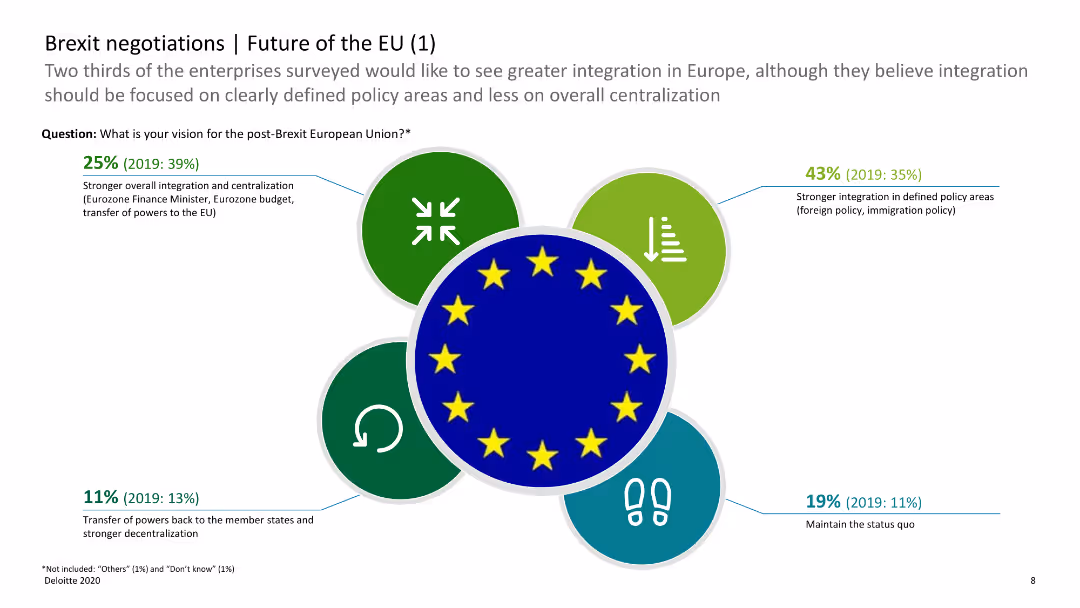
This slide shows survey results on the future of the EU, indicating preferences for integration versus decentralization post-Brexit. It helps understand future EU policy directions.
Brexit, EU future, integration, decentralization, survey
false
Brexit negotiations | Future of the EU (1)Deloitte Brexit Briefing | 13 Brexit Survey: Expectations and preparations of German enterprises
Diagram
Deloitte
View slide
The slide features a red background with white text on the left, and two pie charts with accompanying text on the right. The layout includes a quote at the bottom right. The pie charts use red and gray colors to highlight key statistics.
Risk Assessment and Management
Financial Services
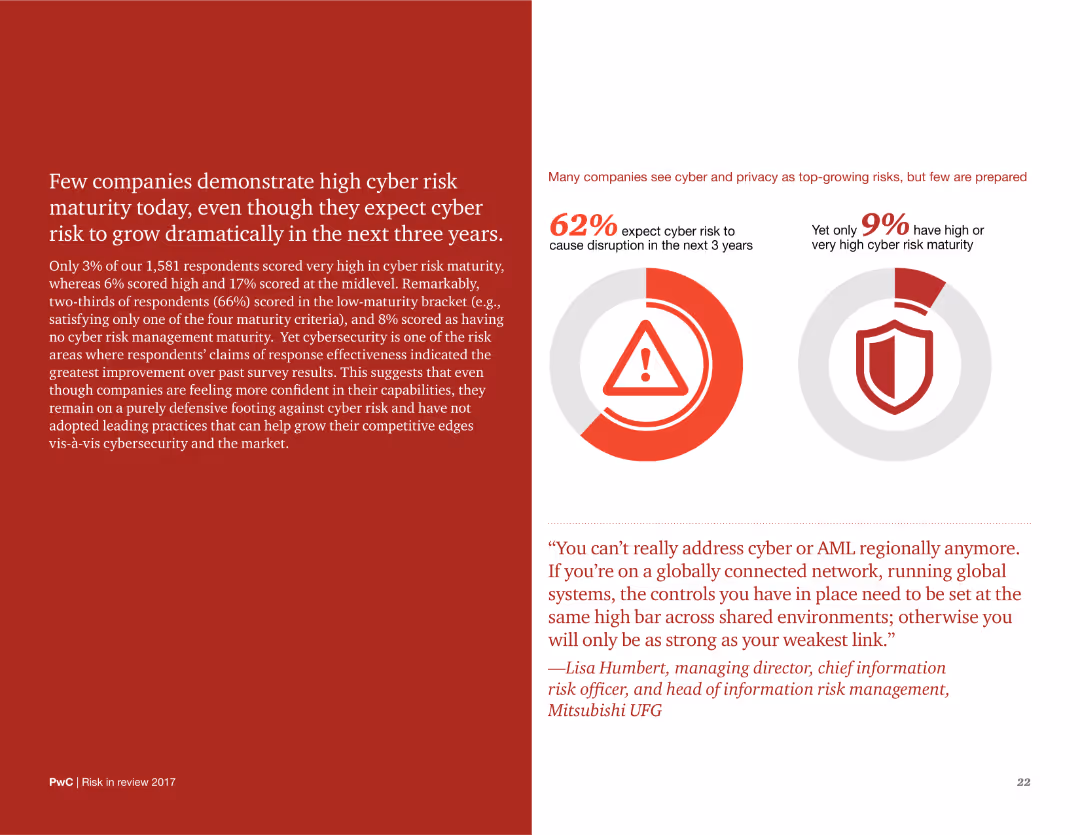
The slide discusses the low levels of cyber risk maturity among companies and highlights key statistics and quotes to emphasize the importance of improving cyber risk management.
cyber risk, maturity, companies, statistics, management, improvement, challenges, future, growth
false
Few companies demonstrate high cyber risk maturity today, even though they expect cyber risk to grow dramatically in the next three years.Risk in review Managing risk from the front line
Multiple Chart
PwC/Strategy&
View slide
Includes flow chart, bold text for emphasis.
Market Analysis and Trends
Retail & E-commerce
Insights into personalized luxury shopping experiences.
UHNWI, personalized, luxury, digital, VIP
false
UHNWIs LOOKING FOR “WHAT MONEY CANNOT BUY”, BEYOND PRODUCTS: CUSTOMER NETWORK AS THE NEW MEASURE OF VALUEBAIN-ALTAGAMMA 2019 WORLDWIDE LUXURY MARKET MONITOR
Linear Flow
Bain
View slide
The slide features a combination of images and bulleted lists. Four images represent key pillars, and a detailed list of industry trends and opportunities follows each image.
Market Analysis and Trends
Energy & Utilities
Discusses the growth drivers in the renewable energy sector, emphasizing Seatruim’s strategic areas of development. Useful for presenting the market outlook and potential growth areas in offshore energy and decarbonization initiatives.
Offshore Wind, Decarbonization, New Energies, Growth
false
INDUSTRY TAILWINDSMorgan Stanley Asia Pacific Summit
Header Vertical
Morgan Stanley
View slide
Timeline format; segmented into years with supporting text blocks; highlights and metrics in blue
Client Case Studies
Retail & E-commerce
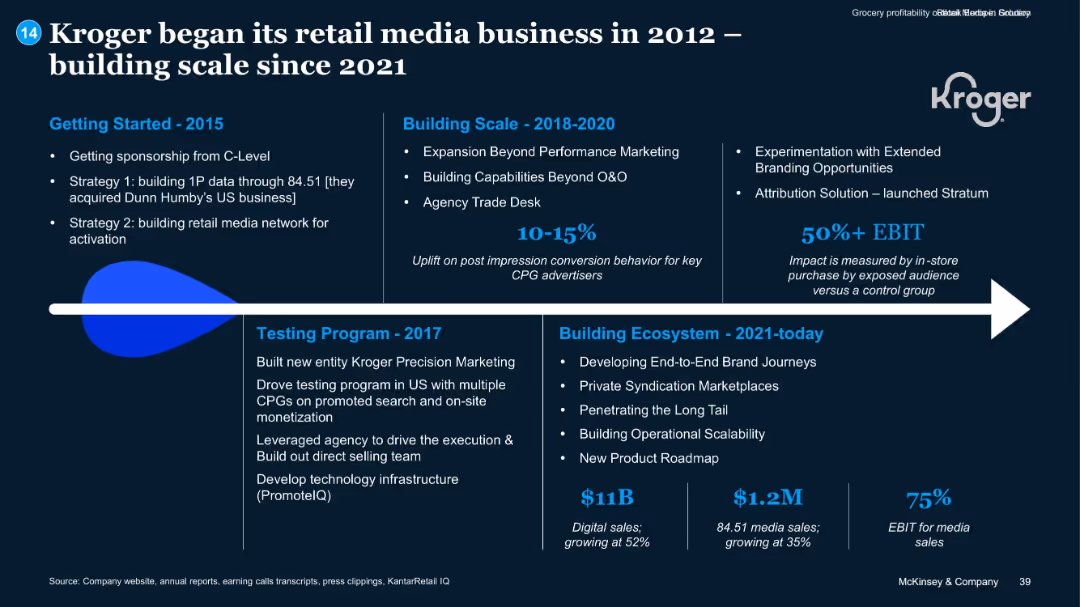
The slide traces Kroger’s retail media journey from 2012, emphasizing milestones such as 1P data acquisition, performance marketing, attribution solutions, and recent scale. It showcases strategic investments and results like EBIT impact, digital/media sales, and growth figures.
Kroger, Retail Media, Digital Sales, EBIT, 1P Data, Strategy
false
Kroger began its retail media business in 2012 – building scale since 2021Grocery profitability outlook –Europe
Linear Flow
McKinsey
View slide
Diagram of three interlocking circles labeled as 'The Orange World', 'The Green World', and 'The Blue World', with adjacent text descriptions.
Industry Overview
Professional Services
Showcasing three possible future scenarios of work culture: 'The Orange World' focusing on flexibility, 'The Green World' on social responsibility, and 'The Blue World' on big corporation dominance. Suited for discussions on corporate culture.
work culture, future scenarios, social responsibility, corporate dominance, flexibility, collectivism, individualism
false
Three worlds of workThe future of work: A journey to 2022
Framework
PwC/Strategy&
View slide
Horizontal layout with 4 circular icons and descriptions under headers: Content synthesis, Coding & software, Creative content, Customer engagement.
Technology and Digital Transformation
Artificial Intelligence
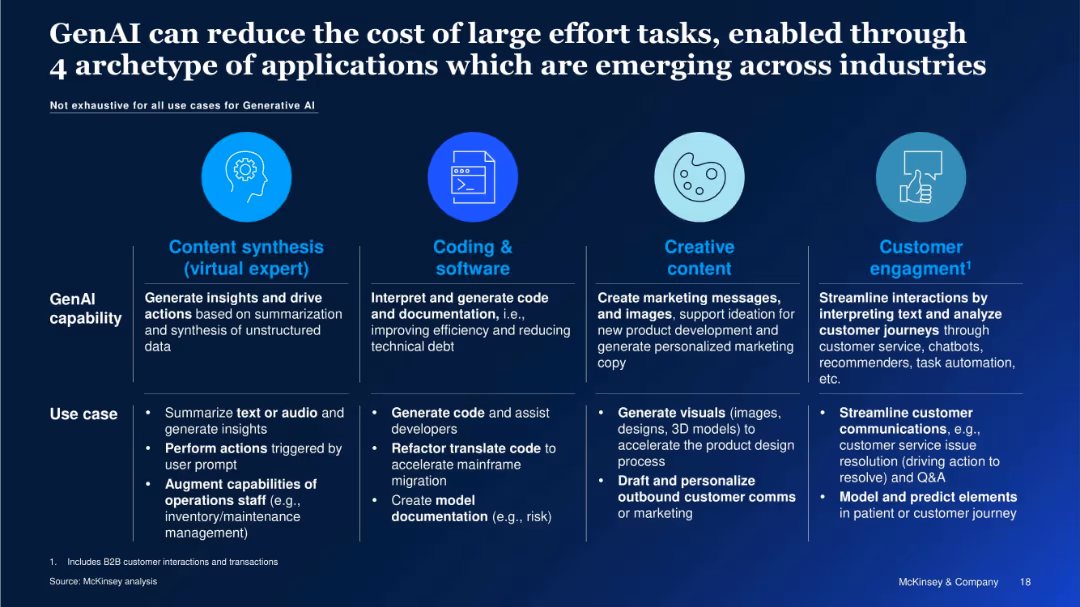
The slide outlines four major archetypes where GenAI adds value by reducing effort and cost: content synthesis, coding, content creation, and customer engagement. Each archetype includes examples and use cases such as automating code, summarizing data, and generating marketing content.
GenAI Capabilities, Content Automation, Code Generation, Marketing Automation, Customer Service, AI Use Cases, Industry Adoption
false
GenAI can reduce the cost of large effort tasks, enabled through 4 archetype of applications which are emerging across industriesThe economic potential of Generative AI in Norway
Table
McKinsey
View slide
The slide has a two-column layout with industry icons on the left and text explanations on the right, against a white background with a title at the top.
Technology and Digital Transformation
Technology & Software
Outlines the impact of cloud and edge computing on various industries, presenting both the affected sectors and implications of the technology trend.
cloud computing, edge computing, industry impact, technology trend, data analytics
false
What industries are most affected by the trend? (continued) McKinsey Technology Trends Outlook 2022 Cloud and edge computing
Header Vertical
McKinsey
View slide
This slide contains a column chart for Equities market share and industry wallet, a stacked column chart for FICC, and a comparative market share bar chart alongside a not-to-scale Marginal ROE chart for Equities and FICC.
Market Analysis and Trends
Financial Services
Tailored for market analysts and investors, this slide reviews the market business’s growth and returns, particularly in Equities and FICC, offering insights into market share increases and investment returns, pertinent for financial strategy development.
market growth, returns, Equities, FICC, market share, investment, financial strategy
false
Markets business continued to increase market share across products while delivering strong returnsCorporate & Investment Bank 2019
Multiple Chart
JP Morgan
View slide
Shows a line chart comparing the cumulative growth of different private asset classes over time, including private equity, private debt, and global private real estate.
Investment Analysis
Financial Services
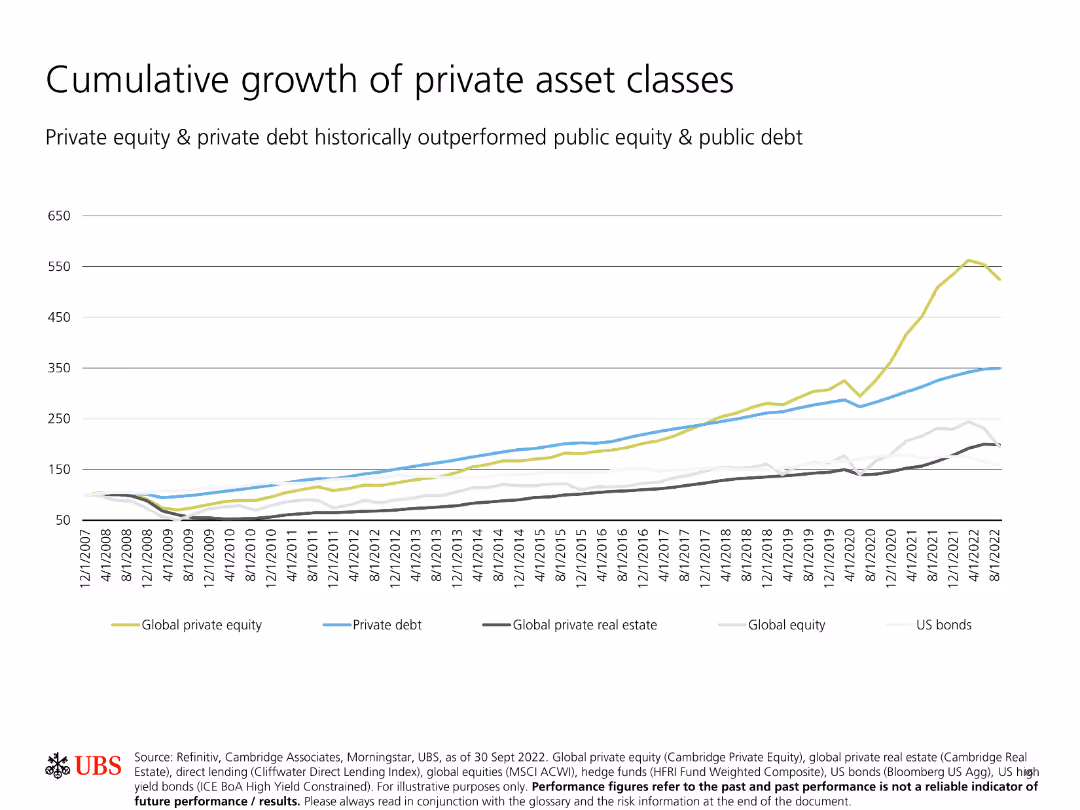
Illustrates the superior cumulative growth of private asset classes compared to public equity and debt, indicating stronger long-term performance.
Cumulative growth, private asset classes, private equity, private debt, real estate
false
Cumulative growth of private asset classesPrivate markets asset allocation guide
Single Chart
UBS
View slide
Horizontal bar chart compares four company types on strategic bet scaling. Left column text highlights key insight.
Strategic Planning
Artificial Intelligence
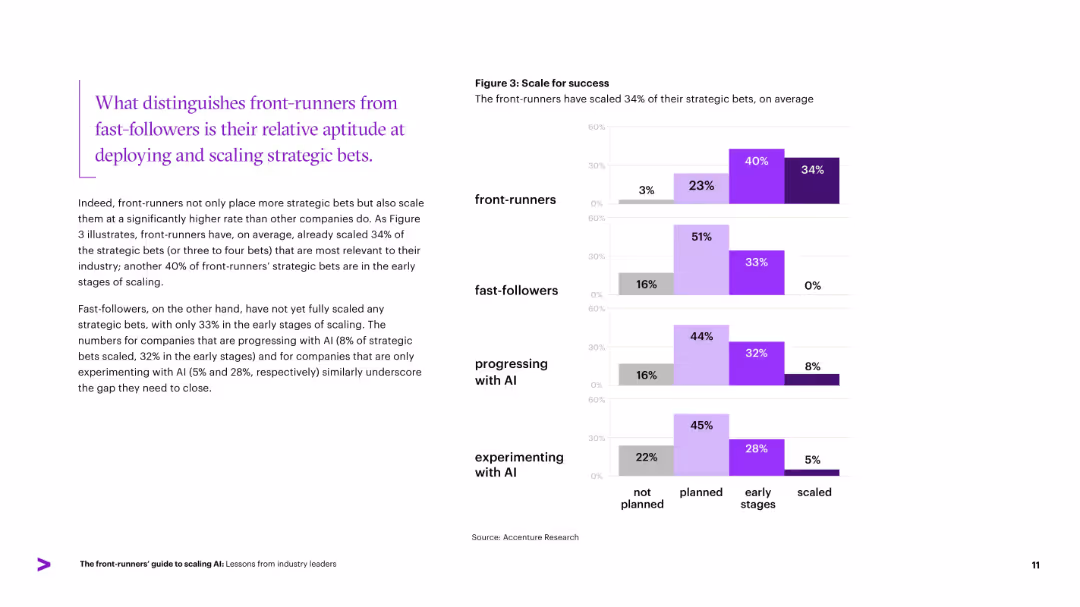
Illustrates how front-runners lead in scaling strategic AI bets, with 34% already scaled and 40% in early stages. Compares progress of other company groups, emphasizing slower scaling among fast-followers and those experimenting. Reinforces that the ability to scale is a differentiator in AI success.
scaling, strategic bets, front-runners, AI success, fast-followers
false
What distinguishes front-runners from fast-followers is their relative aptitude at deploying and scaling strategic bets.The front-runners’ guide to scaling AI Lessons from industry leaders
Mixed Chart
Accenture
View slide
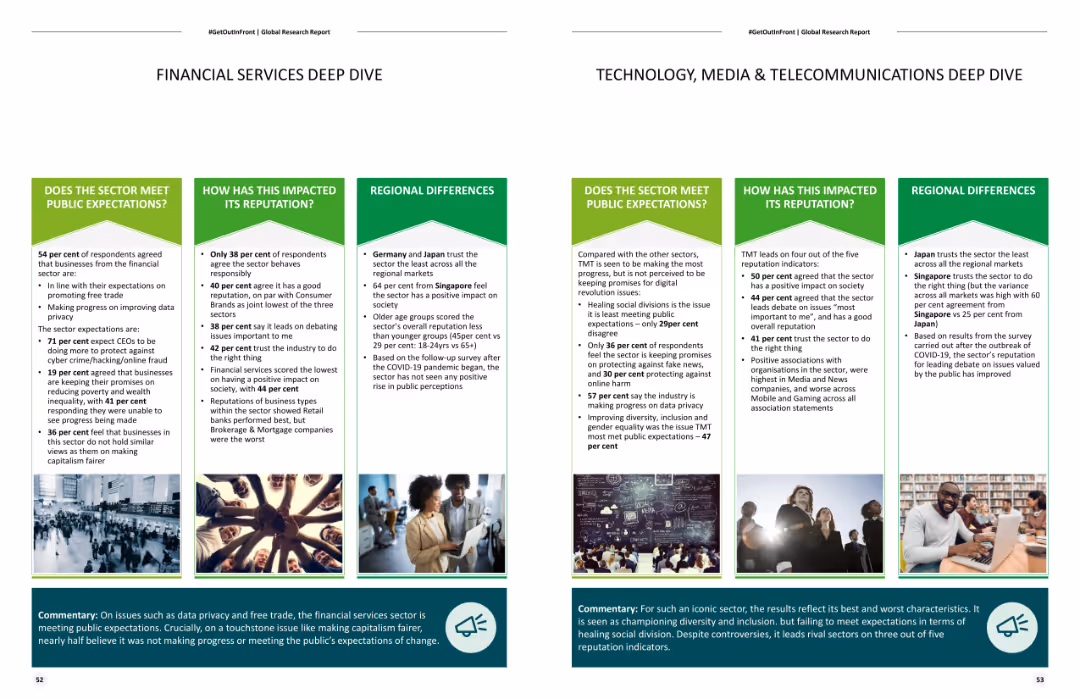
Contains detailed content and images on the public expectations and reputation impacts for the financial and TMT sectors, along with regional differences.
Industry Overview
Financial Services
Provides an in-depth analysis of the financial and TMT sectors, focusing on public expectations, reputation impacts, and regional differences in trust and perceptions.
Financial services, TMT sector, public expectations, reputation, regional differences
false
FINANCIAL SERVICES DEEP DIVE#GetOutInFront
Header Horizontal
Deloitte
1
...
Next
Load More
Hold On!
We are searching in our database
If nothing, comes up, please try different filters!
Create a FREE account to continue browsing
Receive Instant Access to 1,000+ slides from companies like McKinsey, Google, and Goldman Sachs
First Name
Last Name
Email
Password
I agree to all
Terms & Privacy Policy
Thank you! Your submission has been received!
Oops! Something went wrong while submitting the form.
Have an account?
Sign in
Column Chart
Heatmap
Chevron
Org Chart
Infographic
Callouts
Timeline
List
Graphic
Picture
Process Flow
Diagram
Paragraph
Map
Table
Framework
Subtitle
Takeaway Box
Icon
Other Chart
Radar Chart
Waterfall Chart
Mekko Chart
Pie Chart
Scatter Plot
Line Chart
Bar chart
Bullet points