My Account
My Slides
Search by Category
Templates
Leave Feedback
Login
Logout
Get Started
Browse all Slides
Browse all Slides
Create a FREE Account
Instant access to 1,000+ real slides from top companies like McKinsey, BCG, Goldman Sachs, Google and many more!
First Name
Last Name
Email
Password
I agree to all
Terms & Privacy Policy
Thank you! Your submission has been received!
Oops! Something went wrong while submitting the form.
Have an account?
Sign in
Instant access to the internet's best slides
Get access to 40+ advanced filters and more
Advanced Search and Filters
Access to
10,000+ slides
Access to Category Pages
Save/Bookmark Slides
PowerPoint Template Library (New)
Choose your plan
MONTHLY
$12/month
Billed every month, cancel anytime.
YEARLY
$9/month
Billed $108 annually, cancel anytime.
Checkout for $12/month
Checkout for $108/yr
Secured by Stripe | AES-256 bit encryption
📢 Ready to start building slides? Check out our new template library
view templates
Welcome,
Welcome
Upgrade to SlideStart
Pro
Instant access to 15,000+ slides
Show Featured Only
Checkbox 8
Companies
Mckinsey
Bain
BCG
EY
Deloitte
Accenture
PwC/Strategy&
JP Morgan
Goldman Sachs
Morgan Stanley
Citigroup
Deutsche Bank
Barclays
LEK
Kearney
Oliver Wyman
Booz Allen Hamilton
Gartner
IPSOS
Nielsen
Slide type
Header Horizontal
Framework
Vertical Flow
Single Chart
Single Chart
Text Only
Mixed Chart
Header Vertical
Graphic
Pillar
Multiple Chart
Agenda
Title
Table
Linear Flow
Upgrade to SlideStart
Pro
Instant access to 40+ advanced filters
Industry
Upgrade to SlideStart
Pro
Instant access to 40+ advanced filters
Technology
Healthcare
Financial Services
Consumer Goods
Energy & Utilities
Manufacturing
Retail
E-commerce
Logistics
Telecommunications
Real Estate
Professional Services
Education
Media
Entertainment
Hospitatlity
Tourism
Agriculture
Food Production
Government & Public Sector
Environmental
Sustainability
Use Case
Upgrade to SlideStart
Pro
Instant access to 40+ advanced filters
Sales and Business Development
Mergers and Acquisitions
Corporate Finance and Valuation
Performance Metrics and KPIs
Client Case Studies
Competitive Landscape
Product and Service Analysis
Customer and Market Segmentation
Organizational Structure
Human Resources and Talent Management
Industry Overview
Regulatory and Compliance
Risk Assessment and Management
Agriculture & Food Production
Hospitality and Tourism
Government
Environmental
Sustainability
Clear all
Thank you! Your submission has been received!
Oops! Something went wrong while submitting the form.
Show Featured Only
Checkbox 8
Companies
Mckinsey
Bain
BCG
EY
Deloitte
Accenture
PwC/Strategy&
JP Morgan
Goldman Sachs
Morgan Stanley
Citigroup
Deutsche Bank
Barclays
LEK
Kearney
Oliver Wyman
Booz Allen Hamilton
Gartner
IPSOS
Nielsen
Slide type
Text Only
Linear Flow
Vertical Flow
Single Chart
Header Horizontal
Mixed Chart
Header Vertical
Pillar
Multiple Chart
Graphic
Agenda
Title
Table
Framework
Industry
Technology
Healthcare
Financial Services
Consumer Goods
Energy & Utilities
Manufacturing
Retail
E-commerce
Logistics
Telecommunications
Real Estate
Professional Services
Education
Media
Entertainment
Hospitatlity
Tourism
Agriculture
Food Production
Government & Public Sector
Environmental
Sustainability
Use Case
Sales and Business Development
Mergers and Acquisitions
Corporate Finance and Valuation
Performance Metrics and KPIs
Client Case Studies
Competitive Landscape
Product and Service Analysis
Customer and Market Segmentation
Organizational Structure
Human Resources and Talent Management
Industry Overview
Regulatory and Compliance
Risk Assessment and Management
Agriculture & Food Production
Hospitality and Tourism
Government
Environmental
Sustainability
Clear all
Thank you! Your submission has been received!
Oops! Something went wrong while submitting the form.
Tag
View slide
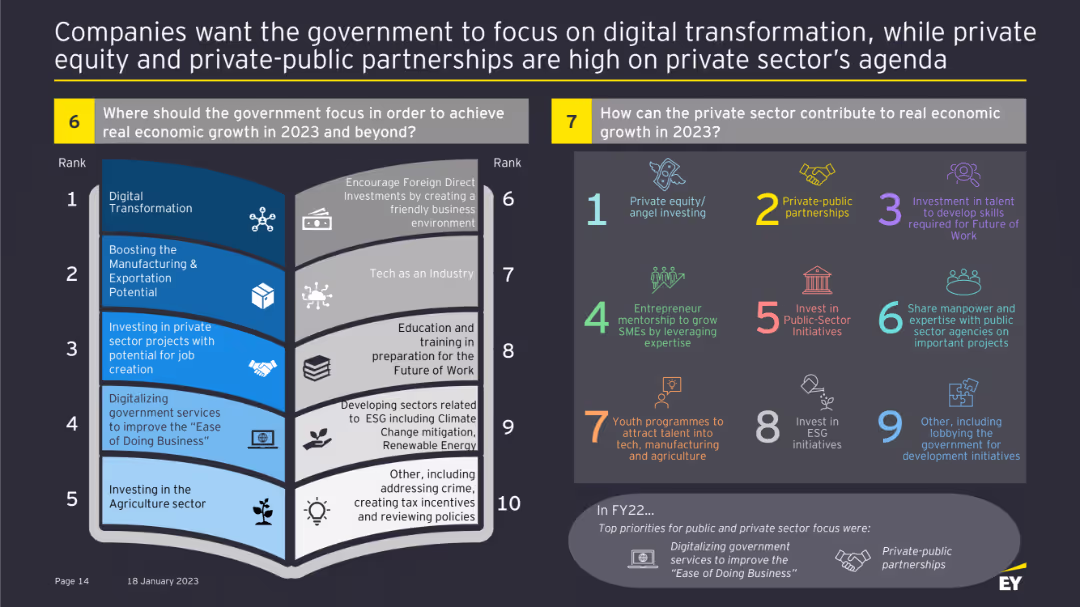
Two panels with ranked lists on where the government should focus for economic growth and how the private sector can contribute.
Strategic Planning
Government & Public Sector
This slide identifies key areas for government focus to achieve economic growth and outlines how the private sector can support these goals through various initiatives.
Government focus, private sector, economic growth, initiatives, digital transformation, investment, partnerships
false
Companies want the government to focus on digital transformation, while private equity and private-public partnerships are high on private sector’s agendaHow will you reframe your future?
Header Horizontal
EY
View slide
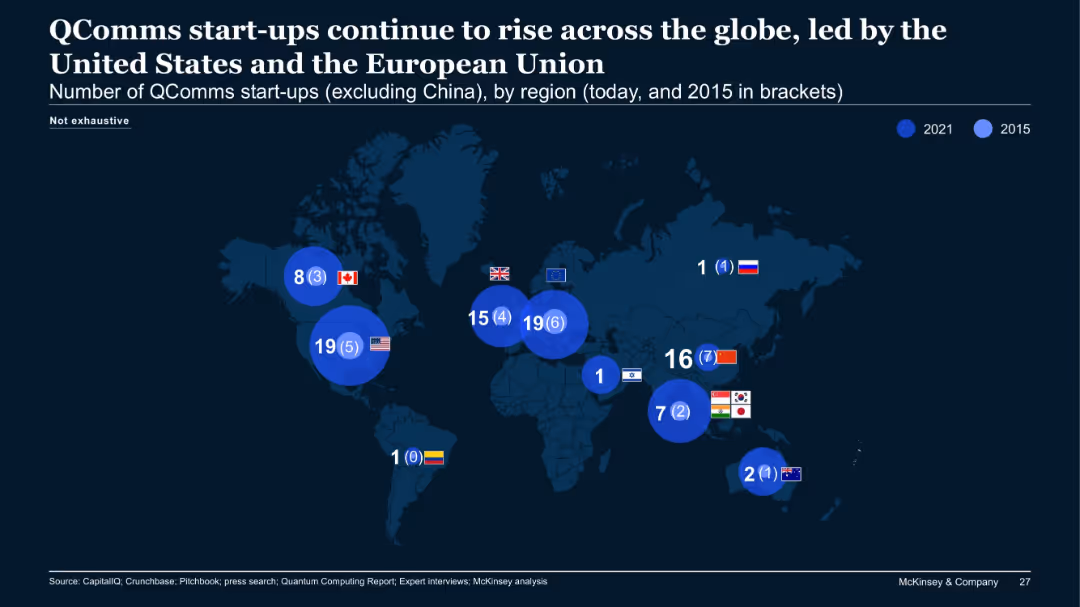
World map showing number of quantum communications (QComms) start-ups by region (2021 vs. 2015).
Market Analysis and Trends
Telecommunications
This slide displays regional growth in QComms start-ups, excluding China. Notably, the US and EU lead with 19 each in 2021, a substantial increase from 2015. Asia shows a moderate rise, while some regions remain stagnant.
QComms, start-ups, global, regional growth, map, telecommunications, EU, US
false
QComms start-ups continue to rise across the globe, led by the United States and the European UnionThe Quantum Technology Monitor September 2021
Single Chart
McKinsey
View slide
Features a timeline graphic showing the progression of contract values over years, along with icons representing different business sectors.
Market Analysis and Trends
Technology & Software
This slide presents the growth of Experian's Ascend platform, illustrating its increasing contract value over time and its potential in the analytics market.
Ascend platform, market growth, analytics, contract value, business expansion
false
Broadening our advantage with Ascend with near-term total contract value reaching US$0.5 billionBarclays Global Credit Bureau Forum
Linear Flow
Barclays
View slide
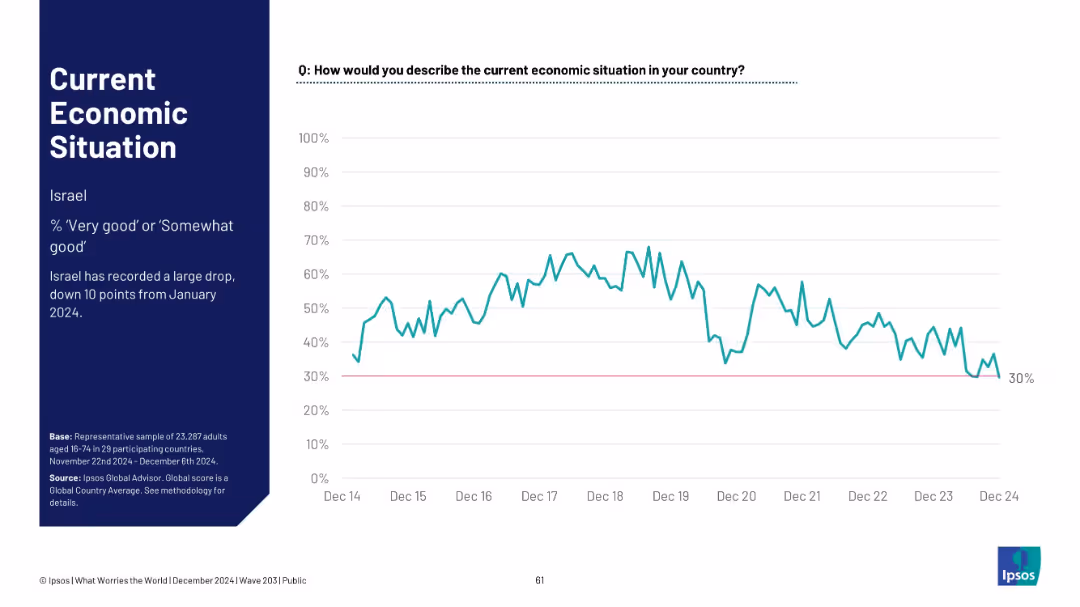
Line graph showing Israel's economic sentiment over time; notes a large recent decline.
Market Analysis and Trends
Financial Services
Israel experienced a sharp 10-point decline since January 2024, dropping to 30% of respondents viewing the economy as good, the lowest point in recent years.
Israel, sentiment drop, Ipsos, economic outlook, 2024 trend, survey data, macroeconomics, historical comparison
false
Current Economic Situation (Israel)WHAT WORRIES THE WORLD? 2024
Mixed Chart
IPSOS
View slide
This slide includes text on energy transitions, along with a graphic showing global final energy demand projections by fuel type and region.
Market Analysis and Trends
Energy & Utilities
The slide explores the varied pace of global energy transitions, predicting significant growth in renewable energy capacity and shifts in final energy demand by 2050.
energy transitions, renewable energy, global demand, fuel types, energy projections
false
Multiple energy transitions will move at different pacesIf every energy transition is different, which course will accelerate yours?
Multiple Chart
EY
View slide
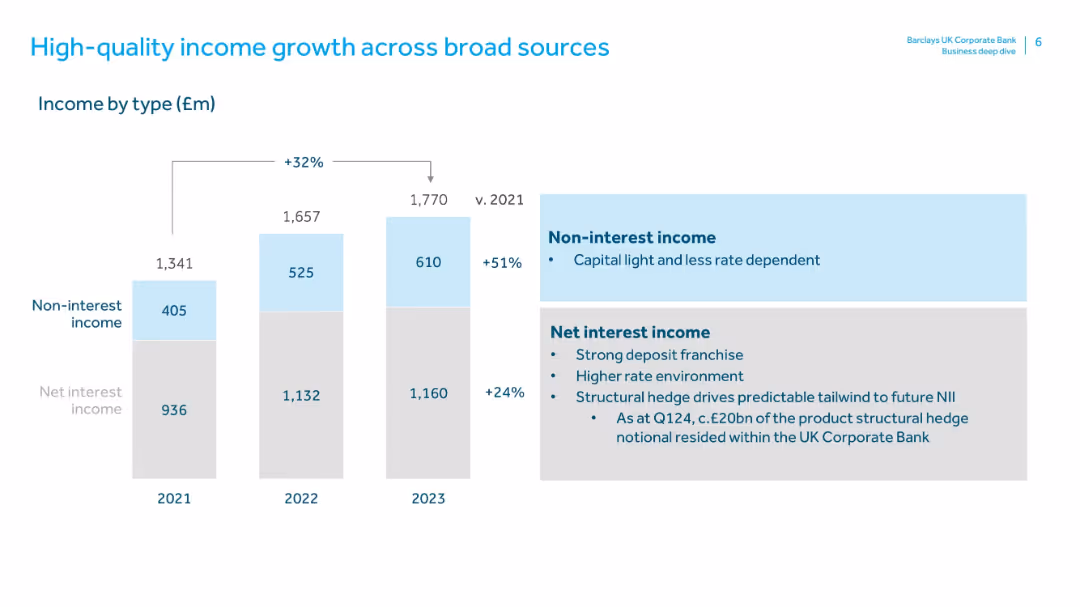
Features a stacked bar chart (2021–2023) showing Non-interest and Net Interest Income with growth percentages. Right side contains text boxes explaining both income types. Consistent blue-gray theme.
Financial Performance
Financial Services
This slide breaks down income sources into net interest income and non-interest income, highlighting a 51% increase in the latter from 2021 to 2023. It emphasizes the importance of a strong deposit franchise, structural hedging, and a capital-light, rate-independent non-interest stream.
net interest income, non-interest income, revenue composition, capital light, interest rate, structural hedge, income sources, financial performance
false
High-quality income growth across broad sourcesBarclays UK Corporate Bank Business deep dive: 18th June 2024
Mixed Chart
Barclays
View slide
The slide includes a column chart and text blocks. It shows the breakdown of risk-weighted assets (RWA) by different risk categories and their changes over time.
Risk Assessment and Management
Financial Services
This slide outlines the distribution of risk-weighted assets, detailing changes due to market volatility and new business activities, useful for risk management and regulatory reporting.
Risk, Assets, Weighted, RWA, Volatility
false
Risk-weighted assetsFirst quarter 2020 results
Mixed Chart
UBS
View slide
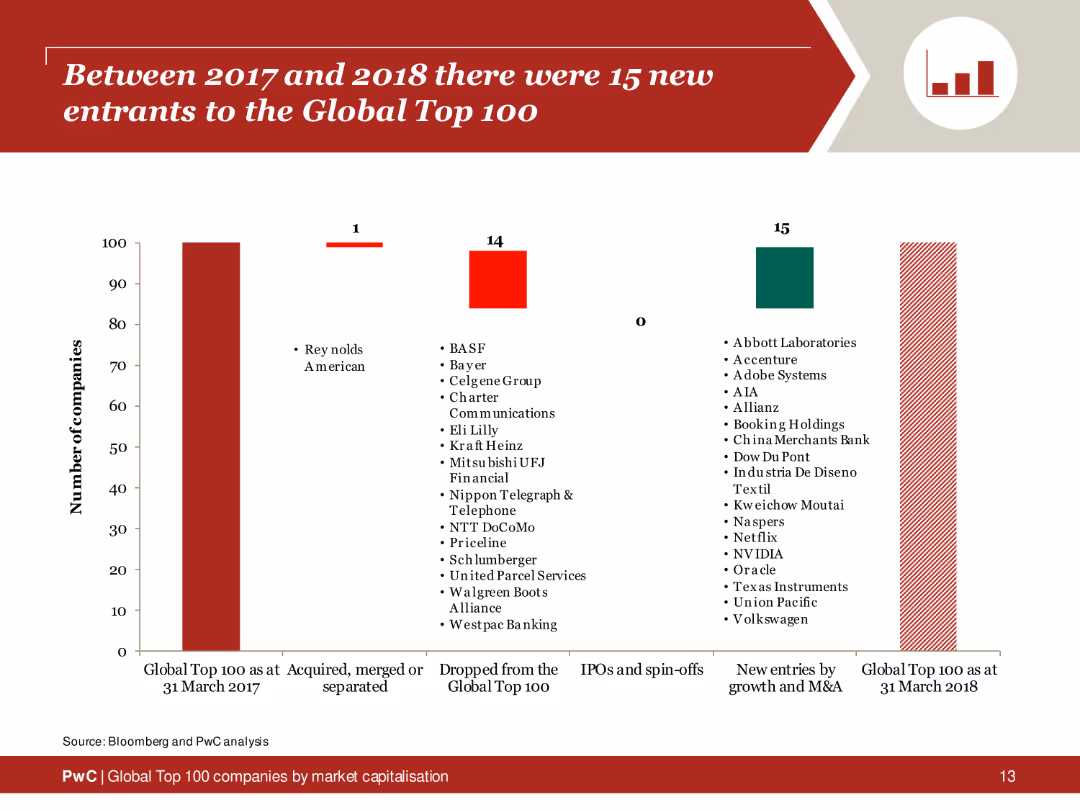
The slide includes a column chart showing the number of companies entering and exiting the Global Top 100 between 2017 and 2018, with textual analysis on the right side.
Market Analysis and Trends
Financial Services
Summary of new entries and exits in the Global Top 100 companies from 2017 to 2018, identifying companies and reasons for changes.
new entrants, global top 100, 2017, 2018, analysis
false
Between 2017 and 2018 there were 15 new entrants to the Global Top 100Global Top 100 companies by market capitalisation
Single Chart
PwC/Strategy&
View slide
A line chart displays systemic stress indicators for the US, Euro Area, and UK, with a commentary section on the right. The y-axis represents stress levels, and the x-axis shows years.
Risk Assessment and Management
Financial Services
The slide reviews systemic financial stress in major economies, noting reduced stress levels since March 2023 peak and discussing potential financial pressures going into 2024.
Financial stress, economic downturn, systemic stress, financial indicators, market trends
false
Systemic financial stress in major economies has generally remained subdued since peaking during the wave of bank failures earlier in the yearYear-end Macro Brief Into the Fog of Winter
Mixed Chart
Accenture
View slide
Uses line and column charts to compare preferences for luxury goods made in Italy, France, and US.
Competitive Landscape
Consumer Goods
Analyzes the growing preference for Italian-made luxury goods among Millennials and Chinese consumers.
luxury goods, Made-in Italy, Millennials, Chinese consumers
false
Made-in Italy increasingly valued by True-Luxury consumers, improving appreciation among Millennial and Chinese consumers2019 True-Luxury Global Consumer I nsight
Multiple Chart
BCG
View slide
Comprising pie charts and column charts showing movements in asset and liability balances, this slide is organized to facilitate easy comprehension of complex financial data.
Financial Performance
Financial Services
Provides insights into Level 3 assets and liabilities, indicating the valuation and risk associated with unobservable assets, crucial for financial risk assessment and investment decision-making.
financial assets, liabilities, risk assessment, valuation
false
Level 3 assets and liabilities As of March 31, 2023, in € bnClient & Creditor Overview July 2023
Multiple Chart
Deutsche Bank
View slide
Graphical representation of income sources with segmented column charts and a comprehensive breakdown of key drivers on the side.
Investment Analysis
Financial Services
Showcases Macquarie Capital’s financial outcomes, particularly the income on equity and debt investments. It serves as an analytical tool for investment performance evaluation, suitable for stakeholders and investment analysts interested in the firm's financial positioning and strategic investment outcomes.
capital, investments, income, analysis, performance
false
Macquarie Capital Result reflects higher income on equity and debt investments and higher fee and commission incomeMorgan Stanley Virtual Hong Kong Summit
Mixed Chart
Morgan Stanley
View slide
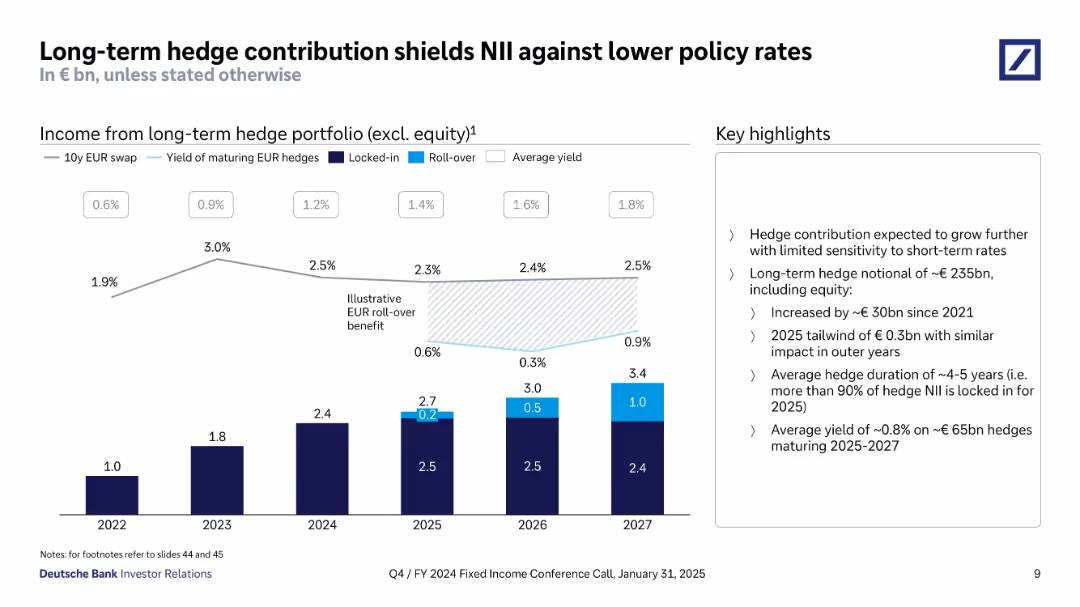
A bar chart with segments for locked-in and roll-over hedge income, overlaid with yield and swap curves. Key highlights in a text box.
Risk Assessment and Management
Financial Services
Demonstrates how Deutsche Bank’s long-term hedge strategy protects NII from policy rate changes. Shows increasing hedge income and yield expectations, along with locked-in benefits for future years. Includes €235bn notional hedge size and ~5-year duration stats.
hedging, NII protection, policy rates, roll-over, locked-in yield, hedge strategy
false
Long-term hedge contribution shields NII against lower policy ratesQ4/FY 2024 Fixed Income Investor Conference Call
Mixed Chart
Deutsche Bank
View slide
Similar to slide 1491, displays three sets of vertical column charts, showing percentages of digital merchants' expected use of various services in Malaysia.
Market Analysis and Trends
Financial Services
Analyses the reliance on digital platforms among Malaysian digital merchants, with predictions for increasing technological integration.
Malaysia, Digital Merchants, Tech-Savvy, Digital Platforms, Financial Services, Future Trends
false
Malaysia Digital merchants are getting tech-savvy and expect to become even more so in the futuree-Conomy SEA 2021 Roaring 20s: The SEA Digital Decade
Multiple Chart
Bain
View slide
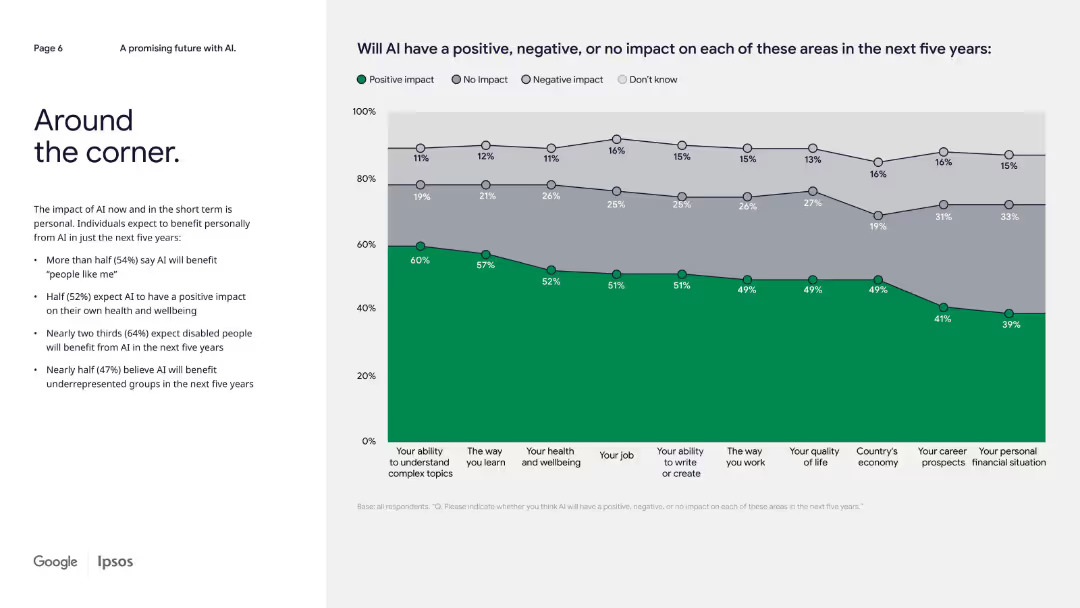
Left-aligned text bullets with a horizontal stacked line graph on the right showing perceived AI impact by category.
Strategic Planning
Artificial Intelligence
The slide predicts AI's short-term personal and societal benefits. More than half expect positive impacts on health, work, and underrepresented groups in the next five years, though optimism varies across categories.
near-future AI, personal benefit, societal impact, short-term outlook, public opinion
false
Around the corner.Our life with AI: The reality of today and the promise of tomorrow
Mixed Chart
IPSOS
View slide
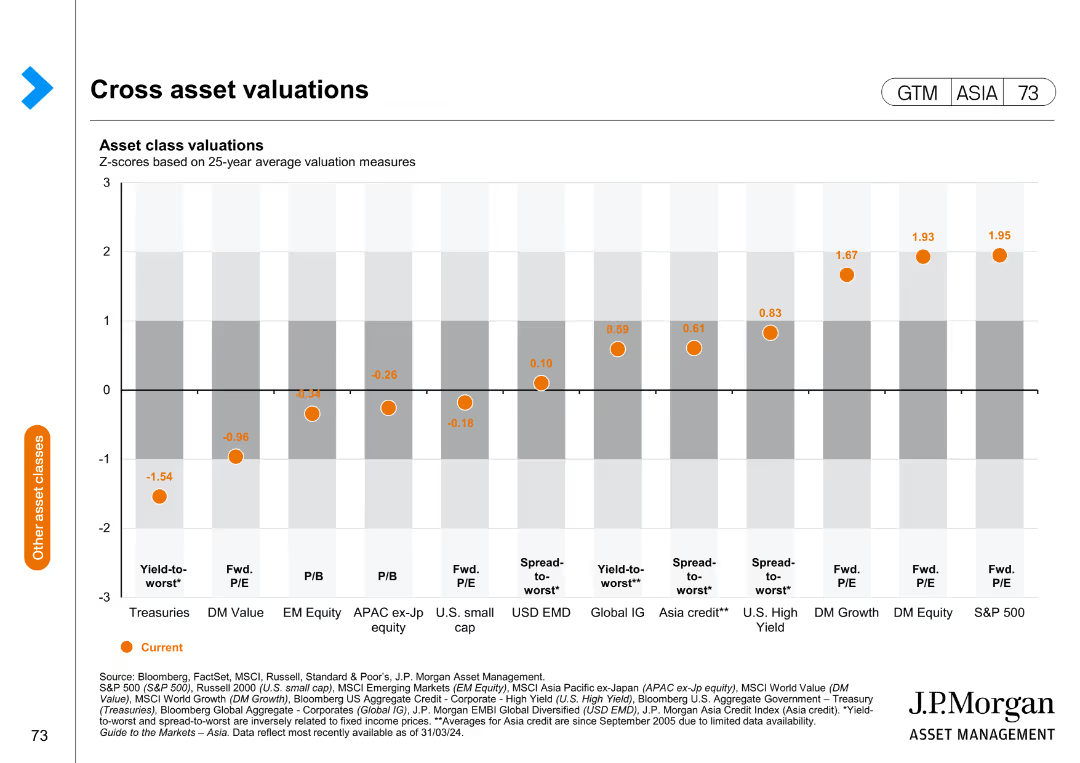
The slide presents a column chart displaying asset class valuations based on 25-year average valuation measures, with different asset classes plotted along the x-axis.
Financial Performance
Financial Services
This slide offers a comparative analysis of asset class valuations, helping in assessing relative value and making informed investment decisions.
asset valuations, financial analysis, investment, comparative analysis, market performance
false
Cross asset valuationsGuide to the Markets Asia | 2Q 2024
Single Chart
JP Morgan
View slide
This slide includes line and column charts that track credit trends over time for branded cards and retail services.
Financial Performance
Financial Services
Offers an analysis of credit trends for branded cards and retail services, highlighting changes in loan performance and provisions.
Credit Trends, Branded Cards, Retail Services, Line Graph, Bar Graph, Performance Analysis
false
Credit Trends for Branded Cards and Retail ServicesEarnings Results Presentation Fourth Quarter and Full Year 2022
Multiple Chart
Citigroup
View slide
Displays a complex visualization of derivatives trading assets under IFRS with a column chart showing impacts of netting and collateral. Also includes a textual description of key points below the chart.
Risk Assessment and Management
Financial Services
Outlines the netting and collateral effects on the financial position of derivatives under IFRS accounting, offering insights into risk management practices and economic exposure.
derivatives, financial, trading, risk, IFRS
false
Derivatives bridgeQ4 / FY 2023 Fixed Income Investor Conference Call
Mixed Chart
Deutsche Bank
View slide
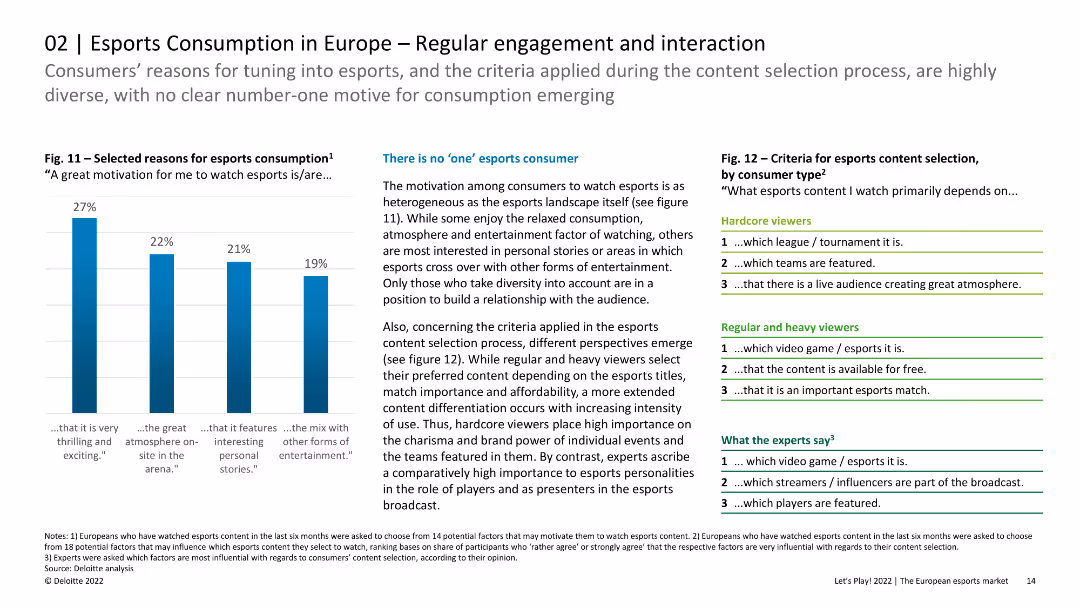
The slide features column charts and lists showing the reasons for esports consumption and criteria for content selection. The layout is organized with clear visual hierarchy.
Customer and Market Segmentation
Media & Entertainment
The slide discusses the diverse motivations and criteria for esports consumption among European viewers, indicating that there is no single dominant reason. It highlights the importance of content differentiation for hardcore, regular, and heavy viewers.
Esports, Engagement, Interaction, Content Selection
false
Consumers’ reasons for tuning into esports, and the criteria applied during the content selection process, are highly diverse, with no clear number-one motive for consumption emergingLet’s Play! 2022 The European esports market
Mixed Chart
Deloitte
View slide
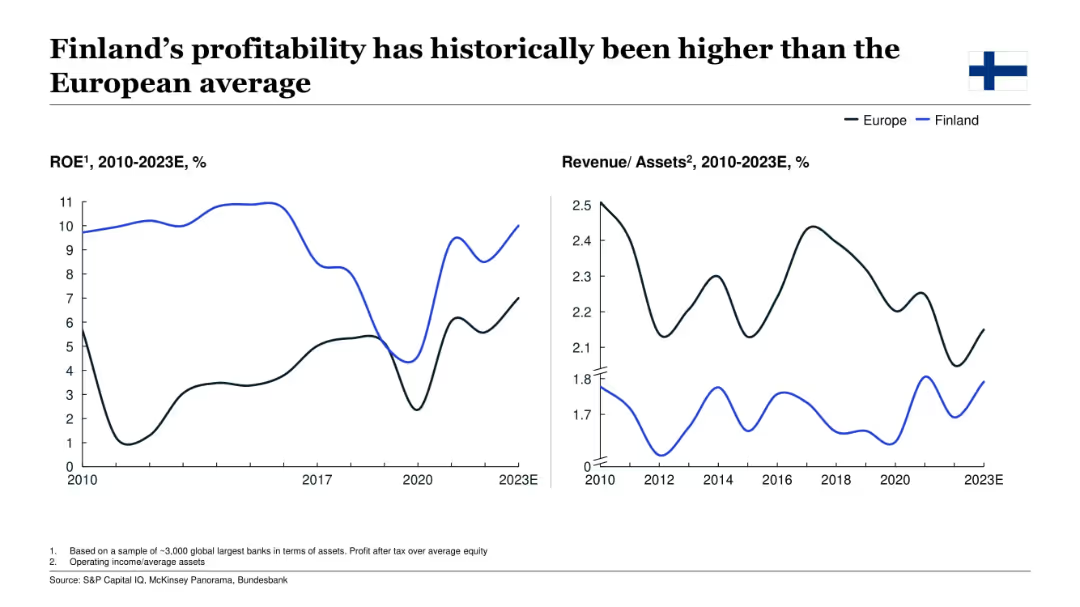
Dual line charts showing Finland’s ROE and revenue/assets from 2010–2023E, compared to the European average.
Financial Performance
Financial Services
This slide focuses on Finland’s bank performance, showing historically higher ROE versus the European average, though revenue/assets are lower. It underscores sustained profitability and offers insight into the structural dynamics of Finnish banking institutions.
Finland, profitability, ROE, revenue/assets, European banks, finance, historical trend
false
Finland’s profitability has historically been higher than the European averageGlobal Banking Annual Review 2023
Multiple Chart
McKinsey
View slide
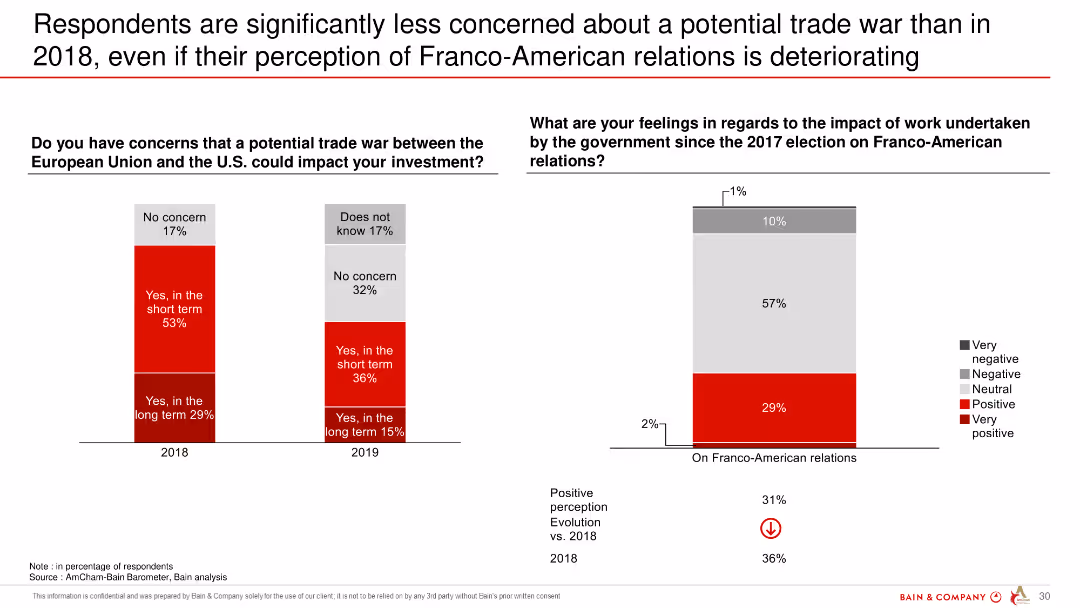
The slide displays two column charts. The left chart compares concerns about a trade war in 2018 and 2019, while the right chart shows respondents' feelings about Franco-American relations over the same period.
Market Analysis and Trends
Government & Public Sector
The slide shows a decrease in concerns about a trade war between the EU and the US from 2018 to 2019, despite worsening perceptions of Franco-American relations.
trade war, Franco-American relations, perceptions, EU, US, survey, comparison
false
Respondents are significantly less concerned about a potential trade war than in 2018, even if their perception of Franco-American relations is deterioratingAmCham – Bain Barometer 20th – Edition
Multiple Chart
Bain
View slide
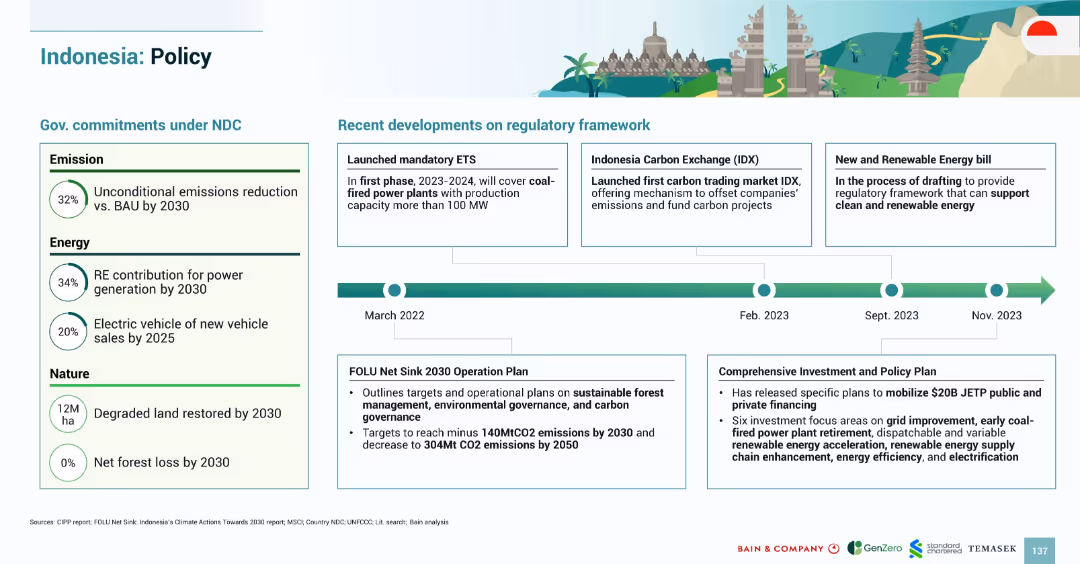
Timeline-based layout with left-side policy targets and right-side regulatory updates; illustrations and flags add clarity
Regulatory and Compliance
Government & Public Sector
Summarizes Indonesia’s regulatory progress on green policy, including NDC commitments, ETS launch, and carbon exchange developments, along with forest and investment frameworks
Indonesia policy, ETS, IDX, NDC, forest carbon, emissions targets, energy bill, regulatory updates
false
Indonesia: PolicySOUTHEAST ASIA’S GREEN ECONOMY 2024
Mixed Chart
Bain
View slide
The slide features a scatter plot with bubbles of various sizes and colors representing different industries and use cases. The axes show 'Volume' of data and 'Impact score' of machine learning applications.
Industry Overview
Technology & Software
This slide analyzes the potential impact of machine learning across various industries like healthcare, consumer goods, and energy, highlighting areas with higher data volumes and impact scores.
Machine Learning, Industries, Data Volume, Impact, Visualization
false
Machine learning has broad potential across industries and use casesA FUTURE THAT WORKS: AI, AUTOMATION, EMPLOYMENT, AND PRODUCTIVITY
Single Chart
McKinsey
View slide
The slide features a table outlining the evolution of biomass drivers from 2010 to 2050+, covering aspects such as supply of feedstocks, infrastructure maturity, sociopolitical pressures, biofuel technology, and competition.
Market Analysis and Trends
Energy & Utilities
This slide examines the shifting drivers of biomass energy over the next decades, highlighting how factors like feedstock supply, infrastructure development, sociopolitical pressures, and technological advancements will influence B2E penetration.
biomass drivers, feedstock supply, infrastructure maturity, sociopolitical pressures, biofuel technology, competition, 2010-2050
false
The drivers of biomass will shift as enablers successively ariseDeveloping sustainable carbon circularity Looking at advanced applications and business models
Table
Kearney
View slide
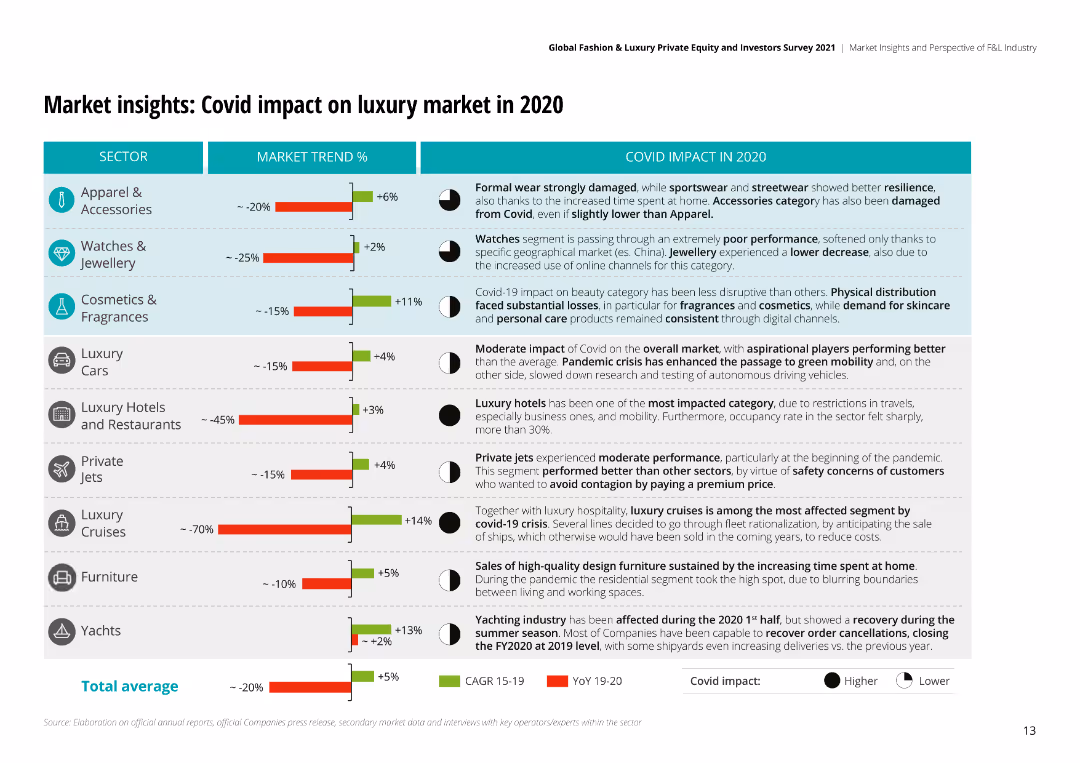
The slide uses a combination of bar charts and textual analysis to detail the impact of COVID-19 on different luxury sectors, including percentages of market trends.
Market Analysis and Trends
Retail & E-commerce
Analyzes the impact of COVID-19 on the luxury market, showing how various sectors like apparel, watches, and hotels were affected during the pandemic.
COVID-19, market impact, luxury, retail, e-commerce, apparel, watches, analysis
false
Market insights: Covid impact on luxury market in 2020Global Fashion & Luxury Private Equity and Investors Survey 2021
Mixed Chart
Deloitte
View slide
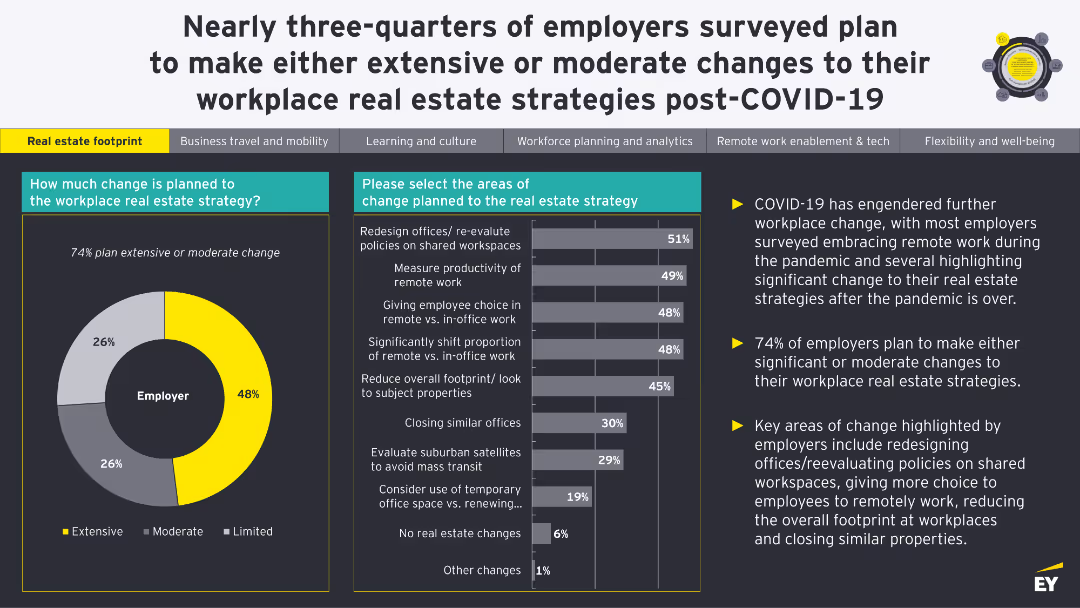
The slide includes bar charts and pie charts depicting changes in business travel and mobility plans post-COVID-19, highlighting employee preferences and employer strategies.
Market Analysis and Trends
Transportation & Logistics
The slide focuses on changes in business travel and mobility post-COVID-19, showing how employee travel frequency and preferences have shifted, and detailing employer plans to adapt to these changes.
business travel, mobility, COVID-19, changes, strategies
false
Nearly three quarters of employers surveyed plan to make either extensive or moderate changes to their workplace real estate strategies post COVID 19Physical return and work reimagined study
Multiple Chart
EY
View slide
The slide has several sections: a large bar graph at the bottom, two smaller graphs to the right, and a section with bullet points explaining the data at the top left corner.
Regulatory and Compliance
Environmental Services & Sustainability
The slide presents the greenhouse gas emissions data for FY22, showing the progress and targets set by the company. It is suitable for audiences interested in environmental impact data and the company’s efforts in reducing its carbon footprint.
emissions, greenhouse gas, data, environmental impact
false
FY22 Greenhouse Gas Emmissions2022 Environmental, Social, Governance Report
Multiple Chart
Booz Allen Hamilton
View slide
Features a silhouette of construction workers against a sunset, overlaid with diagonal blue and white design elements. The slide is visually simple with a bold title, a website link, and a subtitle stating an economic impact.
Operational Efficiency
Real Estate & Construction
The slide's focus is on the economic impact on affordable housing, likely used for a presentation on market analysis or investment opportunities within the real estate sector.
Affordable Housing, Economy, Real Estate, Construction, Investment, Market Analysis, Impact, Finance
false
THE ECONOMY AND ITS IMPACT ON AFFORDABLE HOUSINGTHE ECONOMY AND ITS IMPACT ON AFFORDABLE HOUSING
Title
Citigroup
View slide
Presents a column chart comparing the average weekly study hours of students in Nigerian public schools to those in various other countries, highlighting the educational challenges in Nigeria.
Strategic Planning
Education & Training
Analyzes the limitations in study hours faced by students in Nigerian public schools due to inadequate power supply, using international benchmarks to underscore the need for infrastructural improvements like solar power installations.
education, Nigeria, study hours, international comparison, public schools, power supply, benchmarks
false
Study hours: Limited power supply is a major constraint to study time of boarding students, as several public boarding schools lack electricity accessSocio-economic case for deepening solar PV deployment in Nigeria
Multiple Chart
BCG
View slide
Sectioned layout with distinct points and icons.
Strategic Planning
Professional Services
This slide highlights how HR can lead change in reimagining work within organizations, with a focus on agility and digitalization.
HR, Change, Digitalization, Agility, Leadership
false
What does this mean for HR?Future of Work - How work is enabled?
Header Horizontal
Deloitte
View slide
Slide includes a clear title, three sets of bullet lists under "Traditional approaches" and "Additional approaches", icons, and a clickable white paper download link.
Industry Overview
Technology & Software
This slide presents different digital business models that companies can adopt, such as "Build", "Buy", "Partner", "Invest", and "Incubate/Accelerate". It describes when each approach is most appropriate.
digital business models, build, buy, partner, invest, incubate
false
DIGITAL ENTERPRISE: DIGITAL BUSINESS MODELSDigital Transformation Initiative In collaboration with Accenture
Header Vertical
Accenture
View slide
Slide with a stacked column chart showing the growth of the SEA Internet economy GMV from 2015, projecting significant growth by 2025, categorized by sectors like e-Commerce and Online Travel.
Financial Performance
Technology & Software
Presents the growth trajectory of the SEA Internet economy, highlighting resilience and future potential in various digital sectors, important for investment and economic forecasts.
SEA, Internet economy, GMV, growth, e-Commerce, Online Travel, forecast, resilience
false
The SEA Internet economy will exceed $100B GMV this year despite headwindse-Conomy SEA 2020 At full velocity: Resilient and racing ahead
Single Chart
Bain
View slide
Features a trend line and column charts depicting CIR development and targeted operational efficiencies, using a clean and straightforward layout to emphasize data.
Operational Efficiency
Financial Services
Highlights strategies for reducing the cost/income ratio through operational efficiencies and revenue growth, suitable for analyzing operational cost management.
CIR, reduction, operational, efficiency, cost, income, financial, management, strategies, growth
false
Focus on cost base supports further CIR reductionClient & Creditor Overview May 31, 2023
Mixed Chart
Deutsche Bank
View slide
Several rows categorizing types of COVID-19 tests such as presence of viral genome, immune response, and antigen tests, including their availability status and brands involved.
Product and Service Analysis
Healthcare & Pharmaceuticals
Provides an overview of the available COVID-19 testing technologies, their developers, and the stage of availability, highlighting the evolving landscape in diagnostic tests.
COVID-19, testing landscape, viral genome, immune response, antigen tests, diagnostic tests, healthcare technology
false
Testing landscape is changing: Tests to detect viral genome and patient immune response are now availableCOVID-19 BCG Perspectives Publication #5 with a focus on Revamping Organizations for the New Reality
Table
BCG
View slide
The slide includes various charts and graphs depicting changes in workplace dynamics, such as remote work percentages and engagement metrics.
Organizational Structure and Change
Professional Services
It discusses changes in the strategic procurement team's working environment, engagement, retention, diversity, and gender balance.
Workplace dynamics, remote work, engagement, retention, diversity, gender balance, procurement
false
Leadership in third-party spend translates to measurable advantageExcellence in Procurement
Multiple Chart
Kearney
View slide
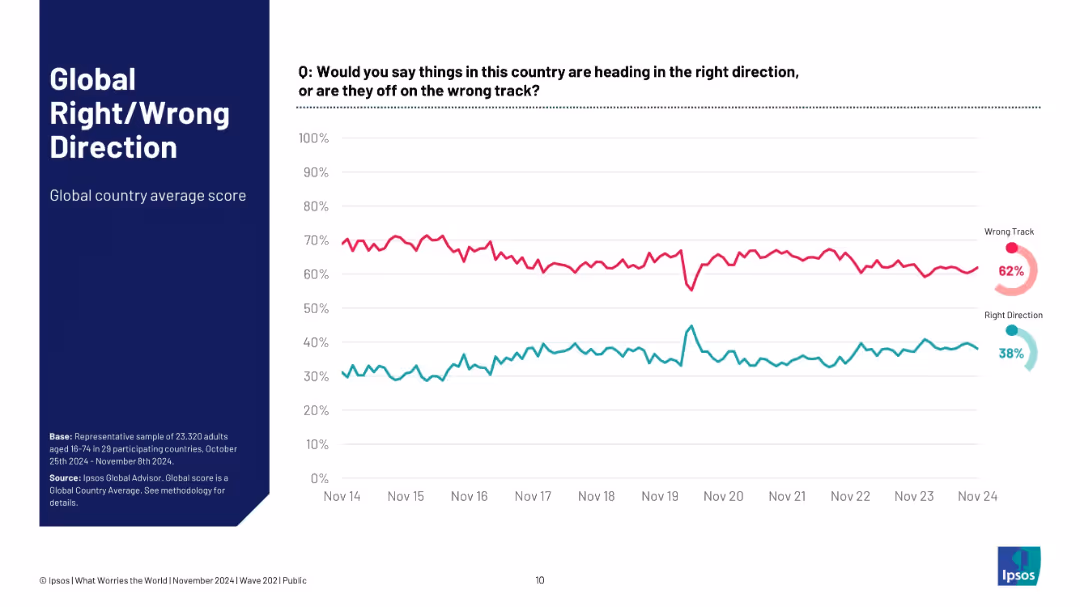
Full-width time-series line chart; visualizes percentage of people believing country is on right/wrong track.
Market Analysis and Trends
Professional Services
This slide tracks a global average of sentiment on national direction over the last 10 years. While there is volatility, a clear long-term trend shows more people believing things are on the wrong track. The gap remains persistent, reflecting ongoing global discontent.
direction sentiment, wrong track, global average, Ipsos, perception trend, dissatisfaction, 10-year trend
false
Global Right/Wrong DirectionWhat Worries the World
Multiple Chart
IPSOS
View slide
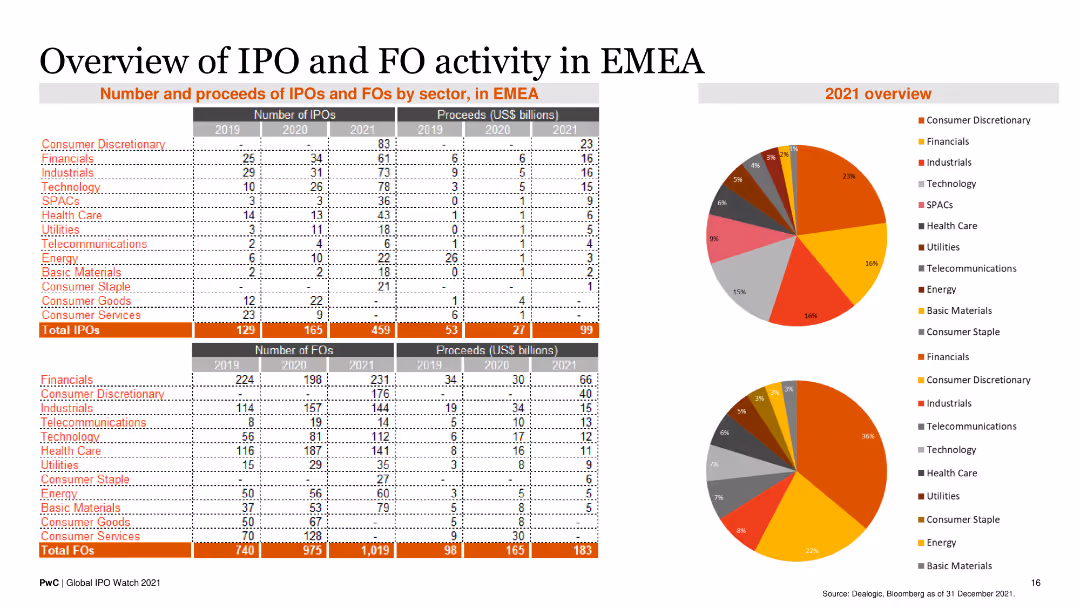
The slide includes tables and pie charts displaying the number and proceeds of IPOs and FOs by sector in the EMEA region for 2019, 2020, and 2021, along with sector breakdowns.
Market Analysis and Trends
Financial Services
It provides a comprehensive overview of IPO and FO activities in EMEA by sector, useful for understanding market trends and sector-specific performance.
IPOs, FOs, sector analysis, EMEA, financial data
false
Number and proceeds of IPOs and FOs by sector, in EMEAGlobal IPO Watch 2021 A PwC Global IPO Centre publication
Multiple Chart
PwC/Strategy&
View slide
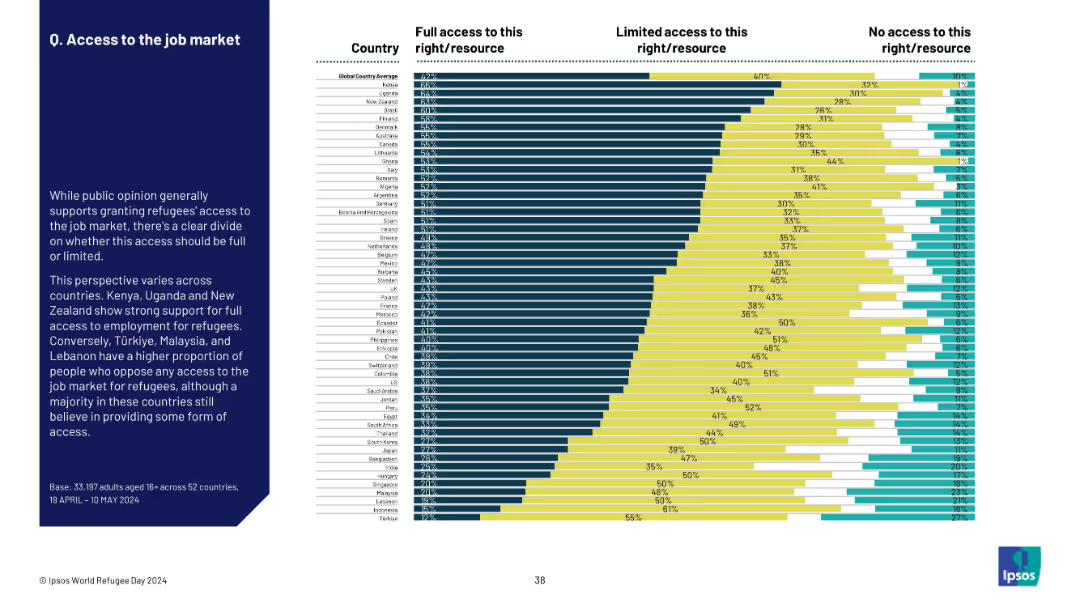
Country-ranked chart with horizontal bars for full, limited, and no access to employment for refugees.
Regulatory and Compliance
Government & Public Sector
The slide explores global support for refugee access to job markets. Kenya and Uganda show highest support for full access. Türkiye and Malaysia lean more toward restricted or no access, reflecting differing national sentiments.
refugees, employment, access, job market, public opinion, national policy, economic inclusion, Ipsos
false
Q. Access to the job marketWORLD REFUGEE DAY
Mixed Chart
IPSOS
View slide
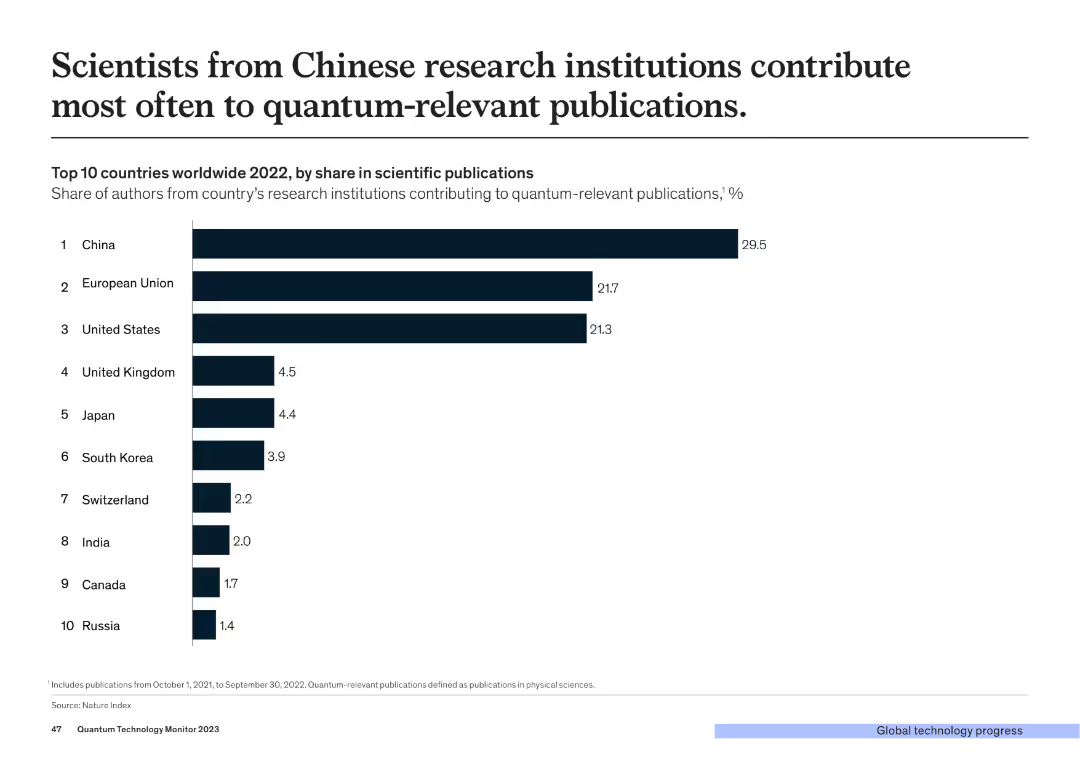
This slide displays a column chart ranking the top 10 countries by share of authors contributing to quantum-relevant publications in 2022. Countries include China, EU, USA, UK, Japan, and others.
Market Analysis and Trends
Technology & Software
The slide illustrates the leading countries in terms of contributions to quantum-relevant scientific publications, with China and the European Union topping the list.
Scientists, Publications, Quantum, China, EU
false
Scientists from Chinese research institutions contribute most often to quantum-relevant publications.Quantum Technology Monitor
Single Chart
McKinsey
View slide
Features a column chart showing the capital expenditure (capex) of major telco operators from 2016 to 2020, with a line graph overlay representing capex to revenue ratio. Color-coded for each operator to show investment patterns relative to revenue.
Operational Efficiency
Telecommunications
Discusses the capital investment trends in the telecommunications industry, highlighting how smaller operators are increasingly investing in expanding their 4G networks, contrasted with Telkom's steady investment strategy.
capex, 4G network, investment, Telkom, telecommunications industry, revenue ratio
false
Telkom capex has remained constant, with smaller players investing slightly more to expand their 4G networkIndonesia case study
Multiple Chart
BCG
View slide
The slide includes text sections and a column chart comparing the percentage of Gen Zs and Millennials engaging in side jobs. It is organized to highlight the financial pressures leading to increased participation in side jobs.
Market Analysis and Trends
Retail & E-commerce
This slide explores the financial pressures faced by Gen Zs and Millennials, showing the rise in side jobs as a response to living paycheck to paycheck, and details the types of side jobs and motivations behind taking on additional work.
Side jobs, financial pressure, paycheck to paycheck, Gen Z, Millennials
false
Side jobs are on the rise as over half live paycheck to paycheck2023 Gen Z and Millennial Survey
Mixed Chart
Deloitte
View slide
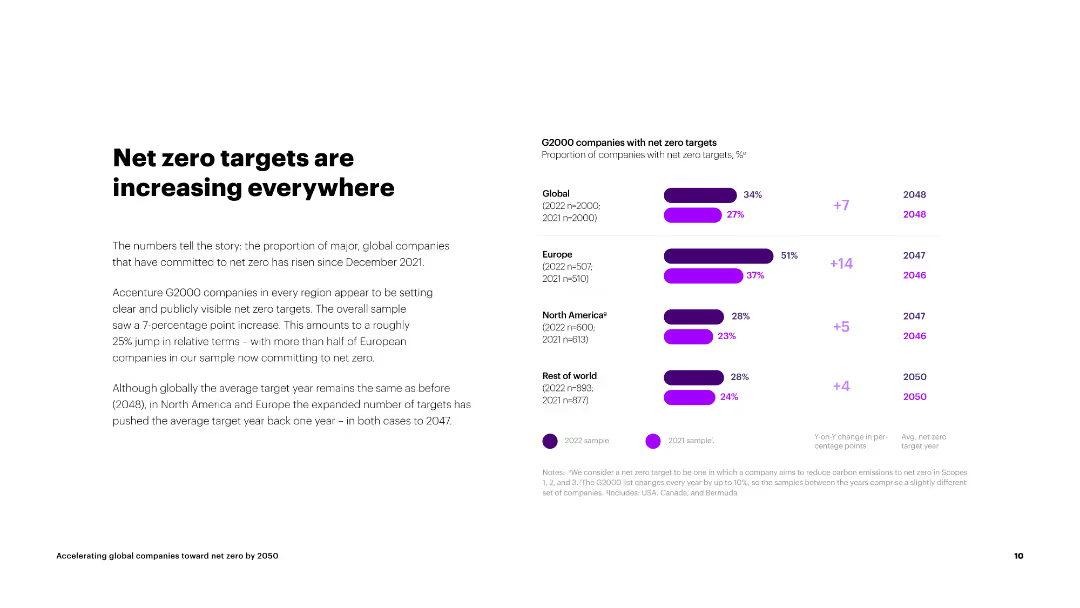
The slide includes a column chart on the right displaying the proportion of G2000 companies with net zero targets by region and their average target years.
Strategic Planning
Environmental Services & Sustainability
The slide explains the increase in global companies committing to net zero targets since December 2021, with regional comparisons and average target years.
net zero, targets, G2000, global, Europe, North America, rest of world, average target year
false
Net zero targets are increasing everywhereAccelerating global companies toward net zero by 2050
Mixed Chart
Accenture
View slide
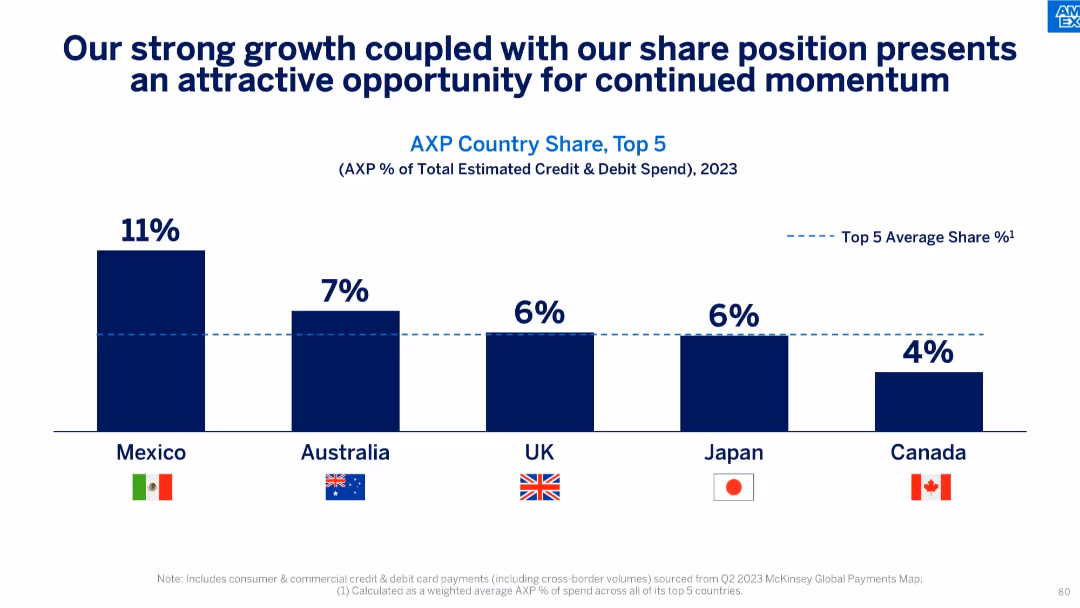
Horizontal bar chart with country flags; highlights percentage share in 5 key markets.
Strategic Planning
Financial Services
Highlights AXP's market share in credit and debit card spend across five countries, with Mexico leading at 11%. The slide suggests that this performance, paired with ongoing growth, positions AXP for further expansion in these regions.
market share, country analysis, card spend, credit & debit, growth opportunity, international, financial services, AXP share
false
Our strong growth coupled with our share position presents an attractive opportunity for continued momentumAmerican Express Investor Day 2024
Single Chart
McKinsey
View slide
The slide presents a column chart comparing technology and product investments in dollars over years 2019 and 2022 Outlook. There's a side section listing impacts of technology investments with corresponding percentage values and brief descriptions. Colors differentiate categories and investments over time.
Market Analysis and Trends
Technology & Software
This slide is likely used for presenting financial investment growth in technology over time, highlighting areas of tech impact, and business strategy alignment. It visualizes investment data to demonstrate strategic focus and outcomes.
investments, technology, growth, impact, strategy, finance, data visualization, business, planning, analytics
false
We continue to deliver customer and business value as we modernize our technologyConsumer & Community Banking
Mixed Chart
JP Morgan
View slide
Balanced layout with four key strategy icons on the left and three upward-pointing arrows on the right. Clean design with company color scheme.
Strategic Planning
Financial Services
Strategic initiatives for customer relations, services, and growth in a financial institution. Objectives for customer engagement and market share are highlighted.
Strategy, Customer Engagement, Product Development, Market Expansion, Value Proposition, Household Growth, Financial Services
false
Looking ahead, we will continue to earn the right to be at the center of our customers’ financial livesConsumer & Community Banking
Header Vertical
JP Morgan
View slide
Contains a column chart for total revenue distribution and a block diagram for the service portfolio, divided into new service business and core service business.
Operational Efficiency
Industrial & Manufacturing
Highlights the distribution of industrial company revenue from services and product segments, and outlines various service portfolio components for business efficiency.
Revenue, Service Portfolio, Industrial, Efficiency, Distribution
false
Figure 1a: Total revenue distributionBlueprint for Service Success
Mixed Chart
Accenture
View slide
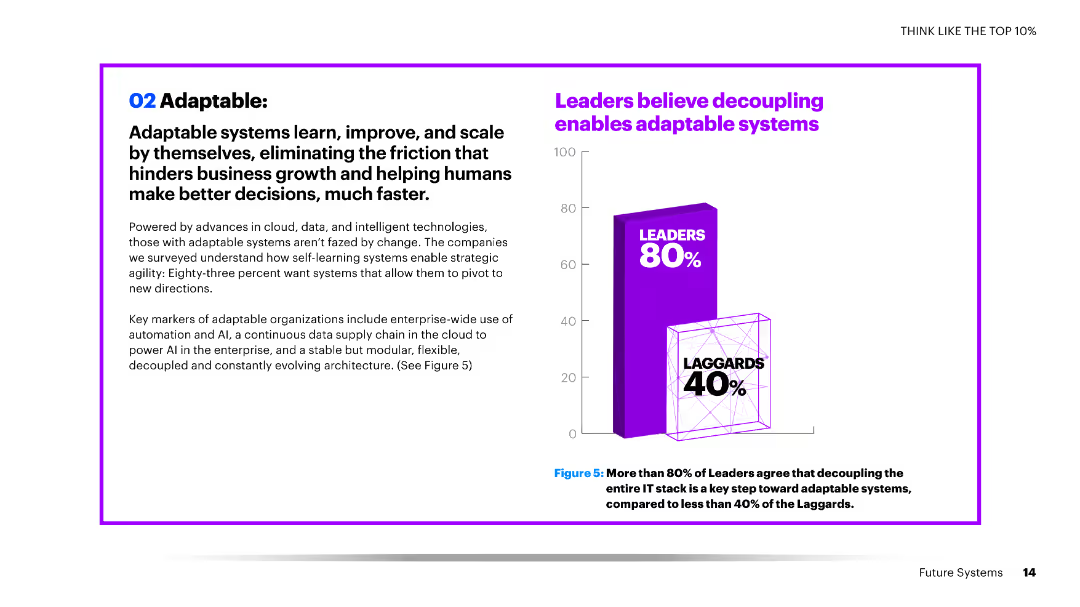
A slide with a large column chart showing the percentage of leaders and laggards who believe in the importance of decoupling IT systems for adaptability.
Technology and Digital Transformation
Technology & Software
The slide emphasizes the belief among leaders that decoupling IT systems is crucial for creating adaptable systems, which is less recognized among laggards, highlighting a key difference in strategic approaches.
decoupling, adaptable systems, leaders, laggards, IT systems, belief, importance, adaptability, strategy, approaches
false
Leaders believe decoupling enables adaptable systemsFULL VALUE. FULL STOP How to scale innovation and achieve full value with Future Systems
Mixed Chart
Accenture
View slide
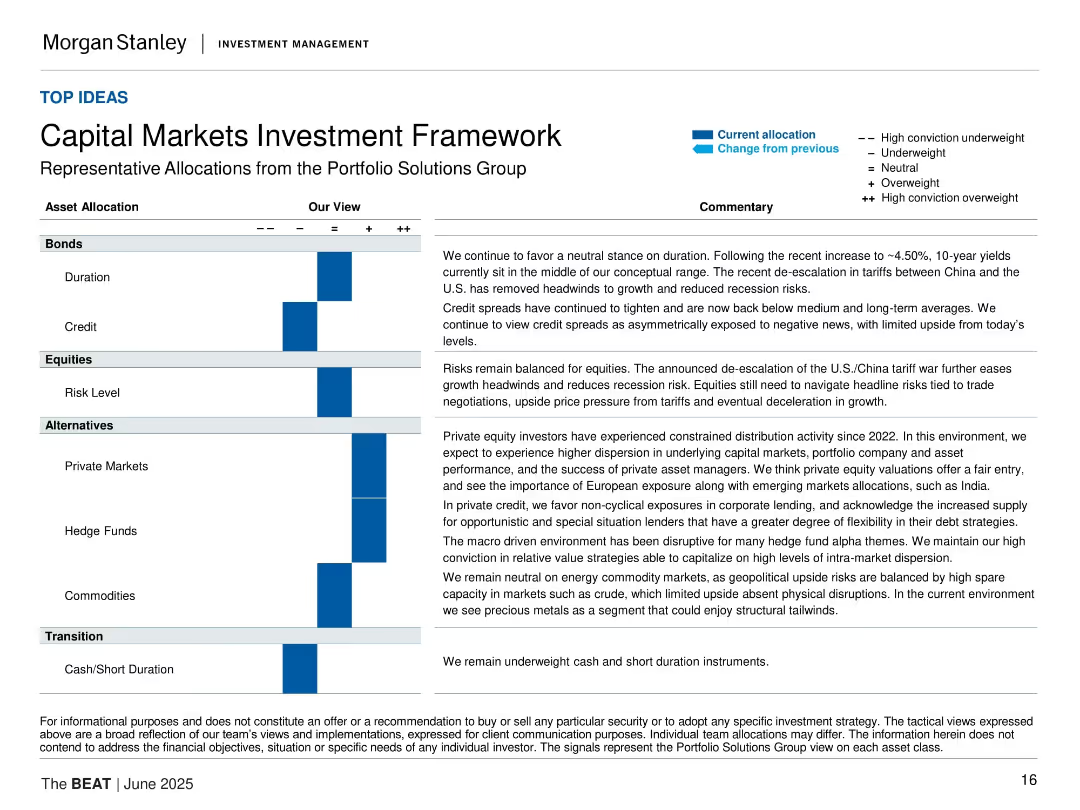
Matrix of asset allocation views with horizontal bars and textual commentary; structured, corporate layout.
Strategic Planning
Financial Services
The slide presents the Portfolio Solutions Group’s tactical asset allocation views across bonds, equities, alternatives, and cash. Commentary explains each allocation decision within a macroeconomic context.
capital markets, investment strategy, asset allocation, portfolio, tactical view, duration, credit, equities, alternatives
false
Capital Markets Investment FrameworkThe BEAT June 2025
Table
Morgan Stanley
View slide
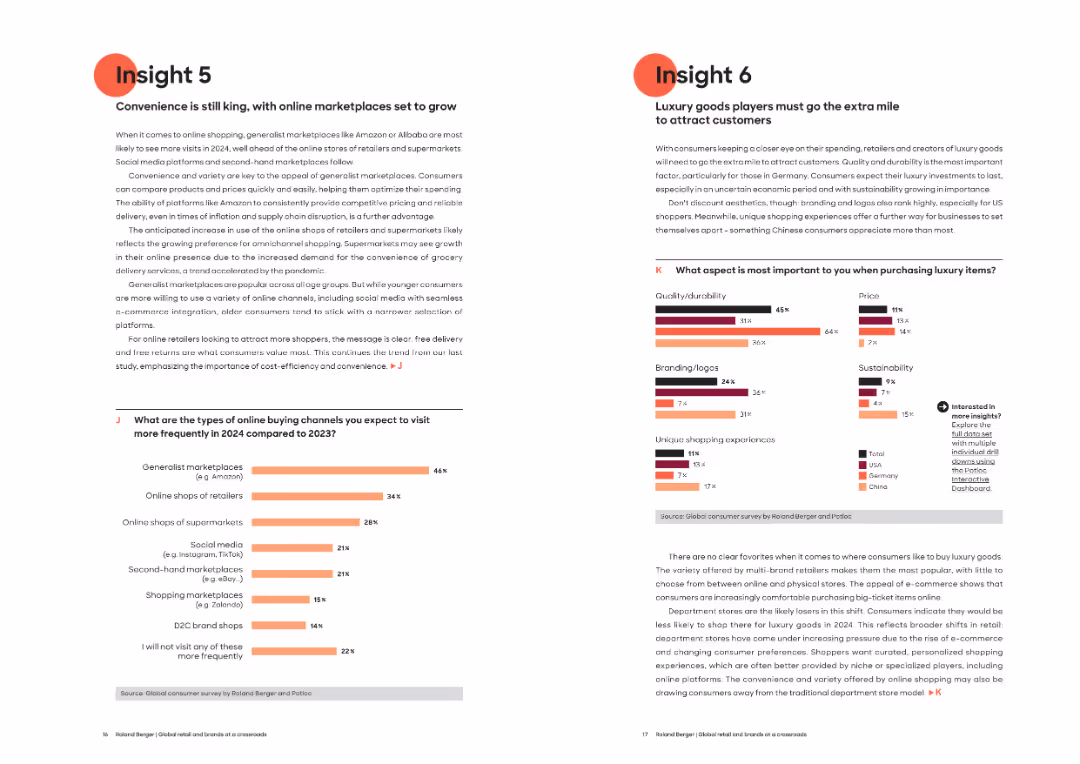
Two-column split slide, each side with a chart and a few paragraphs. Consistent use of red highlights and structured formatting for clarity.
Market Analysis and Trends
Retail & E-commerce
Insight 5 discusses the growing dominance of generalist marketplaces like Amazon for online shopping due to convenience and cost. Insight 6 focuses on luxury goods purchasing drivers, noting quality, sustainability, and unique experiences as critical factors.
Online marketplaces, luxury goods, consumer behavior, shopping trends, generalist platforms, branding, sustainability, price sensitivity
false
Insight 5 Convenience is still king, with online marketplaces set to growGlobal retail and brands at a crossroads
Multiple Chart
Roland Berger
View slide
Continuation from the previous slide, this one similarly employs a mix of informative icons and text to express key points about the operational necessity of edge computing, showcased against a dark backdrop.
Technology and Digital Transformation
Technology & Software
This slide emphasizes the operational necessity of edge computing in modern business, highlighting the growing importance of data regulation, enterprise spend, and distributed computing's popularity. It lays out the escalating pace of data volume growth and the potential for edge computing to offer real-time insights and more significant operational flexibility.
Edge Computing, Data Regulation, Operational Necessity
false
Why should leaders pay attention? 2McKinsey Technology Trends Outlook 2022 Cloud and edge computing
Pillar
McKinsey
View slide
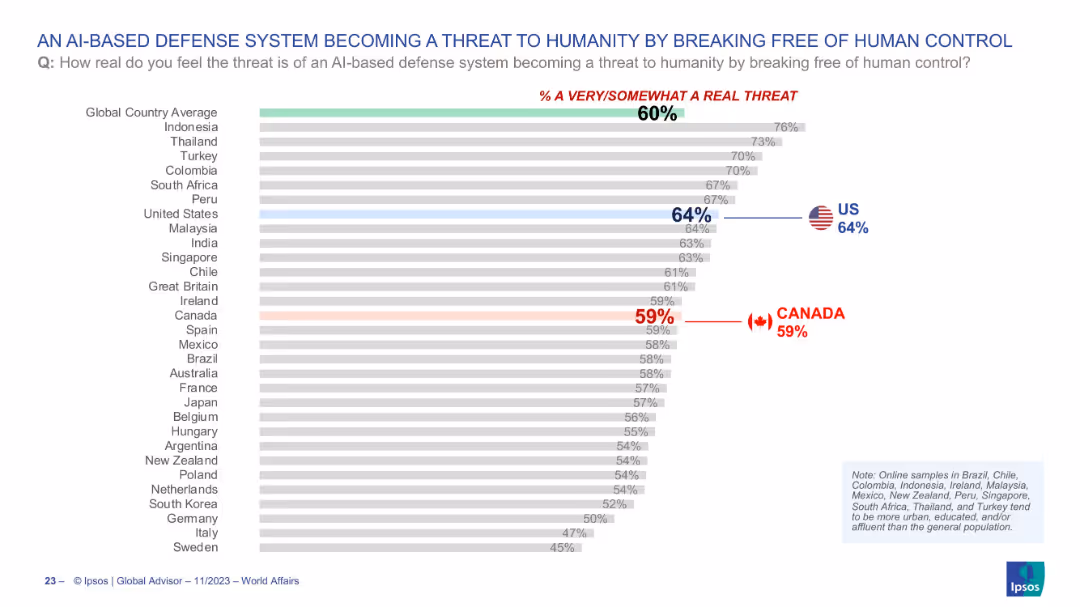
Horizontal bar chart depicting global views on AI-based defense systems becoming uncontrollable; highlights Canada and the US.
Risk Assessment and Management
Artificial Intelligence
This chart illustrates global concern over AI-based defense systems potentially becoming a threat to humanity by escaping human control. With the global average at 60%, the US and Canada register 64% and 59% respectively, reflecting moderate anxiety over emerging AI risks in military contexts.
AI threat, defense systems, artificial intelligence, control risk, public perception, survey, technology, Ipsos
false
AN AI-BASED DEFENSE SYSTEM BECOMING A THREAT TO HUMANITY BY BREAKING FREE OF HUMAN CONTROLWORLD AFFAIRS 2023
Single Chart
IPSOS
View slide
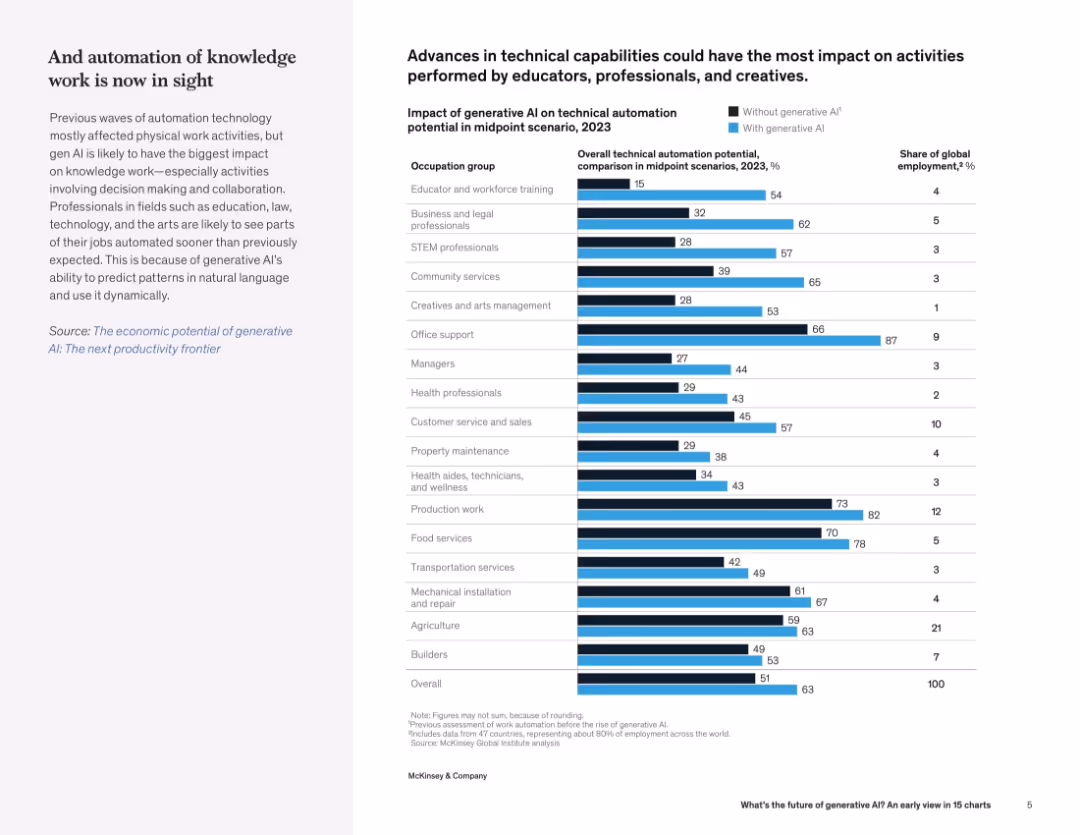
Bar chart comparing automation potential across occupations with and without generative AI; left panel discusses automation of knowledge work.
Human Resources and Talent Management
Artificial Intelligence
The slide presents how generative AI significantly increases automation potential in various occupations, especially knowledge work like education, legal, and creative roles. It quantifies AI’s impact on global employment.
automation, generative AI, occupations, workforce impact, knowledge work, employment trends
false
Advances in technical capabilities could have the most impact on activities performed by educators, professionals, and creatives.What’s the future of generative AI? An early view in 15 charts
Mixed Chart
McKinsey
View slide
Contains four numbered sections, each describing a different strategy for overcoming AI deployment challenges, presented in a clear and structured manner. The use of icons and minimal text helps emphasize the strategies effectively.
Technology and Digital Transformation
Technology & Software
Offers strategies for optimizing AI deployment, including investing in culture and leadership, transforming operations, and orchestrating tech and talent. This slide is ideal for strategic planning sessions in technology sectors.
AI deployment, strategies, culture investment, operations transformation, tech orchestration, strategic planning
false
Rewards can be lucrative for organizations that overcome these challengesFueling the AI transformation: Four key actions powering widespread value from AI, right now.
Linear Flow
Deloitte
View slide
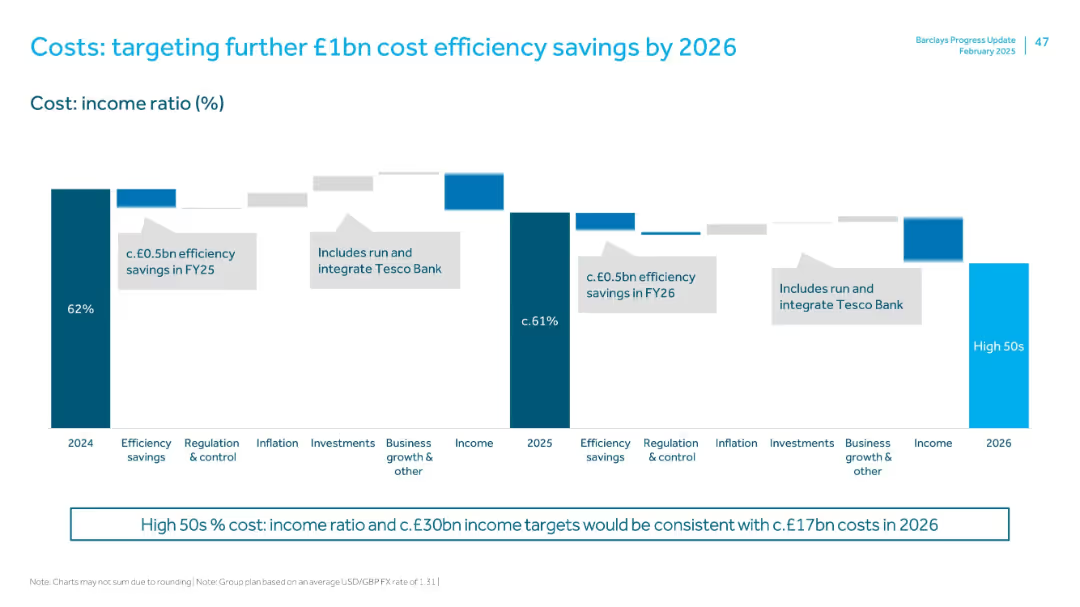
Waterfall chart outlining cost:income ratio (CIR) changes from 2024–2026, highlighting efficiency drivers and integration costs.
Operational Efficiency
Financial Services
Details Barclays’ plan to reduce CIR from 62% (2024) to high 50s by 2026. Targets £1bn in cost savings via efficiency gains, business growth, and integrating Tesco Bank. Reinforces income and regulatory factors.
cost savings, efficiency, Tesco Bank integration, CIR, operational improvement
false
Costs: targeting further £1bn cost efficiency savings by 2026FY 2024 Results Presentation
Mixed Chart
Barclays
View slide
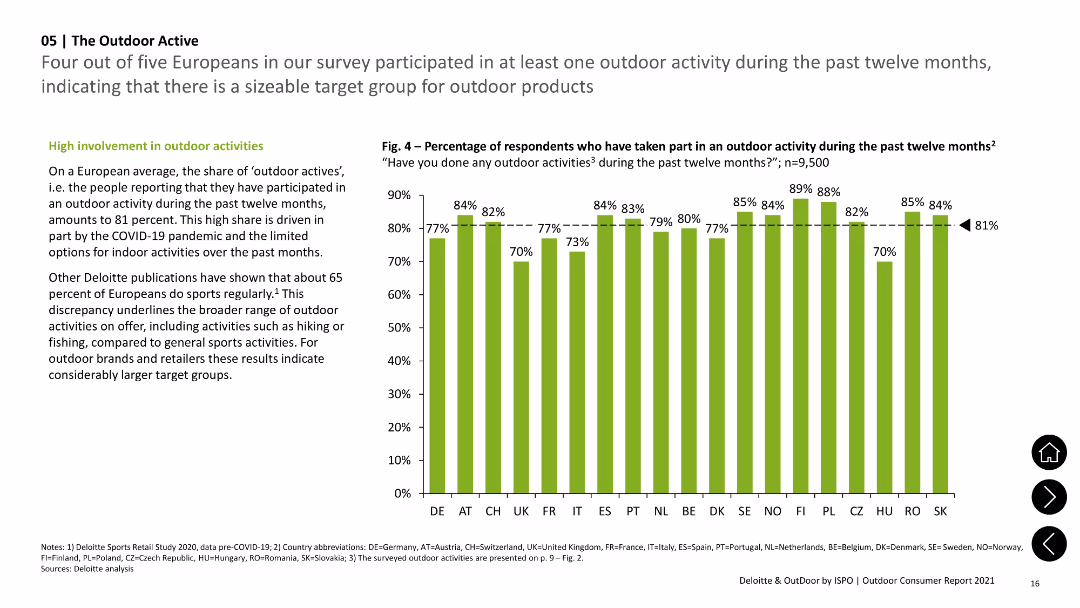
Features a column chart showing percentages of outdoor activity participation across various European countries with text summarizing high involvement in these.
Market Analysis and Trends
Consumer Goods
Shows the percentage of Europeans participating in outdoor activities, emphasizing high involvement rates and variation among countries.
Outdoor, Activities, Europe, Participation, Survey
false
Four out of five Europeans in our survey participated in at least one outdoor activity during the past twelve months, indicating that there is a sizeable target group for outdoor productsOutdoor Consumer Report 2021 Deloitte & OutDoor by ISPO
Mixed Chart
Deloitte
View slide
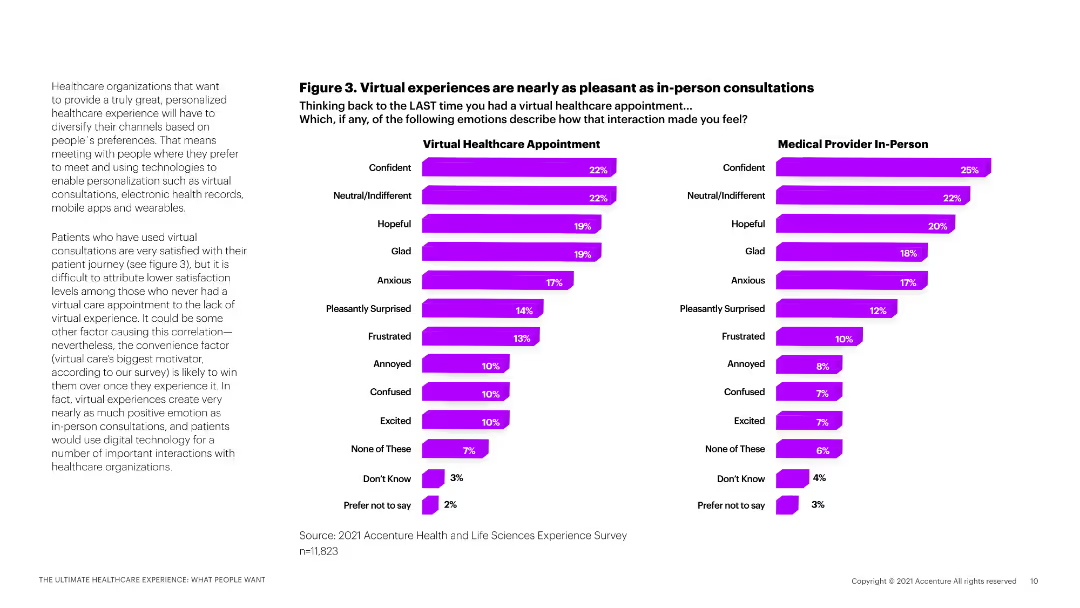
The slide includes two column charts comparing emotional responses to virtual healthcare appointments versus in-person consultations.
Market Analysis and Trends
Healthcare & Pharmaceuticals
This slide compares patient satisfaction and emotional responses between virtual and in-person healthcare consultations.
virtual healthcare, in-person consultations, patient satisfaction, emotional response, healthcare comparison
false
Figure 3. Virtual experiences are nearly as pleasant as in-person consultationsThe ultimate healthcare experience: what people want
Multiple Chart
Accenture
View slide
This slide includes a column chart showing the CO2 capture rate per case, with three distinct bars (CO2 released, CO2 avoided, Extra CO2 captured).
Market Analysis and Trends
Energy & Utilities
The slide illustrates the CO2 capture rate and LCOH increase for brown H2 sources when coupled with CCS, highlighting the additional costs involved.
CO2 capture, LCOH, brown H2, CCS, emissions, costs
false
CO2 capture rate per caseHydrogen applications and business models
Single Chart
Kearney
View slide
Column charts showing provisions for credit losses over several quarters with an additional line graph overlay for average loans. Includes key highlights.
Risk Assessment and Management
Financial Services
Discusses credit loss provisions, showcasing trends and risk management strategies in response to economic conditions.
Credit losses, risk management, trends
false
Provision for credit losses In € m, unless stated otherwiseQ1 2023 results
Mixed Chart
Deutsche Bank
View slide
Displays column charts analyzing demographic responsiveness to inclusive marketing across various industries.
Market Analysis and Trends
Professional Services
Discusses the impact of inclusive marketing on consumer perceptions and brand loyalty, focusing on diverse demographics.
marketing, inclusive, demographics, brand loyalty, advertising, consumer perception
false
FIGURE 1 Younger generations more often notice representative advertising at the time of purchase consideration2022 Global Marketing Trends
Mixed Chart
Deloitte
View slide
Matrix layout with colored squares indicating progress across ambition, roadmap, accelerator, and investment
Performance Metrics and KPIs
Environmental Services & Sustainability
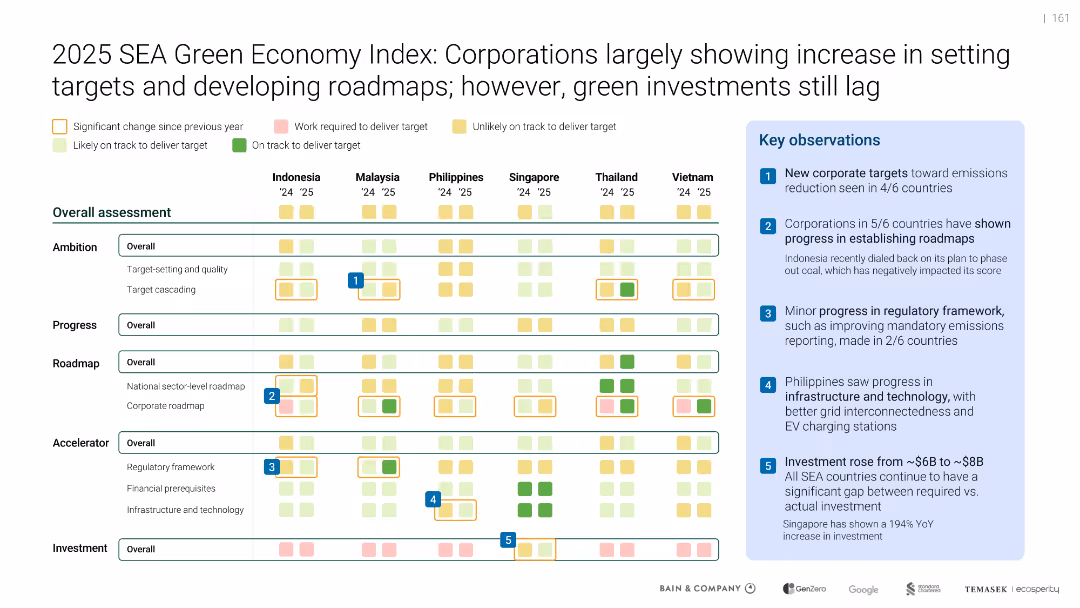
Evaluates six SEA countries on ambition, progress, roadmaps, and enabling frameworks. Most countries improved in corporate targets and planning but still lag in green investments.
Green Economy Index, SEA countries, Corporate targets, Emissions, Roadmap, KPIs, Progress, Infrastructure
false
Overall 2025 SEA Green Economy Index: Corporations largely showing increase in setting targets and developing roadmaps; however, green investments still lagSoutheast Asia's Green Economy
Mixed Chart
Bain
View slide
The slide uses a green and white color scheme with a table showing the percentages of respondents who repaired various items in Germany, France, and the UK. It includes icons for items like washing machines and mobile phones, with the highest and lowest repair rates indicated in different colors.
Market Analysis and Trends
Environmental Services & Sustainability
This slide indicates that the percentage of repaired goods is low across different products, with a focus on comparisons among Germany, France, and the UK, suggesting the impact of initiatives like the Green Deal in France.
repair, e-waste, products, survey, international
false
SIMILARLY, SHARE OF REPAIRED GOODS LOW ACROSS PRODUCTSGoing full circle
Multiple Chart
Oliver Wyman
View slide
Left-aligned text with a quote in purple, right-aligned horizontal bar graphs showing survey results on "Change" and "Replace" expectations by country.
Market Analysis and Trends
Technology & Software
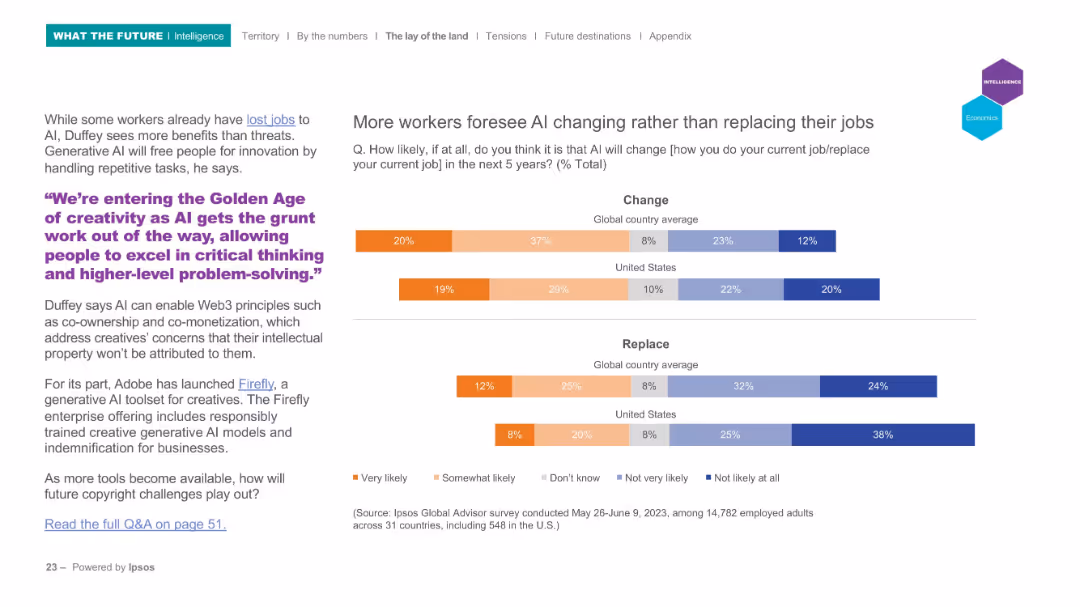
This slide explores perceptions of how AI will impact jobs over the next five years, showing that workers believe AI will more likely change than replace their roles. A quote highlights AI’s role in enhancing creativity. Survey data compares global and U.S. perspectives.
AI, jobs, survey, automation, creativity, change
false
More workers foresee AI changing rather than replacing their jobsWHAT THE FUTURE: INTELLIGENCE
Mixed Chart
IPSOS
View slide
Bar chart comparing buyer categories over 3 years and stacked subsegment chart; side bullet points highlighting three strategic themes.
Strategic Planning
Technology & Software
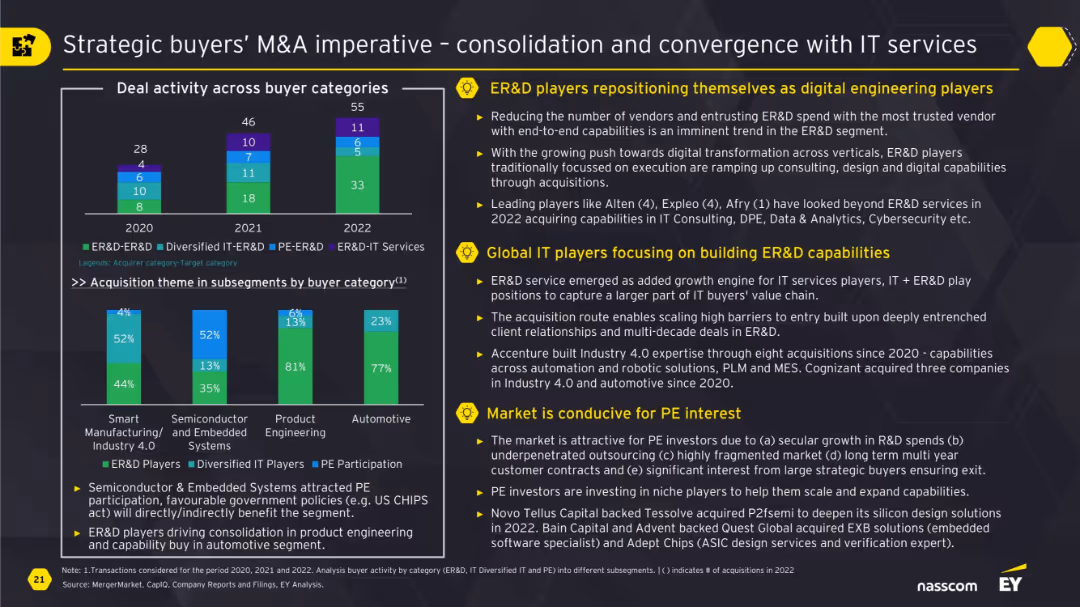
The slide explains how ER&D players and global IT firms are converging through M&A to build digital engineering capabilities. It highlights shifting buyer strategies, rising interest in automation, and favorable conditions for PE investors due to government policies and secular growth in R&D spend.
ER&D, M&A, IT services, digital engineering, private equity, strategic buyers, consolidation
false
Strategic buyers’ M&A imperative – consolidation and convergence with IT servicesA Year of Paradoxes: M&A Trends and Outlook in the Technology Services Sector
Multiple Chart
EY
View slide
A photo of the Colosseum with circular charts showing NPE stock growth expectation and a detailed text explanation.
Market Analysis and Trends
Financial Services
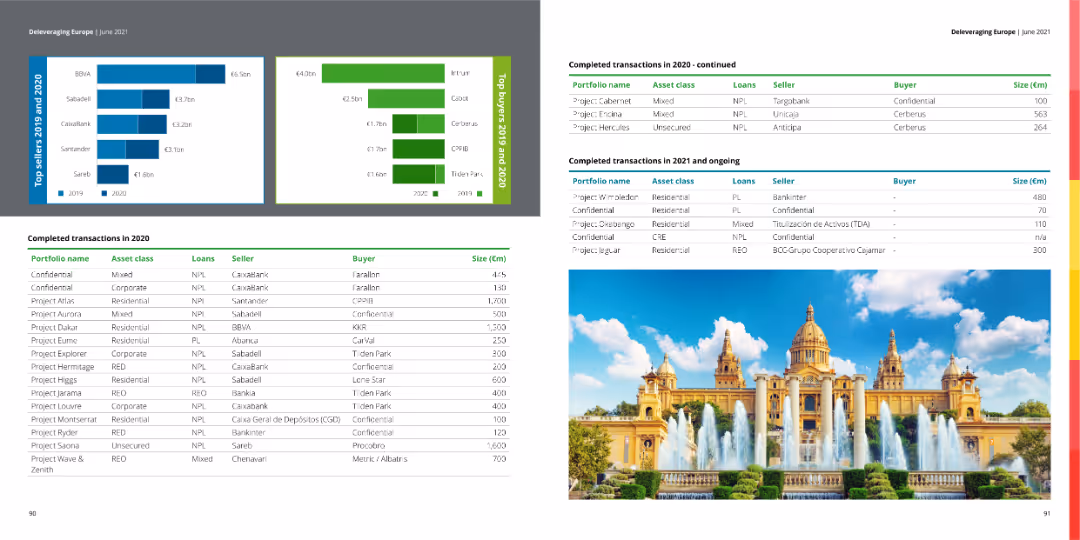
This slide analyzes Italy's banking system and NPE stock growth expectations, discussing economic impacts and future outlooks.
Italy, NPE stock, banking, financial services, market analysis
false
Confidential Mixed NPL CaixaBank Farallon 445Deleveraging Europe
Multiple Chart
Deloitte
View slide
Icons and labels representing tourism enablers
Strategic Planning
Hospitality & Tourism
Identifies key factors necessary for enhancing high-end tourism, including luxury accommodations, high-end brands, and safety.
tourism, strategy, enablers, luxury, safety
false
A series of enablers and attractors are needed to reap the benefits of “hard” and “soft” spilloversHigh-end Tourism - a strong driver for Europe
Table
Bain
View slide
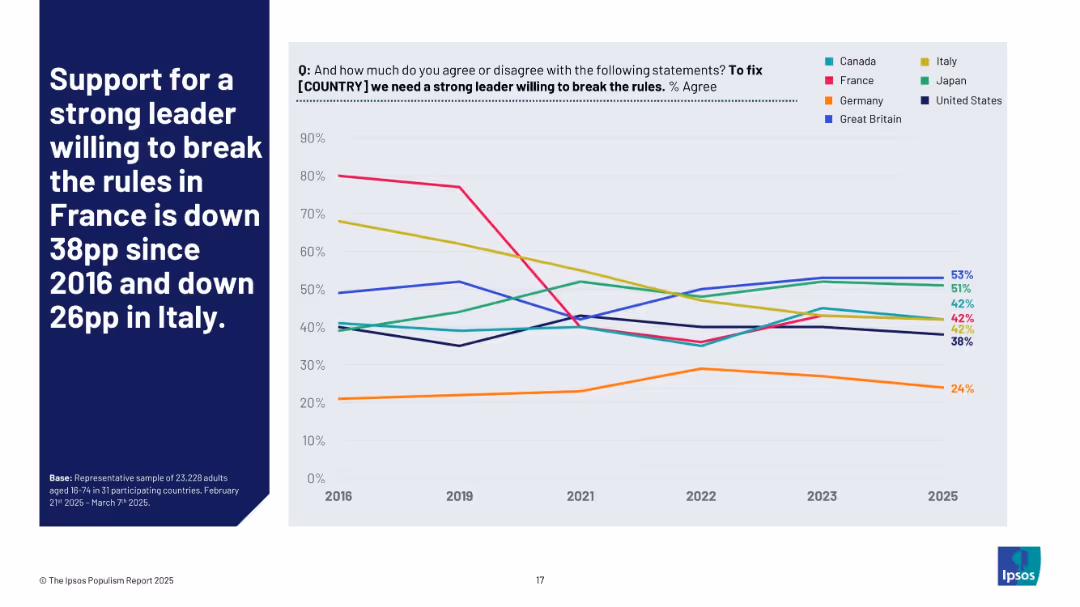
Line chart showing trends from 2016 to 2025 in agreement with the “strong leader willing to break rules” statement across selected countries. Each country is represented by a distinct colored line.
Strategic Planning
Government & Public Sector
This chart visually represents how support for strong leadership has evolved in several countries. Notably, France and Italy have seen major drops in support over the past decade, reflecting shifts in political tolerance or trust in rule-bending solutions.
populism, authoritarianism, leadership, Ipsos trend, France, Italy, political change, international opinion
false
Support for a strong leader willing to break the rules in France is down 38pp since 2016 and down 26pp in Italy.THE IPSOS POPULISM REPORT 2025
Mixed Chart
IPSOS
View slide
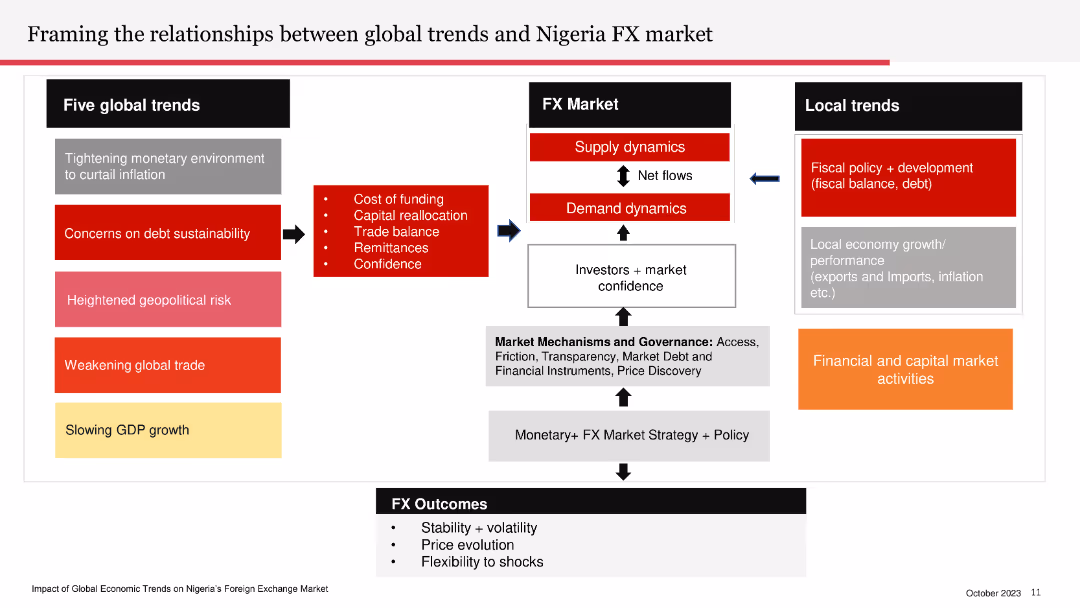
The slide contains a flowchart linking global trends to Nigeria’s FX market, local trends, and FX outcomes. The flowchart uses arrows and color-coded boxes to differentiate between different elements.
Market Analysis and Trends
Financial Services
The slide explains the impact of global trends on Nigeria's foreign exchange market, covering local fiscal policies and financial activities.
FX market, global trends, Nigeria, local trends, fiscal policy, financial activities
false
Framing the relationships between global trends and Nigeria FX marketNigeria (Bi-monthly) Economic Outlook
Diagram
PwC/Strategy&
View slide
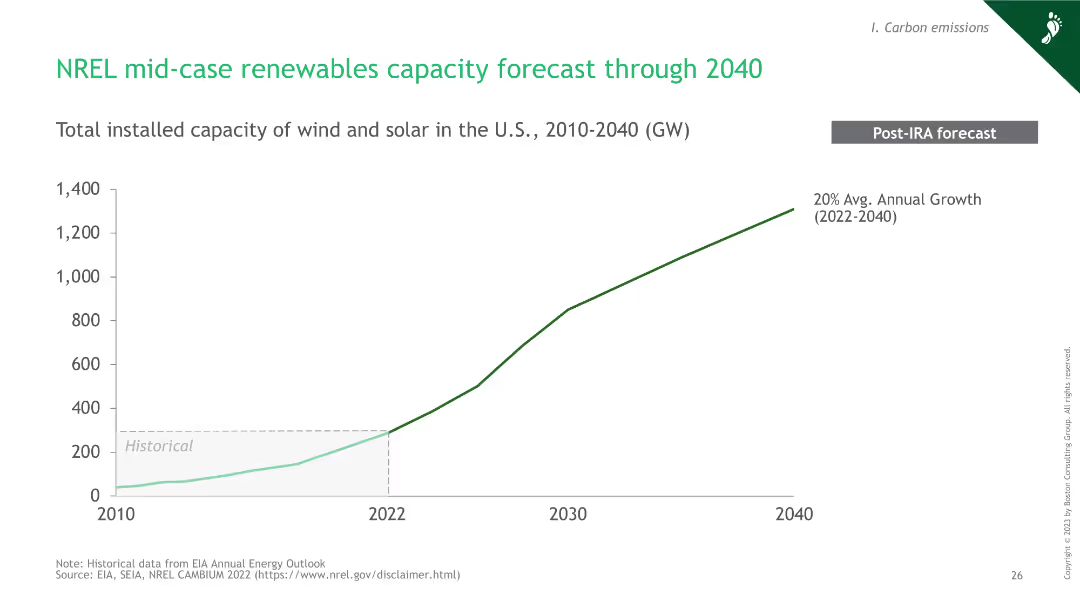
A line chart showing the forecasted growth of renewable energy capacity in the U.S. from 2010 to 2040.
Market Analysis and Trends
Energy & Utilities
This slide forecasts the growth of wind and solar capacity in the U.S. through 2040, indicating a 20% average annual growth rate post-IRA.
hydrogen, renewables, capacity, forecast, 2040
false
NREL mid-case renewables capacity forecast through 2040Green Hydrogen: An assessment of near-term power matching requirements
Single Chart
BCG
View slide
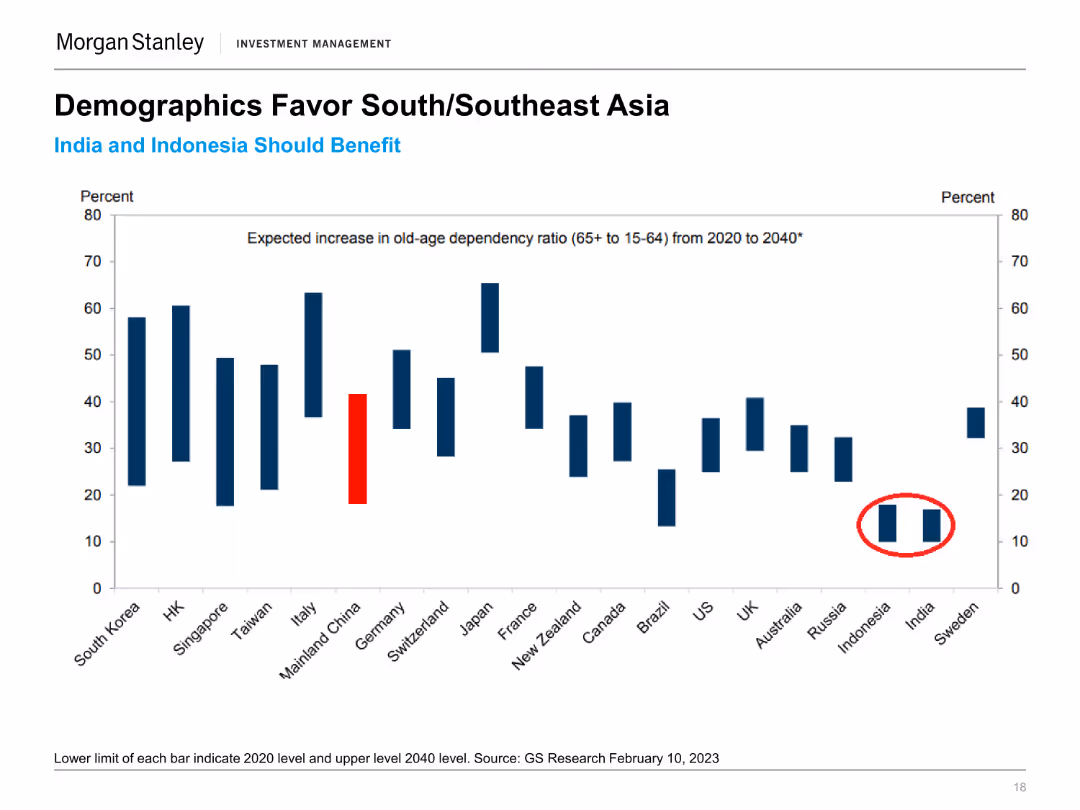
The slide presents a column chart illustrating the expected increase in old-age dependency ratio (65+ to 15-64) from 2020 to 2040 for various countries. Specific countries are highlighted.
Market Analysis and Trends
Financial Services
The slide analyzes demographic trends favoring South and Southeast Asia by projecting old-age dependency ratios, indicating potential economic advantages for these regions.
Demographics, South Asia, Southeast Asia, Old-Age Dependency, Economic Trends, Population Growth, Market Analysis, Regional Advantages
false
Demographics Favor South/Southeast AsiaMorgan Stanley Investment Management Emerging Markets / Asia
Single Chart
Morgan Stanley
View slide
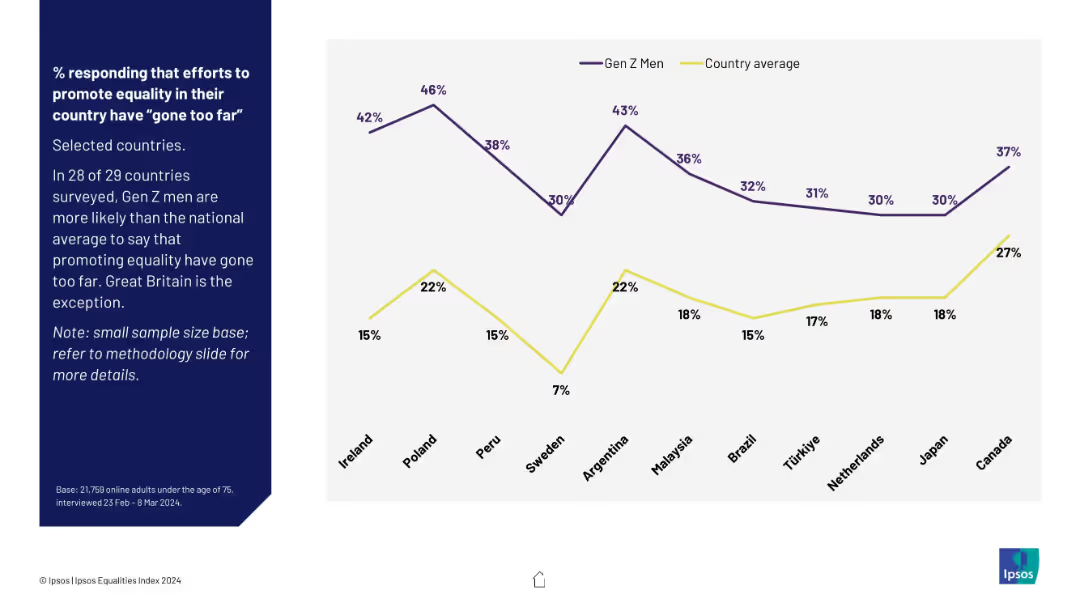
Line graph comparing Gen Z men to national average across selected countries; purple and yellow lines; note on sample size.
Regulatory and Compliance
Government & Public Sector
This slide spotlights Gen Z men across countries, showing their likelihood to say equality efforts have gone too far. In 28 of 29 countries, Gen Z men surpass national averages—Great Britain is the exception.
Gen Z men, backlash, equality efforts, country comparison, Ipsos, public perception, overreach concern
false
% responding that efforts to promote equality... “gone too far” – Selected countriesIPSOS EQUALITIES INDEX 2024
Mixed Chart
IPSOS
View slide
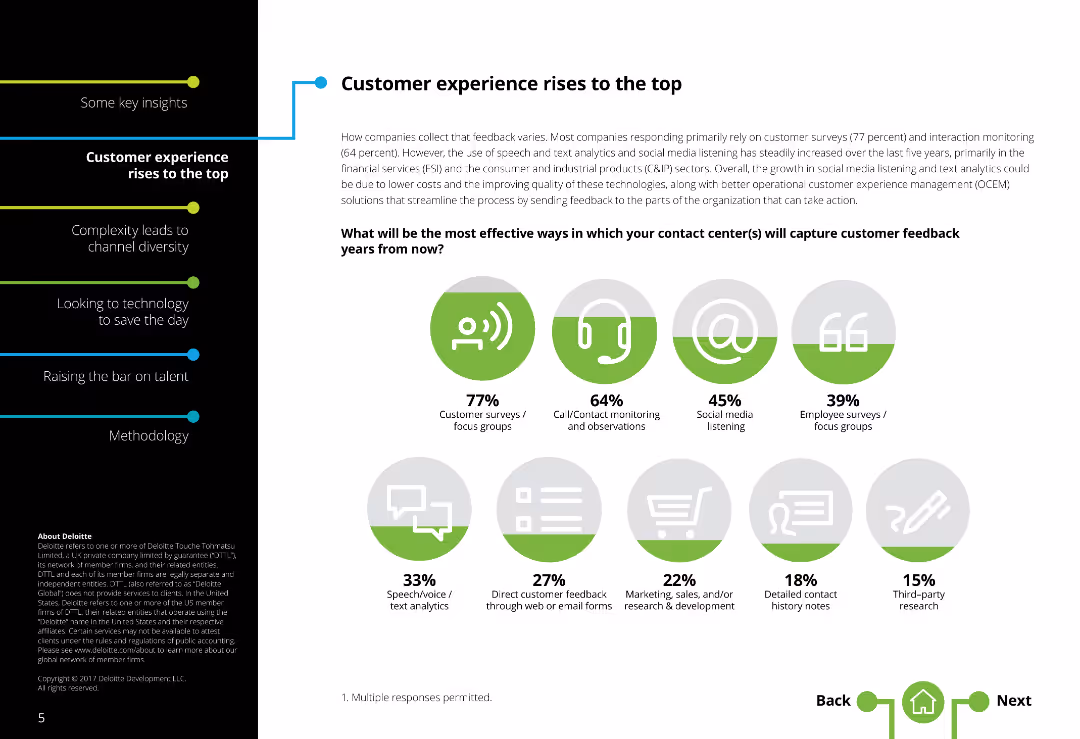
This slide features various icons and column charts displaying effective methods for capturing customer feedback in contact centers, with percentage data for each method.
Market Analysis and Trends
Professional Services
The slide outlines the most effective ways for contact centers to capture customer feedback. It includes survey data showing the prevalence of different methods such as customer surveys, call/contact monitoring, social media listening, and employee focus groups, presented with corresponding icons and column charts.
Customer feedback, contact centers, survey methods, column charts, engagement
false
How companies collect that feedback varies.Global Contact Center Survey
Single Chart
Deloitte
View slide
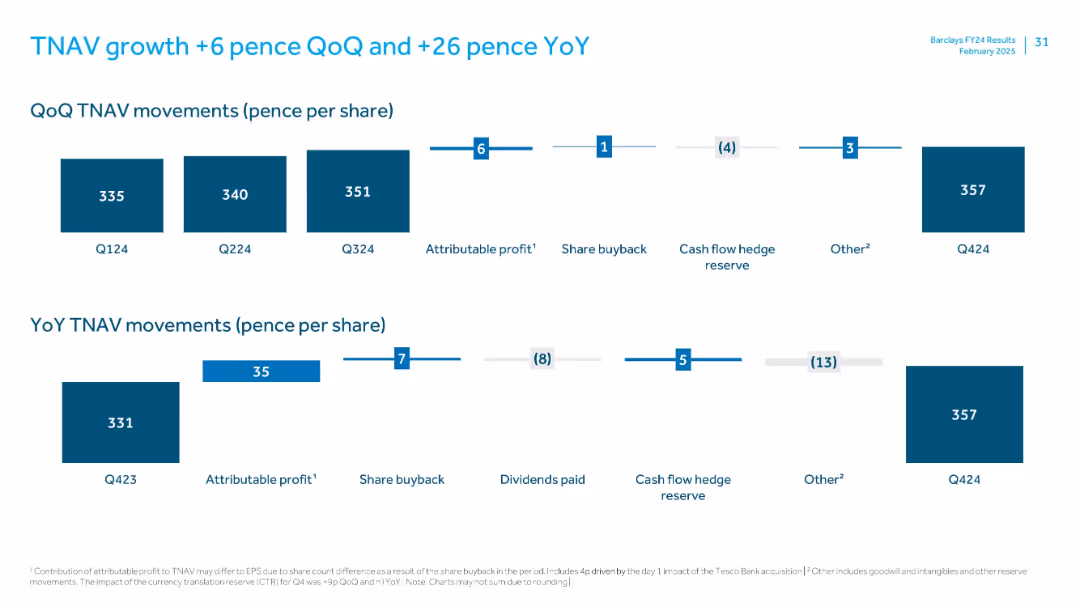
Two horizontal waterfall charts (QoQ and YoY TNAV per share movement) with contributing factors (e.g., profit, buybacks, hedge reserves).
Financial Performance
Financial Services
This slide illustrates tangible net asset value (TNAV) growth per share, with quarterly movement from 351p to 357p and YoY from 331p to 357p. Contributions include profit, share buybacks, and reserve changes.
TNAV, share buyback, profit, Q4 2024, pence per share, dividends
false
TNAV growth +6 pence QoQ and +26 pence YoYFY 2024 Results Presentation
Single Chart
Barclays
View slide
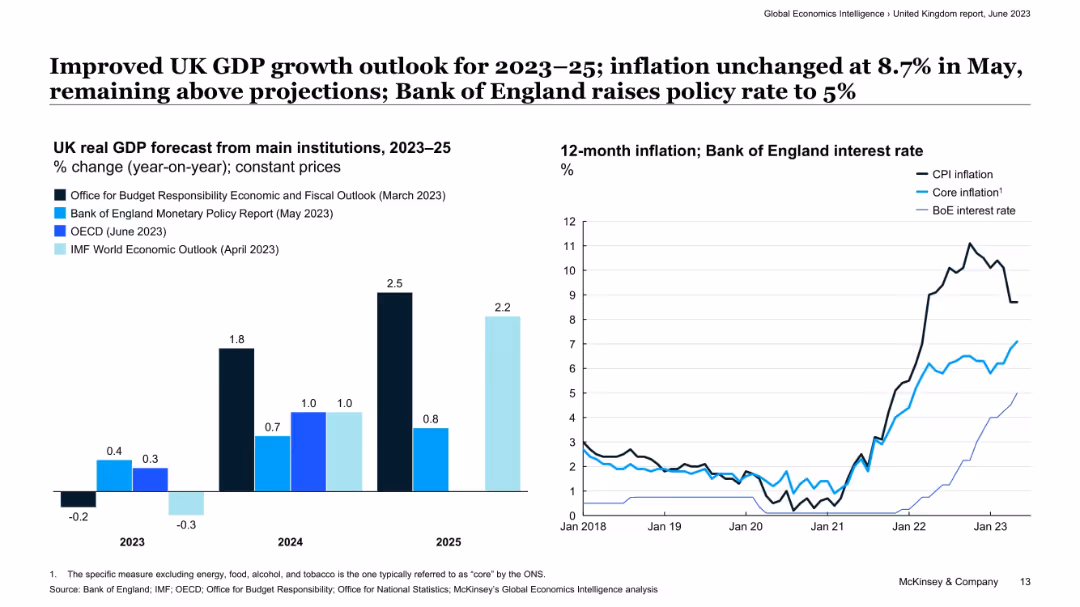
Two-panel layout with bar chart (left) of GDP forecasts and line chart (right) of CPI, core inflation, and BoE interest rate.
Strategic Planning
Financial Services
The slide outlines improved GDP growth forecasts for the UK over the 2023–2025 period, along with persistent inflation pressures. It shows the Bank of England’s policy rate hike to manage inflation, while core inflation trends remain elevated, suggesting monetary tightening is expected to continue.
UK economy, GDP growth, inflation, interest rate, monetary policy, Bank of England, CPI, economic forecast
false
Improved UK GDP growth outlook for 2023–25; inflation unchanged at 8.7% in May, remaining above projections; Bank of England raises policy rate to 5%Global Economics Intelligence June 2023
Multiple Chart
McKinsey
View slide
The slide has two line graphs, one showing the high yield index spread to worst and the other showing capital markets revenues.
Financial Performance
Financial Services
The slide highlights Credit Suisse's resilience in maintaining positive revenue through various credit shocks since 2011, supported by visual data trends.
credit shocks, revenue, Credit Suisse, high yield index, capital markets, resilience, trends, financial performance
false
…and despite past credit shocks, the business has generated positive revenue each quarter since 2011Credit Suisse Investor Day 2018 Managing our business through the cycle
Multiple Chart
Credit Suisse
View slide
The slide features a line chart showing retail sales growth across different countries, alongside a text summary of economic conditions.
Market Analysis and Trends
Consumer Goods
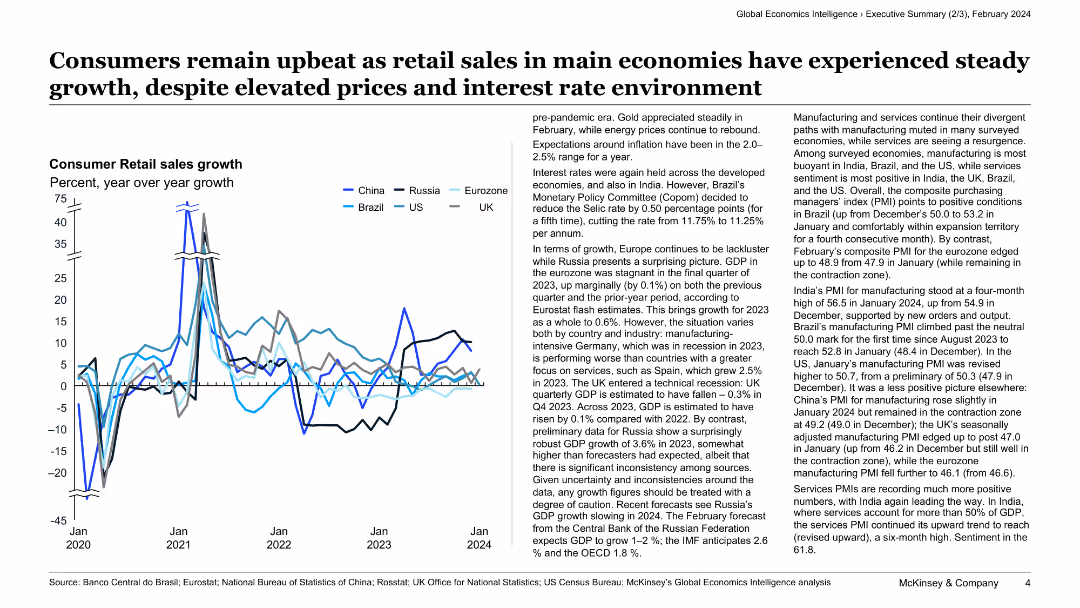
This slide highlights the steady growth in retail sales in major economies, despite elevated prices and interest rates, illustrated with a line chart showing year-over-year growth data.
retail sales, growth, economies, consumer goods, market analysis, trends, interest rates, prices, economic conditions, overview
false
Consumers remain upbeat as retail sales in main economies have experienced steady growth, despite elevated prices and interest rate environmentGlobal Economics Intelligence January 2024
Mixed Chart
McKinsey
View slide
Basic visual complexity, contrasting textual information with a relatable image.
Strategic Planning
Professional Services
Discusses the need for businesses to adapt to changes and disruptions, hinting at strategies for maintaining competitiveness and relevance.
business strategy, adaptability, global trends, disruptions
false
The region’s long-term prospects are promising, driven by structural factorsSoutheast Asia's digital consumers: A new stage of evolution
Mixed Chart
Bain
View slide
Map showing the distribution of charging stations across Romanian counties in 2020 H2, emphasizing the concentration in Bucharest and Western Romania.
Market Analysis and Trends
Energy & Utilities
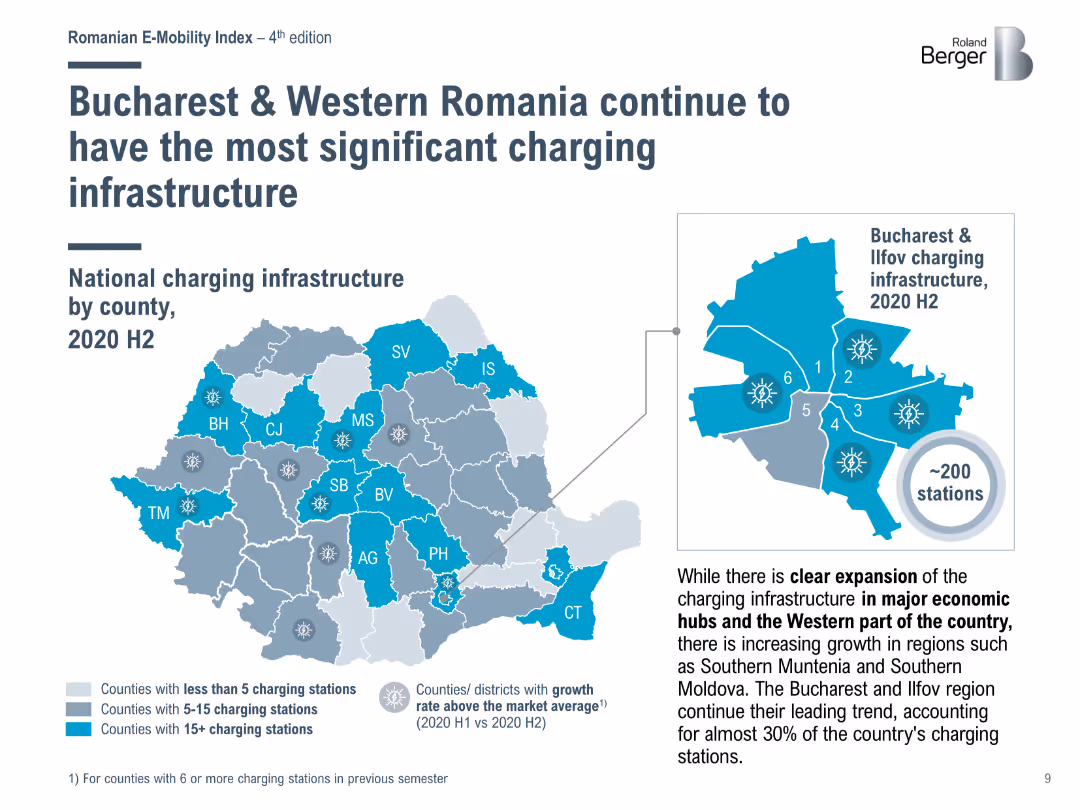
Highlights the regional distribution of charging infrastructure in Romania, with Bucharest and Western Romania having the highest number of charging stations.
charging stations, Bucharest, Romania, infrastructure
false
Bucharest & Western Romania continue to have the most significant charging infrastructureRomanian E Mobility Index REI 4 (Fourth Edition)
Graphic
Roland Berger
View slide
This slide consists of column charts and detailed financial data tables. It shows annual financial results, comparing current year with previous year, in a clear, structured manner using contrasting blue shades for different divisions.
Financial Performance
Financial Services
The slide provides a year-end review of Deutsche Bank's financial results for 2023, comparing it with 2022 data. It includes details on profits, losses, and divisional revenues, offering a comprehensive annual financial overview.
FY 2023, annual review, financial results, comparison
false
FY 2023 highlights In € bn, unless stated otherwiseQ4 / FY 2023 Fixed Income Investor Conference Call
Mixed Chart
Deutsche Bank
View slide
Scenario-based market projection; stacked bar charts for value streams; assumption and belief sections at bottom; muted colors and dark theme.
Investment Analysis
Artificial Intelligence
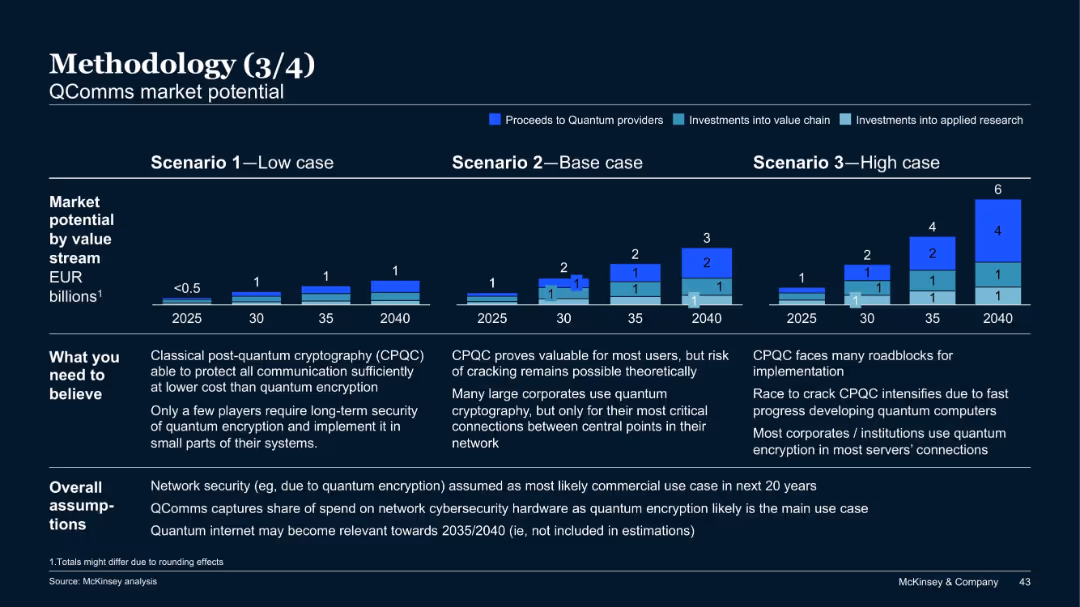
This slide outlines the potential value of quantum communications (QComms) by 2040. It compares low, base, and high-value projections and explores adoption assumptions and technological hurdles like cracking CPQC.
QComms, quantum encryption, cybersecurity, CPQC, projections, investments, McKinsey
false
Methodology (3/4)The Quantum Technology Monitor September 2021
Mixed Chart
McKinsey
View slide
Side-by-side bar charts with percentages, purple gradient bars. Brief explanatory text on the left. Bold headings and clear labels enhance readability.
Technology and Digital Transformation
Healthcare & Pharmaceuticals
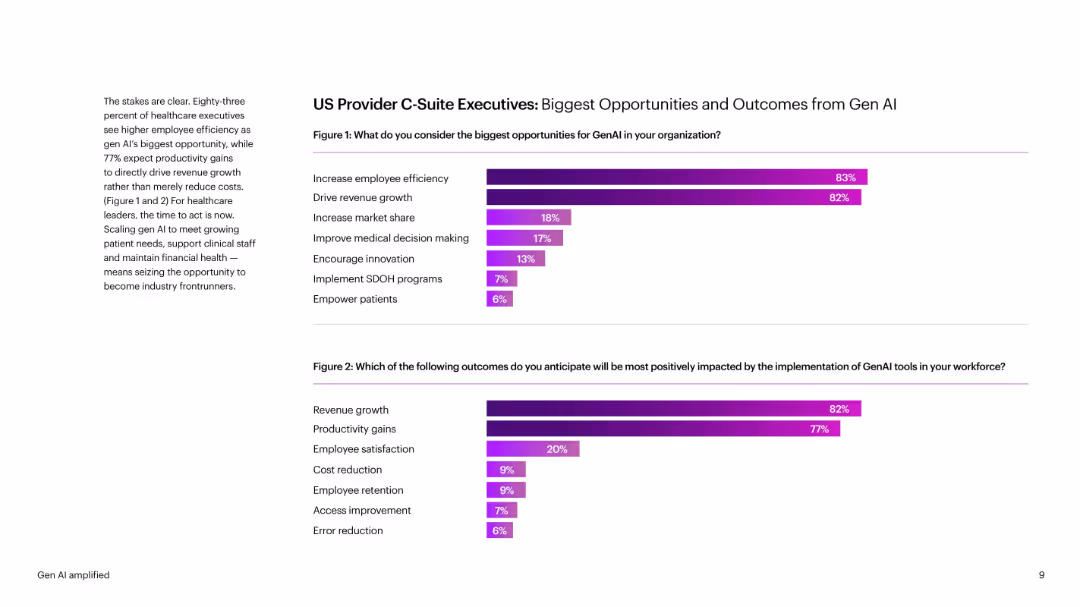
Shows healthcare executives’ views on GenAI benefits—primarily employee efficiency and revenue growth. Also shows anticipated outcomes like satisfaction and cost reduction. Provides quantitative survey data segmented by impact.
GenAI, healthcare, C-suite, productivity, revenue, satisfaction, decision-making
false
US Provider C-Suite Executives: Biggest Opportunities and Outcomes from Gen AIGen AI amplified
Multiple Chart
Accenture
View slide
Features line graphs for travel-related search trends in six SEA countries against a dashed line indicating average pre-pandemic interest. The layout is uncluttered, prioritizing clarity.
Market Analysis and Trends
Hospitality & Tourism
Highlights the resurgence in online travel interest in SEA countries, comparing current search trends to pre-pandemic levels to predict market demand.
SEA, online travel, search trends, market demand, pre-pandemic levels, Indonesia, Malaysia, Philippines
false
Online travel: Travel-related search interest reaches or exceeds pre-pandemic levels, indicating impending demande-Conomy SEA 2022 Through the waves, towards a sea of opportunity
Multiple Chart
Bain
View slide
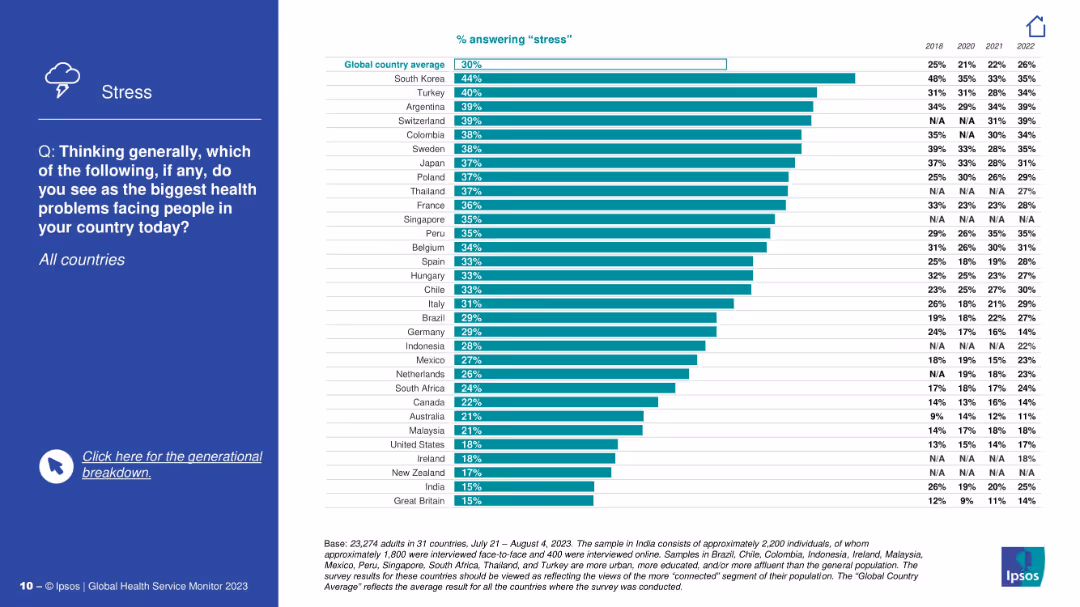
Stress-focused slide with blue sidebar; right side features country ranking by percentage citing stress as a top health issue, plus trend data.
Market Analysis and Trends
Healthcare & Pharmaceuticals
The slide ranks countries based on how many citizens consider stress a leading health problem. South Korea ranks highest. It includes data from past years, showing an increase in stress concern in most countries over time.
stress, mental well-being, Ipsos, health concerns, historical comparison, anxiety, pressure, perception, global health insights
false
StressIPSOS GLOBAL HEALTH SERVICE MONITOR 2023
Mixed Chart
IPSOS
View slide
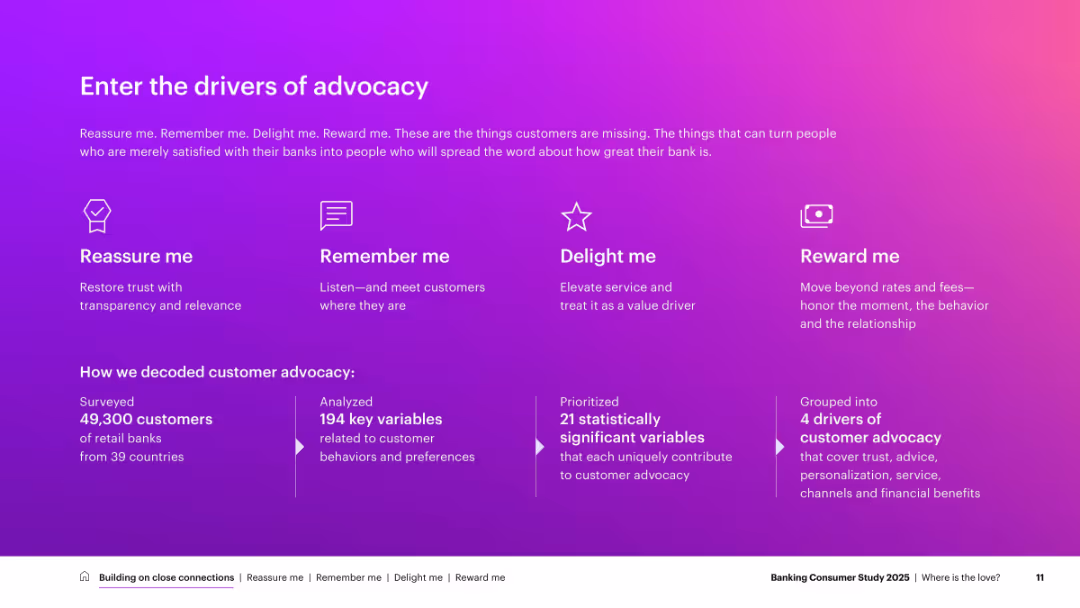
Gradient pink-purple background with white text; icons and labeled segments describing drivers; bottom section outlines research methodology
Strategic Planning
Financial Services
Identifies four main drivers of customer advocacy—Reassure me, Remember me, Delight me, Reward me—based on global banking study findings. Describes methodology used (49,300 surveyed, 194 variables analyzed) to derive 21 significant variables into 4 key groups.
false
Enter the drivers of advocacyBanking Consumer Study 2025
Pillar
Accenture
View slide
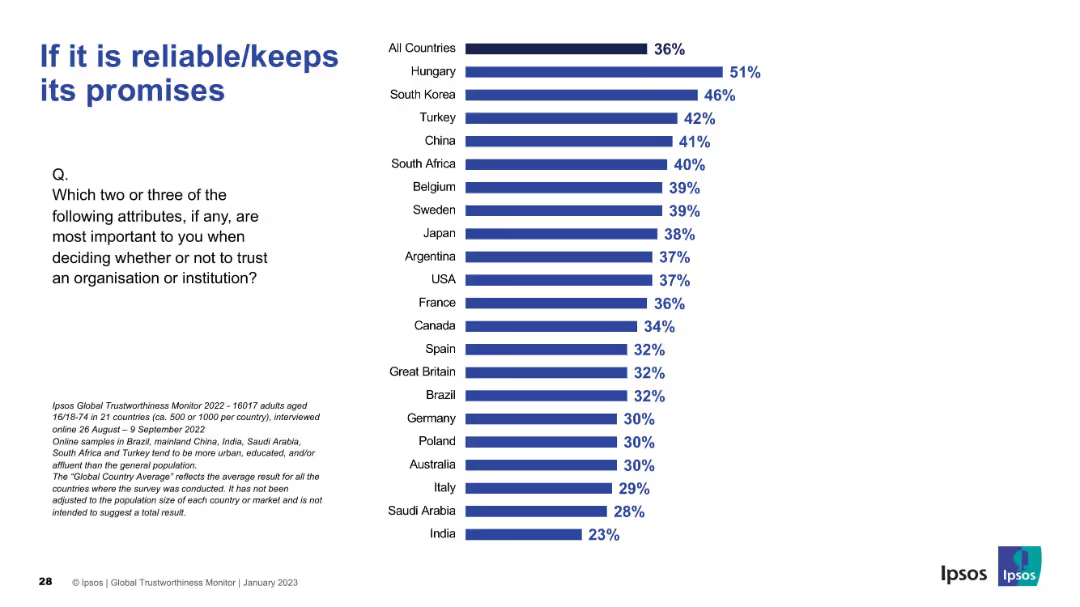
Slide uses same format: bar chart comparing 21 countries. Hungary ranks highest in valuing reliability.
Market Analysis and Trends
Professional Services
Reliability emerges as the most critical trust factor globally, particularly important in Hungary and South Korea. Communicates consistency in expectations.
reliability, trust, promise-keeping, country ranking, Ipsos data, integrity
false
If it is reliable/keeps its promisesIPSOS GLOBAL TRUSTWORTHINESS MONITOR January 2023
Mixed Chart
IPSOS
View slide
Slide features complex graphical data including column chart detailing noninterest expenses and projected cost management strategies with clear visual segmentation.
Operational Efficiency
Financial Services
Highlights the bank's focus on stringent cost management and operational efficiency, detailing projected cost reductions and efficiency measures to support financial health and operational leverage.
cost management, operational efficiency, financial health, cost reduction, efficiency measures
false
Reinforced cost execution supports operating leverageClient & Creditor Overview
Mixed Chart
Deutsche Bank
View slide
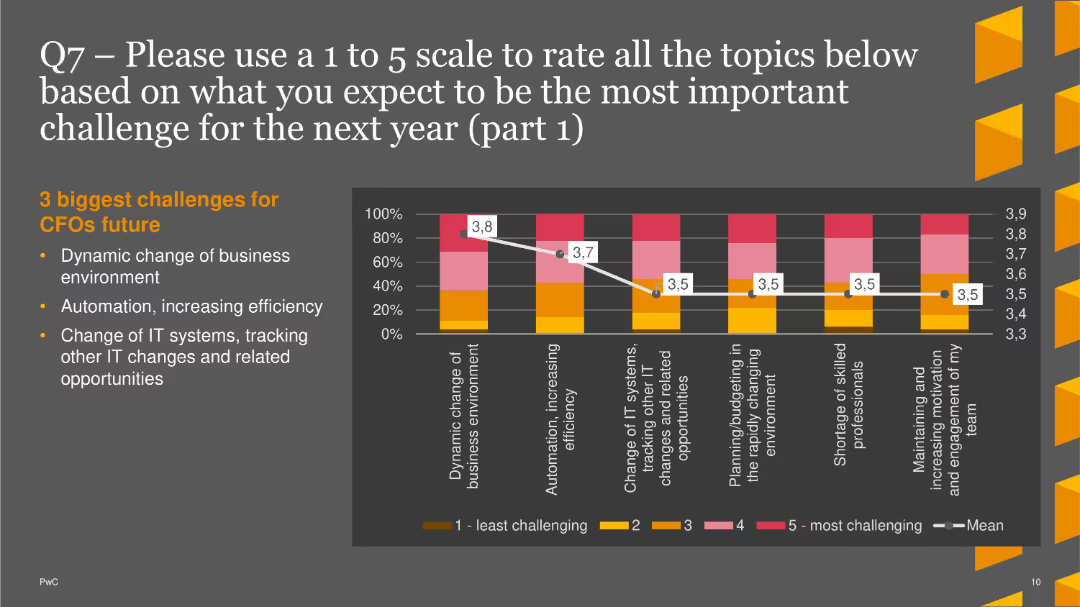
The slide includes a column chart showing anticipated challenges for CFOs, focusing on business environment changes and automation.
Market Analysis and Trends
Financial Services
This slide presents the top three expected challenges for CFOs in the coming year: dynamic business changes, automation, and IT system changes.
Future Challenges, CFOs, Column Chart, PwC, Survey, 2022, Automation
false
Q7 – Please use a 1 to 5 scale to rate all the topics below based on what you expect to be the most important challenge for the next year (part 1)PwC CFO Insights Survey 2022
Mixed Chart
PwC/Strategy&
View slide
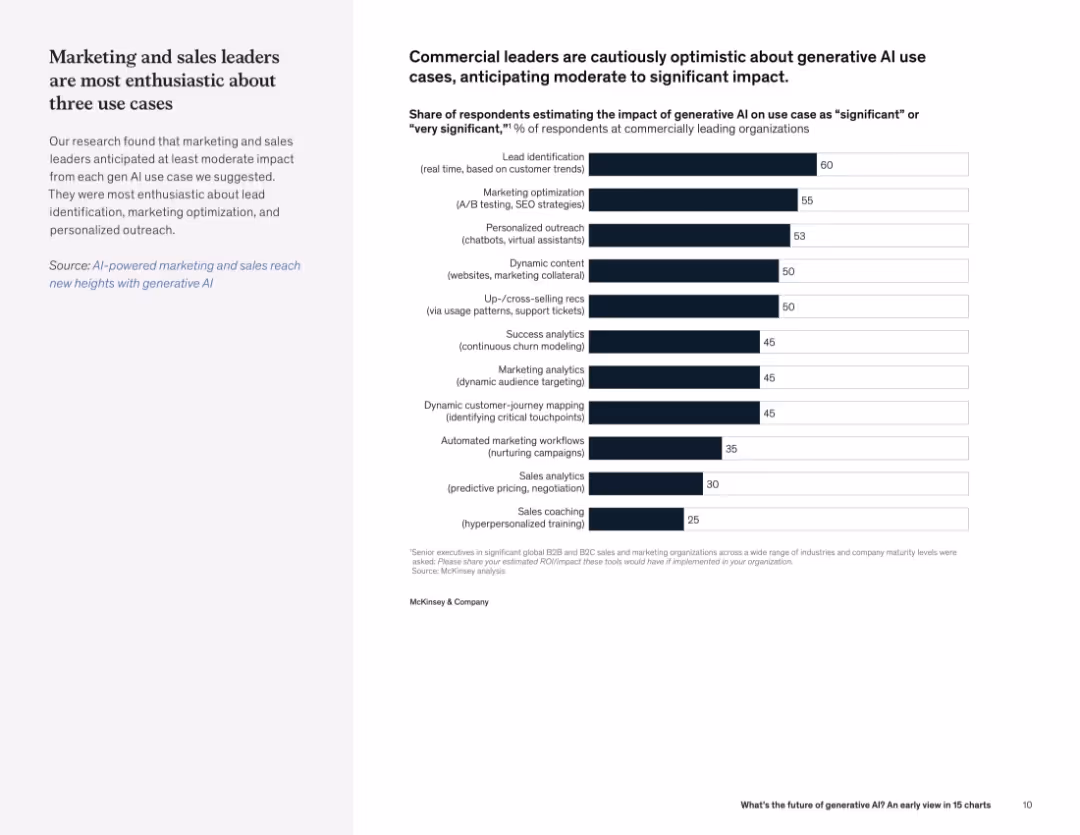
Split layout with text on left and horizontal bar chart on right listing use cases and perceived impact levels.
Product and Service Analysis
Artificial Intelligence
The slide presents survey results showing the perceived business impact of generative AI across use cases. Lead identification, marketing optimization, and personalized outreach rank highest in expected impact.
lead identification, personalized outreach, AI use cases, business impact, marketing, survey, optimism
false
Commercial leaders are cautiously optimistic about generative AI use cases, anticipating moderate to significant impactWhat’s the future of generative AI? An early view in 15 charts
Mixed Chart
McKinsey
View slide
Gartner Hype Cycle diagram for blockchain applications in 2021, showing different stages from innovation trigger to plateau of productivity.
Technology and Digital Transformation
Technology & Software
This slide presents the Gartner Hype Cycle for blockchain applications, illustrating the different stages of technology maturity. It predicts that blockchain will significantly decentralize markets and make trade more efficient, highlighting the expected timeline for various blockchain applications to reach mainstream adoption.
Blockchain, Hype Cycle, Decentralization
false
Most blockchain applications will fully penetrate the market in well under a decade Decentralization will make trade more efficientMegatrend 5 - Technology & Innovation
Mixed Chart
Roland Berger
View slide
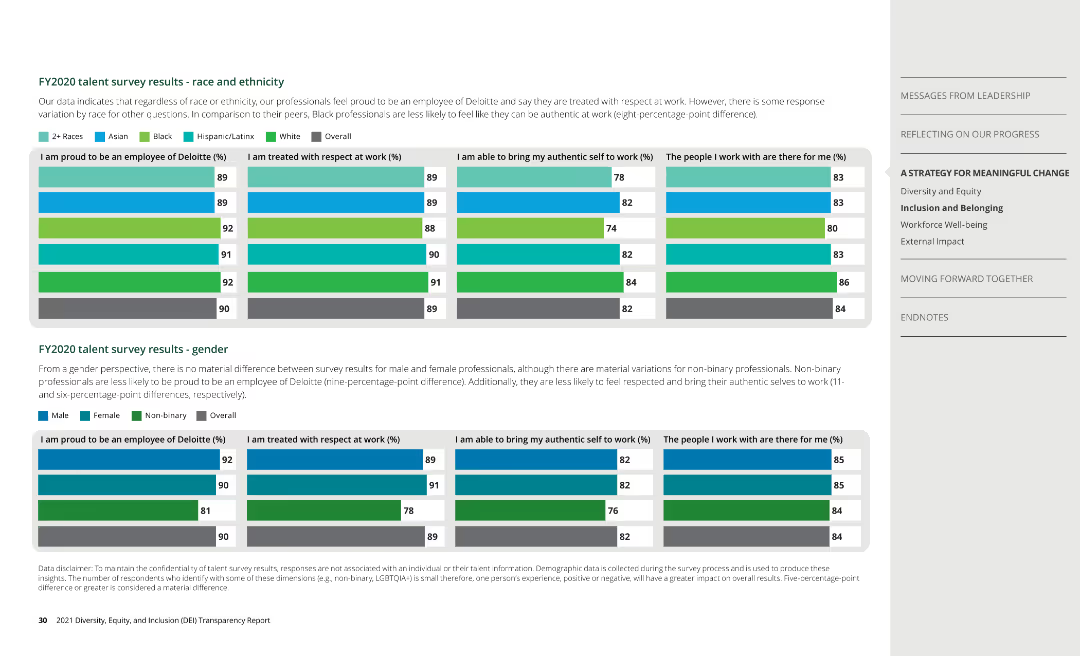
Column charts show survey results by race, ethnicity, and gender, covering aspects of employee experience at Deloitte.
Human Resources and Talent Management
Professional Services
Analyzes survey data on employee satisfaction, highlighting differences in experiences among diverse groups.
talent survey, employee experience, Deloitte
false
FY2020 talent survey results - race and ethnicity2021 Diversity, Equity, and Inclusion (DEI) Transparency Report
Multiple Chart
Deloitte
View slide
The slide includes two charts: a line chart on the weight of top 10 companies in the index by region, and a line chart on MSCI World valuation spread.
Investment Analysis
Financial Services
Evaluates concentration risks and valuation dispersions in global equity markets, focusing on top company weights and valuation spreads, useful for risk assessment.
equities, concentration risk, valuation dispersion, MSCI, market analysis
false
Global equities: Concentration risk and valuation dispersionGuide to the Markets Australia | 2Q 2024
Multiple Chart
JP Morgan
1
...
Next
Load More
Hold On!
We are searching in our database
If nothing, comes up, please try different filters!
Create a FREE account to continue browsing
Receive Instant Access to 1,000+ slides from companies like McKinsey, Google, and Goldman Sachs
First Name
Last Name
Email
Password
I agree to all
Terms & Privacy Policy
Thank you! Your submission has been received!
Oops! Something went wrong while submitting the form.
Have an account?
Sign in
Column Chart
Heatmap
Chevron
Org Chart
Infographic
Callouts
Timeline
List
Graphic
Picture
Process Flow
Diagram
Paragraph
Map
Table
Framework
Subtitle
Takeaway Box
Icon
Other Chart
Radar Chart
Waterfall Chart
Mekko Chart
Pie Chart
Scatter Plot
Line Chart
Bar chart
Bullet points