My Account
My Slides
Search by Category
Templates
Leave Feedback
Login
Logout
Get Started
Browse all Slides
Browse all Slides
Create a FREE Account
Instant access to 1,000+ real slides from top companies like McKinsey, BCG, Goldman Sachs, Google and many more!
First Name
Last Name
Email
Password
I agree to all
Terms & Privacy Policy
Thank you! Your submission has been received!
Oops! Something went wrong while submitting the form.
Have an account?
Sign in
Instant access to the internet's best slides
Get access to 40+ advanced filters and more
Advanced Search and Filters
Access to
10,000+ slides
Access to Category Pages
Save/Bookmark Slides
PowerPoint Template Library (New)
Choose your plan
MONTHLY
$12/month
Billed every month, cancel anytime.
YEARLY
$9/month
Billed $108 annually, cancel anytime.
Checkout for $12/month
Checkout for $108/yr
Secured by Stripe | AES-256 bit encryption
📢 Ready to start building slides? Check out our new template library
view templates
Welcome,
Welcome
Upgrade to SlideStart
Pro
Instant access to 15,000+ slides
Show Featured Only
Checkbox 8
Companies
Mckinsey
Bain
BCG
EY
Deloitte
Accenture
PwC/Strategy&
JP Morgan
Goldman Sachs
Morgan Stanley
Citigroup
Deutsche Bank
Barclays
LEK
Kearney
Oliver Wyman
Booz Allen Hamilton
Gartner
IPSOS
Nielsen
Slide type
Header Horizontal
Framework
Vertical Flow
Single Chart
Single Chart
Text Only
Mixed Chart
Header Vertical
Graphic
Pillar
Multiple Chart
Agenda
Title
Table
Linear Flow
Upgrade to SlideStart
Pro
Instant access to 40+ advanced filters
Industry
Upgrade to SlideStart
Pro
Instant access to 40+ advanced filters
Technology
Healthcare
Financial Services
Consumer Goods
Energy & Utilities
Manufacturing
Retail
E-commerce
Logistics
Telecommunications
Real Estate
Professional Services
Education
Media
Entertainment
Hospitatlity
Tourism
Agriculture
Food Production
Government & Public Sector
Environmental
Sustainability
Use Case
Upgrade to SlideStart
Pro
Instant access to 40+ advanced filters
Sales and Business Development
Mergers and Acquisitions
Corporate Finance and Valuation
Performance Metrics and KPIs
Client Case Studies
Competitive Landscape
Product and Service Analysis
Customer and Market Segmentation
Organizational Structure
Human Resources and Talent Management
Industry Overview
Regulatory and Compliance
Risk Assessment and Management
Agriculture & Food Production
Hospitality and Tourism
Government
Environmental
Sustainability
Clear all
Thank you! Your submission has been received!
Oops! Something went wrong while submitting the form.
Show Featured Only
Checkbox 8
Companies
Mckinsey
Bain
BCG
EY
Deloitte
Accenture
PwC/Strategy&
JP Morgan
Goldman Sachs
Morgan Stanley
Citigroup
Deutsche Bank
Barclays
LEK
Kearney
Oliver Wyman
Booz Allen Hamilton
Gartner
IPSOS
Nielsen
Slide type
Text Only
Linear Flow
Vertical Flow
Single Chart
Header Horizontal
Mixed Chart
Header Vertical
Pillar
Multiple Chart
Graphic
Agenda
Title
Table
Framework
Industry
Technology
Healthcare
Financial Services
Consumer Goods
Energy & Utilities
Manufacturing
Retail
E-commerce
Logistics
Telecommunications
Real Estate
Professional Services
Education
Media
Entertainment
Hospitatlity
Tourism
Agriculture
Food Production
Government & Public Sector
Environmental
Sustainability
Use Case
Sales and Business Development
Mergers and Acquisitions
Corporate Finance and Valuation
Performance Metrics and KPIs
Client Case Studies
Competitive Landscape
Product and Service Analysis
Customer and Market Segmentation
Organizational Structure
Human Resources and Talent Management
Industry Overview
Regulatory and Compliance
Risk Assessment and Management
Agriculture & Food Production
Hospitality and Tourism
Government
Environmental
Sustainability
Clear all
Thank you! Your submission has been received!
Oops! Something went wrong while submitting the form.
Tag
View slide
The slide provides column charts comparing perceptions of HR leaders and non-HR leaders on the effectiveness of HR functions in delivering workforce strategy.
Market Analysis and Trends
Professional Services
Assesses differing perceptions between HR and non-HR leaders regarding the effectiveness of HR strategies in adapting to market changes and achieving organizational goals. Useful for identifying areas for improvement in HR practices and alignment with overall business strategy.
HR effectiveness, workforce strategy, leadership perceptions, organizational alignment, HR practices
false
3. Moves to prepare for the future of work 6. Build ability to rapidly access and deploy talentBoardroom Agenda
Single Chart
PwC/Strategy&
View slide
Slide illustrates the division of traditional managerial roles in an agile context.
Strategic Planning
Professional Services
Describes the shift in managerial responsibilities under agile methodologies.
agile, management roles, leadership, team autonomy, organizational change
false
Leading companies are adopting new ways of working and addressing some of the key concerns raised in the surveyBCG – IPSOS study
Header Horizontal
BCG
View slide
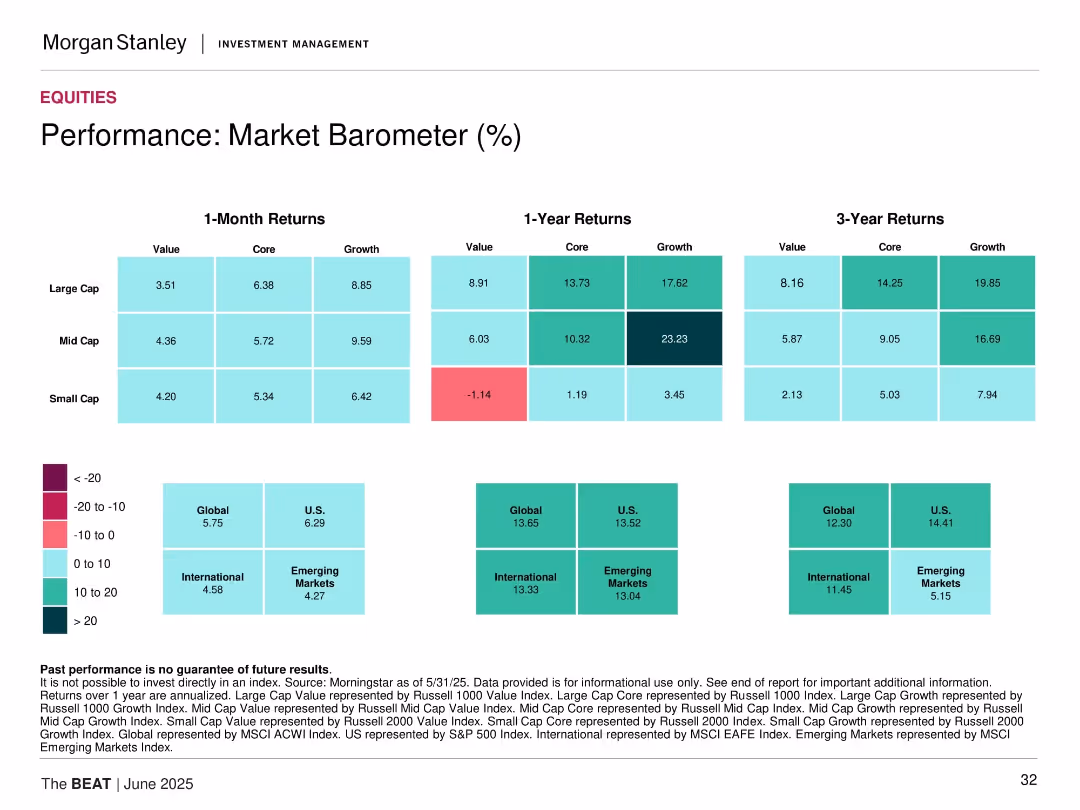
Matrix-style heatmap displaying returns over 1M, 1Y, and 3Y across value/core/growth and cap sizes.
Performance Metrics and KPIs
Financial Services
Heatmap of equity market returns categorized by style (value, core, growth) and market cap (large, mid, small) over 1-month, 1-year, and 3-year periods.
equity returns, style box, performance, small cap, large cap, mid cap, growth, value, global equity, market barometer
false
Performance: Market Barometer (%)The BEAT June 2025
Table
Morgan Stanley
View slide
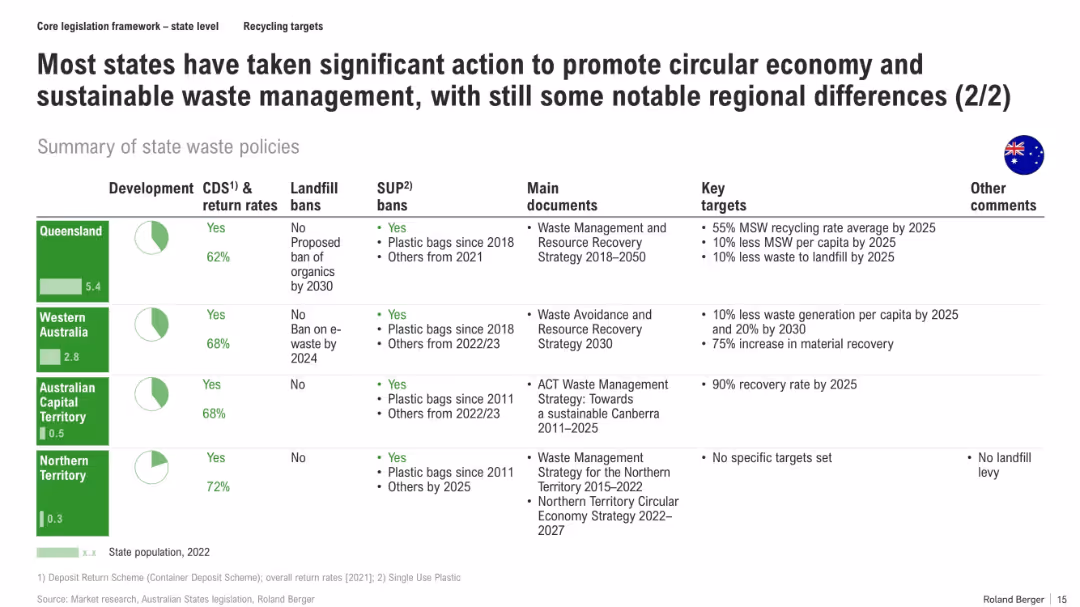
Continuation of the previous slide, using the same tabular format to cover the remaining Australian states and territories
Regulatory and Compliance
Environmental Services & Sustainability
The slide continues coverage of state waste policies, detailing Queensland, Western Australia, ACT, and Northern Territory. It compares CDS return rates, bans, and strategic targets, identifying gaps in NT and strong recovery goals in others.
state policies, CDS, plastic bans, landfill strategy, recovery targets, circular economy, recycling, Australia
false
Most states have taken significant action to promote circular economy and sustainable waste management, with still some notable regional differences (2/2)Aluminum Cans Market Assessment - Australia
Mixed Chart
Roland Berger
View slide
The slide includes a quote, a bar chart, and a conclusion section. The background features an abstract visual with a burst of colors.
Mergers and Acquisitions
Financial Services
The slide discusses the role of communication teams in acquisitions, emphasizing their importance throughout the transaction lifecycle.
Acquisitions, communication, stakeholder, HR, IR, integration, synergies, corporate, lifecycle, challenges
false
This involvement across the acquisition lifecycle brings opportunities for increased collaboration and often sees corporate communicators work with functions they less typically engage with.THE IPSOS REPUTATION COUNCIL
Mixed Chart
IPSOS
View slide
Slide with a central circular segmented diagram depicting a cycle of services, development, construction, and investment around sustainable urban development. Three text sections flank the diagram, detailing strategic approaches. To the right, a background image of a city skyline.
Strategic Planning
Government & Public Sector
Discusses strategies for enhancing the sustainability of urban environments through service improvements, asset growth, and development. For urban development and sustainable city planning presentations.
sustainable cities, urban development, construction, investment, services, asset management, growth strategy, partnerships, project development
false
More life in sustainable citiesGoldman Sachs Symposium presentation
Linear Flow
Goldman Sachs
View slide
The slide includes a vertical column chart showing the number of apprentices organizations typically host per year, segmented into five categories. A separate horizontal bar chart shows the types of support services apprentices receive, with four categories.
Human Resources and Talent Management
Professional Services
The slide highlights that organizations leveraging apprenticeships typically host between 11 and 30 apprentices per year. It also shows the support services provided to apprentices, such as mentorship, employability training, career counseling, and mental health services.
apprenticeships, support services, mentorship, training, career counseling, mental health
false
Of those who leverage apprenticeships for their tech talent needs, 79% typically host between 11 and 30 apprentices per year. Most also offer their apprentices mentorship/peer support and employability training.Tech Talent Hiring Trends Survey
Multiple Chart
Accenture
View slide
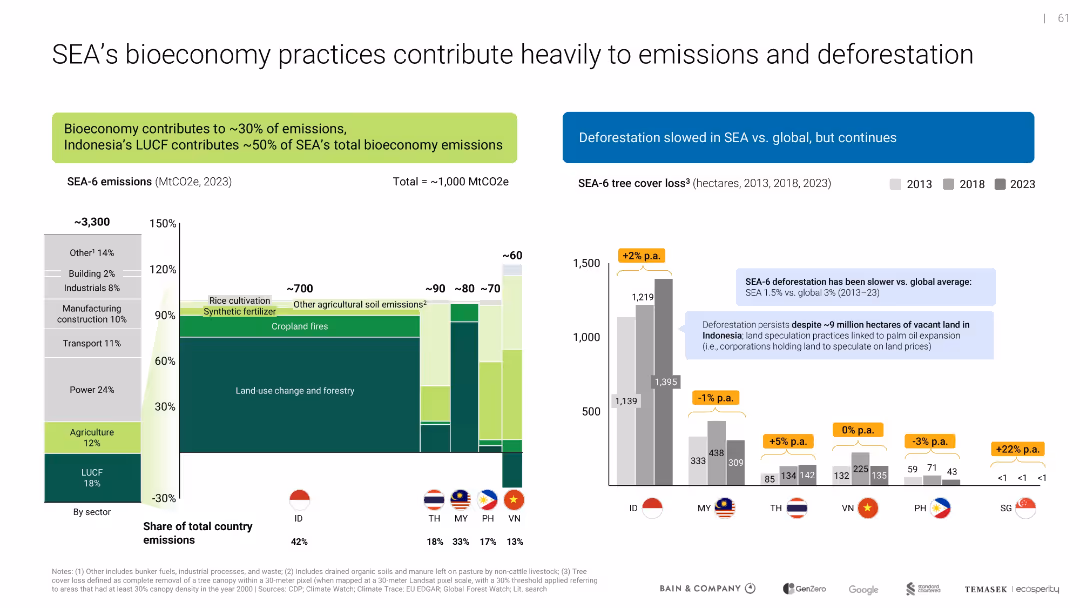
Side-by-side bar charts; one shows sector emissions breakdown, the other tracks deforestation trends by country
Risk Assessment and Management
Environmental Services & Sustainability
Analyzes emissions sources in SEA's bioeconomy, particularly land use change and agriculture. Deforestation data shows varied progress across countries, with Indonesia as a major contributor.
emissions, deforestation, LUCF, agriculture, SEA, sustainability, climate impact
false
SEA’s bioeconomy practices contribute heavily to emissions and deforestationSoutheast Asia's Green Economy
Multiple Chart
Bain
View slide
Slide includes lists and icons under headings "PROGRESS" and "WORKSTREAMS", detailing steps in a 3-year transformation plan.
Operational Efficiency
Consumer Goods
Explains the operational transformation roadmap with anticipated benefits like margin enhancement and support of financial targets.
transformation, operational efficiency, margin enhancement, financial targets, roadmap, icons
false
TRANSFORMATION PROGRESSBARCLAYS GLOBAL CONSUMER STAPLES CONFERENCE
Boxed
Barclays
View slide
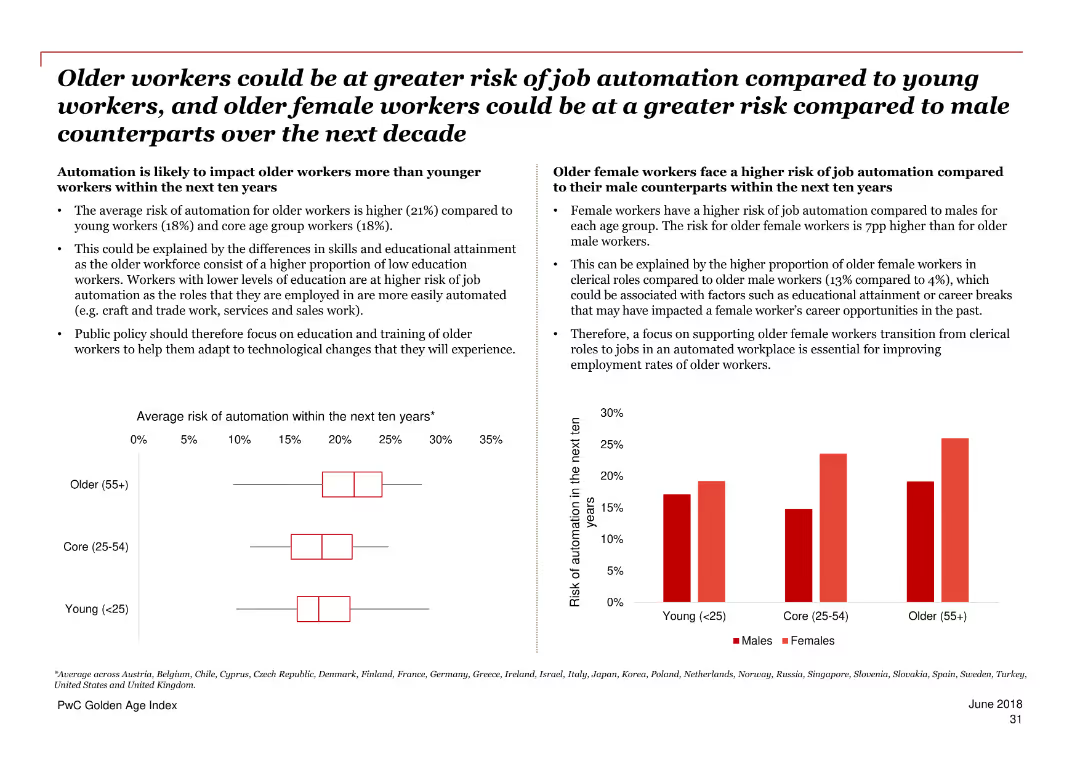
The slide includes two charts: a column chart comparing the average risk of automation for different age groups, and another chart comparing the risk of automation for males and females across various age groups. Text sections provide further details.
Risk Assessment and Management
Government & Public Sector
The slide compares the risk of job automation between older and younger workers and highlights the higher risk for older female workers compared to their male counterparts. It suggests a focus on training and education to mitigate these risks.
automation, age comparison, gender comparison, risk, job automation, older workers, younger workers, policy, training
false
Older workers could be at greater risk of job automation compared to young workersPwC Golden Age index Unlocking a potential $3.5 trillion prize from longer working lives
Multiple Chart
PwC/Strategy&
View slide
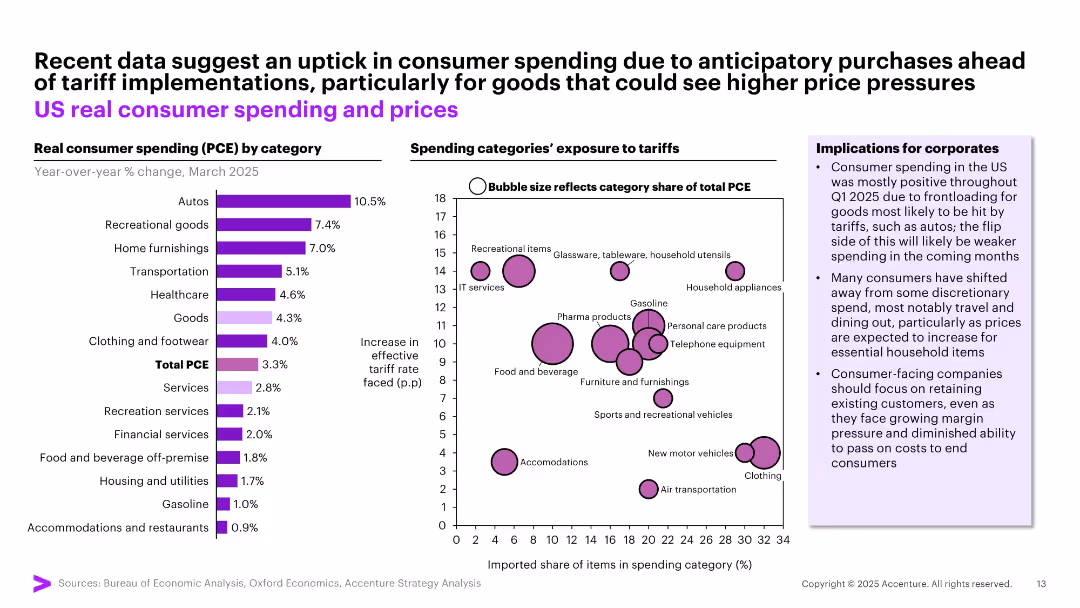
Left: Bar chart of real consumer spending by category. Right: Bubble chart showing spending category exposure to tariffs.
Pricing Strategies
Consumer Goods
Indicates temporary increases in US consumer spending due to anticipatory purchases ahead of tariffs—especially for autos and recreational goods. Accompanied by bubble plot detailing categories most exposed to tariff hikes, highlighting risks and opportunities for pricing strategy.
tariff impact, consumer behavior, pricing, spending categories, strategy
false
Recent data suggest an uptick in consumer spending due to anticipatory purchases ahead of tariff implementations, particularly for goods that could see higher price pressuresMay Macro Brief Consumer spending in flux
Multiple Chart
Accenture
View slide
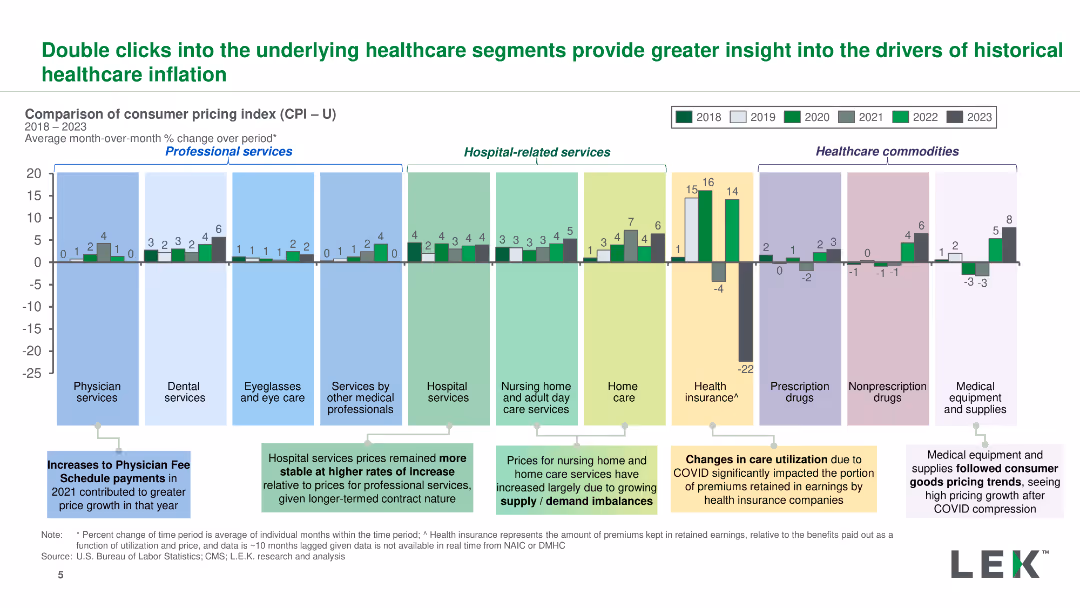
A bar chart showing the month-over-month percentage change in consumer pricing index for various healthcare segments from 2018 to 2023, with detailed labels and color coding.
Product and Service Analysis
Healthcare & Pharmaceuticals
The slide analyzes healthcare pricing trends across different segments, highlighting significant changes and the impact of COVID-19 on healthcare costs.
healthcare, pricing, segments, COVID-19, analysis
false
Double clicks into the underlying healthcare segments provide greater insight into the drivers of historical healthcareinflationPerspectives on US Healthcare Inflation Insights from L.E.K. Consulting
Single Chart
LEK
View slide
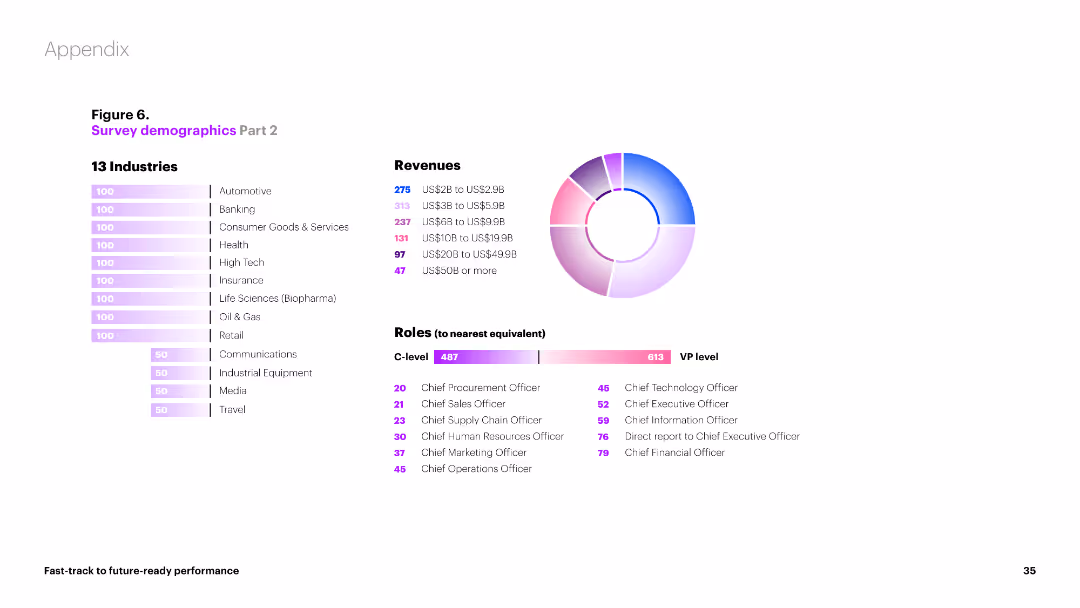
Bar charts and a pie chart showing the distribution of survey participants by industry, revenue, and roles. Different colors and sections indicate various categories.
Market Analysis and Trends
Professional Services
This slide provides a breakdown of survey participants by industry, revenue brackets, and roles. It includes visual data on the number of participants from different sectors and their respective revenues.
demographics, industry, revenue, roles, participants
false
Figure 6. Survey demographics Part 2FAST-TRACK TO FUTURE-READY PERFORMANCE
Multiple Chart
Accenture
View slide
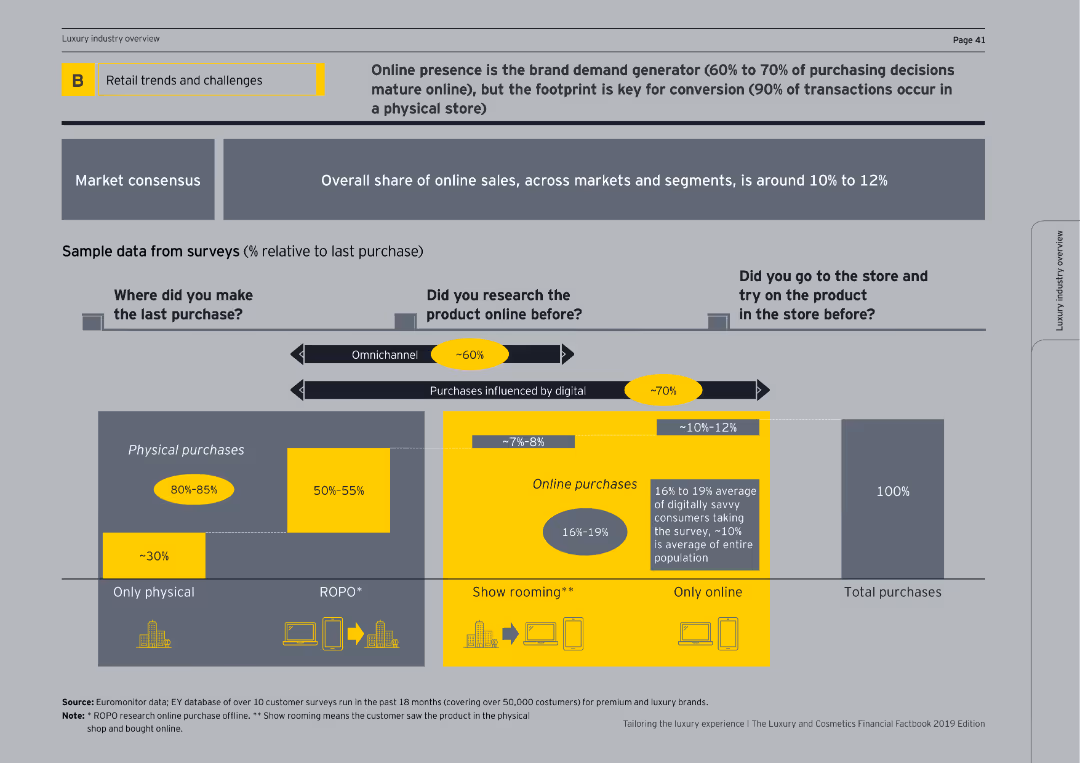
This slide includes multiple bar charts showing market consensus and online vs. physical purchase behaviors, segmented by various purchase scenarios.
Market Analysis and Trends
Retail & E-commerce
Examines the trends and challenges in retail, focusing on the impact of online presence and physical store experiences on purchasing decisions.
retail trends, challenges, online presence, physical purchases, market consensus, bar charts, omnichannel, show rooming, e-commerce, consumer behavior
false
Online presence is the brand demand generator (60% to 70% of purchasing decisions mature online)Tailoring the luxury experience The Luxury and Cosmetics Financial Factbook 2019 Edition
Single Chart
EY
View slide
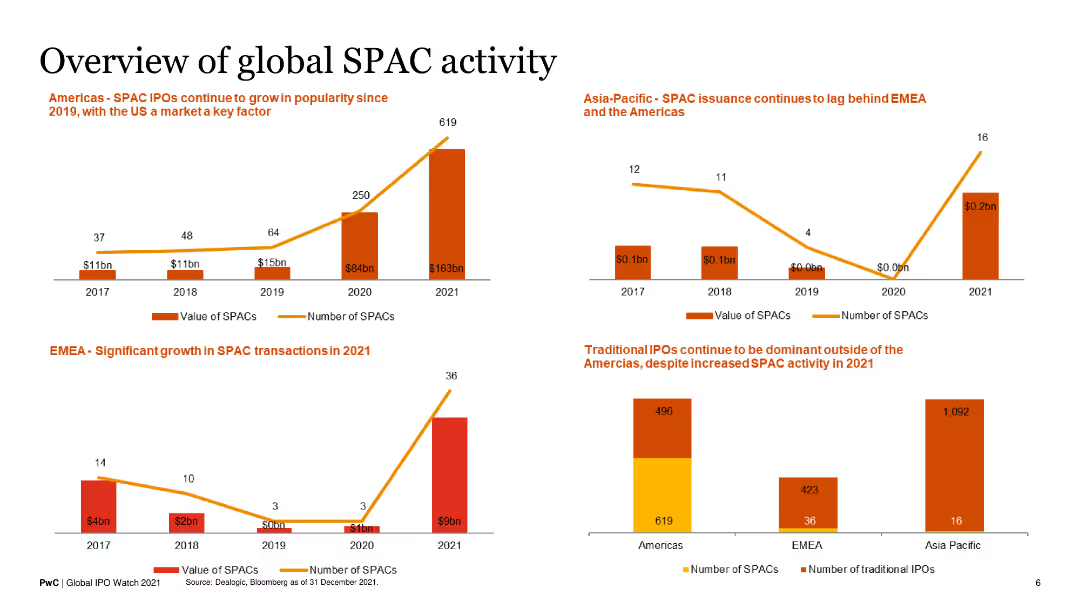
This slide contains four column charts, each showing the number and value of SPACs and traditional IPOs in different regions (Americas, EMEA, Asia-Pacific) from 2017 to 2021.
Market Analysis and Trends
Financial Services
The slide provides a comparative overview of SPAC and IPO activities across various regions, highlighting significant growth in the Americas.
SPACs, IPOs, financial markets, regional analysis, growth trends
false
Overview of global SPAC activityGlobal IPO Watch 2021 A PwC Global IPO Centre publication
Multiple Chart
PwC/Strategy&
View slide
A two-column layout with purple headers. Left column has a narrative on customer retention through reliability and value; right column lists the top reasons for promoter and detractor sentiments using numbers. The bottom provides a data source citation. Simple design with textual information and a list.
Market Analysis and Trends
Retail & E-commerce
The slide compares customer retention strategies focusing on reliability and value, illustrating the top reasons customers are promoted to or deterred from a brand. Useful for discussions on marketing strategy and consumer behavior analysis in the retail sector.
consumer retention, reliability, value, promoters, detractors, marketing, brand strategy
false
Steering the futureDigital Consumers of Tomorrow, Here Today: A SYNC SOUTHEAST ASIA REPORT
Agenda
Bain
View slide
Column charts and annotations depict the profitability trends of luxury brands from 2009 to projected 2025, focusing on EBIT percentages.
Financial Performance
Retail & E-commerce
Evaluates changes in the profitability of luxury brands over time, with projections up to 2025, considering the impact of digital disruptions.
profitability trends, luxury brands, financial analysis, digital impact, future projections
false
DIGITAL DISRUPTION SHIFTING PROFILE AND NATURE OF EXPENDITURE ITEMS; PROFITABILITY LIKELY TO STABILIZE IN THE COMING YEARSALTAGAMMA 2018 WORLDWIDE LUXURY MARKET MONITOR
Mixed Chart
Bain
View slide
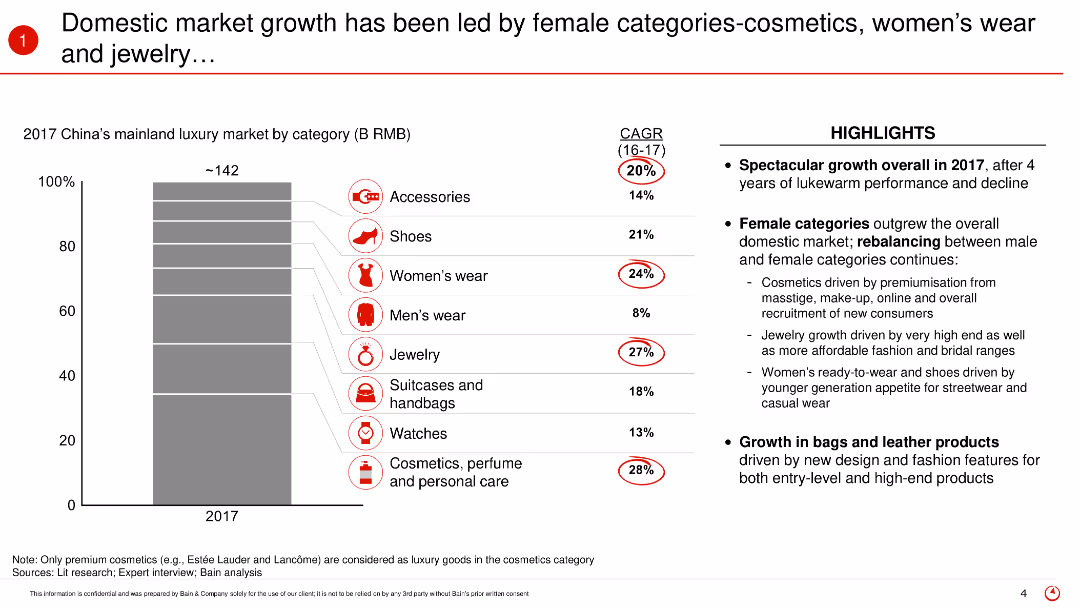
The slide contains a vertical bar (column) chart showing the market share of various luxury categories in 2017. It uses icons and text to highlight the categories led by female consumers and the respective compound annual growth rates (CAGR).
Market Analysis and Trends
Retail & E-commerce
The slide highlights the significant growth in China's luxury market driven by female categories such as cosmetics, women’s wear, and jewelry in 2017. It showcases the compound annual growth rates of these categories and emphasizes the shift in market dynamics towards female-led consumption.
Market growth, luxury market, female consumers, cosmetics, women’s wear, jewelry, China, 2017, market dynamics, CAGR
false
Domestic market growth has been led by female categories-cosmetics, women’s wear and jewelry…2017 China Luxury Market Study
Mixed Chart
Bain
View slide
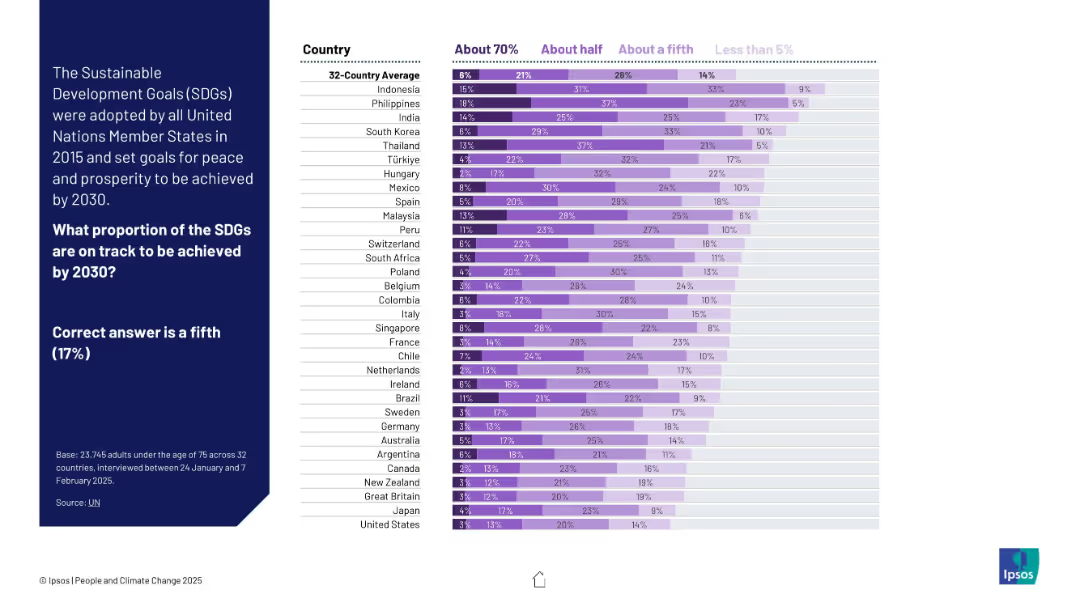
Stacked bar chart using shades of purple to show estimates across countries. Left panel provides correct answer (17%) for reference.
Industry Overview
Government & Public Sector
The chart shows how people estimate progress toward UN Sustainable Development Goals by 2030. Many overestimate; few select the accurate proportion (about one-fifth).
SDGs, sustainable development, UN goals, public awareness, global perception, Ipsos, progress tracking, purple chart, development targets, 2030 goals
false
What proportion of the SDGs are on track to be achieved by 2030?PEOPLE AND CLIMATE CHANGE
Mixed Chart
IPSOS
View slide
Column chart (horizontal) showing the percentage breakdown of integration costs across various functional areas such as HR, IT, and Finance.
Financial Performance
Professional Services
Breaks down the integration costs by function, highlighting the proportion of expenses in HR, IT, and other areas, demonstrating cost distribution.
integration, costs, HR, IT, finance, cost breakdown, functional expenses
false
Functional break down of integration costsHow to gain value from M&A
Single Chart
Deloitte
View slide
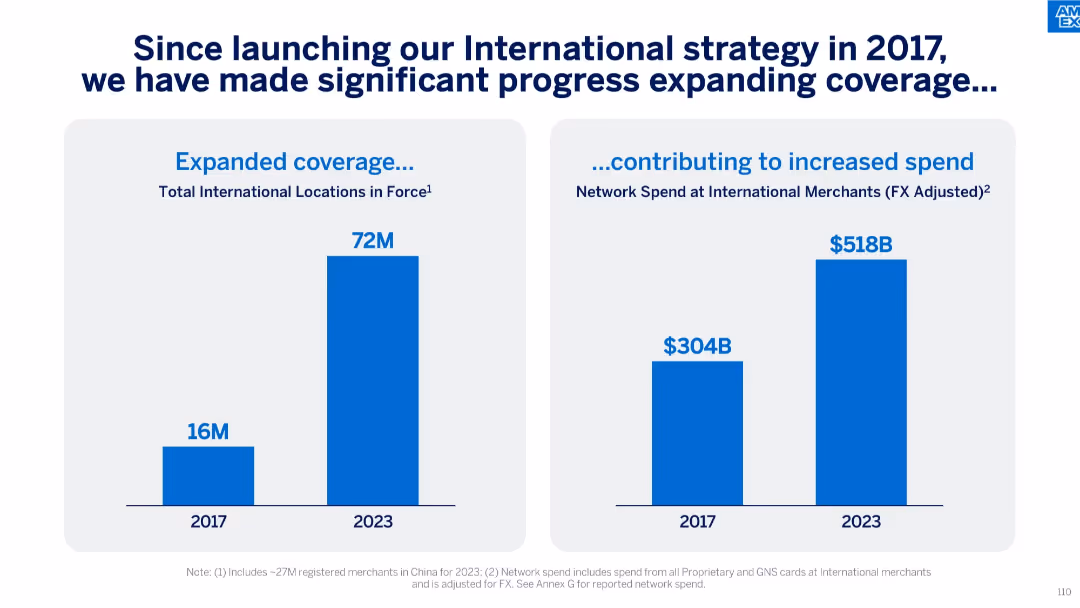
Two vertical bar charts: one for expanded international locations, another for network spend growth at international merchants.
Strategic Planning
Financial Services
This slide shows the outcome of the 2017 international strategy, highlighting significant increases in locations (from 16M to 72M) and FX-adjusted network spend (from $304B to $518B) at international merchants by 2023.
International Strategy, Merchant Spend, FX Adjusted, Location Growth, Global Expansion
false
Since launching our International strategy in 2017, we have made significant progress expanding coverageAmerican Express Investor Day 2024
Single Chart
McKinsey
View slide
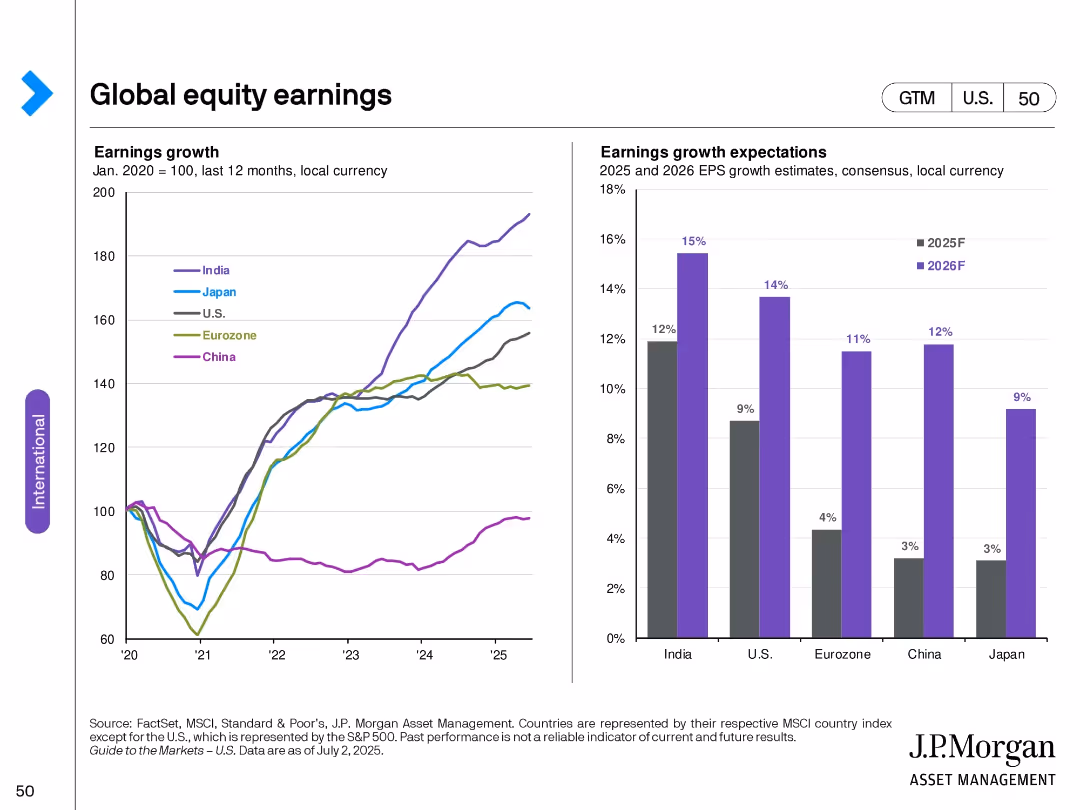
Dual chart layout: Left—indexed earnings growth by country; Right—bar chart of forecasted EPS growth (2025–2026).
Financial Performance
Financial Services
Displays historical earnings growth trends across key global regions and compares forward-looking EPS growth forecasts. India shows the strongest expected growth, with Japan and China lagging.
earnings growth, EPS forecast, regional comparison, financial outlook, 2025 projections, historical analysis
false
Global equity earningsGuide to the Markets U.S. 3Q 2025
Multiple Chart
JP Morgan
View slide
The slide contains a pie chart illustrating investors' views on limiting managers' exposure to digital assets. A vibrant image of digital assets in a server room is on the left.
Market Analysis and Trends
Financial Services
Explores hedge fund managers' interest in digital assets and investors' requirements for limiting exposure to these assets, highlighting the percentage of discretionary assets.
hedge funds, digital assets, investors, exposure, cryptocurrency, decentralized finance, blockchain, market trends, server room
false
Hedge fund managers’ interest in digital assets is still nascent, but growing Investors: Do you require that your managers limit their exposure to crypto-/digital-related assets in funds that are not dedicated to crypto-/digital-related assets?Can resilience shape a shifting landscape?
Mixed Chart
EY
View slide
Waterfall chart showing IFRS to net amount adjustments; summary box on right.
Risk Assessment and Management
Financial Services
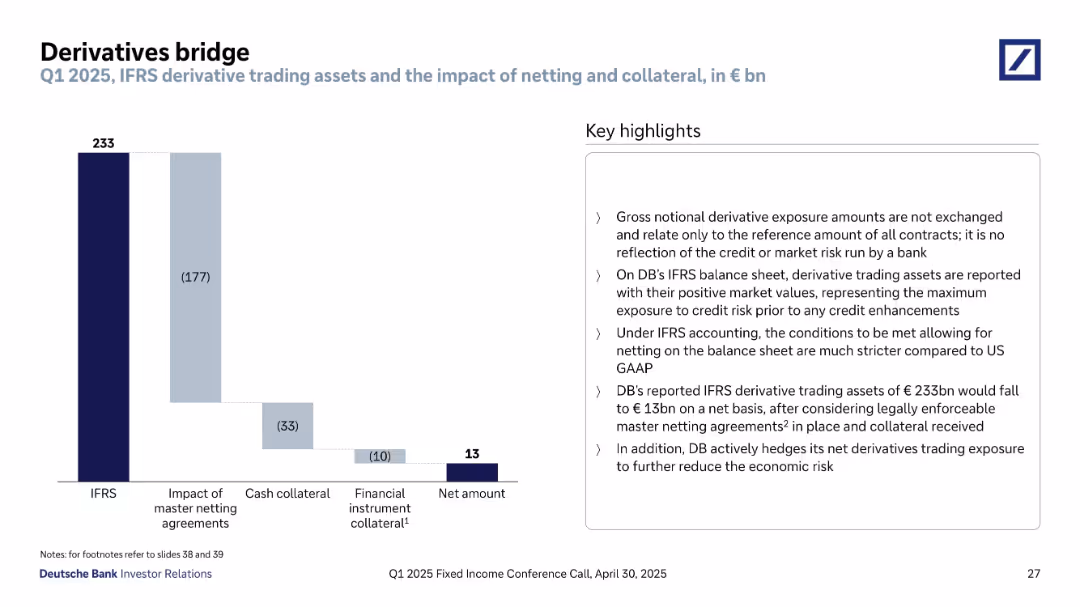
Shows how Deutsche Bank’s derivative trading asset value reduces from €233bn (IFRS) to €13bn net through netting and collateral. Explains IFRS accounting treatment versus U.S. GAAP, credit risk representation, and risk hedging strategies. Highlights conservative exposure reporting and efforts to minimize economic risk through netting and collateral management.
derivatives, IFRS, netting, collateral, credit risk, risk management, Deutsche Bank, waterfall chart, accounting treatment
false
Derivatives bridgeQ1 2025 Fixed Income Investor Conference Call
Mixed Chart
Deutsche Bank
View slide
The slide follows a structured three-column layout describing methodology phases: "Trend analysis," "Market assessment," and "Impact on market players," each with bullet points and icons above the headers. On the right side, a shaded box contains "Sources" with bullet points listing data sources. The background is white with black and grey text. A Roland Berger logo appears in the upper right corner.
Market Analysis and Trends
Industrial & Manufacturing
This slide outlines the methodology used to analyze automotive trends and their implications for the stamped BIW (Body-in-White) and chassis component market. It breaks down the approach into three phases: identifying macro trends, estimating market size and segmentation, and analyzing competitive impact on key players. The slide also lists data sources including interviews, external providers, and desk research.
automotive trends, BIW, chassis components, market forecast, competitive landscape, hot stamping, macro trends, methodology, Roland Berger, market segmentation
false
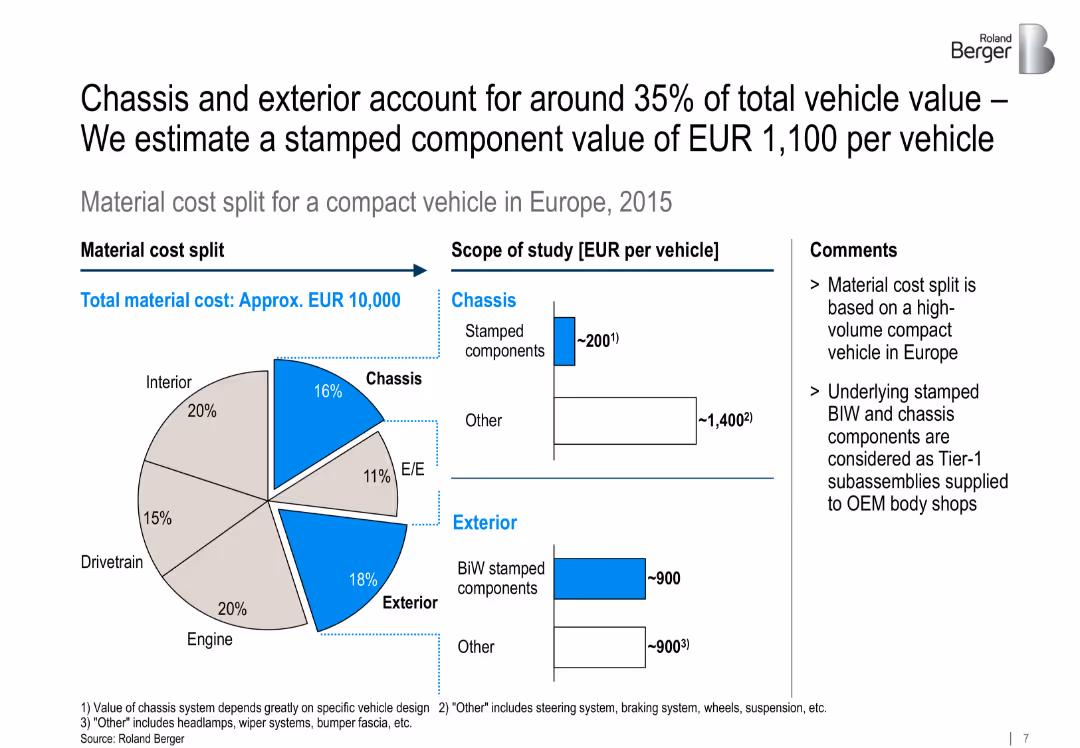
Chassis and exterior account for around 35% of total vehicle value – We estimate a stamped component value of EUR 1,100 per vehicleAutomotive metal components for car bodies and chassis
Multiple Chart
Roland Berger
View slide
The slide shows a rock climber in a scenic location. Next to it is a column chart listing reasons for Greece’s attractiveness to improve, with yellow bars indicating the percentage of respondents.
Market Analysis and Trends
Professional Services
The slide highlights reasons investors expect Greece’s attractiveness to improve, citing infrastructure quality, availability of skilled talent, sustainability, and R&D opportunities.
attractiveness, improve, Greece, reasons, infrastructure, talent, sustainability
false
Why do you expect Greece’s attractiveness to improve? (selection of all that apply) Sample: 168 respondents, expecting Greece’s attractiveness to improveGreece goes the distance, continuing to win investors’ trust
Multiple Chart
EY
View slide
Bar chart comparing travel and tourism capital investment as % of GDP by country; background nature imagery
Strategic Planning
Hospitality & Tourism
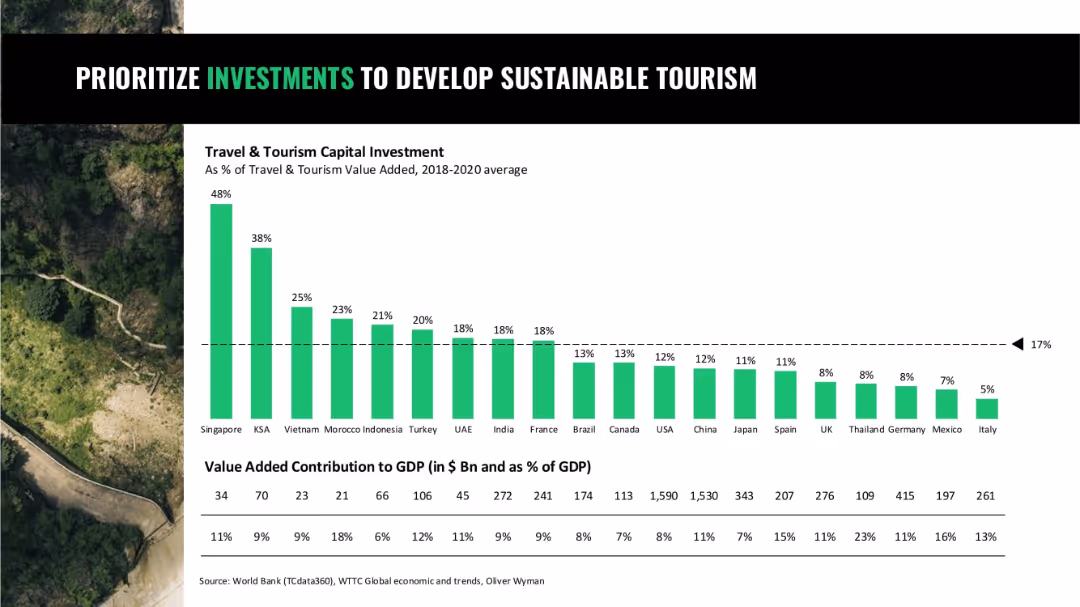
A comparison of how countries invest in sustainable tourism relative to GDP, highlighting Singapore, Saudi Arabia, and Vietnam as leaders, and showing a global average benchmark.
tourism investment, sustainable development, travel, capital allocation, GDP share
false
PRIORITIZE INVESTMENTS TO DEVELOP SUSTAINABLE TOURISMOUR 5 URGENT ACTS
Single Chart
Oliver Wyman
View slide
Incorporates a mix of colored texts in boxes, infographics, and progress bars to represent sustainability goals and social commitments in finance.
Market Analysis and Trends
Technology & Software
Conveys financial commitments to sustainability and inclusivity, outlining progress in green finance, community, and diversity initiatives.
sustainability, inclusivity, finance, community development, green, social responsibility, progress
false
Advancing a sustainable and inclusive economy remains a core priorityFirm Overview 2022
Table
JP Morgan
View slide
Three interconnected circular nodes with icons, titled 'The Future of Enterprise', 'The Future of the Workforce', and 'How Work Gets Done'. The slide has a futuristic and clean design.
Technology and Digital Transformation
Professional Services
Presents an interconnected analysis of the future of enterprises, workforce, and work processes, with emphasis on disruptive forces and innovation.
future, enterprise, workforce, work processes, disruptive innovation
false
The world is changing and the future is arriving nowFuture of Work - How work is enabled?
Linear Flow
Deloitte
View slide
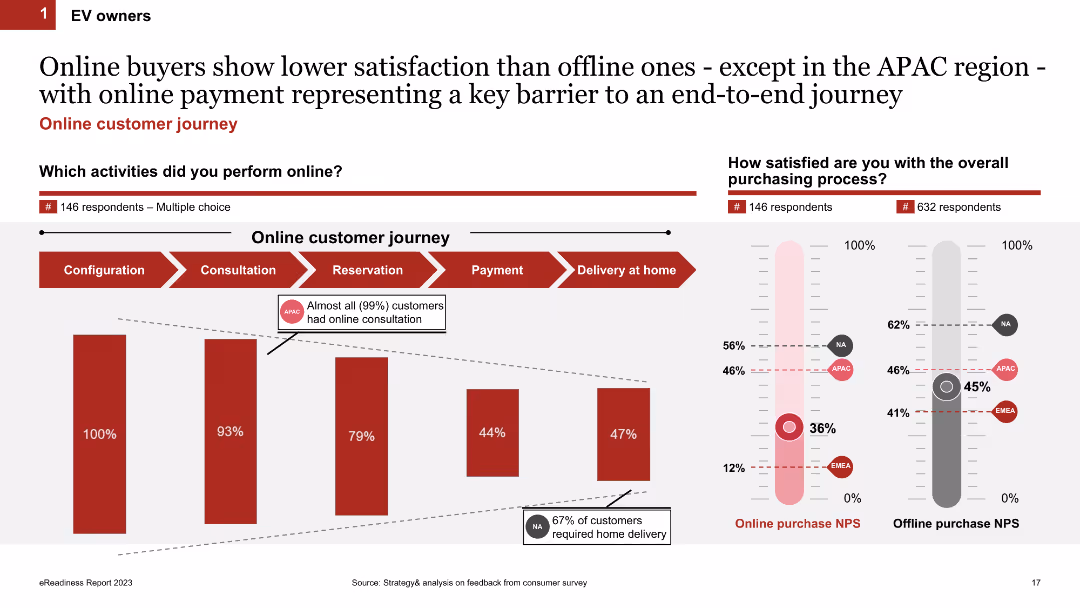
Two sections: a column chart on online customer journey activities and a satisfaction comparison between online and offline purchases.
Market Analysis and Trends
Transportation & Logistics
Examines the online purchasing process and highlights the lower satisfaction levels of online buyers compared to offline buyers, especially regarding payment barriers.
online purchase, customer journey, satisfaction, EV buyers, survey
false
Online buyers show lower satisfaction than offline ones - except in the APAC region - with online payment representing a key barrier to an end-to-end journey4th edition eReadiness 2023
Multiple Chart
PwC/Strategy&
View slide
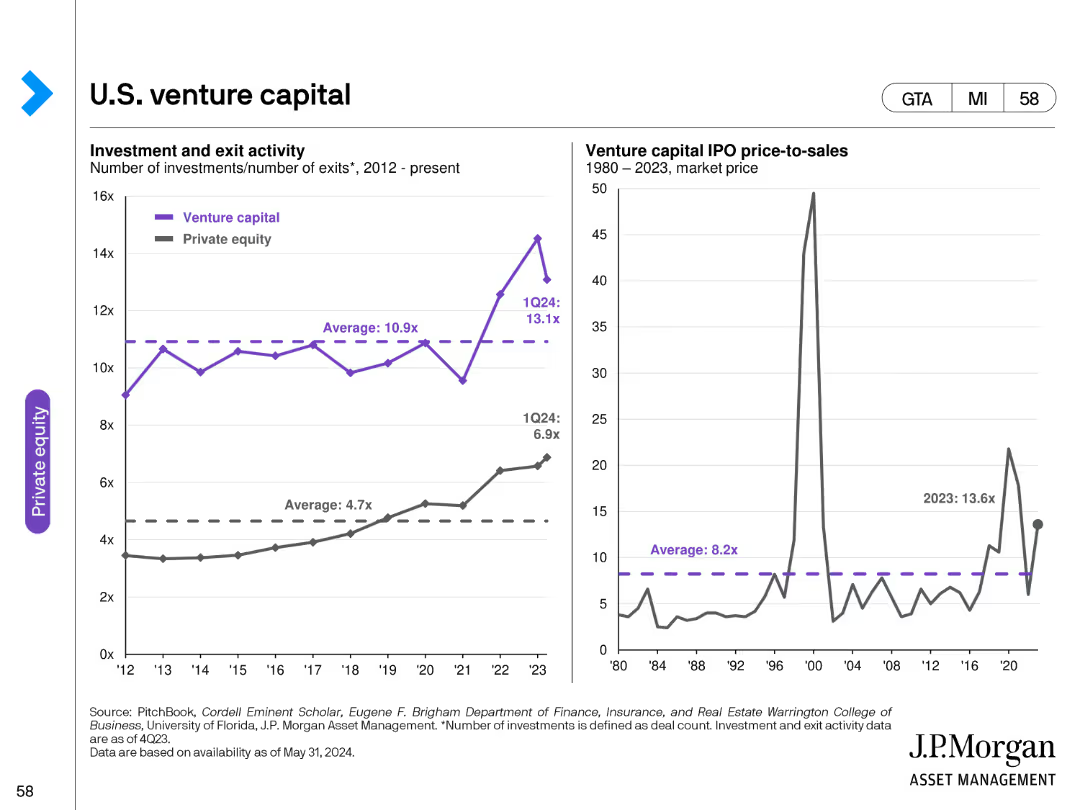
The slide features two line charts: one showing venture capital investment and exit activity, and the other depicting IPO price-to-sales ratios over time.
Investment Analysis
Financial Services
It provides a detailed analysis of U.S. venture capital activities, highlighting investment and exit trends as well as IPO price-to-sales ratios.
venture capital, U.S., investments, exits, IPO, price-to-sales, trends, financial, data analysis
false
U.S. venture capitalGuide to Alternatives
Multiple Chart
JP Morgan
View slide
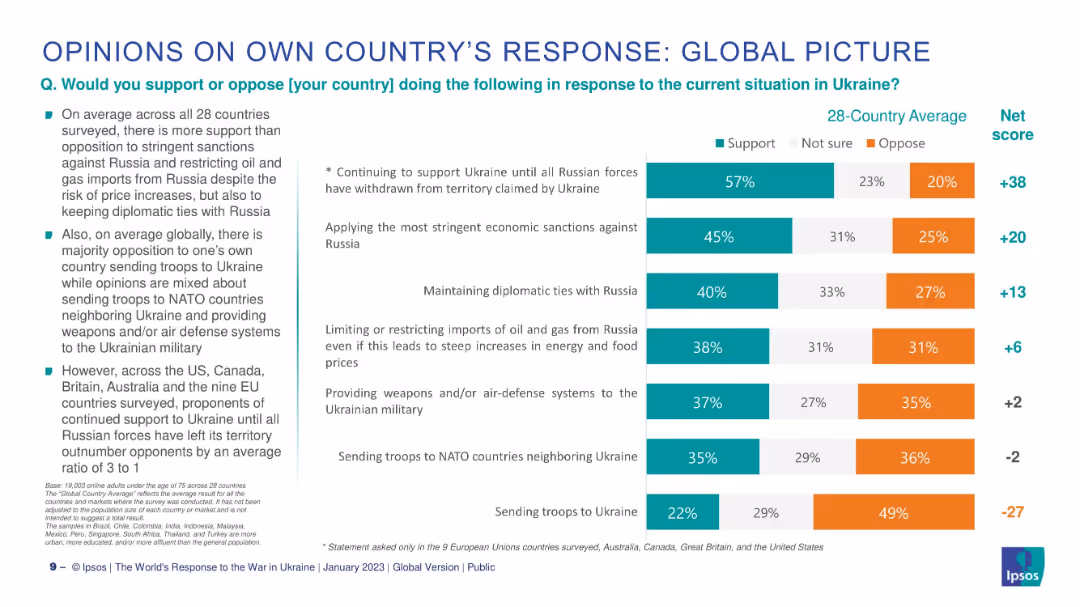
Horizontal bar chart with segmented bars (support/unsure/oppose), accompanied by key highlights in bullets.
Strategic Planning
Government & Public Sector
This slide explores global opinion on how citizens want their own governments to respond to the Ukraine conflict. It breaks down support, opposition, and uncertainty on actions like military aid, economic sanctions, and diplomatic relations.
response, sanctions, military, aid, opinion, support, oppose, Ipsos, Ukraine
false
OPINIONS ON OWN COUNTRY’S RESPONSE: GLOBAL PICTURETHE WORLD’S RESPONSE TO THE WAR IN UKRAINE
Mixed Chart
IPSOS
View slide
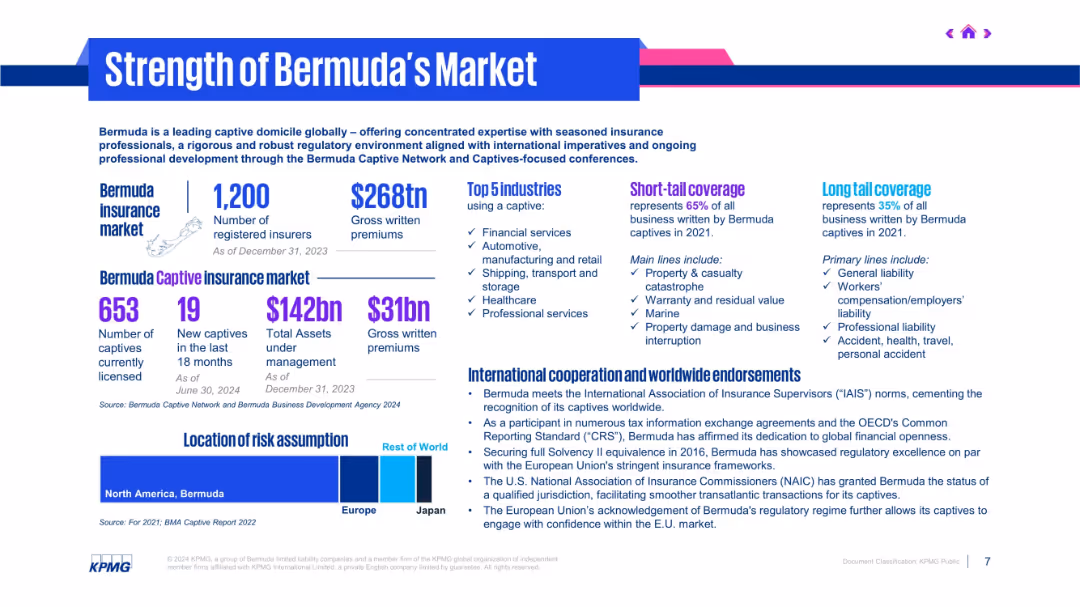
Infographic layout with multiple blocks, charts, and figures using purple and blue tones.
Industry Overview
Financial Services
The slide presents Bermuda’s position as a leading captive insurance market, detailing metrics like number of insurers, gross premiums, and top industries. It highlights coverage types, international endorsements, and geographic risk assumption.
Bermuda, captives, insurance market, premiums, endorsements, coverage
false
Strength of Bermuda's MarketCaptive Insurance Guide
Mixed Chart
KPMG
View slide
Bar chart with change indicators showing agreement with the view that the world is improving; ranked by country.
Market Analysis and Trends
Media & Entertainment
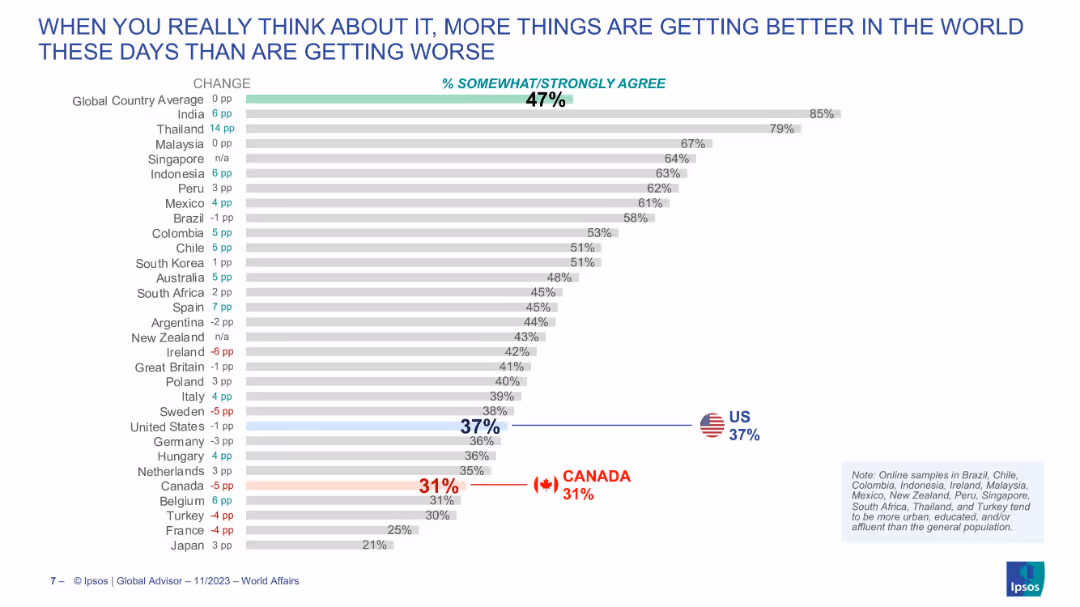
This slide explores public optimism globally, comparing countries that believe more things are improving than worsening, with India and Thailand showing the most positivity.
optimism, improvement, public sentiment, inequality, global attitudes, comparative analysis
false
More Things Are Getting Better Than WorseWORLD AFFAIRS 2023
Single Chart
IPSOS
View slide
The slide features multiple data visualizations including a large column chart, a line graph, and several tables with quantitative data. Colors like red and black are used for text and highlighting, with a clear division between different sections.
Market Analysis and Trends
Financial Services
This slide presents an overview of global token offerings in the first ten months of 2019, showcasing total funds raised and the evolution of offerings over the years. It includes specific examples like the Telegram ICO and uses visual aids to compare funding volumes and token offering counts.
ICO, STO, global, funding, blockchain, 2019, token offerings, digital tokens
false
In first ten months 2019, over 380 token offerings have raised a total of USD 4.1bn[Presentation title] 6th ICO / STO Report
Mixed Chart
PwC/Strategy&
View slide
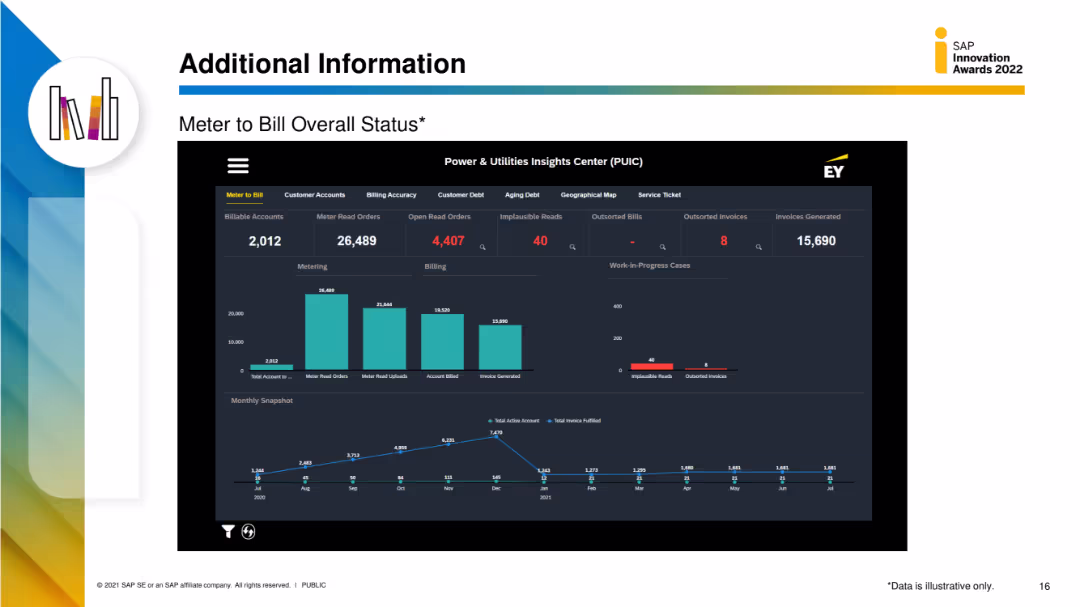
The slide features a detailed dashboard with multiple data visualizations, including column charts and metrics for meter to bill status, customer accounts, and billing accuracy.
Performance Metrics and KPIs
Energy & Utilities
This slide provides detailed metrics on the meter-to-bill process, including the number of billable accounts, meter read orders, and billing accuracy, displayed through various data visualizations.
meter to bill, status, utilities, customer accounts, billing accuracy
false
Additional Information Meter to Bill Overall Status*SAP Innovation Awards 2022 Entry Pitch Deck
Multiple Chart
EY
View slide
Combines a column chart with the forecasted market size and textual annotations detailing strategic imperatives for the luxury goods sector.
Strategic Planning
Retail & E-commerce
Forecasts the luxury goods market and outlines strategic mantras focused on proactive customer engagement and leveraging technology.
market forecast, strategic planning, luxury goods, technology integration, customer engagement
false
AS WE LOOK AHEAD: 3 STRATEGY MANTRAS AND 1 FUNDAMENTAL ENABLER TO BEAR IN MINDALTAGAMMA 2018 WORLDWIDE LUXURY MARKET MONITOR
Mixed Chart
Bain
View slide
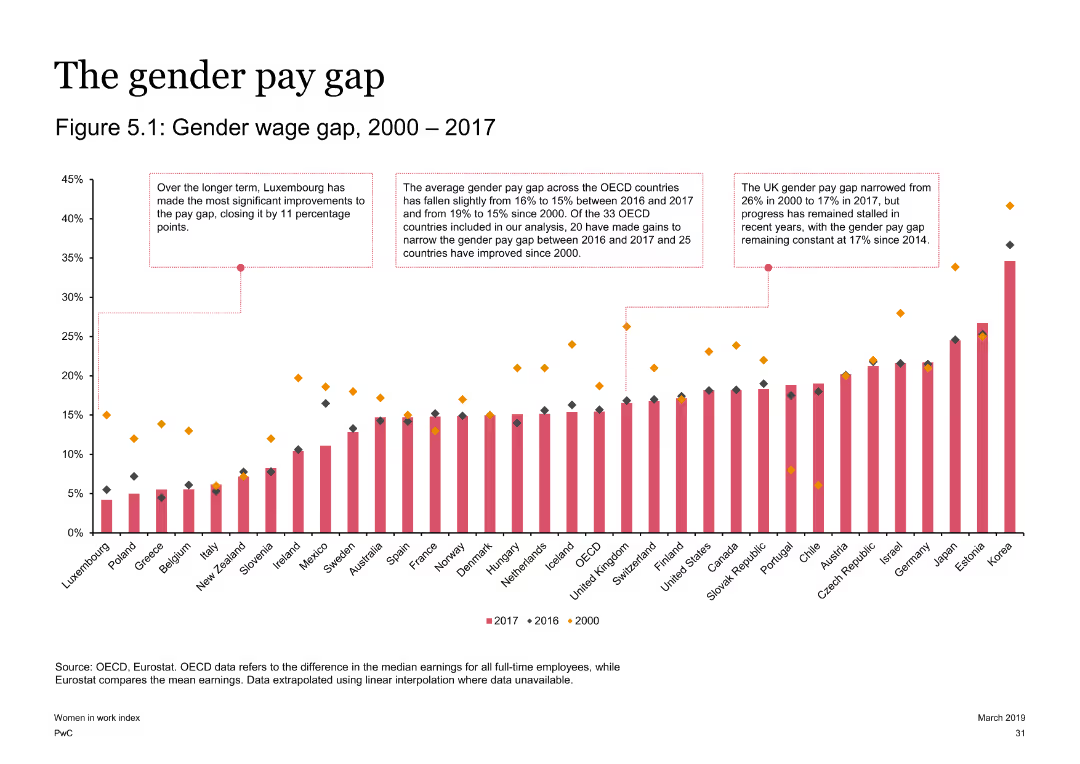
Features a column chart showing gender wage gaps across OECD countries from 2000 to 2017. The slide includes annotations highlighting key points and trends. The slide is visually engaging with detailed data.
Market Analysis and Trends
Government & Public Sector
Analyzes the gender wage gap trends across OECD countries, highlighting improvements in Luxembourg and the overall reduction in the gap since 2000. The slide provides a clear visual representation of the data over time.
gender wage gap, OECD, wage trends, Luxembourg, data analysis
false
The gender pay gap Figure 5.1: Gender wage gap, 2000 – 2017Women in Work Index 2019
Single Chart
PwC/Strategy&
View slide
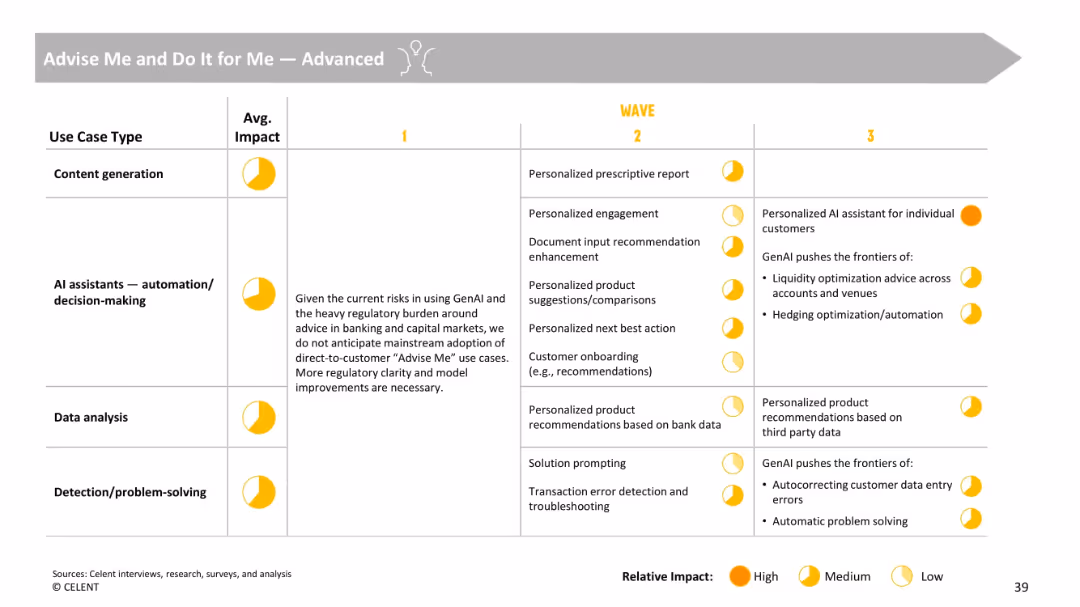
Tabular structure outlining advanced GenAI applications, with notes and footnotes on risk considerations.
Strategic Planning
Financial Services
Describes advanced GenAI use cases like personalized recommendations, financial planning, and automated troubleshooting. Notes current limitations due to regulatory constraints and outlines a roadmap for future AI involvement in banking.
advanced AI, financial advice, automation, personalization, regulation, onboarding
false
Advise Me and Do It for Me — AdvancedGenerative AI Making Waves
Single Chart
Oliver Wyman
View slide
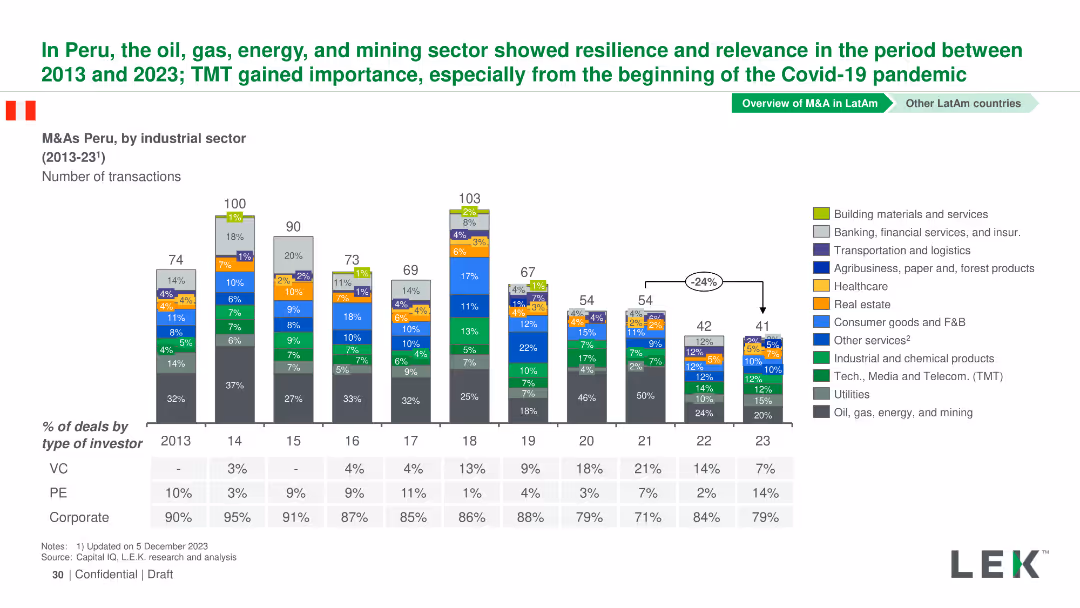
Column chart showing the number of M&A transactions by industrial sector in Peru from 2013-2023. Sectors are color-coded and detailed in a legend.
Market Analysis and Trends
Financial Services
This slide presents M&A transactions in Peru from 2013-2023, highlighting the resilience and relevance of the oil, gas, energy, and mining sectors.
Peru, M&A, Industrial Sectors, Transactions, Trends
false
In Peru, the oil, gas, energy, and mining sector showed resilience and relevance in the period between 2013 and 2023; TMT gained importance, especially from the beginning of the Covid-19 pandemicMergers and Acquisitions in LatAm: Evolution and prospects
Mixed Chart
LEK
View slide
Includes a pie chart and a sectioned content layout with headers and bullet points. Text sections cover key findings and broad overviews.
Operational Efficiency
Financial Services
This slide outlines the limited involvement of tax functions in ERP and software deployment within companies. It details the survey percentages and discusses the necessity for greater integration of tax operations into ERP systems.
tax, ERP, software, deployment, involvement, financial services, pie chart
false
Tax usually has little involvement in Enterprise Resource Planning (ERP)/Software deploymentTax Function Effectiveness
Mixed Chart
PwC/Strategy&
View slide
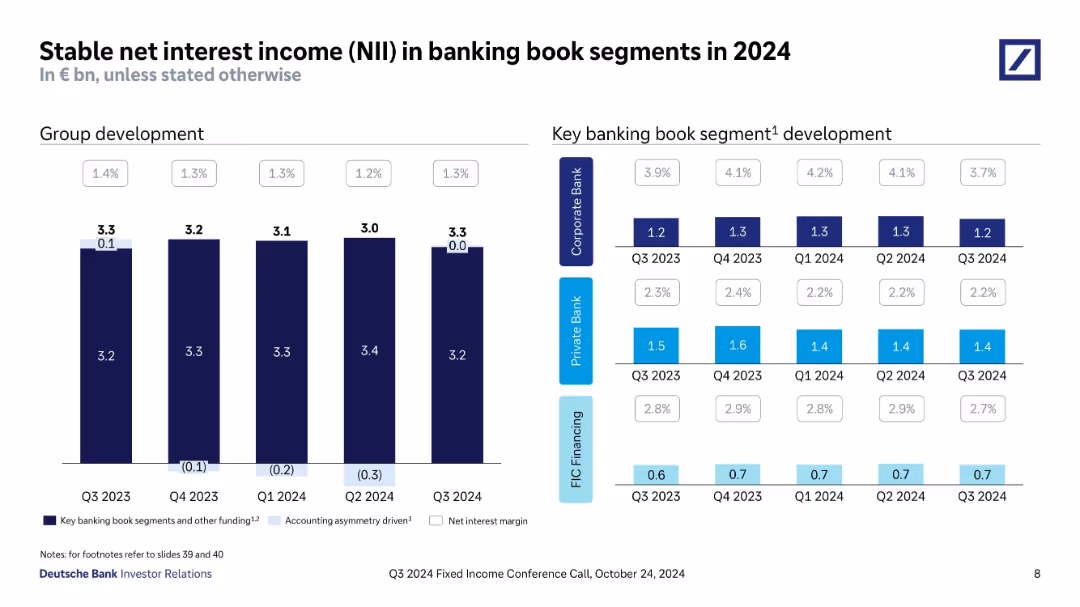
Dual-panel slide with grouped bar charts: one for total NII (with margin overlays), another segmented by business line. Tables show values and margins across quarters.
Financial Performance
Financial Services
Demonstrates that net interest income remains stable despite slight margin pressure. Provides breakdown by Corporate Bank, Private Bank, and FIC Financing. Highlights consistent NII performance across 2024 with minor variance.
net interest income, banking book, NII margin, FIC, Corporate Bank, Private Bank, Q3 2024, 2024 trend
false
Stable net interest income (NII) in banking book segments in 2024Q3 2024 Fixed Income Investor Conference Call
Multiple Chart
Deutsche Bank
View slide
The slide features a pie chart breaking down the customer base by sector: Defense, Civil, Intelligence, and Global Commercial. Each sector has additional details listed alongside. The layout is clean and informative.
Customer and Market Segmentation
Professional Services
This slide outlines Booz Allen's diverse customer base across various sectors, including Defense, Civil, Intelligence, and Global Commercial. It highlights the company's broad reach and specialization in different market segments.
customer base, segmentation, defense, civil, intelligence
false
BROAD CUSTOMER BASE WE SERVE A BROAD CUSTOMER BASE THAT SPANS ACROSS THE U.S. GOVERNMENT AND COMMERCIAL MARKETSInvestor Presentation Deck
Mixed Chart
Booz Allen Hamilton
View slide
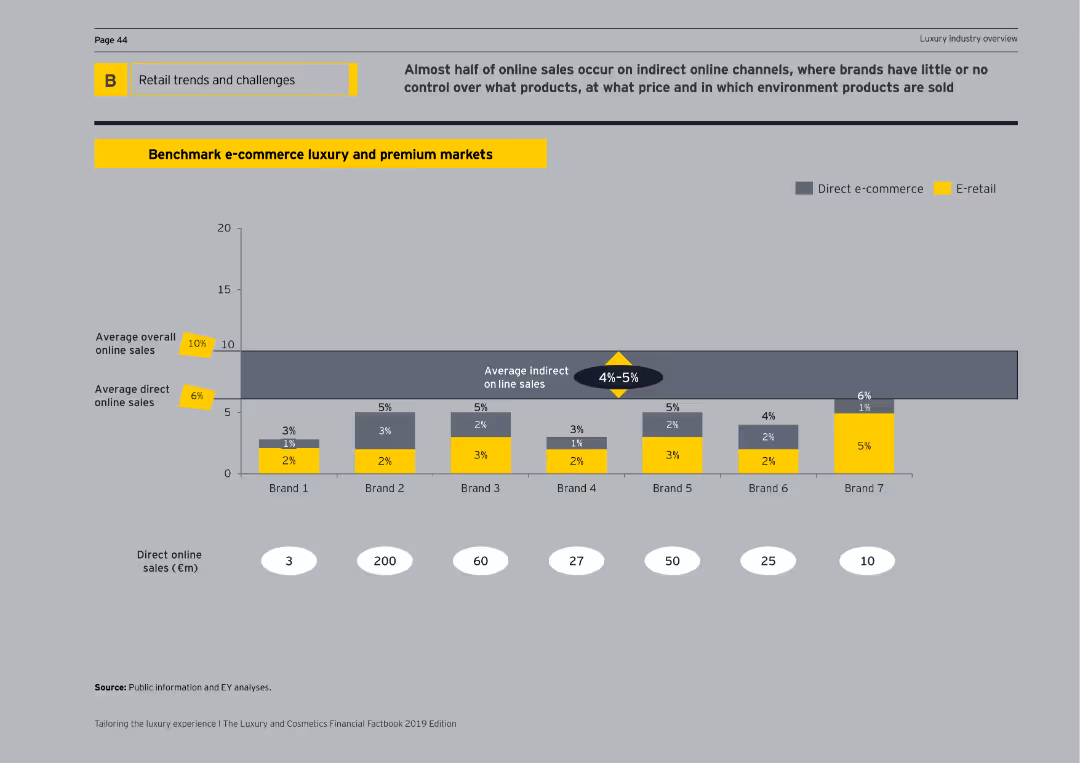
Contains bar charts comparing direct and indirect online sales across seven brands, highlighting average online sales percentages.
Competitive Landscape
Retail & E-commerce
Analyzes e-commerce performance in the luxury and premium markets, focusing on direct versus indirect sales and brand comparisons.
e-commerce, luxury, premium markets, direct sales, indirect sales, online sales, brand comparison, bar charts, competitive landscape
false
Almost half of online sales occur on indirect online channels, where brands have little or no control over what products, at what price and in which environment products are soldTailoring the luxury experience The Luxury and Cosmetics Financial Factbook 2019 Edition
Single Chart
EY
View slide
Presents a column chart showing the growth in commercial banking gross investment banking revenue over five years, with annotations and icons indicating key growth areas.
Financial Performance
Financial Services
Explains JPMC's success in delivering top-tier investment banking services to commercial banking clients, highlighting consistent revenue growth and strategic expansion in targeted sectors.
investment banking, commercial banking, revenue growth, JPMC, strategic expansion, middle market, private capital
false
Delivering the #1 investment bank to CB clientsCommercial Banking 2022
Mixed Chart
JP Morgan
View slide
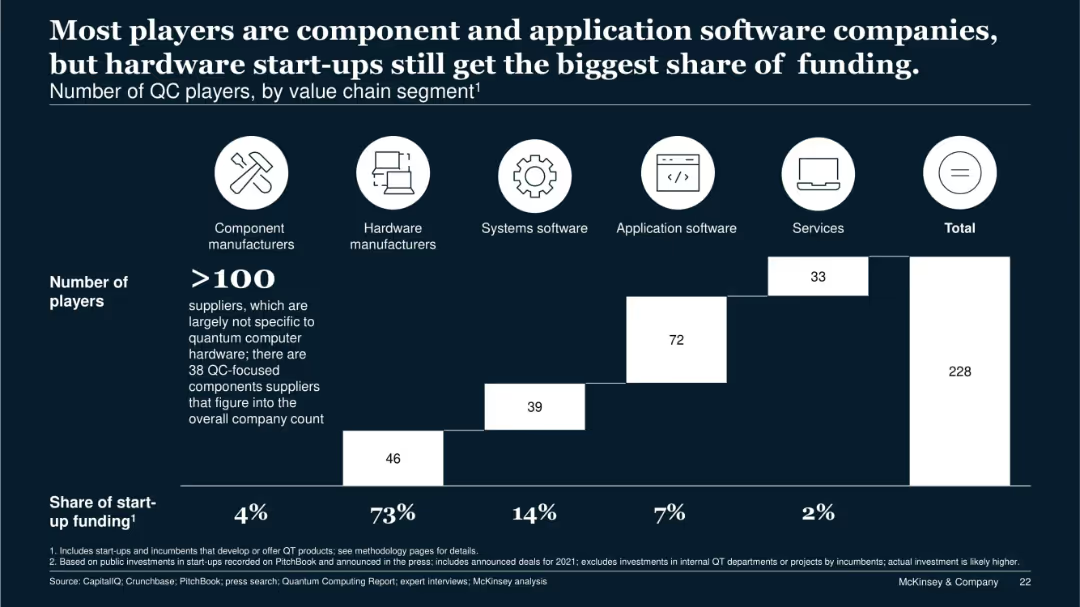
Stacked bar chart segmented by company type; icons for categories above the chart; funding share noted below.
Competitive Landscape
Technology & Software
This slide segments 228 quantum computing companies by value chain role. Although hardware manufacturers represent only a fraction of players, they receive 73% of total startup funding. It illustrates market imbalance and the dominant capital flow toward hardware.
value chain, QC players, startup funding, hardware, components, services
false
Most players are component and application software companies, but hardware start-ups still get the biggest share of funding.Quantum Technology Monitor June 2022
Single Chart
McKinsey
View slide
Same design as previous slides with vertical country list and agree/disagree bar chart; teal for "Agree", red for "Disagree".
Market Analysis and Trends
Government & Public Sector
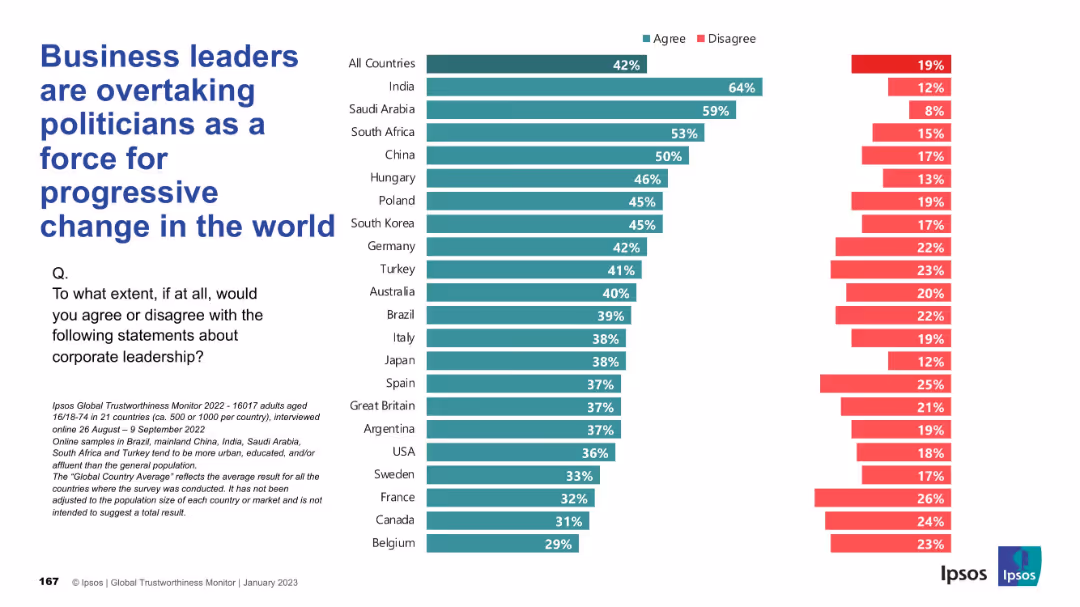
This slide explores the perception that corporate leaders are becoming more progressive change agents than politicians. Agreement is highest in India and Saudi Arabia, showing a trend of growing corporate influence.
corporate influence, progressive change, politics, public perception, Ipsos, leadership, governance, reform
false
Business leaders are overtaking politicians as a force for progressive change in the worldIPSOS GLOBAL TRUSTWORTHINESS MONITOR January 2023
Mixed Chart
IPSOS
View slide
The slide includes a pie chart and a table, with a layout that balances text and visual elements. The focus is on investor satisfaction with digital experiences.
Customer and Market Segmentation
Financial Services
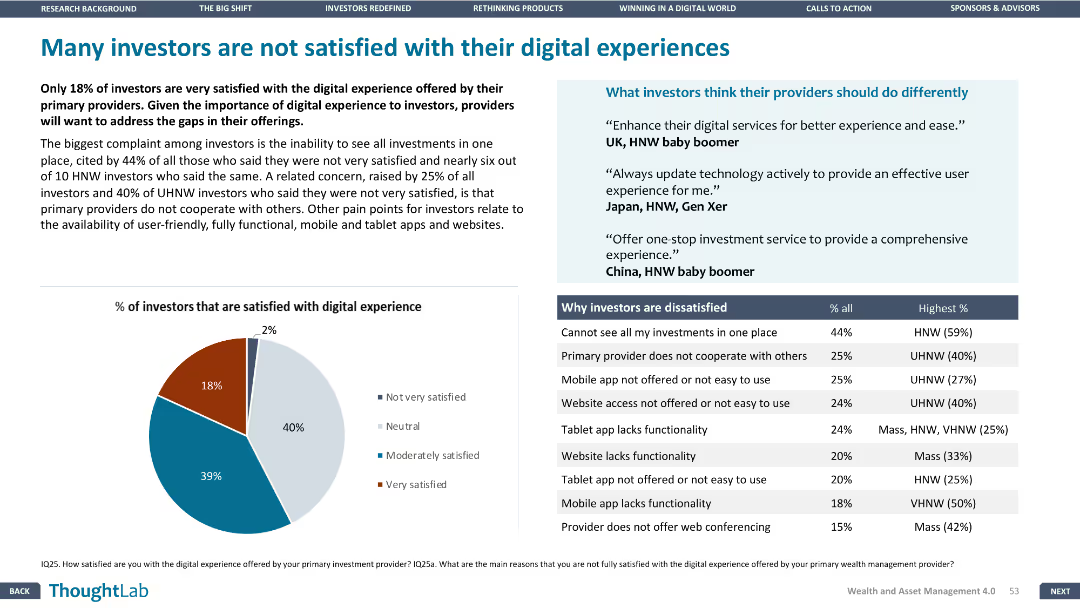
The slide addresses the dissatisfaction among investors with their digital experiences, listing the main reasons for dissatisfaction and what investors think providers should do differently.
Investor satisfaction, digital experience, dissatisfaction reasons, improvement
false
Many investors are not satisfied with their digital experiencesWealth and asset management 4.0
Mixed Chart
Deloitte
View slide
The slide uses pie charts and bar charts to show the percentage of Canadians who received recommendations from financial advisors to purchase crypto funds, comparing data from 2023 and 2022.
Market Analysis and Trends
Financial Services
It details recommendations from financial advisors regarding purchasing crypto funds, including the frequency and nature of these recommendations and changes from 2022 to 2023.
recommendations, financial advisor, crypto funds, purchase, comparison
false
Recommendations From Advisor to Purchase Crypto Funds Consistent with crypto assets, 78% of investors with advisors have not been recommended to purchase crypto investment funds by their financial advisor;CRYPTO ASSET SURVEY 2023
Multiple Chart
IPSOS
View slide
The slide features a mix of text and a column chart comparing the UK’s ranking with other G7 countries. The text highlights key points about the UK's position in the index and its performance over time.
Market Analysis and Trends
Financial Services
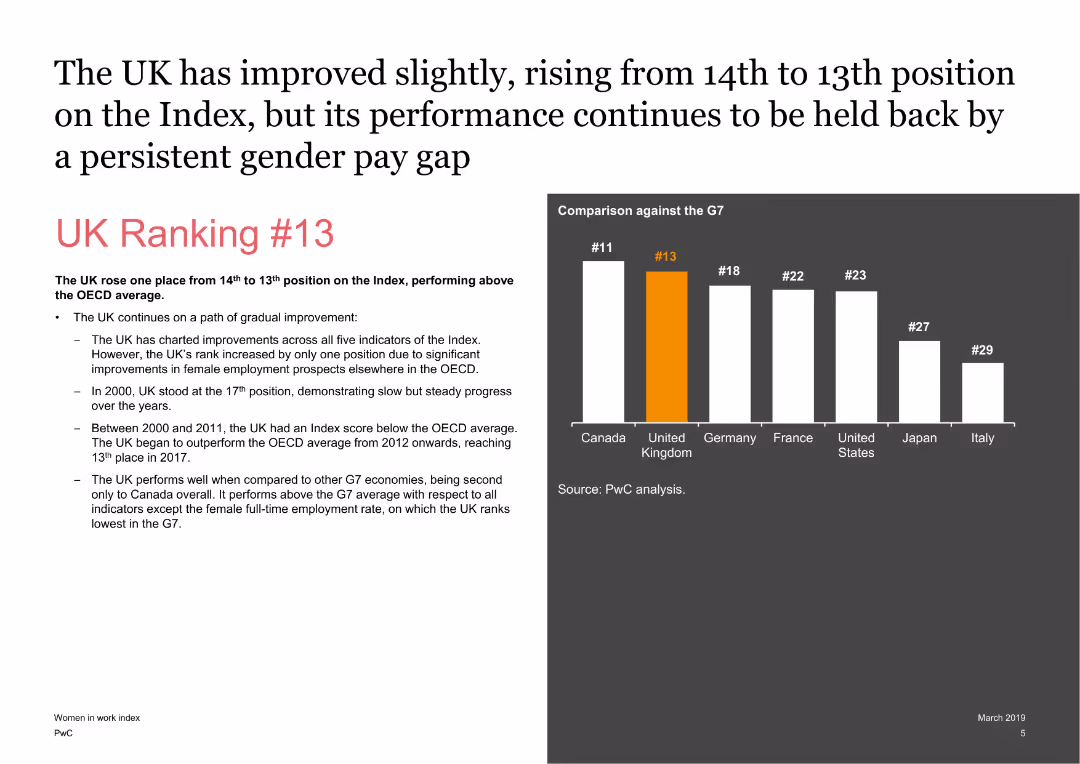
It discusses the UK’s improvement in the ranking on the Women in Work Index, highlighting the UK's performance compared to other G7 countries and factors influencing its ranking.
UK, Ranking, G7, Performance, Index, Analysis
false
The UK has improved slightly, rising from 14th to 13th position on the Index,Women in Work Index 2019
Mixed Chart
PwC/Strategy&
View slide
Contains several pie charts and column charts depicting revenues by client segment, assets under management, and new client segments within personal and wealth management.
Customer and Market Segmentation
Financial Services
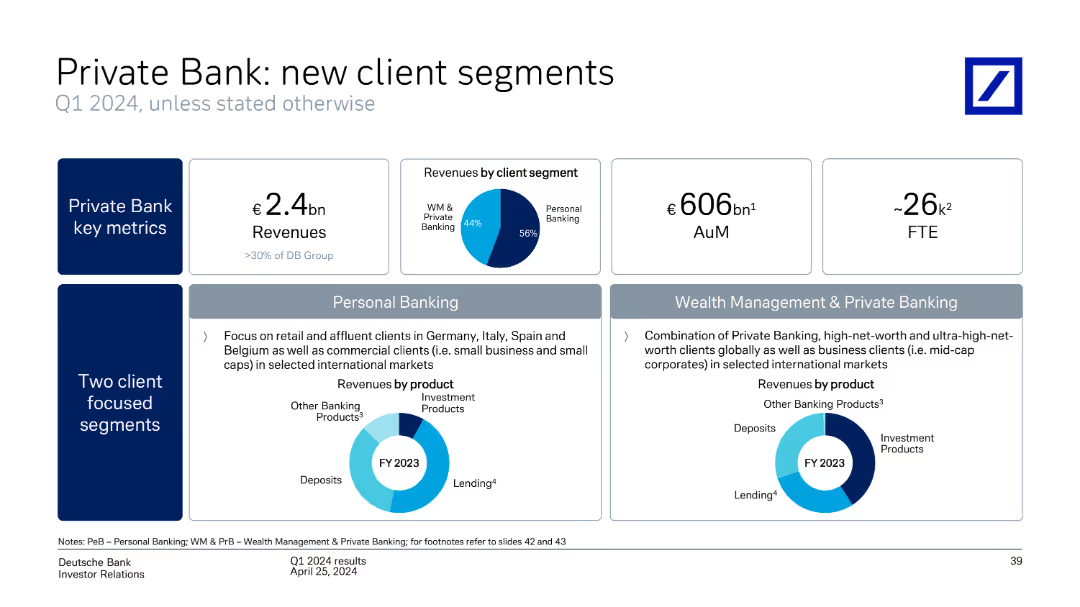
Analyzes new client segments and key metrics for private banking, highlighting revenues, assets under management, and focused client segments.
private bank, client segments, revenues, assets under management, personal banking, wealth management
false
Private Bank: new client segments Q1 2024, unless stated otherwiseQ1 2024 results
Multiple Chart
Deutsche Bank
View slide
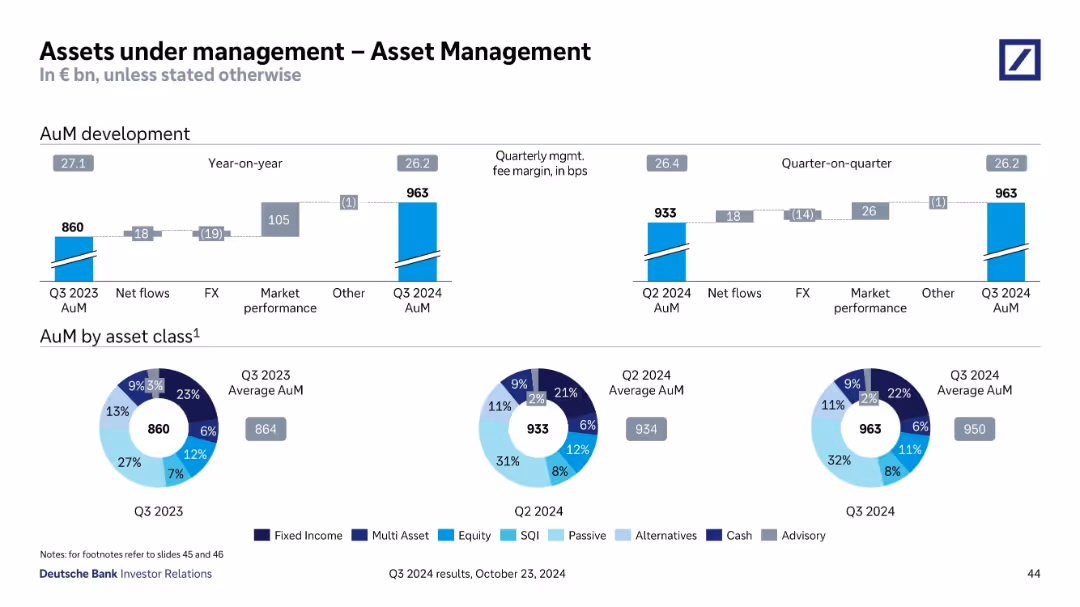
Top shows AuM development bar chart (YoY and QoQ), bottom features pie charts of AuM by asset class for 3 quarters.
Financial Performance
Financial Services
Analyzes changes in Asset Management AuM from Q3 2023 to Q3 2024, highlighting impact from market performance and FX. Pie charts show diversification across fixed income, equity, passive, and other asset classes.
AuM, Asset Management, FX, Market Performance, Fixed Income, Equity
false
Assets under management – Asset ManagementQ3 2024 results
Multiple Chart
Deutsche Bank
View slide
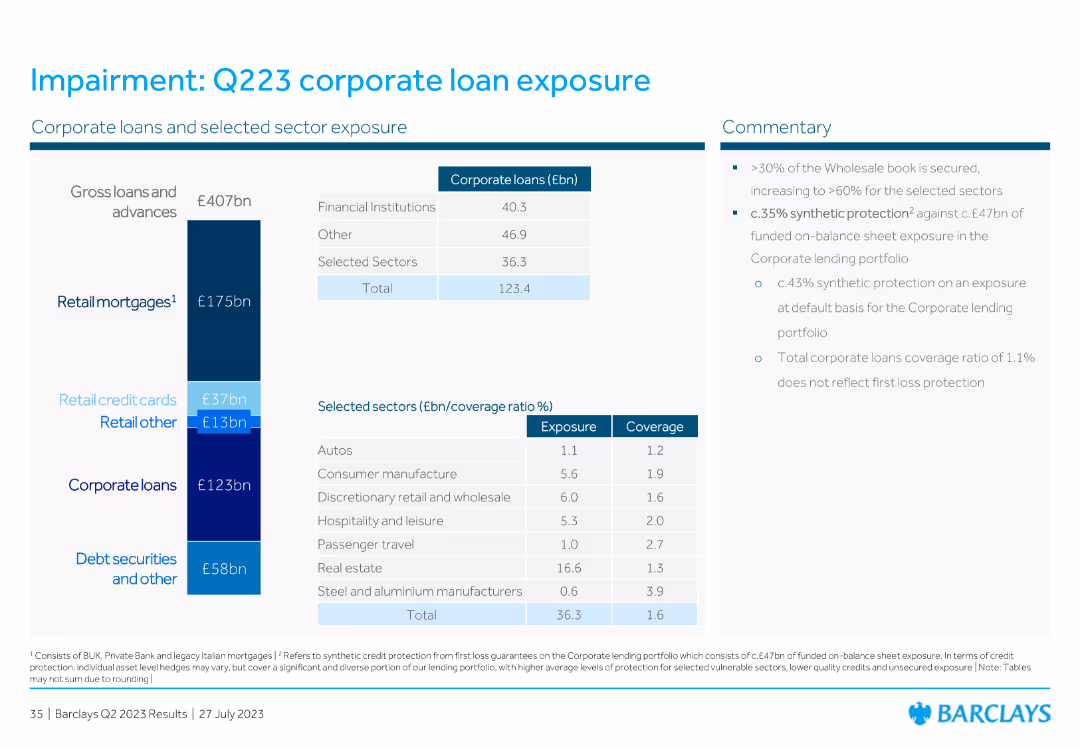
The slide contains a detailed table listing corporate loans and selected sector exposure with specific values for financial institutions, retail mortgages, credit cards, and other sectors. Includes commentary on the right-hand side.
Financial Performance
Financial Services
The slide presents corporate loan exposure and sector-specific coverage ratios. Commentary includes insights on wholesale book security and synthetic protection, highlighting overall corporate loan exposure and risk management.
corporate loans, sector exposure, retail mortgages, commentary, financial institutions
false
Impairment: Q223 corporate loan exposureBarclays PLC Q2 2023 Results Presentation
Mixed Chart
Barclays
View slide
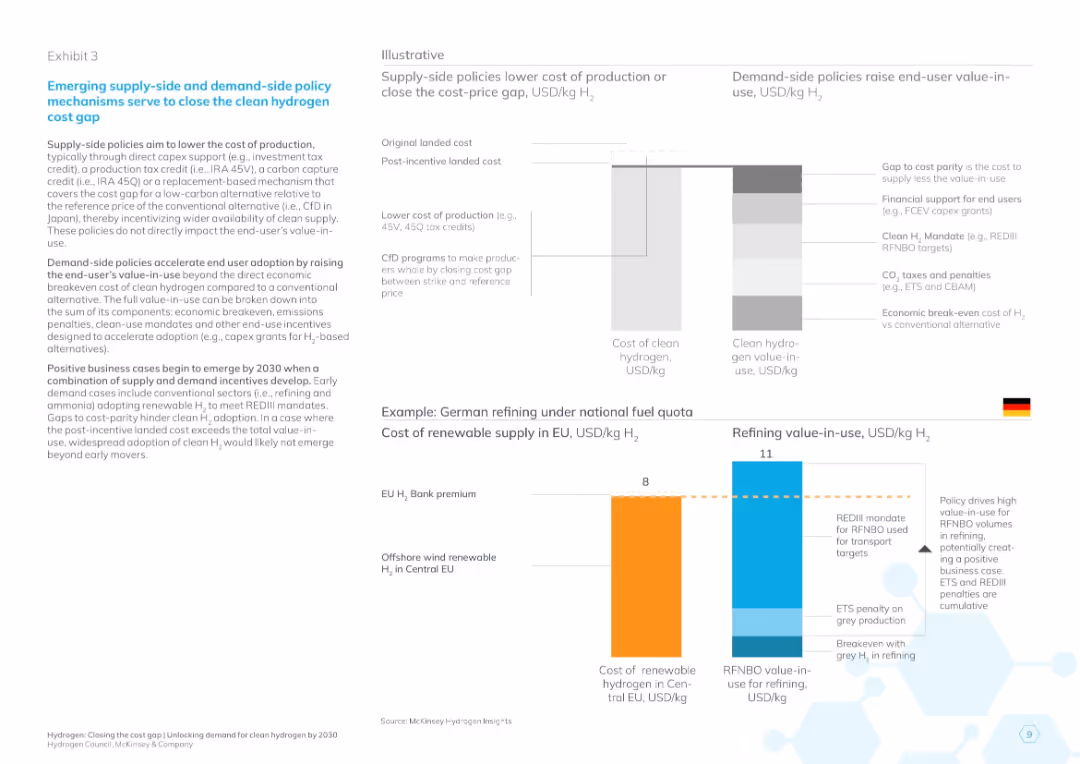
Left text explains policies; right side includes two diagrams: a bar visual of cost reductions and a Germany-focused comparison of hydrogen costs and value-in-use.
Regulatory and Compliance
Energy & Utilities
Explains supply- and demand-side policy mechanisms to narrow hydrogen cost gaps. Uses visual examples to illustrate how incentives can make clean hydrogen financially viable in sectors like German refining.
hydrogen policy, cost gap, value-in-use, subsidies, clean energy incentives, EU energy, Germany, REDIII, CFd, 2030 projections
false
Emerging supply-side and demand-side policy mechanisms serve to close the clean hydrogen cost gapHydrogen: Closing the cost gap
Multiple Chart
McKinsey
View slide
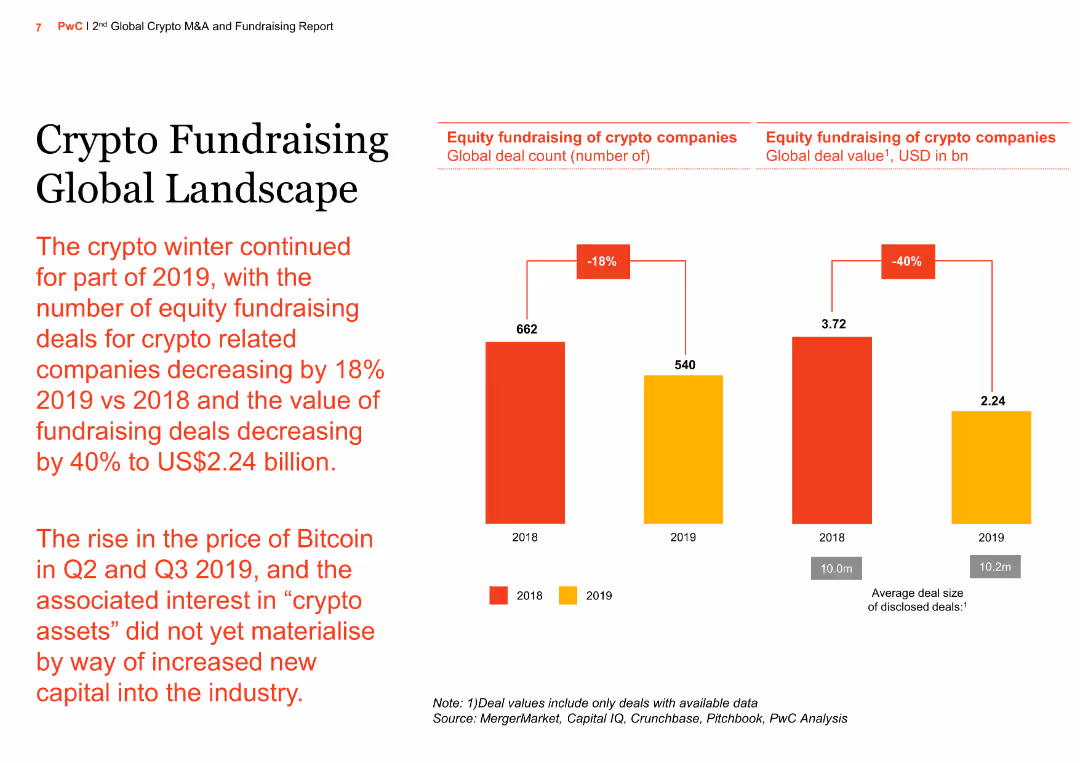
The slide has a column chart showing the decline in equity fundraising deals for crypto companies from 2018 to 2019, with a text summary of the continued "crypto winter" and its impact on fundraising activities.
Market Analysis and Trends
Financial Services
The slide provides an overview of the global landscape for crypto fundraising, highlighting a significant decrease in deal volume and value in 2019 compared to 2018, and the challenges faced by the industry.
Crypto fundraising, global landscape, equity deals, deal volume, deal value, crypto winter, financial services, market analysis, investment trends, 2018 vs 2019
false
Crypto Fundraising Global Landscape2nd Global Crypto M&A and Fundraising Report
Mixed Chart
PwC/Strategy&
View slide
Similar bar chart format to 19071, showing “Agree” and “Disagree” rates per country, with global average highlighted.
Market Analysis and Trends
Artificial Intelligence
This slide presents comparative data on how many people in various countries are excited about AI-powered products and services. Countries are sorted by agreement levels, illustrating global enthusiasm for AI.
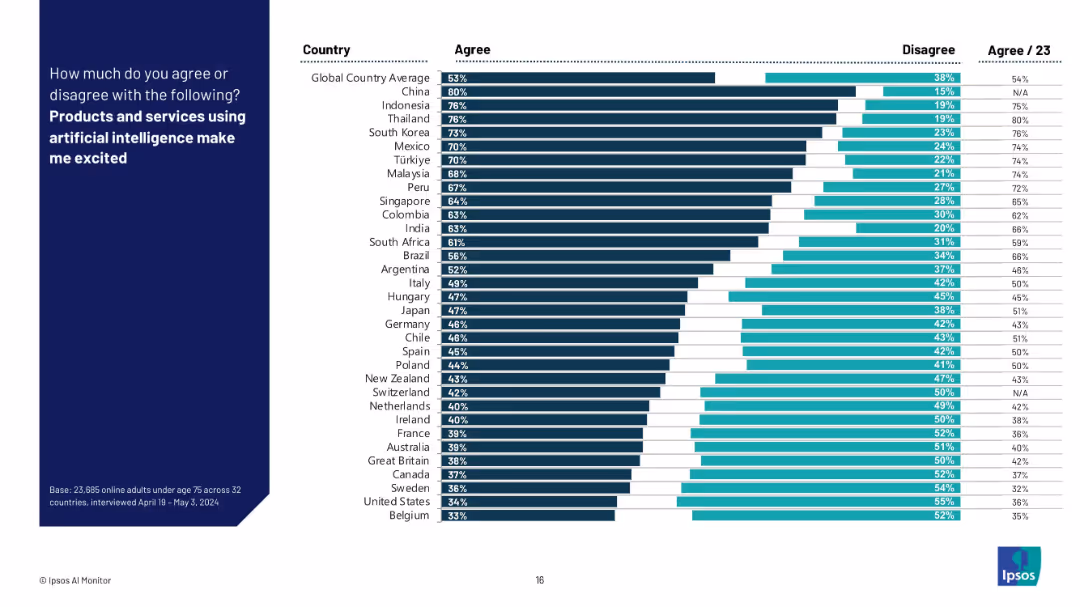
excitement, AI adoption, sentiment, Ipsos, countries, optimism, survey data, technology perception, global trend, enthusiasm
false
Products and services using artificial intelligence make me excitedTHE IPSOS AI MONITOR 2024
Mixed Chart
IPSOS
View slide
Vertical bar chart showing group sizes from solo to 5+ with orange bars; summary text at bottom.
Customer and Market Segmentation
Hospitality & Tourism
This slide presents data on group sizes of event attendees, showing that the most common size was 4 people. Nearly 60% came in groups of 4 or more, reflecting the event's group appeal.
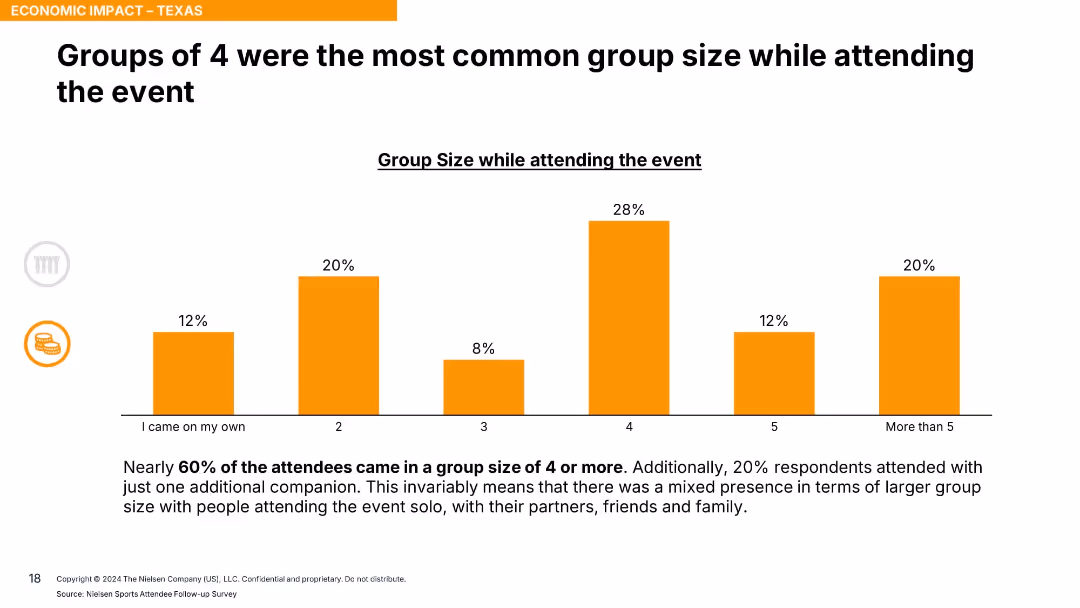
group size, event attendance, social behavior, tourism, segmentation, group travel, audience analysis
false
Groups of 4 were the most common group size while attending the eventEconomic Impact Assessment ICC Men’s T20 World Cup 2024 - Texas (USA)
Single Chart
Nielsen
View slide
Split layout with text and bullet points detailing vaccine efficacy scenarios, complemented by quotes and regulatory considerations.
Regulatory and Compliance
Healthcare & Pharmaceuticals
Discusses the implications of different COVID-19 vaccine efficacy rates on public health strategy and vaccine adoption policies.
efficacy, vaccine, COVID-19, health policy
false
Vaccine efficacy expected to impact demand dynamics & healthcare response prioritiesVaccines & Therapeutics Outlook Part I: Timelines and Success Factors
Header Vertical
BCG
View slide
Dual bar chart showing CAGR of payment types for 2016–2021 and 2021–2026
Market Analysis and Trends
Financial Services
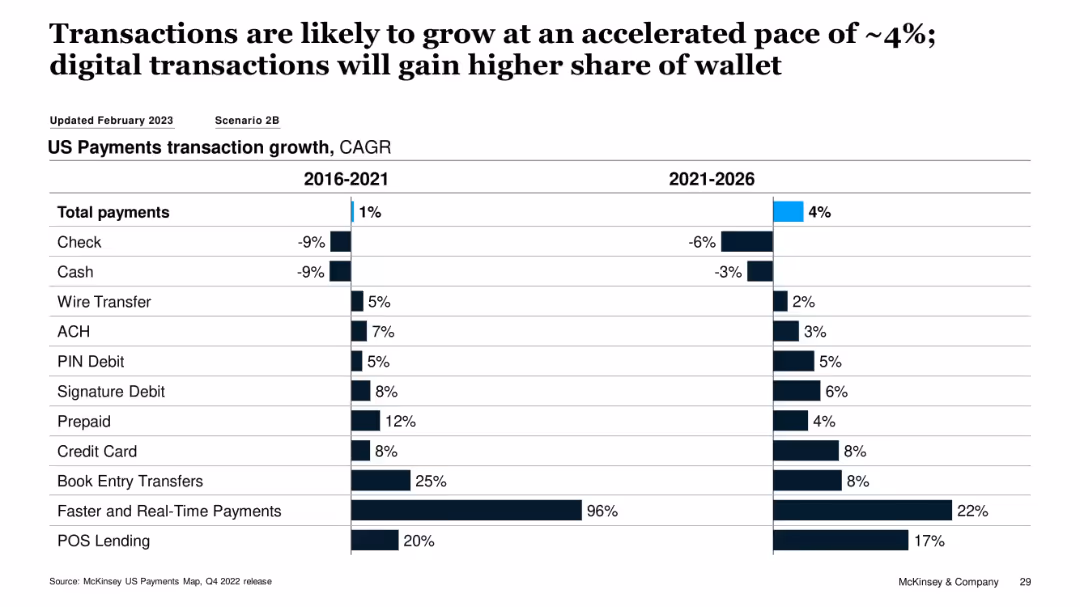
This slide tracks payment method CAGR over two periods, showing a projected acceleration in digital payment adoption. Credit cards, POS lending, and real-time payments are forecasted to grow significantly from 2021–2026, while traditional methods like checks and cash are expected to decline.
payments CAGR, digital transactions, credit card, real-time payments, POS lending, decline of cash
false
Transactions are likely to grow at an accelerated pace of ~4%; digital transactions will gain higher share of walletUS Credit Card Issuer Performance, 1Q 2023
Single Chart
McKinsey
View slide
This slide contains three stacked column charts comparing the projected volume of electric vehicle units in the US, EU, and China from 2020 to 2035. Each region's chart shows significant growth in electric vehicle adoption, with China leading by volume.
Market Analysis and Trends
Transportation & Logistics
Analyzes regional differences in electric vehicle adoption, highlighting Europe and China as leaders in the transition towards electric mobility. This is relevant for discussions on global market dynamics and policy impacts on electric vehicle growth.
electric vehicles, market analysis, US, EU, China, adoption rates
false
Europe and China to lead global electric vehicle adoptionWhat if all vehicles were electric?
Multiple Chart
BCG
View slide
Features a column chart and a breakdown of expenses, with a clean and professional design.
Operational Efficiency
Financial Services
Analyzes JPMorgan's adjusted expenses in various sectors, using bar graphs to indicate investment focuses and outlook for 2023, aiming to present a narrative of prudent and focused investment strategies.
investing, expenses, bar graphs, JPMorgan, operational efficiency
false
Expense discipline and focused investingInverstors Day 2023
Single Chart
JP Morgan
View slide
Split section layout with two circular graphs: one on AI understanding, the other on product awareness.
Industry Overview
Artificial Intelligence
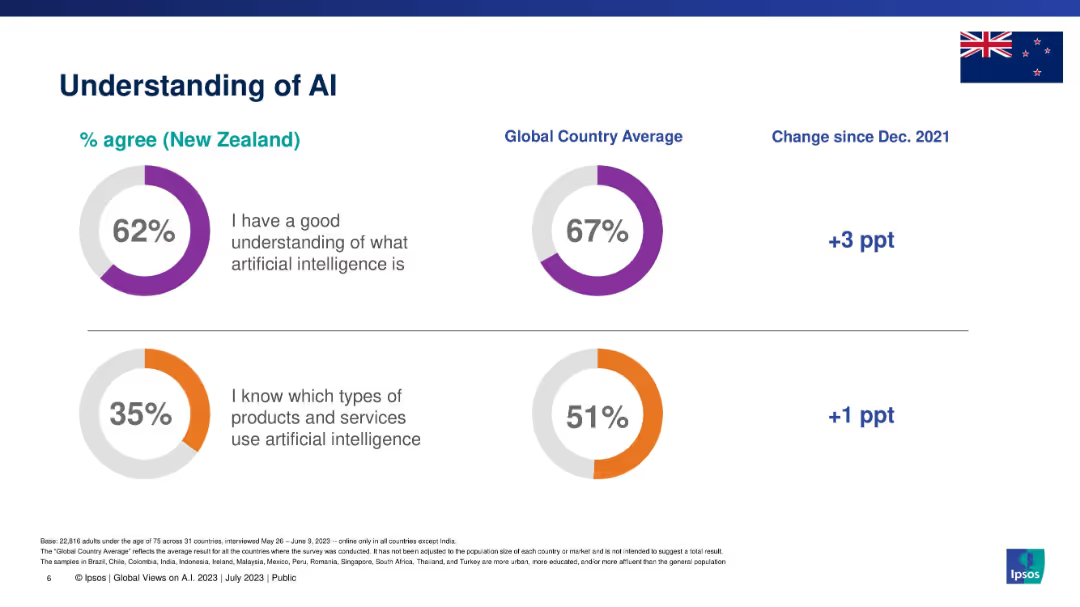
This slide presents New Zealanders' understanding of AI in comparison with global averages. It measures agreement with two statements: understanding AI conceptually and knowing which products/services use AI. It also includes percentage changes since 2021.
AI, understanding, awareness, Ipsos, New Zealand, global comparison, knowledge levels
false
Understanding of AIGLOBAL VIEWS ON A.I. IN 2023
Single Chart
IPSOS
View slide
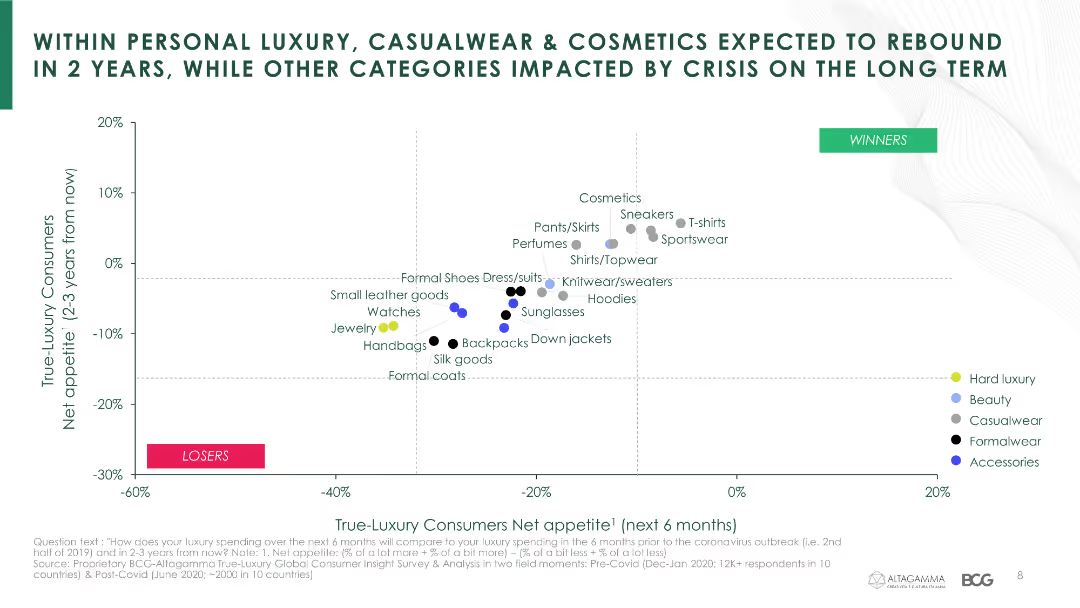
This slide shows a scatter plot analyzing net appetite of true-luxury consumers for various product categories over the next 6 months and 2-3 years.
Market Analysis and Trends
Consumer Goods
It provides a detailed analysis of luxury consumer preferences for different product categories, indicating which are expected to rebound faster.
luxury market, product categories, net appetite, consumer preferences, COVID-19, rebound
false
WITHIN PERSONAL LUXURY, CASUALWEAR & COSMETICS EXPECTED TO REBOUND IN 2 YEARS, WHILE OTHER CATEGORIES IMPACTED BY CRISIS ON THE LONG TERMTrue-Luxury Global Consumer Insights 7th Edition
Single Chart
BCG
View slide
The slide features four column charts with varying bar lengths, representing data over a period from 2012-13 to 2016-17. One chart shows the percentage of pending family law final order cases older than 12 months, and the other shows the 75th percentile transfer time.
Regulatory and Compliance
Government & Public Sector
This slide presents data on the age of pending cases in family law courts, highlighting the issue of growing backlogs. It compares the percentage of cases older than 12 months across different years and cities, and the time taken to transfer cases. It is useful for analyzing court efficiency.
backlog, courts, family law, pending cases, transfer time
false
Measures of backlog among courts (con’d)Review of efficiency of the operation of the federal courts
Multiple Chart
PwC/Strategy&
View slide
The slide features two column charts showing the percentages of participants who experienced gains or losses from crypto assets and crypto investment funds.
Financial Performance
Financial Services
This slide provides insights into the financial outcomes (gains or losses) for participants holding crypto assets and investment funds.
Gains, losses, crypto assets, investment funds, financial outcomes
false
Gains / Losses From Crypto Assets / Crypto Investment FundsCRYPTO ASSET SURVEY
Multiple Chart
IPSOS
View slide
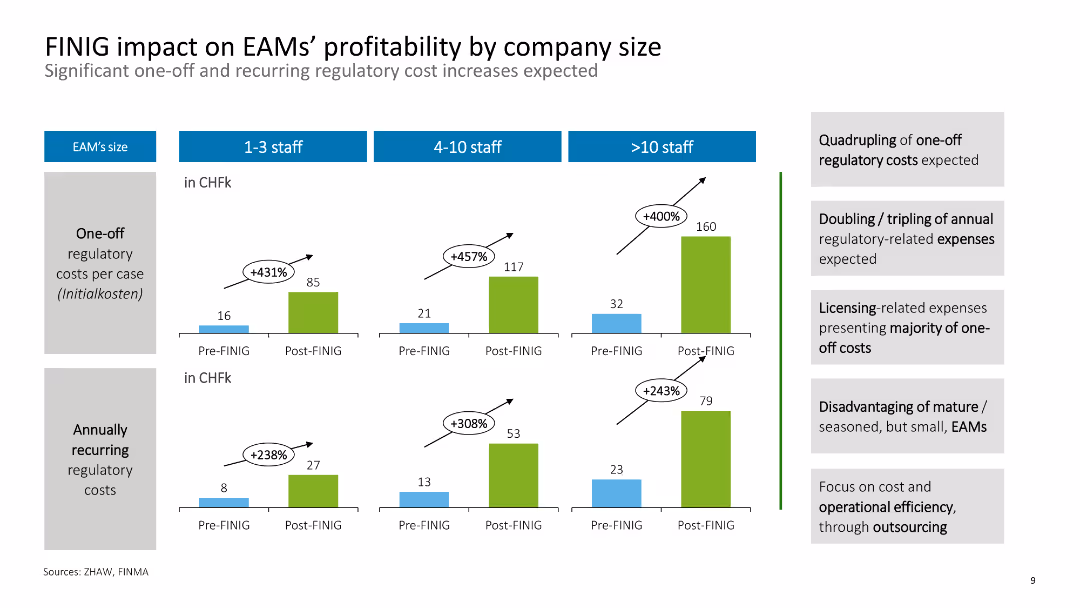
The slide has a comparative bar chart illustrating the cost impacts of FINIG on EAMs by company size.
Financial Performance
Financial Services
It highlights the expected increase in one-off and recurring regulatory costs for External Asset Managers (EAMs) of different sizes due to FINIG.
FINIG, costs, EAMs, profitability, regulatory
false
FINIG impact on EAMs’ profitability by company sizeExternal Asset Manager (EAM) Conference
Multiple Chart
Deloitte
View slide
Features images of EV charging and regulatory icons, with quotes from major automotive CEOs about shifts towards electrification.
Strategic Planning
Transportation & Logistics
Discusses the accelerating factors and strategic responses of automotive industries toward electrification, including regulatory impacts and market dynamics.
electrification, automotive industry, regulations, battery costs, OEM strategies, market dynamics
false
Rest of decade set up for a more rapid shift to fully electrified powertrains than many forecasted 12 months earlierWhat if all vehicles were electric?
Pillar
BCG
View slide
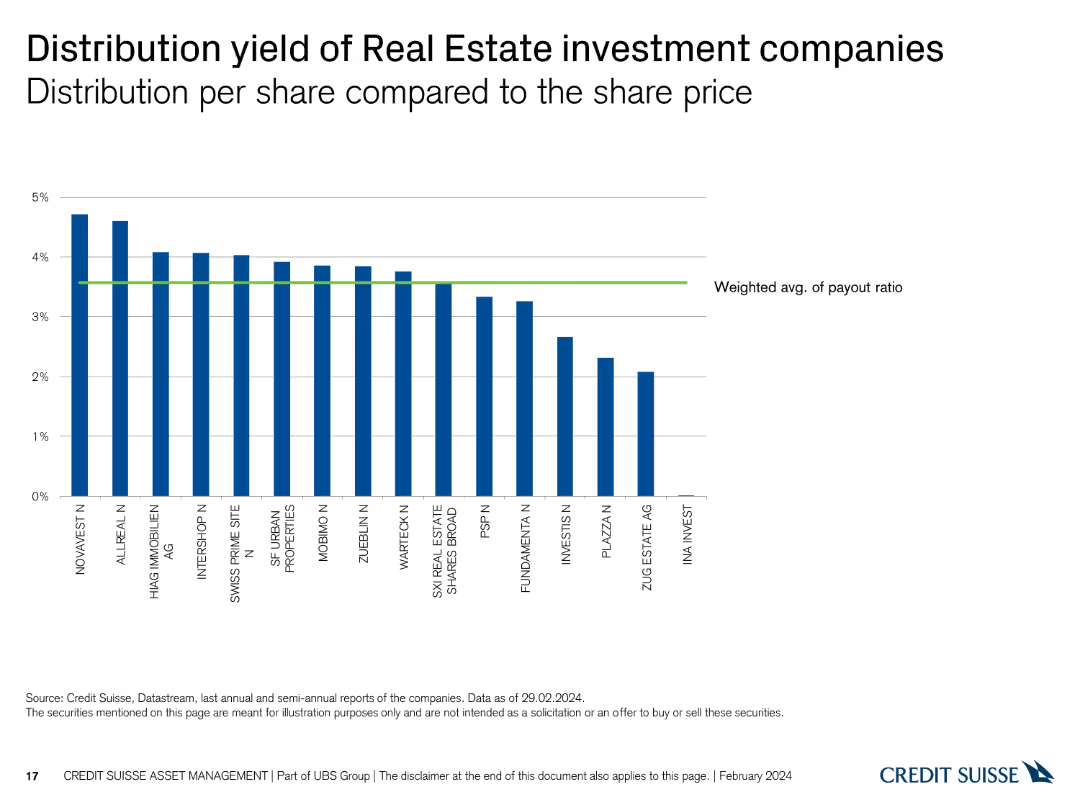
The slide includes a column chart showing the distribution yield per share compared to the share price for various Real Estate investment companies.
Financial Performance
Real Estate & Construction
It evaluates the distribution yield of different Real Estate companies, assisting in investment analysis based on yield performance.
distribution yield, Real Estate, investment, companies, share price
false
Distribution yield of Real Estate investment companies Distribution per share compared to the share priceSwiss Real Estate Funds At a glance
Single Chart
Credit Suisse
View slide
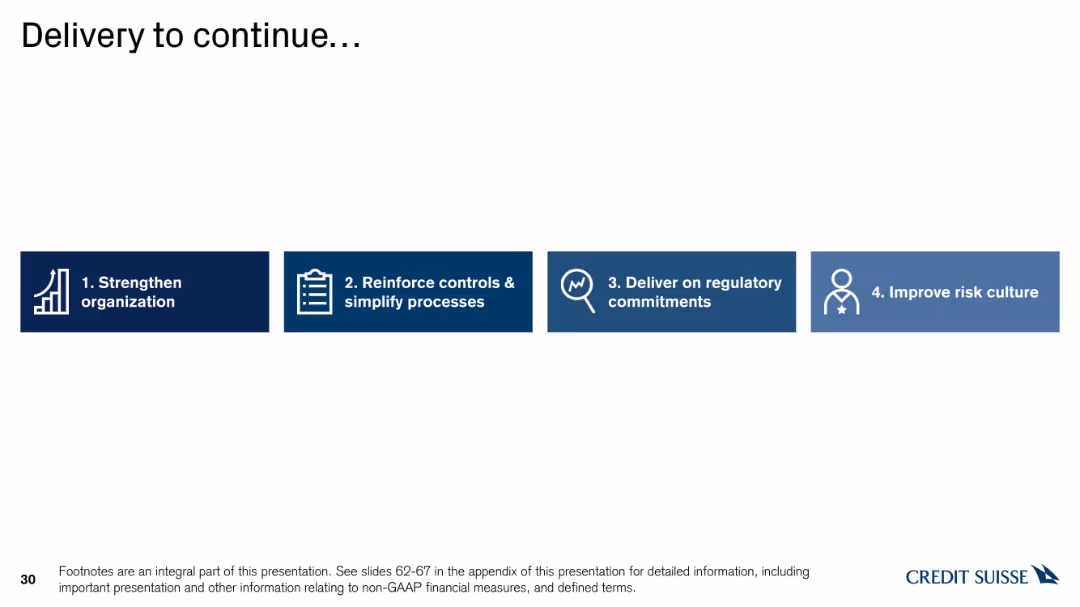
Horizontal bar chart with icons representing four steps: Strengthen organization, Reinforce controls, Deliver on commitments, and Improve risk culture.
Strategic Planning
Financial Services
The slide details the ongoing delivery strategy, focusing on strengthening organization, reinforcing controls, delivering on regulatory commitments, and improving risk culture.
delivery, strategy, organization, controls, commitments
false
Delivery to continue…Investor Deep Dive 2022
Linear Flow
Credit Suisse
View slide
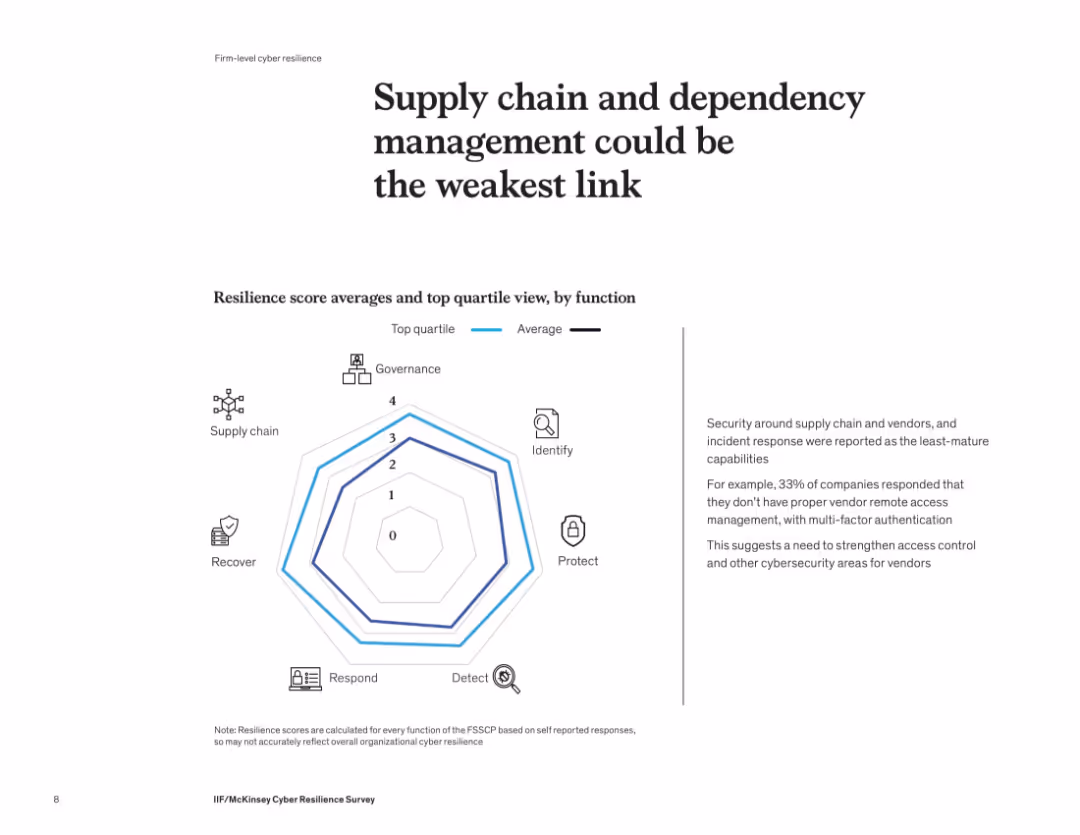
Radar/spider chart compares average vs. top quartile resilience scores across cybersecurity functions. Text box on the right provides insights into vendor access weaknesses.
Risk Assessment and Management
Financial Services
The slide highlights supply chain and dependency management as the least mature cybersecurity function. Companies report weak vendor access control and limited use of multi-factor authentication. Incident response also shows gaps, suggesting a need for strengthened controls and vendor oversight.
cybersecurity, supply chain, dependency management, weak link, vendor control, risk management, radar chart
false
Supply chain and dependency management could be the weakest linkIIF/McKinsey Cyber Resilience Survey
Mixed Chart
McKinsey
View slide
Central pie chart with percentage of internet-using buyers, flanked by bar graphs comparing younger and older offline shopper preferences.
Market Analysis and Trends
Retail & E-commerce
Insights into consumer durable shopping trends, contrasting preferences between online and offline shoppers with a focus on service and repair aspects.
Consumer Durables, Online Shopping, Offline Shopping, Service Concerns, Purchase Triggers
false
Consumer Durables: Shoppers deterred by service/repair concernsDigital consumer spending in India: A $100 Bn opportunity
Mixed Chart
BCG
View slide
A photo of Cologne Cathedral with a graph showing Germany's GDP growth and a detailed text explanation.
Market Analysis and Trends
Financial Services
This slide discusses Germany's economic conditions, highlighting GDP growth trends and the impact of COVID-19 on the economy.
Germany, GDP growth, economy, financial services, market analysis
false
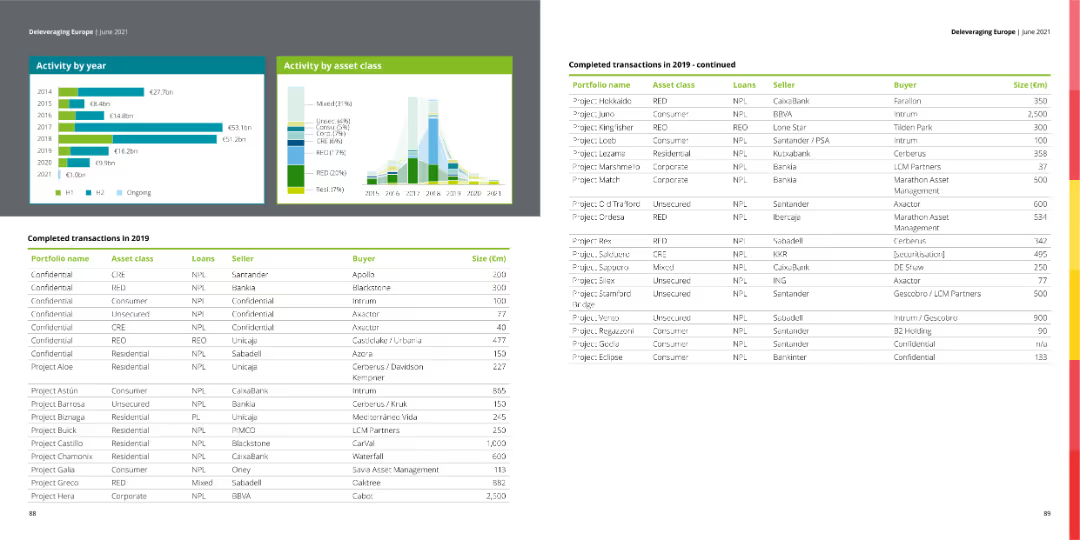
Confidential CRE NPL Santander Apollo 200Deleveraging Europe
Multiple Chart
Deloitte
View slide
Features a line chart on the left comparing YTD returns relative to MSCI USA Index and a table on the right showing 3M percentage change in FY1 revenue estimates across various sectors.
Investment Analysis
Financial Services
The slide suggests that the dip in the momentum factor presents an opportunity to buy quality stocks, supported by positive revenue estimate revisions and selective cyclical exposure.
Momentum, MSCI USA, Revenue Estimates, Investment, Quality Stocks, Financial Performance
false
A Dip in the Momentum Factor Is an Opportunity To Buy QualityThe BEAT May 2024
Mixed Chart
Morgan Stanley
View slide
The slide displays a donut chart and a gauge chart showing survey responses about staff turnover. The donut chart uses multiple colors to differentiate responses, and the gauge chart indicates a percentage.
Human Resources and Talent Management
Professional Services
This slide presents survey data regarding staff turnover, indicating a majority opinion with visual aids. It is useful for HR presentations to discuss staff retention strategies.
staff turnover, HR, survey, donut chart, gauge
false
Our organisation has had very little staff turnover over the last few yearsHR Pulse Survey Presentation of results
Multiple Chart
PwC/Strategy&
View slide
Features a central hub-and-spoke diagram linking various strategies and tools aimed at enhancing client coverage, surrounded by relevant data points.
Operational Efficiency
Financial Services
Discusses the development and enhancement of JPMorgan’s client coverage team, emphasizing training, tools, and insights that lead to increased productivity and market understanding.
Client Coverage, Training, Productivity, Banking, Tools, Insights, Market Understanding
false
Building an unmatched client coverage team with data-driven tools, insights and trainingCommercial Banking 2022
Framework
JP Morgan
View slide
This slide includes a header, body text, and three percentage indicators in different colored boxes (green, blue, red). The percentages are displayed above each box, showing the perceived performance of healthcare systems in optimizing patient experience.
Customer and Market Segmentation
Healthcare & Pharmaceuticals
This slide highlights the importance of the healthcare experience for US consumers, emphasizing equitable treatment and optimization of the health experience regardless of personal circumstances. It shows varied ratings for healthcare system performance.
healthcare, experience, US, equitable treatment
false
‘The experience is important to me.’ Consumers: United StatesHealth care consumer views on value
Mixed Chart
EY
View slide
This slide features a bar chart showing the relevance of various SDGs among Danish executives, coupled with a key takeaway box emphasizing SDG 12, 8, 13, 9, and 3 as most relevant to businesses.
Market Analysis and Trends
Professional Services
The slide displays survey results from Danish executives highlighting the perceived relevance of SDGs to their businesses, emphasizing SDGs related to responsible production, economic growth, and climate action as most pertinent.
SDGs, survey, Danish executives, business relevance
false
Survey results: SDG 12 is considered to be the most relevant among Danish executives closely followed by SDG 8, 13, 9, and 3 …Survey results: SDG 12 is considered to be the most relevant among Danish executives closely followed by SDG 8, 13, 9, and 3 …SDG Guide for Business Leaders
Single Chart
McKinsey
View slide
A bubble chart showing the growth and CARG (2020-2025) of different IT services, categorized by 'Run,' 'Build,' and 'Design.' Each bubble represents a service category with varying sizes indicating their market impact.
Technology and Digital Transformation
Technology & Software
This slide illustrates the transition from on-premise to cloud services, highlighting the growth rates and market sizes of different IT service categories, aiding in strategic planning for digital transformation.
On-Prem to Cloud, IT Services, Growth, Digital Transformation, Market Impact
false
From On Prem to CloudGartner delivers actionable, objective insight, guidance and tools to enable stronger performance on your organization’s mission critical priorities
Single Chart
Gartner
View slide
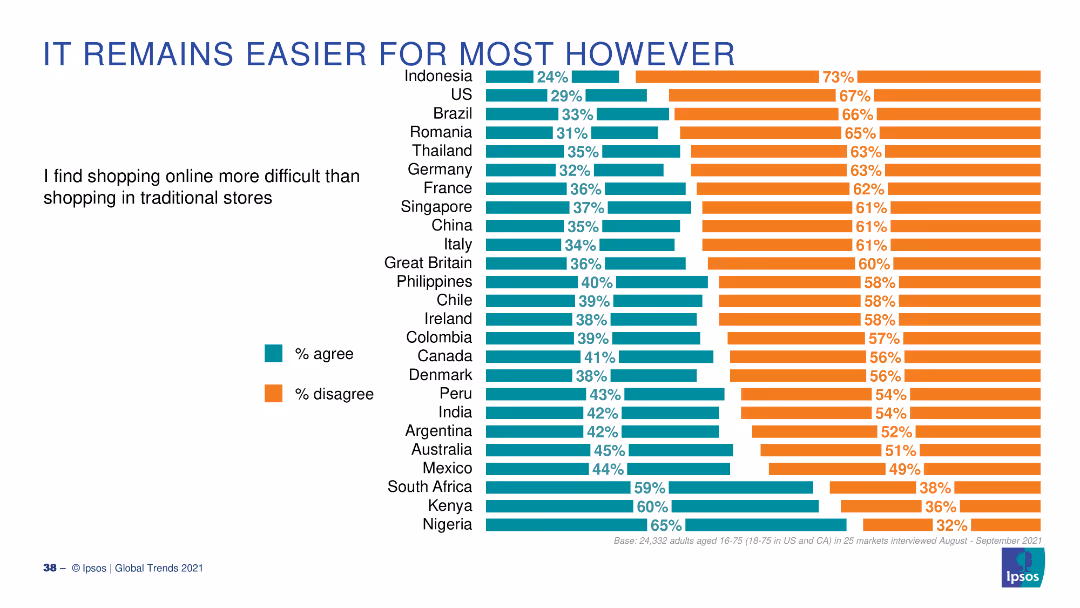
A bar chart with horizontal bars displaying the percentage of people who agree or disagree that online shopping is more difficult than traditional shopping across various countries.
Market Analysis and Trends
Retail & E-commerce
The slide shows survey data on the ease of online shopping compared to traditional shopping, with a global perspective, highlighting different country responses.
online shopping, ease, global, survey, countries
false
IT REMAINS EASIER FOR MOST HOWEVERGLOBAL TRENDS 2021 Aftershocks and continuity
Multiple Chart
IPSOS
View slide
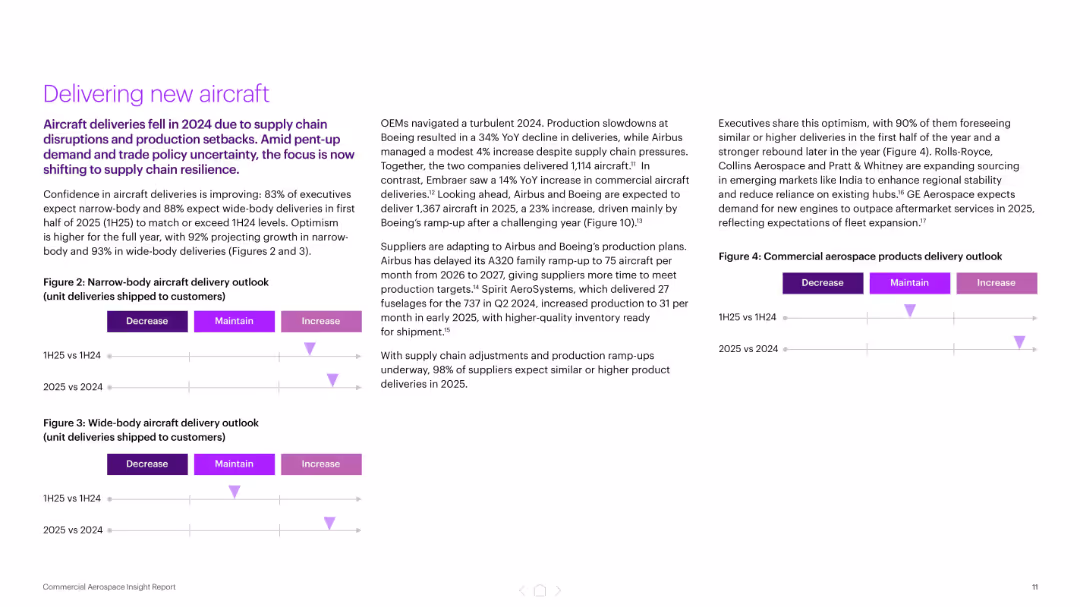
Three-column layout with bullet points and delivery outlook charts (narrow and wide-body aircraft)
Performance Metrics and KPIs
Industrial & Manufacturing
The slide focuses on improving aircraft delivery confidence for 2025, with 83–93% of executives expecting growth. It highlights OEM production plans and supply chain adjustments following a turbulent 2024, and features delivery outlook visuals segmented by aircraft type and year comparison.
aircraft delivery, OEMs, production, supply chain, Boeing, Airbus, KPIs
false
Delivering new aircraftNavigating uncertain skies Commercial Aerospace Insight Report
Mixed Chart
Accenture
View slide
This slide displays a technology portfolio applicable across the mining value chain. It uses icons and a curved line to represent the exploration to extraction process, flanked by images and text explaining the technology use at each stage.
Product and Service Analysis
Industrial & Manufacturing
The slide provides an overview of technology applications throughout the mining process, suitable for discussing product breadth and the value each technology brings at different stages.
Technology Portfolio, Mining, Value Chain, Applications, Product Breadth
false
Technology Portfolio Applicable across whole mining value chainIMDEX Presentation Morgan Stanley Conference
Diagram
Morgan Stanley
View slide
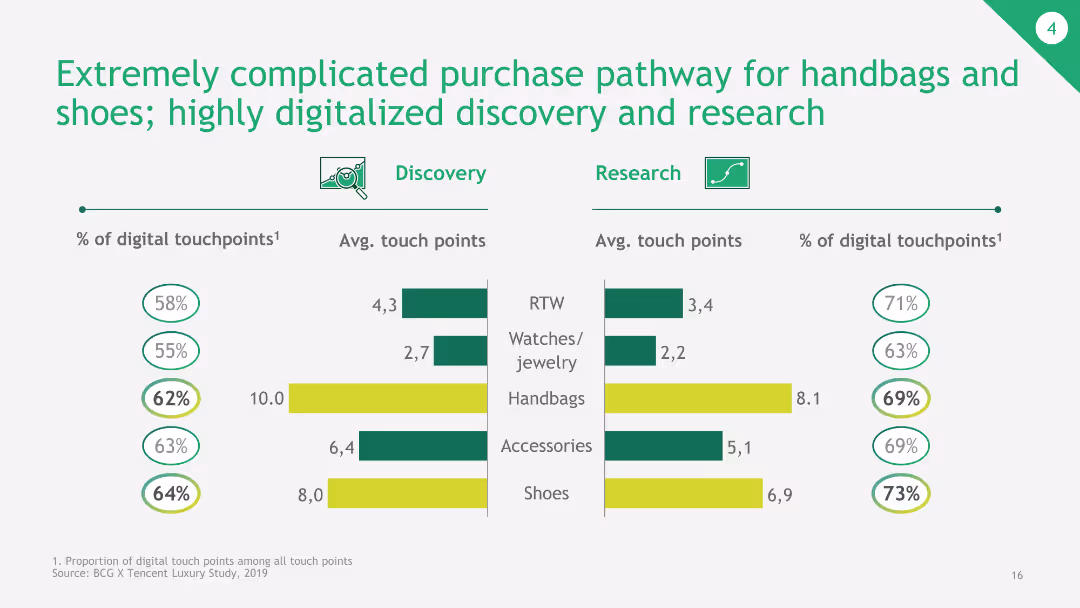
The slide features a column chart comparing discovery and research touchpoints for various product categories. Each bar represents average touch points and percentage of digital touchpoints.
Market Analysis and Trends
Retail & E-commerce
The slide shows the digital touchpoints and average touch points for discovery and research of various product categories like RTW, watches/jewelry, handbags, accessories, and shoes.
digital touchpoints, discovery, research, handbags, shoes
false
Extremely complicated purchase pathway for handbags and shoes; highly digitalized discovery and researchChina Luxury Digital Playbook
Multiple Chart
BCG
View slide
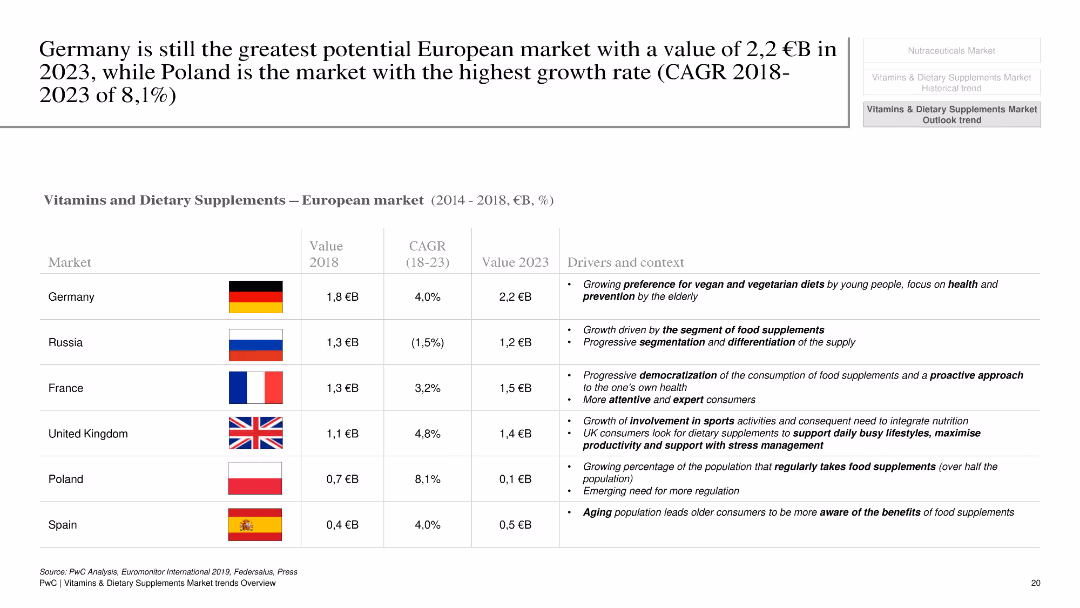
This slide compares the vitamins and dietary supplements markets across several European countries, using a table format. It includes columns for market value, CAGR, and key drivers for each country. Flags of the respective countries are also displayed.
Market Analysis and Trends
Healthcare & Pharmaceuticals
The slide compares market potential for vitamins and dietary supplements across Germany, Russia, France, the UK, Poland, and Spain. It provides a detailed analysis of market size, growth rates, and key factors driving market trends in each country, emphasizing Germany's potential and Poland's high growth rate.
market potential, Germany, Europe, vitamins, dietary supplements, growth rate
false
Germany is still the greatest potential European market with a value of 2,2 €B in 2023,Vitamins & Dietary Supplements Market trends - Overview
Table
PwC/Strategy&
View slide
The slide includes column charts and a line chart illustrating the sensitivity of group revenues to interest rates and CHF yield curve shifts.
Financial Performance
Financial Services
This slide discusses the cumulative group revenues sensitivity of CHF ~0.9 bn by 2025 vs. 2022 and the impact of higher forward rate expectations.
revenues, interest rates, forward rate, yield curve, funding costs
false
CHF ~0.9 bn additional group revenues by 2025 from higher forward rate expectations4Q22 and Full Year 2022 Results Analyst and Investor Call
Multiple Chart
Credit Suisse
View slide
Dominated by a large flowchart diagram in shades of red and brown, the slide visualizes the family law process from lodgment to appeal, with key findings highlighted in text boxes.
Strategic Planning
Professional Services
This executive summary illustrates the flow of family law cases through the Australian courts, highlighting key statistics and findings relevant to stakeholders in the legal profession, designed for strategic planning and understanding the appeal process.
Family law, Court process, Statistics, Key findings, Legal profession, Flowchart, Appeals, Executive summary, Strategic planning
false
Executive summaryReview of efficiency of the operation of the federal courts
Diagram
PwC/Strategy&
View slide
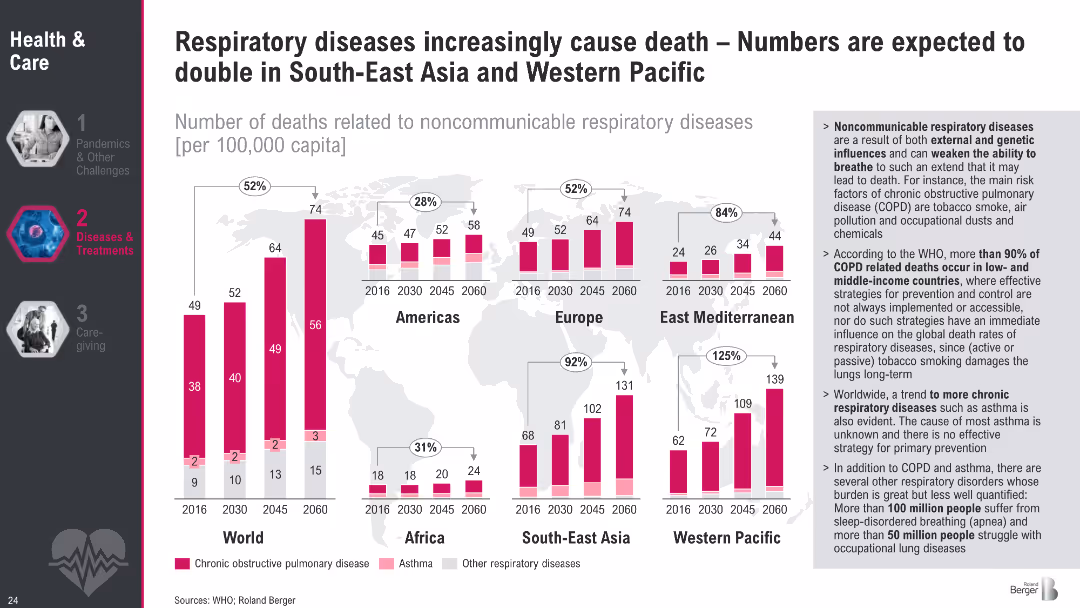
World map with bar charts per region showing death rates from respiratory diseases (2016–2060); sidebar with detailed insights; color-coded bars for disease types
Market Analysis and Trends
Healthcare & Pharmaceuticals
This slide presents global and regional projections of deaths from noncommunicable respiratory diseases, highlighting a sharp increase in South-East Asia and Western Pacific. It attributes the rise to environmental and behavioral risk factors and emphasizes disparities between high- and low-income countries.
COPD, respiratory diseases, regional projections, healthcare inequality, asthma, pollution, mortality, WHO, tobacco, healthcare trends
false
Respiratory diseases increasingly cause death Numbers are expected to double in South East Asia and Western PacificMegatrend 2 Health & Care
Multiple Chart
Roland Berger
View slide
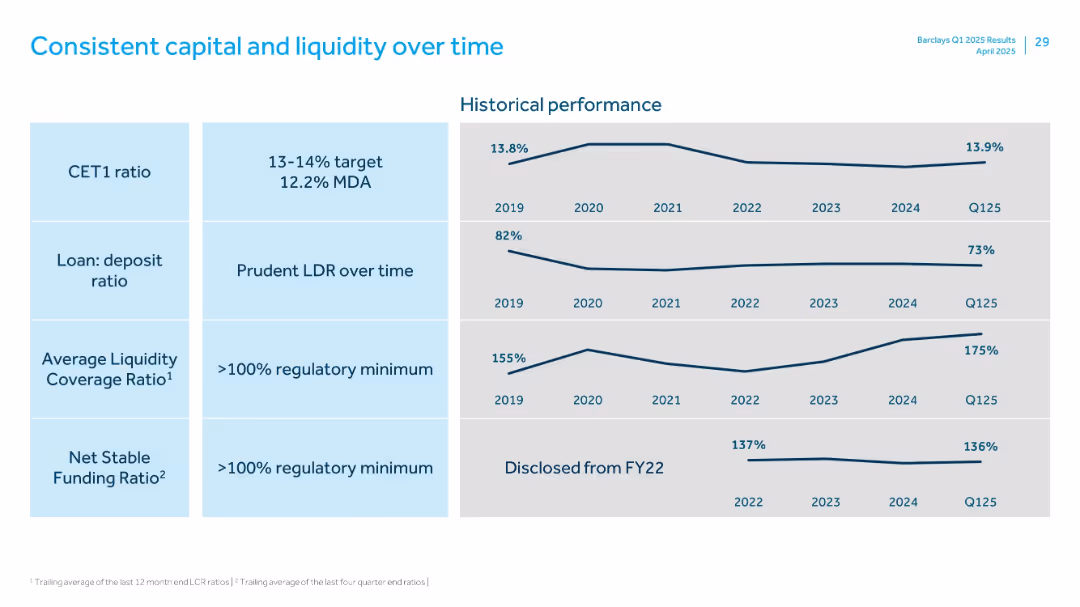
Matrix on the left and line graphs on the right showing historical trends of key financial ratios
Financial Performance
Financial Services
Presents historical trends (2019–Q125) for CET1 ratio, loan-to-deposit ratio, liquidity coverage ratio, and net stable funding ratio, emphasizing prudence and consistency across regulatory and capital metrics.
CET1, liquidity ratio, funding ratio, loan-deposit, trends
false
Consistent capital and liquidity over timeQ1 2025 Results Presentation
Single Chart
Barclays
View slide
Contains bar charts and diagrams explaining asset lifecycle management in energy sectors, including case study of Iberdrola.
Operational Efficiency
Energy & Utilities
Details the importance of asset lifecycle management in the energy industry, using a case study to illustrate effective predictive maintenance.
asset management, lifecycle management, energy industry, predictive maintenance, Iberdrola, operational efficiency
false
1. Asset lifecycle managementWorld Economic Forum Digital Transformation Initiative: In collaboration with Accenture
Mixed Chart
Accenture
View slide
The slide has a white background with green and black text. It includes a column chart on the right showing different maturity groups' views on cyber importance.
Strategic Planning
Technology & Software
Outlines five key focus areas for the future of cyber, emphasizing leadership, scenario planning, and the role of AI in cyber strategies, supported by survey data.
Cyber future, leadership, scenario planning, AI risk, digital transformation
false
Key insights to shape the future of cyber: Five areas of focusGlobal Future of Cyber Survey
Mixed Chart
Deloitte
View slide
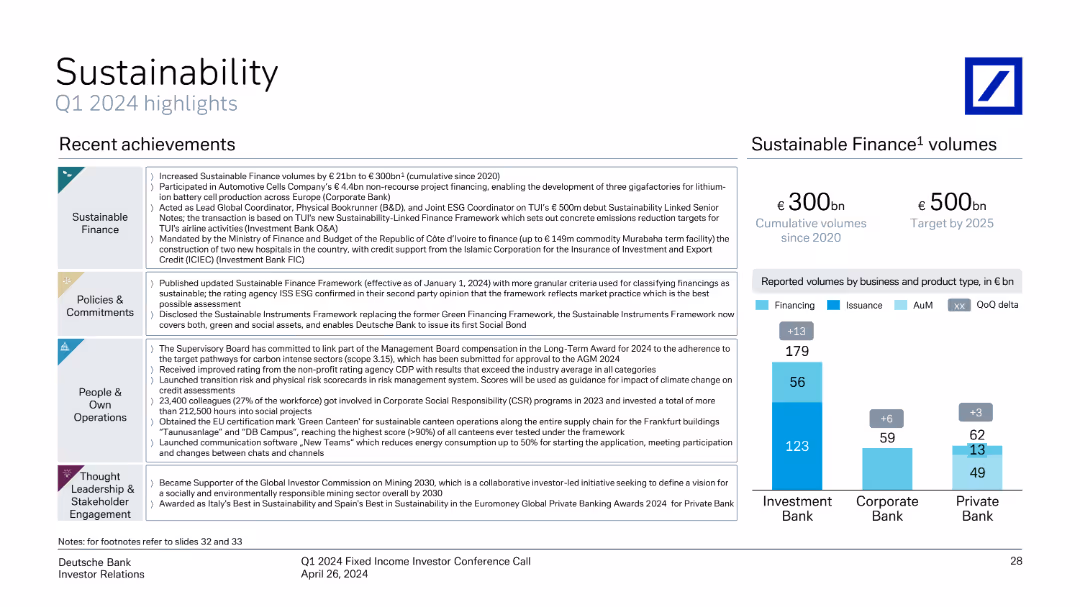
Mixed layout with text, bullet points, and bar charts, highlighting recent achievements and sustainable finance volumes.
Regulatory and Compliance
Environmental Services & Sustainability
Summarizes recent achievements in sustainability initiatives, including policies, commitments, and reported volumes in sustainable finance.
sustainability, finance, achievements, policies, commitments, volumes
false
Sustainability Q1 2024 highlightsQ1 2024 Fixed Income Investor Conference Call
Mixed Chart
Deutsche Bank
1
...
Next
Load More
Hold On!
We are searching in our database
If nothing, comes up, please try different filters!
Create a FREE account to continue browsing
Receive Instant Access to 1,000+ slides from companies like McKinsey, Google, and Goldman Sachs
First Name
Last Name
Email
Password
I agree to all
Terms & Privacy Policy
Thank you! Your submission has been received!
Oops! Something went wrong while submitting the form.
Have an account?
Sign in
Column Chart
Heatmap
Chevron
Org Chart
Infographic
Callouts
Timeline
List
Graphic
Picture
Process Flow
Diagram
Paragraph
Map
Table
Framework
Subtitle
Takeaway Box
Icon
Other Chart
Radar Chart
Waterfall Chart
Mekko Chart
Pie Chart
Scatter Plot
Line Chart
Bar chart
Bullet points