My Account
My Slides
Search by Category
Templates
View All Templates
Download Template Slides
Leave Feedback
Login
Logout
Get Started
Browse all Slides
Browse all Slides
Create a FREE Account
Instant access to 1,000+ real slides from top companies like McKinsey, BCG, Goldman Sachs, Google and many more!
First Name
Last Name
Email
Password
I agree to all
Terms & Privacy Policy
Thank you! Your submission has been received!
Oops! Something went wrong while submitting the form.
Have an account?
Sign in
Instant access to the internet's best slides
Get access to 40+ advanced filters and more
Advanced Search and Filters
Access to
10,000+ slides
Access to Category Pages
Save/Bookmark Slides
PowerPoint Template Library (New)
Choose your plan
MONTHLY
$12/month
Billed every month, cancel anytime.
YEARLY
$9/month
Billed $108 annually, cancel anytime.
Checkout for $12/month
Checkout for $108/yr
Secured by Stripe | AES-256 bit encryption
Spark Your Next Big Idea with New Presentation Templates
VIEW ALL Templates
Welcome,
Welcome
Upgrade to SlideStart
Pro
Instant access to 15,000+ slides
Show Featured Only
Checkbox 8
Companies
Mckinsey
Bain
BCG
EY
Deloitte
Accenture
PwC/Strategy&
JP Morgan
Goldman Sachs
Morgan Stanley
Citigroup
Deutsche Bank
Barclays
LEK
Kearney
Oliver Wyman
Booz Allen Hamilton
Gartner
IPSOS
Nielsen
Slide type
Header Horizontal
Framework
Vertical Flow
Single Chart
Single Chart
Text Only
Mixed Chart
Header Vertical
Graphic
Pillar
Multiple Chart
Agenda
Title
Table
Linear Flow
Upgrade to SlideStart
Pro
Instant access to 40+ advanced filters
Industry
Upgrade to SlideStart
Pro
Instant access to 40+ advanced filters
Technology
Healthcare
Financial Services
Consumer Goods
Energy & Utilities
Manufacturing
Retail
E-commerce
Logistics
Telecommunications
Real Estate
Professional Services
Education
Media
Entertainment
Hospitatlity
Tourism
Agriculture
Food Production
Government & Public Sector
Environmental
Sustainability
Use Case
Upgrade to SlideStart
Pro
Instant access to 40+ advanced filters
Sales and Business Development
Mergers and Acquisitions
Corporate Finance and Valuation
Performance Metrics and KPIs
Client Case Studies
Competitive Landscape
Product and Service Analysis
Customer and Market Segmentation
Organizational Structure
Human Resources and Talent Management
Industry Overview
Regulatory and Compliance
Risk Assessment and Management
Agriculture & Food Production
Hospitality and Tourism
Government
Environmental
Sustainability
Clear all
Thank you! Your submission has been received!
Oops! Something went wrong while submitting the form.
Show Featured Only
Checkbox 8
Companies
Mckinsey
Bain
BCG
EY
Deloitte
Accenture
PwC/Strategy&
JP Morgan
Goldman Sachs
Morgan Stanley
Citigroup
Deutsche Bank
Barclays
LEK
Kearney
Oliver Wyman
Booz Allen Hamilton
Gartner
IPSOS
Nielsen
Slide type
Text Only
Linear Flow
Vertical Flow
Single Chart
Header Horizontal
Mixed Chart
Header Vertical
Pillar
Multiple Chart
Graphic
Agenda
Title
Table
Framework
Industry
Technology
Healthcare
Financial Services
Consumer Goods
Energy & Utilities
Manufacturing
Retail
E-commerce
Logistics
Telecommunications
Real Estate
Professional Services
Education
Media
Entertainment
Hospitatlity
Tourism
Agriculture
Food Production
Government & Public Sector
Environmental
Sustainability
Use Case
Sales and Business Development
Mergers and Acquisitions
Corporate Finance and Valuation
Performance Metrics and KPIs
Client Case Studies
Competitive Landscape
Product and Service Analysis
Customer and Market Segmentation
Organizational Structure
Human Resources and Talent Management
Industry Overview
Regulatory and Compliance
Risk Assessment and Management
Agriculture & Food Production
Hospitality and Tourism
Government
Environmental
Sustainability
Clear all
Thank you! Your submission has been received!
Oops! Something went wrong while submitting the form.
Tag
View slide
The slide features four maturity curves comparing conditioning, pretreatment, conversion technologies, and biofuels maturity levels. Each curve shows the progression from research to mature technology, highlighting key processes and technologies at different maturity stages.
Technology and Digital Transformation
Energy & Utilities
This slide illustrates the maturity levels of various bioenergy technologies, including conditioning, pretreatment, conversion, and biofuels, showing their development stages from research to mature deployment.
maturity curve, conditioning technologies, pretreatment, conversion, biofuels, research, deployment, maturity levels
false
This diversity also comes with disparities in the processing technologies and biofuels maturity levelDeveloping sustainable carbon circularity Looking at advanced applications and business models
Multiple Chart
Kearney
View slide
The slide features a column chart displaying the percentage of respondents planning to buy different types of EVs from 2020 to 2023. Key points are highlighted on the right side with yellow text boxes.
Market Analysis and Trends
Transportation & Logistics
This slide shows the increasing consumer intent to buy electric vehicles, including BEVs, hybrids, and plug-in hybrids, across several years. It indicates strong sales volume and government incentives.
EV-buying intent, consumer confidence, market share, sales volume, government incentives
false
Purchase intention for EVs (BEV, hybrid and plug-in hybrid) continues to increase, signalingan ever-growing consumer confidenceEY Mobility Consumer Index (MCI) 2023 study
Mixed Chart
EY
View slide
The slide contains two charts. The left line chart shows U.S. goods imports by location. The right bar chart displays company plans to relocate out of China.
Competitive Landscape
Transportation & Logistics
This slide examines the commercial relationship between the U.S. and China, focusing on import locations and companies' relocation plans.
Commercial, U.S., China, Imports, Relocation
false
U.S.-China commercial relationshipsGuide to Investing in Asia
Multiple Chart
JP Morgan
View slide
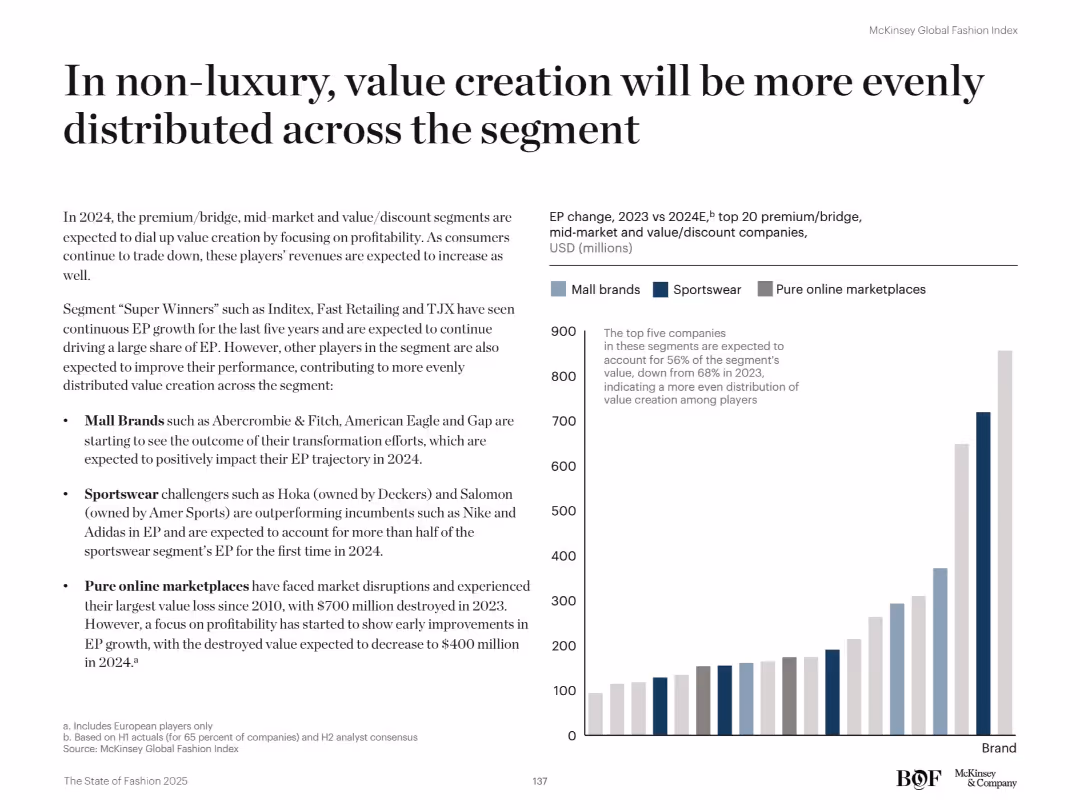
Left text discusses drivers of balanced value creation. Right bar chart categorizes EP growth by brand type (Mall, Sportswear, Online).
Strategic Planning
Retail & E-commerce
The slide shows that in 2024, value creation within non-luxury segments (mall brands, sportswear, online) will be more evenly spread. Growth is no longer driven by a few top performers, indicating broader improvements across brands.
Non-luxury, value creation, EP growth, segment balance, sportswear, online retail, mall brands, fashion strategy, brand performance
false
In non-luxury, value creation will be more evenly distributed across the segmentThe State of Fashion 2025
Mixed Chart
McKinsey
View slide
Diagram and pie charts comparing platform usage between China and the US
Market Analysis and Trends
Technology & Software
Highlights platform consolidation in China, with a significant share held by Tencent
Technology, Platform Usage, China, Tencent, Comparison
false
… attention focuses platform consolidated by super APPChina Luxury Digital Playbook
Multiple Chart
BCG
View slide
The slide shows a column chart representing the connected population in different countries.
Customer and Market Segmentation
Media & Entertainment
The slide illustrates the necessity of speaking to people in real life despite high levels of internet connectivity.
real life, internet connectivity, countries, necessity, communication, World Bank
false
Connected population as a share of total populationOur Path to Ipsos 2025: A Strategic Update
Single Chart
IPSOS
View slide
Slide with three sections of bullet points discussing the balance of opportunities and pitfalls in digital trust.
Technology and Digital Transformation
Technology & Software
Highlights how digital trust can contribute to value creation despite the challenges and uncertainties in the technological landscape.
digital trust, value creation, risk management, strategic planning
false
Why should leaders pay attention? (continued)McKinsey Technology Trends Outlook 2022 Trust architectures and digital identity
Header Horizontal
McKinsey
View slide
Includes flow chart, bold text for emphasis.
Market Analysis and Trends
Retail & E-commerce
Insights into personalized luxury shopping experiences.
UHNWI, personalized, luxury, digital, VIP
false
UHNWIs LOOKING FOR “WHAT MONEY CANNOT BUY”, BEYOND PRODUCTS: CUSTOMER NETWORK AS THE NEW MEASURE OF VALUEBAIN-ALTAGAMMA 2019 WORLDWIDE LUXURY MARKET MONITOR
Linear Flow
Bain
View slide
Light background with yellow title banner, text-heavy content, and a column chart comparing IPO returns vs. offer prices by market cap.
Financial Performance
Financial Services
The slide analyzes how large-cap IPOs have trailed smaller deals in returns within a volatile environment. It includes a column chart showing weighted average IPO returns vs. offer prices by market cap for 2022 and 2023.
IPO returns, large-cap, market volatility, 2023, financial analysis
false
Big debuts trailing returns in a fragile environmentWith the market in flux, how can your IPO journey stay the course?
Multiple Chart
EY
View slide
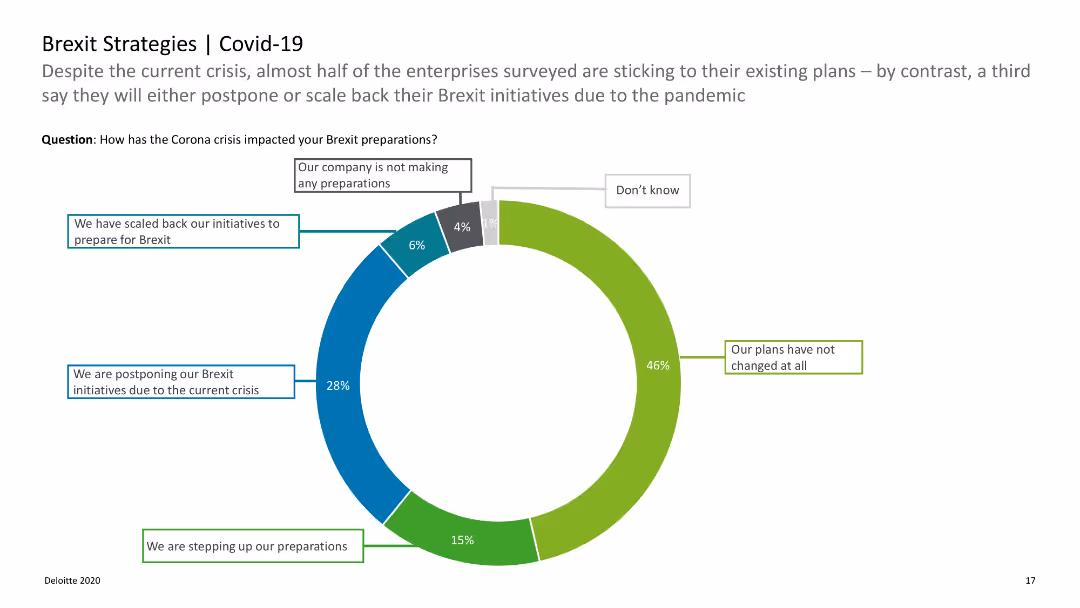
The slide shows a donut chart illustrating the impact of COVID-19 on Brexit preparations with labeled segments.
Strategic Planning
Professional Services
Explores how the COVID-19 crisis has influenced companies' Brexit strategies, including scaling back or postponing initiatives.
Brexit, COVID-19, strategies, impact, preparations
false
Brexit Strategies | Covid 19Deloitte Brexit Briefing | 13 Brexit Survey: Expectations and preparations of German enterprises
Single Chart
Deloitte
View slide
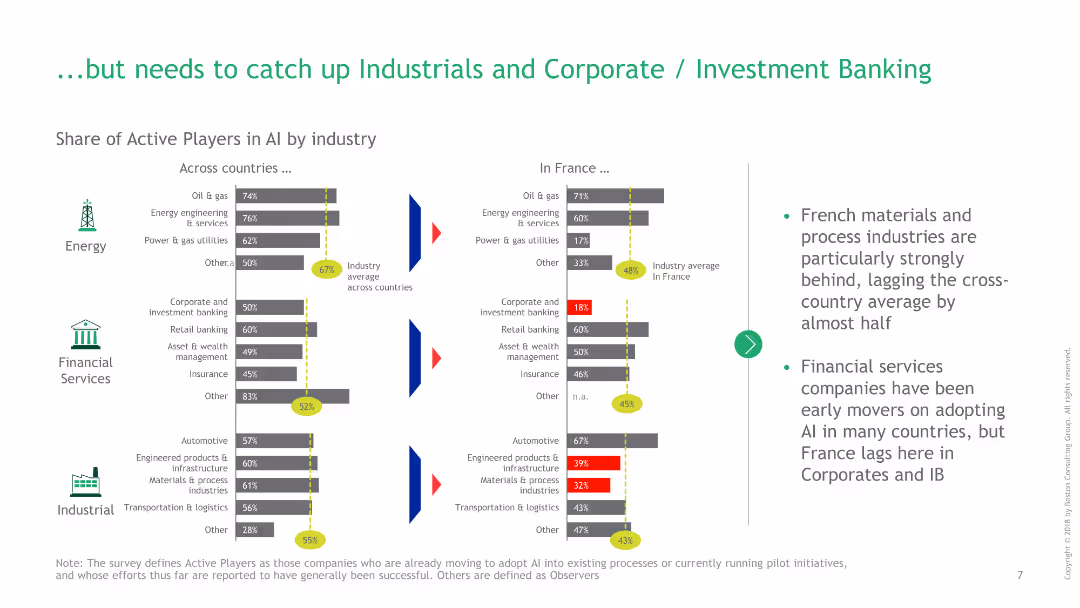
Bar charts showing the share of active AI players in energy, financial services, and industrial sectors between France and other countries.
Competitive Landscape
Financial Services
This slide highlights areas where France lags in AI adoption, particularly in industrial and corporate banking sectors, compared to other countries.
AI, France, financial services, industrial, investment banking, energy, comparison, active players, bar charts, industry average
false
...but needs to catch up Industrials and Corporate / Investment BankingMind the (AI) Gap: Leadership Makes the Difference
Multiple Chart
BCG
View slide
Two-section layout: left half with title overlaying image; right half with text blocks, stats, and a bar chart about tourism growth
Strategic Planning
Consumer Goods
KSA’s luxury market growth is driven by internal demand and high-end tourism. Despite current low luxury retail penetration (7% vs. 26% in Western Europe), consumer spending outlook is strong (47% vs. 39% average). High-end tourism is projected to expand significantly by 2030.
KSA, luxury retail, tourism, spending outlook, penetration, high-end travel, giga-projects
false
Two main drivers fueling KSA Luxury market growth...True-Luxury Global Consumer Insights
Mixed Chart
BCG
View slide
This slide contains multiple column charts displaying demographic information about Chinese luxury consumers, including age, education, and gender distribution.
Customer and Market Segmentation
Consumer Goods
Analyzes the demographic characteristics of Chinese luxury consumers, focusing on their youth, education, and predominantly female composition.
demographics, luxury, consumer, China, education, gender, age, distribution, market segmentation
false
They are very young, better educated, more femaleChina Luxury Digital Playbook
Multiple Chart
BCG
View slide
The slide contains a mix of text and icons describing primary end markets, demand drivers, and outlook for the waste and recycling segment.
Market Analysis and Trends
Environmental Services & Sustainability
It details the resilience of the waste and recycling segment against commercial volume reduction, highlighting residential, commercial, and industrial demand.
Waste, recycling, demand, commercial, residential, industrial, segment, outlook, primary markets
false
Waste and recyclingsegment has not been significantly affected despite commercial volume reduction and lower recycling ratesEnvironmental Services Outlook
Table
LEK
View slide
Contains text boxes with bullet points comparing the US and France with Australia in terms of cement industry characteristics.
Strategic Planning
Industrial & Manufacturing
Compares the cement supply chain and import-export dynamics of the US Northeast and France with Australia. Identifies key factors for selection of comparators, such as economic development and shipping methods.
Comparators, cement industry, US, France, Australia
false
International comparators were selected after assessing a number of factors including scale, import-export mix, and supply chain similarityInternational Comparison of Australia’s Freight and Supply Chain Performance Final Report - Cement
Header Vertical
LEK
View slide
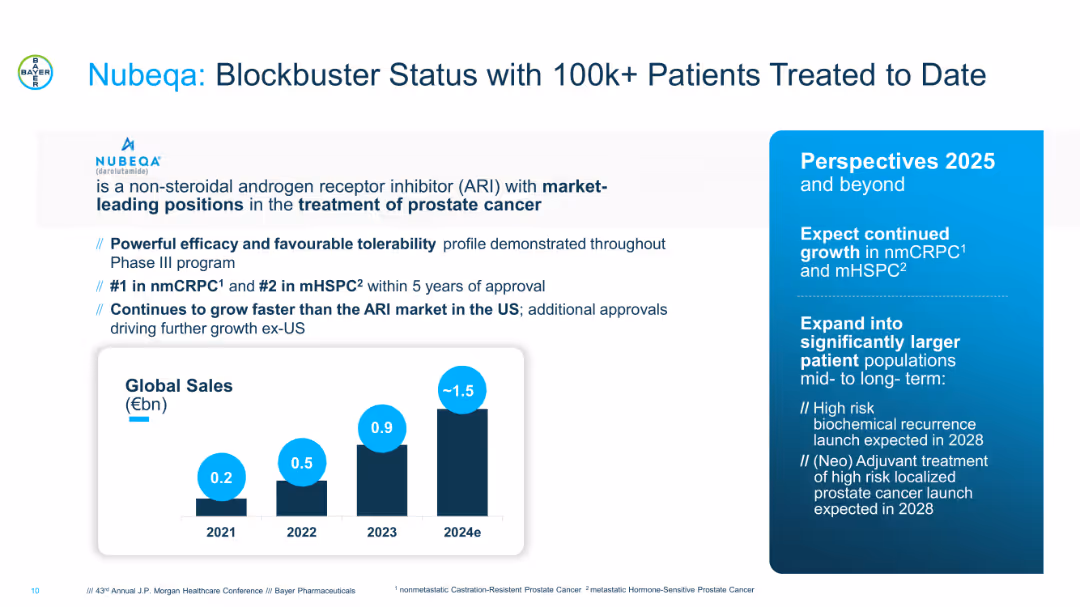
Split layout with product description and future outlook on the right, sales bar graph at bottom. Blue and black colors dominate. Clinical highlights and growth expectations are presented in bullet points.
Product and Service Analysis
Healthcare & Pharmaceuticals
Details the success of Nubeqa (Darolutamide) in prostate cancer treatment, highlighting market leadership, sales trajectory, and growth strategy. Future plans include expansion into larger patient segments with launches expected in 2028 for high-risk prostate cancer treatments.
Nubeqa, prostate cancer, ARI, patient growth, blockbuster drug, oncology, pharma sales
false
Nubeqa: Blockbuster Status with 100k+ Patients Treated to Date43rd Annual J.P. Morgan Healthcare Conference Handout
Mixed Chart
JP Morgan
View slide
Features a world map and portrait of a woman, highlighting Brazil's role as a continental hub attracting global tech companies
Market Analysis and Trends
Technology & Software
Focuses on Brazil's emerging status as a tech hub, mapping major global tech players and their activities within the region
Brazil, tech hub, global, market, innovation
false
Brazil has consolidated itself as a continental hub, attracting players from all over the world...Brazil Digital Report
Graphic
McKinsey
View slide
The slide features a column chart with green, blue, and dark gray bars indicating value seen from third-party cyber services across different categories.
Risk Assessment and Management
Technology & Software
Examines the value derived from third-party cyber services, emphasizing data protection, infrastructure security, and vendor management, supported by survey data.
Third-party services, vendor management, data protection, infrastructure security, cyber strategy
false
One other area in which highly mature cyber organizations exceeded their peers in the low and medium group: the value they are seeing from using third-party cyber servicesGlobal Future of Cyber Survey
Mixed Chart
Deloitte
View slide
This slide contains multiple column charts across a timeline from 1996 to 2019, separated into phases labeled "Sortie du temple," "Democratization," "Crisis," and others.
Market Analysis and Trends
Consumer Goods
The slide presents a timeline of the luxury goods market growth from 1996 to 2019, highlighting various market phases and projecting growth. It is used to analyze market trends.
Luxury goods, Market growth, Crisis, Projection
false
THE PERSONAL LUXURY GOODS MARKET IS EXPECTED TO CONTINUE ITS GROWTH TRAJECTORY IN 2019BAIN-ALTAGAMMA 2019 WORLDWIDE LUXURY MARKET MONITOR
Single Chart
Bain
View slide
Column chart displaying dissatisfaction levels across different demographics and product categories, with notable dissatisfaction in online experiences.
Market Analysis and Trends
Consumer Goods
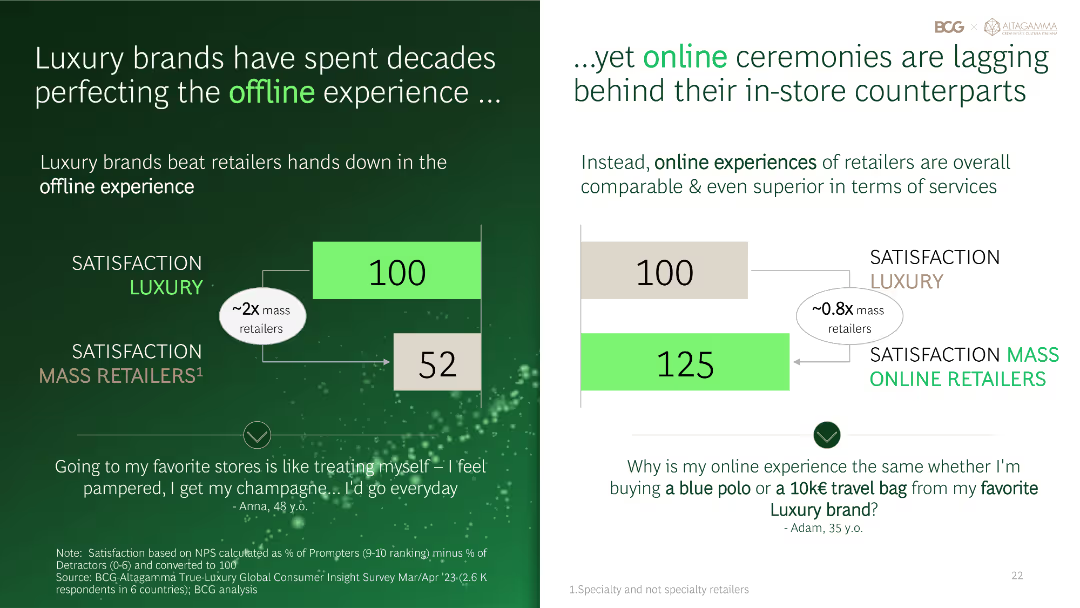
Highlights dissatisfaction with online experiences among various demographics and product categories, emphasizing the digital gap in consumer satisfaction.
Dissatisfaction, digital, demographics, product, analysis
false
Luxury brands have spent decades perfecting the offline experience ...True-Luxury Global Consumer Insights 9th Edition
Multiple Chart
BCG
View slide
Consists of two pie charts and two column charts showing the composition and quarterly movement of Level 3 assets and liabilities, with textual highlights.
Financial Performance
Financial Services
Analyzes the financial instruments classified as Level 3 assets and liabilities, detailing their valuation uncertainty and movements over the quarter.
assets, liabilities, financial, Level 3, risk management, valuation, uncertainty, banking
false
Level 3 assets and liabilities As of June 30, 2023, in € bnQ2 2023 results
Multiple Chart
Deutsche Bank
View slide
This slide has moderate visual complexity, featuring two pie charts to represent survey data on female millennials' attitudes toward international experience as a factor in employment. The design uses a consistent color scheme of red and grey to maintain visual coherence.
Human Resources and Talent Management
Professional Services
This slide discusses the importance of international assignments in attracting and retaining female talent, highlighting how such opportunities are crucial for employer branding. It emphasizes the need for organizations to incorporate international mobility into their employee value proposition.
Female talent, Millennials, Employer branding, International assignments
false
3. An international talent brandMoving women with purpose: Creating gender inclusive global mobility
Multiple Chart
PwC/Strategy&
View slide
Two-bar comparison chart (LCR min vs. Barclays) and bullet list of liquidity frameworks
Risk Assessment and Management
Financial Services
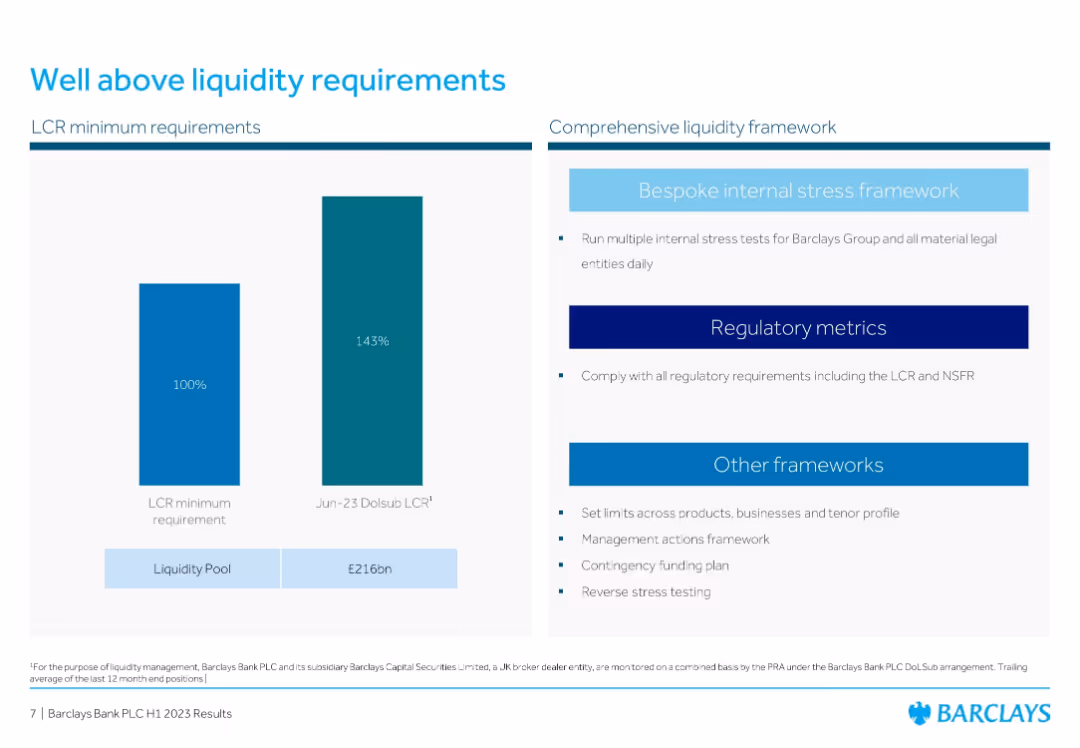
Highlights Barclays' liquidity coverage ratio of 143% against a 100% requirement, supported by a £216bn liquidity pool. Also outlines the bank's internal and regulatory frameworks to manage liquidity risks.
Liquidity, LCR, Stress Testing, Barclays, Risk Management, Financial Compliance, Resilience
false
Well above liquidity requirementsH1 2023 Client information – Summary of existing disclosure
Mixed Chart
Barclays
View slide
Horizontal bar chart of countries’ agreement that developed countries should do more to combat climate change. Shows agreement levels and year-over-year change.
Strategic Planning
Environmental Services & Sustainability
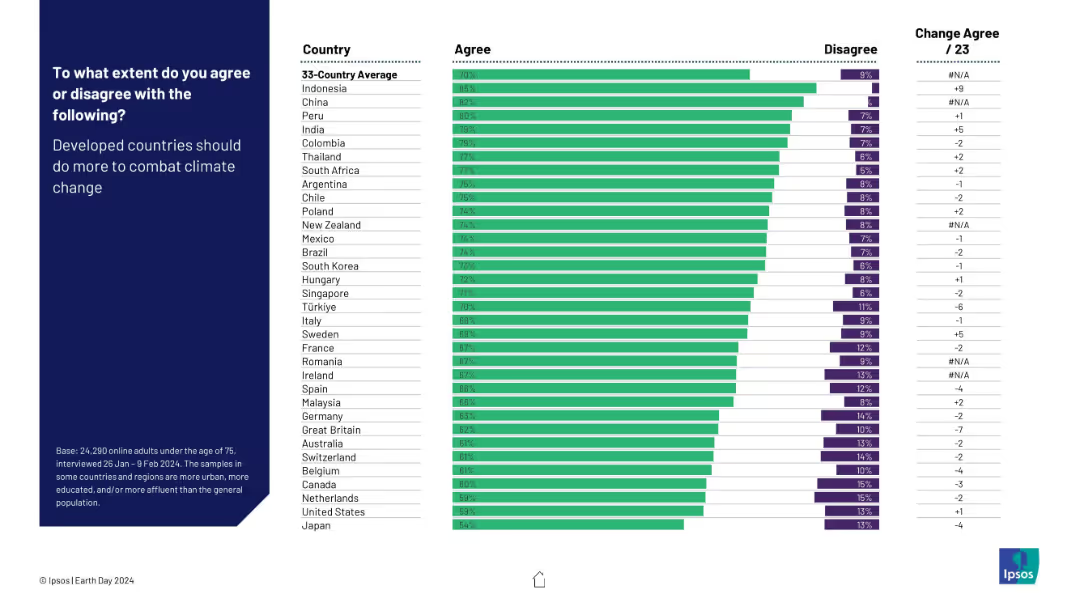
This slide highlights global demand for developed nations to increase their efforts in fighting climate change. Agreement is especially high in China, Peru, and Colombia, indicating a sense of unmet responsibility by wealthier countries.
climate action, developed nations, global responsibility, public sentiment, environmental urgency, international pressure, Ipsos, Earth Day
false
To what extent do you agree or disagree with the following?EARTH DAY 2024
Mixed Chart
IPSOS
View slide
The slide features a colorful index grid titled 'MGI Sector Digitization Index' comparing various sectors in terms of digital assets, usage, and labor. Accompanying the grid is a legend explaining the degree of digitization.
Market Analysis and Trends
Technology & Software
The slide provides an analysis of digitization levels across different sectors using an index that evaluates digital assets, usage, and labor. Each sector is color-coded to indicate its relative degree of digitization. This serves as a strategic tool to understand where digitization is most advanced and where there is potential for growth, aiding in decision-making for digital transformation initiatives.
Digitization Index, Sectors, Assets, Usage, Labor, ICT, Media, Finance, Manufacturing, Services, B2B, Technology Adoption
false
Extent of Digitization varies by sectorDigital Economy: Trends, Opportunities and Challenges
Mixed Chart
McKinsey
View slide
Horizontal bar chart showing likelihood by country; sorted descending by perceived likelihood.
Market Analysis and Trends
Government & Public Sector
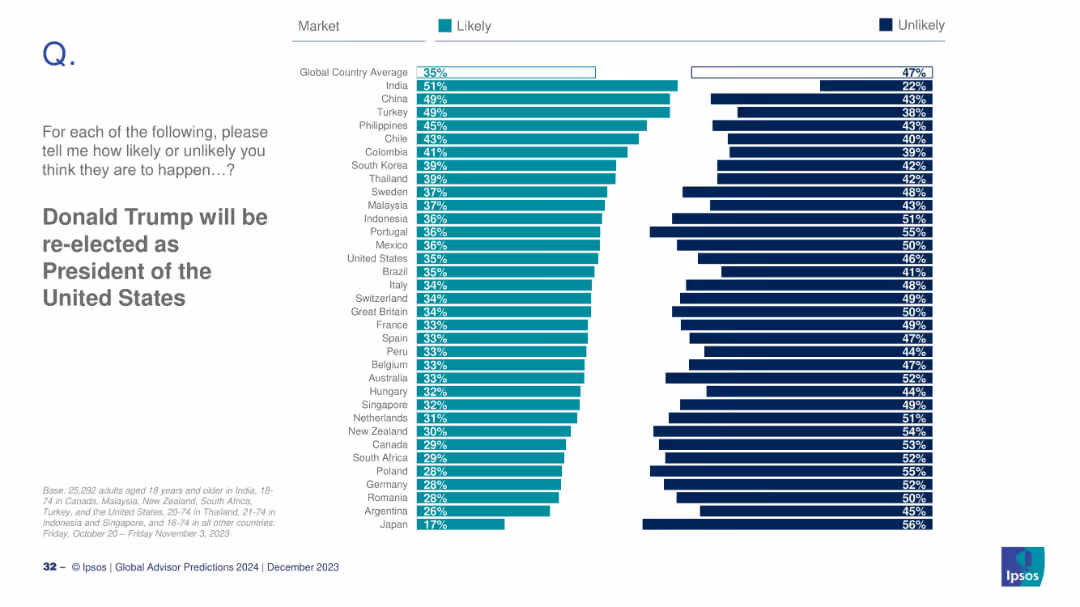
This slide displays global public opinion on whether Donald Trump will be re-elected as U.S. President. India and China show the highest expectations. The U.S. perception (35%) is equal to the global average. The layout visualizes "likely" vs. "unlikely" opinion across countries.
Trump, election, politics, U.S. presidency, international opinion, 2024 prediction, Ipsos
false
Donald Trump will be re-elected as President of the United StatesGLOBAL ADVISOR 2024 PREDICTIONS
Mixed Chart
IPSOS
View slide
The slide contains a column chart showing the number of relationship managers and net hires across regions, alongside metrics for RM productivity improvements in CHF mn. Bullet points highlight strategic hiring efforts and productivity gains.
Human Resources and Talent Management
Financial Services
The slide illustrates the impact of targeted hiring in growth markets, showing net hires and productivity gains. It emphasizes the strategic approach to upgrading the talent base, resulting in higher RM productivity and improved client management outcomes.
hiring, productivity, talent management, RM, growth markets
false
Quality hiring in targeted growth markets, leading to higher productivity; started net hiring in 9M19Credit Suisse Investor Day 2019 Growth in Wealth Management
Multiple Chart
Credit Suisse
View slide
Features two line charts, one showing simulated historical growth of $100 and the other depicting simulated historical drawdowns.
Financial Performance
Financial Services
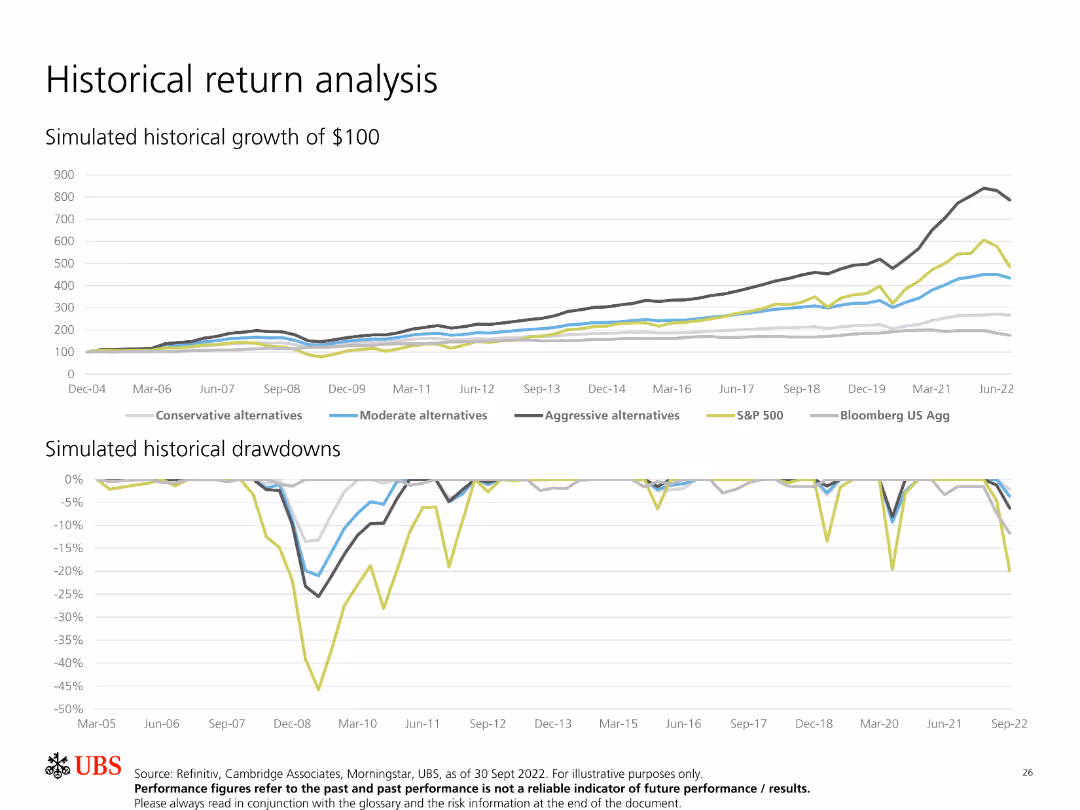
Analyzes historical returns of different investment strategies, comparing their growth and drawdowns over time to evaluate performance and risk.
Historical Returns, Growth, Drawdowns, Investment, Performance, Simulation, Analysis, Comparison, Strategies
false
Historical return analysisPrivate markets asset allocation guide
Multiple Chart
UBS
View slide
The slide features several bar charts comparing leaders and others in value generation across dimensions like cost, resilience, ESG, and growth.
Operational Efficiency
Financial Services
It highlights how leaders generate value through cost reduction, resilience, ESG, and growth. It is used for showing value dimensions and their impact.
Value generation, cost reduction, resilience, ESG, growth, procurement, financial impact
false
Convenience is supposedly a top priority for consumers and only increasing in importance.Customer loyalty and Convenience
Mixed Chart
Kearney
View slide
Text on left, and a bar chart on right showing how effective large vs. small organizations are at ESG practices like alignment, contribution tracking, and stakeholder engagement.
Operational Efficiency
Professional Services
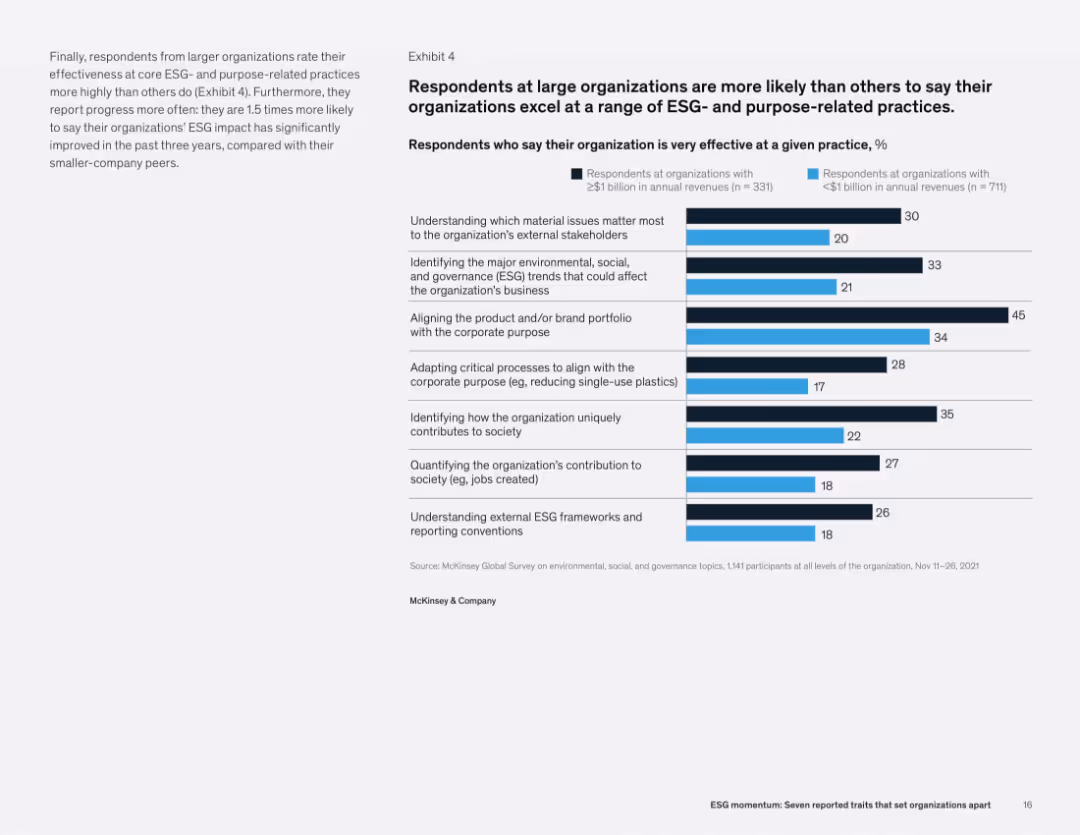
Larger organizations report significantly higher effectiveness in various ESG practices, including stakeholder engagement, brand alignment with purpose, and trend identification. The data suggests a broader and more integrated ESG strategy in large firms.
ESG effectiveness, organizational practices, purpose alignment, stakeholder engagement, corporate strategy
false
Respondents at large organizations are more likely than others to say their organizations excel at a range of ESG- and purpose-related practicesESG momentum: Seven reported traits that set organizations apart
Mixed Chart
McKinsey
View slide
Features text with a bar chart showing the acceleration of net zero commitments from different organizations and countries between 2020 and 2021.
Strategic Planning
Environmental Services & Sustainability
Discusses the acceleration of decarbonization commitments by governments and businesses, highlighting the significant increase in net zero targets within a year.
Net zero, commitment, government, business, decarbonization, target, emissions, sustainability
false
Delivering on government and business commitments will require transformative changeEssential, expensive and evolving: The outlook for carbon credits and offsets
Multiple Chart
EY
View slide
The slide includes column chart and diagrams showing the economic impact of Copernicus on agriculture.
Market Analysis and Trends
Agriculture & Food Production
Focuses on precision farming and the economic benefits derived from using Copernicus data in agriculture, aiming to enhance profitability and productivity.
Agriculture, Precision Farming, Copernicus, Profitability, Productivity
false
AGRICULTURE COPERNICUS BENEFITS FOR AGRICULTURECOPERNICUS Market report February 2019
Mixed Chart
PwC/Strategy&
View slide
Features green-colored blocks outlining the rationale and questions to consider for creating value through M&A. It emphasizes traditional and forward-looking synergies like revenue and cost efficiencies, risk mitigation, and knowledge generation.
Strategic Planning
Financial Services
Provides a strategic framework for evaluating M&A opportunities, focusing on identifying synergies, assessing risks, and understanding cost benefits to maximize deal value.
M&A, Value Creation, Synergies, Strategy, Risk Mitigation, Cost Efficiency
false
Creating the M&A value caseHow to gain value from M&A
Table
Deloitte
View slide
The slide contains a scatter plot graph showing banks' focus on digitalization and open banking functionalities. Different colors represent digital champions, smart followers, adopters, and latecomers. The slide also includes descriptive text on digital champions' positions.
Competitive Landscape
Financial Services
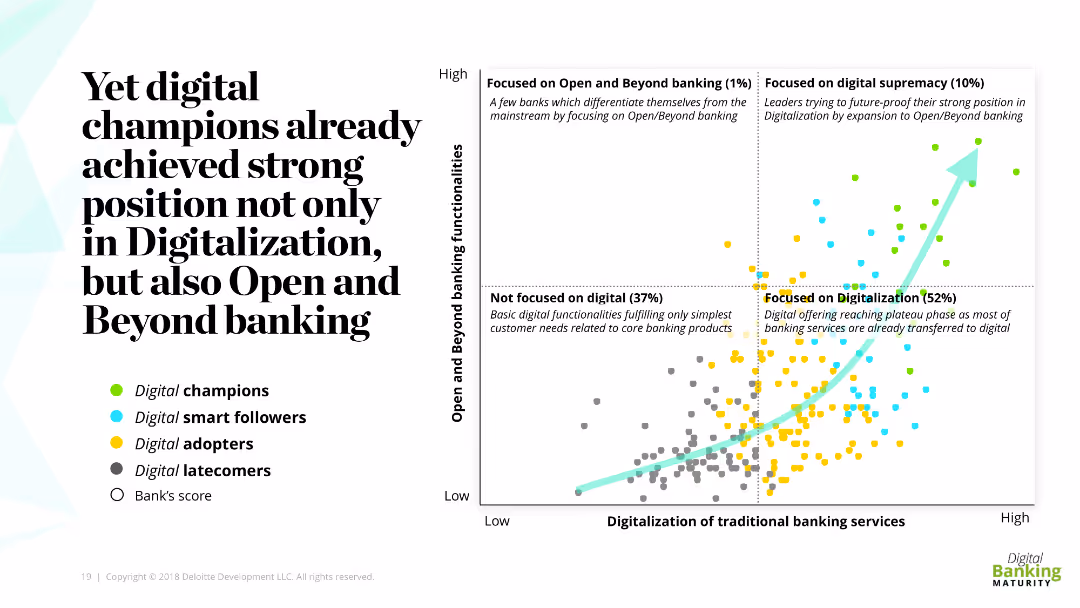
This slide highlights the strong position achieved by digital champions in both digitalization and open banking functionalities. It categorizes banks based on their focus and digital capabilities, showing leaders in digital supremacy and open banking.
digital champions, open banking, digitalization, competitive landscape, banks
false
Yet digital champions already achieved strong position not only in Digitalization, but also Open and Beyond bankingEMEA Digital Banking Maturity 2018
Mixed Chart
Deloitte
View slide
Dual donut charts: biocapacity share by nation and forest degradation share by nation.
Risk Assessment and Management
Environmental Services & Sustainability
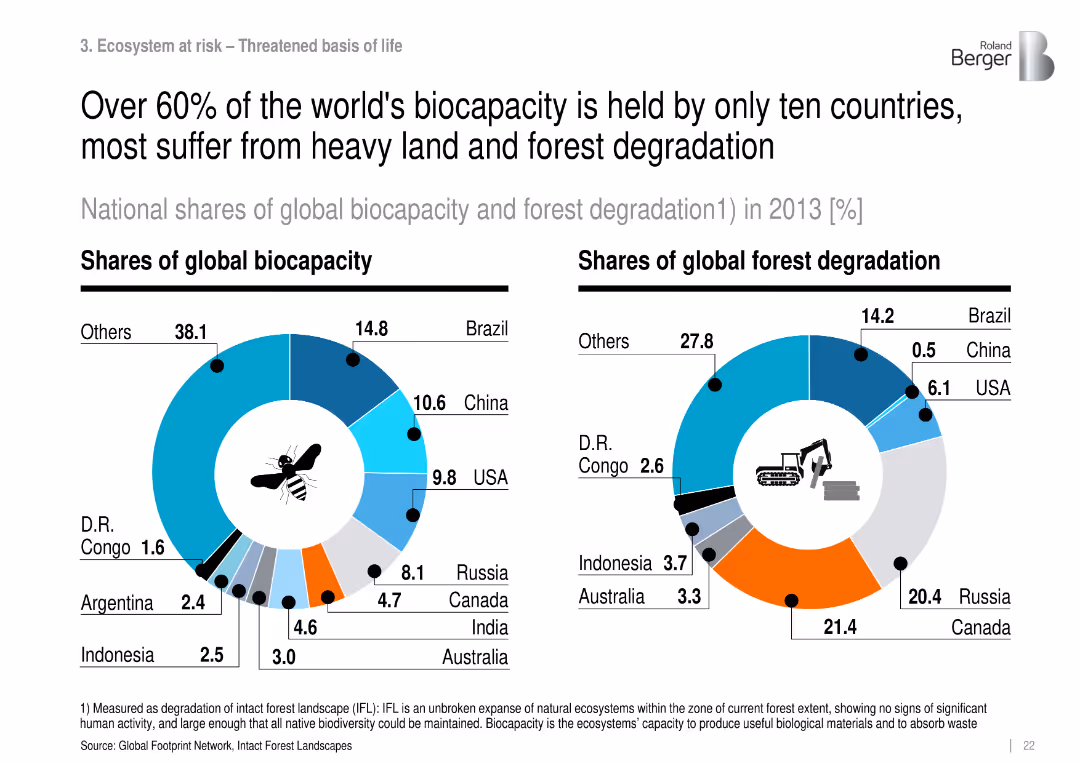
Highlights global biocapacity concentration and compares it to forest degradation patterns, indicating critical pressure in high-capacity countries like Brazil and Russia.
biocapacity, forest degradation, land use, biodiversity, ecosystem stress
false
Over 60% of the world's biocapacity is held by only ten countries, most suffer from heavy land and forest degradationRoland Berger Trend Compendium 2030 Megatrend 4 Climate change & ecosystem at risk
Multiple Chart
Roland Berger
View slide
Circular icons and line-style comparisons from 2015–2023, segmented by engagement themes
Market Analysis and Trends
Government & Public Sector
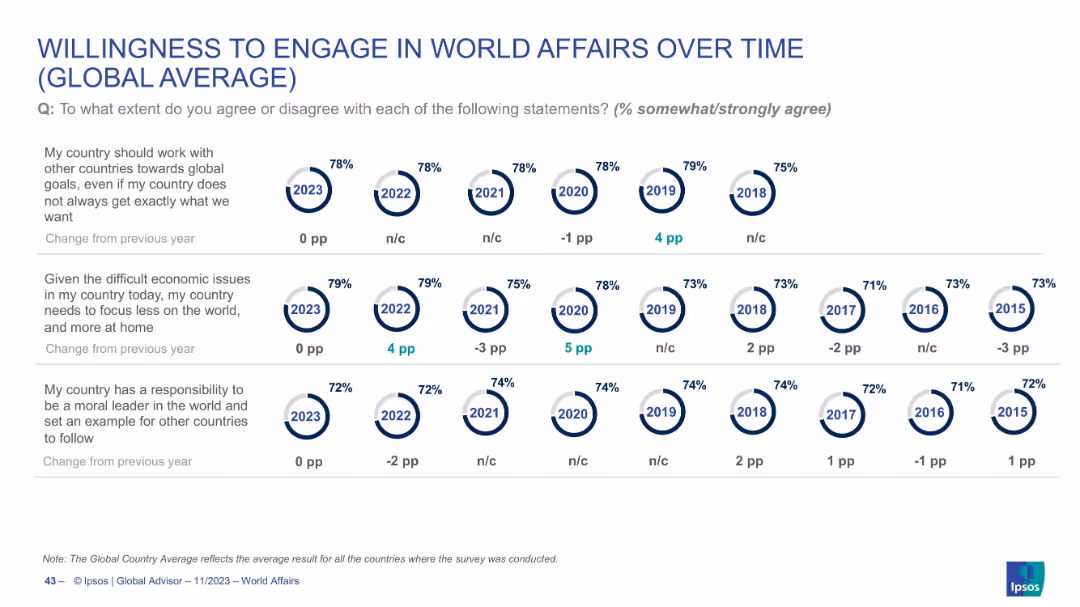
Tracks trends in global attitudes from 2015–2023 on cooperation, internal economic focus, and moral leadership. Provides visual history of public opinion shifts, with data consistency or modest changes across years.
trend analysis, world affairs, global opinion, survey history, policy engagement, Ipsos
false
WILLINGNESS TO ENGAGE IN WORLD AFFAIRS OVER TIME (GLOBAL AVERAGE)WORLD AFFAIRS 2023
Single Chart
IPSOS
View slide
Structured layout with left-side sectioned narrative and right-side survey bar charts. Purple color scheme aligns with legal focus. Clearly segmented advantages/disadvantages.
Investment Analysis
Financial Services
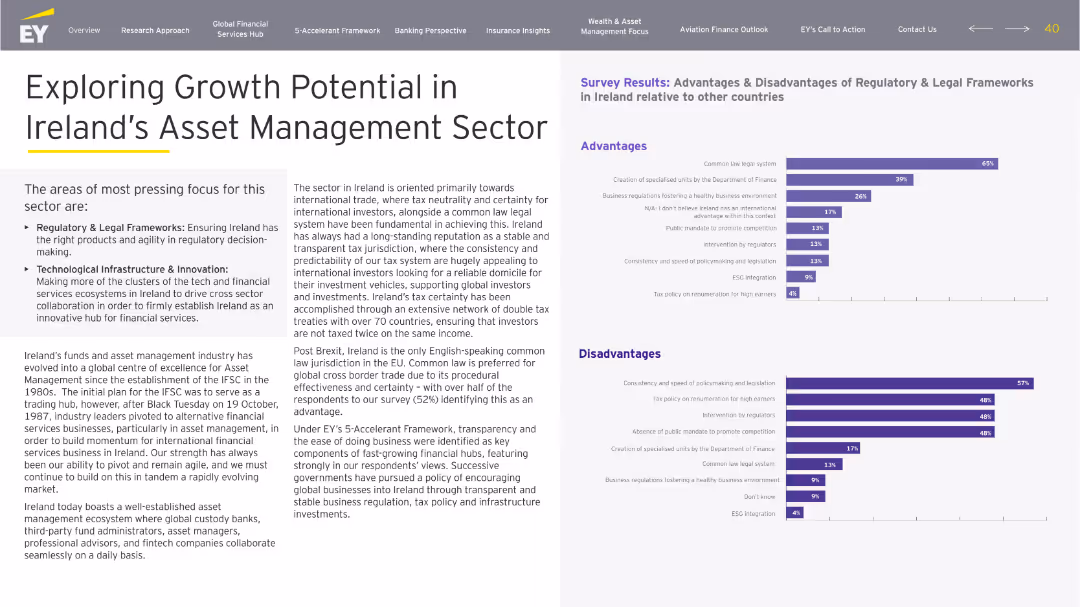
Discusses growth prospects for Ireland's asset management sector, emphasizing regulatory clarity and tech innovation. Survey results show strong sentiment on legal stability and tax neutrality as advantages. Critiques focus on slow policy changes and lack of promotion.
asset management, growth, legal, tax neutrality, regulation, innovation
false
Exploring Growth Potential in Ireland’s Asset Management SectorBuilding a Better Financial Services Ireland: Accelerate to Elevate
Multiple Chart
EY
View slide
The slide features a column chart showing potential annual increase in main banks' revenue per customer across nine countries, indicating additional banking and non-FS revenue. The layout includes a key takeaway box and explanatory text.
Market Analysis and Trends
Financial Services
The slide analyzes the potential revenue increase for banks through product and channel integration. It highlights a 20% uplift in revenue per customer, with country-specific details.
revenue, banking, integration, multiplier effect, financial services, customer advocacy, market analysis
false
Figure 8. Potential annual increase in main banks’ revenue per customer by activating the ‘multiplier effect’.Global Banking Consumer Study Reignite human connections to discover hidden valu
Mixed Chart
Accenture
View slide
The slide includes a line chart showing historical Brent prices and the average mean reversion time, with a detailed explanation of the concept of mean reversion in commodity prices.
Market Analysis and Trends
Energy & Utilities
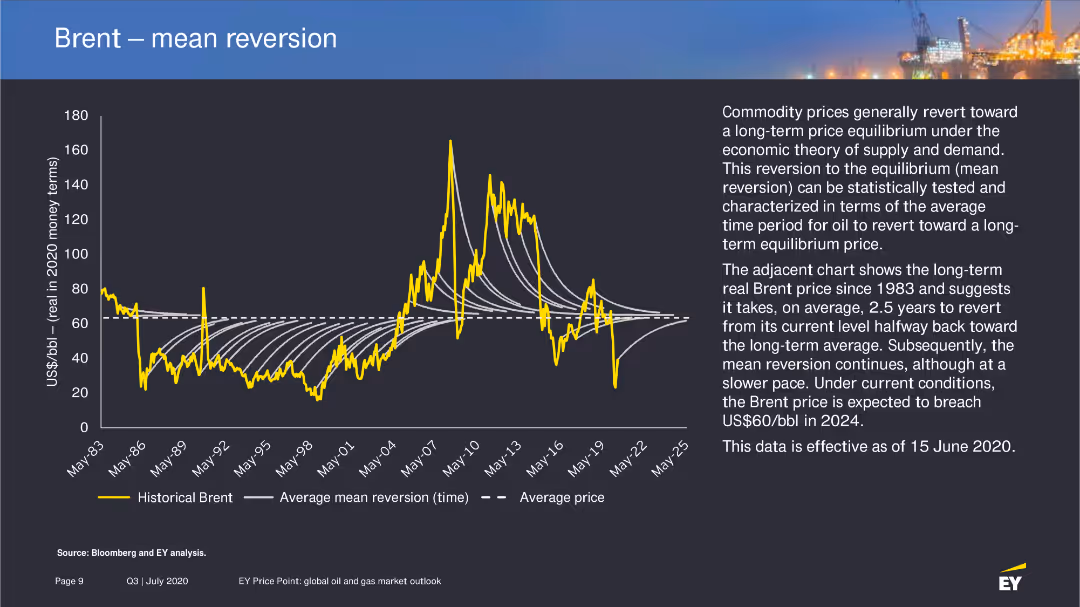
Explores the theory of mean reversion in oil prices, presenting historical data and future projections to explain the expected price adjustments over time.
mean reversion, Brent prices, oil market, 2020
false
Brent — mean reversionEY Price Point: global oil and gas market outlook Q3 | July 2020
Mixed Chart
EY
View slide
Horizontal bar chart with segmented agreement levels; sidebar with title and average.
Market Analysis and Trends
Financial Services
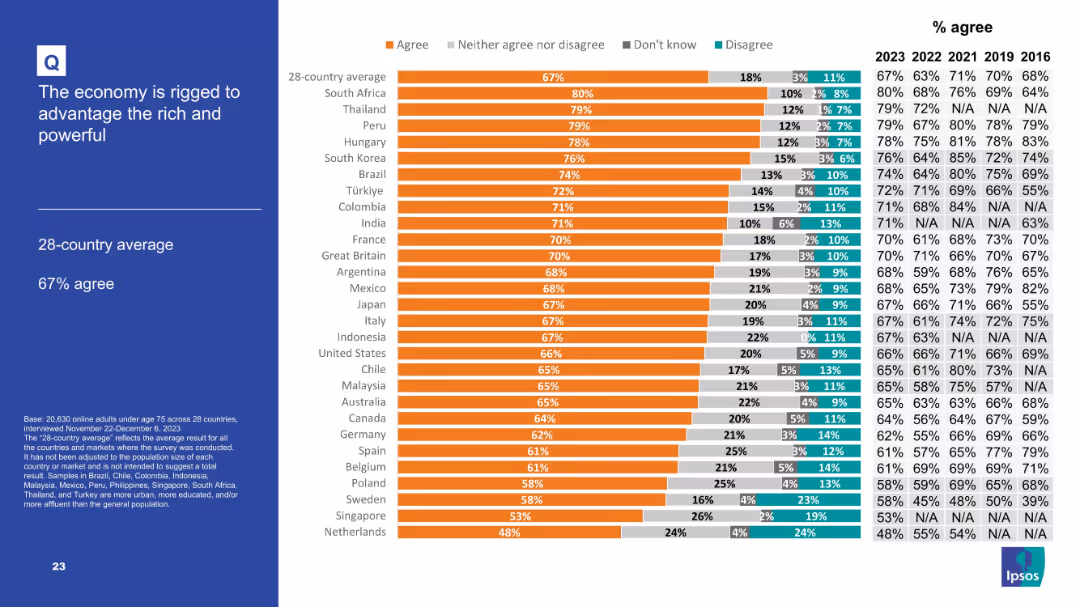
Displays agreement levels with the statement that the economy benefits the rich and powerful. The 28-country average is 67%. South Africa, Thailand, and Peru show the highest agreement, indicating widespread skepticism about economic fairness.
economy, inequality, rigged system, public opinion, economic perception
false
The economy is rigged to advantage the rich and powerfulPOPULISM IN 2024
Mixed Chart
IPSOS
View slide
Column chart displaying the percentage of respondents agreeing they need to do more about physical health, with countries sorted from highest to lowest agreement.
Customer and Market Segmentation
Healthcare & Pharmaceuticals
Illustrates the global drive to improve physical health, showing agreement levels across countries. Nigeria has the highest agreement, while Netherlands has the lowest.
physical health, global, agreement, survey, improvement
false
The drive to do more about our physical health is strong across all marketsA NEW WORLD DISORDER?
Multiple Chart
IPSOS
View slide
Incorporates line charts comparing global SVOD revenue against traditional box office figures from 2015 to 2024, with a separate focus on India. The chart uses contrasting colors to highlight the overtaking of box office revenue by SVOD, underscoring a significant industry shift.
Competitive Landscape
Media & Entertainment
Discusses the impact of digital streaming services on traditional cinema, marking a pivotal shift as SVOD revenue surpasses box office collections globally and in India. This slide is vital for analyzing market dynamics, consumer behavior changes, and the strategic implications for content distributors and film producers.
SVOD, box office, digital transformation, cinema
false
OTT to gain as cinema degrows; SVOD revenue to overtake box office spend in 2020Global Entertainment & Media Outlook: 2020-2024
Multiple Chart
PwC/Strategy&
View slide
Clustered bar chart showing consumer behavioral response to perceived price increases by category (e.g., gas, apparel); action types color-coded
Pricing Strategies
Retail & E-commerce
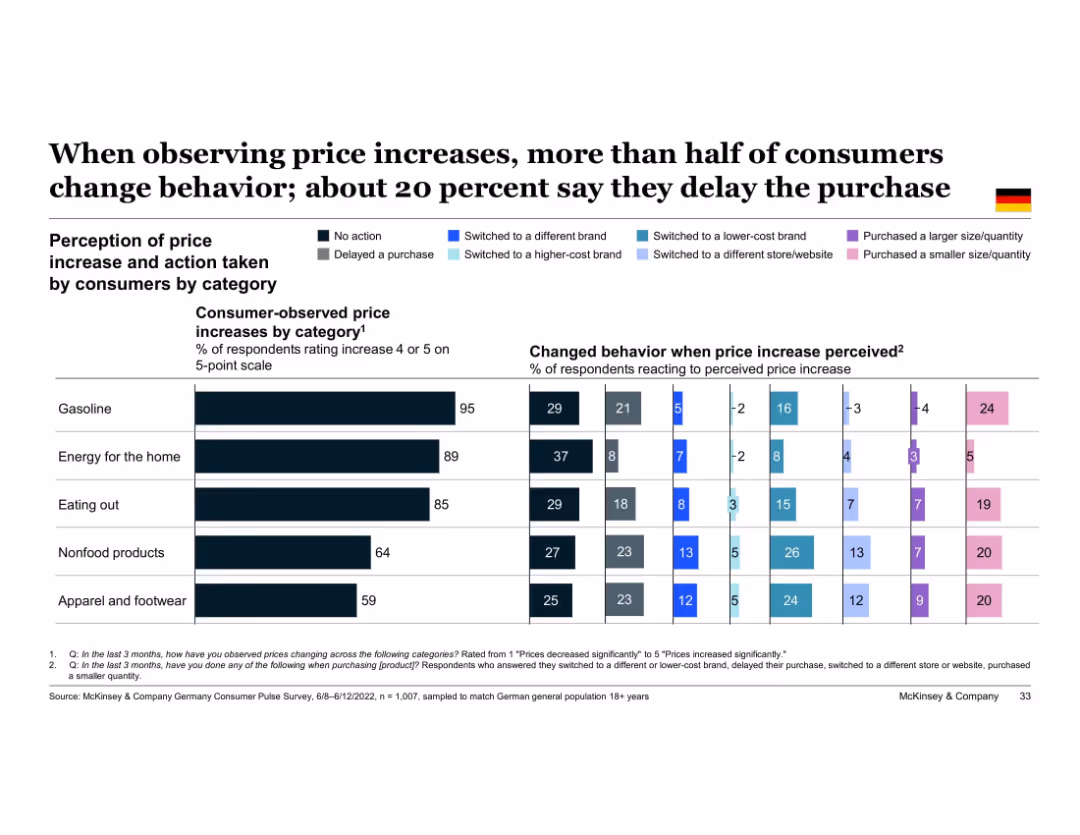
Consumers are highly responsive to perceived price increases. Across categories like gasoline, energy, and food, many switch to lower-cost brands or delay purchases. Delaying purchases is particularly common for gas and non-essentials. The slide emphasizes behavior changes in response to inflationary pressure.
price perception, delayed purchase, inflation response, price sensitivity, category behavior, Germany, consumer change
false
When observing price increases, more than half of consumers change behavior; about 20 percent say they delay the purchaseEuropean Consumer Sentiment Survey: How current events in Europe are shaping consumer behavior
Single Chart
McKinsey
View slide
Side-by-side bar chart comparing cost of investing vs. cost of borrowing. Bold numbers and clean layout.
Strategic Planning
Financial Services
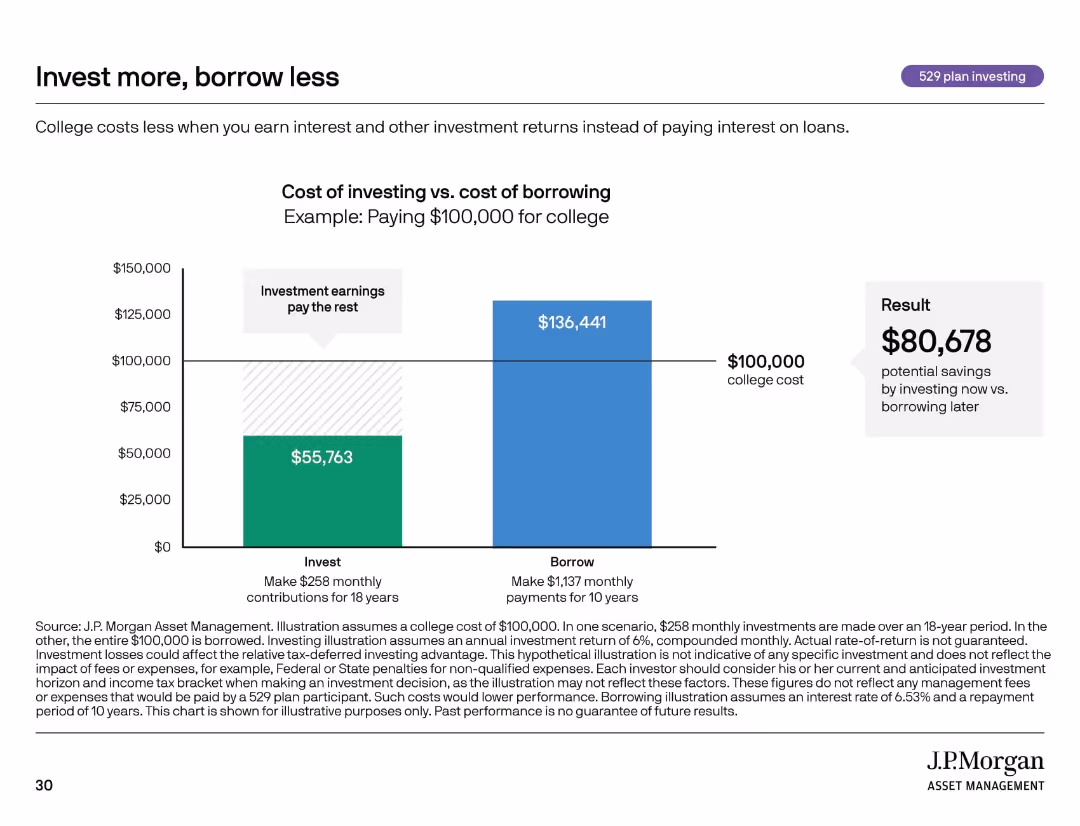
Illustrates how investing early for college can result in substantial savings compared to borrowing. Assumes different scenarios for a $100,000 college cost and highlights a potential $80,678 savings from investing instead of taking loans.
investing vs borrowing, savings, cost comparison, education planning
false
Invest more, borrow lessCollege Planning Essentials A comprehensive guide to saving and investing
Mixed Chart
JP Morgan
View slide
The slide features two column charts showing cost reduction actions over the past and next 24 months across different regions. Key findings are included in text boxes.
Operational Efficiency
Financial Services
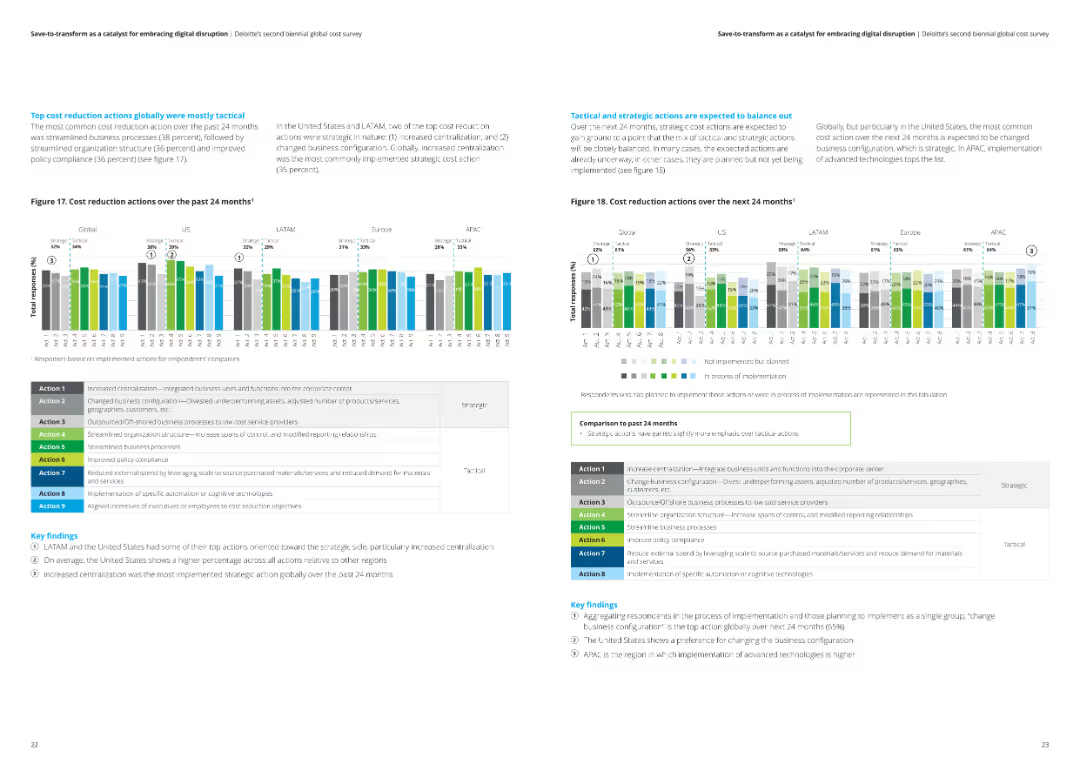
The slide details tactical and strategic cost reduction actions taken in various regions over the past 24 months and projected for the next 24 months.
Cost reduction, tactical actions, strategic actions, analysis, financial services
false
Top cost reduction actions globally were mostly tactical The most common cost reduction action over the past 24 months was streamlined business processes (38 percent),Save-to-transform as a catalyst for embracing digital disruption Deloitte’s second biennial global cost survey
Multiple Chart
Deloitte
View slide
The slide contains a bar chart showing the percentage of large companies participating in various tech-propelled markets, with a focus on six key sectors.
Market Analysis and Trends
Technology & Software
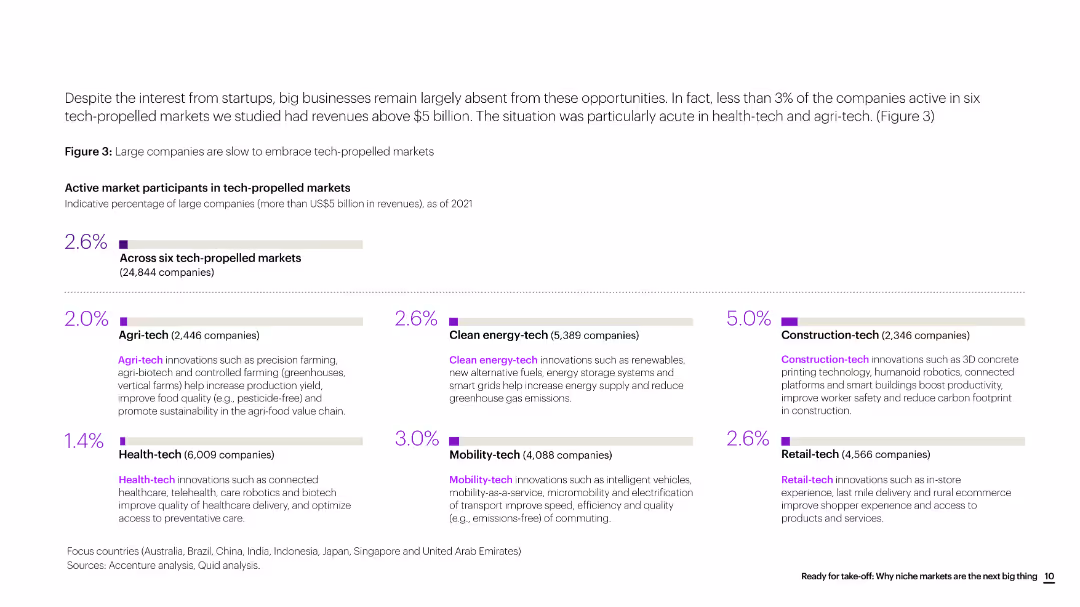
The slide analyzes the participation of large companies in tech-propelled markets, highlighting the low involvement despite the potential growth opportunities.
market participants, tech markets, large companies, analysis, technology, bar chart
false
Despite the interest from startups, big businesses remain largely absent from these opportunities.Ready for take-off Why niche markets are the next big thing
Multiple Chart
Accenture
View slide
This slide provides a detailed breakdown of strategic priorities along Australia's battery value chain from mining to recycling. It uses color-coded sections and icons to highlight specific areas such as mining, refining, active materials, and cell manufacturing, with bullet points detailing strategic actions for each segment. The layout is comprehensive and strategically organized to convey complex information in a structured manner.
Competitive Landscape
Energy & Utilities
Discusses how Australia can enhance its end-to-end capabilities in the battery value chain, focusing on leveraging its rich mineral resources and strengthening manufacturing and recycling.
strategic priorities, battery value chain, Australia, mining, refining, manufacturing, recycling, global market, value chain enhancement, resource management
false
To develop strong end-to-end capabilities in the battery value chain, Australia will need to focus on leveraging its upstream strengthsCharging Ahead Australia’s battery powered future
Linear Flow
Accenture
View slide
The slide features a donut chart showing responses to a question about the relationship between interest rates and bond prices, with breakdowns of correct and incorrect answers. The layout is moderately complex.
Performance Metrics and KPIs
Financial Services
This slide assesses knowledge about the impact of interest rates on bond prices, showing mixed understanding among Canadians. It aims to evaluate public knowledge on financial concepts.
interest rates, bond prices, knowledge, financial, Canadians
false
Interest Rate/ Bond Price KnowledgeCRYPTO ASSET SURVEY
Single Chart
IPSOS
View slide
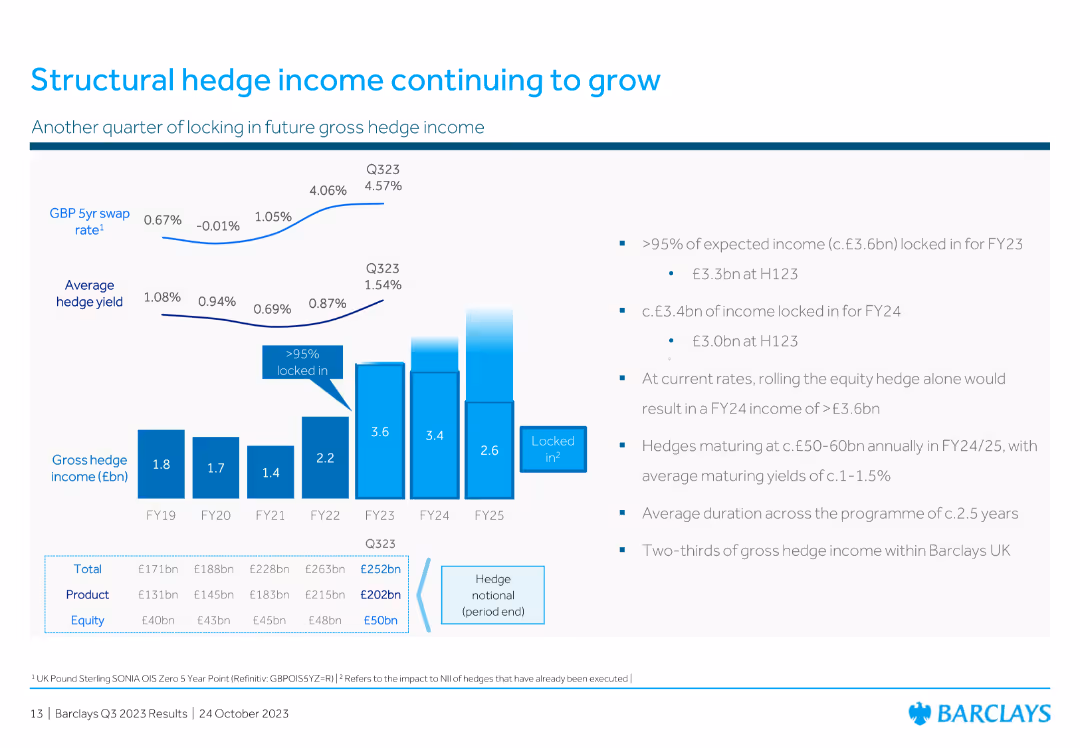
This slide features a column chart showing gross hedge income (£bn) from FY19 to FY25, with details on expected income, hedge yields, and the proportion of income locked in.
Financial Performance
Financial Services
The slide highlights the growth in structural hedge income for Barclays, detailing expected income, hedge yields, and the duration of income locking, projecting future gross hedge income growth.
hedge income, growth, projections, yields, FY25
false
Structural hedge income continuing to growBarclays PLC Q3 2023 Fixed Income Investor Presentation
Multiple Chart
Barclays
View slide
Features a dual graph layout showing marketing spend alongside key performance metrics. The design is data-intensive but remains clear due to the effective use of colors and spacing.
Sales and Business Development
Financial Services
The slide breaks down the card marketing strategy and its impact on scale and distribution, displaying a disciplined approach to marketing and its direct correlation with performance growth in terms of sales and account acquisition.
Marketing Strategy, Performance Growth, Sales Volume, Account Acquisition, Business Scaling
false
Our marketing engine fuels our scale and distributionInverstors Day 2023
Single Chart
JP Morgan
View slide
The slide presents stacked column charts representing capital movement with labels for dates and financial segments. It uses a color gradient to differentiate segments within the bars.
Financial Performance
Financial Services
This slide shows capital movement within Macquarie Capital over two time points, highlighting changes across different financial sectors like debt and various types of energy investments.
Capital, Investments, Realizations, FX, Debt
false
Macquarie Capital Movement in capitalMorgan Stanley Virtual Hong Kong Summit
Single Chart
Morgan Stanley
View slide
Slide with headers and structured bullet points on one side and a flow diagram on the other, with a red and black design theme.
Financial Performance
Industrial & Manufacturing
Describes the Input-Output modeling used to assess the Tempest program's economic contribution to the UK supply chain.
Input-Output analysis, supply chain, GVA, employment, Tempest, economic contribution, UK
false
Input-Output analysis is used to estimate the effect on GVA and employment through the supply chainAssessment of the expected economic impact of the Tempest Programme (2021-2050)
Diagram
PwC/Strategy&
View slide
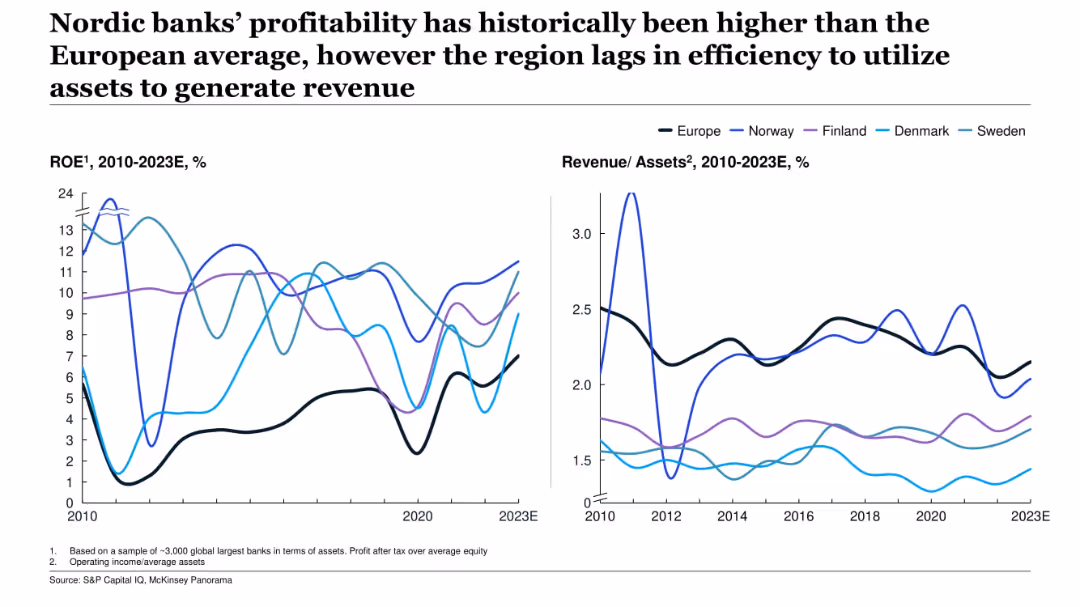
Two line graphs: ROE and revenue/assets over time (2010–2023E); Nordic countries vs. Europe benchmark.
Financial Performance
Financial Services
This slide compares Nordic banks’ historical performance to the European average, showing higher ROE but lower efficiency in asset utilization. It highlights a tradeoff where profitability is strong, yet revenue per asset remains relatively low, indicating efficiency gaps.
Nordic banks, ROE, profitability, revenue/assets, efficiency, finance, Europe, trends
false
Nordic banks’ profitability has historically been higher than the European average, however the region lags in efficiency to utilize assets to generate revenueGlobal Banking Annual Review 2023
Multiple Chart
McKinsey
View slide
Dark background with column charts. Text on the right discussing platform strategy considerations
Competitive Landscape
Professional Services
It outlines the increased partnership formation among platform adopters and criteria for platform strategy
Partnerships, Strategy, Market Dynamics, Technology, Ecosystem
false
More platform adopters form new partnershipsLevel Up: Elevate Your Business With a Platform Strategy
Mixed Chart
Accenture
View slide
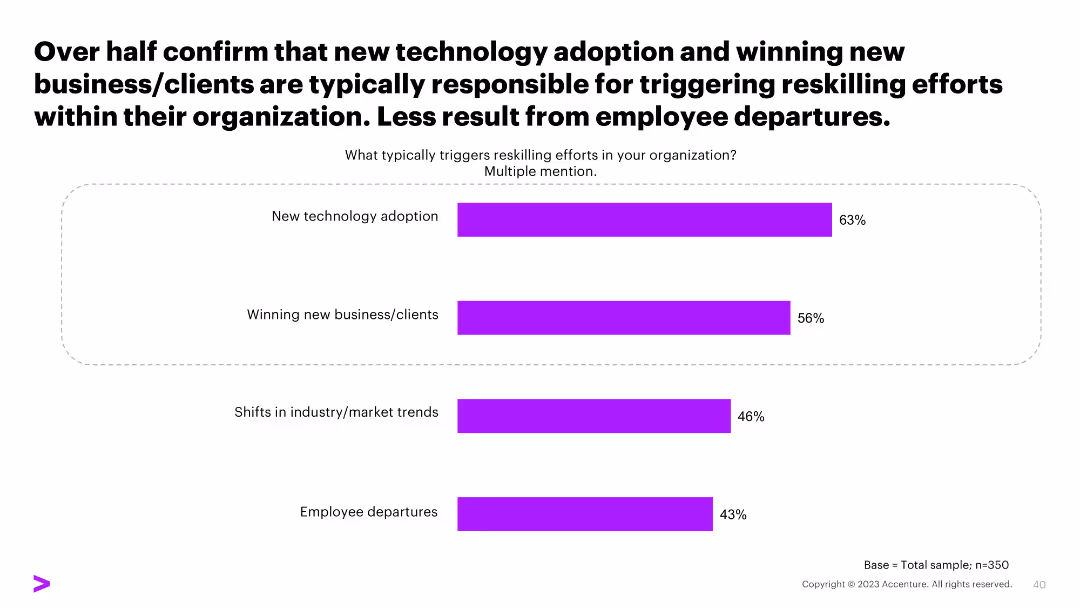
This slide includes a horizontal bar chart showing factors that trigger reskilling efforts within organizations, such as new technology adoption, winning new clients, market trends, and employee departures.
Human Resources and Talent Management
Professional Services
The slide details the primary factors that prompt reskilling efforts in organizations, with new technology adoption and winning new clients being the top triggers.
reskilling, technology adoption, market trends, clients, employee departures
false
Over half confirm that new technology adoption and winning new business/clients are typically responsible for triggering reskilling efforts within their organization. Less result from employee departures.Tech Talent Hiring Trends Survey
Single Chart
Accenture
View slide
Features a series of column charts comparing shifts in consumer behavior across various service sectors. The design utilizes blue tones and is labeled for clarity.
Market Analysis and Trends
Technology & Software
This slide shows the changes in user behavior due to COVID-19, with significant shifts to online services in food delivery, groceries, and education. Useful for analyzing consumer trends and market shifts during a pandemic.
COVID-19, consumer behavior, food delivery, online services, education, groceries
false
Users moved online for Food delivery, Groceries, Education, Entertainmente-Conomy SEA 2020 At full velocity: Resilient and racing ahead
Single Chart
Bain
View slide
A slide with bar graphs and circular statistics to illustrate the experiences of women in hybrid working environments and how they vary by organizational culture.
Operational Efficiency
Professional Services
Emphasizes how Gender Equality Leaders create better hybrid working experiences, valuable for discussions on hybrid workplace models and inclusive culture development.
hybrid work, gender equality, culture, experience
false
Women who work for Gender Equality Leaders benefit from high levels of supportWomen @ Work 2023: 7 The Gender Equality Leaders are benefiting from doing it right
Multiple Chart
Deloitte
View slide
The slide features a vertical column chart detailing the loss-absorbing capacity in various capital tiers, complemented by bullet points explaining the relevance and regulatory implications. The design is straightforward with a clear focus on data presentation.
Regulatory and Compliance
Financial Services
Explains the protective measures in place for depositors and counterparties through loss-absorbing capacity in financial contexts, crucial for discussions on financial stability and regulatory compliance.
financial protection, compliance, banking, capital
false
Depositors and counterparties are protected by € 119bn loss-absorbing capacityClient & Creditor Overview July 2023
Mixed Chart
Deutsche Bank
View slide
The slide includes three column charts comparing Tyson's sales volume and growth in the retail perimeter to total grocery sales. The visual design uses deep blue and gray to distinguish between Tyson and total grocery, effectively drawing attention to Tyson's advantageous positioning.
Market Analysis and Trends
Agriculture & Food Production
Discusses Tyson’s competitive advantage in retail sales, particularly in perimeter categories of grocery stores. It highlights Tyson's performance and growth in these areas, providing insights for stakeholders interested in retail strategies and market positioning.
Retail, Tyson, Grocery, Sales, Market Analysis, Growth
false
Tyson is advantaged in the perimeterBarclays Global Consumer Staples Conference
Multiple Chart
Barclays
View slide
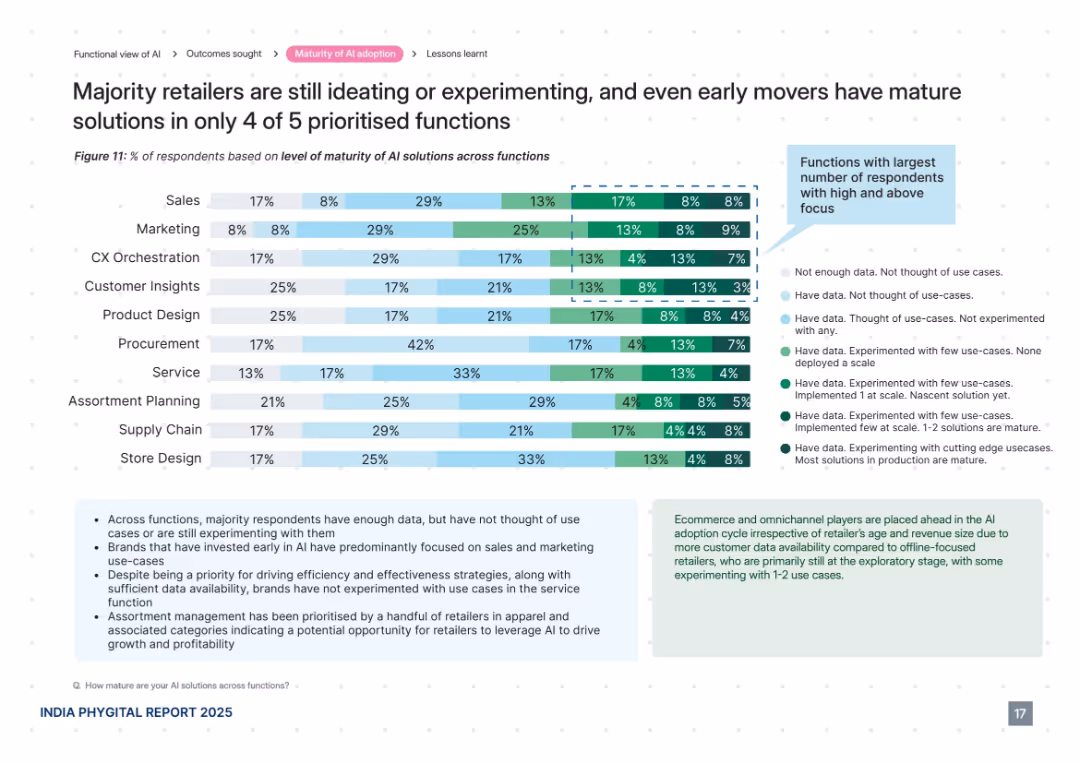
Horizontal bar chart with 10 AI functions, color-coded by level of maturity. Informational text boxes explain insights and patterns. Clean, data-heavy design with a right-aligned legend.
Technology and Digital Transformation
Retail & E-commerce
This slide analyzes the maturity levels of AI adoption across various retail functions, revealing that most brands are still experimenting or ideating. Only a few functions such as sales and marketing show mature solutions. The visual compares ten functions and explains trends in AI data usage and implementation, highlighting areas of opportunity and early adoption.
AI maturity, retail functions, experimentation, early adoption, customer insights, data use, sales, marketing, CX, assortment planning
false
Majority retailers are still ideating or experimenting, and even early movers have mature solutions in only 4 of 5 prioritised functionsAI in Retail
Mixed Chart
PwC/Strategy&
View slide
It features a line chart with multiple data series showing core inflation rates over two decades for the US, Eurozone, and UK. The slide has a white background with minimal design elements.
Market Analysis and Trends
Financial Services
Presenting a longitudinal view of core inflation trends, this slide is instrumental in understanding persistent inflation across various economies. It's valuable for financial analysts and economists for long-term planning and policy development, especially considering recent spikes in the inflation data.
Core Inflation, Trend, US, Eurozone, UK, Long-Term, Finance, Policy, 2023
false
But core remains sticky everywhereGuide to the Markets
Single Chart
JP Morgan
View slide
Central circular diagram surrounded by text blocks that emphasize the bank's strengths, with a background of a global map.
Strategic Planning
Financial Services
This slide emphasizes the longstanding global reach and comprehensive services of the bank, portraying it as a reliable financial partner through various market cycles, geared towards future client needs with robust financial strategies.
Heritage, Global, Strategy, Financial Services, Client Needs, Market Cycles, Future
false
Building on our heritage Your Global HausbankAccelerated execution of Global Hausbank strategy to drive returns
Framework
Deutsche Bank
View slide
Graphs and bulleted lists detailing the impact of privacy concerns on consumer behavior and the shift toward first-party data strategies, with a global comparison of data privacy concerns.
Technology and Digital Transformation
Retail & E-commerce
Discusses the implications of privacy concerns and the phaseout of third-party cookies on data capture strategies and digital marketing practices.
Data Privacy, Third-party Cookies, Consumer Behavior, First-party Data, Privacy Regulations, Marketing Strategy, Global Trends, Ad Blockers, Data Strategy, Digital Trust
false
Privacy concerns and the expiration of 3P cookies present a challenge, prompting a focus on first- & zero-party data and data partnershipsBCG Executive Perspectives: The Future of Sales and Marketing is Here
Header Horizontal
BCG
View slide
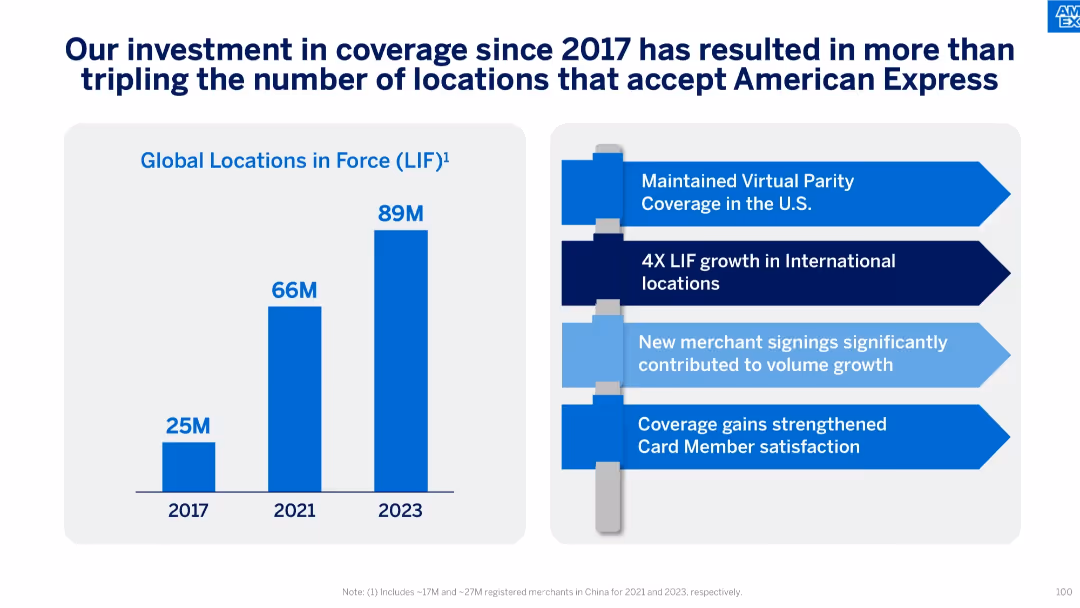
Bar chart (left) showing global LIF growth and a bullet list (right) with strategic initiatives and outcomes.
Operational Efficiency
Financial Services
This slide emphasizes the expansion in Global Locations in Force (LIF) from 25M in 2017 to 89M in 2023. It outlines strategic outcomes like virtual parity in the U.S., 4x growth internationally, and improved cardholder satisfaction.
LIF, Global Locations, Coverage, Strategy, Virtual Parity, International Growth, Merchant Signings
false
Our investment in coverage since 2017 has resulted in more than tripling the number of locations that accept American ExpressAmerican Express Investor Day 2024
Mixed Chart
McKinsey
View slide
The slide includes various charts and graphs depicting changes in workplace dynamics, such as remote work percentages and engagement metrics.
Organizational Structure and Change
Professional Services
It discusses changes in the strategic procurement team's working environment, engagement, retention, diversity, and gender balance.
Workplace dynamics, remote work, engagement, retention, diversity, gender balance, procurement
false
Teaming and Ways of Working are changingExcellence in Procurement
Multiple Chart
Kearney
View slide
Slide with title and subtitle, utilizes a puzzle graphic as a metaphor for critical components of disciplined underwriting. Also, features two column charts showing approval rates and card NCO rates based on deposit relationships.
Risk Assessment and Management
Financial Services
This slide could be used to illustrate the advantages of deepened banking relationships in risk management. It uses underwriting as a case study to show how customer data from non-card relationships can inform better risk decisions, with graphical data supporting the claims.
Risk Management, Underwriting, Banking Relationships, Data Utilization, Customer Data, Deposit Relationships, Approval Rates, Financial Services, Card NCO Rates, Chase
false
Deepened relationships give us unique risk management advantagesConsumer & Community Banking 2019
Mixed Chart
JP Morgan
View slide
Presents a line graph tracking the increase in social media hashtags for home hobbies, supported by a prominent quote.
Market Analysis and Trends
Retail & E-commerce
Analyzes the stabilization of market interests in home-based hobbies, indicating a sustained engagement in these activities beyond the immediate reaction to global events.
Home hobbies, Market stabilization, Social media trends, Hashtags increase, Engagement continuity, Line graph, Market interests
false
New hobbies from home continue as markets stabilizeHow is COVID-19 changing the retail consumer?
Multiple Chart
Accenture
View slide
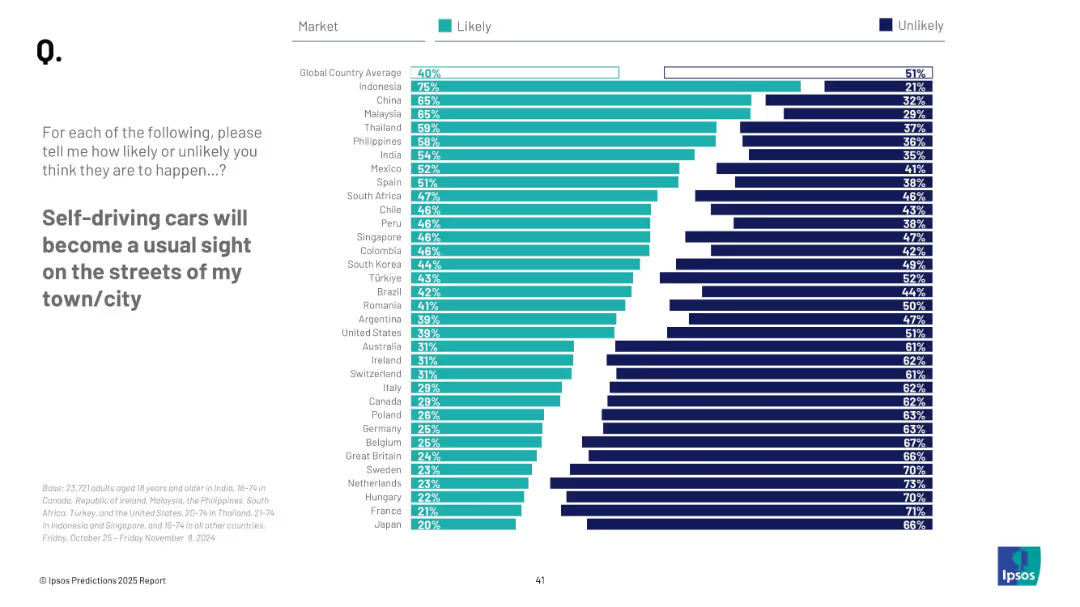
Horizontal bar chart; similar design as previous slide; country ranking with percentages, “Likely” vs “Unlikely”
Technology and Digital Transformation
Transportation & Logistics
This slide visualizes global sentiment on the mainstream emergence of self-driving cars. Indonesia, China, and Malaysia lead in optimism, with 40% global average expecting it likely.
autonomous vehicles, transportation, public opinion, technology, self-driving cars, urban planning, mobility, innovation, survey
false
Self-driving cars will become a usual sight on the streets of my town/cityPREDICTIONS 2025 REPORT
Mixed Chart
IPSOS
View slide
Includes a radial diagram and small charts, with detailed annotations regarding the potential value of digital initiatives in the electricity industry.
Technology and Digital Transformation
Energy & Utilities
Explores potential digital initiatives for the electricity industry, emphasizing their impact over the next decade on the industry and society.
digital transformation, electricity industry, future initiatives, societal impact, technology benefits, industry value
false
Future horizons: digital themes and initiativesWorld Economic Forum Digital Transformation Initiative: In collaboration with Accenture
Mixed Chart
Accenture
View slide
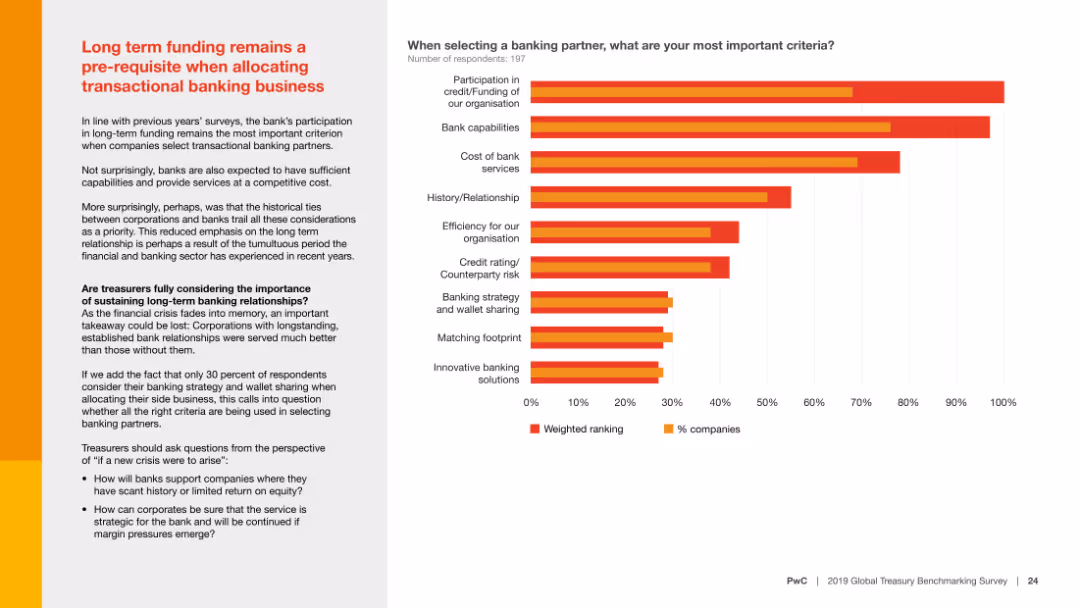
Includes two pie charts showing the frequency of core and secondary bank relationship reviews. Text explains the importance of systematic reviews.
Operational Efficiency
Financial Services
Highlights the lack of regular review of bank relationships by treasurers, suggesting systematic, scheduled reviews to enhance service and future readiness.
Bank relationships, review, frequency, systematic, treasurers
false
Long term funding remains a pre-requisite when allocating transactional banking businessDigital Treasury-It takes two to tango 2019 Global Treasury Benchmarking Survey
Mixed Chart
PwC/Strategy&
View slide
The slide compares two aspects: market trends and defense budgets across different regions, using a map and red text boxes. A red outline frames the slide's main message.
Market Analysis and Trends
Industrial & Manufacturing
Analyzes defense market trends and budget growth to identify commercial opportunities. It provides a global outlook on market potential and the company’s position in it. This slide is likely used in market analysis and strategic planning sessions.
Defense Market, Trends, Commercial Opportunities, Budget Growth, Strategic Planning
false
Growing commercial opportunities driven by positive defence market trends as well as our domestic and international strengthsGoldman Sachs Investor Meeting
Boxed
Goldman Sachs
View slide
Features a column charts with a key findings section to the left. The chart displays the efforts in recruitment, education, and reskilling due to generative AI's impact. The colors green and teal denote different levels of expertise.
Human Resources and Talent Management
Technology & Software
The slide assesses efforts made by organizations in preparing their workforce for the advent of generative AI. It emphasizes the proactive steps taken in hiring, educating, and reskilling employees and compares these efforts with the perceived expertise in generative AI within the organizations.
generative AI, recruitment, education, reskilling, workforce, efforts, expertise, preparation
false
Against this backdrop, some respondents reported making a high or very high effort to: recruit and hire technical talent to drive their generative AI initiatives (42%), educate the workforce about generative AI (40%)Insights from the leading edge of generative AI adoption
Mixed Chart
Deloitte
View slide
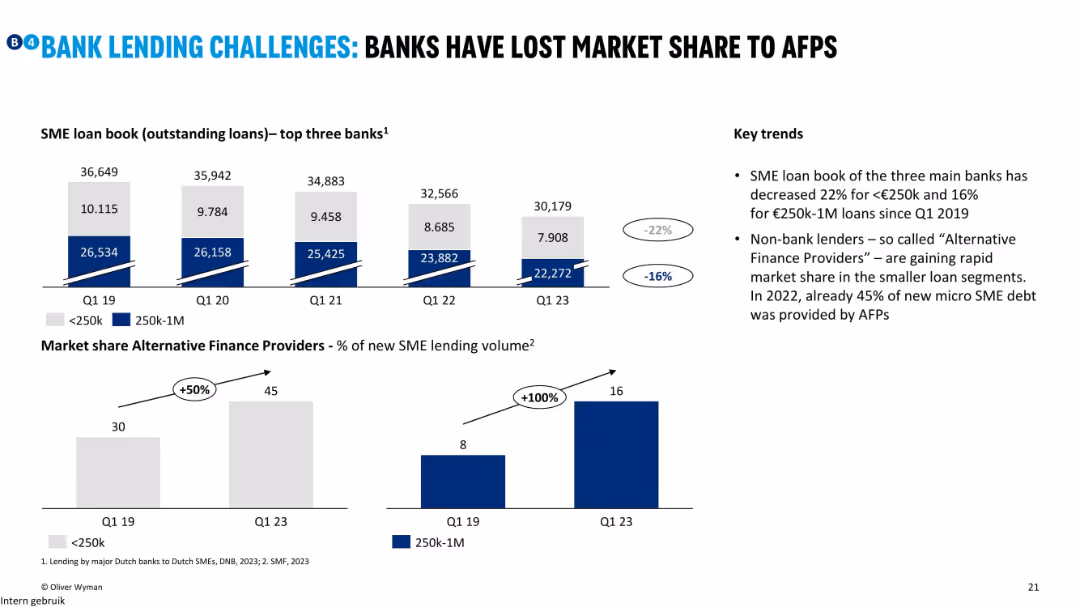
Bar charts showing declining SME loan book at major Dutch banks and rising AFP market share; annotations highlight % change.
Competitive Landscape
Financial Services
The slide tracks how Dutch banks have lost SME loan market share to Alternative Finance Providers (AFPs), especially in smaller loans. AFPs now provide 45% of new micro-SME loans, doubling their share since 2019.
AFP, SME loans, NL, banks, market share, non-bank lending, micro loans
false
BANK LENDING CHALLENGES: BANKS HAVE LOST MARKET SHARE TO AFPSCreating the best SME Debt finance ecosystem
Multiple Chart
Oliver Wyman
View slide
The slide includes a large orange circle graph depicting the comparison of reserves, production, and resources in gigatonnes of oil equivalent. It also features a smaller circle graph and several bar graphs showing percentages of various fossil energy types like coal, oil, and natural gas.
Industry Overview
Energy & Utilities
This slide highlights the vast difference between the production and the reserves and resources of fossil fuels in 2015. It breaks down production, reserves, and resources into types like hard coal, lignite, and crude oil. This is useful for analyzing the sustainability and future availability of these energy sources.
fossil fuels, reserves, production, resources, energy
false
The reserves and resources of fossil energy products are huge compared to the production of energyRoland Berger Trend Compendium 2030: Megatrend 3 Scarcity of resources
Mixed Chart
Roland Berger
View slide
Includes bullet points on unsecured debt, a column chart comparing benchmark and preferred stock issuance against maturities, and another chart depicting liability management actions. The text details expectations and actions regarding unsecured debt management.
Financial Performance
Financial Services
Analyzes the firm's unsecured debt strategy, detailing the benchmark issuance, the mix of funding sources, and planned liability management actions. It provides insight into the expectations for the fiscal year regarding unsecured debt and the strategic issuance of benchmark debt.
unsecured debt, benchmark issuance, funding strategy, liability management, column chart
false
Unsecured Debt Benchmark Issuance and GuidanceFixed Income Investor Presentation
Mixed Chart
Goldman Sachs
View slide
The slide includes a column chart comparing container packing costs per tonne between Australia, Ukraine, and Canada, along with contextual notes.
Market Analysis and Trends
Transportation & Logistics
The slide compares container packing rates in Australia, Ukraine, and Canada, explaining the reasons behind the higher costs in Australia and their implications for the logistics industry.
Container packing, Australia, Ukraine, Canada, cost comparison, transportation, logistics, market analysis
false
Australian container packing rates are c.40% higher than Canada’s and comparable with the Ukraine’sInternational Comparison of Australia’s Freight and Supply Chain Performance
Mixed Chart
LEK
View slide
This slide shows a series of column charts comparing the share of quantum patents by country and technology type (QT, QC, QComms, QS). Each chart lists countries such as China, Japan, EU, USA, and others.
Market Analysis and Trends
Technology & Software
The slide highlights the dominance of Chinese companies in obtaining QT patents across various technology types. It compares the patent shares of different countries and provides key takeaways on global patent trends.
QT, Patents, China, Technology, Countries
false
Over half of QT patents have been granted to Chinese companies.Quantum Technology Monitor
Multiple Chart
McKinsey
View slide
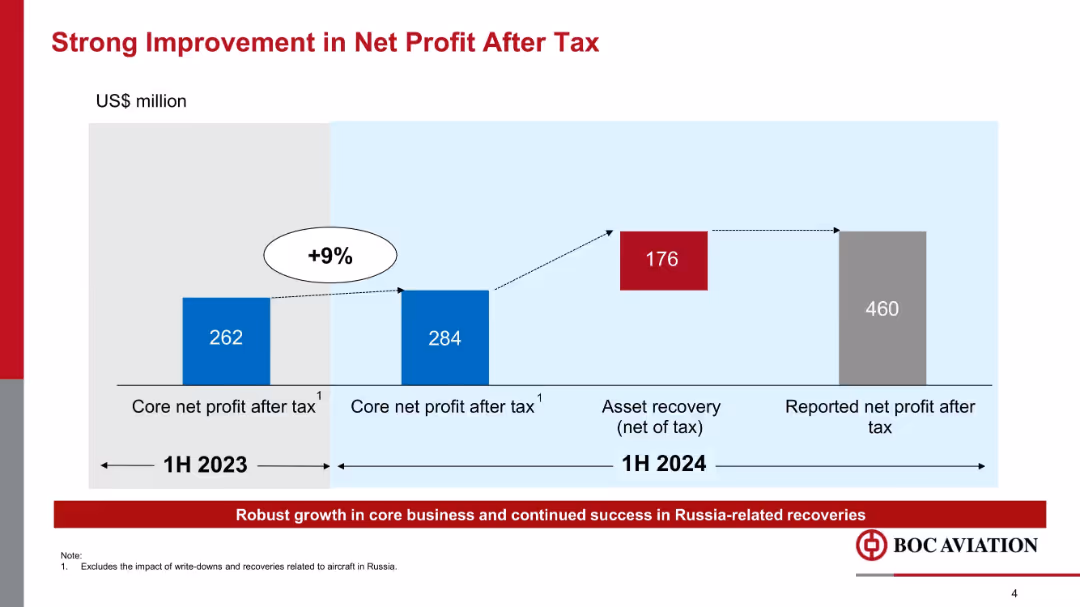
Step-style bar chart showing progression of core net profit and total reported profit, color-coded with % increase indicator.
Financial Performance
Transportation & Logistics
The slide presents a 9% increase in core net profit after tax from 1H 2023 to 1H 2024, along with additional gains from asset recovery related to Russia, resulting in a significantly higher reported net profit of $460 million.
net profit, core earnings, asset recovery, financial growth, Russia, BOC Aviation, 1H2024, profitability
false
Strong Improvement in Net Profit After TaxGoldman Sachs 2024 Aircraft Leasing Conference
Single Chart
Goldman Sachs
View slide
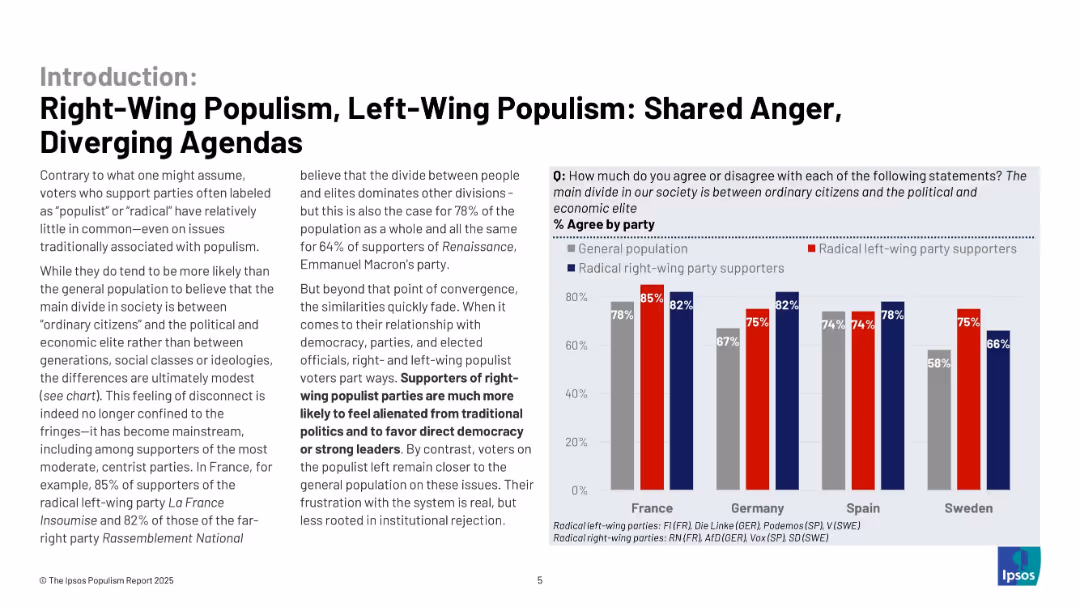
Text and bar chart comparing belief in a society divided between elites and ordinary citizens by political ideology and country.
Customer and Market Segmentation
Government & Public Sector
The slide compares agreement levels with the belief that society is divided between elites and citizens across France, Germany, Spain, and Sweden, broken down by political orientation. Both radical right and left show high agreement.
populism, elites, democracy, left-wing, right-wing, public sentiment
false
Right-Wing Populism, Left-Wing Populism (Chart 1)THE IPSOS POPULISM REPORT 2025
Mixed Chart
IPSOS
View slide
Text, percentage circles, and a table showing employee and employer views on DEI actions and their most important actions to improve diversity, equity, and inclusion.
Human Resources and Talent Management
Professional Services
This slide addresses how hybrid work and addressing rewards can enhance diversity, equity, and inclusion (DEI) efforts, detailing survey results on actions to improve DEI from both employee and employer perspectives.
DEI, hybrid work, employee views, employer views, diversity, equity, inclusion
false
Hybrid work and addressing rewards can advance approaches to diversity, equity and inclusionEY Work Reimagined 2022 Survey
Multiple Chart
EY
View slide
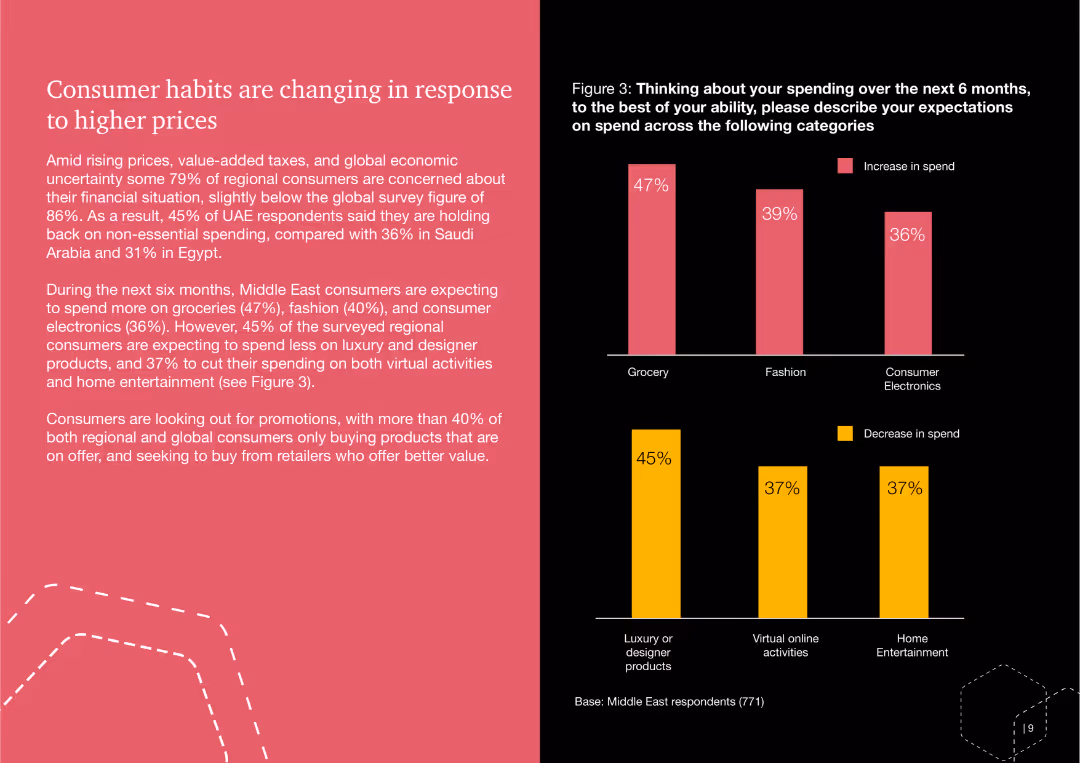
This slide features a bar chart showing the expected increase and decrease in consumer spending across various categories like groceries, fashion, and consumer electronics. The slide also includes a text description summarizing consumer concerns.
Market Analysis and Trends
Consumer Goods
The slide discusses changing consumer habits in the Middle East due to higher prices, predicting spending trends over the next six months in categories such as groceries, fashion, and electronics.
consumer, habits, spending, prices, groceries, fashion, electronics, Middle East
false
Consumer habits are changing in response to higher pricesInflation and rising prices shape a new hybrid Middle East consumer
Multiple Chart
PwC/Strategy&
View slide
Column chart showing the percentage of consumers who research content online before watching, across OTT, movie studios, and LTV.
Customer and Market Segmentation
Media & Entertainment
This slide presents data on consumer behavior, indicating that over 60% of consumers research content online before deciding to watch, with digital touchpoints.
consumers, research, content, digital, touchpoints
false
60%+ consumers seek out information about content before deciding to watchSeeing the BIG Picture
Mixed Chart
BCG
View slide
The slide features a bubble chart showing the importance of various factors in campaign performance, with audience targeting and ad creative being the most critical.
Market Analysis and Trends
Professional Services
This slide highlights the critical role of audience targeting in campaign performance, showing its significant impact compared to other factors like ad creative and data quality.
audience targeting, campaign performance, ad creative, data quality, marketing
false
Audience targeting is critical in positively influencing campaign performanceEra of alignment
Mixed Chart
Nielsen
View slide
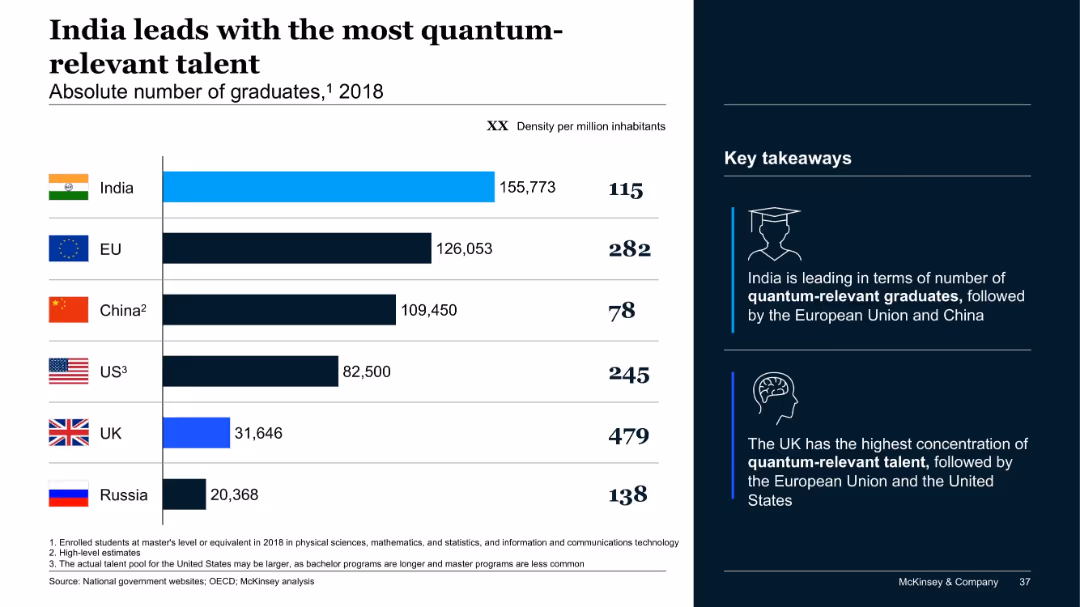
Bar chart showing graduate counts and population density; key takeaways highlighted with icons; bold headers; minimalist styling.
Human Resources and Talent Management
Artificial Intelligence
This slide reveals India's lead in quantum-relevant graduates by absolute numbers, with the EU and China following. The UK has the highest concentration per capita. It reflects both volume and density of emerging talent across key nations.
quantum talent, graduates, India, EU, China, UK, education, McKinsey, density
false
India leads with the most quantumrelevant talentThe Quantum Technology Monitor September 2021
Mixed Chart
McKinsey
View slide
Bar chart, pie chart, multiple text callouts and company boxes at the bottom; dark background with bright accents; structured into segments and highlights.
Mergers and Acquisitions
Technology & Software
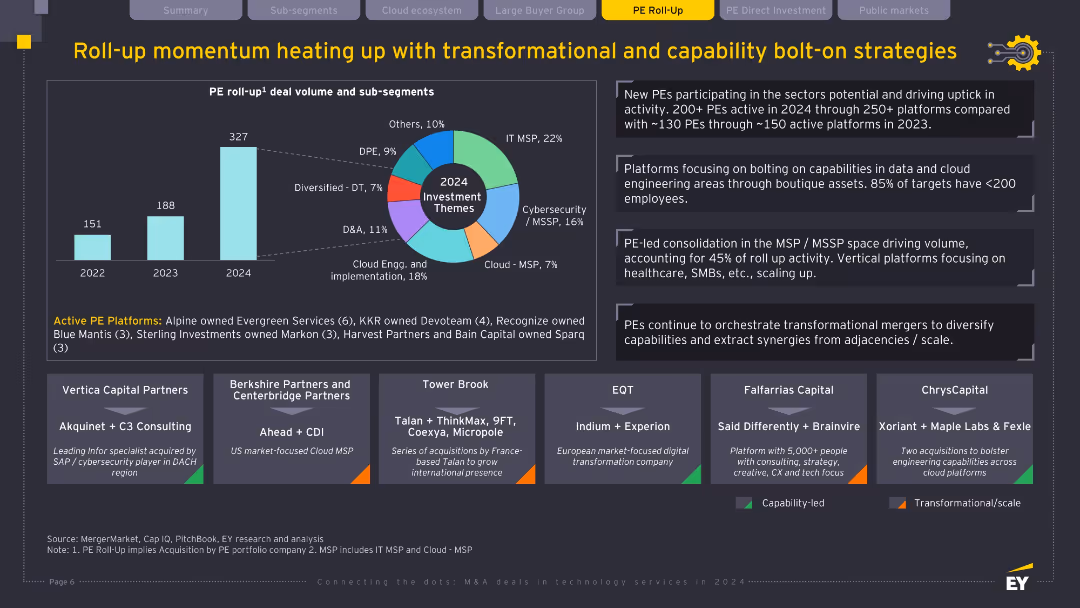
The slide illustrates the acceleration of PE roll-up deals, particularly in the IT MSP and cybersecurity segments. It outlines 2024 investment themes, details top PE platforms and notable acquisitions, and highlights the strategic focus on transformation and data/cloud capabilities. It also emphasizes the increasing involvement of new PE firms and preference for small targets (<200 employees).
PE roll-up, MSP, bolt-on strategy, cybersecurity, cloud, data engineering, transformation
false
Roll-up momentum heating up with transformational and capability bolt-on strategiesConnecting the dots: M&A deals in technology services in 2024
Multiple Chart
EY
View slide
This slide uses text blocks and icons to depict strategies for using M&A to improve core business functions, move into adjacent markets, and create new business segments. It features logos of notable companies to illustrate examples of each strategy.
Strategic Planning
Financial Services
Outlines how M&A is strategically used to enhance company offerings, enter new markets, and create innovative business models. It emphasizes the role of M&A in corporate strategy with practical examples from well-known companies.
M&A, Strategy, Business Improvement, New Markets, Innovation, Companies
false
The role of M&A in realizing the corporate strategyHow to gain value from M&A
Diagram
Deloitte
View slide
Contains three circular graphs illustrating financial benefits of AI in banking, showing improvements in productivity, revenue growth, and return on equity.
Financial Performance
Financial Services
Details projected financial benefits for banks adopting AI, emphasizing significant gains in productivity, revenue growth, and return on equity, suitable for financial strategy discussions.
AI adoption, financial projections, banking, productivity, revenue growth
false
Our latest financial projections indicate that the gains over the next three years will be substantial for the early adopters:The age of AI: Banking’s new reality
Pillar
Accenture
View slide
The slide features column charts displaying total investments, deal types, and deal sizes within the real estate sector across different quarters. The charts use distinct colors to differentiate quarters.
Market Analysis and Trends
Financial Services
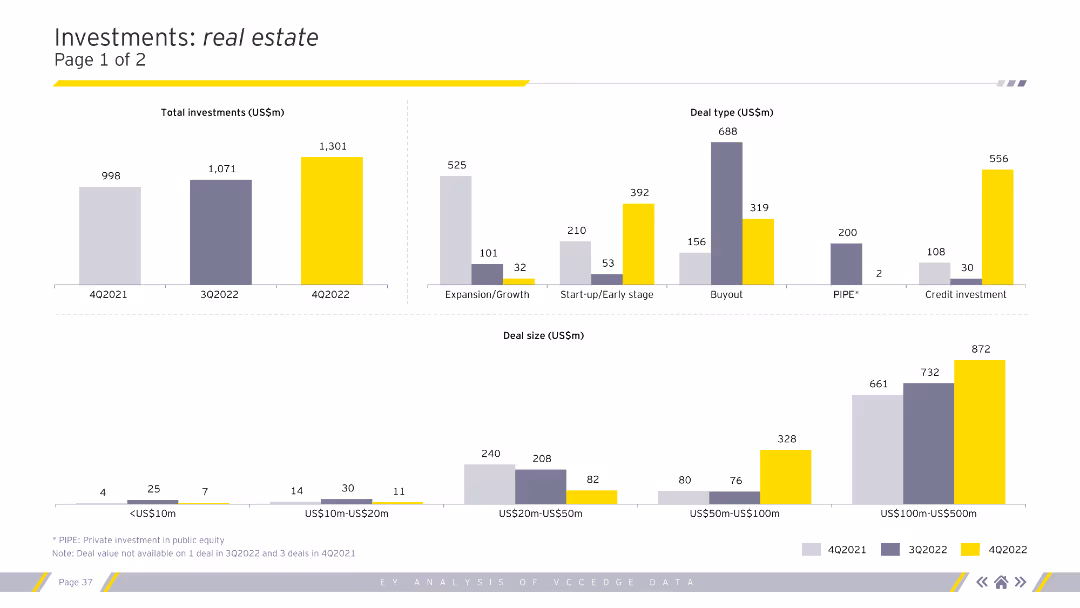
This slide focuses on real estate investments, providing detailed information on total invested amounts, types of deals, and sizes, essential for analyzing real estate investment trends.
Real estate, investments, deal types, deal sizes
false
Investments: real estatePage 1 of 2Is private equity rewriting what value means? Explore the emergence of NextWaveprivate equity and its impact on the economy and society
Multiple Chart
EY
View slide
The slide features a column chart detailing necessary changes to manage risks associated with digital asset strategies, highlighting risk management and technology-related changes.
Risk Assessment and Management
Financial Services
This slide identifies necessary changes for managing risks associated with digital asset strategies, emphasizing the importance of risk management-related changes and enhanced employee training.
digital assets, risk management, column chart, changes
false
Figure 20: The significance of talent risk to banksSeeking stability within volatility: How interdependent risks put CROs at the heart of the banking business
Multiple Chart
EY
View slide
Dual-axis line and bar chart shows EP vs. EBITA index. Text discusses investor sentiment and valuation pressures.
Investment Analysis
Retail & E-commerce
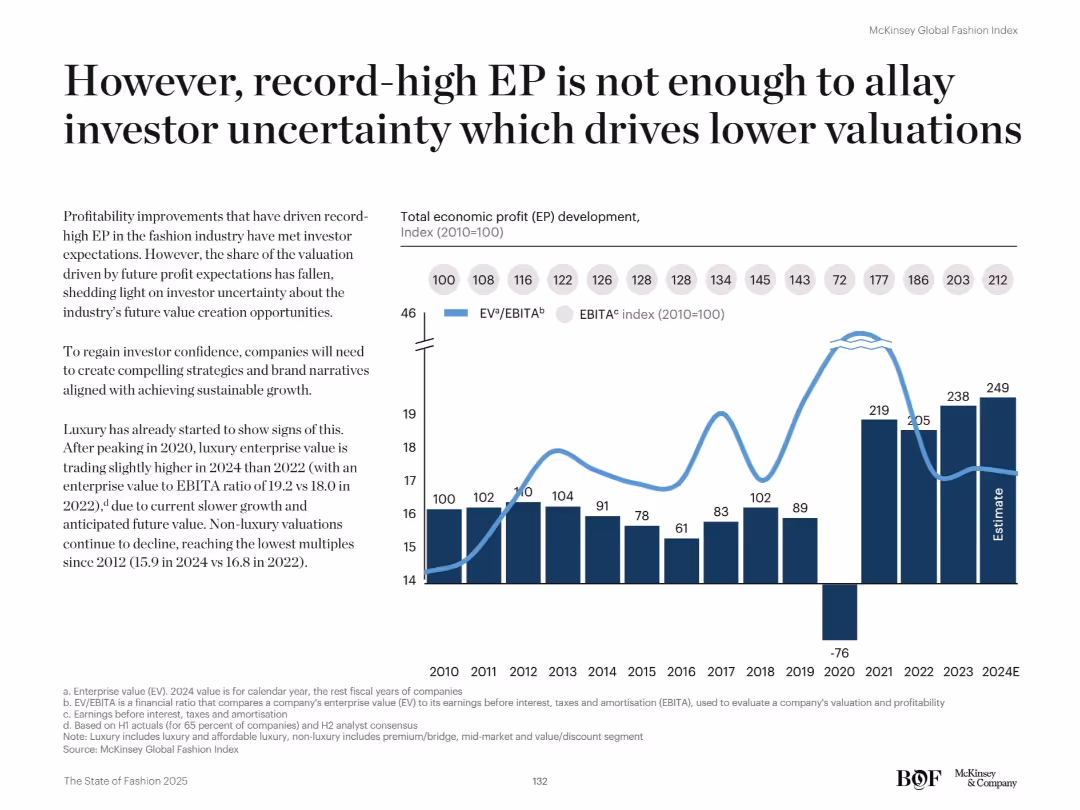
Despite strong EP performance, the fashion industry faces declining valuations due to investor concerns about future growth. The chart compares EP trends with EBITA ratios, revealing a drop in valuation multiples since 2020.
Valuation, investor sentiment, EBITA, economic profit, fashion finance, capital markets, growth outlook, luxury, profitability, EV/EBITA
false
However, record-high EP is not enough to allay investor uncertainty which drives lower valuationsThe State of Fashion 2025
Mixed Chart
McKinsey
1
...
Next
Load More
Hold On!
We are searching in our database
If nothing, comes up, please try different filters!
Create a FREE account to continue browsing
Receive Instant Access to 1,000+ slides from companies like McKinsey, Google, and Goldman Sachs
First Name
Last Name
Email
Password
I agree to all
Terms & Privacy Policy
Thank you! Your submission has been received!
Oops! Something went wrong while submitting the form.
Have an account?
Sign in
Column Chart
Heatmap
Chevron
Org Chart
Infographic
Callouts
Timeline
List
Graphic
Picture
Process Flow
Diagram
Paragraph
Map
Table
Framework
Subtitle
Takeaway Box
Icon
Other Chart
Radar Chart
Waterfall Chart
Mekko Chart
Pie Chart
Scatter Plot
Line Chart
Bar chart
Bullet points