🎉 Black Friday Sale!
- Save 20% on SlideStart Pro Annual plan! CODE:
BLACKFRIDAY
My Account
My Slides
Search by Category
Templates
View All Templates
Download Template Slides
Leave Feedback
Login
Logout
Get Started
Browse all Slides
Browse all Slides
Create a FREE Account
Instant access to 1,000+ real slides from top companies like McKinsey, BCG, Goldman Sachs, Google and many more!
First Name
Last Name
Email
Password
I agree to all
Terms & Privacy Policy
Thank you! Your submission has been received!
Oops! Something went wrong while submitting the form.
Have an account?
Sign in
Instant access to the internet's best slides
Get access to 40+ advanced filters and more
Advanced Search and Filters
Access to
10,000+ slides
Access to Category Pages
Save/Bookmark Slides
PowerPoint Template Library (New)
Choose your plan
MONTHLY
$12/month
Billed every month, cancel anytime.
YEARLY
$9/month
Billed $108 annually, cancel anytime.
Checkout for $12/month
Checkout for $108/yr
Secured by Stripe | AES-256 bit encryption
Spark Your Next Big Idea with New Presentation Templates
VIEW ALL Templates
Welcome,
Welcome
Upgrade to SlideStart
Pro
Instant access to 15,000+ slides
Show Featured Only
Checkbox 8
Companies
Mckinsey
Bain
BCG
EY
Deloitte
Accenture
PwC/Strategy&
JP Morgan
Goldman Sachs
Morgan Stanley
Citigroup
Deutsche Bank
Barclays
LEK
Kearney
Oliver Wyman
Booz Allen Hamilton
Gartner
IPSOS
Nielsen
Slide type
Header Horizontal
Framework
Vertical Flow
Single Chart
Single Chart
Text Only
Mixed Chart
Header Vertical
Graphic
Pillar
Multiple Chart
Agenda
Title
Table
Linear Flow
Upgrade to SlideStart
Pro
Instant access to 40+ advanced filters
Industry
Upgrade to SlideStart
Pro
Instant access to 40+ advanced filters
Technology
Healthcare
Financial Services
Consumer Goods
Energy & Utilities
Manufacturing
Retail
E-commerce
Logistics
Telecommunications
Real Estate
Professional Services
Education
Media
Entertainment
Hospitatlity
Tourism
Agriculture
Food Production
Government & Public Sector
Environmental
Sustainability
Use Case
Upgrade to SlideStart
Pro
Instant access to 40+ advanced filters
Sales and Business Development
Mergers and Acquisitions
Corporate Finance and Valuation
Performance Metrics and KPIs
Client Case Studies
Competitive Landscape
Product and Service Analysis
Customer and Market Segmentation
Organizational Structure
Human Resources and Talent Management
Industry Overview
Regulatory and Compliance
Risk Assessment and Management
Agriculture & Food Production
Hospitality and Tourism
Government
Environmental
Sustainability
Clear all
Thank you! Your submission has been received!
Oops! Something went wrong while submitting the form.
Show Featured Only
Checkbox 8
Companies
Mckinsey
Bain
BCG
EY
Deloitte
Accenture
PwC/Strategy&
JP Morgan
Goldman Sachs
Morgan Stanley
Citigroup
Deutsche Bank
Barclays
LEK
Kearney
Oliver Wyman
Booz Allen Hamilton
Gartner
IPSOS
Nielsen
Slide type
Text Only
Linear Flow
Vertical Flow
Single Chart
Header Horizontal
Mixed Chart
Header Vertical
Pillar
Multiple Chart
Graphic
Agenda
Title
Table
Framework
Industry
Technology
Healthcare
Financial Services
Consumer Goods
Energy & Utilities
Manufacturing
Retail
E-commerce
Logistics
Telecommunications
Real Estate
Professional Services
Education
Media
Entertainment
Hospitatlity
Tourism
Agriculture
Food Production
Government & Public Sector
Environmental
Sustainability
Use Case
Sales and Business Development
Mergers and Acquisitions
Corporate Finance and Valuation
Performance Metrics and KPIs
Client Case Studies
Competitive Landscape
Product and Service Analysis
Customer and Market Segmentation
Organizational Structure
Human Resources and Talent Management
Industry Overview
Regulatory and Compliance
Risk Assessment and Management
Agriculture & Food Production
Hospitality and Tourism
Government
Environmental
Sustainability
Clear all
Thank you! Your submission has been received!
Oops! Something went wrong while submitting the form.
Tag
View slide
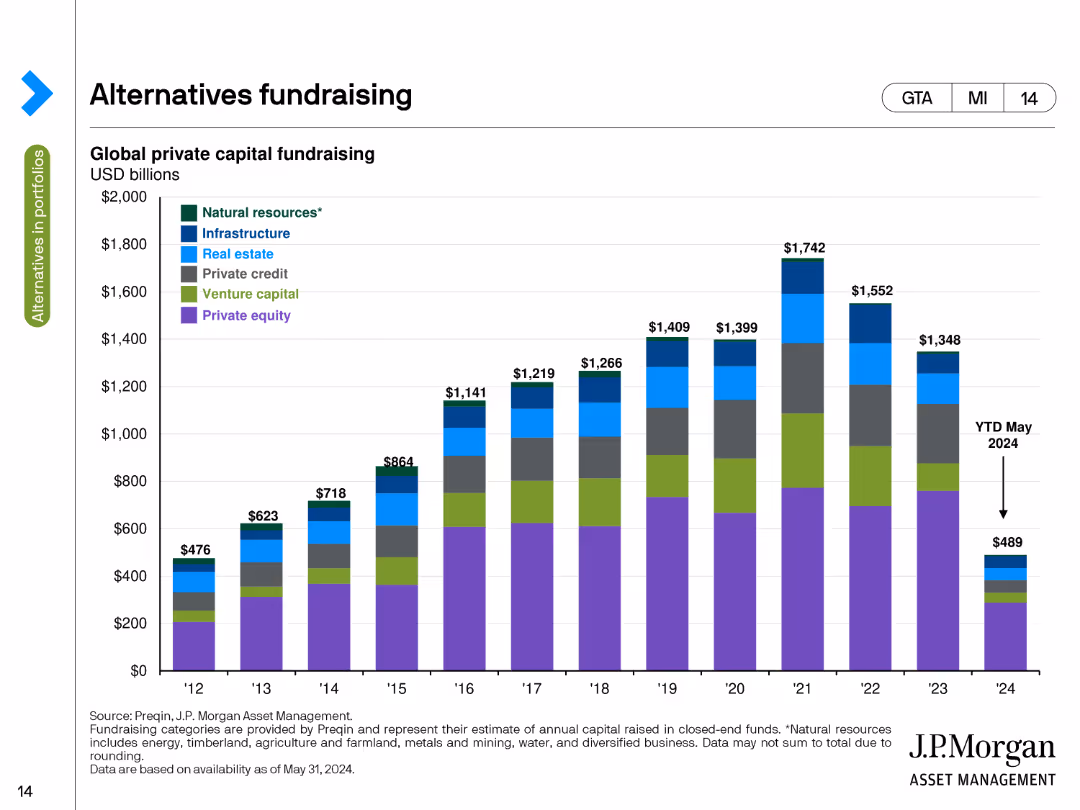
This slide contains a stacked column chart illustrating global private capital fundraising amounts in USD billions from 2012 to 2024. Different colors represent categories like natural resources, infrastructure, and private equity.
Market Analysis and Trends
Financial Services
The slide tracks global private capital fundraising by asset class over time, highlighting the amounts raised annually from 2012 to 2024, with a breakdown by categories such as natural resources, infrastructure, and private equity.
Fundraising, Private Capital, Asset Classes, USD Billions, Trends
false
Alternatives fundraising Global private capital fundraisingGuide to Alternatives
Single Chart
JP Morgan
View slide
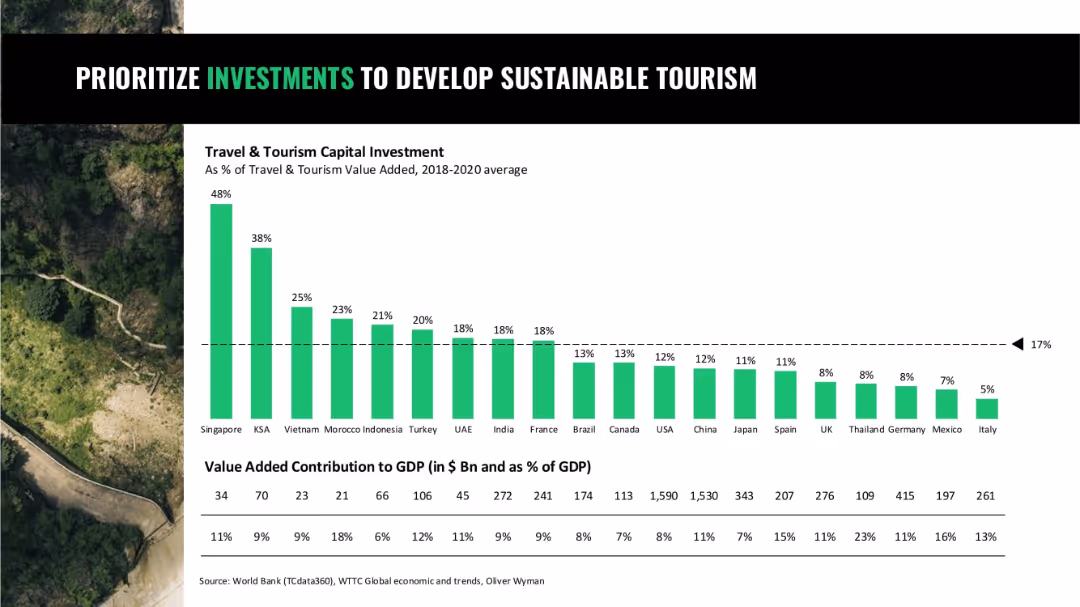
Bar chart comparing travel and tourism capital investment as % of GDP by country; background nature imagery
Strategic Planning
Hospitality & Tourism
A comparison of how countries invest in sustainable tourism relative to GDP, highlighting Singapore, Saudi Arabia, and Vietnam as leaders, and showing a global average benchmark.
tourism investment, sustainable development, travel, capital allocation, GDP share
false
PRIORITIZE INVESTMENTS TO DEVELOP SUSTAINABLE TOURISMOUR 5 URGENT ACTS
Single Chart
Oliver Wyman
View slide
Slide contains three column charts displaying factors affecting regional attractiveness in Île-de-France, Auvergne-Rhône-Alpes, and Hauts-de-France. Red header, white background, blue columns, annotations for data percentages.
Market Analysis and Trends
Government & Public Sector
Analyzes main determinants for regional attractiveness in France, focusing on geographic location, workforce, and infrastructure across three specific regions.
regional analysis, determinants, France, Île-de-France, Auvergne-Rhône-Alpes, Hauts-de-France, workforce, infrastructure, attractiveness
false
Focus on 3 regions | Geographic location, workforce, quality of infrastructure and economic dynamism contribute most to the attractiveness of regionsBAROMETER AmCham-Bain 2024
Multiple Chart
Bain
View slide
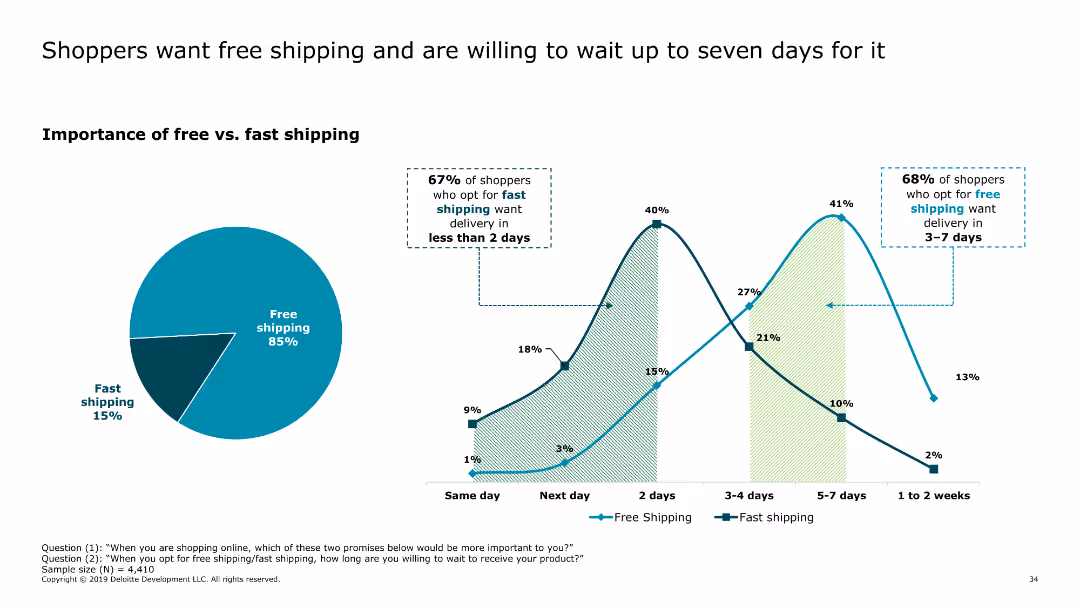
This slide includes a pie chart showing the importance of free versus fast shipping, along with a line chart illustrating delivery time preferences for free and fast shipping options.
Market Analysis and Trends
Retail & E-commerce
The slide highlights consumer preferences for free shipping over fast shipping, with many shoppers willing to wait up to seven days for free delivery. It provides insights into delivery expectations and preferences.
free shipping, delivery preferences, consumer behavior, online shopping, shipping options
false
Shoppers want free shipping and are willing to wait up to seven days for it2019 Holiday Survey of Consumers Keeping the good times rolling
Multiple Chart
Deloitte
View slide
Contains line charts comparing the growth of mobile versus wired internet advertising revenues in India from 2016 to 2025.
Market Analysis and Trends
Media & Entertainment
Explores the shift towards mobile internet advertising in India, noting it as a major growth driver in digital advertising revenues.
mobile advertising, growth driver, India, digital revenue, 2025 forecast, internet advertising
false
… with Mobile continue to be the biggest driver of growthGlobal & Entertainment Media Outlook 2021-2025
Mixed Chart
PwC/Strategy&
View slide
Features bulleted lists, bar graphs, and a mobile app interface highlighting physical and mental health strategies. The slide uses a mix of green and dark tones for visual separation.
Human Resources and Talent Management
Healthcare & Pharmaceuticals
Focuses on workplace safety and mental health management. It covers strategies like stress management, hygiene standards, and mental health training benefits, with a service provider example showing impact on stress and burnout rates.
Employee safety, Mental health, Stress management, Burnout, Hygiene
false
Physical and mental healthCOVID-19 BCG Perspectives Publication #5 with a focus on Revamping Organizations for the New Reality
Header Vertical
BCG
View slide
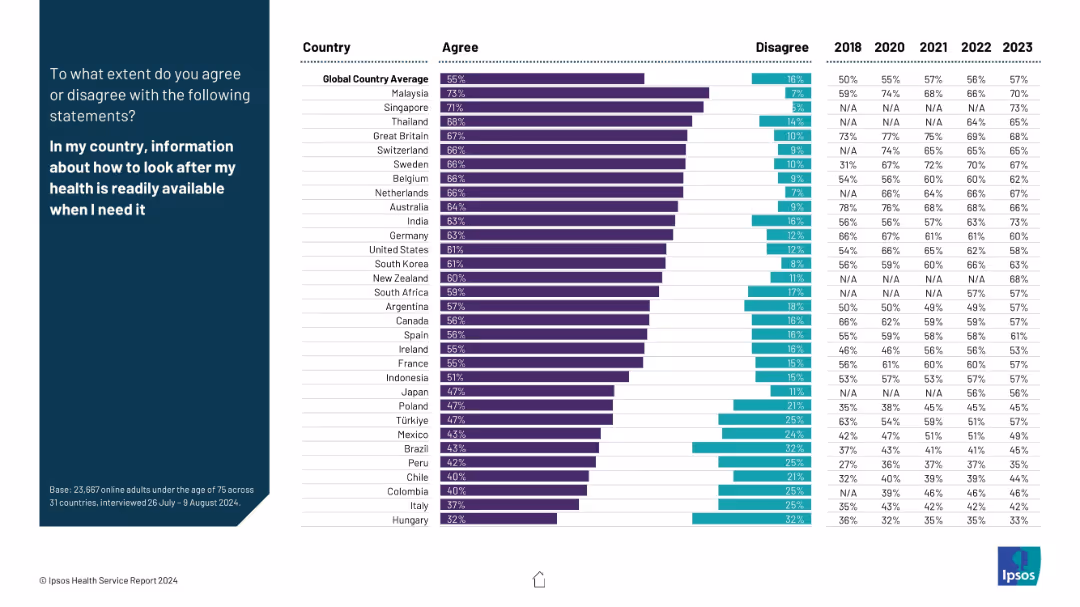
Similar layout as previous; left blue panel with bold white statement, right side includes bar charts showing agreement/disagreement levels across countries with historical comparison data from 2018–2023.
Market Analysis and Trends
Healthcare & Pharmaceuticals
This slide illustrates public perception across countries on whether health-related information is readily available. It includes agreement levels and five-year trend data, reflecting access to health literacy and public health communication efficiency.
health information, availability, literacy, awareness, survey, trends, public opinion, countries, Ipsos, access
false
Information about how to look after my health is readily availableIPSOS HEALTH SERVICE REPORT 2024
Mixed Chart
IPSOS
View slide
Contains a large green area chart showing the relative impact of public health measures, virus monitoring, and vaccines over time throughout 2021.
Strategic Planning
Healthcare & Pharmaceuticals
Analyzes the steps required to defeat the pandemic by Q3 2021 through a multi-phase approach, focusing on public health measures, virus monitoring, and vaccine rollout.
pandemic, recovery, public health, monitoring, vaccines
false
Fast recovery scenario: Defeating pandemic by Q3 2021 will require balancing multiple interventions across Three ActsCOVID-19 BCG Perspectives State of the World
Mixed Chart
BCG
View slide
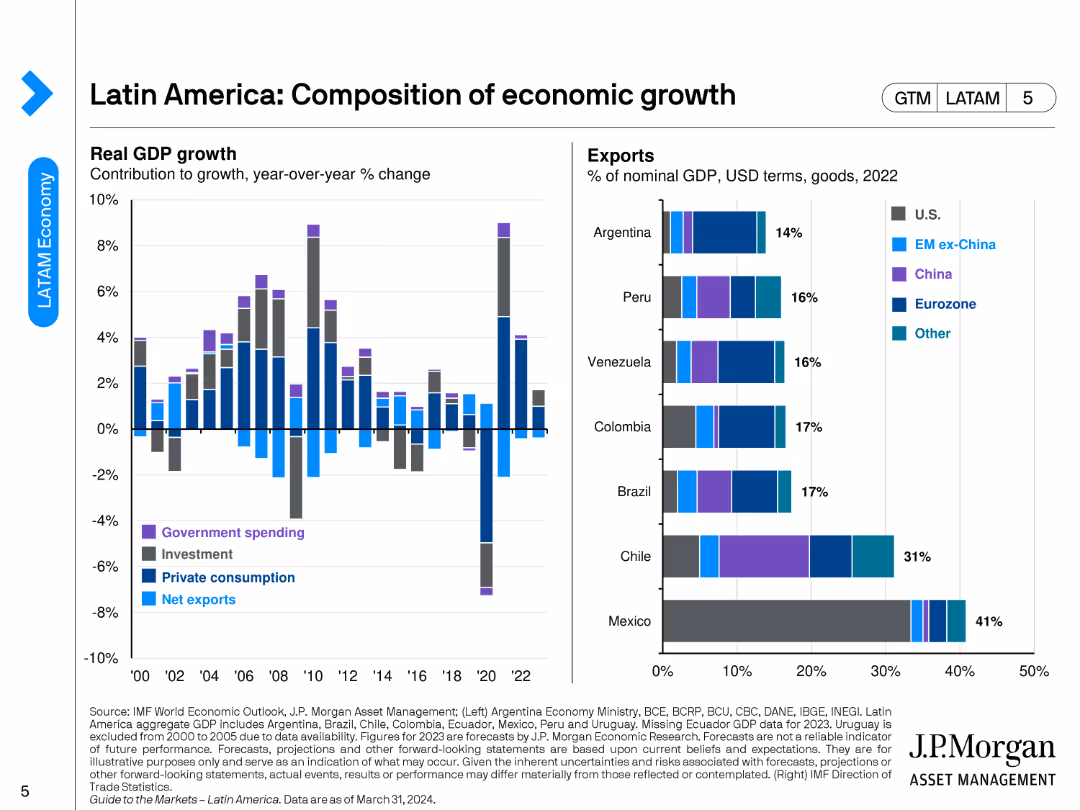
The slide contains a bar chart displaying the composition of GDP growth (government spending, investment, private consumption, net exports) and a stacked bar chart showing exports by country and region (U.S., EM ex-China, China, Eurozone, Other).
Market Analysis and Trends
Financial Services
This slide breaks down the components of GDP growth in Latin America, along with an analysis of export contributions by country and region.
GDP growth, Latin America, exports, economic composition, trade
false
Latin America: Composition of economic growthGuide to the Markets Latin America | 2Q 2024
Multiple Chart
JP Morgan
View slide
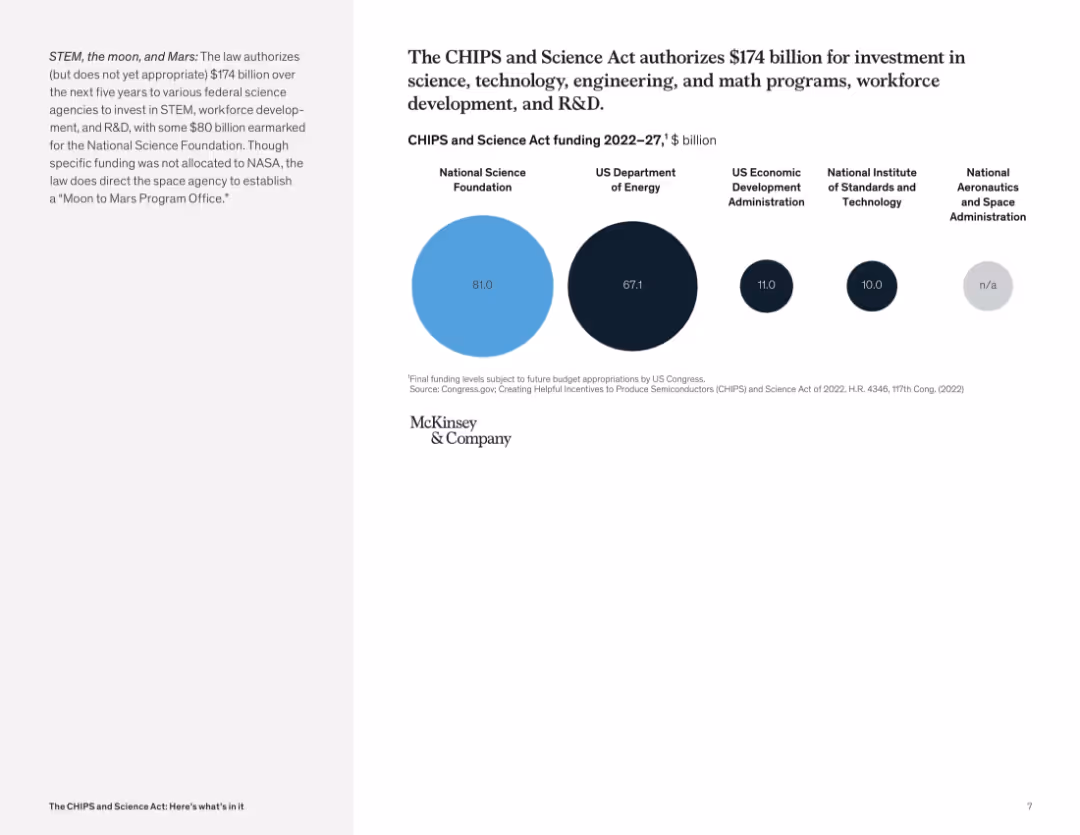
Simple circular infographic with bubble sizes indicating allocated amounts to different agencies; clean and minimalist visual design.
Strategic Planning
Government & Public Sector
The slide outlines the $174B in authorized but not yet appropriated funds over five years for various federal science agencies. It emphasizes funding for STEM, workforce development, and the NSF, with additional mentions of energy and space initiatives.
STEM, CHIPS Act, science funding, workforce development, NSF, DOE, federal budget, R&D, NASA
false
The CHIPS and Science Act authorizes $174 billion for investment in science, technology, engineering, and math programs, workforce development, and R&D.The CHIPS and Science Act: Here’s what’s in it
Mixed Chart
McKinsey
View slide
Features a large central image with three text sections on the sides, focusing on challenges and discussions around digital trust.
Technology and Digital Transformation
Telecommunications
Details the debates regarding stakeholder expectations, data and privacy regulation, and risk area identification.
digital trust, stakeholder expectations, privacy regulation, risk identification
false
What are some topics of debate related to the trend?McKinsey Technology Trends Outlook 2022 Trust architectures and digital identity
Header Vertical
McKinsey
View slide
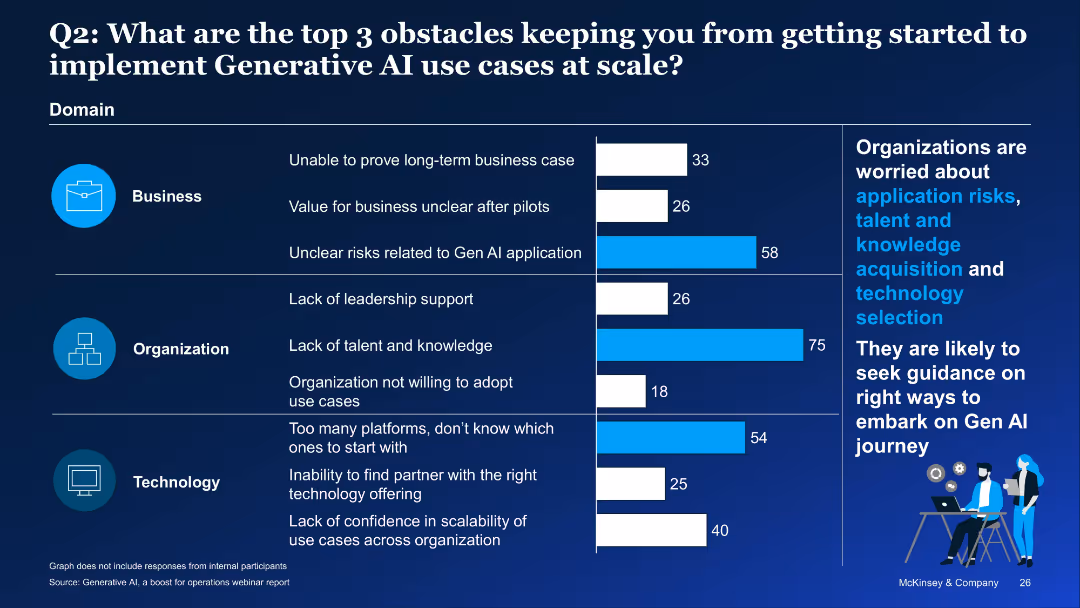
Bar chart by domain (Business, Organization, Technology), dark theme with callouts on right
Strategic Planning
Artificial Intelligence
This survey slide outlines the top three barriers to GenAI adoption: risk uncertainty, lack of talent, and platform complexity. It emphasizes organizations’ need for guidance on navigating these issues to scale AI effectively.
GenAI adoption, barriers, risks, talent shortage, tech selection, survey, scaling
false
Q2: What are the top 3 obstacles keeping you from getting started to implement Generative AI use cases at scale?Generative AI: A boost for Operations
Mixed Chart
McKinsey
View slide
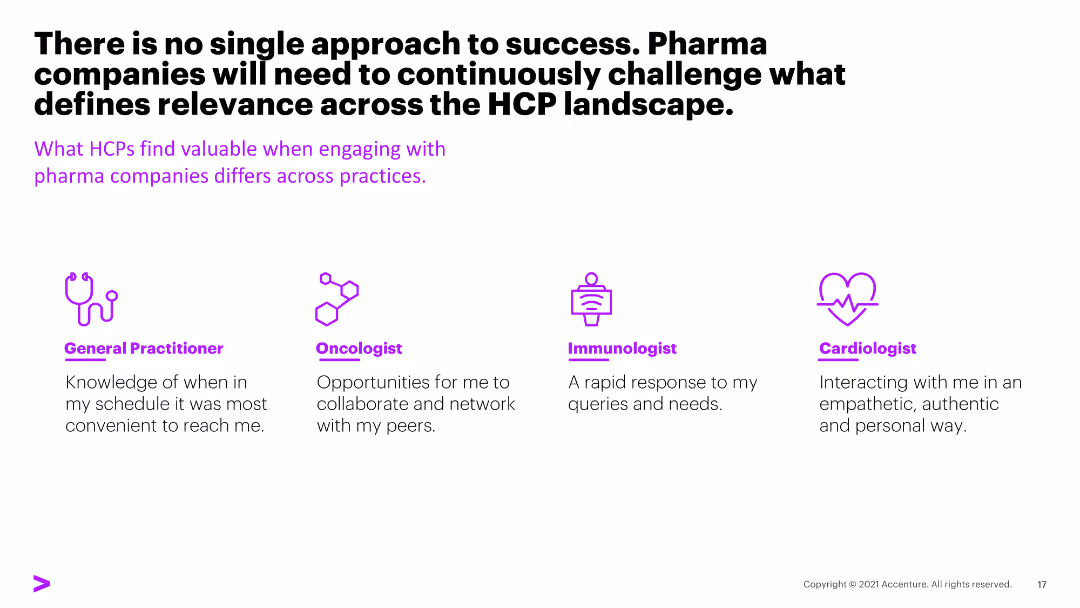
The slide features text with four icons representing different healthcare practitioners and their preferred engagement methods with pharma companies.
Strategic Planning
Healthcare & Pharmaceuticals
The slide emphasizes that engagement strategies with healthcare professionals (HCPs) need to be tailored to their specific practice areas, highlighting varied preferences.
engagement, HCPs, strategies, pharma, preferences
false
There is no single approach to success. Pharma companies will need to continuously challenge what defines relevance across the HCP landscape.The "new" rules of engagement
Pillar
Accenture
View slide
Features split design with icons: potential of AI on the left, challenges of AI adoption on the right.
Technology and Digital Transformation
Technology & Software
Highlights AI's potential for success and disruptive capability, alongside the challenges faced by organizations in adopting and scaling AI solutions.
AI, leadership, potential, challenges, adoption, success
false
Why should leaders pay attention?McKinsey Technology Trends Outlook 2022 Industrializing machine learning
Text Only
McKinsey
View slide
Bar chart with horizontal bars ranked by country, placed on a clean white background; explanatory text and title in a blue left-hand panel.
Market Analysis and Trends
Government & Public Sector
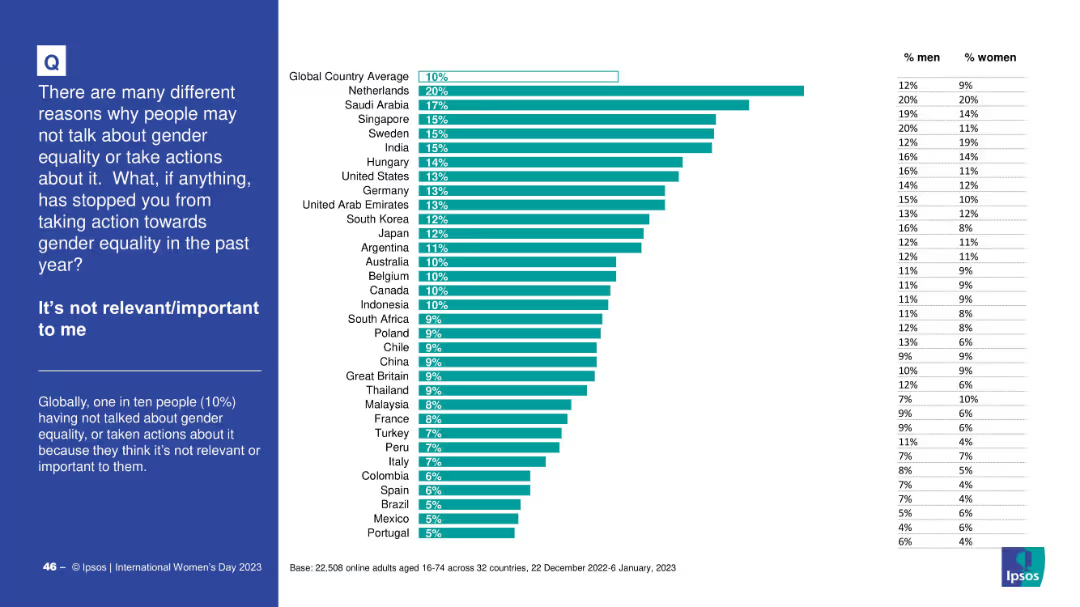
The slide visualizes the percentage of people in different countries who did not act on gender equality because they felt it was not relevant to them. The global average is 10%, with country-specific breakdowns and gender splits on the right side.
gender equality, relevance, global average, country comparison, survey, Ipsos, men vs women, attitudes, public opinion
false
It's not relevant/important to meINTERNATIONAL WOMEN'S DAY 2023
Mixed Chart
IPSOS
View slide
Slide with comparative data in bar graph format, emphasizing regional differences in executive confidence and outlook for 2023, using green, red, and gray color scheme.
Market Analysis and Trends
Professional Services
Compares the optimism and confidence among C-suite leaders globally, highlighting regional variations and strategic concerns for 2023.
C-suite, optimism, strategy, 2023, global
false
C suite leaders go into 2023 generally optimistic, but less confident about their company's ability to outperformThe CEO Outlook Caution, Optimism, and Navigating the Road Ahead
Multiple Chart
BCG
View slide
Provides definitions and statistics for various types of migrants, including refugees and internally displaced persons, with clear segmentation.
Market Analysis and Trends
Government & Public Sector
Educates on the complexities of migration and the varying statuses of migrants worldwide.
migration, refugees, IDPs, status, education
false
Migration is a complex topic – Not every migrant has crossed a border, not every immigrant is a refugeeRoland Berger Trend Compendium 2030: Megatrend 1 People & Society
Mixed Chart
Roland Berger
View slide
Features complex column charts and line graphs detailing balance sheet provisions, credit impairment charges, and loan loss rates over multiple years.
Risk Assessment and Management
Financial Services
Provides insights into risk management practices by showing loan loss provisions and impairment charges over time, highlighting financial stability strategies.
risk management, financial stability, loan loss, impairment, credit, balance sheet, provisions, Barclays
false
LLR of 46bps; maintaining through the cycle guidance of 50-60bpsFY 2023 Results Announcement
Multiple Chart
Barclays
View slide
The slide has a dark background with a summary section and a bar chart showing industry presence across regions. It covers various industries such as C&IP, FS, TMT, and more.
Industry Overview
Professional Services
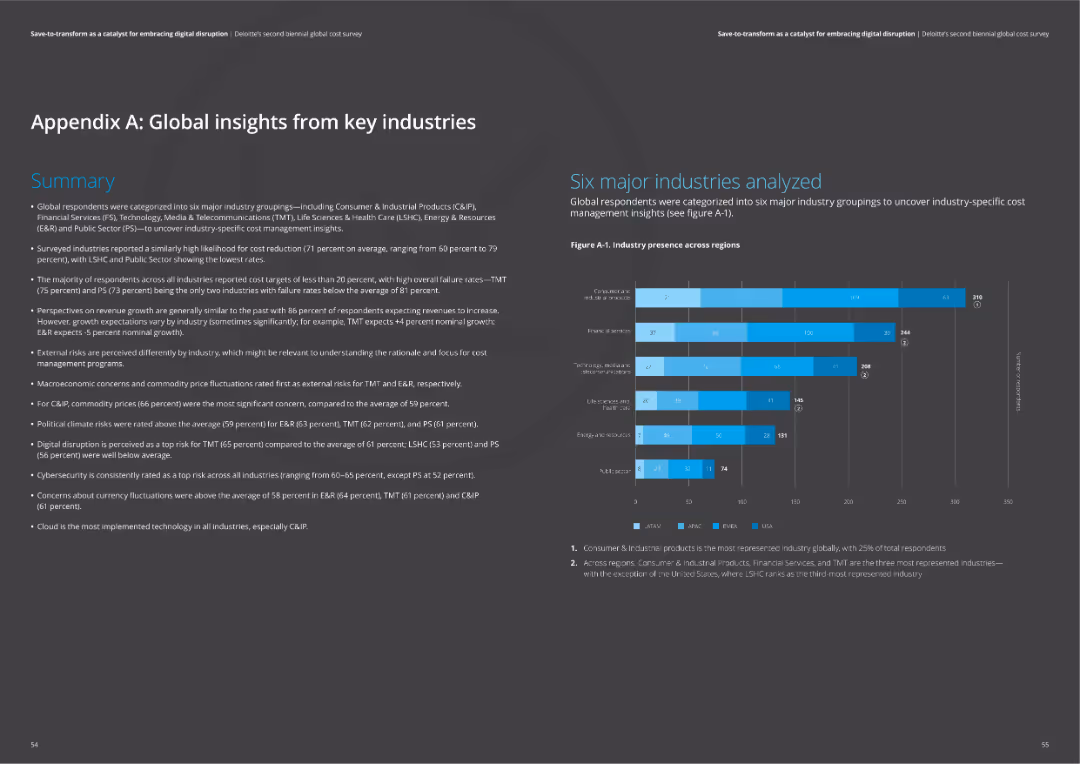
This slide provides a high-level summary of insights from key industries, detailing cost reduction trends and failure rates. It includes comparative data on industry presence and external risks like macroeconomic concerns and commodity prices.
industry insights, cost reduction, failure rates, macroeconomic concerns, commodity prices
false
Appendix A: Global insights from key industriesSave-to-transform as a catalyst for embracing digital disruption Deloitte’s second biennial global cost survey
Mixed Chart
Deloitte
View slide
Another horizontal bar chart presenting RPA adoption in finance/accounting processes such as reconciliations, GAAP reporting, and STAT reporting, with levels indicated by colors.
Operational Efficiency
Financial Services
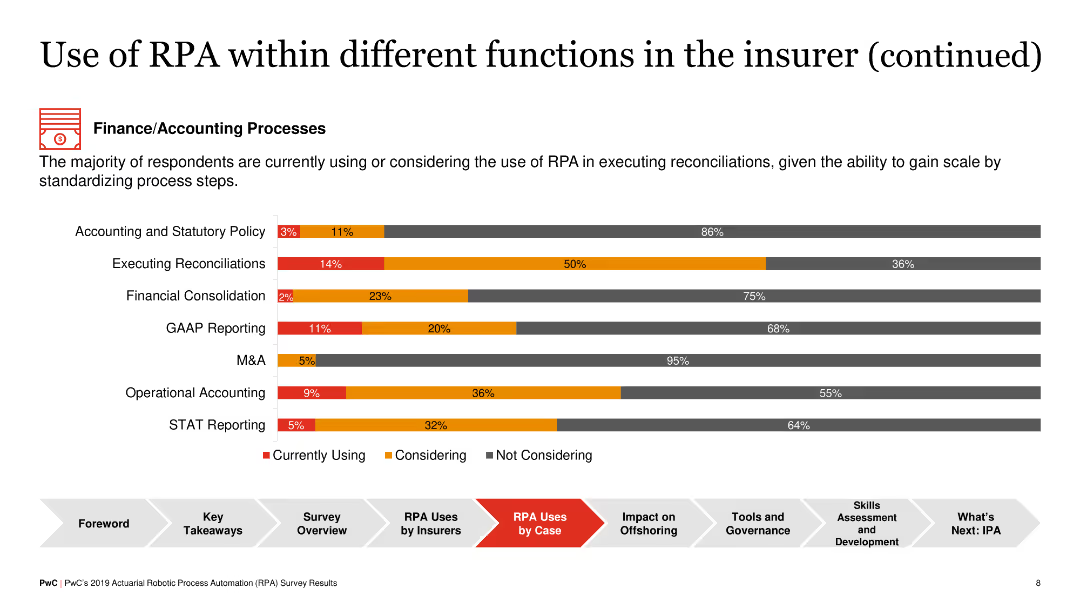
The slide outlines RPA usage in finance and accounting within insurance, showing that tasks like reconciliations and GAAP reporting are increasingly automated, providing efficiencies and standardization benefits.
RPA, Finance, Accounting, Insurance, Reconciliation
false
Finance/Accounting ProcessesPwC’s 2019 actuarial robotic process automation (RPA) survey report
Single Chart
PwC/Strategy&
View slide
Slide includes heatmap comparing preferences among managers in different countries.
Market Analysis and Trends
Professional Services
Analyzes managerial career preferences across various countries, highlighting shifts in career goals.
career progression, management, global trends, preferences, comparative analysis
false
Alternative career progression models are becoming more attractiveBCG – IPSOS study
Table
BCG
View slide
Similar layout to 18861; left-aligned title and question box, right-aligned bar chart with rankings and year-over-year change in positive perception of Iran.
Market Analysis and Trends
Government & Public Sector
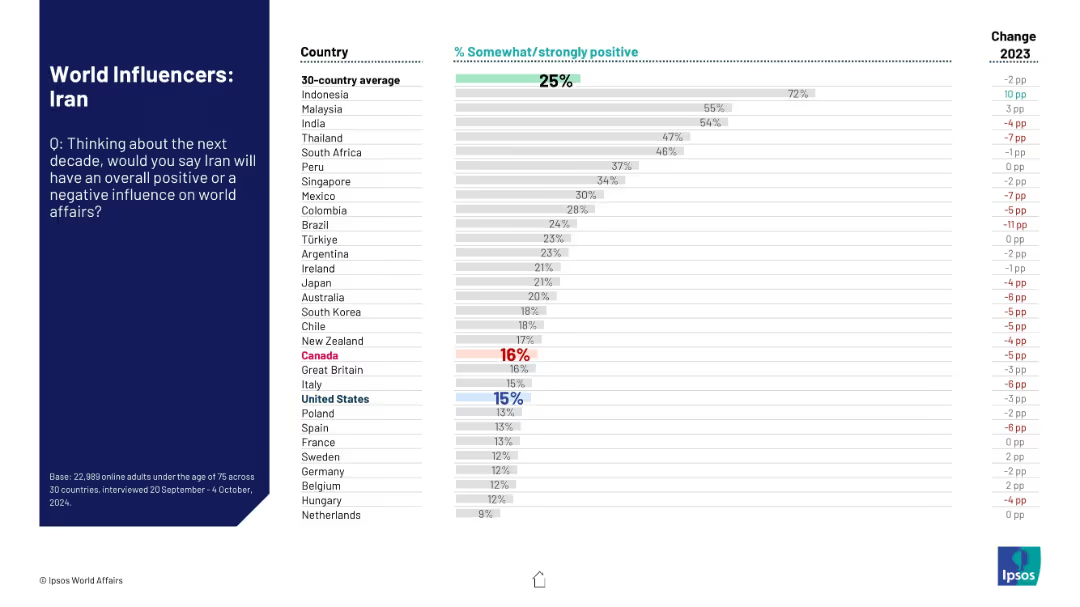
This slide presents public sentiment about Iran’s influence on global affairs over the next decade. Results from 30 countries show a generally negative perception with visual emphasis on declining support across regions.
Iran, global influence, public opinion, perception change, survey, geopolitical, Ipsos, world affairs, rankings, sentiment
false
World Influencers: IranWORLD AFFAIRS
Mixed Chart
IPSOS
View slide
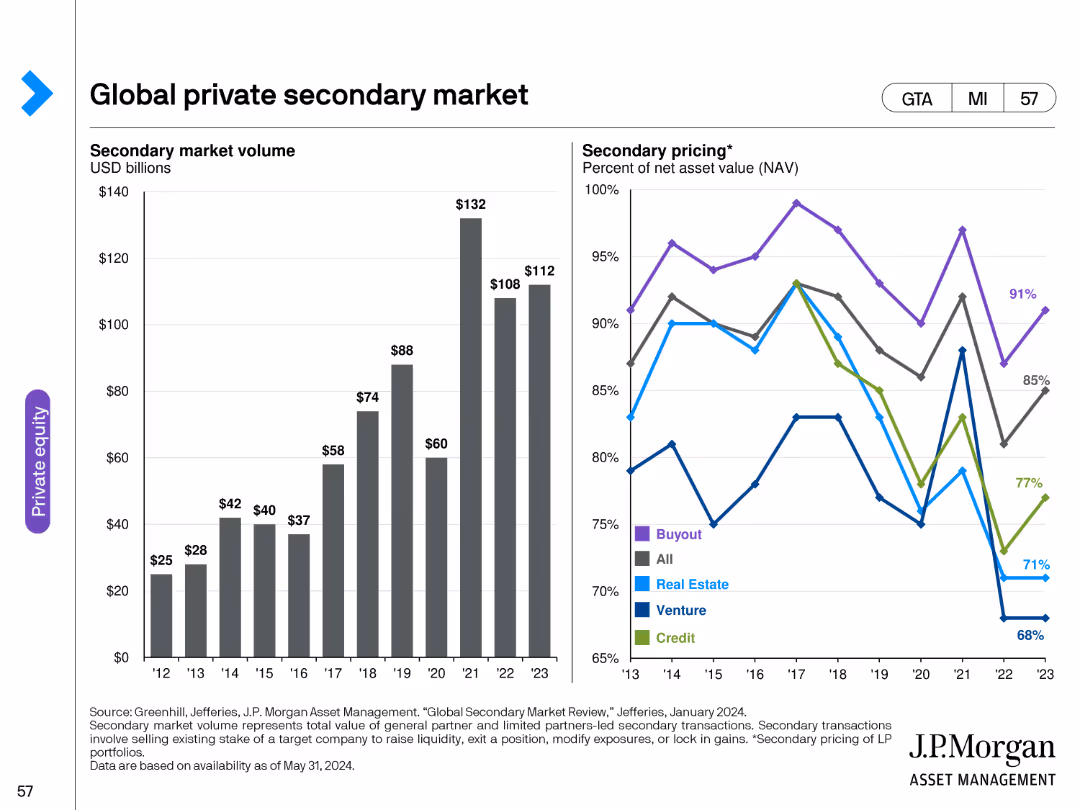
This slide includes a column chart showing secondary market volume and a line chart depicting secondary pricing trends for various investment types.
Market Analysis and Trends
Financial Services
It examines the global private secondary market, providing data on market volume and pricing trends across different types of secondary transactions.
secondary market, global, volume, pricing, trends, investment types, data analysis, financial
false
Global private secondary marketGuide to Alternatives
Multiple Chart
JP Morgan
View slide
The slide features a column chart depicting a reduction in investment bank RWA and LE. It also includes labeled segments showing various market and business adjustments.
Risk Assessment and Management
Financial Services
The slide illustrates the strategy for reducing risk-weighted assets and leverage exposure by about 40% through various strategic initiatives within the investment bank.
investment, risk, RWA, LE, reduction
false
Investment Bank: ~40% reduction in IB RWA and LECredit Suisse 2022 Strategy Update
Single Chart
Credit Suisse
View slide
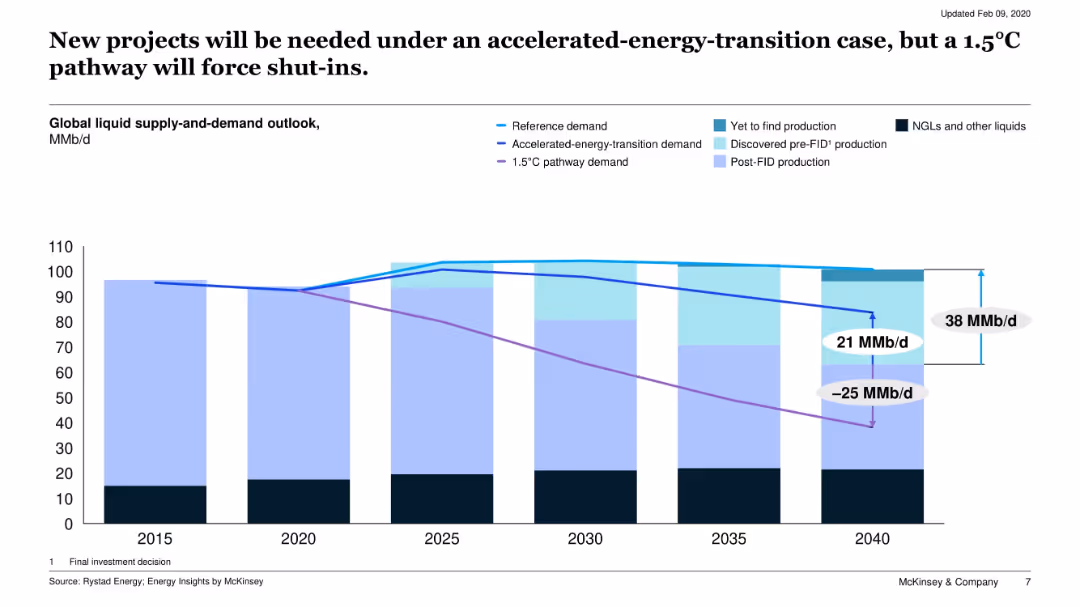
Stacked area chart showing global liquid supply and demand under three scenarios to 2040, highlighting production types and the gap/surplus.
Risk Assessment and Management
Energy & Utilities
The slide assesses oil production under three energy transition scenarios, illustrating potential overcapacity or shortfall, and the effect of climate targets on future supply needs.
energy transition, climate policy, supply-demand gap, 1.5C pathway, oil shut-ins
false
New projects will be needed under an accelerated energy transition case, but a 1.5 C pathway will force shut ins.Global oil outlook to 2040
Single Chart
McKinsey
View slide
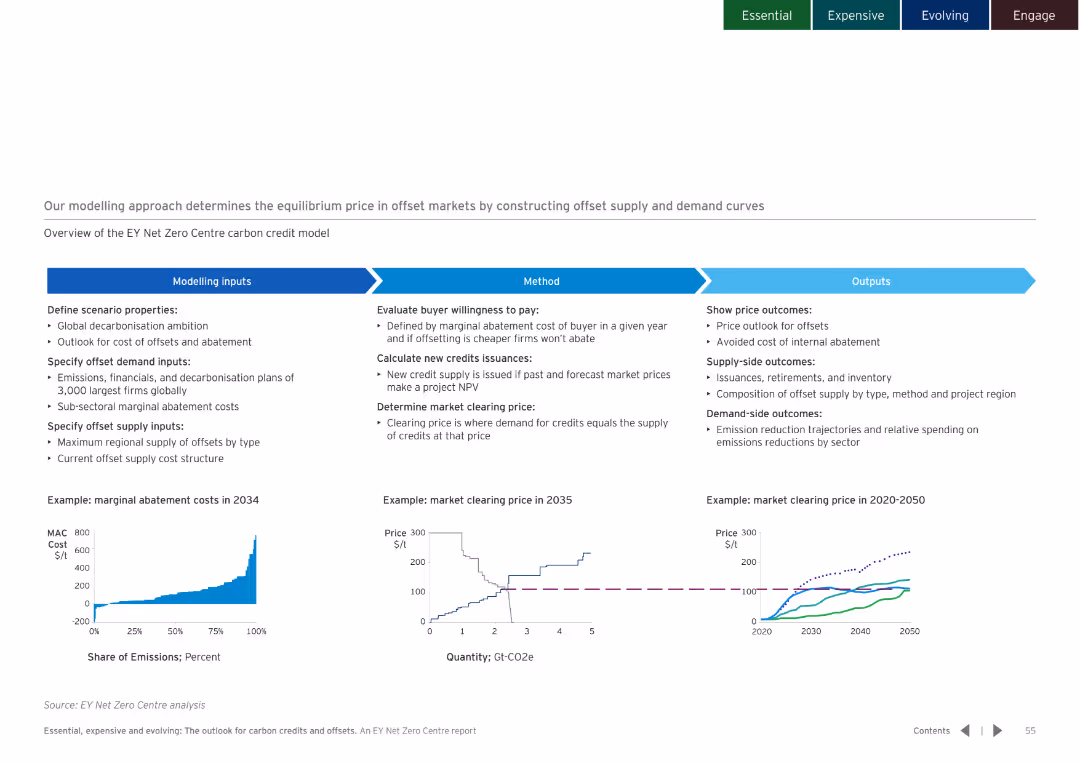
White background with a flowchart explaining the modelling approach, including inputs, methods, and outputs. Charts illustrate key concepts.
Strategic Planning
Environmental Services & Sustainability
Details the modelling approach used to determine the equilibrium price in offset markets, covering inputs, methods, and expected outputs.
equilibrium price, offset markets, modelling approach
false
Our modelling approach determines the equilibrium price in offset markets by constructing offset supply and demand curvesEssential, expensive and evolving: The outlook for carbon credits and offsets
Multiple Chart
EY
View slide
Slide with number 2, a large column chart comparing the percentage of unbanked adults in various countries, with text annotations for additional context.
Market Analysis and Trends
Financial Services
Highlighting financial inclusion issues, this slide compares the proportion of adults without bank accounts in SEA countries to the global average. It focuses on Vietnam, Philippines, and Indonesia, signaling market challenges and opportunities in financial services.
unbanked, SEA, financial inclusion, Vietnam, Philippines, Indonesia, adult population
false
>150m adults 25+ in SEA are unbanked, with >100m existing in Vietnam, Philippines, and Indonesiae-Conomy SEA Unlocking the $200 billion digital opportunity in Southeast Asia
Single Chart
Bain
View slide
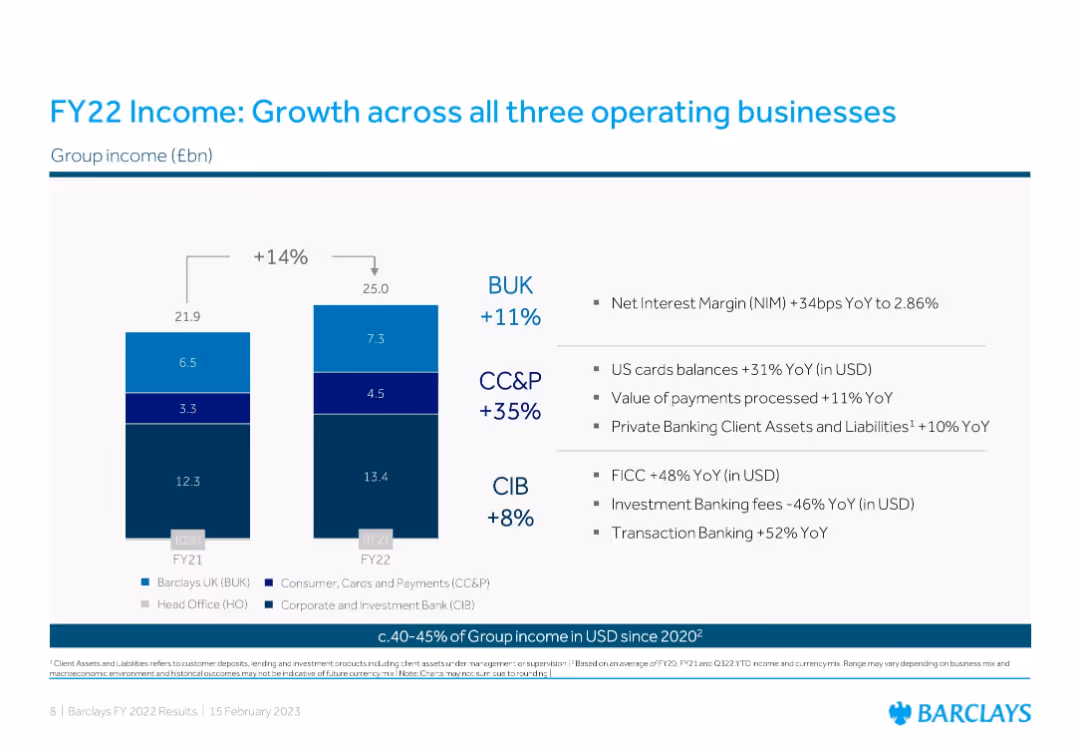
Stacked bar charts + bullet insights; YoY group income growth across BUK, CC&P, and CIB
Strategic Planning
Financial Services
Compares income across three Barclays business units in FY21 vs. FY22 with YoY percentage changes. Bullet points outline business segment growth drivers like US card balances, transaction banking, and FICC performance.
Income Growth, Operating Units, BUK, CC&P, CIB, YoY, Strategy, Revenue, Barclays
false
FY22 Income: Growth across all three operating businessesBarclays PLC FY 2022 Results
Mixed Chart
Barclays
View slide
Features a line chart tracking changes in budget allocation over time, supplemented by insights into industry-specific budgeting.
Human Resources and Talent Management
Professional Services
Reviews trends in marketing budget allocation for training and development, highlighting industry variations and impacts of economic events.
budgeting, marketing, training, COVID-19 impact, industry comparison
false
On average 4% of marketing budgets are devoted to training and development, dropping from pre COVID high of 5.8%The CMO Survey The Highlights and Insights Report February 2022
Mixed Chart
Deloitte
View slide
Clustered bar chart showing consumer behavioral response to perceived price increases by category (e.g., gas, apparel); action types color-coded
Pricing Strategies
Retail & E-commerce
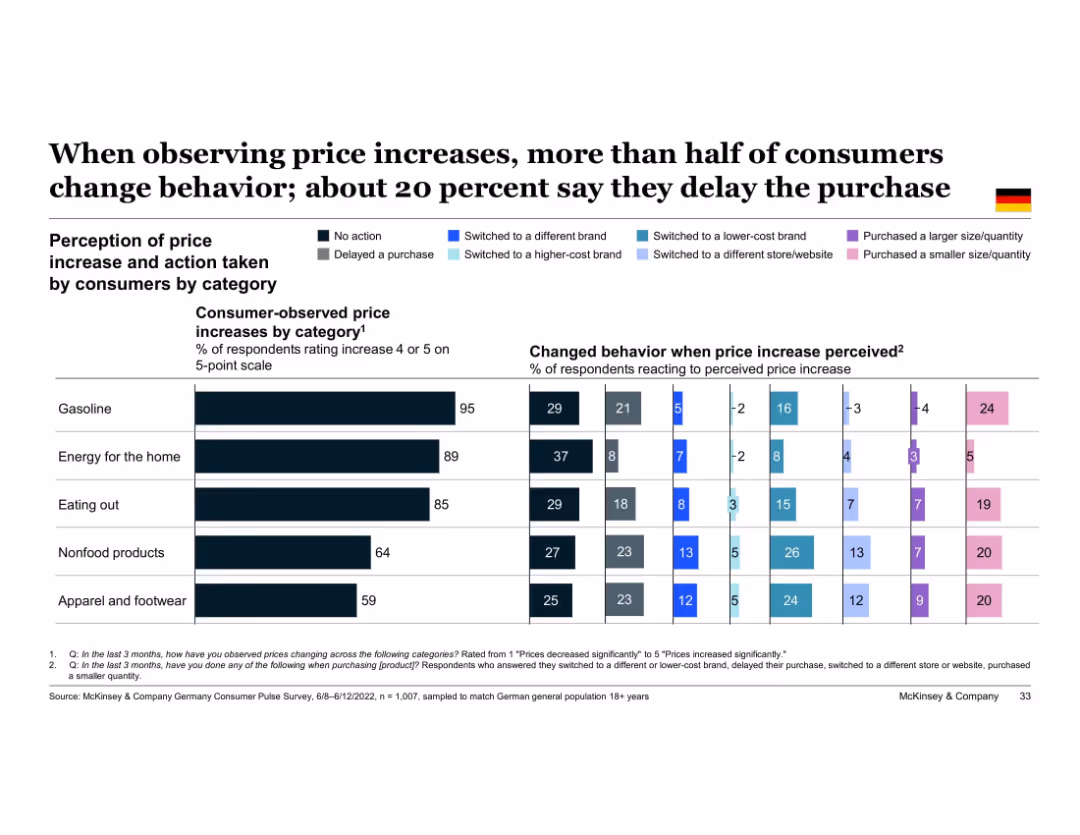
Consumers are highly responsive to perceived price increases. Across categories like gasoline, energy, and food, many switch to lower-cost brands or delay purchases. Delaying purchases is particularly common for gas and non-essentials. The slide emphasizes behavior changes in response to inflationary pressure.
price perception, delayed purchase, inflation response, price sensitivity, category behavior, Germany, consumer change
false
When observing price increases, more than half of consumers change behavior; about 20 percent say they delay the purchaseEuropean Consumer Sentiment Survey: How current events in Europe are shaping consumer behavior
Single Chart
McKinsey
View slide
Includes maps and column charts detailing school connectivity and population distribution across Indonesian regions. Color gradations indicate connectivity levels and population densities, with annotations providing regional data and trends.
Market Analysis and Trends
Education & Training
Details the disparity in school connectivity across Indonesia, with a focus on Sumatra's lag in internet access despite high connectivity in more populated regions like Java. Discusses the implications for educational equity and digital access.
school connectivity, internet access, regional disparity, Sumatra, Java
false
Most of schools are connected already, despite Sumatra still needing more equalization of internet accessIndonesia case study
Multiple Chart
BCG
View slide
The slide features a line chart showing sales index evolution from 2015 to 2019, with CAGR values and EBITDA percentage changes.
Market Analysis and Trends
Retail & E-commerce
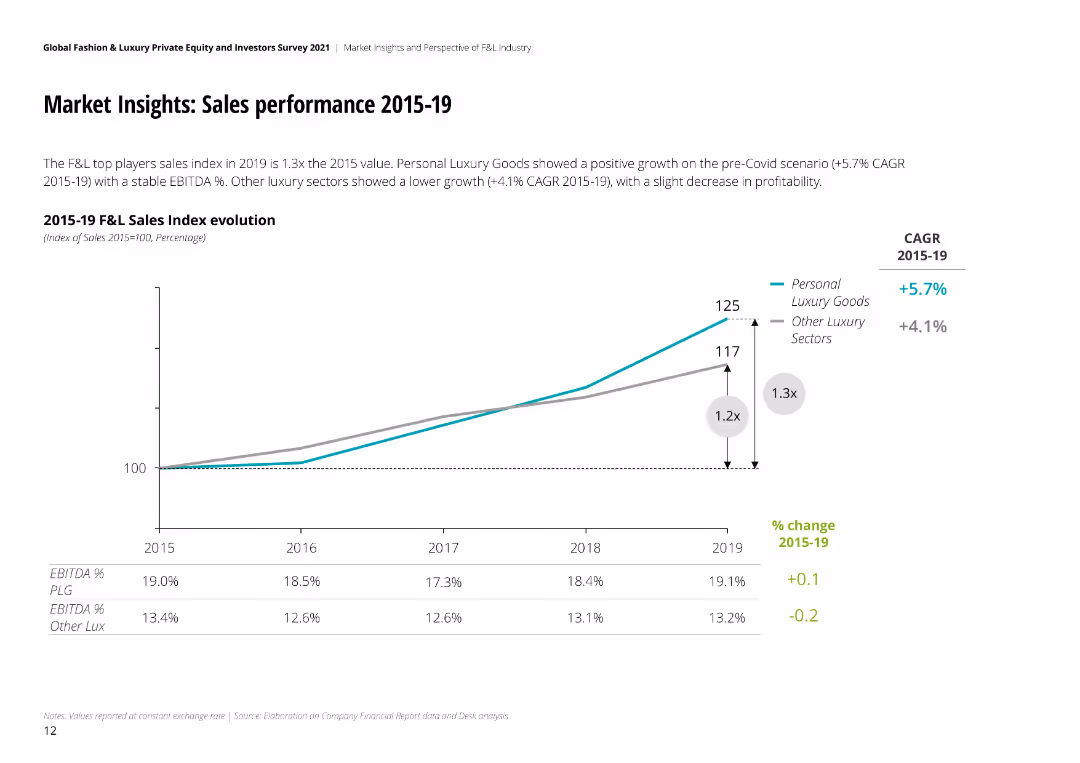
Reviews sales performance in the fashion and luxury market from 2015 to 2019, highlighting growth rates and profitability trends over the years.
sales, performance, market, fashion, luxury, CAGR, EBITDA, growth, profitability
false
Market Insights: Sales performance 2015-19Global Fashion & Luxury Private Equity and Investors Survey 2021
Mixed Chart
Deloitte
View slide
The slide features vertical bar charts comparing survey responses by age groups on their concerns about technology and internet reliance.
Market Analysis and Trends
Technology & Software
The slide presents data showing that younger people are more likely to express concerns about technology and their dependency on the internet.
Technology concerns, age groups, internet reliance, public opinion, survey
false
Disquiet about technology is somewhat more prevalent among younger peopleA NEW WORLD DISORDER?
Multiple Chart
IPSOS
View slide
Depicts a central graphic with concentric circles detailing governance, strategy, risk management, and targets, accompanied by side text and logos.
Regulatory and Compliance
Industrial & Manufacturing
Discusses how Michelin adheres to the Task Force on Climate-Related Financial Disclosures (TCFD) with a focus on governance, strategy, risk management, and targets related to climate initiatives.
TCFD, Michelin, Climate Change, Financial Disclosures, Risk Management, Strategy, Governance, Environmental Targets, Corporate Responsibility, Sustainability
false
Michelin applies the recommendations of the Task Force on Climate Related Financial Disclosures (TCFD)Road Show US West Coast Morgan Stanley
Framework
Morgan Stanley
View slide
Title on top, two-part text section with bullet points on investment and operational strategies, accompanied by a pie chart showing the budget allocation between them.
Operational Efficiency
Technology & Software
Details the role of engineering in growth and operations, emphasizing investment in new platforms, API ecosystems, infrastructure, and driving simplicity, underpining the firm's execution strategy.
Engineering, Growth, Operational Strategy, Investment, Infrastructure
false
Engineering Core to Execution StrategyGoldman Sachs Investor Day
Mixed Chart
Goldman Sachs
View slide
This slide features a flowchart diagram depicting the various stakeholders in the warehouse automation value chain, including components providers, solution providers, integrators, consultants, and end users. It highlights the forecast demand for automation in different end markets like e-commerce, food & beverage, apparel, and general merchandise.
Technology and Digital Transformation
Industrial & Manufacturing
The slide outlines the stakeholders involved in warehouse automation, detailing components providers, solution providers, integrators, consultants, and end users, along with the forecast demand for automation in various end markets.
Warehouse Automation, Value Chain, Stakeholders, Components Providers, Solution Providers, Integrators, Consultants, End Users, Forecast Demand
false
Various stakeholders active across the warehouse automation value chain; the end-market mix shift is largely attributed to growth in e-commerceWarehouse Automation
Linear Flow
LEK
View slide
Column chart showing spend outlook breakdown by geography, highlighting the most positive outlook from end-users in China
Market Analysis and Trends
Consumer Goods
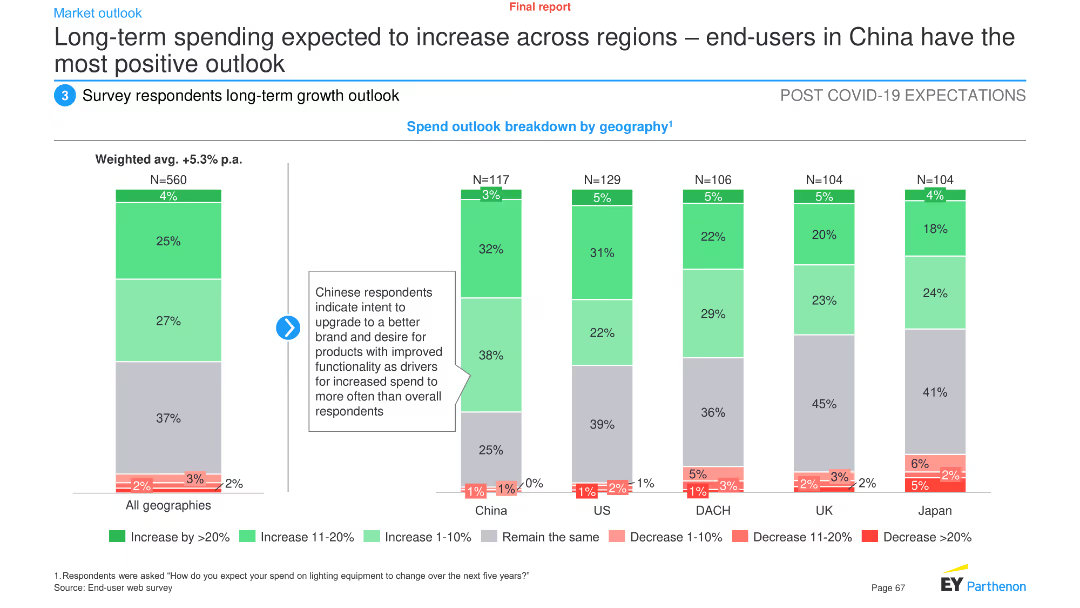
The slide analyzes long-term spending trends on lighting solutions across regions, with China showing the most positive outlook
spending, regions, outlook, China, trends
false
Long term spending expected to increase across regions end users in China have the most positive outlookProject Spiritus Final report Market Study
Multiple Chart
EY
View slide
It has a column chart demonstrating growth over years and a text box detailing forward catalysts. The color palette is limited, enhancing readability.
Market Analysis and Trends
Financial Services
This slide demonstrates the growth of Goldman Sachs' investment banking division, detailing the increase in client coverage and wallet share gains. It is designed for presentations on market expansion and strategic growth opportunities.
investment banking, growth, market size, Goldman Sachs, strategy, wallet share, technology, healthcare
false
"Investment Banking: Robust Backlog Combined with Strategic Growth Opportunities"Goldman Sachs Strategic Update
Mixed Chart
Goldman Sachs
View slide
Line graph showing median deal size by series, with sharp peaks in D+ rounds.
Market Analysis and Trends
Financial Services
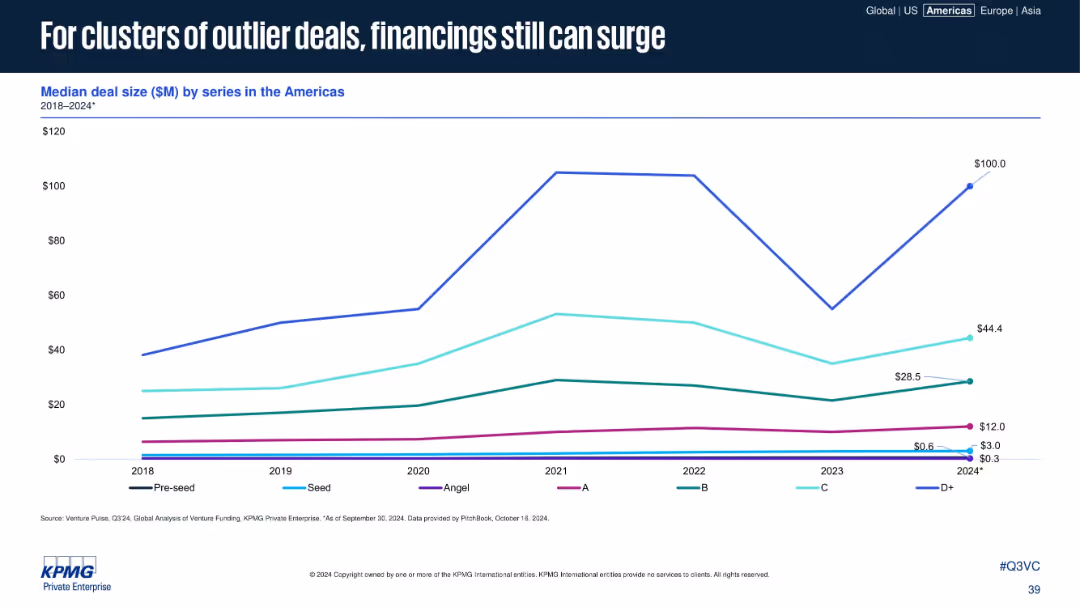
This visualization of deal size by funding series highlights volatility, particularly for late-stage (D+) deals. While early stages remain flat, occasional spikes in later rounds suggest that large outlier financings continue to influence the market.
deal size, D+ rounds, outliers, VC series, funding trends, volatility, late stage, median size, Americas
false
For clusters of outlier deals, financings still can surgeVenture Pulse Q3 2024
Single Chart
KPMG
View slide
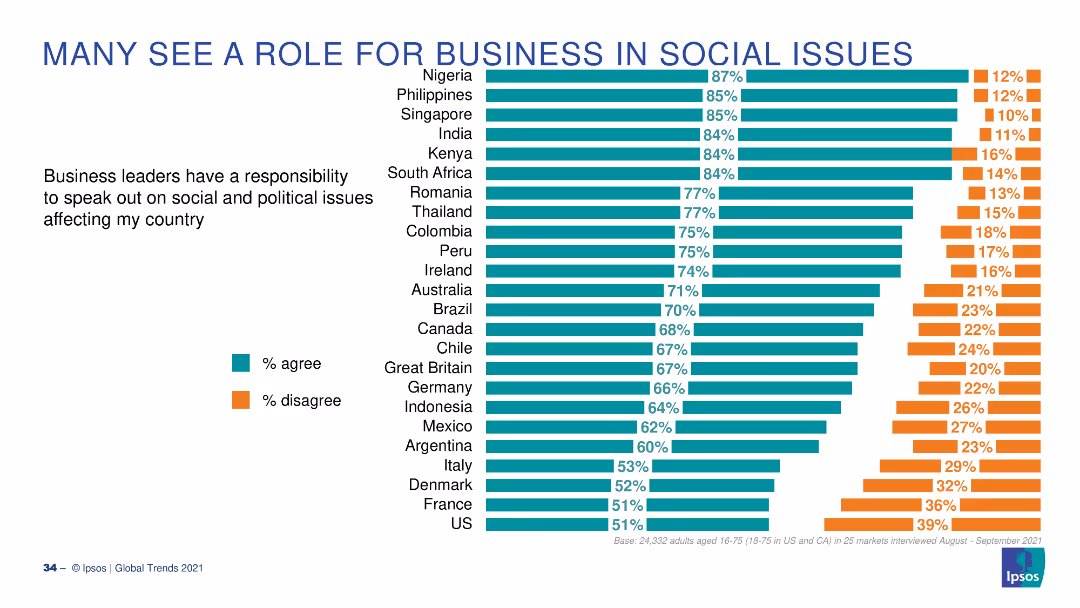
A bar chart with horizontal bars showing the percentage of people agreeing or disagreeing that business leaders should speak on social issues, across different countries.
Market Analysis and Trends
Professional Services
This slide presents survey results on whether business leaders should address social and political issues, with data from multiple countries and respondent percentages.
business, social issues, survey, opinions, global
false
MANY SEE A ROLE FOR BUSINESS IN SOCIAL ISSUESGLOBAL TRENDS 2021 Aftershocks and continuity
Multiple Chart
IPSOS
View slide
The slide presents three line charts showing the enrollment distribution percentages across three health plans (AmeriHealth Caritas, NH Healthy Families, Well Sense) over several fiscal years. The table below provides specific distribution percentages. The focus is on market share impact.
Regulatory and Compliance
Healthcare & Pharmaceuticals
Analyzes the impact of performance incentives on health plan market share, showing enrollment distribution changes for various health plans in the Medicaid program.
Medicaid, health plan, performance, market share
false
Medicaid Care Management | Health Plan Performance Incentives | Analysis (2 of 3)NH DHHS Operations Assessment
Multiple Chart
Alvarez & Marsal
View slide
The slide includes a scatter plot comparing cost efficiency and capital efficiency among banks. Text boxes explain the efficiency and profitability of UBS's personal and corporate banking.
Operational Efficiency
Financial Services
This slide showcases UBS's cost and capital efficiency, comparing it to Swiss and European peers, and highlights its superior profitability.
Cost Efficiency, Capital Efficiency, UBS, Banking, Profitability
false
Leading returns through cost and capital efficiencyUBS Investor Update Personal & Corporate Banking
Mixed Chart
UBS
View slide
The slide features a column chart displaying the private funding value from 2019 to H1 2022 alongside an orange line graph for the average 10-year US treasury rate. Annotations provide additional context about market trends, including recent changes affecting investments.
Investment Analysis
Financial Services
Highlights investment trends in the first half of 2022, comparing private funding values with the average 10-year US treasury rate, contextualized with annotations on SEA’s deal landscape, showing how rising interest rates affect investments.
investments, trends, H1 2022, private funding, treasury rates, SEA, market
false
Investments maintained strong momentum in H1 2022, but investors are getting increasingly cautiouse-Conomy SEA 2022 Through the waves, towards a sea of opportunity
Mixed Chart
Bain
View slide
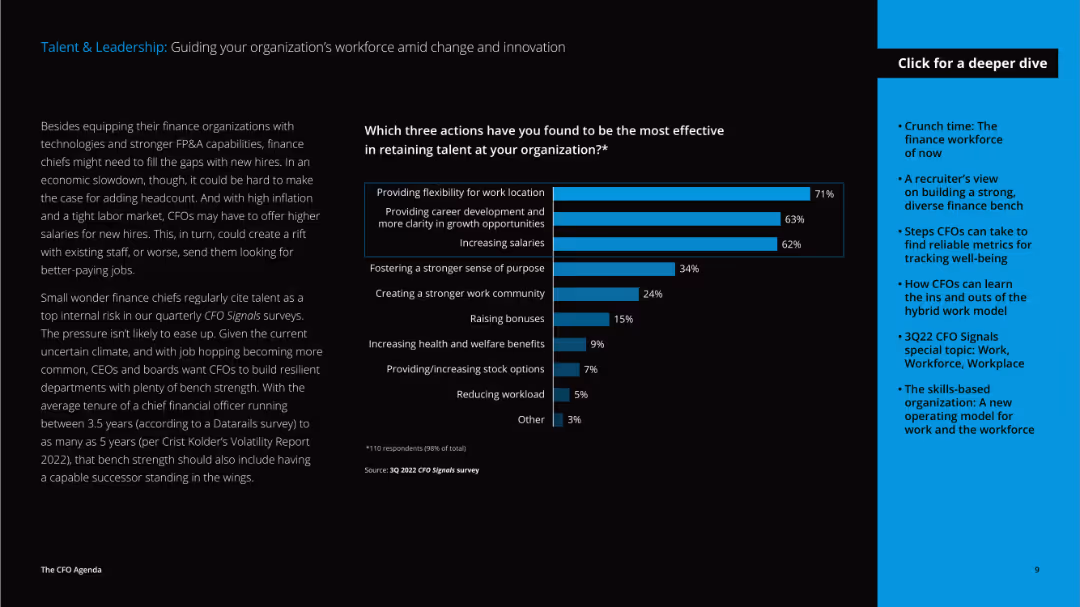
The slide features a detailed text on the left discussing talent retention strategies and a vertical column chart on the right showing effective actions taken by organizations.
Human Resources and Talent Management
Professional Services
The slide discusses strategies for retaining talent, including providing work flexibility, career development, and increasing salaries, highlighting the challenges and solutions CFOs face in talent management.
talent, leadership, workforce, retention, flexibility, career development, salaries, CFO, challenges, solutions
false
Which three actions have you found to be the most effective in retaining talent at your organization?*The CFO Agenda 2023
Mixed Chart
Deloitte
View slide
Bar graphs display net income and earnings per share growth over five fiscal years.
Strategic Planning
Financial Services
Highlights financial growth under a strategic plan, with emphasis on net income and earnings per share.
Financial performance, earnings growth, net income, strategic results
false
VISION 2020 RESULTSFiscal Year 2021 First Quarter
Multiple Chart
Booz Allen Hamilton
View slide
The slide includes column charts showing the budget outlook for medium-size and large-size public hospitals over the last three years, current year, and next three years.
Financial Performance
Healthcare & Pharmaceuticals
This slide details the budget outlook for public hospitals in APAC, comparing medium-size and large-size facilities. It highlights budget deficit and surplus trends over a three-year period.
public, hospitals, budget, outlook, financial
false
Public hospitals show better budget outlook in the near term in light of increased government funding; currently, less than 15% of medium-size or large hospitals are facing budget deficitsAsia-Pacific 2022 Hospital Priorities Survey: Strategic Implications for Healthcare Providers
Multiple Chart
LEK
View slide
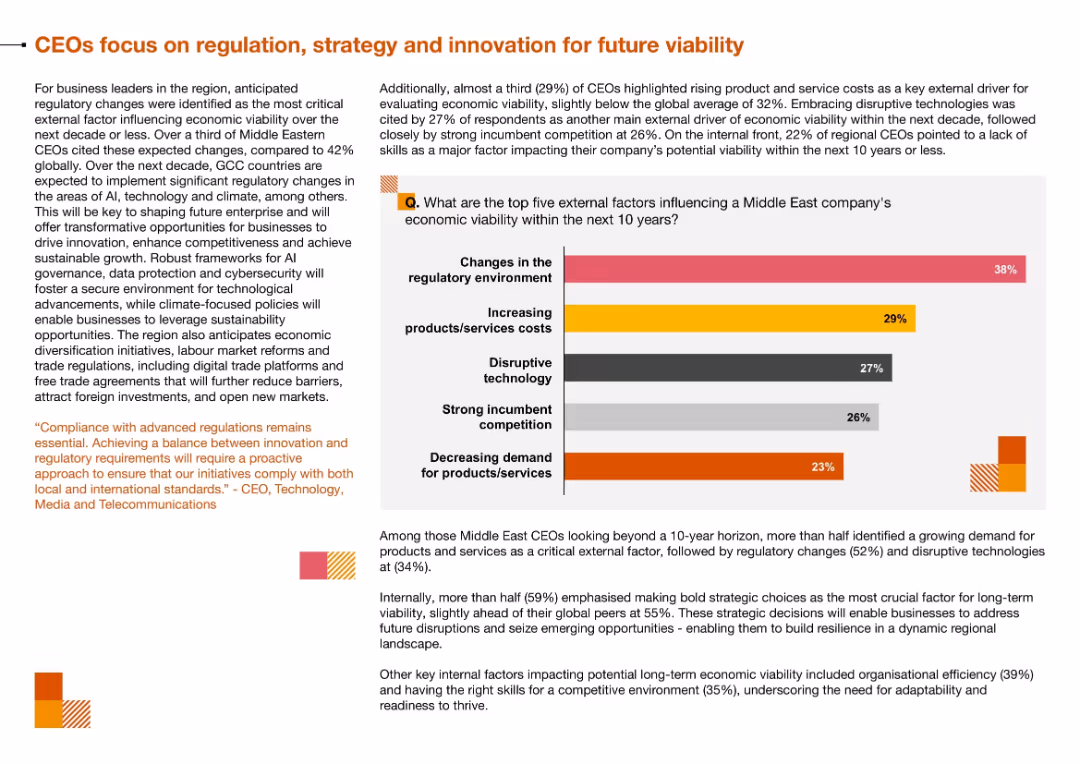
Bar chart of top five external factors influencing viability, with accompanying narrative on right; top section uses orange and gray color palette
Regulatory and Compliance
Technology & Software
The slide identifies the main external challenges facing Middle East businesses—particularly regulatory changes and rising costs—and the internal need to adapt through innovation and strategic decisions.
Regulation, Economic Viability, Disruptive Technology, Strategic Planning, Cost Pressures, Compliance
false
CEOs focus on regulation, strategy and innovation for future viabilityCapturing opportunities today, reinventing for tomorrow
Mixed Chart
PwC/Strategy&
View slide
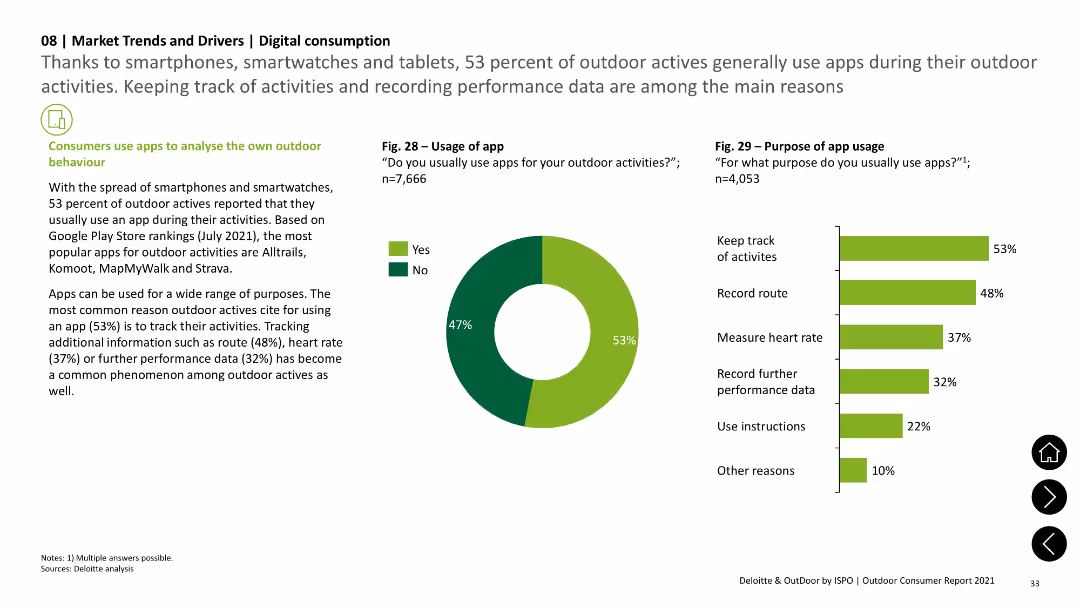
The slide features a pie chart showing app usage during outdoor activities and a column chart detailing the purposes of app usage, such as tracking activities and recording performance data. Text sections add context.
Technology and Digital Transformation
Technology & Software
The slide examines the use of apps by outdoor enthusiasts, highlighting the main purposes for app usage, including tracking activities, recording routes, and measuring heart rates, based on survey data.
app usage, digital tools, outdoor activities, tracking, performance data
false
Thanks to smartphones, smartwatches and tablets, 53 percent of outdoor actives generally use apps during their outdoor activities. Keeping track of activities and recording performance data are among the main reasonsOutdoor Consumer Report 2021 Deloitte & OutDoor by ISPO
Multiple Chart
Deloitte
View slide
This slide presents column chart comparing current MREL/TLAC requirements with available capital resources, highlighted with clear, distinct colors for different types of capital. Key highlights discuss regulatory implications.
Regulatory and Compliance
Financial Services
Discusses the institution's capacity to meet and exceed regulatory capital requirements, providing a detailed view on the sufficiency of loss-absorbing capacity, and strategic planning implications for financial stability.
regulatory, capital, financial, stability, planning
false
Continued high loss-absorbing capacity In € bn, period endQ3 2023 Fixed Income Investor Conference Call
Mixed Chart
Deutsche Bank
View slide
Text dominant layout with small pie charts in red and grey tones. There's a distinct contrast between the 'Orange World' text section and statistical data side.
Strategic Planning
Professional Services
The slide explores the move towards a more autonomous, fragmented network of operations, highlighting changes in employment structures and the rise of freelance work.
Work, Autonomy, Freelance, Employment, Opportunities
false
Seeking out fresh opportunitiesThe future of work: A journey to 2022
Mixed Chart
PwC/Strategy&
View slide
The slide presents column charts and donut charts breaking down sales and EBITDA pre percentages. Red and grey colors are used to show contrasts.
Financial Performance
Industrial & Manufacturing
Analyzing Q1 results, the slide breaks down sales and EBITDA pre percentages by sector, supported by LANXESS’s Consumer Protection and Engineering Materials divisions.
Q1 results, sales breakdown, EBITDA, Consumer Protection, Engineering Materials, LANXESS, financial data, sector analysis
false
Q1 2021: Results supported by Consumer Protection and Engineering MaterialsLANXESS – Morgan Stanley Cannon Ball Run Field trip
Multiple Chart
Morgan Stanley
View slide
Left side has percentage boxes, right side has a pie chart and text
Sales and Business Development
Retail & E-commerce
Analysis of generative AI's potential to replace roles in sales operations, focusing on team efficiency
sales, AI, team replacement, sales operations
false
Sales* Some believe they can completely replace a team member with generative AI, with sales ops being most commonGenerative AI Surveys
Mixed Chart
Gartner
View slide
The slide features a detailed process diagram for hydrogen-based direct reduction of iron and text on using hydrogen to lower emissions in steel production.
Market Analysis and Trends
Energy & Utilities
The slide explains how adopting hydrogen and other low carbon energy sources can help decarbonize steel production, supported by a detailed process diagram and explanatory text.
hydrogen, steel, decarbonization, reduction, emissions, process diagram, low carbon
false
Hydrogen based Direct Reduction proposed process designHydrogen applications and business models
Diagram
Kearney
View slide
This slide features two column charts and text descriptions comparing year-over-year changes. The colors orange, blue, and grey dominate, with clear labels and percentage values.
Financial Performance
Transportation & Logistics
Discusses Faurecia's H1 2018 financial results, emphasizing sales growth, operating income, and performance across different business groups and regions. Useful for assessing financial trends and operational efficiency within the automotive sector.
Sales Growth, Operating Income, Automotive, Global, Profitability
false
H1 2018 Results Continued improvement in profitability leading to upgrade FY2018 guidanceDeutsche Bank Global Auto Industry Conference
Multiple Chart
Deutsche Bank
View slide
Column chart and line chart showing average private credit cashflow/interest expense and distressed debt & special situations dry powder over time.
Investment Analysis
Financial Services
The slide highlights the attractiveness of special situations private credit, with increasing borrower challenges and available capital for flexible solutions.
private credit, special situations, distressed debt, cashflow, interest expense, investment opportunity
false
The Opportunity Set For Special Situations Private Credit Looks AttractiveThe BEAT February 2024
Multiple Chart
Morgan Stanley
View slide
The slide contains multiple charts: column charts for profit before tax, operating income, cost/income ratio, mandate volume, loans, and invested assets.
Financial Performance
Financial Services
The slide presents various financial metrics for Global Wealth Management, comparing data from multiple quarters to 1Q20.
wealth management, profit, operating income, cost ratio, loans
false
Global Wealth Management Profit before taxFirst quarter 2020 results
Multiple Chart
UBS
View slide
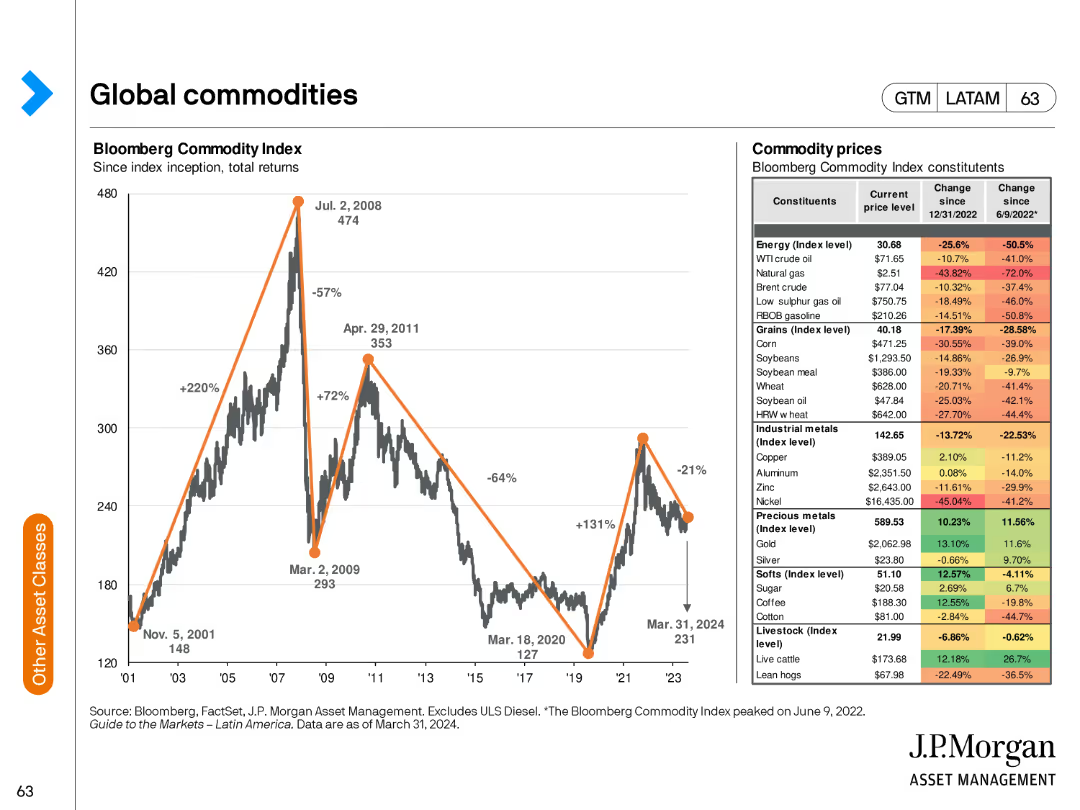
The slide includes a line chart depicting the Bloomberg Commodity Index total returns and a table showing current commodity prices and their changes over time.
Market Analysis and Trends
Financial Services
This slide provides an overview of the global commodities market, focusing on the Bloomberg Commodity Index and the price changes of various commodities.
commodities, Bloomberg Index, total returns, prices, market overview
false
Global commodities Bloomberg Commodity IndexGuide to the Markets Latin America | 2Q 2024
Mixed Chart
JP Morgan
View slide
This slide contains a world map highlighting project team presence across various global cities. Below the map are three key points about the firm's capabilities, including team size, office locations, and client base. The slide uses a mix of icons and text.
Industry Overview
Professional Services
The slide presents an overview of L.E.K. Consulting’s global presence, highlighting their offices, team size, and client relationships, emphasizing their global strategy and market knowledge.
global presence, strategy, consulting, offices, team
false
L.E.K. Consulting is a leading global strategy consulting firmEducation: Mega Trends and Opportunities in Africa
Graphic
LEK
View slide
Text-dominant slide with a professional layout, utilizing bold headers and bullet points to delineate sections and present complex information in a digestible format.
Technology and Digital Transformation
Energy & Utilities
The slide discusses the uncertainties and potential impacts of the conflict in Ukraine on the global energy transition and decarbonization paths. It outlines various scenarios and raises questions regarding government policies, consumer responses, and the broader implications for GDP and energy supply and demand. This slide aims to provoke thought and discussion on how current geopolitical events may shape the future of energy and environmental policy.
Geopolitical, Energy Transition, Ukraine, Decarbonization
false
While developments of the conflict in Ukraine are highly uncertain, today’s decisions could impact the long-term energy transition and path towards decarbonizationGlobal Energy Perspective 2022
Header Horizontal
McKinsey
View slide
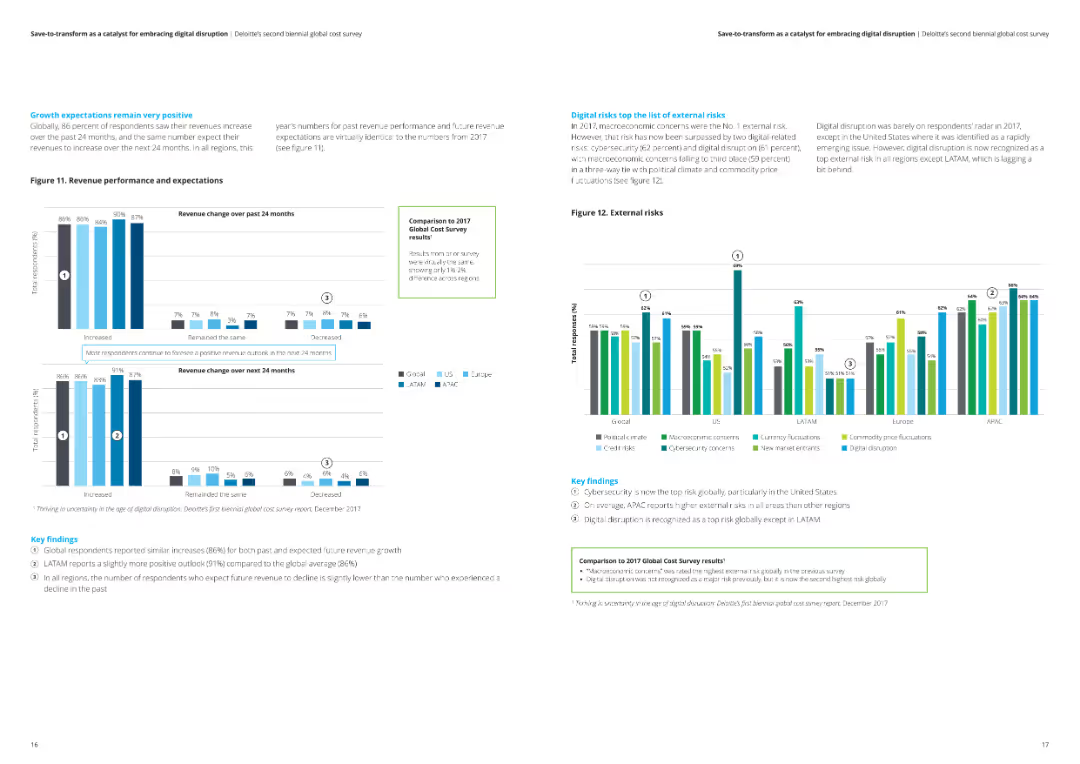
The slide features a detailed analysis of revenue change expectations over the past and next 24 months. It includes column charts and key findings on the positive growth outlook across different regions, and highlights the top external risks impacting businesses.
Market Analysis and Trends
Professional Services
This slide discusses positive growth expectations for revenue over the past and next 24 months, based on Deloitte's survey. It includes an analysis of external risks and key findings, showing a generally optimistic outlook across various regions.
growth expectations, revenue, positive outlook, Deloitte, external risks
false
Growth expectations remain very positive Globally, 86 percent of respondents saw their revenues increase over the past 24 months,Save-to-transform as a catalyst for embracing digital disruption Deloitte’s second biennial global cost survey
Multiple Chart
Deloitte
View slide
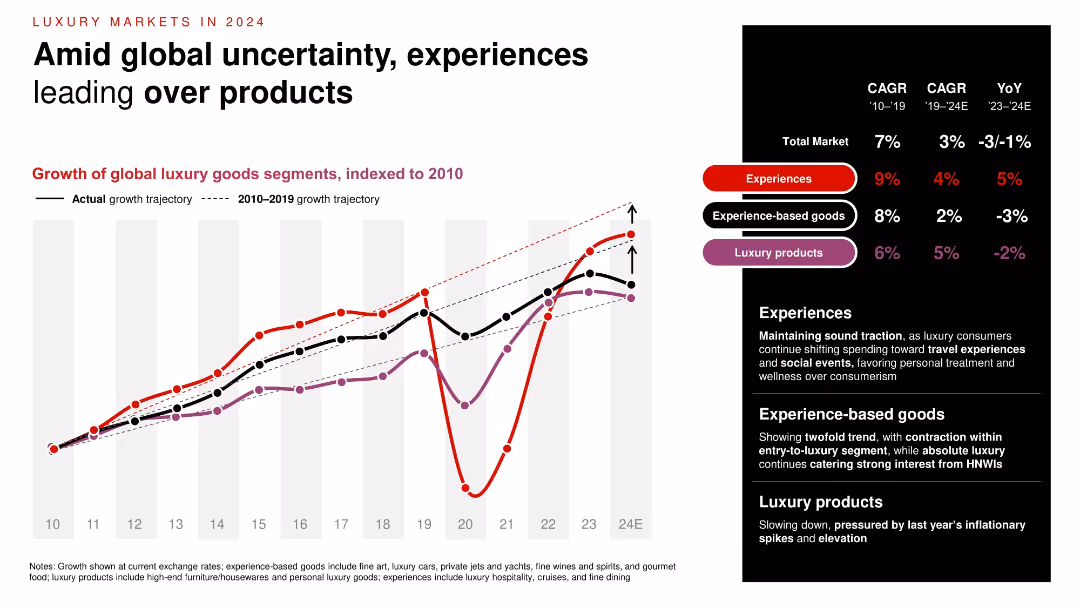
Line chart showing indexed growth trajectories (2010–2024E) of experiences, experience-based goods, and luxury products, color-coded and annotated. Growth rates and CAGR listed in a sidebar.
Market Analysis and Trends
Consumer Goods
The chart reveals diverging growth trends in luxury: experiences continue to outperform goods, especially post-COVID. Experiences see a 5% YoY growth, while luxury products decline. Commentary elaborates on consumer behavior shift from material goods to social and experiential spending.
luxury trends, experience economy, CAGR, consumer behavior, 2024, indexed growth, experiences
false
Amid global uncertainty, experiences leading over productsGood times for a change
Mixed Chart
Bain
View slide
Features three column charts comparing the annual sales, revenue, and attrition rates between customers who redeem Ultimate Rewards® once, multiple times, or not at all. There's a clear focus on the benefits of engagement.
Client Case Studies
Financial Services
Analyzes the positive impact of the Ultimate Rewards® program on customer engagement, showing how redeemers contribute to higher sales and revenue and lower attrition rates.
customer engagement, rewards program, sales, revenue, attrition
false
Our experience has shown the value of engaging our large customer baseConsumer & Community Banking 2019
Multiple Chart
JP Morgan
View slide
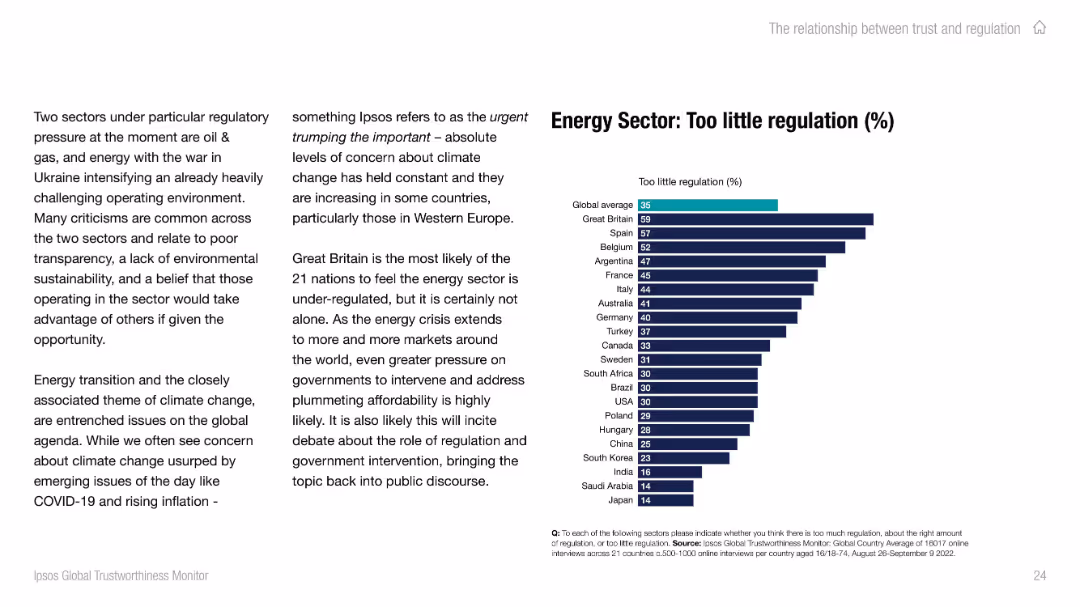
Split slide layout; left side contains paragraph text, right side features a horizontal bar chart comparing "Too little regulation (%)" by country with bold headings and teal/navy color scheme.
Regulatory and Compliance
Energy & Utilities
The slide highlights global perceptions of under-regulation in the energy sector, emphasizing the impact of climate concerns and geopolitical issues. A chart shows country-specific sentiment, with the UK having the highest concern and Japan the least.
regulation, energy, trust, climate, public opinion, global, Ipsos, chart, UK, Western Europe
false
Energy Sector: Too little regulation (%)IPSOS GLOBAL TRUSTWORTHINESS MONITOR
Mixed Chart
IPSOS
View slide
Contains column chart comparing revenue mix and production type mix in 2020 and projected for 2025, showing shifts towards more diversified propulsion types. Color coding aids in distinguishing between BEV, HEV, and ICE types.
Strategic Planning
Industrial & Manufacturing
Analyzes how TI Fluid Systems plans to balance its revenue according to different propulsion types, forecasting a strategic shift towards a more balanced mix by 2025. This aligns with broader industry trends towards diversification.
propulsion types, revenue mix, 2020, 2025, bar graphs
false
Balancing Propulsion Revenue to Production MixTI Fluid Systems Investor Presentation
Mixed Chart
Deutsche Bank
View slide
Detailed column charts illustrating assets under management by business unit and product group over time.
Financial Performance
Financial Services
Displays the trend of assets under management within Deutsche Bank's Private Bank, highlighting changes and net flows.
assets management, private banking, financial trends, investment products
false
Assets under management – Private Bank In € bn, unless stated otherwiseQ1 2023 results
Multiple Chart
Deutsche Bank
View slide
The slide combines text and a line chart. The text details the capital structure and free cash flow deployment, while the chart shows share repurchases over time.
Financial Performance
Financial Services
The slide discusses the capital structure, financial leverage, and free cash flow deployment strategies, including share repurchases and debt metrics.
Capital Structure, Leverage, Free Cash Flow, Share Repurchases, Debt Ratings, Investment Grade
false
Capital Structure and AllocationGartner Introduction
Mixed Chart
Gartner
View slide
Left-aligned blue headline with supporting vertical bar chart on the right showing response percentages by category.
Strategic Planning
Environmental Services & Sustainability
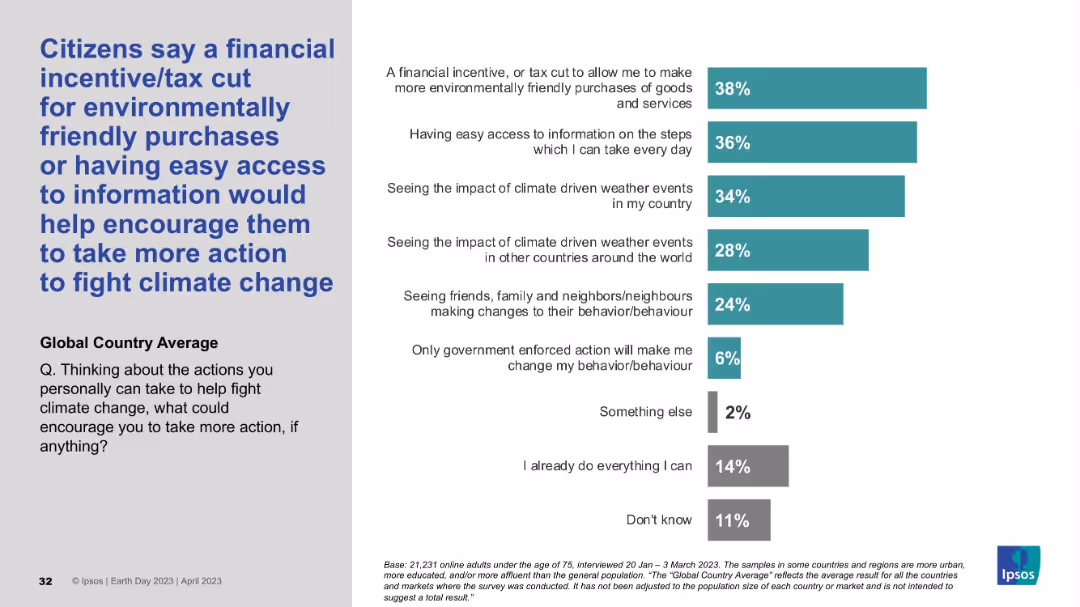
The slide outlines motivating factors that could encourage individuals to take more action against climate change. A financial incentive or tax cut and easier access to information top the list of responses, reflecting what support mechanisms people believe would be most effective.
behavior change, motivation, incentives, environment, climate action, survey, Ipsos, awareness, global average, support strategies
false
Citizens say a financial incentive/tax cut...would help encourage them...EARTH DAY 2023
Mixed Chart
IPSOS
View slide
The slide has an impactful visual with a futuristic aircraft image, title text overlay, and a nighttime backdrop.
Market Analysis and Trends
Industrial & Manufacturing
This is the title slide for a report on the Tempest Programme, hinting at the extensive analysis of its economic impact from 2021 to 2050.
economic impact, Tempest Programme, aerospace, defense, forecasting
false
Assessment of the expected economic impact of the Tempest Programme (2021-2050)Assessment of the expected economic impact of the Tempest Programme (2021-2050)
Title
PwC/Strategy&
View slide
The slide features a bar chart showing percentages of respondents' management of their primary investment accounts. Each bar represents a different management method.
Investment Analysis
Financial Services
The slide presents survey data on how respondents manage their primary investment accounts, including using advisors, self-directed investment, and online advisors.
investment, advisor, portfolio, self-directed, online
false
Management of Primary Investment Account I work with, or have, an advisor or portfolio managerINVESTING AND THE COVID-19 PANDEMIC
Single Chart
IPSOS
View slide
The slide has a title at the top, text in the middle, and a column chart at the bottom depicting changes in working situations or hours due to the pandemic.
Operational Efficiency
Professional Services
Provides data on changes in working situations due to the pandemic, with 43% reporting changes. Details include working from home, decrease/increase in hours, and furlough.
Working Situation, Pandemic, Survey, Work, Data
false
43% reported changes in their working situation or hours since the start of the pandemicThe Impact of COVID-19 on wellbeing in Scotland: Ipsos MORI report
Mixed Chart
IPSOS
View slide
The slide presents a line chart showing technology adoption rates in US households over time, color-coded by technology type. Key observations about the impact of world events on technology adoption are summarized on the right.
Market Analysis and Trends
Technology & Software
This slide examines the historical trends in technology adoption among US households, noting that major world events generally do not hinder technological progress, with some delays observed during WWII.
Technology adoption, US households, historical trends, world events, resilience
false
Major world events do not seem to stop technology adoption. At best, they slightly delay it, but most of the time, there is no visible slowdownGoing Public EY Global Blockchain Summit 2020
Mixed Chart
EY
View slide
A color-coded horizontal bar graph contrasted against a black background, assessing CEO beliefs about the impact of AI compared to the internet.
Market Analysis and Trends
Technology & Software
Evaluates CEO perspectives on AI's potential impact versus the internet revolution, highlighting significant regional insights.
AI impact, internet revolution, CEO survey, global regions, data comparison, technology adoption, business insights, future outlook, market research
false
EXHIBIT 15 Addressing these gaps is critical as the majority of CEOs believe AI will have a larger impact than the internet revolutionPwC's 22nd Annual Global CEO Survey
Mixed Chart
PwC/Strategy&
View slide
White background with purple text boxes listing factors for considering a platform strategy
Strategic Planning
Technology & Software
The slide provides a list of factors companies should consider when evaluating a platform strategy
Platform Strategy, Considerations, Industry Dynamics, Technology Capabilities, Ecosystem
false
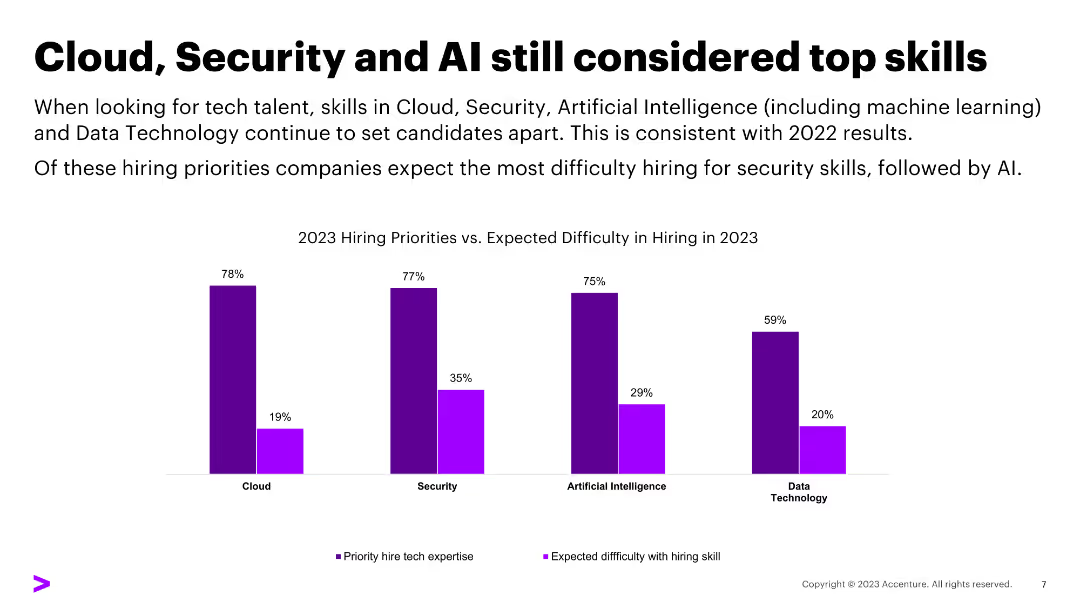
Cloud, Security and AI still considered top skillsTech Talent Hiring Trends Survey
Single Chart
Accenture
View slide
The slide includes text boxes outlining key figures and commitments for future dates, and the 'Act4nature International' logo.
Strategic Planning
Environmental Services & Sustainability
Outlines Michelin's environmental performance in 2022 and its commitments for 2030 to reduce the impact of its operations on biodiversity and ecosystems, highlighting progress and future targets.
Biodiversity, Ecosystems, Environmental Impact, Michelin, Commitments, Sustainability, Life Cycle Analysis, Raw Materials, 2030 Targets, Act4nature
false
Strong commitment to reduce impact of operations on biodiversity and ecosystemsRoad Show US West Coast Morgan Stanley
Table
Morgan Stanley
View slide
A slide that blends images and bulleted text highlighting key statistics and trends in consumer behavior, e-commerce growth, and emerging channels like the metaverse.
Market Analysis and Trends
Retail & E-commerce
Highlights shifts in consumer expectations and the growth of new sales and marketing channels, essential for strategic business adaptation and planning.
Consumer Behavior, E-commerce, Sales Trends, Marketing Strategy, Personalization, Virtual Assistants, Metaverse, Market Growth, Business Strategy, Technological Advancements
false
Consumer behavior is evolving, necessitating shifts in sales and marketingBCG Executive Perspectives: The Future of Sales and Marketing is Here
Header Horizontal
BCG
View slide
Diagram with timeline, icons of people, and dual line graph (CV vs. Cost). Sidebar with key points.
Operational Efficiency
Professional Services
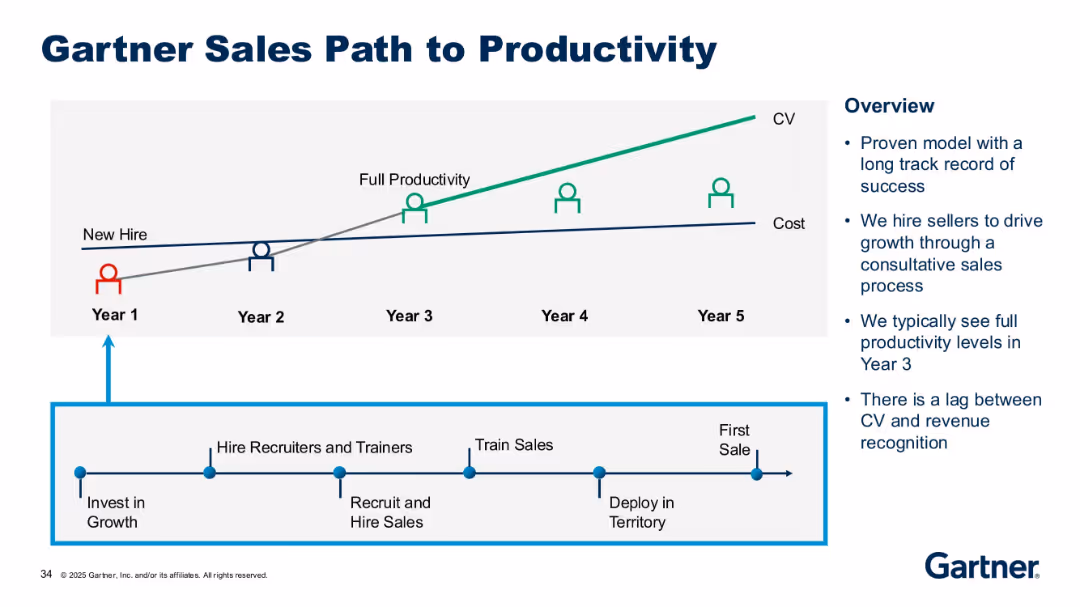
This slide outlines the multi-year path from new hire to full productivity, typically achieved in Year 3. It includes stages like recruiting, training, and deployment, emphasizing the lag between CV generation and revenue recognition.
sales productivity, new hire, cost, CV, sales model, training, timeline, growth strategy, revenue lag
false
Gartner Sales Path to ProductivityGartner Introduction 2025
Mixed Chart
Gartner
View slide
A column chart showcasing growth in podcast advertising revenue from 2015 to 2017 with a projection for 2017. The growth percentages are highlighted above each bar.
Market Analysis and Trends
Media & Entertainment
This slide analyzes the growth trends in podcast advertising revenue, showing significant increases year over year with future projections. Useful for discussions on media market trends and revenue strategies.
podcast, advertising, revenue growth, media
false
Podcast advertising revenue grew at a double-digit rate from 2015 to 2016, and the growth is forecast to build in 2017.IAB Podcast Ad Revenue Study: An Analysis of the Largest Players in the Podcasting Industry
Single Chart
PwC/Strategy&
View slide
Bar chart comparing SME contribution in DF9 with EU countries, supported by narrative text on left
Organizational Structure and Change
Artificial Intelligence
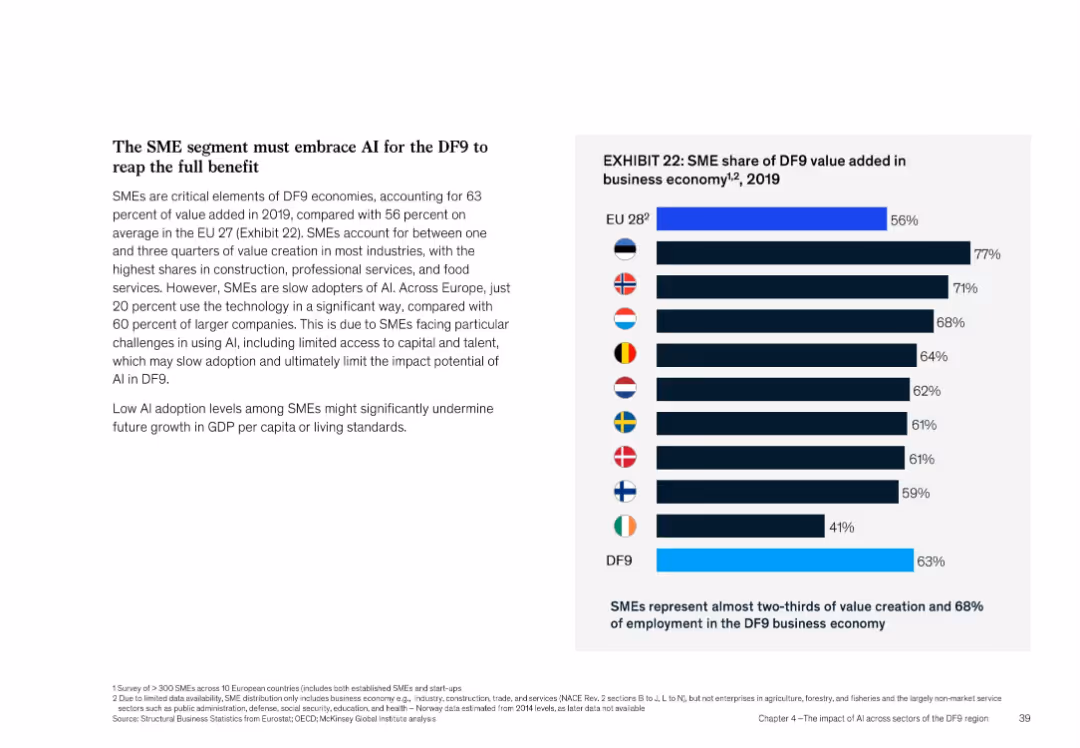
Describes the role of SMEs in DF9 economies, highlighting their large contribution to value creation (63%) and employment (68%). Notes that SME AI adoption is low (~20%), which could hinder growth. Bar chart ranks SME contributions across EU nations.
SMEs, AI adoption, DF9, EU comparison, value creation, employment
false
EXHIBIT 22: SME share of DF9 value added...How nine digital frontrunners can lead on AI in Europe
Mixed Chart
McKinsey
View slide
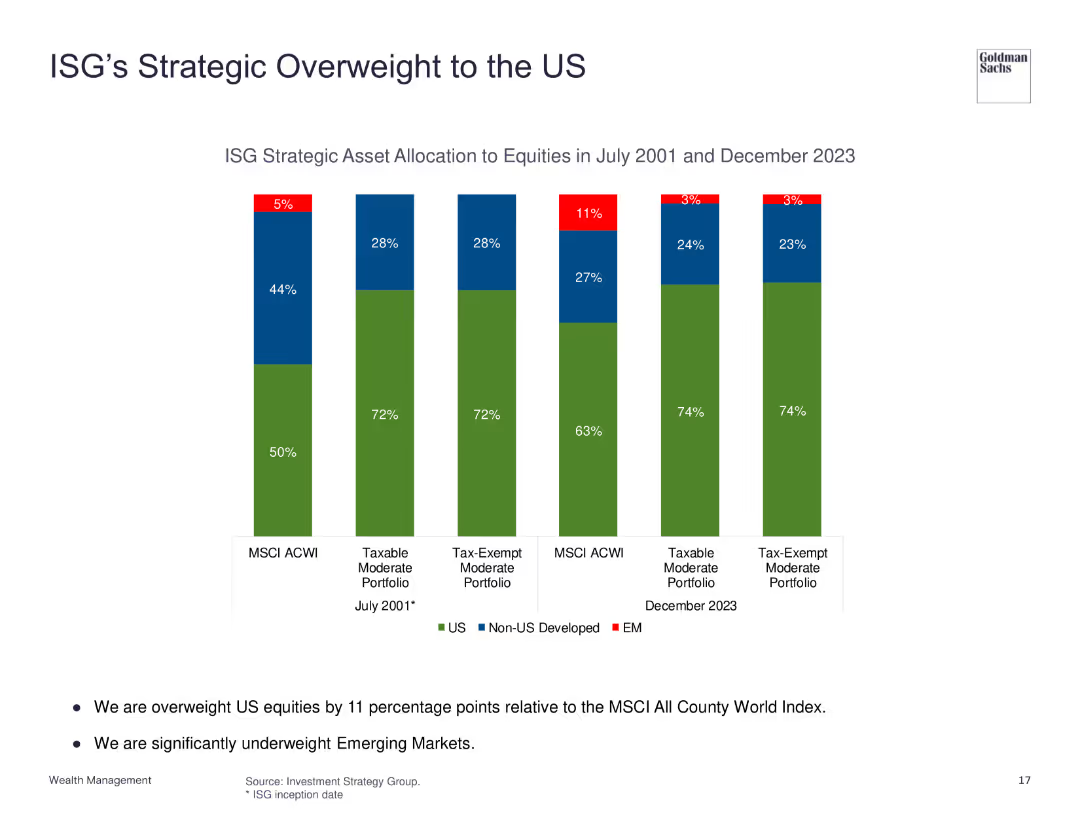
The slide shows column charts comparing ISG's asset allocation to equities in 2001 and 2023, highlighting an increased overweight to US equities.
Strategic Planning
Financial Services
The slide illustrates ISG's strategic decision to overweight US equities, showing the changes in asset allocation over time and the focus on US market investments compared to non-US developed and emerging markets.
ISG, Strategy, Asset Allocation, US Equities, Overweight
false
ISG’s Strategic Overweight to the USInvestment Strategy Group
Single Chart
Goldman Sachs
View slide
The slide uses pie charts and diagram to show how nbn has impacted employment and income outcomes, with specific metrics and examples.
Market Analysis and Trends
Telecommunications
This slide evaluates the impact of nbn on employment and income, detailing the benefits and statistics associated with increased connectivity.
nbn, employment, income, internet impact, connectivity, statistics
false
How nbn-enabled internet impacts employment & income outcomesThe economic and social impact of investment in the nbn network Methodology Report
Multiple Chart
Accenture
View slide
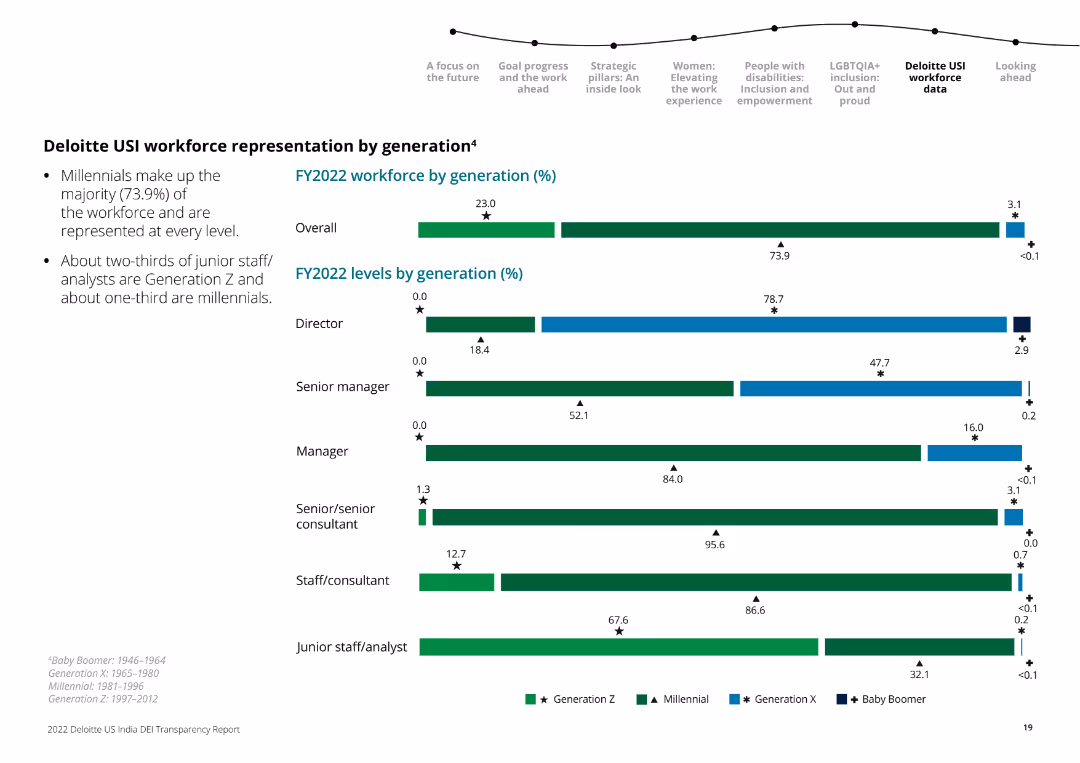
The slide presents horizontal bar charts depicting workforce distribution across generations (Gen Z, Millennials, Gen X, Baby Boomers) in FY2022.
Human Resources and Talent Management
Professional Services
The slide details the generational composition of Deloitte USI's workforce at various organizational levels in FY2022.
workforce, generation, Deloitte, distribution, FY2022, generational analysis, bar chart
false
Deloitte USI workforce representation by generation42022 Deloitte US India Diversity, Equity, and Inclusion (DEI) Transparency Report
Multiple Chart
Deloitte
View slide
Pie chart displaying the distribution of approaches to ML governance among various firms.
Regulatory and Compliance
Technology & Software
Provides an overview of how different organizations are handling ML governance and framework adaptation.
ML governance, framework, adaptation, distribution
false
What others are doing - ML GovernanceAI/ML use in Risk Management and Compliance PwC Actuarial, Risk & Quants
Single Chart
PwC/Strategy&
View slide
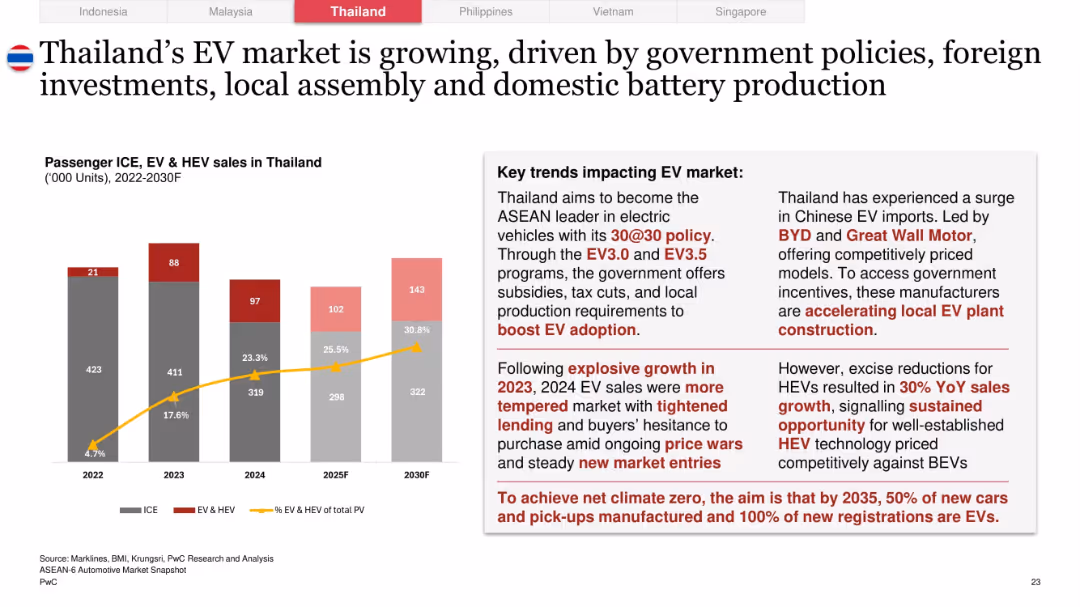
Left section features bar and line graph for EV/ICE trends 2022–2030F; right section has detailed narrative on EV policies and challenges
Technology and Digital Transformation
Industrial & Manufacturing
Thailand’s EV market sees strong growth in 2023, with 30% EV target by 2030. Government subsidies, local production, and rising Chinese imports fuel the transition. Market cooling in 2024 due to price sensitivity and lending tightness is noted.
Thailand, EV policy, BEV vs HEV, 30@30, Chinese EVs, BYD, price sensitivity, local assembly, carbon goals
false
Thailand’s EV market is growing, driven by government policies, foreign investments, local assembly and domestic battery productionOverview of the ASEAN-6 Automotive Market
Mixed Chart
PwC/Strategy&
View slide
Detailed slide with multiple column charts, each representing a different aspect of Indonesia's digital financial services. Utilizes shades of blue for a clean look.
Financial Performance
Financial Services
This slide gives an in-depth view of the projected growth in digital lending, payments, insurance, and wealth in Indonesia's financial sector.
Indonesia, Digital Financial Services, Lending, Payments, Insurance, Wealth, Growth Projections, Financial Sector
false
Indonesia DFS: Lending and wealth expected to rise rapidly from a low basee-Conomy SEA 2023 report: Indonesia
Multiple Chart
Bain
View slide
This slide features multiple line charts tracking the net interest margin development for Corporate and Private Banks. It includes column charts showing group NIM development. There's a side panel with key highlights in bullet points.
Financial Performance
Financial Services
The slide illustrates the development of net interest margins within a financial institution, comparing corporate and private banking sectors over several quarters.
NIM, banking, financial analysis, interest rates, quarterly performance
false
Net interest margin (NIM)Client & Creditor Overview August 2023
Multiple Chart
Deutsche Bank
View slide
Graph and textual layout depicting the timeline of business expansion and its financial projections.
Strategic Planning
Financial Services
The slide presents JPMorgan's investment plans to achieve operational leverage, showing expected growth in customer numbers and cost per customer.
Strategic planning, investment, growth, operating leverage, banking, business expansion
false
We are investing to build a sizeable business with high operating leverageInternational Consumer Growth Initiatives 2022
Multiple Chart
JP Morgan
View slide
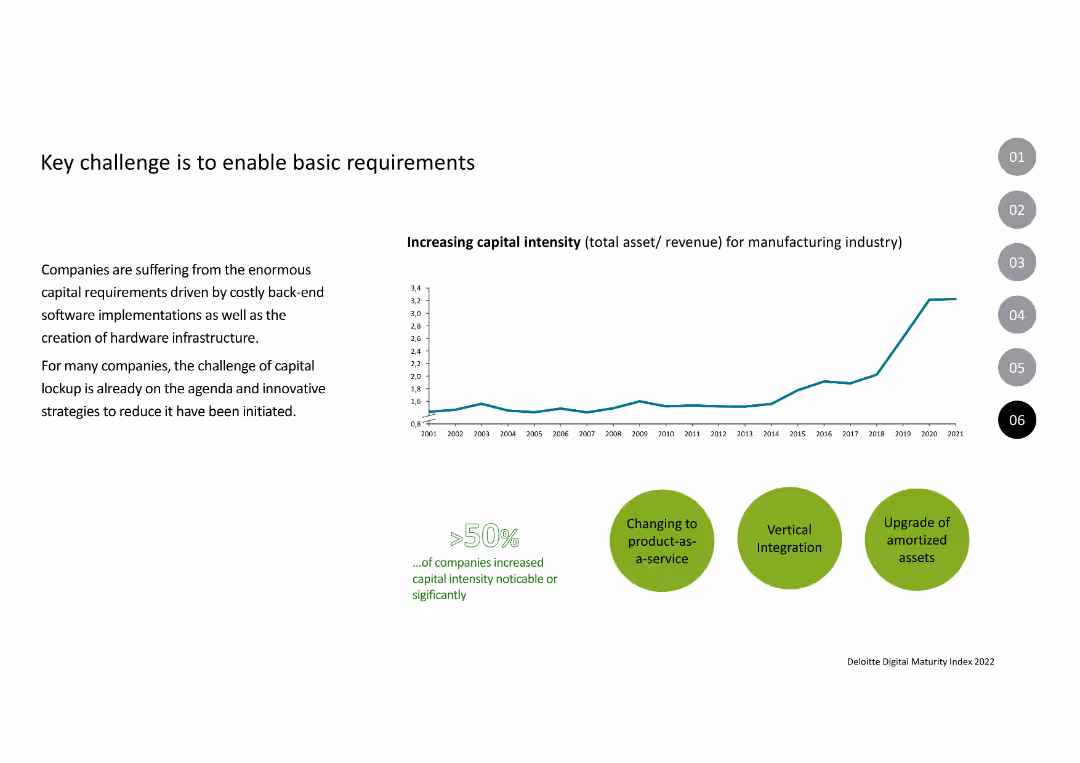
Features a line chart showing the increase in capital intensity for the manufacturing industry from 2001 to 2021. Below the chart, there are three key strategies illustrated with icons: changing to product-as-a-service, vertical integration, and upgrading amortized assets.
Operational Efficiency
Industrial & Manufacturing
Highlights the rising capital intensity in the manufacturing industry and the strategies being adopted to manage this challenge. It emphasizes the need for innovative approaches like product-as-a-service models and vertical integration to unlock capital and drive efficiency.
Capital, Intensity, Manufacturing, Strategy, Integration
false
Key challenge is to enable basic requirementsDigital Maturity Index Survey 2022
Mixed Chart
Deloitte
View slide
The slide features bar charts showing risks and opportunities percentages. Text boxes detail risks and opportunities, and a summary box highlights key takeaways.
Market Analysis and Trends
Transportation & Logistics
It presents survey results indicating a need for repositioning in aerospace and defense functions due to digitalization, with focus on production and logistics.
Digitalization, aerospace, defense, risks, opportunities, production, logistics
false
73% of Aerospace and Defense leaders confirm the need for functions to reposition Highest potential in Production & Logistics10th Operations Efficiency Radar
Multiple Chart
Roland Berger
View slide
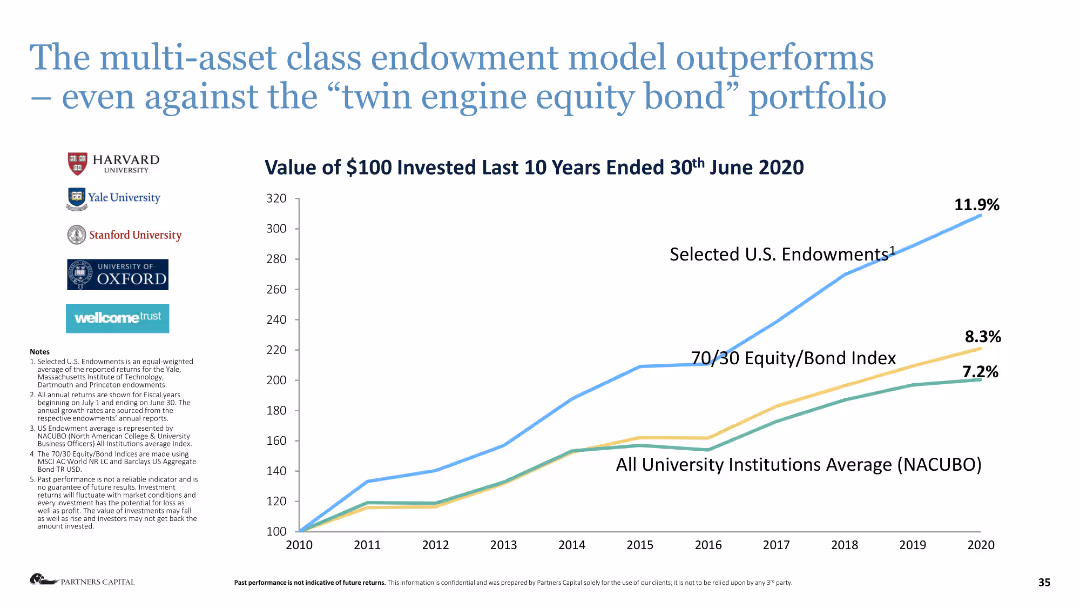
Line chart comparing the performance of different investment models over ten years.
Investment Analysis
Financial Services
This slide illustrates the superior performance of the multi-asset class endowment model compared to other investment approaches.
endowment model, investment performance, multi-asset, equity bond, financial analysis
false
The multi asset class endowment model outperforms even against the “twin engine equity bond” portfolioExternal Asset Manager (EAM) Conference
Mixed Chart
Deloitte
View slide
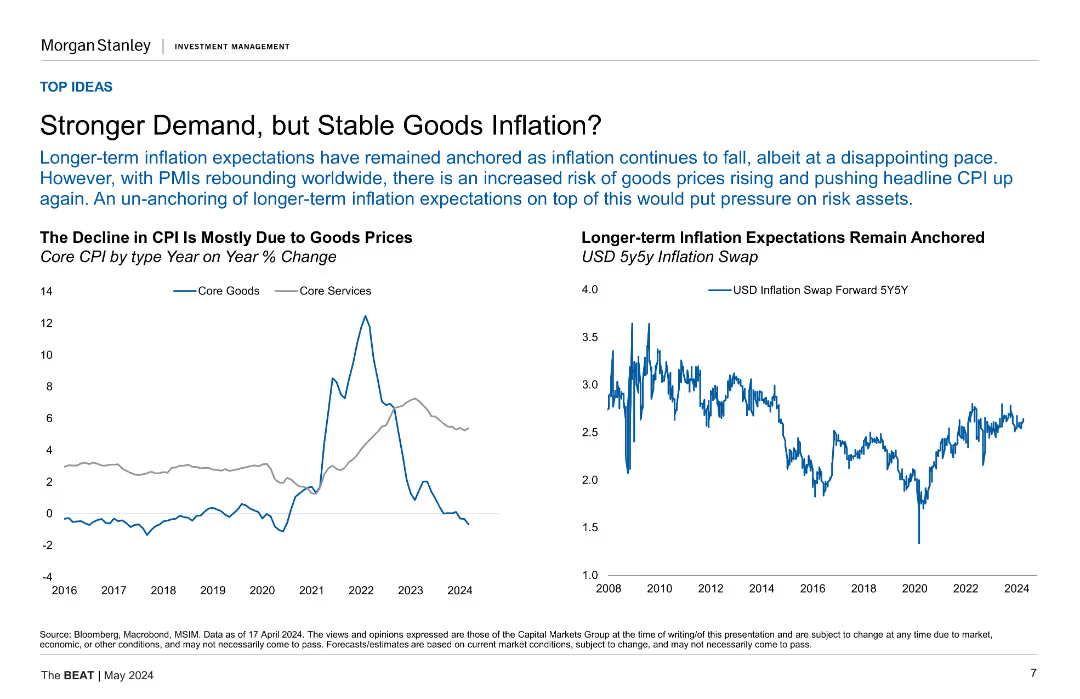
The slide features two line charts side by side. The left chart shows Core CPI by type (Goods and Services) over time, with data points from 2016 to 2024. The right chart displays USD 5y5y Inflation Swap rates from 2008 to 2024.
Market Analysis and Trends
Financial Services
The slide discusses how long-term inflation expectations have remained anchored despite recent CPI declines due to stable goods prices, while also highlighting the risks of rising goods prices amid rebounding PMIs.
Inflation, CPI, Core Goods, Core Services, USD, 5y5y, Inflation Swap, PMIs, Market Trends
false
Stronger Demand, but Stable Goods Inflation?The BEAT May 2024
Multiple Chart
Morgan Stanley
1
...
Next
Load More
Hold On!
We are searching in our database
If nothing, comes up, please try different filters!
Create a FREE account to continue browsing
Receive Instant Access to 1,000+ slides from companies like McKinsey, Google, and Goldman Sachs
First Name
Last Name
Email
Password
I agree to all
Terms & Privacy Policy
Thank you! Your submission has been received!
Oops! Something went wrong while submitting the form.
Have an account?
Sign in
Column Chart
Heatmap
Chevron
Org Chart
Infographic
Callouts
Timeline
List
Graphic
Picture
Process Flow
Diagram
Paragraph
Map
Table
Framework
Subtitle
Takeaway Box
Icon
Other Chart
Radar Chart
Waterfall Chart
Mekko Chart
Pie Chart
Scatter Plot
Line Chart
Bar chart
Bullet points