My Account
My Slides
Leave Feedback
Login
Logout
Get Started
Browse all Slides
Browse Slides Pro
Create a FREE Account
Instant access to 1,000+ real slides from top companies like McKinsey, BCG, Goldman Sachs, Google and many more!
First Name
Last Name
Email
Password
I agree to all
Terms & Privacy Policy
Thank you! Your submission has been received!
Oops! Something went wrong while submitting the form.
Have an account?
Sign in
Saved Slides
Total No. of slides saved
0
↻ Refresh
✖ Clear all
A dark-themed slide with a multi-layered column chart depicting various components of banking and markets revenues in billions, across multiple years.
Financial Performance
Financial Services
Displaying a breakdown of revenues for Global Banking & Markets, this slide highlights underwriting, FICC intermediation, and other revenue components.
revenue, banking, markets, underwriting, FICC
false
Financial Performance
Financial Services
Single Chart
Goldman Sachs
Add to my slides
Remove from favorites
A dark-themed slide with two sets of horizontal bar graphs, accompanied by callouts with key percentages and notable quotes. The layout is well-structured to compare categories and provides insights through selected respondent quotes.
Customer and Market Segmentation
Retail & E-commerce
Focuses on how companies plan to incorporate ethical concerns into their operations, with emphasis on transparent communication, making it relevant for discussions on corporate responsibility and communication strategies.
Ethics, Transparency, Corporate Communication, Operational Strategy, Corporate Responsibility
false
Customer and Market Segmentation
Retail & E-commerce
Mixed Chart
Kearney
Add to my slides
Remove from favorites
A data chart highlights the percentage of the population aged 15-35 and the unbanked/underbanked percentage in various countries, along with a qualitative 'right to win' indicator for digibanks. The slide has a clear, organized layout with country flags, statistics, and a legend for understanding the 'right to win' levels.
Market Analysis and Trends
Financial Services
Assessing the potential uptake of digibanks in different countries, this slide correlates the percentage of the young population with the unbanked demographics and evaluates the digital maturity of incumbent banks, giving insights into market opportunities for digibanks.
digibanks, unbanked, population, market analysis, digital maturity, incumbent banks
false
Market Analysis and Trends
Financial Services
Table
Bain
Add to my slides
Remove from favorites
A data-centric slide featuring a bar graph comparing spending between Tier 1 and Tier 2 cities across Southeast Asia. The graph is central, with supporting text on either side providing context and interpretation for the data.
Market Analysis and Trends
Retail & E-commerce
Examines the spending behaviors of consumers in Tier 1 and Tier 2 cities in Southeast Asia, highlighting the trend of increasing expenditure in smaller cities and the implications for retail strategies and market expansion.
spending behaviors, Tier 1 cities, Tier 2 cities, Southeast Asia, consumer expenditure, retail strategy, market expansion, economic trends
false
Market Analysis and Trends
Retail & E-commerce
Multiple Chart
Bain
Add to my slides
Remove from favorites
A data-centric slide with multiple bar graphs showing the adoption of AI across various geographies. Accompanied by icons and statistics on AI expansion, implementation ease, and innovation growth.
Financial Performance
Technology & Software
Leaders are urged to consider the significance of AI adoption, evidenced by statistics on global expansion, innovation, and investment, reflecting AI's impact on business performance.
AI Adoption, Financial Growth, Global Expansion, Innovation, Investment, Business Performance
false
Financial Performance
Technology & Software
Single Chart
McKinsey
Add to my slides
Remove from favorites
A data-driven slide with bar graphs, column charts, and a pie chart. High density of information, contrasting colors, and significant textual content.
Market Analysis and Trends
Technology & Software
It presents a detailed analysis of digital consumer behavior in Indonesia, covering e-commerce, media usage, and a breakdown of the willingness to pay for sustainable products, intended for market analysis purposes.
digital consumers, Indonesia, e-commerce, media usage, sustainability
false
Market Analysis and Trends
Technology & Software
Multiple Chart
Bain
Add to my slides
Remove from favorites
A data-heavy slide with a blue and black bar graph showing the percentage of vulnerable private-sector jobs in small firms.
Risk Assessment and Management
Government & Public Sector
The slide provides a statistical breakdown of private-sector jobs at risk, segmented by industry and company size, highlighting the concentration in smaller firms.
labor market, private sector, small firms, job vulnerability, industry analysis
false
Risk Assessment and Management
Government & Public Sector
Single Chart
McKinsey
Add to my slides
Remove from favorites
A data-heavy slide, it showcases a comparison of online activity incidence with color-coded bars, highlighting the low digital activity levels across sectors.
Market Analysis and Trends
Technology & Software
This slide analyzes the incidence of various online activities in metropolitan versus non-metropolitan areas, illustrating a stark contrast in digital adoption.
online activity, digital adoption, e-commerce, payments, food delivery, metropolitan, non-metropolitan
false
Market Analysis and Trends
Technology & Software
Table
Kearney
Add to my slides
Remove from favorites
A data-rich slide featuring graphs of central bank policy rates and market expectations for future central bank rates.
Risk Assessment and Management
Financial Services
The slide examines monetary policy by illustrating current and historical central bank policy rates and future market expectations.
monetary policy, central bank, market expectations, data-driven, policy rates
false
Risk Assessment and Management
Financial Services
Multiple Chart
Morgan Stanley
Add to my slides
Remove from favorites
A data-rich slide with color-coded percentage changes for different months and regions. It has a legend for easy interpretation.
Market Analysis and Trends
Retail & E-commerce
Discusses the year-on-year change in retail goods sales, highlighting recovery trends in different countries post-COVID-19.
retail goods sales, COVID-19 recovery, YOY change, market data
false
Market Analysis and Trends
Retail & E-commerce
Table
BCG
Add to my slides
Remove from favorites
A data-rich slide with multiple bar graphs representing regional economic impacts. The slide is text-heavy with key statistics highlighted.
Technology and Digital Transformation
Government & Public Sector
Focuses on the economic contribution of the Tempest programme to various UK regions, presenting data and graphs on regional impact and productivity.
Tempest, economic contribution, UK, regions, impact, productivity, data
false
Technology and Digital Transformation
Government & Public Sector
Multiple Chart
PwC/Strategy&
Add to my slides
Remove from favorites
A dense slide featuring charts, circular diagrams, and statistical data. Colors are used to differentiate various financial services sectors, with blue tones dominating.
Market Analysis and Trends
Financial Services
This slide shows the market share growth in different sectors of financial services, emphasizing the company's leading position in the market.
market share, financial services, client-centric, growth, data, charts, competitive, statistics
false
Market Analysis and Trends
Financial Services
Diagram
JP Morgan
Add to my slides
Remove from favorites
A dense slide with multiple bar graphs comparing GDP growth forecasts, accompanied by a textual analysis of the economic conditions.
Market Analysis and Trends
Financial Services
Analyzes adjustments in global growth projections and their drivers, likely used in financial services and economic strategy presentations.
GDP forecast, economic analysis, inflation, financial sector, geopolitical impact, growth projections, market trends
false
Market Analysis and Trends
Financial Services
Mixed Chart
McKinsey
Add to my slides
Remove from favorites
A dense, color-coded table displays annual asset performance from 1999 to 2023. Various asset classes are represented in colored squares, forming a grid that provides a visual performance history. Below, the source information is cited.
Investment Analysis
Financial Services
The slide is a comprehensive visual representation of the relative performance of various asset classes over a 25-year period, serving as a valuable tool for investment analysis and understanding market trends.
Asset performance, investment analysis, market trends, historical data, annual comparison, asset classes, financial history, relative performance, market research, data visualization
false
Investment Analysis
Financial Services
Table
Morgan Stanley
Add to my slides
Remove from favorites
A descriptive list with icons. Blue and white color scheme, with a clear layout.
Technology and Digital Transformation
Healthcare & Pharmaceuticals
Discusses the influence of bioengineering across different industries.
Bioengineering, Industry Influence, Comparative Analysis
false
Technology and Digital Transformation
Healthcare & Pharmaceuticals
Header Vertical
McKinsey
Add to my slides
Remove from favorites
A descriptive page featuring key issuance metrics for sustainable bonds, a summary table, and a column chart with minimal design elements.
Corporate Finance and Valuation
Financial Services
The slide provides details on JPMorgan Chase’s sustainable bond issuances and their environmental impact, highlighting key financials and project types for investor relations and reporting.
sustainable bond, JPMorgan Chase, environmental impact, finance, investment, green projects, annual report, key metrics
false
Corporate Finance and Valuation
Financial Services
Table
JP Morgan
Add to my slides
Remove from favorites
A detailed diagram illustrating the process of whitelisting wallets for tokenized assets, including steps like KYC/AML checks, engagement with regulators, and the role of tokenization providers, custodians, and exchanges.
Regulatory and Compliance
Financial Services
Describes an interim solution for enhancing secondary market liquidity by whitelisting wallets, detailing the process and regulatory compliance required to ensure secure and efficient trading of tokenized assets.
whitelisting, wallets, tokenization, KYC/AML, secondary market
false
Regulatory and Compliance
Financial Services
Diagram
EY
Add to my slides
Remove from favorites
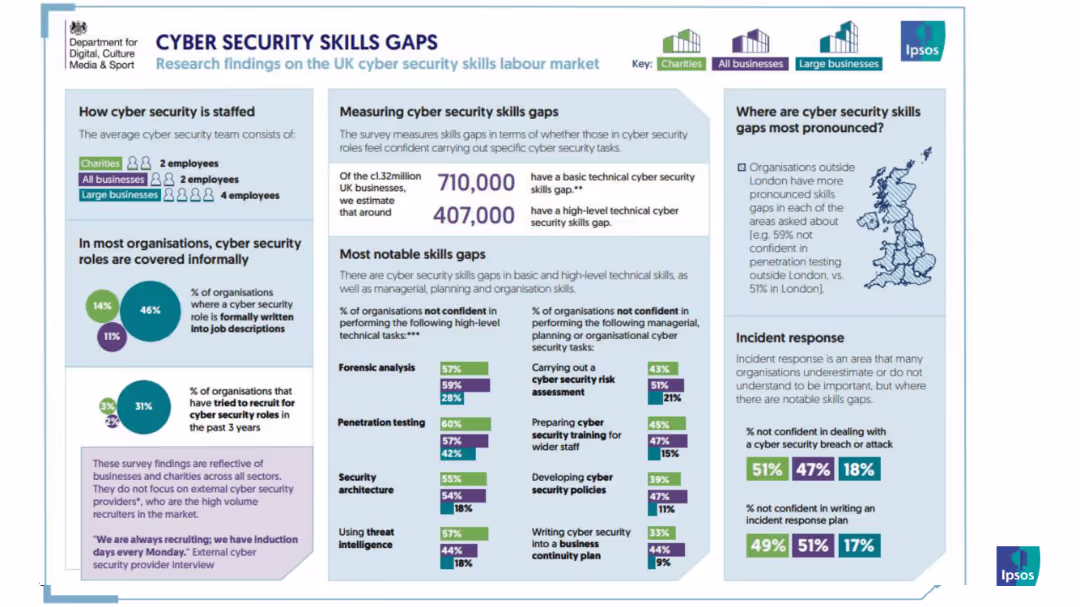
A detailed infographic presenting data on cybersecurity skill gaps, staffing, notable gaps, and confidence levels in various skills among UK organizations.
Human Resources and Talent Management
Technology & Software
The slide explores the gaps in cybersecurity skills within UK organizations, including staff levels and areas of improvement needed.
infographic, cybersecurity, skills gap, UK, staffing, organizations, talent
false
Human Resources and Talent Management
Technology & Software
Multiple Chart
IPSOS
Add to my slides
Remove from favorites
A detailed process flow diagram depicts the stages of the procurement process from product selection to payment. Includes icons and descriptions for each step, interactions with a central data hub, and customer service systems.
Operational Efficiency
Professional Services
Provides a comprehensive view of the procurement process, showing the sequence and tools involved from the initial product need to final payment, highlighting integration with technology for efficiency.
Procurement, Process, Technology, Efficiency, Integration
false
Operational Efficiency
Professional Services
Diagram
Kearney
Add to my slides
Remove from favorites
A detailed slide with a column chart showing annual global entertainment and media revenue from 2016-2025, with a red line depicting year-on-year growth percentage.
Market Analysis and Trends
Media & Entertainment
This slide analyzes the decline in global entertainment and media revenue in 2020 due to pandemic impacts, with projections up to 2025.
E&M industry, revenue impact, pandemic, global trends, 2020, projections, annual growth
false
Market Analysis and Trends
Media & Entertainment
Single Chart
PwC/Strategy&
Add to my slides
Remove from favorites
A detailed slide with a numbered list of controversial topics regarding Web3. It has a blue and white color scheme and uses icons and large numbers to delineate sections.
Strategic Planning
Technology & Software
Outlines the controversial topics surrounding Web3, such as its reliability, patterns of adoption, enterprise integration, regulatory trust, and the impact of new models and the metaverse on existing systems.
Controversies, Web3, Enterprise Integration, Regulation
false
Strategic Planning
Technology & Software
Header Vertical
McKinsey
Add to my slides
Remove from favorites
A detailed slide with two sections of bullet points emphasizing key performance indicators for Treasury and Trade Solutions and Securities Services, accompanied by rankings and metrics.
Financial Performance
Financial Services
Highlights Citibank's performance in specific service areas, offering a detailed review of financial metrics that would be relevant in a financial review or strategy meeting. It could be used to highlight Citibank's market position and performance goals.
Treasury, Trade Solutions, Securities, Performance Indicators, Citibank, Financial Metrics, Ranking
false
Financial Performance
Financial Services
Boxed
Citigroup
Add to my slides
Remove from favorites
A detailed step-by-step diagram explaining the 7-step strategic sourcing process, with annotations for each step.
Strategic Planning
Professional Services
Illustrates how the Purchasing Chessboard® is applied in strategic sourcing projects, providing a structured process overview.
Purchasing Chessboard, strategic sourcing, process, steps, procurement, planning, structured process, annotations
false
Strategic Planning
Professional Services
Linear Flow
Kearney
Add to my slides
Remove from favorites
A detailed text layout with three columns providing information on Swiss Bank, Share-Backed Lending, and IB Leveraged Finance portfolios. Text boxes highlight forward-looking risk management measures for each portfolio.
Risk Assessment and Management
Financial Services
Provides an in-depth look at selected portfolios, their investment grade ratings, exposure levels, and forward-looking risk management measures. It focuses on high-quality assets, conservative lending standards, and de-risking strategies.
Swiss Bank, Share-Backed Lending, IB Leveraged Finance, risk management, portfolios
false
Risk Assessment and Management
Financial Services
Table
Credit Suisse
Add to my slides
Remove from favorites
A diagram depicting various business areas supported by CTOO, including Wealth Management, Investment Bank, Swiss Bank, and Asset Management, with metrics for each area.
Technology and Digital Transformation
Technology & Software
This slide illustrates the support provided by Technology and Operations (CTOO) across different business areas, showcasing key metrics and the scale of foundational infrastructure.
technology, operations, business, support, metrics
false
Technology and Digital Transformation
Technology & Software
Diagram
Credit Suisse
Add to my slides
Remove from favorites
A diagram illustrating how Nielsen Streaming Signals optimize targeting intelligence. Includes boxes for CTV tuning information, individual/HHLD data, and Nielsen data science.
Technology and Digital Transformation
Media & Entertainment
Explains how Nielsen Streaming Signals improve the performance of targeting intelligence through optimization signals and data integration.
targeting, intelligence, Nielsen, streaming, optimization, data science
false
Technology and Digital Transformation
Media & Entertainment
Diagram
Nielsen
Add to my slides
Remove from favorites
A diagram showing a model of siloed private networks and a bar chart displaying the participation in private blockchain networks. It contrasts the traditional isolated networks with emerging trends of openness to public blockchains.
Market Analysis and Trends
Technology & Software
Highlights the shift from isolated private networks to a growing interest in public blockchains among enterprises, driven by the limitations of current siloed models.
Public blockchains, enterprise, trends, private networks, isolation, openness, participation, 2019, accelerated interest
false
Market Analysis and Trends
Technology & Software
Mixed Chart
EY
Add to my slides
Remove from favorites
A diagram slide featuring logos of DIRECTV, Vizio, Dish, and Roku at the top. Below, a four-step integration process for Nielsen Measurement with colored arrows indicating data flow.
Technology and Digital Transformation
Media & Entertainment
Describes the steps for integrating big data into Nielsen measurement, including data quality, demographics, exposure, and ratings calculations.
Big data, Nielsen, integration, data quality, demographics, exposure, ratings
false
Technology and Digital Transformation
Media & Entertainment
Linear Flow
Nielsen
Add to my slides
Remove from favorites
A diagram with three categories (breadth, scale, and insights) and their sub-components, representing the asset and wealth management capabilities of the firm.
Product and Service Analysis
Financial Services
An overview of the asset and wealth management services offered by the firm, categorizing them into breadth, scale, and insights. It showcases the firm's diverse asset management portfolio and its approach to providing comprehensive client solutions.
asset management, wealth management, client solutions, service analysis, comparative layout
false
Product and Service Analysis
Financial Services
Pillar
Goldman Sachs
Add to my slides
Remove from favorites
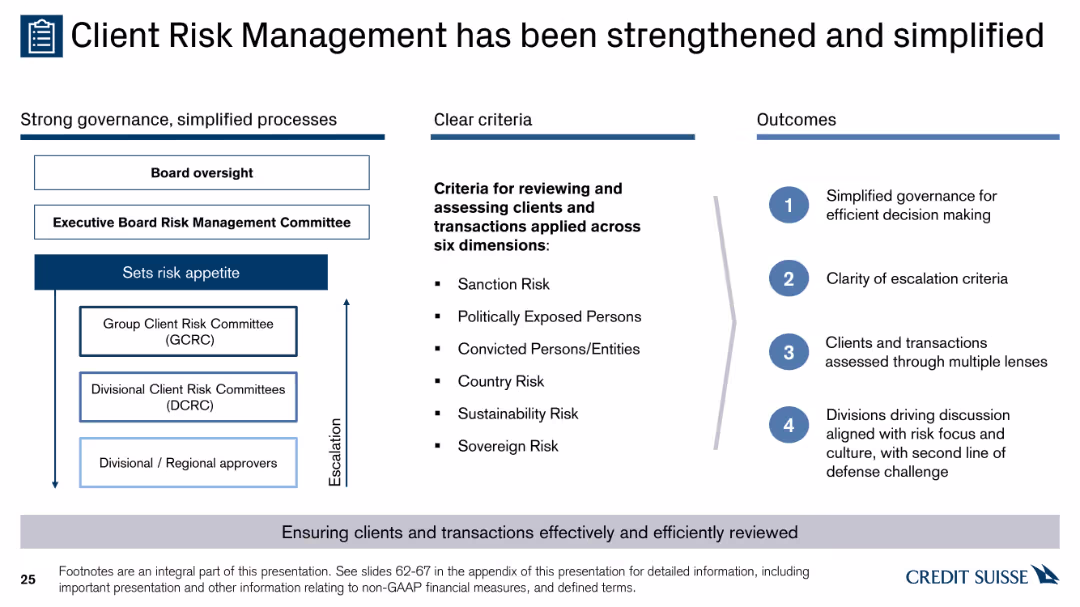
A diagram with three columns showing governance structure, criteria for reviewing clients and transactions, and outcomes. Contains text, bullet points, and arrows for escalation.
Risk Assessment and Management
Financial Services
The slide explains the enhanced and simplified client risk management process, detailing governance structures, risk criteria, and the expected outcomes for effective decision making.
governance, risk, criteria, outcomes, escalation
false
Risk Assessment and Management
Financial Services
Header Horizontal
Credit Suisse
Add to my slides
Remove from favorites
A diagrammatic slide with labeled tech clusters indicating their roles as Infrastructure, Enablers, and Applications. Uses a simple black and white scheme for a professional, analytical look.
Strategic Planning
Technology & Software
This slide demonstrates the exponential growth due to the combinatorial effects of technology across industries. It helps in understanding how the convergence of various tech advancements enables new business models and innovation, making it essential for strategic discussions about technological investments and industry evolution.
Combinatorial Effects, Technology, Growth, Innovation, Business Models, Investment, Industry Evolution
false
Strategic Planning
Technology & Software
Framework
McKinsey
Add to my slides
Remove from favorites
A diamond-shaped quadrant with four segments shows Goldman Sachs services, juxtaposed with Orsted’s services on the right.
Organizational Structure and Change
Financial Services
Describes Goldman Sachs' comprehensive service structure and how it supports a local client with global capabilities through different services.
Goldman Sachs, Global Markets, Asset Management, Investment Banking, Client Services, Orsted, Financing, Advising
false
Organizational Structure and Change
Financial Services
Header Vertical
Goldman Sachs
Add to my slides
Remove from favorites
A donut chart dominates the slide, showcasing the distribution of a firm's investment platform across various asset classes, complemented by performance metrics on the right.
Investment Analysis
Financial Services
The slide indicates a financial firm’s asset and wealth management capabilities, detailing the distribution of firmwide investments and their performance over five years. Suitable for demonstrating the firm's diversified asset management and strong performance history.
asset management, investment, performance, diversification, growth
false
Investment Analysis
Financial Services
Mixed Chart
Goldman Sachs
Add to my slides
Remove from favorites
A donut chart showing 81% of companies measure employee satisfaction.
Strategic Planning
Professional Services
Highlights the importance of measuring employee satisfaction in HR management, used for assessing HR practices.
HR, employee satisfaction, measurement, practices, assessment
false
Strategic Planning
Professional Services
Single Chart
PwC/Strategy&
Add to my slides
Remove from favorites
A donut chart showing 91% of respondents have disciplinary procedures in place.
Strategic Planning
Professional Services
Useful for HR management to evaluate the adoption and effectiveness of disciplinary procedures within organizations.
HR, disciplinary procedures, evaluation, adoption, effectiveness
false
Strategic Planning
Professional Services
Single Chart
PwC/Strategy&
Add to my slides
Remove from favorites
A doughnut chart in the center showing the distribution of crypto asset ownership categories, with percentages indicated in different colors.
Market Analysis and Trends
Financial Services
Presents data on crypto asset ownership among Canadians, highlighting the percentages of current and previous owners, and the breakdown of asset categories.
crypto ownership, crypto assets, investment funds, market analysis, financial services
false
Market Analysis and Trends
Financial Services
Mixed Chart
IPSOS
Add to my slides
Remove from favorites
A dual-axis chart showing semiconductor supply shortages and price pressures from Jan 2019 to Jan 2023, indicating supply and price trends.
Risk Assessment and Management
Technology & Software
The slide highlights the easing but still elevated semiconductor supply and price pressures, with insights into inventory improvements.
semiconductor, supply chain, price pressures, technology, risk management, inventory
false
Risk Assessment and Management
Technology & Software
Mixed Chart
Accenture
Add to my slides
Remove from favorites
A dual-axis line chart shows the percentage of banks tightening lending standards over time, contrasting US and Eurozone conditions. The slide background is white with grey recession markers.
Risk Assessment and Management
Financial Services
The slide compares credit conditions between the US and Eurozone, highlighting the risks associated with tighter lending standards. It is used to convey the potential impacts on financial stability and market conditions, likely serving as a risk assessment tool for investors or policy-makers.
Credit, US, Eurozone, Banks, Lending, Risk, Recession, Standards, 2023
false
Risk Assessment and Management
Financial Services
Multiple Chart
JP Morgan
Add to my slides
Remove from favorites
A dual-chart layout, one depicting yield/duration for various financial instruments and the other showing correlation with U.S. Treasuries, to compare rate risks and credit exposure.
Risk Assessment and Management
Financial Services
The slide contrasts the yield/duration metrics of different investment vehicles with their correlation to U.S. Treasuries, useful in risk management and investment strategy formulation.
yield, duration, rate risk, credit exposure, investment vehicles, correlation, US Treasuries, strategy
false
Risk Assessment and Management
Financial Services
Multiple Chart
Morgan Stanley
Add to my slides
Remove from favorites
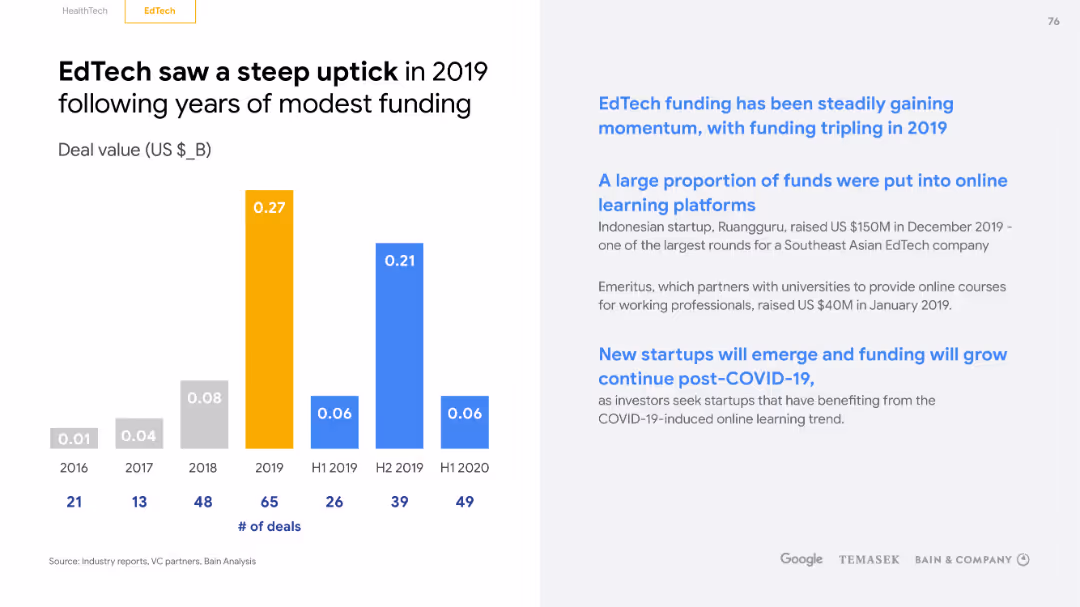
A dual-colored column chart displays EdTech funding over years with annotations. The layout includes a title at the top and a footnote, with a yellow and blue theme.
Investment Analysis
Education & Training
The slide highlights a significant increase in EdTech funding, particularly in 2019, and discusses the types of platforms that received investment, suggesting ongoing momentum and the potential for new startups in the post-COVID era.
EdTech, Funding, Increase, Investment, Startups, COVID-19, Platforms, Momentum, Growth, Potential
false
Investment Analysis
Education & Training
Single Chart
Bain
Add to my slides
Remove from favorites
A final slide in the disruption series, maintaining a consistent design with the previous slides. The text is organized in two columns, complemented by simple tech iconography. The white, blue, and black color scheme keeps the focus on the content.
Strategic Planning
Technology & Software
Concluding the series on technology-driven disruptions, this slide summarizes the transformative effects on strategy, organization, and operations, providing a high-level view of the strategic considerations necessary to navigate the evolving tech landscape. It is intended for presentations that aim to synthesize and summarize key points from a detailed discussion on cross-industry technological impacts.
Technology, Disruption, Strategy, Summary, Transformative, Organization, Operations, Considerations
false
Strategic Planning
Technology & Software
Header Vertical
McKinsey
Add to my slides
Remove from favorites
A flow chart showing the relationship between product complexity and EBITDA margin across different industries.
Product and Service Analysis
Financial Services
Compares EBITDA margins for less complex and more complex products, highlighting the impact of technical support.
EBITDA, Product Complexity, Technical Support, Margins, Distribution
false
Product and Service Analysis
Financial Services
Linear Flow
EY
Add to my slides
Remove from favorites
A flow diagram compares the client experience before and after optimization, alongside future digital interface plans.
Operational Efficiency
Financial Services
Illustrates the evolution of client experience from multiple contacts to a streamlined, digital, client-aligned global markets process.
client experience, digital transformation, global markets, trade lifecycle, operational efficiency, process optimization
false
Operational Efficiency
Financial Services
Linear Flow
Goldman Sachs
Add to my slides
Remove from favorites
A flow diagram illustrating inefficiencies in linear value chains and potential interventions. Contains icons and labeled stages from product design to end-of-life disposal.
Strategic Planning
Environmental Services & Sustainability
This slide explains the concept of the circular economy by identifying key inefficiencies in traditional linear business models and suggesting strategic interventions to mitigate these inefficiencies, thereby creating business value through sustainability practices.
circular economy, sustainability, business strategy, value chain, inefficiencies
false
Strategic Planning
Environmental Services & Sustainability
Linear Flow
Accenture
Add to my slides
Remove from favorites
A flow diagram illustrating the semiconductor value chain from design to final product, including stages like manufacturing and assembly. Each stage is visually separated and described.
Technology and Digital Transformation
Technology & Software
This slide provides an overview of the semiconductor value chain, detailing each step from design through manufacturing and assembly to the final product, highlighting opportunities in each stage.
Semiconductor, value chain, manufacturing, design, assembly
false
Technology and Digital Transformation
Technology & Software
Diagram
Deloitte
Add to my slides
Remove from favorites
A flowchart depicting a typical enterprise procurement process with steps from proposal to payment receipt. Accompanied by bullet points explaining the reasons for starting with procurement and its suitability for blockchain applications.
Operational Efficiency
Technology & Software
Describes EY's Network Procurement module within OpsChain 4.0, highlighting its deployment on the Baseline Protocol and the rationale for focusing on procurement processes first.
OpsChain, Network Procurement, Baseline Protocol, blockchain, enterprise procurement, EY, process flow, efficiency
false
Operational Efficiency
Technology & Software
Graphic
EY
Add to my slides
Remove from favorites
A flowchart depicting the transformation of fund distribution channels from a traditional linear model to an emerging digital (on-chain) distribution model. Includes roles like fund managers, custodians, and transfer agents, with arrows indicating the process flow.
Operational Efficiency
Financial Services
Illustrates the transformation of fund distribution channels, highlighting the shift from traditional linear relationships to integrated digital (on-chain) distribution platforms, promoting efficiency and accessibility for investors.
distribution channels, digital, fund managers, transformation, efficiency
false
Operational Efficiency
Financial Services
Linear Flow
EY
Add to my slides
Remove from favorites
A flowchart diagram showing the interconnectivity of privacy-preserving technologies, including data platforms, clean rooms, and activation channels.
Technology and Digital Transformation
Technology & Software
Depicts the interconnectivity of various privacy-preserving technologies, emphasizing the integration of data platforms and clean rooms for secure data management.
privacy-preserving, interconnectivity, data platforms, clean rooms, technology
false
Technology and Digital Transformation
Technology & Software
Diagram
IPSOS
Add to my slides
Remove from favorites
A flowchart illustrating a complex money laundering scheme, with various entities and financial flows depicted.
Risk Assessment and Management
Financial Services
This slide explains the complexity of money laundering schemes, detailing the roles of different entities and the financial transactions involved.
Money laundering, flowchart, financial transactions, sophisticated criminals, risk assessment
false
Risk Assessment and Management
Financial Services
Diagram
Credit Suisse
Add to my slides
Remove from favorites
A flowchart with three main sections: Trend Screening, Trend Assessment, and TrendRadar, visually connecting these steps through a funnel.
Market Analysis and Trends
Professional Services
Explains the three-step procedure of TrendRadar, which includes trend screening, assessment, and visualization for identifying and assessing industry trends.
TrendRadar, procedure, trend screening, assessment, visualization
false
Market Analysis and Trends
Professional Services
Mixed Chart
Deloitte
Add to my slides
Remove from favorites
A flowchart with various privacy controls and methods, ranging from basic to advanced, listed in red blocks on the left side of the slide.
Risk Assessment and Management
Professional Services
Outlines different privacy controls and methods for protecting consumer data, from encryption and redaction to advanced techniques like random noise injection.
privacy controls, consumer data, encryption, redaction, privacy methods
false
Risk Assessment and Management
Professional Services
Vertical Flow
IPSOS
Add to my slides
Remove from favorites
A forward-looking slide with green and blue column charts representing projected capital accretion and associated annotations. The design uses contrasting colors to distinguish between negative and positive values.
Investment Analysis
Financial Services
Projects the potential upside from the bank's securities portfolio, with a focus on capital accretion over a multi-year timeline, using an implied forward curve for estimations.
securities portfolio, capital accretion, projections, AOCI, forward curve
false
Investment Analysis
Financial Services
Single Chart
Goldman Sachs
Add to my slides
Remove from favorites
A gauge diagram in a gradient from orange to yellow, indicating a balance between operational and strategic focuses, with a pointer set at 'Balanced'.
Market Analysis and Trends
Professional Services
Analyzes the focus of organizations on operational versus strategic approaches, providing insights into how companies balance daily operations with long-term strategic planning.
operational, strategic, focus, planning, balance, organizations, approaches
false
Market Analysis and Trends
Professional Services
Single Chart
PwC/Strategy&
Add to my slides
Remove from favorites
A global map highlighted in purple shades with yield percentages for various countries prominently displayed, facilitates a geographical comparison of equity yields.
Market Analysis and Trends
Financial Services
This visual slide displays global equity yields, simplifying the comparison of investment returns across countries, which can guide international investment strategies.
global, equity yields, investment returns, geographical comparison, countries, map, strategy, finance
false
Market Analysis and Trends
Financial Services
Graphic
Morgan Stanley
Add to my slides
Remove from favorites
A global map highlights the firm's presence in the ultra-high net worth segment. The slide contains numerical data points and a concise list of services offered, presented with a balanced use of space and a clear font.
Market Analysis and Trends
Financial Services
Showcasing the firm as a leader in the ultra-high net worth sector, this slide communicates the extensive global reach, services offered, and the substantial assets under supervision.
ultra-high net worth, global, wealth management, assets
false
Market Analysis and Trends
Financial Services
Graphic
Goldman Sachs
Add to my slides
Remove from favorites
A graph displays patent family citations in future mobility against a teal background, accompanied by statistical highlights.
Strategic Planning
Transportation & Logistics
Focuses on Ford's patents in the future of mobility sector, including AI and electric vehicles, with a high percentage of recent patents.
Ford, future of mobility, patents, autonomous, AI, electric vehicles
true
Strategic Planning
Transportation & Logistics
Single Chart
BCG
Add to my slides
Remove from favorites
A graph slide with a bar chart showing the levels of concern across different sectors for ESG dimensions. The slide is divided into three sections with color-coded bars corresponding to environment, social, and governance concerns.
Risk Assessment and Management
Technology & Software
Analyzes ESG concerns in SEA's core digital economy sectors, highlighting the higher levels of concern in areas like e-commerce, transport, and gaming.
ESG, sustainability, SEA, digital economy, concerns, environment, social, governance, sectors
false
Risk Assessment and Management
Technology & Software
Table
Bain
Add to my slides
Remove from favorites
A graphic representation of Citibank's business sectors shown in a circular synergy diagram, distinguishing between institutional and personal banking with arrows indicating interactions.
Strategic Planning
Financial Services
The slide visually depicts the synergies between different Citibank business units, suitable for illustrating organizational structure and inter-departmental cooperation within the financial services industry.
Synergies, Personal Banking, Wealth Management, Institutional, Citibank, Organizational Structure
false
Strategic Planning
Financial Services
Framework
Citigroup
Add to my slides
Remove from favorites
A graphic scale compares traits of a 'Stable Organisation' and an 'Adaptable Organisation' with colored circles denoting each trait's presence in an organization. There are icons representing different organizational qualities.
Strategic Planning
Professional Services
Compares behavioral traits between stable and adaptable organizations to prompt discussions on strategic planning and organizational adaptability within professional services.
adaptability, stable, organisation, strategic, planning, traits
false
Strategic Planning
Professional Services
Single Chart
Deloitte
Add to my slides
Remove from favorites
A graphical timeline illustrating significant ESG milestones from pre-2020 to 2024, marked with icons and brief descriptions of each achievement.
Strategic Planning
Financial Services
Outlines Barclays' progression in ESG initiatives over several years, demonstrating commitments like joining the Paris Pledge and setting new financing restrictions.
ESG, sustainability, strategic milestones, climate action, corporate responsibility, green financing
false
Strategic Planning
Financial Services
Linear Flow
Barclays
Add to my slides
Remove from favorites
A graphically dense slide with multiple data presentations, including bar charts, icons, and callouts to highlight key figures. The slide presents information in contrasting colors of blue and yellow, with clear demarcations for different sections. Visuals include statistics on battery electric vehicles (BEVs), charts showing a premium vs. overall market share, and highlighted quotations for emphasis. There is a clear hierarchy of information from top to bottom with a strong visual flow.
Technology and Digital Transformation
Industrial & Manufacturing
Discusses the advantage of the company's tires in electric vehicles (EVs) and presents data on the adoption of BEVs. It provides insights on market share and future sales projections, relevant for conversations on technology strategy in the automotive sector.
electrification, OEM, BEVs, market share, technology, tires, electric vehicles, sales projections, automotive
false
Technology and Digital Transformation
Industrial & Manufacturing
Mixed Chart
Morgan Stanley
Add to my slides
Remove from favorites
A graphically dense slide with statistics on internet downloads, preferences for network reliability, and illustrations that emphasize user engagement with the nbn™ network.
Technology and Digital Transformation
Telecommunications
Highlights the preferred status of the nbn™ network in Australia, its value to users, and the significant amount of internet traffic it handles.
Internet, Downloads, nbn, Connectivity, User Preference, Traffic
false
Technology and Digital Transformation
Telecommunications
Pillar
Accenture
Add to my slides
Remove from favorites
A graphically intensive slide illustrating growth opportunities and textual information on a dark background.
Investment Analysis
Financial Services
This slide outlines the estimated growth opportunities across different financial sectors, highlighting the engineering support for these initiatives.
Growth, Opportunities, Franchise, Investing, Banking, Revenue, Engineering
false
Investment Analysis
Financial Services
Vertical Flow
Goldman Sachs
Add to my slides
Remove from favorites
A graphically intensive slide that presents a colorful chart depicting future energy consumption trends, balanced with descriptive text to the side.
Technology and Digital Transformation
Energy & Utilities
The slide projects future trends in the global energy mix, with a focus on the growing role of electricity and hydrogen. The chart and accompanying text highlight key findings, such as the expected increase in the share of these energy sources, driven by technological advancements and policy measures. It offers a visual representation of the data discussed in the report, making complex projections more accessible and emphasizing the shift towards cleaner energy sources.
Energy Trends, Electricity, Hydrogen, Future Projections
true
Technology and Digital Transformation
Energy & Utilities
Mixed Chart
McKinsey
Add to my slides
Remove from favorites
A gray and purple map highlights selected cities with their economic contribution in bubbles, and explanatory text to the side, with a clean and effective presentation of data.
Financial Performance
Technology & Software
Demonstrates the significant economic contribution of Greater Jakarta to Indonesia's GDP, offering a geographic and economic overview for potential investors or policymakers.
Jakarta, GDP, economic contribution, Indonesian economy
false
Financial Performance
Technology & Software
Single Chart
Kearney
Add to my slides
Remove from favorites
A green and white slide detailing Ford's contribution to US GDP, including manufacturing and multiplier effects.
Financial Performance
Transportation & Logistics
Captures the overarching economic contribution of Ford to the US GDP, with a focus on manufacturing, sales, and associated multiplier effects from employee spending.
Ford, US GDP, economic contribution, manufacturing, multiplier effects, vehicle sales, after-sales service, community impact
true
Financial Performance
Transportation & Logistics
Single Chart
BCG
Add to my slides
Remove from favorites
A grey-scale donut chart shows the percentage of GDP generated by sectors with varying degrees of exposure to the net-zero transition. Blue accents highlight key sections. Additional text provides context and analysis.
Risk Assessment and Management
Environmental Services & Sustainability
Addresses the uneven impact of the net-zero transition across the economy, specifying which sectors are most exposed in terms of GDP contribution. Offers insights into potential risk areas within the economic shift.
Net-Zero, Economic Exposure, GDP, Sectors, Transition, Risk Management
false
Risk Assessment and Management
Environmental Services & Sustainability
Single Chart
McKinsey
Add to my slides
Remove from favorites
A grid illustrating strategic business areas with adjacent opportunities, indicating expansion directions with arrows.
Strategic Planning
Financial Services
Explores expansion strategies by leveraging synergies between existing and new business areas, essential for strategic market expansion discussions.
Market Expansion, Strategic Adjacencies, Business Development, Growth, Addressable Market
false
Strategic Planning
Financial Services
Framework
Goldman Sachs
Add to my slides
Remove from favorites
A grid layout with icons and text describes different technology implementation strategies. The design is instructional, with clear delineation between the models and a blue and black color scheme for readability.
Technology and Digital Transformation
Professional Services
This slide examines four archetypes of technology implementation within organizations. It's pivotal for leadership discussions about technology adoption, indicating the necessity for a strategic fit with existing business models and highlighting how ecosystems can facilitate technology integration.
Technology Implementation, Strategy, Business Model, Ecosystems, Organizational Fit
false
Technology and Digital Transformation
Professional Services
Header Horizontal
McKinsey
Add to my slides
Remove from favorites
A hexagon-shaped diagram in the center connected to multiple client types like Pensions, Insurers, etc. It uses shades of blue and has a balanced distribution of text and graphic elements.
Financial Performance
Financial Services
The slide illustrates the firm's capabilities in providing holistic solutions through asset allocation, market views, and risk management, targeting various institutional client types.
Asset Allocation, Holistic, Solutions, Management
false
Financial Performance
Financial Services
Framework
Goldman Sachs
Add to my slides
Remove from favorites
A highlighted map of Europe with key strategy points listed to the left, and a descriptive heading at the top. Neat layout with icons and colored text boxes.
Strategic Planning
Financial Services
Focuses on the growth and strategic positioning within the developed European markets, outlining opportunities and initiatives to strengthen the company's presence.
Strategy, Europe, market growth, development, positioning
false
Strategic Planning
Financial Services
Table
Goldman Sachs
Add to my slides
Remove from favorites
A historical chart comparing CPI growth rates across different decades, annotated with tenure markers for investment roles.
Investment Analysis
Financial Services
Examines historical inflation trends and their impact on investment, emphasizing the experience of investors during various economic periods.
Inflation, CPI, Investment, Historical Trends, Economic Periods, Senior Partner, Market Stability, Financial History
false
Investment Analysis
Financial Services
Mixed Chart
Bain
Add to my slides
Remove from favorites
A horizontal bar chart comparing conservative and aggressive investment attitudes before and during the pandemic, with a small shift chart showing more conservative or risky attitudes over time.
Market Analysis and Trends
Financial Services
Examines how Canadian investors' attitudes toward investing have shifted due to the pandemic, comparing conservative and aggressive investment attitudes before and after.
attitude, investing, conservative, aggressive, shift
false
Market Analysis and Trends
Financial Services
Multiple Chart
IPSOS
Add to my slides
Remove from favorites
A horizontal bar chart listing factors negatively affecting HR function, highlighting the top three factors.
Strategic Planning
Professional Services
Slide illustrates major barriers in HR function performance, useful in HR management discussions for identifying critical areas of focus.
HR, barriers, management, performance, top three
false
Strategic Planning
Professional Services
Single Chart
PwC/Strategy&
Add to my slides
Remove from favorites
A horizontal bar chart listing the most demanding work problems faced by CIOs, with 'Resources/Talent' being the top issue. Each bar represents a different problem and its percentage of respondents.
Human Resources and Talent Management
Professional Services
The slide identifies the top challenges faced by CIOs, with a particular focus on issues related to resources and talent, making it a tool for HR strategy discussions.
CIO Challenges, Talent Management, HR Issues, Professional Services, Workplace Problems
false
Human Resources and Talent Management
Professional Services
Mixed Chart
Gartner
Add to my slides
Remove from favorites
A horizontal bar chart showing the percentage of titles distributed among various linear and OTT services as of February 2022, alongside a key statistic of 817K unique program titles.
Product and Service Analysis
Media & Entertainment
The slide provides an overview of the distribution of video content titles across different services, emphasizing the growth in content availability.
video, content, titles, services, distribution
false
Product and Service Analysis
Media & Entertainment
Mixed Chart
Nielsen
Add to my slides
Remove from favorites
A horizontal five-step roadmap diagram with circular nodes and accompanying text. The design is clear with a simple color scheme directing focus to each step of the process.
Technology and Digital Transformation
Professional Services
Details a strategic roadmap for crafting employee experience, from organizational review to governance and continuous improvement.
employee experience, organizational strategy, governance, continuous improvement, roadmap
false
Technology and Digital Transformation
Professional Services
Linear Flow
Deloitte
Add to my slides
Remove from favorites
A horizontal flow chart listing six execution priorities under the vision to create a global wealth manager.
Strategic Planning
Financial Services
Outlines the strategic priorities for Wealth Management, emphasizing integration, growth, and risk management.
strategy, execution priorities, wealth management, global vision, risk management
false
Strategic Planning
Financial Services
Diagram
Credit Suisse
Add to my slides
Remove from favorites
A horizontal layout showing key export products of various Central American countries. Each product is listed under the respective country’s flag and accompanied by percentage data.
Market Analysis and Trends
Industrial & Manufacturing
The slide highlights the main export products from different Central American countries, showcasing their manufacturing capabilities and potential for leveraging friendshoring opportunities.
Exports, Central America, products, friendshoring, manufacturing
false
Market Analysis and Trends
Industrial & Manufacturing
Linear Flow
Deloitte
Add to my slides
Remove from favorites
A horizontal line chart illustrating shifts in investment practices among investors, focusing on factors like cost of capital and valuation approaches. Labeled with percentages for clarity.
Operational Efficiency
Financial Services
Explores changes in investor behavior in response to a recessionary environment, noting a more conservative approach in valuing investments and managing capital.
investing practices, recession, conservative strategies
false
Operational Efficiency
Financial Services
Single Chart
BCG
Add to my slides
Remove from favorites
A horizontal process diagram illustrates the client experience from solutioning through onboarding, lending, servicing, to content delivery, complemented by performance and efficiency icons.
Operational Efficiency
Financial Services
Focuses on operational excellence and client experience through various banking services.
Client, experience, KYC, lending, servicing, operational, excellence, onboarding, banking
false
Operational Efficiency
Financial Services
Linear Flow
JP Morgan
Add to my slides
Remove from favorites
A horizontal timeline highlights key milestones in the company's history with descriptive text and images.
Industry Overview
Technology & Software
Traces the technological evolution of IBKR over four decades, marking significant milestones and innovations in trading platforms.
IBKR, Technological Evolution, Milestones, Automated Trading, Timeline, Innovations, Broker-Dealer, Market Expansion
false
Industry Overview
Technology & Software
Linear Flow
Goldman Sachs
Add to my slides
Remove from favorites
A laptop screen displaying a dashboard with a pie chart and list of financial data, mostly in white and gray colors.
Financial Performance
Financial Services
The slide demonstrates a workbench for relationship managers, showcasing client information, asset allocation, and portfolio details.
Relationship manager, dashboard, financial data, pie chart, portfolio
false
Financial Performance
Financial Services
Mixed Chart
Credit Suisse
Add to my slides
Remove from favorites
A large column chart details the reasons why sustainability matters in luxury goods purchases.
Customer and Market Segmentation
Environmental Services & Sustainability
Analyzes consumer priorities regarding sustainability in the context of luxury goods.
sustainability, luxury goods, consumer priorities, environmental impact
false
Customer and Market Segmentation
Environmental Services & Sustainability
Single Chart
BCG
Add to my slides
Remove from favorites
A large column chart displays the growth of Indonesia’s internet economy, with projections to 2025. A smaller line graph shows the Compound Annual Growth Rate (CAGR).
Market Analysis and Trends
Technology & Software
Shows Indonesia's growing internet economy with projections suggesting robust future growth, symbolizing a positive economic outlook.
Indonesia, Internet Economy, Growth, Projection, CAGR, Optimism, $70B, 2025
false
Market Analysis and Trends
Technology & Software
Single Chart
Bain
Add to my slides
Remove from favorites
A large multi-colored area graph dominates this slide, charting the increase in daily COVID-19 cases by region from March to December. The background is gray, and each region (like North America, South America) is represented in a different color, with key data points highlighted on the graph.
Strategic Planning
Healthcare & Pharmaceuticals
Details the dramatic increase in COVID-19 cases globally with a focus on recent months. It provides a visual analysis of the pandemic's surge in different regions, emphasizing the growth in cases and the ongoing challenges in managing the spread.
COVID-19, daily cases, global, regions, pandemic, trends, healthcare
false
Strategic Planning
Healthcare & Pharmaceuticals
Single Chart
BCG
Add to my slides
Remove from favorites
A large pie chart on the left and a bar graph on the right against a purple background with descriptive text boxes.
Strategic Planning
Telecommunications
Examines how the nbn™ network aligns with user values, indicating a significant agreement on its positive impact on their lives.
user values, nbn network, life impact, agreement percentage, life goals, value alignment, network benefits, survey data
false
Strategic Planning
Telecommunications
Multiple Chart
Accenture
Add to my slides
Remove from favorites
A layered diagram slide, detailed with icons and labels. It presents a technology stack with an integrated model including Client Interaction, Orchestration, and Core Processing layers.
Technology and Digital Transformation
Technology & Software
Describes the structure of J.P.Morgan's payment business's technology stack and the components that enable their service offerings.
Technology Stack, Payments, J.P.Morgan, Integration, Engineering, Fintech Partnerships
false
Technology and Digital Transformation
Technology & Software
Table
JP Morgan
Add to my slides
Remove from favorites
A layout that combines pie charts and text sections to compare market positions across the U.S., Asia, and Mexico, using a blue and dark gray color scheme for visual clarity.
Competitive Landscape
Financial Services
Discussing leading market positions in various regions, the slide provides data on net income, revenue, client numbers, and banking performance, offering a global competitive analysis.
Market Positions, Diversified Business, Net Income, Revenue, Clients, Banking, Competitive Analysis, Global Strategy, Performance
false
Competitive Landscape
Financial Services
Multiple Chart
Citigroup
Add to my slides
Remove from favorites
A layout with two bubble charts, each showing the benefits organizations hope to gain from generative AI, with text explanation on the left.
Market Analysis and Trends
Technology & Software
It explores the tactical and strategic benefits organizations seek from generative AI, focusing on efficiency, productivity, cost reduction, innovation, and growth.
Generative AI, Efficiency, Growth, Strategy, Benefits
false
Market Analysis and Trends
Technology & Software
Mixed Chart
Deloitte
Add to my slides
Remove from favorites
A line and bar graph depict the trend of digital investments in Indonesia from 2016 to 2020, with accompanying text on investment values and deal numbers.
Investment Analysis
Technology & Software
This slide presents the growing trend of digital investments in Indonesia, illustrating a doubling of investment in 2020.
Digital investments, trends, Indonesia, growth, deal value
false
Investment Analysis
Technology & Software
Single Chart
Kearney
Add to my slides
Remove from favorites
A line chart comparing 'Goods' (in blue) and 'Services' (in orange) spending by US consumers is presented on this slide. The chart tracks the spending index from December 2019, showing a sharp decline followed by a recovery with fluctuating levels for both categories.
Financial Performance
Technology & Software
This slide shows the impact of the pandemic on US consumer spending, demonstrating changes in the level and composition of expenditures on goods and services. It could be used to analyze consumer behavior during economic shocks and guide business strategy adjustments.
Pandemic, Consumer Spending, US, Goods, Services, Economic Impact, Spending Behavior
false
Financial Performance
Technology & Software
Single Chart
JP Morgan
Add to my slides
Remove from favorites
A line chart comparing Netflix's penetration rates in MVPD (Multichannel Video Programming Distributor) and Non-MVPD U.S. TV households over several quarters. The chart uses two lines to represent each category's penetration trend.
Market Analysis and Trends
Media & Entertainment
This slide compares the penetration of Netflix in MVPD versus Non-MVPD U.S. TV households, showing trends and growth patterns over multiple quarters from Q1 2018 to Q4 2021.
Netflix penetration, MVPD, Non-MVPD, U.S. households, quarterly trends
false
Market Analysis and Trends
Media & Entertainment
Single Chart
Nielsen
Add to my slides
Remove from favorites
A line chart comparing sectors such as CGS, Auto/IE, LS/Pharma/Biotech, Retail, and Travel/Hospitality in terms of leadership behaviors related to I&D.
Strategic Planning
Retail & E-commerce
Analyzes retail sector's performance in managing talent pipelines and recognizing I&D efforts compared to other sectors.
retail, talent pipelines, I&D, sector comparison, leadership behavior, line chart, performance analysis
false
Strategic Planning
Retail & E-commerce
Mixed Chart
Accenture
Add to my slides
Remove from favorites
A line chart comparing the S&P 500 Quality Index to the S&P 500. The chart is superimposed on recession period markers. The background is white, with the 'Equities' category highlighted in green.
Financial Performance
Financial Services
This slide examines the performance of high-quality stocks during recession periods, likely intended for financial analysts and investors focusing on long-term investment strategies and the resilience of quality stocks in turbulent times.
S&P 500, Quality, Performance, Recession, Equities, Analysis, Investment
false
Financial Performance
Financial Services
Single Chart
JP Morgan
Add to my slides
Remove from favorites
A line chart depicting the annual variation of FDI in Central America from 2015 to 2022, with notable events marked along the timeline. The chart uses a single blue line on a black background.
Investment Analysis
Financial Services
The slide shows the trend of Foreign Direct Investment in Central America, noting significant events that impacted investment levels, such as tariffs, COVID-19, and the Russia-Ukraine war.
FDI, Central America, investment, line chart, trends
false
Investment Analysis
Financial Services
Single Chart
Deloitte
Add to my slides
Remove from favorites
A line chart depicting the fluctuating contribution of social media to company performance, with annotations for significant changes.
Performance Metrics and KPIs
Professional Services
Evaluates the impact of social media on company performance, essential for performance tracking in consumer services and retail.
social media, performance, consumer services, retail, impact, fluctuation, evaluation, tracking, change, contribution
false
Performance Metrics and KPIs
Professional Services
Mixed Chart
Deloitte
Add to my slides
Remove from favorites
A line chart depicting the viewership decline of top movies over time, including titles like Don’t Look Up, Red Notice, and Encanto.
Performance Metrics and KPIs
Media & Entertainment
This slide analyzes the sharp decline in viewership minutes for popular movies shortly after release, emphasizing the transient nature of interest.
line chart, movies, viewership, decline, entertainment, trends
false
Performance Metrics and KPIs
Media & Entertainment
Single Chart
Nielsen
Add to my slides
Remove from favorites
A line chart displaying the integration cost as a percentage of cost synergies, with marked percentiles and a clear delineation of the median.
Financial Performance
Professional Services
Analyzes integration costs relative to annual synergies, providing a financial perspective on the cost-effectiveness of integration strategies.
integration, costs, synergies, financial analysis, cost-effectiveness
false
Financial Performance
Professional Services
Single Chart
Deloitte
Add to my slides
Remove from favorites
A line chart displaying trends in GDP per capita from 2011 to 2016 for several US metro areas, each represented by a different colored line, with highlighted points for areas like San Francisco and Washington DC.
Financial Performance
Transportation & Logistics
Analyzes economic growth in U.S. metropolitan areas through GDP per capita over time, highlighting regions with significant changes. Useful for economic planning and assessment.
GDP, economic growth, metro areas, US, trends, financial analysis
false
Financial Performance
Transportation & Logistics
Single Chart
BCG
Add to my slides
Remove from favorites
Previous
Next
You don't have any favorites yet.
Please wait loading your favorites slides...
Create a FREE account to continue browsing
Receive Instant Access to 7,500+ of the internet's best slides
First Name
Last Name
Email
Password
I agree to all
Terms & Privacy Policy
Thank you! Your submission has been received!
Oops! Something went wrong while submitting the form.
Have an account?
Sign in
Upgrade to PRO to Save slides
Advanced Search and Filters
Access to 8,000+ slides
Access to Category Pages
Save/Bookmark Slides
PowerPoint Template Library
(Coming Soon)
Pick a Plan
MONTHLY
$12/month
Billed every month, Cancel anytime.
YEARLY
$9/year
Billed $108 annually, Cancel anytime.
Checkout for $12/month
Checkout for $108/yr
Secured by Stripe | AES-256 bit encryption