My Account
My Slides
Search by Category
Companies
Slide Type
Use Case
Industry
Pricing
Templates
View All Templates
Download Template Slides
✦ AI
AI Prompt Library
AI Search
Feedback
Login
Logout
Get Started
Browse all Slides
Browse all Slides
Create a FREE Account
Instant access to 1,000+ real slides from top companies like McKinsey, BCG, Goldman Sachs, Google and many more!
First Name
Last Name
Email
Password
I agree to all
Terms & Privacy Policy
Thank you! Your submission has been received!
Oops! Something went wrong while submitting the form.
Have an account?
Sign in
Saved Slides
Total No. of slides saved
0
↻ Refresh
✖ Clear all
Timeline with icons and dates marking significant investments in battery manufacturing.
Investment Analysis
Industrial & Manufacturing
Showcases recent investments and future projections for battery manufacturing in India.
battery manufacturing, investments, India, lithium-ion, timeline
false
Investment Analysis
Industrial & Manufacturing
Linear Flow
PwC/Strategy&
Add to my slides
Remove from favorites
Features a column chart and text detailing the forecasted supply challenges for lithium, nickel, and cobalt. The charts and textual content are arranged in a grid layout on a dark background.
Operational Efficiency
Energy & Utilities
Analyzes the projected shortages in key battery materials and their impact on the battery supply chain, emphasizing the need for increased mining and recycling efforts.
battery materials, lithium, nickel, cobalt, supply chain, shortages, mining, recycling
false
Operational Efficiency
Energy & Utilities
Mixed Chart
Accenture
Add to my slides
Remove from favorites
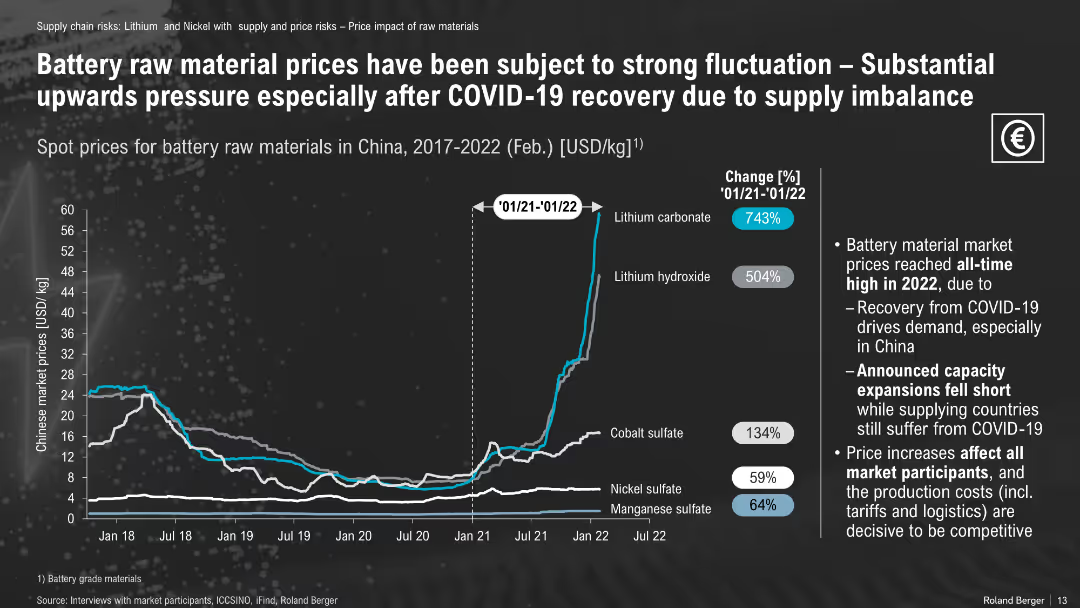
Line graph of raw material prices (2017–2022); change percentages annotated
Pricing Strategies
Energy & Utilities
Raw material prices for batteries surged post-COVID, with lithium carbonate and hydroxide increasing over 500%. The slide emphasizes price volatility due to delayed capacity expansion and recovery-driven demand.
battery materials, lithium prices, COVID impact, cobalt, nickel, price spike
false
Pricing Strategies
Energy & Utilities
Mixed Chart
Roland Berger
Add to my slides
Remove from favorites
A line graph illustrates the forecasted price trends for lithium-ion battery packs up to 2030, accompanied by detailed text analysis. The graph is set against a dark background with purple and grey lines.
Financial Performance
Energy & Utilities
Discusses the impact of critical material shortages on the future pricing of lithium-ion battery packs, highlighting expected price increases and their implications for the market.
battery prices, lithium-ion, market trends, price increase, economic impact, forecasting
false
Financial Performance
Energy & Utilities
Mixed Chart
Accenture
Add to my slides
Remove from favorites
Bar chart outlines who consumers believe should manage the end-of-life of EV batteries, categorized by responsibility preferences such as recycling companies and government agencies.
Strategic Planning
Environmental Services & Sustainability
Analyzes consumer opinions on the responsibility for EV battery lifecycle management, important for strategic planning in sustainability practices within the environmental sector.
battery recycling, lifecycle management, consumer opinions, sustainability, environmental responsibility, strategic planning, EV batteries
false
Strategic Planning
Environmental Services & Sustainability
Single Chart
Deloitte
Add to my slides
Remove from favorites
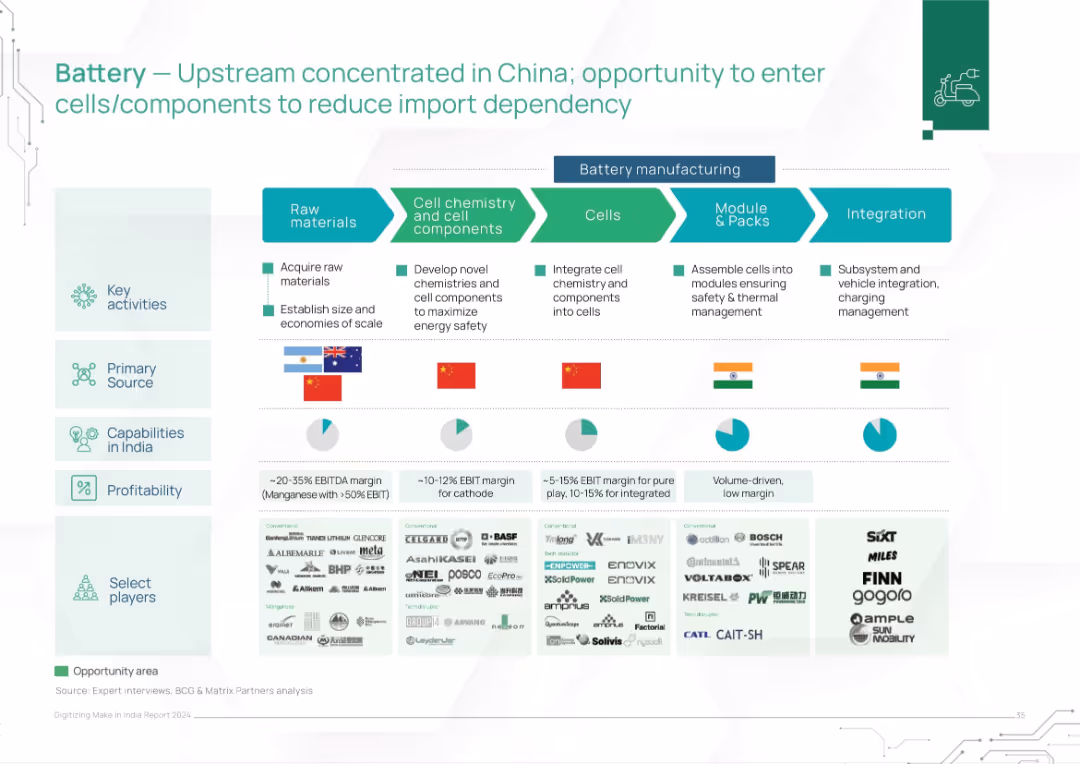
Horizontal flowchart with 5 battery manufacturing stages, showing key activities, source countries, profitability, and notable players below. Icons and pie charts enhance clarity.
Strategic Planning
Energy & Utilities
This slide analyzes the battery manufacturing value chain, identifying upstream concentration in China. It highlights opportunities for India in cell/module integration, showing capabilities, margins, and select players across the chain. Visuals underscore India's potential in downstream manufacturing and low dependency.
battery supply chain, China dependency, manufacturing margin, India capabilities, energy storage, electric vehicles, integration, modules, raw materials, cell chemistry
false
Strategic Planning
Energy & Utilities
Mixed Chart
BCG
Add to my slides
Remove from favorites
Features a comparison of different battery technologies, including lithium-ion, flow batteries, and sodium-ion. The slide uses bar graphs to depict expected global demand and Australia's relative strength in these technologies. Color coding and icons are used to visually differentiate each technology type, with additional textual descriptions providing context on their applications and advantages.
Competitive Landscape
Energy & Utilities
Analyzes the market potential and advantages of various battery technologies, focusing on Australia's strengths and opportunities in sectors like lithium-ion and flow batteries.
battery technologies, Australia, global market, lithium-ion, flow batteries, sodium-ion, market analysis, technology strengths, future potential, energy storage
false
Competitive Landscape
Energy & Utilities
Mixed Chart
Accenture
Add to my slides
Remove from favorites
Table comparing different battery technologies (e.g., Na sulfur, solid state battery) with parameters like technology readiness level, implementation timeline, energy density, and cycle life.
Technology and Digital Transformation
Technology & Software
The slide provides a comparative analysis of various frontier battery technologies, detailing their readiness levels, implementation timelines, energy densities, and potential applications. It highlights the importance of advancing battery technology to support the transition away from fossil fuels.
Battery Technology, Energy Storage, Implementation
false
Technology and Digital Transformation
Technology & Software
Table
Roland Berger
Add to my slides
Remove from favorites
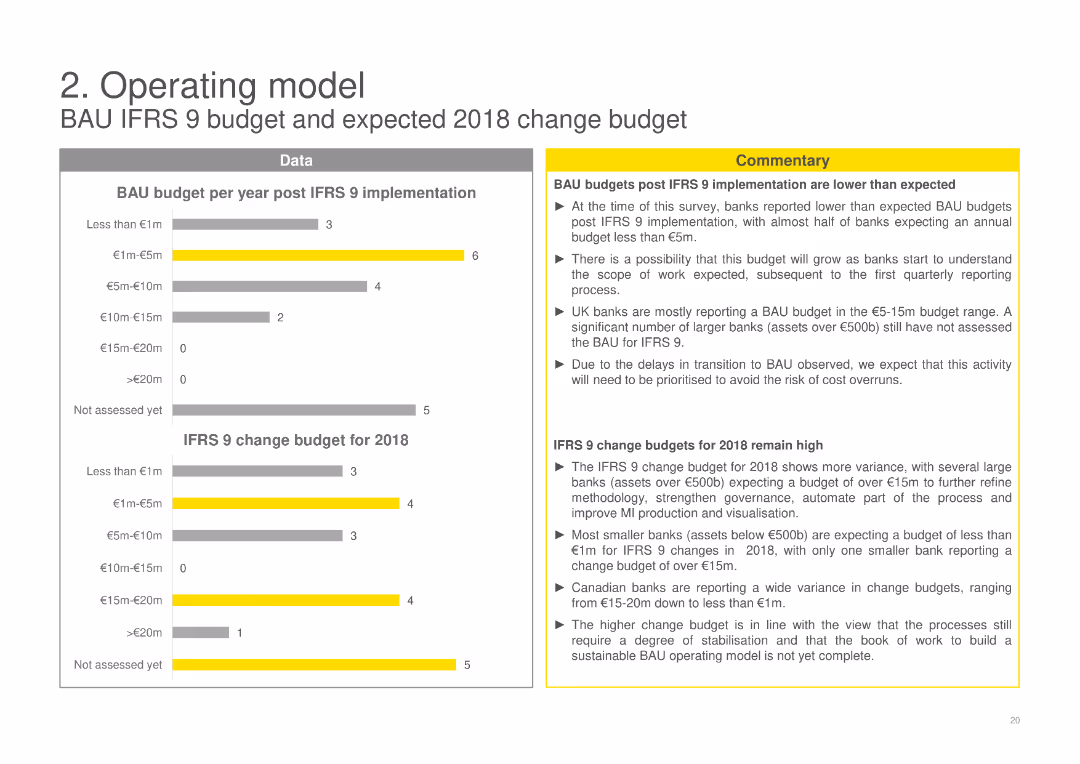
Contains column charts showing the BAU budget per year post-IFRS 9 implementation and the IFRS 9 change budget for 2018, with commentary discussing the variances in budget expectations and actual allocations among banks.
Operational Efficiency
Financial Services
Discusses the budget allocations for BAU post-IFRS 9 and change budgets for 2018, highlighting variances and expectations among banks, and the impact on financial planning and budgeting post-implementation.
BAU budget, IFRS 9, financial planning, budget variance, financial services
false
Operational Efficiency
Financial Services
Multiple Chart
EY
Add to my slides
Remove from favorites
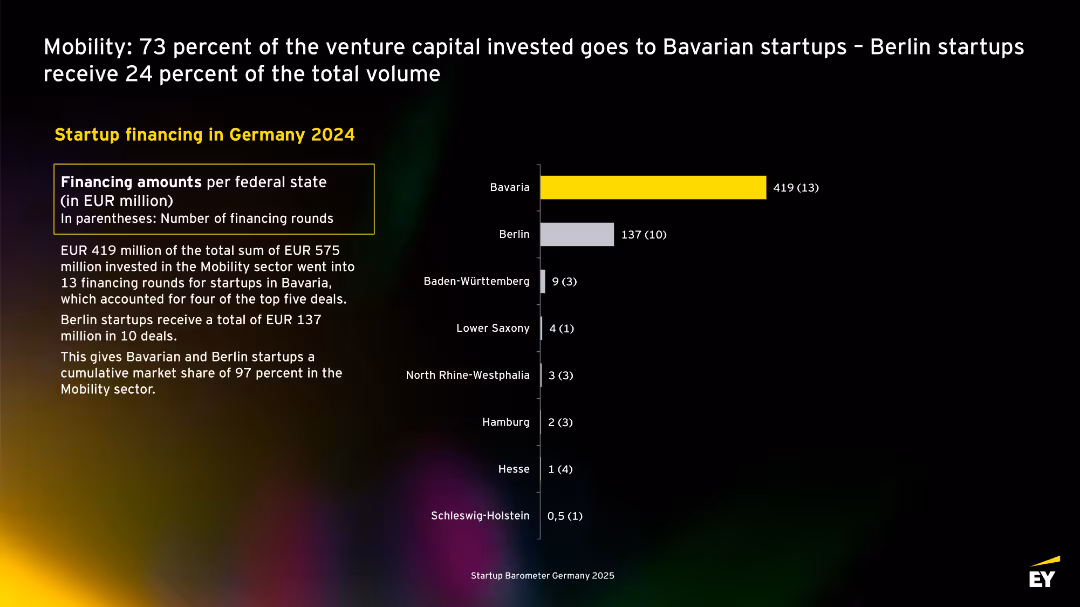
Bar chart ranks federal states by funding; yellow bar for Bavaria; narrative details dominance of Bavarian and Berlin startups.
Investment Analysis
Transportation & Logistics
Bavarian startups received EUR 419M of EUR 575M total mobility funding in 2024 (73%). Berlin follows with EUR 137M. The slide emphasizes Bavaria’s overwhelming share.
Bavaria, Berlin, venture capital, mobility, transportation, 2024, Germany, regional
false
Investment Analysis
Transportation & Logistics
Mixed Chart
EY
Add to my slides
Remove from favorites
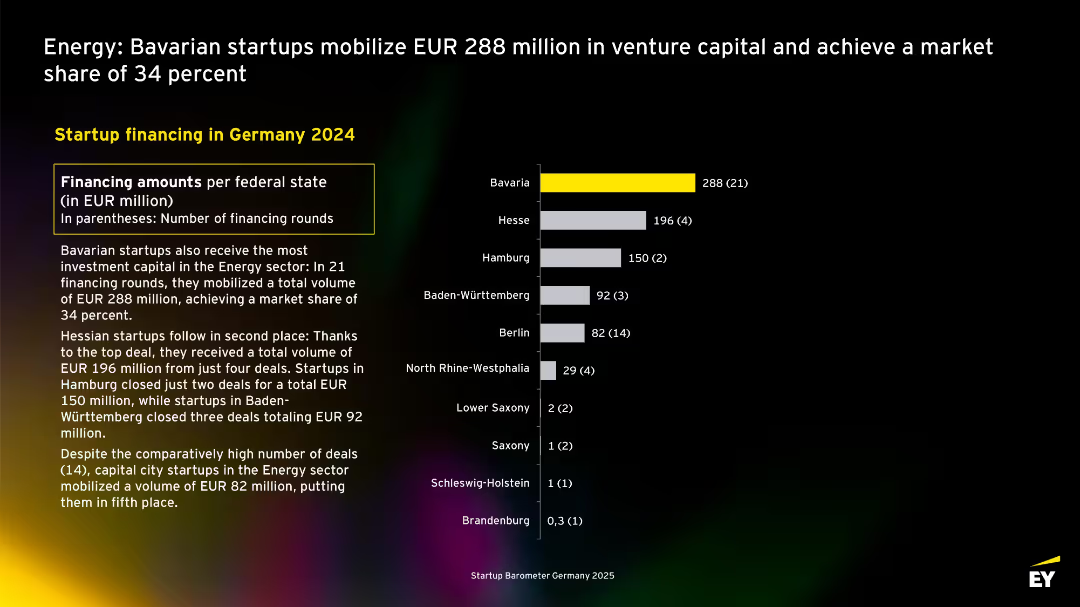
Same layout as prior slide, but shows investment by federal state with Bavaria in yellow as market leader; bar chart on right, text and table on left.
Investment Analysis
Energy & Utilities
Focuses on geographic distribution of energy startup funding in Germany. Bavaria leads with EUR 288M from 21 rounds. Hesse, Hamburg, and Baden-Württemberg follow. Despite more deals, Berlin raised less capital.
Bavaria, energy startups, Germany, state comparison, venture capital, 2024, market share
false
Investment Analysis
Energy & Utilities
Mixed Chart
EY
Add to my slides
Remove from favorites
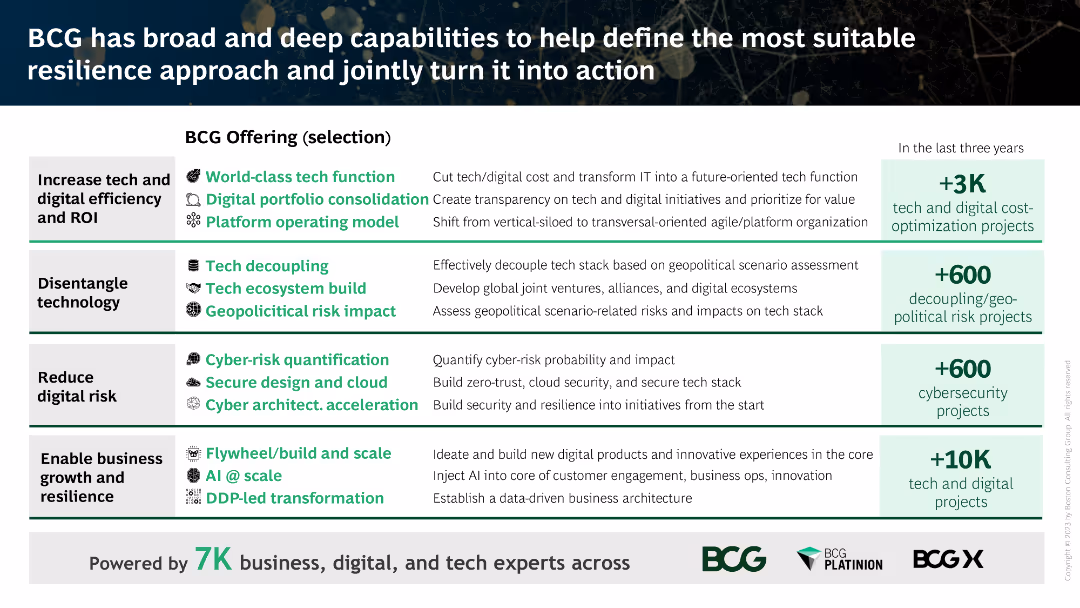
The slide is divided into multiple sections, each highlighting BCG's offerings with icons, descriptive text, and numerical data on completed projects.
Client Case Studies
Professional Services
This slide showcases BCG's capabilities in increasing tech efficiency, disentangling technology, reducing digital risk, and enabling business growth and resilience.
BCG, tech efficiency, digital risk, business growth, resilience
false
Client Case Studies
Professional Services
Vertical Flow
BCG
Add to my slides
Remove from favorites
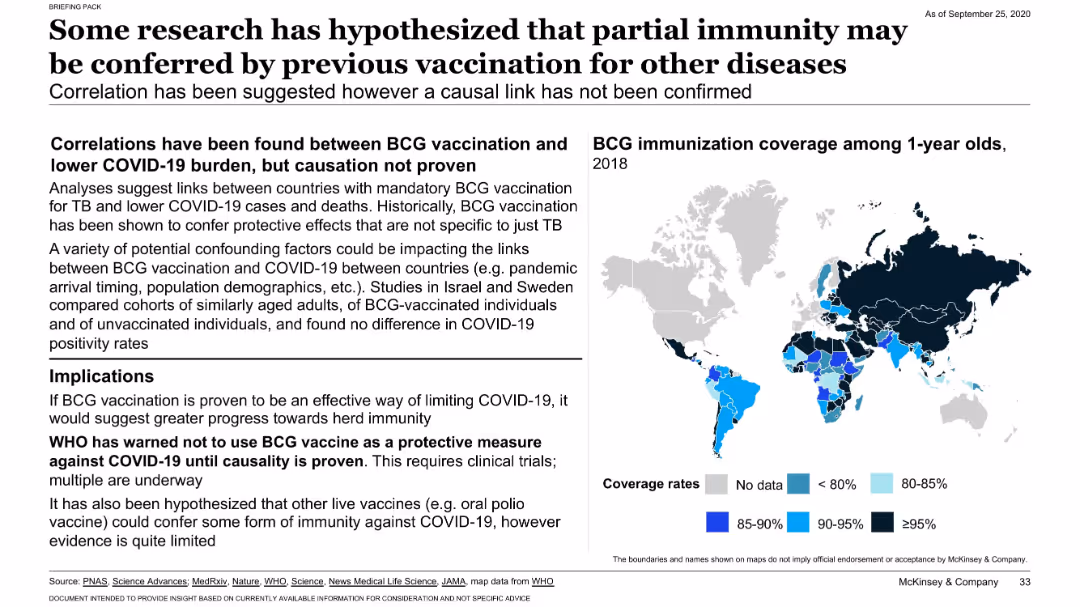
Text-heavy slide with a global map of BCG immunization rates among 1-year-olds; includes summary of research insights and implications.
Market Analysis and Trends
Healthcare & Pharmaceuticals
Suggests possible correlation between BCG vaccination and lower COVID-19 burden. While not proven, the hypothesis supports investigating existing vaccines’ protective effects. Map shows global BCG coverage to contextualize this theory.
BCG vaccine, COVID-19, immunity, correlation, vaccination, epidemiology
false
Market Analysis and Trends
Healthcare & Pharmaceuticals
Mixed Chart
McKinsey
Add to my slides
Remove from favorites
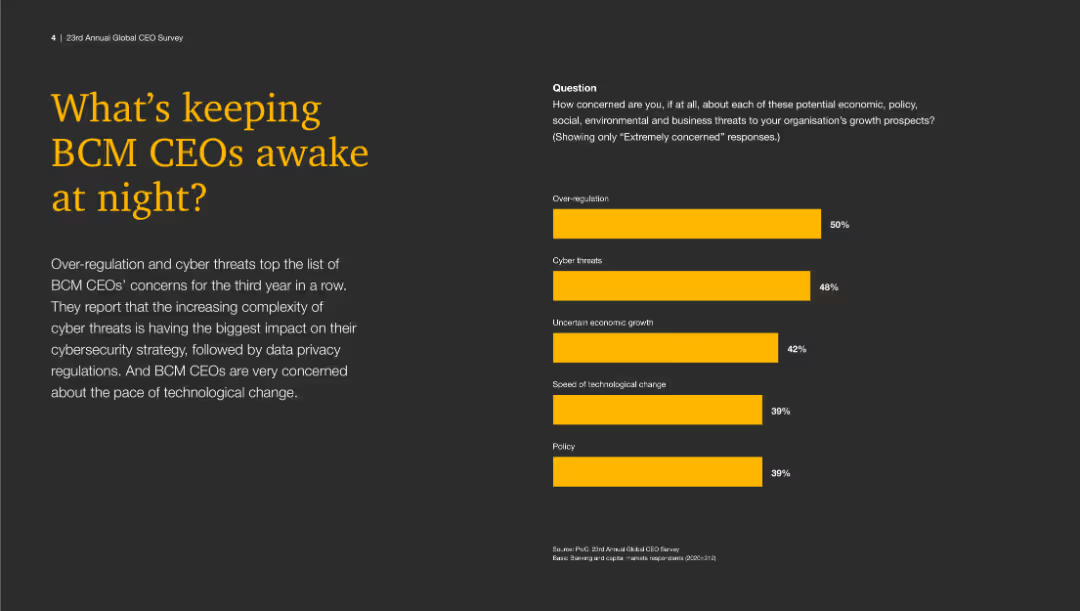
The slide uses a dark background with a large yellow title on the left. On the right, a column chart with yellow bars indicates different concerns for BCM CEOs.
Risk Assessment and Management
Financial Services
This slide shows the top concerns for BCM CEOs, including over-regulation, cyber threats, uncertain economic growth, speed of technological change, and policy concerns.
BCM, CEOs, risks, concerns, cybersecurity, regulation, growth, technology, policy
false
Risk Assessment and Management
Financial Services
Mixed Chart
PwC/Strategy&
Add to my slides
Remove from favorites
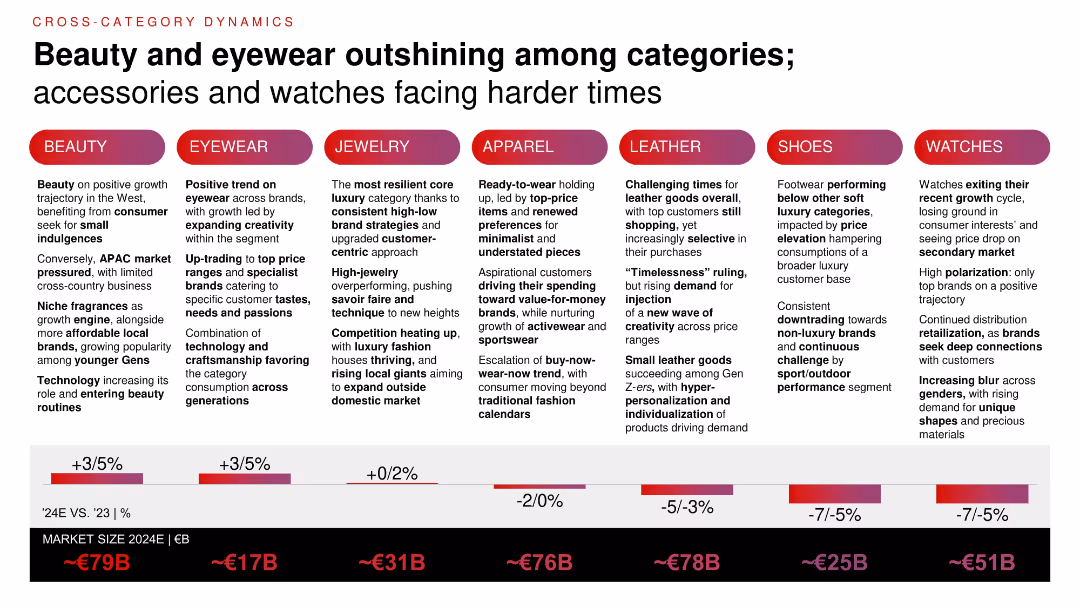
Comparative layout by category with % growth projections (2024E vs. 2023) and market size estimates; includes vertical columns of insights by product segment.
Product and Service Analysis
Consumer Goods
Beauty and eyewear are performing best among luxury categories in 2024, while watches, shoes, and leather goods are under pressure. The slide compares category dynamics, market sizes, and evolving consumer preferences, especially among younger buyers.
beauty growth, eyewear, category trends, personal luxury, Gen Z, market size, product comparison
false
Product and Service Analysis
Consumer Goods
Mixed Chart
Bain
Add to my slides
Remove from favorites
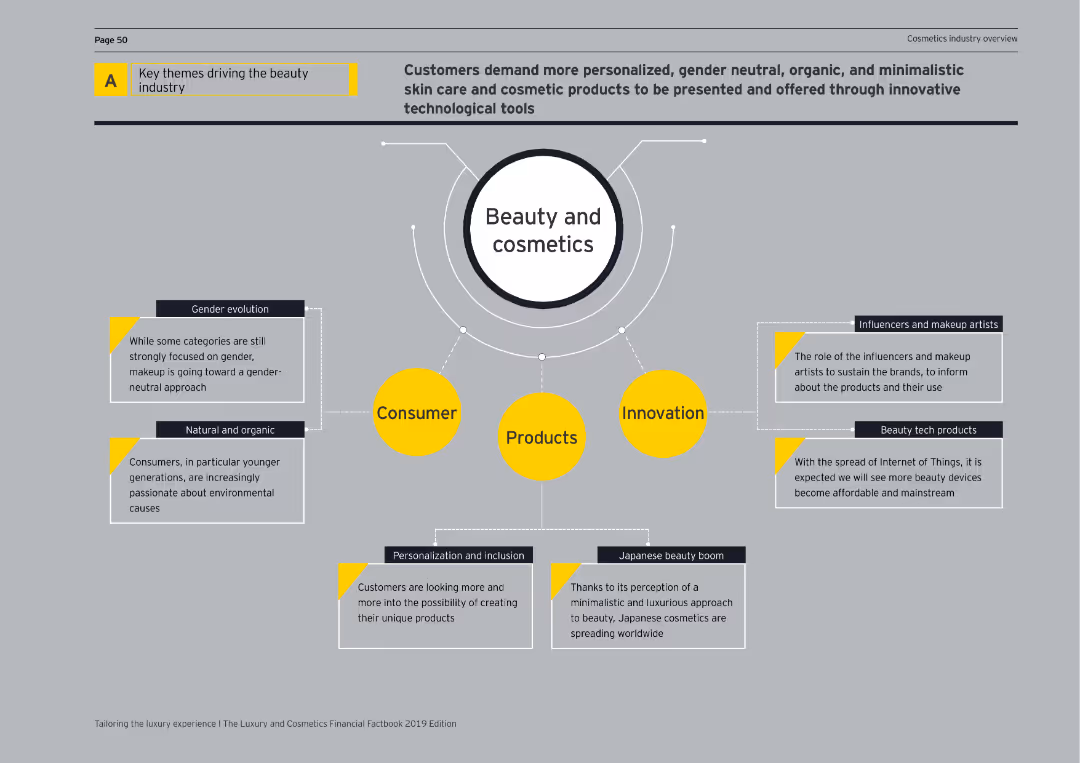
Diagram with four main themes (Consumer, Products, Innovation, Influencers) surrounding the central theme of Beauty and Cosmetics.
Market Analysis and Trends
Consumer Goods
Highlights the main drivers in the beauty industry, focusing on consumer trends, product innovation, and the role of influencers and tech products.
beauty industry, consumer trends, product innovation, influencers, technology, cosmetics, market analysis, diagram, key themes
false
Market Analysis and Trends
Consumer Goods
Diagram
EY
Add to my slides
Remove from favorites
Displays a column chart plotting annual growth rates of the beauty market, using a gradient color scheme for visual clarity.
Market Analysis and Trends
Consumer Goods
Summarizes historical growth trends in the beauty industry and projects future growth rates.
beauty market, growth trends, historical data, future projections
false
Market Analysis and Trends
Consumer Goods
Single Chart
Deutsche Bank
Add to my slides
Remove from favorites
The slide provides text descriptions and a diagram explaining BECCS technology, including its pros and cons, key features, and potential.
Technology and Digital Transformation
Energy & Utilities
Explains BECCS technology, highlighting its role in sustainable energy production and CO2 storage, as well as the benefits and challenges of this approach.
BECCS, bioenergy, carbon capture, storage, sustainable energy, biomass, technology explanation, pros and cons
false
Technology and Digital Transformation
Energy & Utilities
Table
Kearney
Add to my slides
Remove from favorites
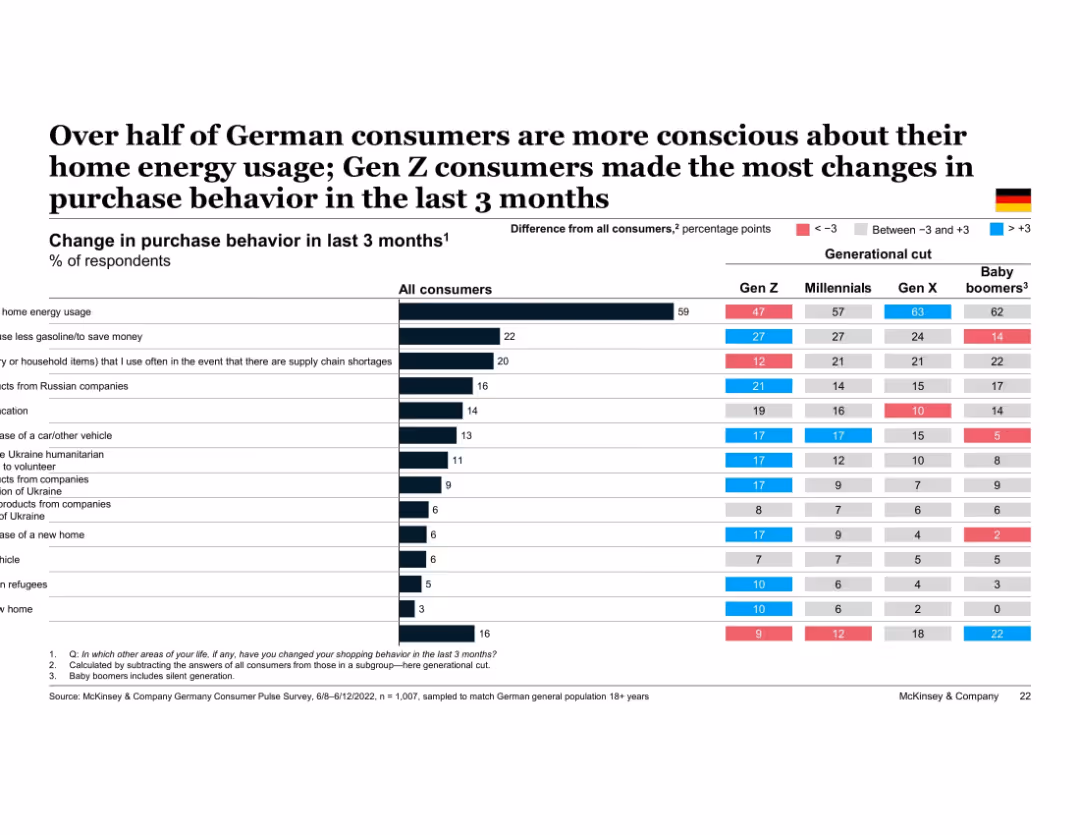
Table chart showing % of German consumers changing various behaviors, broken down by generation. Color coding indicates deviation from average. Most actions relate to energy savings, budgeting, or avoiding Russia-linked products.
Customer and Market Segmentation
Financial Services
This slide tracks behavioral adjustments made by German consumers in response to economic and geopolitical events. The most common change is reducing home energy use, particularly among Gen X and Baby Boomers. Gen Z shows the most widespread behavioral adaptation across categories.
behavioral change, energy savings, Germany, generational behavior, inflation response, geopolitical impact, Gen Z, purchase habits
false
Customer and Market Segmentation
Financial Services
Multiple Chart
McKinsey
Add to my slides
Remove from favorites
Diagram showing the process of crisis management and community-based interventions leading to treatment in the community. Visual elements include icons and flow arrows.
Strategic Planning
Healthcare & Pharmaceuticals
This slide explains how an SMI IMD Waiver can help expand the capacity for behavioral health services, providing a detailed flow of the process from crisis management to private sector involvement.
Behavioral health, capacity expansion, community-based interventions, private sector, New Hampshire Hospital, crisis management, SMI IMD Waiver
false
Strategic Planning
Healthcare & Pharmaceuticals
Diagram
Alvarez & Marsal
Add to my slides
Remove from favorites
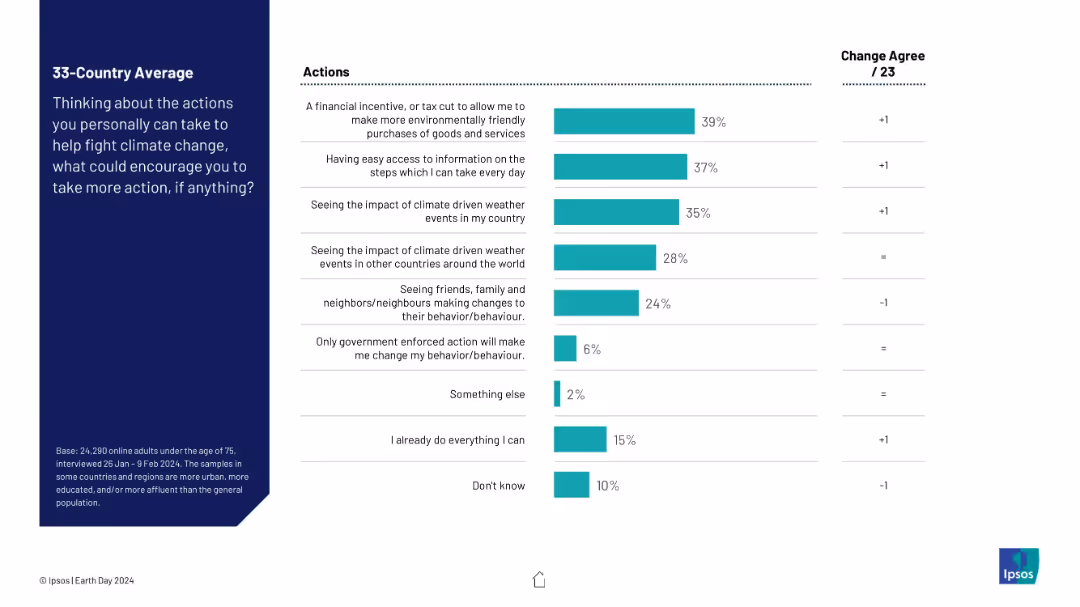
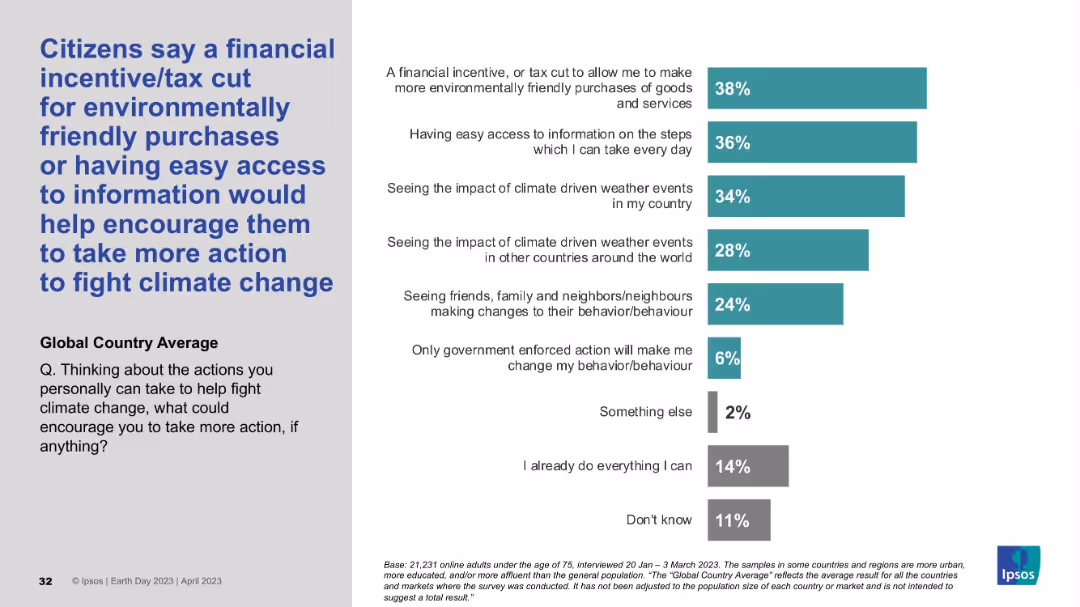
Vertical bar chart ranking factors that could personally encourage people to take action against climate change. Includes data on change from the previous year.
Human Resources and Talent Management
Environmental Services & Sustainability
The slide explores what motivates individuals to take climate action. Top motivators include financial incentives, accessible information, and direct experience with climate events, highlighting the need for policy and communication strategies that resonate personally.
behavior change, climate action, personal motivation, financial incentives, public awareness, Ipsos, sustainability, global opinion
false
Human Resources and Talent Management
Environmental Services & Sustainability
Mixed Chart
IPSOS
Add to my slides
Remove from favorites
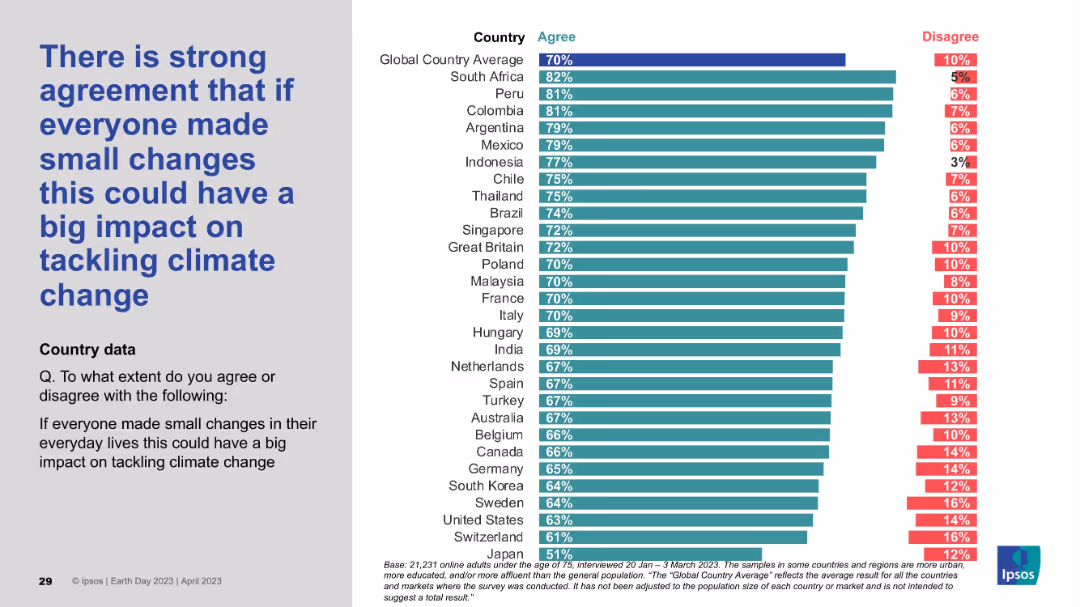
Classic two-panel format: statement on left, country-wise bar chart on right. Most countries show high agreement with minimal disagreement levels.
Customer and Market Segmentation
Environmental Services & Sustainability
This slide emphasizes the belief in collective small actions having a large impact on combating climate change. High agreement percentages reflect optimism in grassroots behavioral change and the perceived importance of individual contributions to global climate solutions.
behavior change, collective action, optimism, public sentiment, climate impact, Ipsos, Earth Day
false
Customer and Market Segmentation
Environmental Services & Sustainability
Mixed Chart
IPSOS
Add to my slides
Remove from favorites
Column chart depicting changes in behavior such as phone calls, online shopping, news consumption, exercise, and drinking alcohol, comparing pre/post COVID-19.
Market Analysis and Trends
Healthcare & Pharmaceuticals
Discusses various behavioral changes in people during the COVID-19 pandemic, comparing current habits to those before the pandemic.
behavior change, COVID-19, phone calls, online shopping, news consumption, exercise, drinking alcohol
false
Market Analysis and Trends
Healthcare & Pharmaceuticals
Single Chart
IPSOS
Add to my slides
Remove from favorites
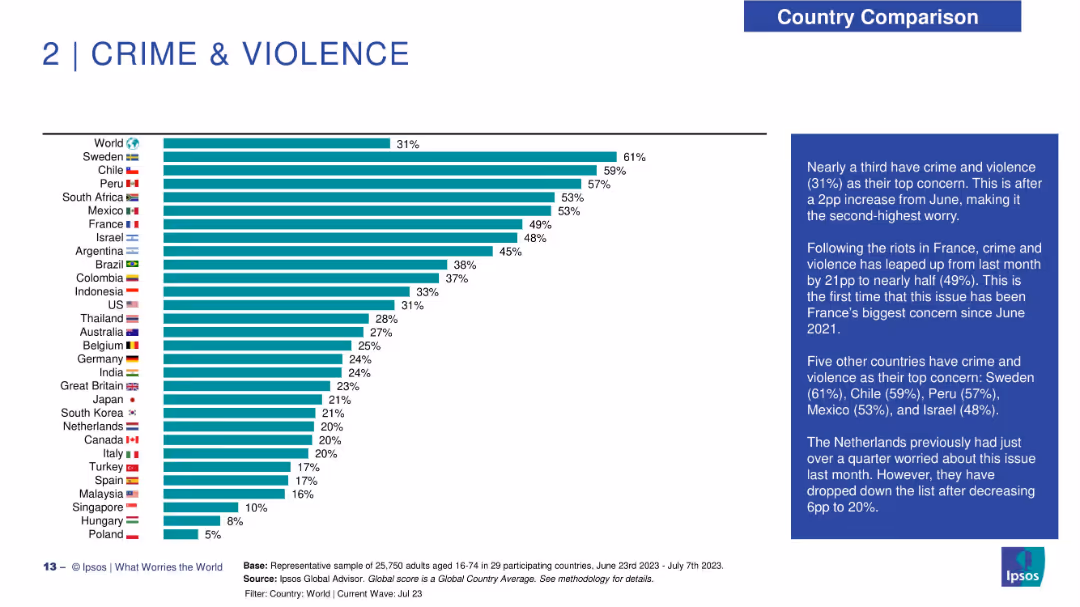
Horizontal bar chart ranking countries by concern over crime & violence; includes explanatory text on right.
Risk Assessment and Management
Government & Public Sector
Crime and violence is identified as a rising concern globally, with countries like Sweden and Chile showing high levels. The sidebar discusses recent spikes, notably in France following riots, and other regional trends.
behavior change, environmental motivation, climate incentives, Ipsos, personal action, survey data, awareness, sustainability strategy
false
Risk Assessment and Management
Government & Public Sector
Mixed Chart
IPSOS
Add to my slides
Remove from favorites
Left-aligned blue headline with supporting vertical bar chart on the right showing response percentages by category.
Strategic Planning
Environmental Services & Sustainability
The slide outlines motivating factors that could encourage individuals to take more action against climate change. A financial incentive or tax cut and easier access to information top the list of responses, reflecting what support mechanisms people believe would be most effective.
behavior change, motivation, incentives, environment, climate action, survey, Ipsos, awareness, global average, support strategies
false
Strategic Planning
Environmental Services & Sustainability
Mixed Chart
IPSOS
Add to my slides
Remove from favorites
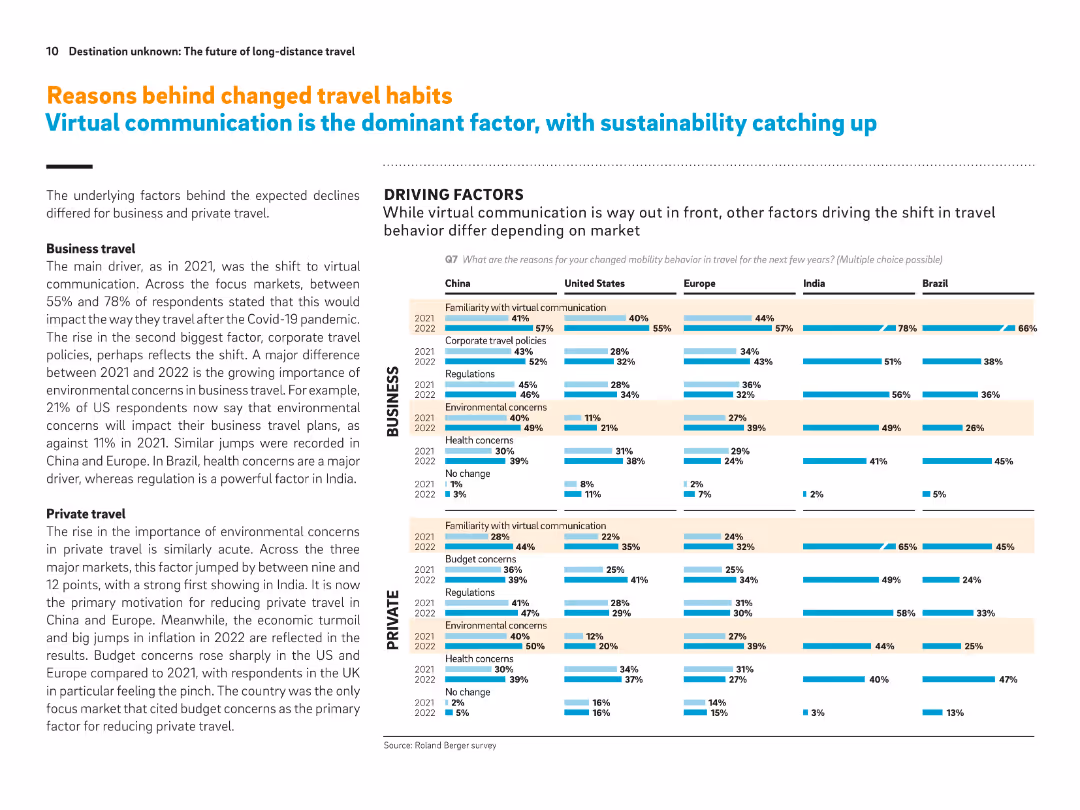
Grid of horizontal bar charts per country showing reasons for behavior change in business and private travel. Emphasis on communication, sustainability, cost.
Market Analysis and Trends
Transportation & Logistics
This slide details country-level breakdowns of reasons for changing travel behavior post-Covid. Virtual communication is the top factor for business travel changes, while environmental and cost concerns lead in private travel. Charts show shifts from 2021 to 2022.
Behavior change, virtual communication, environmental concern, business travel, private travel, travel reduction, cost impact
false
Market Analysis and Trends
Transportation & Logistics
Multiple Chart
Roland Berger
Add to my slides
Remove from favorites
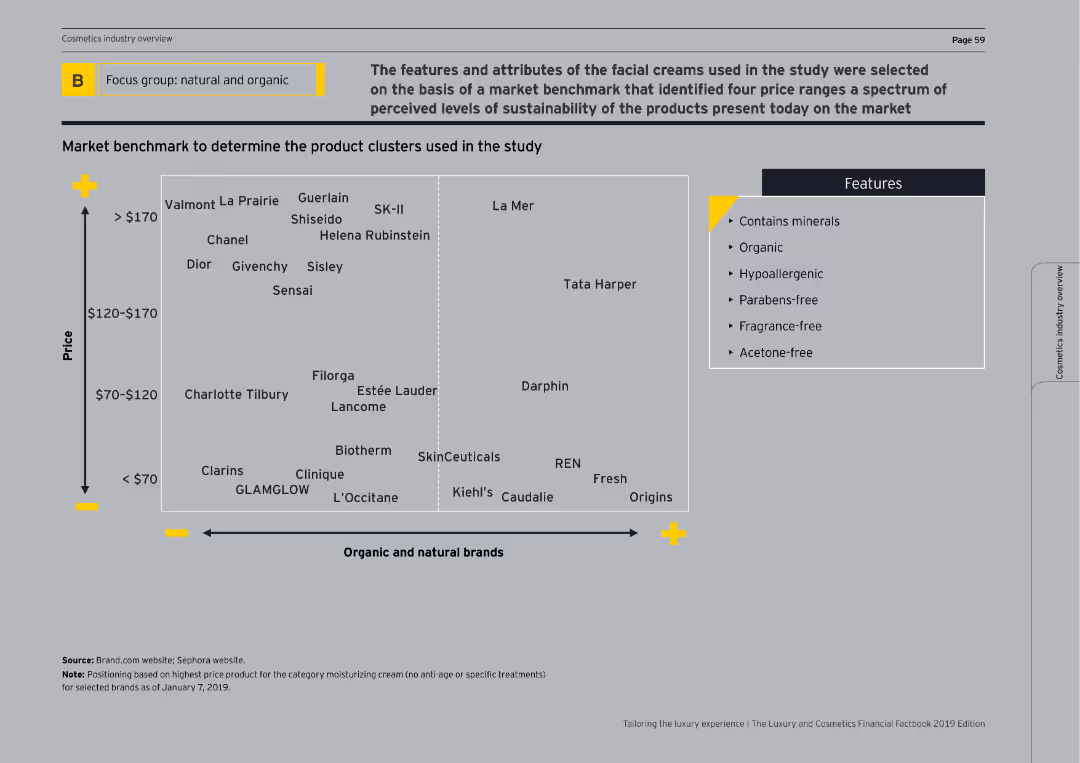
The slide shows a 2x2 matrix comparing the price and sustainability features of various beauty brands. It includes a legend for product features.
Competitive Landscape
Consumer Goods
This slide benchmarks facial creams based on price and sustainability features, positioning various brands on a matrix to illustrate market clusters.
benchmark, facial creams, price, sustainability, matrix
false
Competitive Landscape
Consumer Goods
Mixed Chart
EY
Add to my slides
Remove from favorites
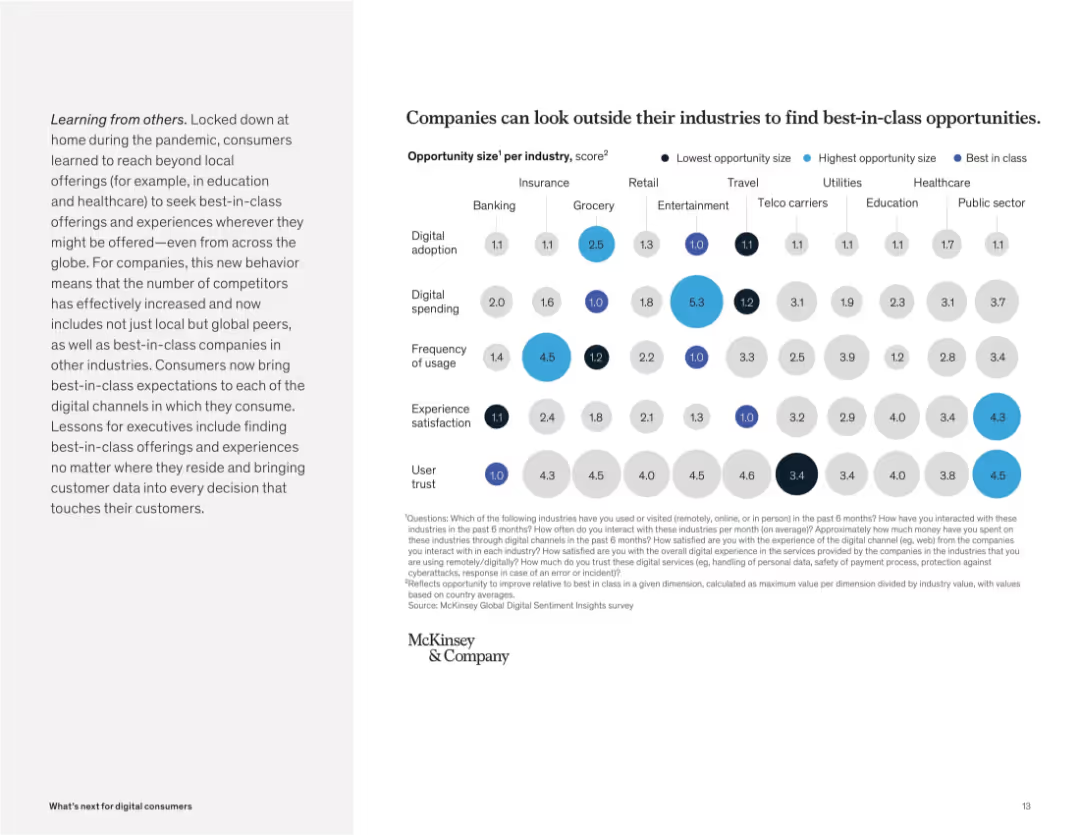
Bubble chart showing opportunity sizes by category (trust, satisfaction, usage) across industries. Colored by size and best-in-class value.
Competitive Landscape
Technology & Software
This slide highlights cross-industry benchmarking, showing that companies can identify best-in-class practices from other sectors to improve digital services. Bubbles represent areas like spending, adoption, and trust.
benchmarking, opportunity size, best-in-class, cross-industry, trust, spending, adoption, user expectations
false
Competitive Landscape
Technology & Software
Mixed Chart
McKinsey
Add to my slides
Remove from favorites
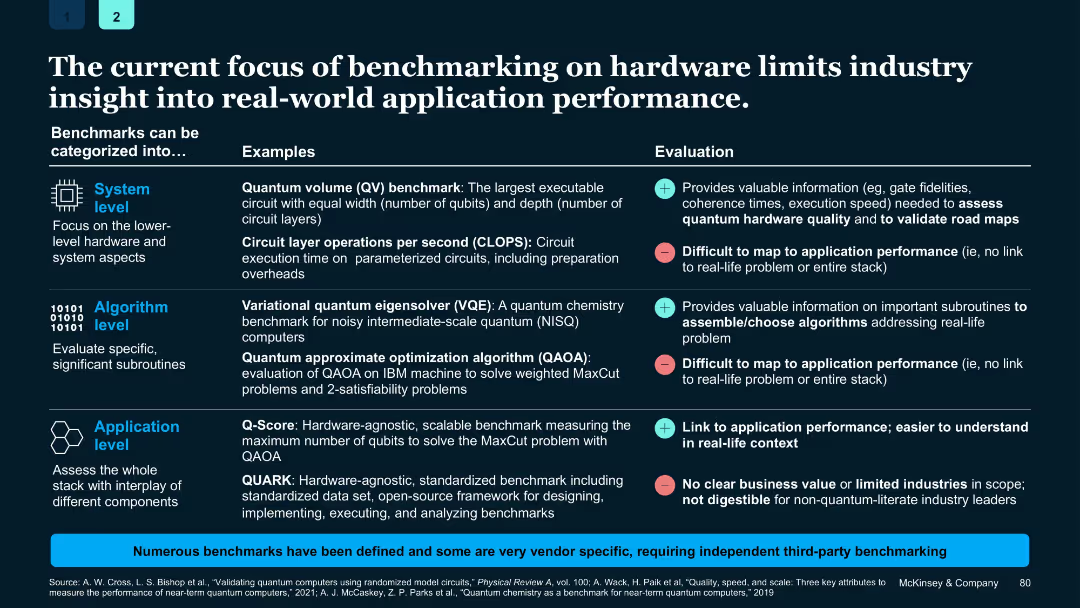
Three-tiered table comparing benchmark levels (System, Algorithm, Application); columns for examples and evaluation; uses color-coded markers.
Performance Metrics and KPIs
Artificial Intelligence
Compares quantum benchmarking types and their relevance to real-world applications. Highlights gap between technical metrics and business performance indicators, suggesting need for broader, application-linked benchmarks.
Benchmarking, performance, system-level, application, quantum evaluation
false
Performance Metrics and KPIs
Artificial Intelligence
Table
McKinsey
Add to my slides
Remove from favorites
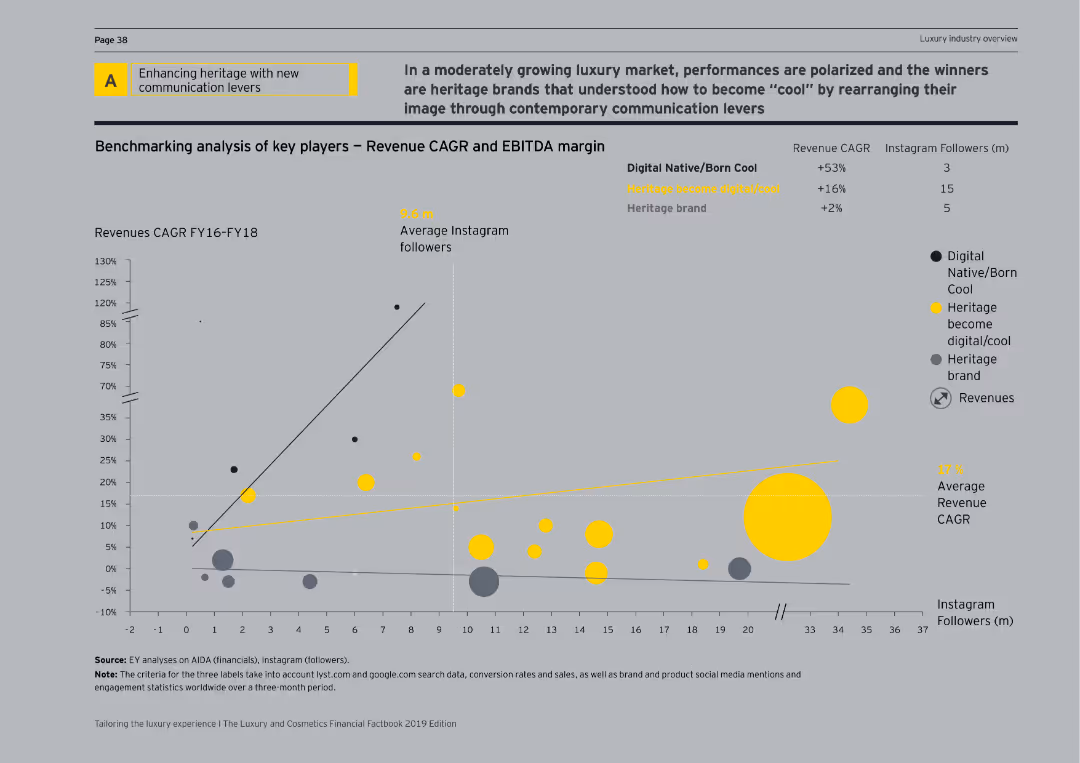
Contains a scatter plot showing revenue CAGR and EBITDA margin, along with Instagram followers for digital native, heritage, and hybrid brands.
Strategic Planning
Media & Entertainment
Analyzes key players in the luxury market, comparing their revenue growth, EBITDA margins, and social media influence to drive strategic planning.
benchmarking, revenue CAGR, EBITDA margin, Instagram followers, digital native, heritage brand, hybrid brand, scatter plot, strategic planning
false
Strategic Planning
Media & Entertainment
Single Chart
EY
Add to my slides
Remove from favorites
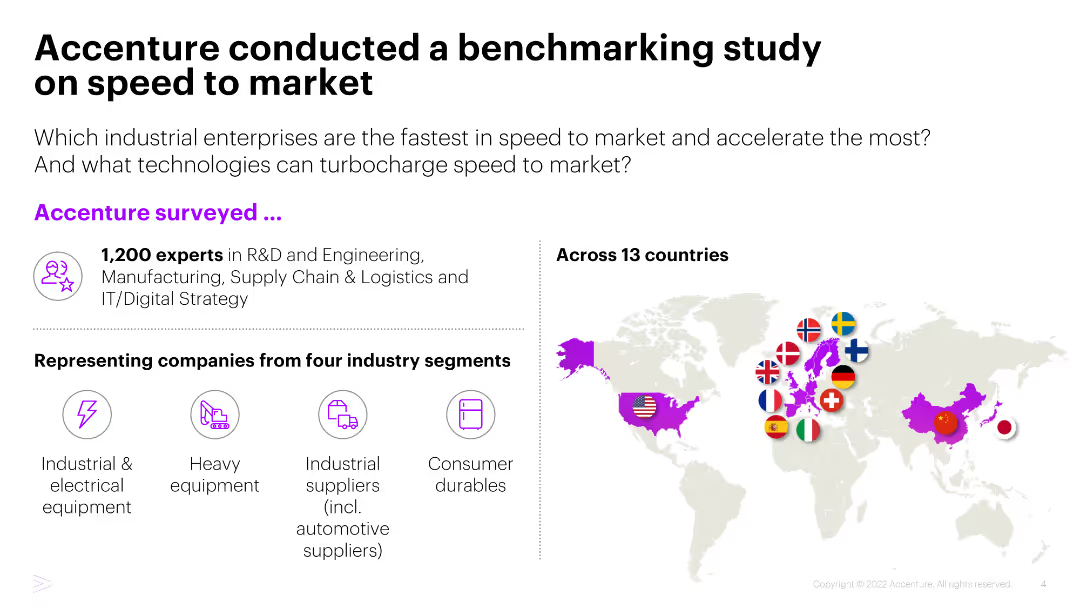
Map showing surveyed countries and icons representing industry segments included in the benchmarking study.
Market Analysis and Trends
Industrial & Manufacturing
The slide summarizes a benchmarking study by Accenture on industrial enterprises' speed to market, detailing the survey's scope, industry segments, and geographical coverage.
Benchmarking study, Speed to market, Industrial enterprises, Survey, Market analysis
false
Market Analysis and Trends
Industrial & Manufacturing
Header Vertical
Accenture
Add to my slides
Remove from favorites
Slide with text and images comparing Canada and Ukraine to Australia in terms of wheat production and export, highlighting similarities in supply chains and efficiency.
Competitive Landscape
Agriculture & Food Production
The slide compares Australia's wheat supply chain to Canada and Ukraine, using these countries as benchmarks for efficiency and export market similarities.
benchmarking, wheat supply chain, Canada, Ukraine, Australia
false
Competitive Landscape
Agriculture & Food Production
Graphic
LEK
Add to my slides
Remove from favorites
The slide has four sections: two bar charts, one column chart, and a textual explanation with graphs and diagrams.
Client Case Studies
Professional Services
Showcases benchmark results from the AEP feedback report, comparing participant performance across different metrics.
benchmarks, AEP, procurement, performance, comparison, feedback, bar charts, column chart, graphs, metrics
false
Client Case Studies
Professional Services
Multiple Chart
Kearney
Add to my slides
Remove from favorites
The slide is text-heavy, detailing benchmarking strategies for social impact with bullet points. Emphasizes clarity and accessibility in its design.
Market Analysis and Trends
Telecommunications
Outlines how benchmarks are set for assessing the social impact of broadband, including comparisons to previous years and different demographic groups.
benchmarks, social impact, broadband, assessment, evaluation, comparison, demographic analysis, yearly trends, data analysis
false
Market Analysis and Trends
Telecommunications
Header Vertical
Accenture
Add to my slides
Remove from favorites
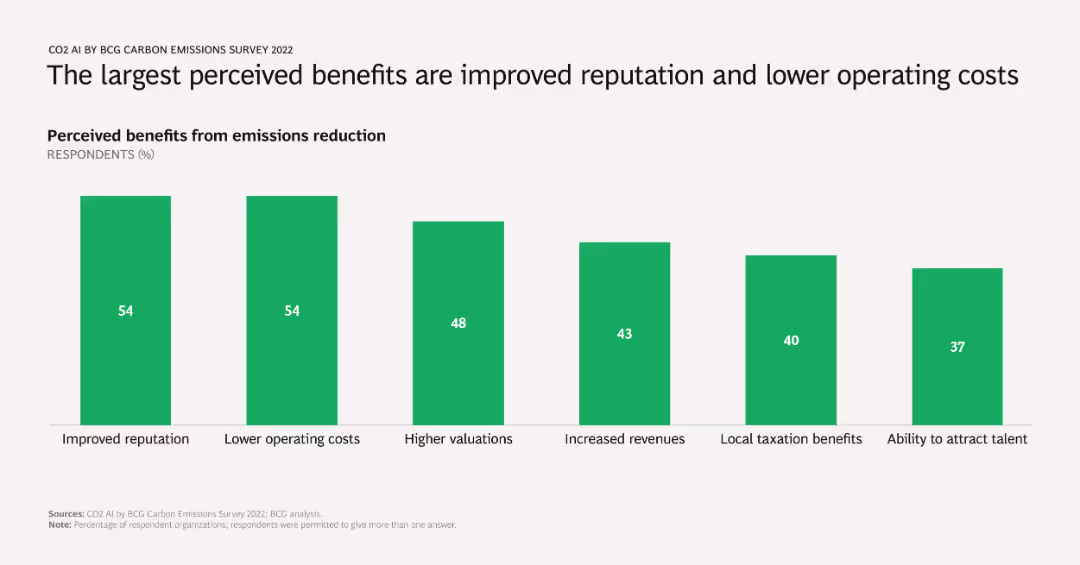
A column chart showing percentages of respondents citing various benefits from emissions reduction, including improved reputation, lower operating costs, higher valuations, increased revenues, local taxation benefits, and talent attraction.
Market Analysis and Trends
Environmental Services & Sustainability
Identifies and quantifies the primary benefits companies perceive from reducing emissions, emphasizing reputational and financial gains. Useful for advocating emissions reduction strategies to stakeholders.
benefits, emissions reduction, reputation, operating costs, survey results
false
Market Analysis and Trends
Environmental Services & Sustainability
Single Chart
BCG
Add to my slides
Remove from favorites
This slide utilizes a green and blue theme with six main categories listed in a three-column format. Icons and short descriptions are used for each benefit type.
Human Resources and Talent Management
Professional Services
Outlines medical, personalized, and fringe benefits, and emphasizes development benefits and flexible work arrangements for HR strategy.
benefits, medical, personalized, fringe, development, mentoring, flexibility, HR strategy
false
Human Resources and Talent Management
Professional Services
Header Horizontal
Kearney
Add to my slides
Remove from favorites
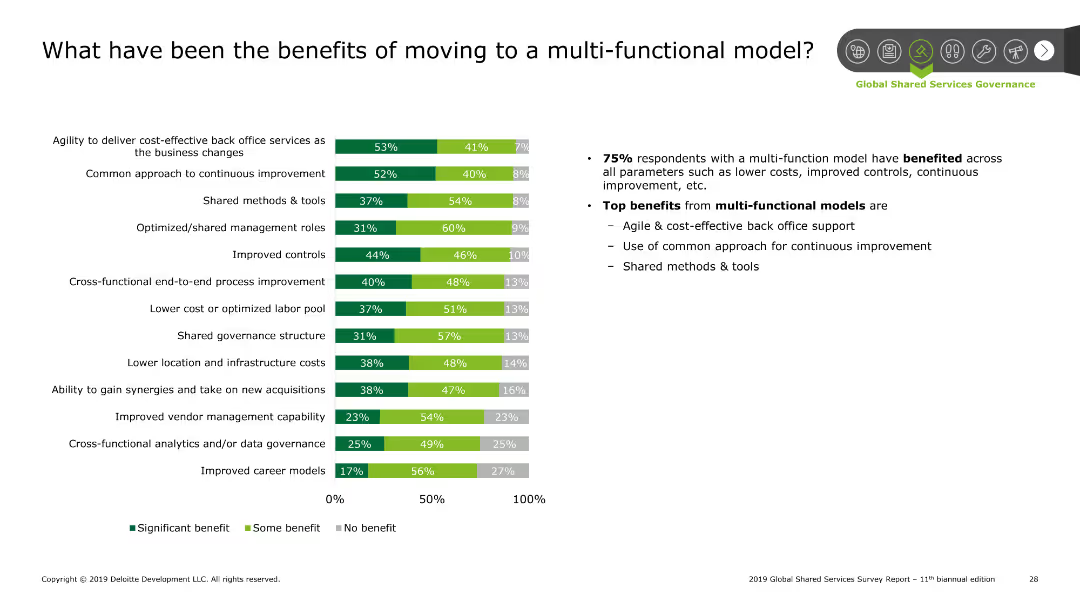
The slide contains a column chart showing the benefits of moving to a multi-functional model. There are three categories in the chart: Significant benefit, Some benefit, No benefit.
Operational Efficiency
Professional Services
This slide presents data on the benefits of adopting a multi-functional model in organizations. Key benefits include cost-effectiveness, improved controls, and shared methods.
Benefits, multi-functional model, cost savings, improvement, controls
false
Operational Efficiency
Professional Services
Mixed Chart
Deloitte
Add to my slides
Remove from favorites
Two-side layout separating benefits and risks of connectivity, accompanied by relevant symbols.
Strategic Planning
Professional Services
Highlights the benefits and risks associated with advanced connectivity, giving leaders strategic insights.
Benefits, Risks, Connectivity, Strategy, Digital Transformation, IoT
false
Strategic Planning
Professional Services
Boxed
McKinsey
Add to my slides
Remove from favorites
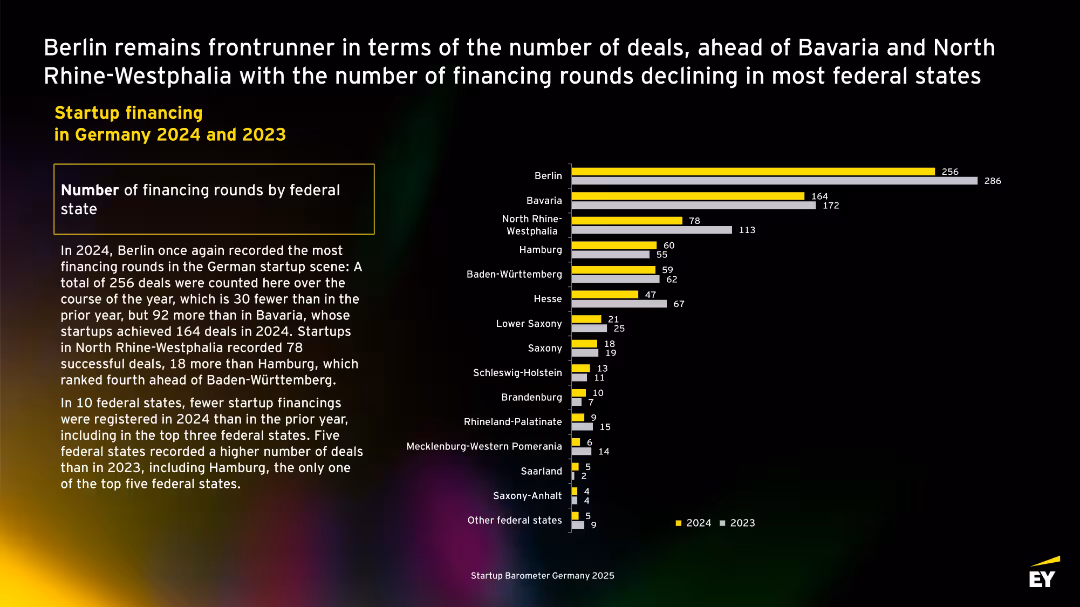
Horizontal bar chart with yellow (2024) and gray (2023) bars representing financing rounds across German federal states; accompanied by a text box summarizing insights; dark background with highlighted yellow labels.
Market Analysis and Trends
Technology & Software
Compares startup financing activity across German states in 2023 and 2024. Berlin leads in number of financing rounds, followed by Bavaria and North Rhine-Westphalia. The slide highlights regional differences and declining trends in most states.
Berlin, Bavaria, North Rhine-Westphalia, financing rounds, startups, federal states, EY, 2024, 2023
false
Market Analysis and Trends
Technology & Software
Mixed Chart
EY
Add to my slides
Remove from favorites
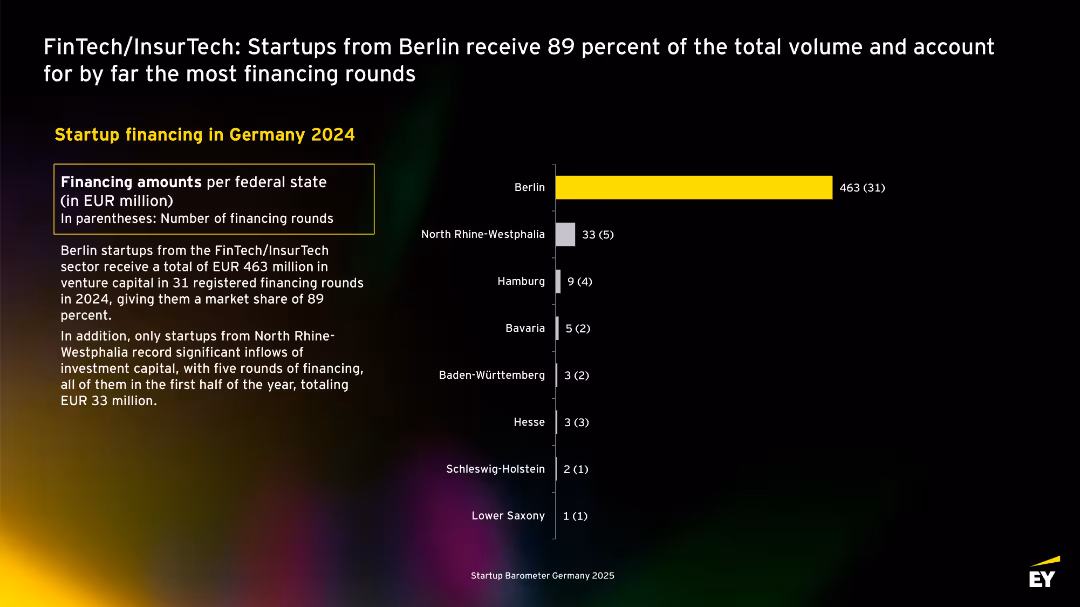
Bar chart shows Berlin dominating regional funding; yellow bar; left text explains Berlin’s overwhelming share of capital.
Investment Analysis
Financial Services
Berlin-based FinTech/InsurTech startups secured EUR 463M in 2024, comprising 89% of the sector's VC volume. 31 rounds were registered in Berlin. Other states lag far behind.
Berlin, FinTech, InsurTech, funding rounds, venture capital, 2024, Germany
false
Investment Analysis
Financial Services
Mixed Chart
EY
Add to my slides
Remove from favorites
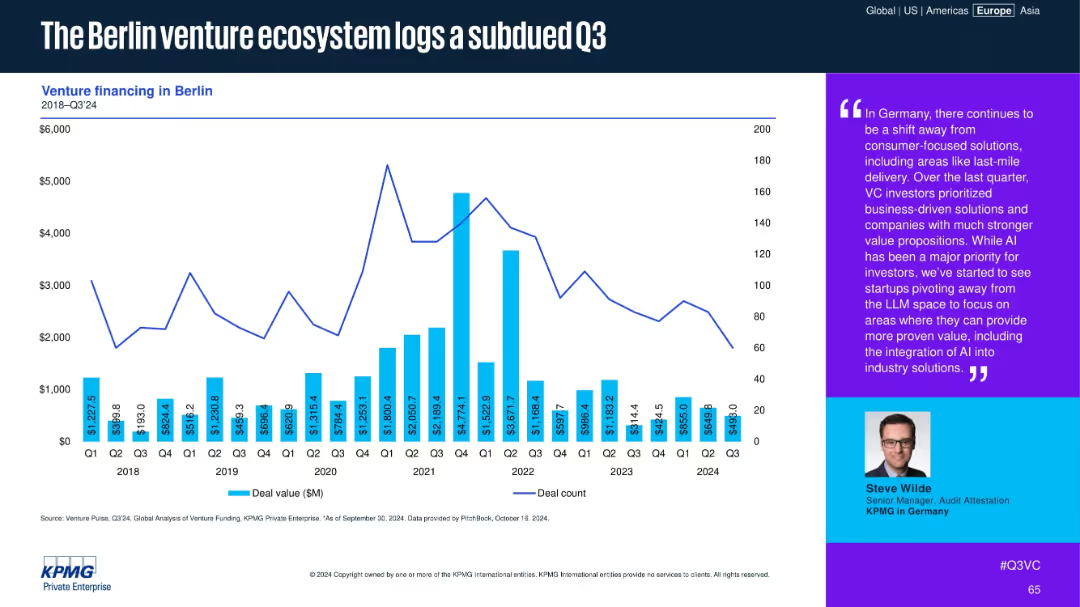
Bar and line chart of venture financing in Berlin (2018–Q3 2024), with quote highlighting VC investor behavior.
Market Analysis and Trends
Financial Services
Berlin's VC ecosystem softened in Q3 2024. Commentary suggests a shift away from last-mile delivery and LLMs, toward business-oriented solutions and AI integration into industrial processes, as investors pursue proven value.
Berlin, VC funding, Q3 2024, AI solutions, investor behavior, industry pivot, last-mile delivery, business focus
false
Market Analysis and Trends
Financial Services
Mixed Chart
KPMG
Add to my slides
Remove from favorites
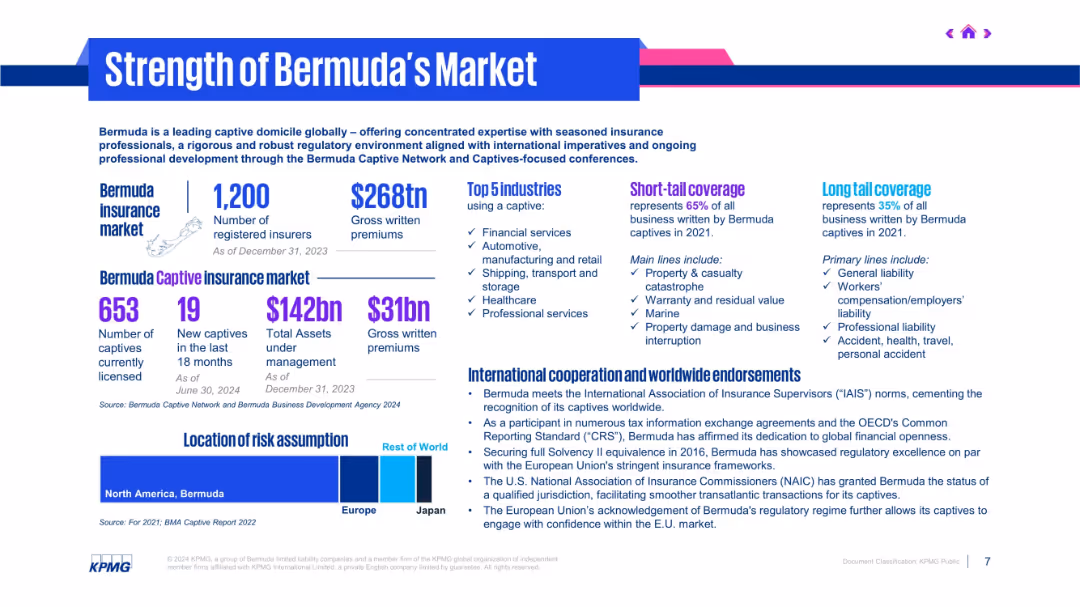
Infographic layout with multiple blocks, charts, and figures using purple and blue tones.
Industry Overview
Financial Services
The slide presents Bermuda’s position as a leading captive insurance market, detailing metrics like number of insurers, gross premiums, and top industries. It highlights coverage types, international endorsements, and geographic risk assumption.
Bermuda, captives, insurance market, premiums, endorsements, coverage
false
Industry Overview
Financial Services
Mixed Chart
KPMG
Add to my slides
Remove from favorites
Moderate complexity slide with a line graph showing the decline in 'best practice' mentions, juxtaposed with a cityscape image reflecting corporate progress.
Strategic Planning
Professional Services
Discusses trends in corporate strategy with a focus on moving away from 'best practice' towards unique business reinvention methods.
Best Practice, Corporate Strategy, Trends, Reinvention, Performance
false
Strategic Planning
Professional Services
Multiple Chart
Accenture
Add to my slides
Remove from favorites
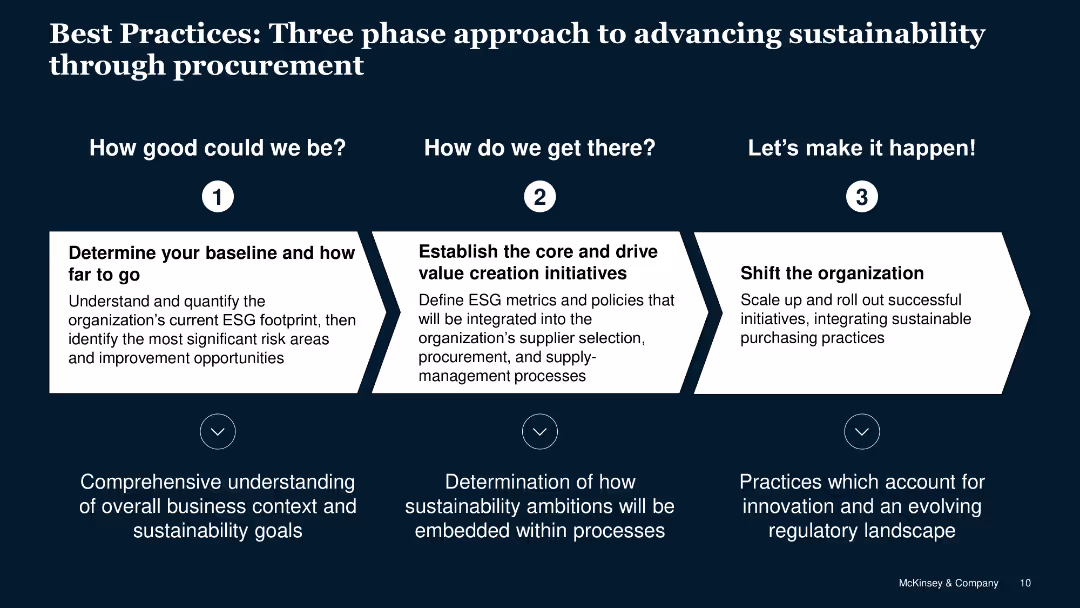
Step-by-step flow for advancing sustainability through procurement with detailed text descriptions.
Strategic Planning
Professional Services
Outlines a three-phase approach to integrating sustainable practices into procurement strategies.
best practices, sustainability, procurement, approach, phases
false
Strategic Planning
Professional Services
Linear Flow
McKinsey
Add to my slides
Remove from favorites
A comparative analysis layout showing potential profit losses for Asian and Chinese BEV manufacturers under different market scenarios. Utilizes color coding for clarity.
Risk Assessment and Management
Transportation & Logistics
Focuses on the challenges facing Asian and Chinese manufacturers in the BEV market, detailing the risk of significant profit losses under slow electrification scenarios and potential gains in more favorable conditions.
BEV, Asian OEMs, Chinese OEMs, profit loss, risks
false
Risk Assessment and Management
Transportation & Logistics
Table
BCG
Add to my slides
Remove from favorites
Complex visual layout with annotated diagrams of BEV components and systems across a transparent car diagram. Highlights areas like battery, thermal management, and sensors with different color coding for clarity.
Technology and Digital Transformation
Industrial & Manufacturing
Outlines the specific components and systems involved in battery electric and autonomous vehicles, indicating areas of growth and innovation for TI Fluid Systems in these emerging technologies.
BEV, autonomous vehicles, thermal management, diagrams
false
Technology and Digital Transformation
Industrial & Manufacturing
Diagram
Deutsche Bank
Add to my slides
Remove from favorites
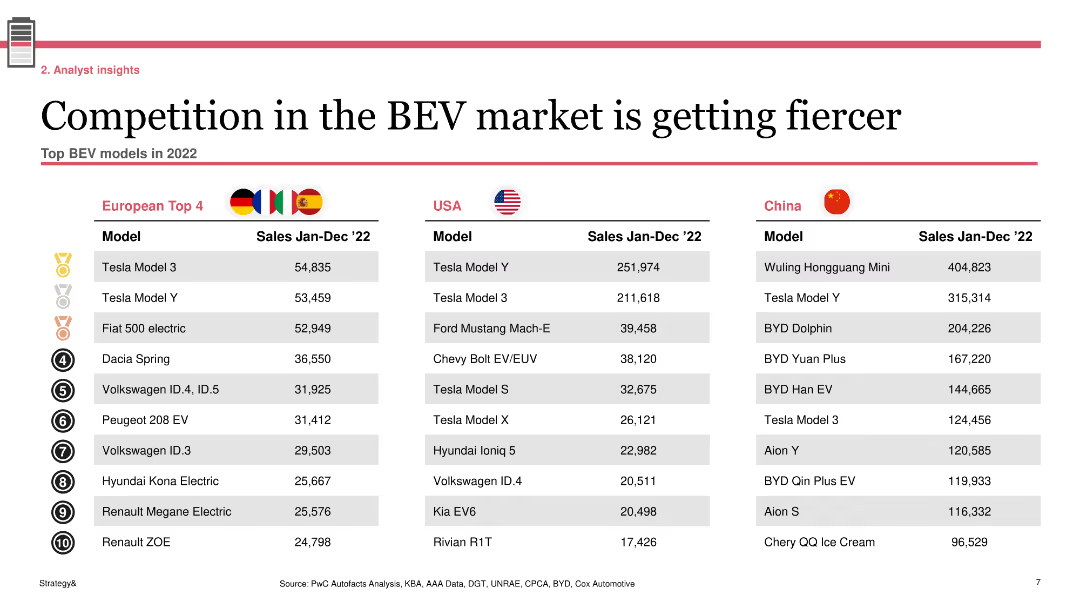
The slide presents three tables listing the top BEV models in 2022 for Europe, USA, and China. Each table includes the model name and sales figures for January to December 2022.
Competitive Landscape
Transportation & Logistics
This slide shows the top BEV models sold in Europe, USA, and China in 2022, highlighting the competitive nature of the BEV market across different regions with sales figures for each top model.
BEV, competition, market, sales, models
false
Competitive Landscape
Transportation & Logistics
Table
PwC/Strategy&
Add to my slides
Remove from favorites
Detailed diagram of a BEV chassis coolant system with annotations. It includes parts like chassis thermal lines and under-hood thermal hoses, visually differentiated through various colors and labels.
Technology and Digital Transformation
Industrial & Manufacturing
Demonstrates the coolant loop system for battery electric vehicles (BEV), focusing on the chassis design used by TI Fluid Systems. It highlights how these systems are integral to managing vehicle temperature and efficiency.
BEV, coolant system, chassis, diagram, technology
false
Technology and Digital Transformation
Industrial & Manufacturing
Diagram
Deutsche Bank
Add to my slides
Remove from favorites
A comprehensive table displays various concerns related to the cost of owning a BEV, including aspects like charging and battery replacement.
Risk Assessment and Management
Transportation & Logistics
Explores financial barriers to BEV adoption, such as cost and charging infrastructure, vital for risk assessment and strategy development in the automotive industry.
BEV, cost concerns, charging infrastructure, battery cost, financial barriers, automotive industry, risk assessment, strategy development
false
Risk Assessment and Management
Transportation & Logistics
Single Chart
Deloitte
Add to my slides
Remove from favorites
A bar chart depicts consumer expectations for BEV driving range, categorized by urban and sub-urban/rural responses, showing varying preferences.
Market Analysis and Trends
Transportation & Logistics
Discusses consumer expectations for battery electric vehicle (BEV) driving ranges, essential for understanding market needs and vehicle design in the automotive sector.
BEV, driving range, consumer expectations, urban, rural, market needs, vehicle design, automotive trends
false
Market Analysis and Trends
Transportation & Logistics
Single Chart
Deloitte
Add to my slides
Remove from favorites
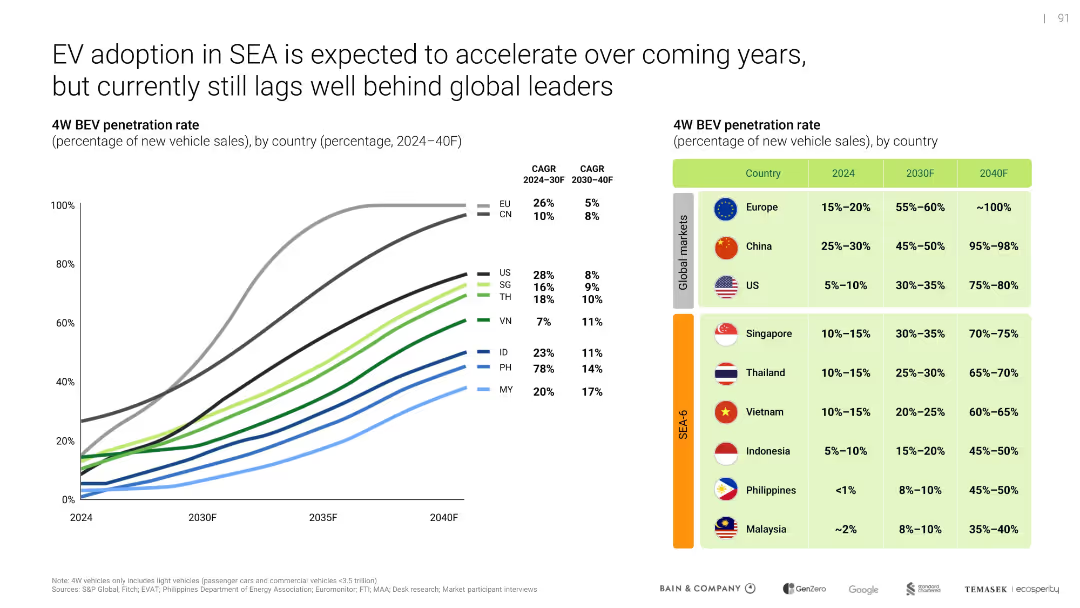
Line graph of BEV penetration projections with accompanying data table; green-blue color gradients distinguish countries
Market Analysis and Trends
Transportation & Logistics
Forecasts the BEV penetration rate in SEA-6 and global markets through 2040, indicating substantial growth but continued lag behind global leaders. Provides CAGR figures and expected market evolution.
BEV forecast, SEA-6, EV penetration, CAGR, global comparison, adoption
false
Market Analysis and Trends
Transportation & Logistics
Mixed Chart
Bain
Add to my slides
Remove from favorites
The slide includes two column charts comparing the application of BEV, GH2, and LH2 technologies across various segments for Vision 2030 and 2040. Comments section highlights key insights.
Market Analysis and Trends
Energy & Utilities
Discusses the expected dominance of BEV and Gaseous H2 in zero-emission technology over the next decade and limited application of Liquid H2.
BEV, GH2, LH2, zero-emission, Vision 2030, Vision 2040, application, comparison, market trends
false
Market Analysis and Trends
Energy & Utilities
Table
Roland Berger
Add to my slides
Remove from favorites
Features diagrams of heat pump valve unit and car, with callouts describing parts and benefits.
Technology and Digital Transformation
Transportation & Logistics
Highlights the role of a specific heat pump technology in BEV cabin comfort, focusing on supplier monopoly and efficiency gains.
BEV, heat pump, valve unit, efficiency, supply chain
false
Technology and Digital Transformation
Transportation & Logistics
Diagram
Deutsche Bank
Add to my slides
Remove from favorites
Multiple small column charts integrated with a world map, color-coded to indicate different regions. Includes icons and labels for external factors affecting market growth.
Market Analysis and Trends
Transportation & Logistics
Predicts a 60% worldwide market share for battery electric vehicles by 2035 with regional differences. Factors like legislation, subsidies, and infrastructure development are highlighted as influences on market growth.
BEV, market share, 2035, global, electric vehicles
false
Market Analysis and Trends
Transportation & Logistics
Multiple Chart
BCG
Add to my slides
Remove from favorites
A structured grid layout with bars and percentages showing projected profits under different market scenarios for BEV adoption. Each OEM type is categorized by strategy alignment.
Strategic Planning
Transportation & Logistics
Analyzes the impact of different electrification strategies on OEM profitability under various market scenarios, providing a strategic overview for stakeholders in the electric vehicle market.
BEV, OEM, profitability, market scenarios, strategy
false
Strategic Planning
Transportation & Logistics
Table
BCG
Add to my slides
Remove from favorites
A series of comparative charts analyzing the profit potential for different OEM archetypes across various BEV market scenarios. Uses a green-to-red gradient to indicate performance.
Investment Analysis
Transportation & Logistics
Discusses the profit potential for European and American OEMs in the BEV market under different electrification scenarios, highlighting the risks and opportunities associated with each market condition.
BEV, OEM, profits, market scenarios, electrification
false
Investment Analysis
Transportation & Logistics
Table
BCG
Add to my slides
Remove from favorites
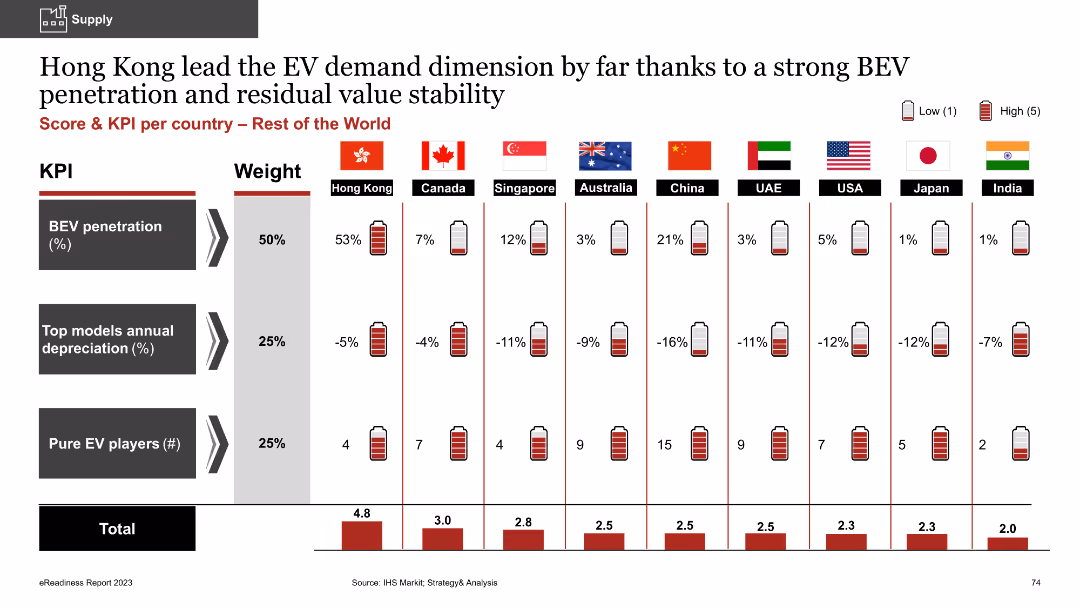
Column chart comparing BEV penetration, annual depreciation of top models, and number of pure EV players
Market Analysis and Trends
Energy & Utilities
The slide shows Hong Kong's leading position in BEV demand, comparing it with other countries based on metrics like BEV penetration, model depreciation rates, and the number of EV players
BEV penetration, demand, depreciation, EV players, comparative analysis
false
Market Analysis and Trends
Energy & Utilities
Multiple Chart
PwC/Strategy&
Add to my slides
Remove from favorites
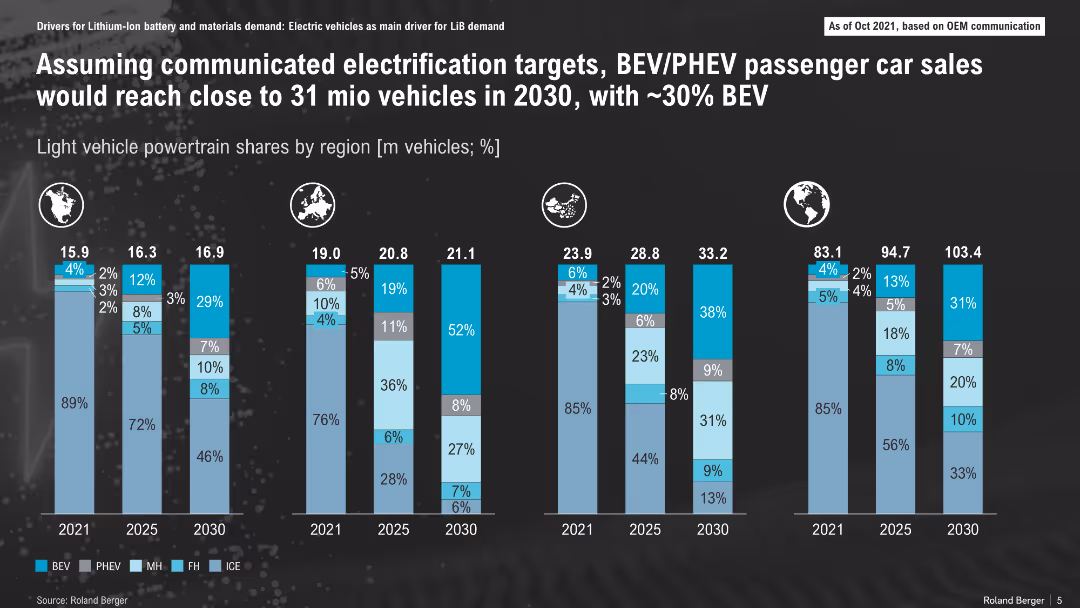
Multiple regional stacked bar charts showing EV powertrain mix forecast through 2030
Market Analysis and Trends
Transportation & Logistics
The slide forecasts EV adoption by region through 2030, indicating rising BEV and PHEV market shares, with BEV expected to hit ~30%. Europe leads in adoption while internal combustion engine (ICE) dominance continues in some regions through 2025.
BEV, PHEV, ICE, electrification, EV market, regional forecast, vehicle sales
false
Market Analysis and Trends
Transportation & Logistics
Single Chart
Roland Berger
Add to my slides
Remove from favorites
This slide shows a line graph tracking BEV sales over time, column charts of top selling OEMs and leading EV markets, highlighting significant growth particularly in Europe.
Market Analysis and Trends
Transportation & Logistics
Provides a detailed overview of global battery electric vehicle (BEV) sales trends, highlighting market leaders and key markets driving growth.
BEV sales, market trends, top OEMs, electric vehicles, Europe growth
false
Market Analysis and Trends
Transportation & Logistics
Multiple Chart
PwC/Strategy&
Add to my slides
Remove from favorites
A comparative analysis with three line charts showing different market scenarios for BEV shares by region from 2025 to 2040. Color-coded to distinguish scenarios.
Market Analysis and Trends
Transportation & Logistics
Examines three potential growth scenarios for battery electric vehicles depending on regional adjustments like government policies and infrastructure expansion.
BEV, scenarios, growth, policy, infrastructure
false
Market Analysis and Trends
Transportation & Logistics
Multiple Chart
BCG
Add to my slides
Remove from favorites
Slide includes line graphs comparing the total cost of ownership of BEVs against other vehicle types, showing the trend towards cost-effectiveness of BEVs.
Investment Analysis
Transportation & Logistics
Provides a financial analysis on the cost-competitiveness of battery electric vehicles over time, useful for investors and companies planning transitions in vehicle fleets.
BEVs, cost analysis, electric vehicles, TCO, automotive economics, investment
false
Investment Analysis
Transportation & Logistics
Single Chart
BCG
Add to my slides
Remove from favorites
Column charts depicting the number of BEVs and PHEVs in use and the number of charging points per 100 vehicles across different regions, from 2015 to 2022.
Market Analysis and Trends
Energy & Utilities
This slide shows the growth of battery electric vehicles (BEVs) and plug-in hybrid electric vehicles (PHEVs) in use from 2015 to 2022 and their corresponding charging points.
BEVs, PHEVs, charging points, growth, regions
false
Market Analysis and Trends
Energy & Utilities
Multiple Chart
JP Morgan
Add to my slides
Remove from favorites
Column chart displaying BEV penetration, depreciation rates, and EV players across European countries
Market Analysis and Trends
Energy & Utilities
The slide highlights Norway's dominance in BEV supply and market penetration compared to other European countries, showing metrics like BEV penetration percentage, top models' depreciation, and the number of pure EV players
BEV supply, market penetration, depreciation, EV players, European market
false
Market Analysis and Trends
Energy & Utilities
Multiple Chart
PwC/Strategy&
Add to my slides
Remove from favorites
The slide includes a combination of a line chart showing gas prices and a column chart comparing TCO of Opel Corsa ICE vs. BEV. It has text in two columns with analysis and explanations.
Market Analysis and Trends
Energy & Utilities
The slide discusses the potential threat to the total cost of ownership (TCO) advantage of BEVs in Germany due to waning government incentives and rising electricity prices. It uses Opel Corsa as a case study for analysis.
BEV, TCO, Germany, Opel Corsa, incentives, analysis
false
Market Analysis and Trends
Energy & Utilities
Multiple Chart
PwC/Strategy&
Add to my slides
Remove from favorites
Diagrams of thermal manifolds and modules with key components labeled, designed for integration in BEVs.
Technology and Digital Transformation
Transportation & Logistics
Focuses on integration techniques for manifolds and modules in BEVs, emphasizing reduction in part count and weight.
BEV, thermal management, integration, efficiency, manufacturing
false
Technology and Digital Transformation
Transportation & Logistics
Diagram
Deutsche Bank
Add to my slides
Remove from favorites
The slide features pie charts showing the development of self-confidence, presentation skills, and business networking skills among care-experienced youth.
Client Case Studies
Education & Training
The slide presents the Beyond Your Limits program, which provides targeted support for care-experienced young people through skills training and mentoring.
Beyond Your Limits, care-experienced, skills training, mentoring
false
Client Case Studies
Education & Training
Multiple Chart
EY
Add to my slides
Remove from favorites
The slide includes a column chart with segments representing different banking sectors and a side section with key drivers listed as bullet points. The colors blue and gray are used for the chart, with annotations for changes. It also contains an inset box summarizing the content in a clear, readable font.
Market Analysis and Trends
Financial Services
Displays the growth in Banking and Financial Services (BFS) in areas like personal banking and wealth management, complemented by key drivers affecting these sectors, such as changes in deposit volumes and management fees. Tailored for analyzing market trends in banking services.
BFS, growth, banking, financial services, personal banking, wealth management, deposit volumes, performance analysis
false
Market Analysis and Trends
Financial Services
Mixed Chart
Goldman Sachs
Add to my slides
Remove from favorites
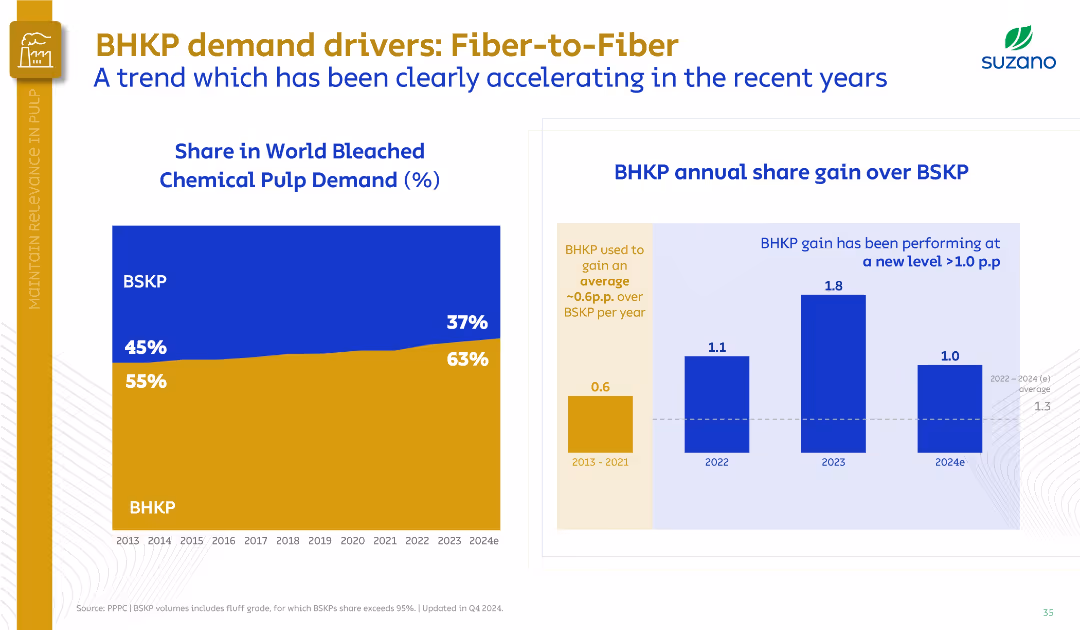
Left graph shows BHKP vs. BSKP share trend; right bar chart compares share gain. Uses a dual-panel data layout.
Market Analysis and Trends
Industrial & Manufacturing
The slide shows BHKP’s growing share in world pulp demand from 55% in 2013 to 63% in 2024, surpassing BSKP. Highlights increasing annual gains, particularly post-2022, signaling a market shift to hardwood pulp.
BHKP, BSKP, market share, demand growth, pulp, Suzano, fiber substitution
false
Market Analysis and Trends
Industrial & Manufacturing
Multiple Chart
Goldman Sachs
Add to my slides
Remove from favorites
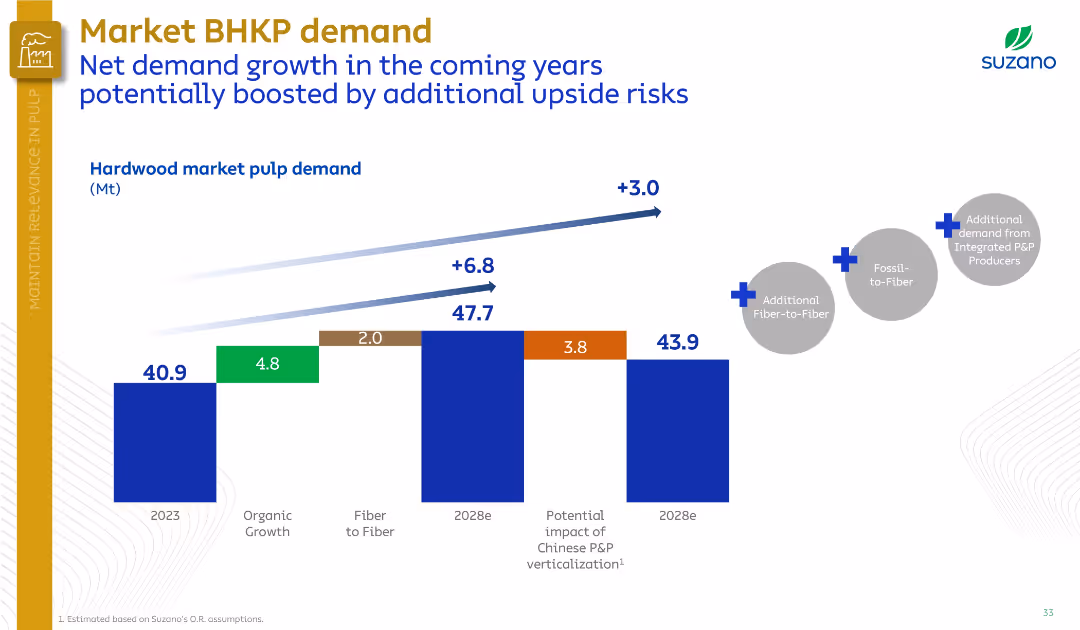
Horizontal bar chart tracks demand growth drivers; annotations highlight upside potential. Minimalist layout with emphasis on data.
Market Analysis and Trends
Industrial & Manufacturing
Suzano outlines projected demand growth for market BHKP from 2023 to 2028, driven by organic growth, fiber substitution, and potential upside from Chinese market changes and fossil-to-fiber trends.
BHKP demand, fiber-to-fiber, organic growth, pulp market, China, fossil substitution
false
Market Analysis and Trends
Industrial & Manufacturing
Single Chart
Goldman Sachs
Add to my slides
Remove from favorites
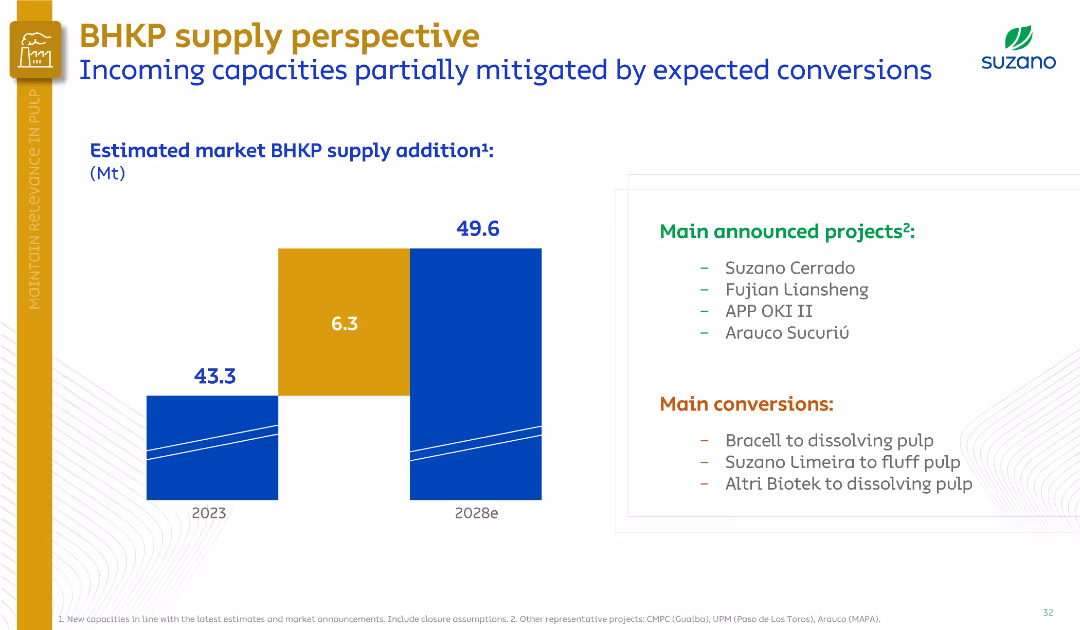
Left side shows bar chart of supply additions; right side lists new projects and conversions. Split layout, clean with minimal colors.
Market Analysis and Trends
Industrial & Manufacturing
The slide estimates BHKP market supply to increase from 43.3 Mt in 2023 to 49.6 Mt by 2028, offset by pulp conversions. Lists major new projects and planned mill conversions, helping stabilize market supply.
BHKP supply, pulp market, new projects, conversions, Suzano, capacity, 2028 forecast
false
Market Analysis and Trends
Industrial & Manufacturing
Mixed Chart
Goldman Sachs
Add to my slides
Remove from favorites
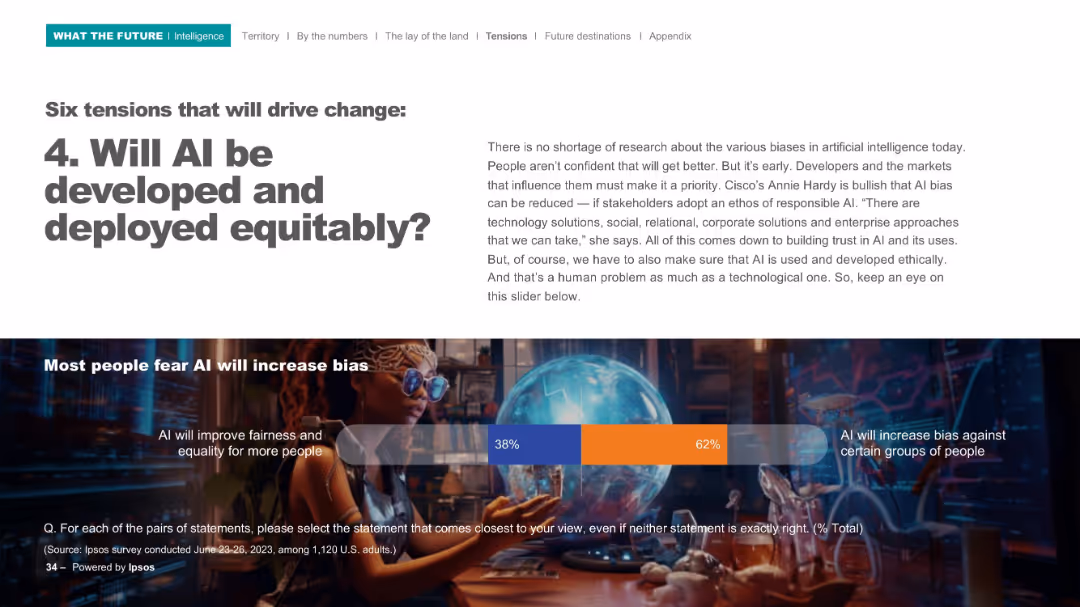
Top portion includes a question and analysis text; lower part features a bar split graphic on public sentiment about AI and fairness.
Regulatory and Compliance
Artificial Intelligence
Focused on AI fairness and ethics, this slide explores public perception that AI may increase bias rather than reduce it. It emphasizes the need for developers to prioritize responsible AI development.
bias, fairness, equity, ethics, AI development
false
Regulatory and Compliance
Artificial Intelligence
Mixed Chart
IPSOS
Add to my slides
Remove from favorites
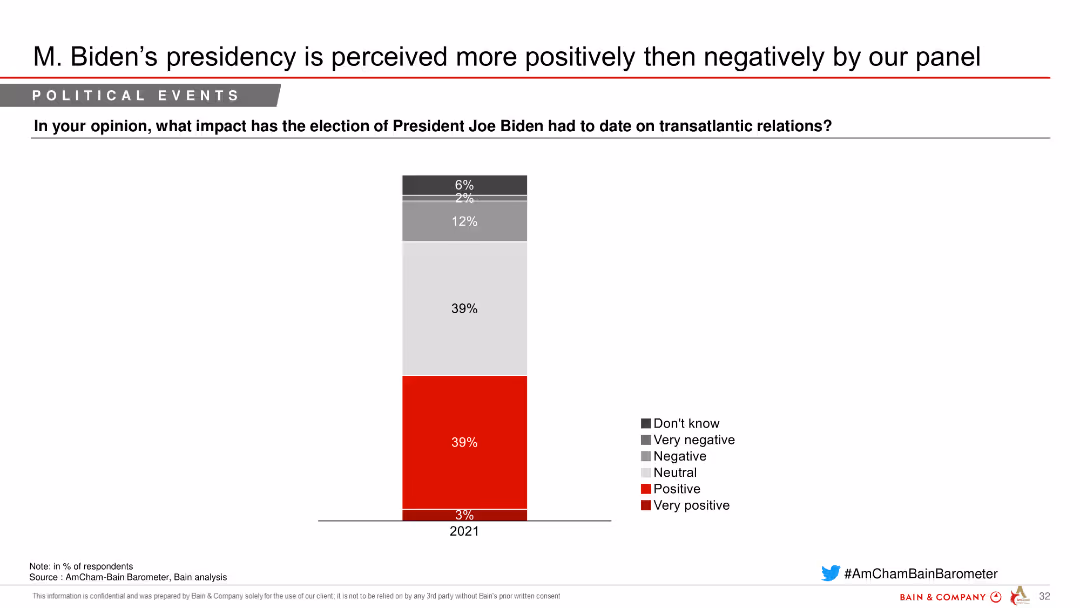
Column chart depicting perceptions of President Joe Biden's impact on transatlantic relations, with segmented responses indicating varying degrees of positivity and negativity.
Market Analysis and Trends
Government & Public Sector
Shows the impact of President Joe Biden's election on transatlantic relations, with a majority seeing it positively, as indicated by a survey of respondents.
Biden, transatlantic, relations, perceptions, survey
false
Market Analysis and Trends
Government & Public Sector
Single Chart
Bain
Add to my slides
Remove from favorites
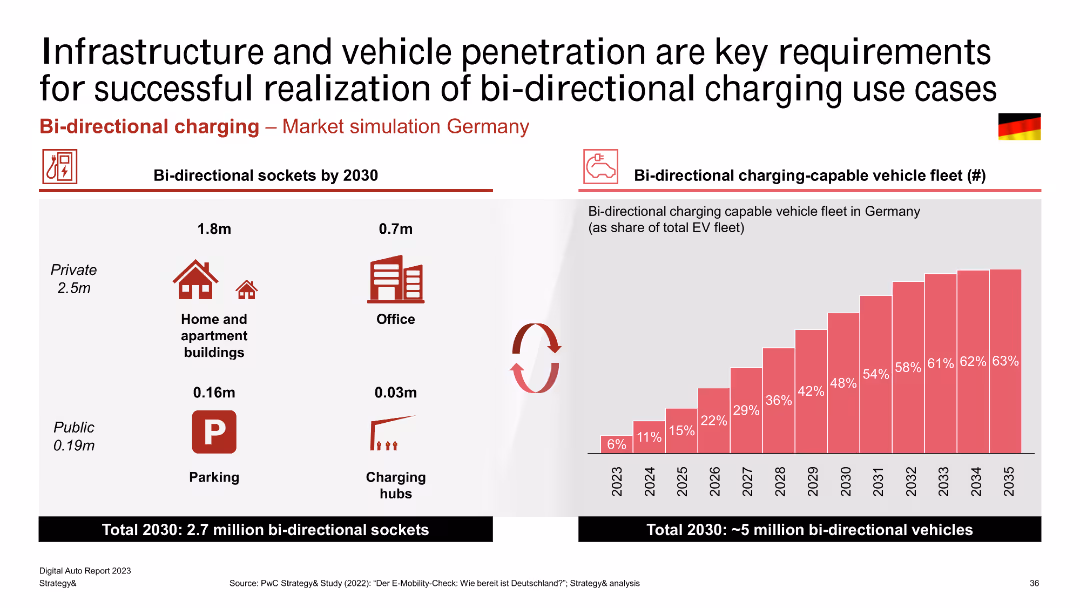
This slide presents a combination of infographics and column charts, highlighting projections for bi-directional sockets and vehicle fleet penetration in Germany by 2030. It includes icons and percentage bars.
Market Analysis and Trends
Energy & Utilities
The slide projects the number of bi-directional sockets and bi-directional charging-capable vehicles in Germany by 2030. It highlights the significant growth expected in private, office, and public charging hubs, emphasizing the infrastructure needed for this transition.
Bi-directional Charging, Infrastructure, Vehicle Penetration, Germany, Market Simulation, Charging Hubs, Projection
false
Market Analysis and Trends
Energy & Utilities
Mixed Chart
PwC/Strategy&
Add to my slides
Remove from favorites
Slide displays a line graph illustrating the global Big Data Analytics market forecast. The layout includes bulleted text and a highlighted callout box, making it easy to follow.
Market Analysis and Trends
Environmental Services & Sustainability
Analyzes the integration of Earth Observation data within the Big Data context, forecasting significant growth in EO Big Data revenues. This slide is instrumental for discussions on market opportunities and strategic planning.
Big Data, Earth Observation, market forecast, revenue growth, analytics
false
Market Analysis and Trends
Environmental Services & Sustainability
Mixed Chart
PwC/Strategy&
Add to my slides
Remove from favorites
Circular diagram highlighting the fragmentation of health data ecosystems and a list of the four dimensions of big data in healthcare (Volume, Veracity, Variety, Velocity).
Market Analysis and Trends
Healthcare & Pharmaceuticals
The slide highlights the importance of big data in the healthcare sector, emphasizing the need to analyze the increasing volumes of data. It discusses the fragmentation of health data ecosystems and outlines the four key dimensions of big data that are crucial for deriving actionable insights in healthcare.
Big Data, Healthcare, Data Analysis, Ecosystems
false
Market Analysis and Trends
Healthcare & Pharmaceuticals
Diagram
Roland Berger
Add to my slides
Remove from favorites
A diagram slide featuring logos of DIRECTV, Vizio, Dish, and Roku at the top. Below, a four-step integration process for Nielsen Measurement with colored arrows indicating data flow.
Technology and Digital Transformation
Media & Entertainment
Describes the steps for integrating big data into Nielsen measurement, including data quality, demographics, exposure, and ratings calculations.
Big data, Nielsen, integration, data quality, demographics, exposure, ratings
false
Technology and Digital Transformation
Media & Entertainment
Linear Flow
Nielsen
Add to my slides
Remove from favorites
Two-column layout with bullet points detailing headwinds on the left and opportunities on the right. Uses icons and highlighted text for emphasis.
Market Analysis and Trends
Technology & Software
Discusses the challenges and opportunities in the tech sector post-COVID, including cost-cutting measures and the rise of AI technologies.
big tech, opportunities, headwinds, market, AI
false
Market Analysis and Trends
Technology & Software
Boxed
IPSOS
Add to my slides
Remove from favorites
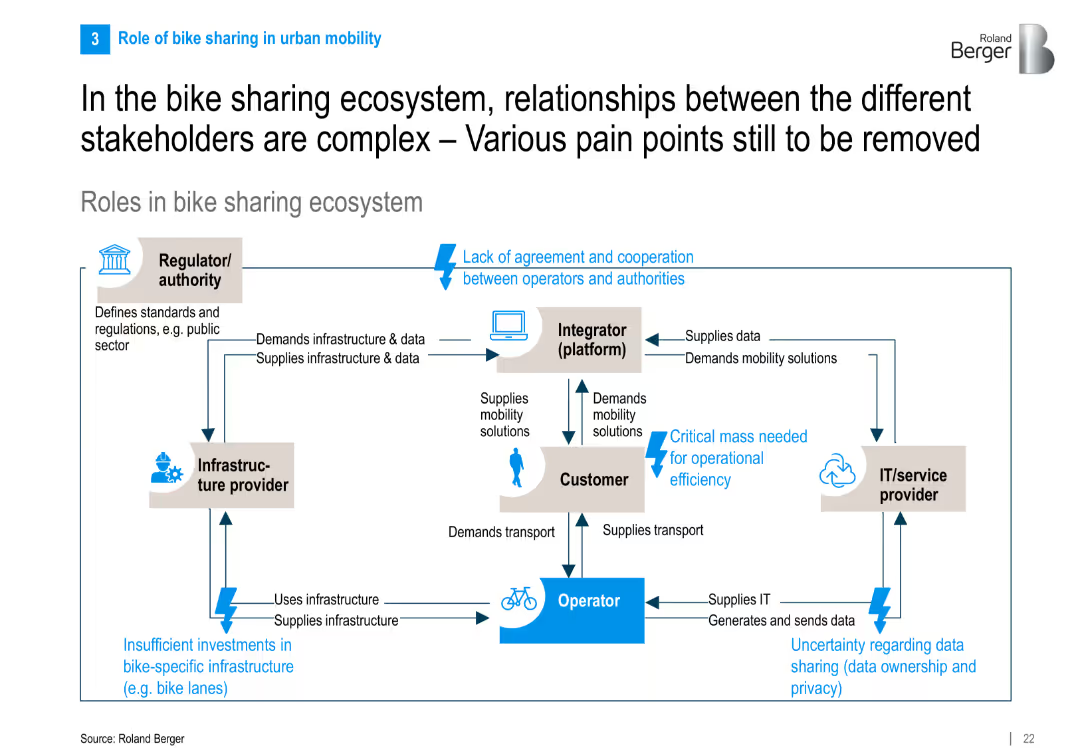
Flowchart-style diagram showing stakeholder interactions in the ecosystem with directional arrows, text boxes, and pain points highlighted in blue.
Operational Efficiency
Transportation & Logistics
The slide maps out interactions among key stakeholders in bike sharing—operators, customers, regulators, integrators, and IT providers—highlighting collaboration pain points like regulation, infrastructure, and data issues.
bike sharing, ecosystem, stakeholder roles, pain points, infrastructure, IT providers, mobility
false
Operational Efficiency
Transportation & Logistics
Diagram
Roland Berger
Add to my slides
Remove from favorites
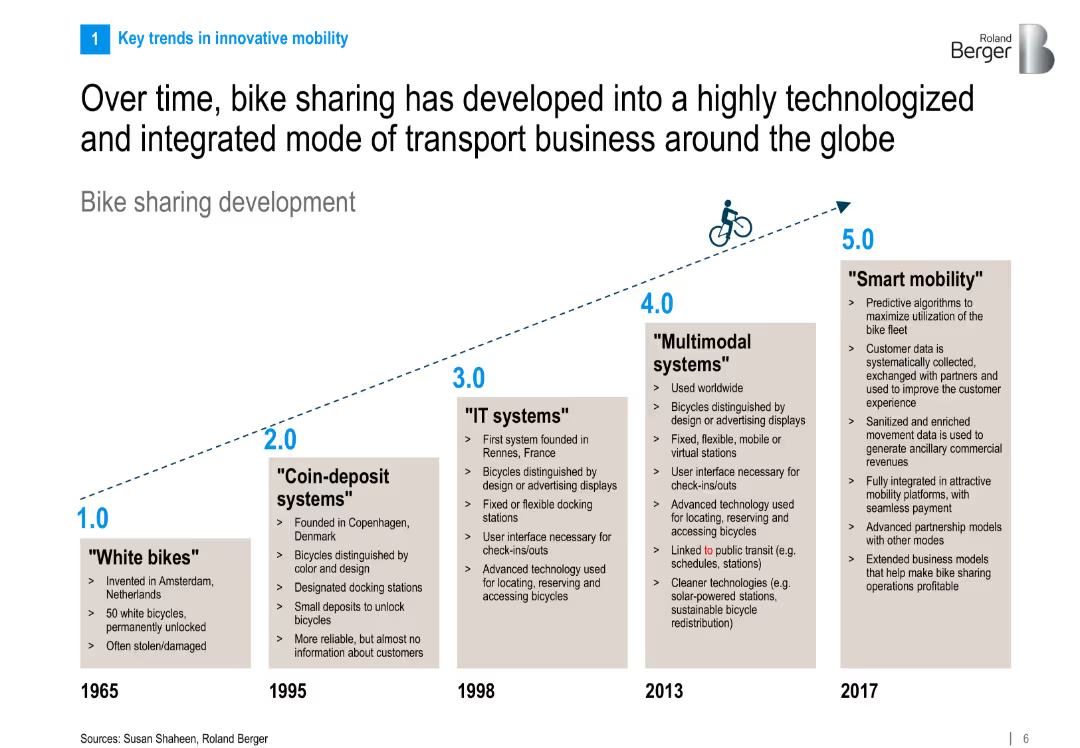
Timeline infographic illustrating five generations of bike sharing systems from 1965 to 2017. Each generation is explained in a boxed section along an upward trajectory.
Industry Overview
Transportation & Logistics
This slide traces the evolution of bike sharing, from early white bikes in 1965 to integrated smart mobility systems in 2017. It emphasizes the increasing role of technology, multimodal systems, and predictive algorithms in bike sharing.
bike sharing, evolution, smart mobility, IT systems, multimodal, transportation, timeline, innovation, mobility trends
false
Industry Overview
Transportation & Logistics
Linear Flow
Roland Berger
Add to my slides
Remove from favorites
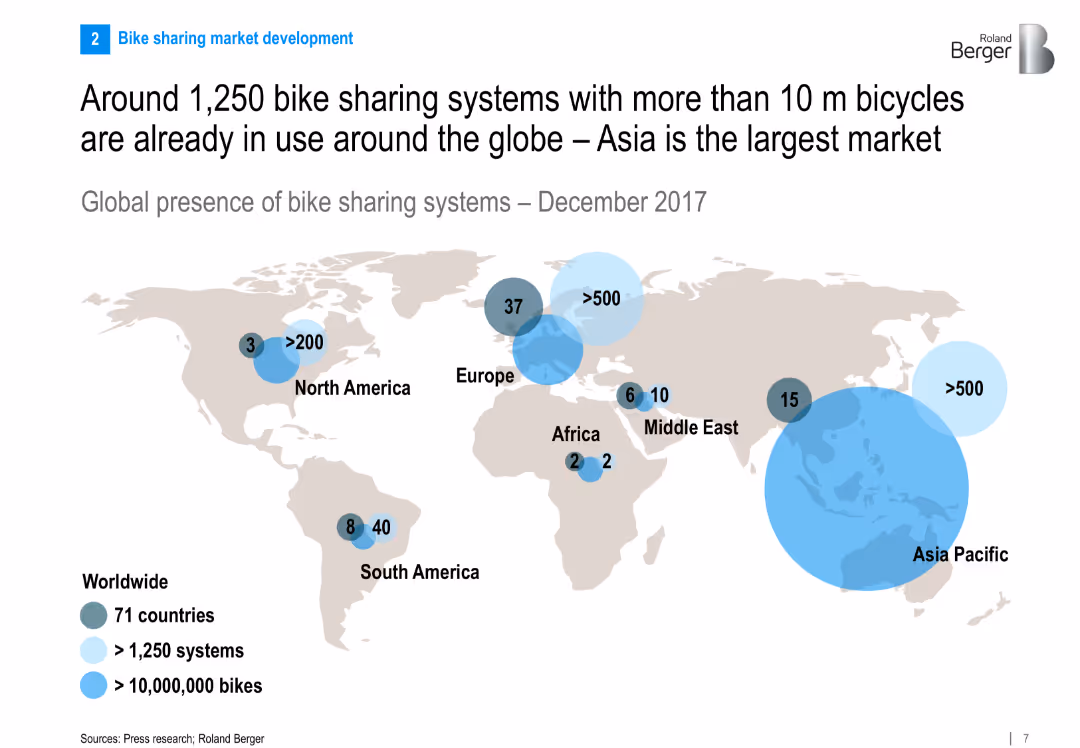
World map showing global presence of bike sharing systems with bubble markers for number of systems and bikes per region. Clean and global infographic design.
Market Analysis and Trends
Transportation & Logistics
The slide presents a global snapshot of bike sharing systems, highlighting Asia Pacific as the largest market. It shows the number of systems and bikes by region, indicating the global spread and significance of the industry.
bike sharing, global distribution, Asia Pacific, market size, transportation, infographic, global trends, 2017
false
Market Analysis and Trends
Transportation & Logistics
Multiple Chart
Roland Berger
Add to my slides
Remove from favorites
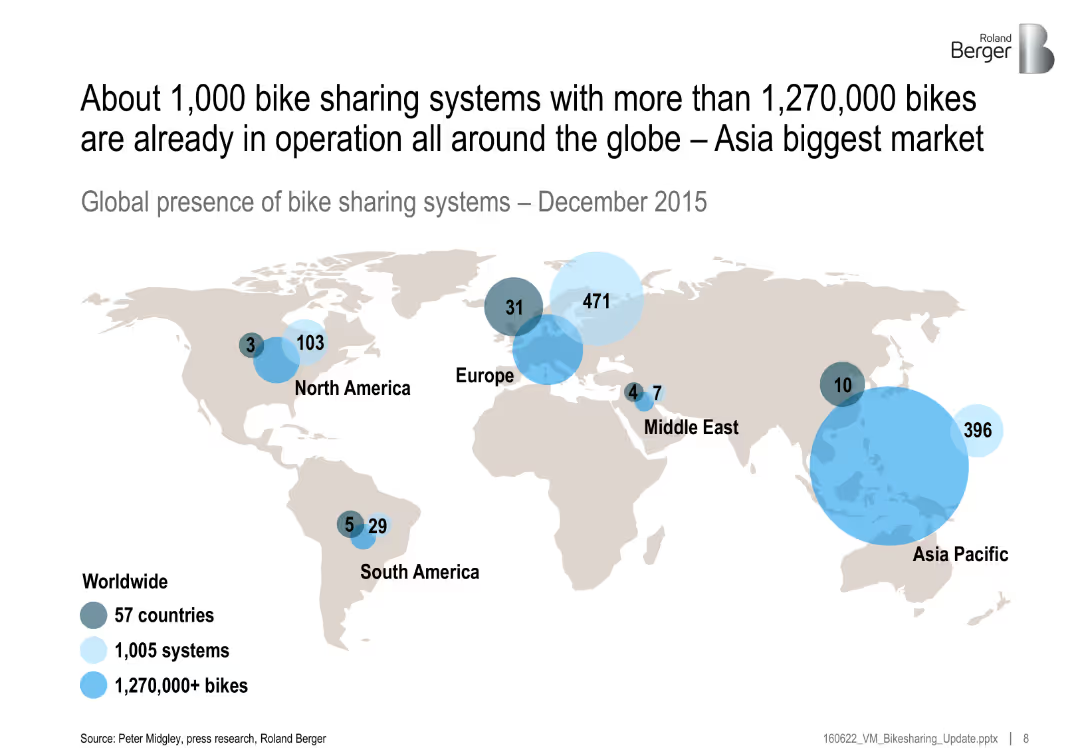
World map with labeled circles showing distribution of systems and bikes by region; bubble sizes proportional to number of bikes
Industry Overview
Transportation & Logistics
The slide presents global statistics on bike-sharing systems as of December 2015. It shows widespread adoption, with Asia-Pacific being the largest market. Bubble sizes indicate the number of systems and bikes per region.
bike sharing, global distribution, systems, Asia-Pacific, transportation, bikes, 2015, mobility
false
Industry Overview
Transportation & Logistics
Single Chart
Roland Berger
Add to my slides
Remove from favorites
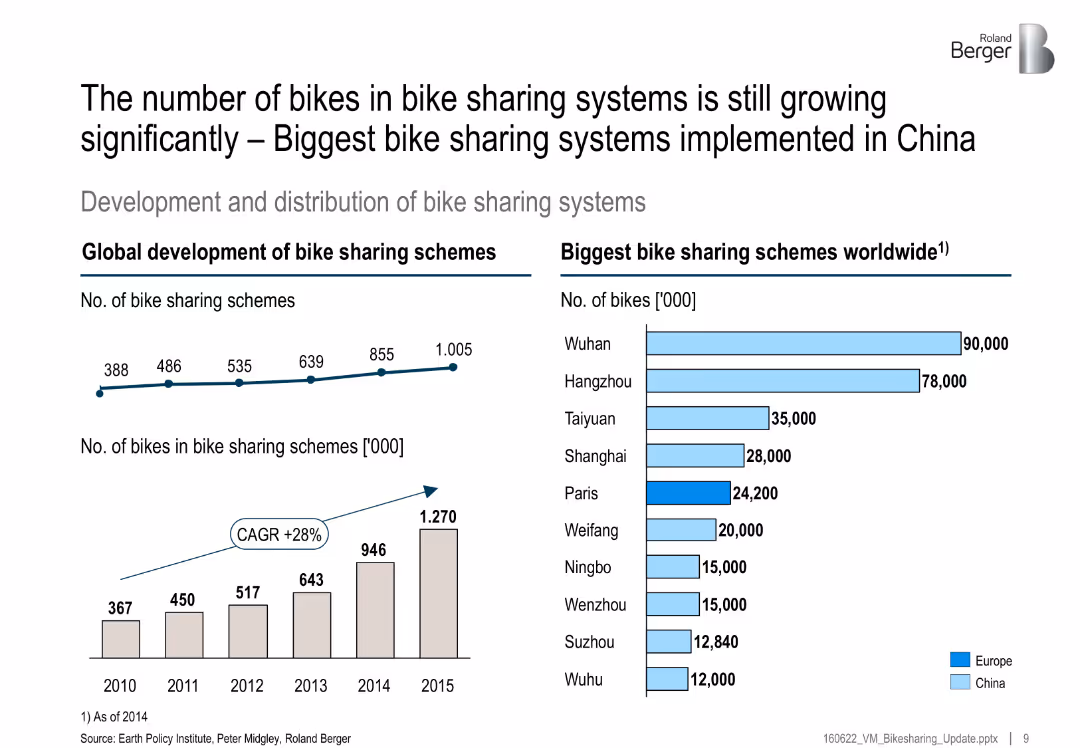
Left side has two growth charts (number of systems and bikes); right side bar chart lists largest global schemes by city
Market Analysis and Trends
Transportation & Logistics
This slide highlights significant global growth in bike-sharing schemes, especially in China. It includes a CAGR of 28% and lists top cities by number of bikes, with Wuhan and Hangzhou leading.
bike sharing, growth, China, CAGR, top cities, mobility, transportation, schemes
false
Market Analysis and Trends
Transportation & Logistics
Multiple Chart
Roland Berger
Add to my slides
Remove from favorites
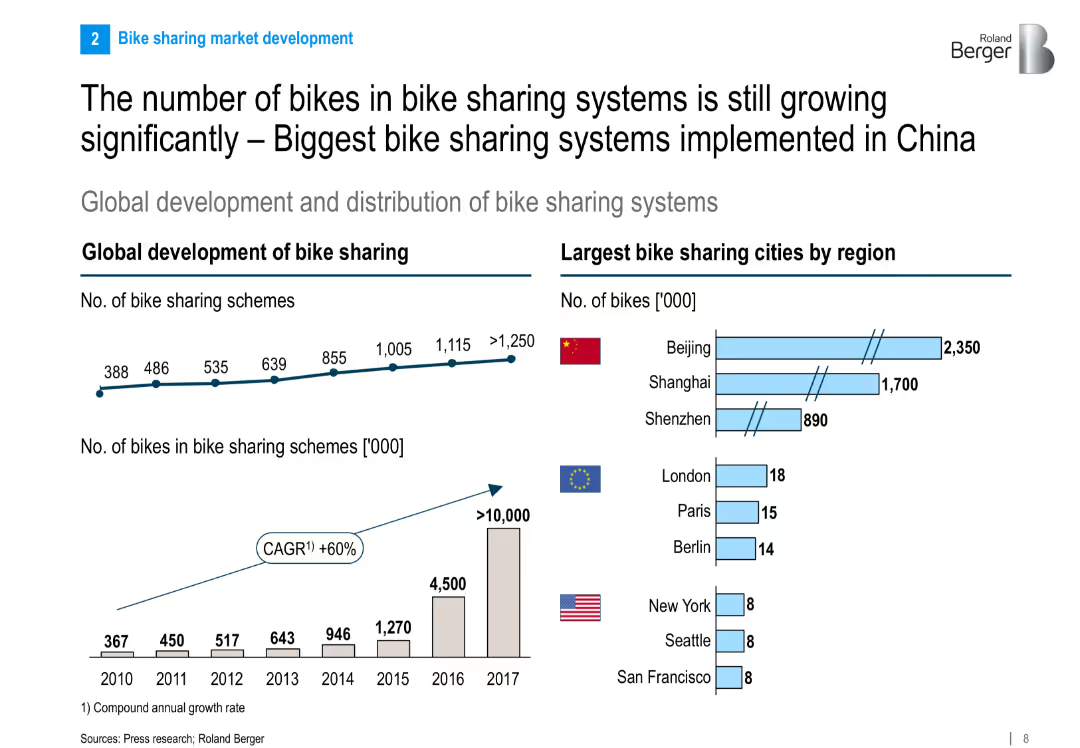
Dual charts: a time-series graph showing growth of schemes and bikes globally, and a bar chart comparing leading cities by number of bikes.
Market Analysis and Trends
Transportation & Logistics
This slide presents the strong growth trajectory of global bike sharing systems, with China’s cities like Beijing and Shanghai leading in bike count. It shows the annual increase in schemes and bike volumes from 2010 to 2017.
bike sharing, growth, China, global development, urban mobility, market trends, cities, statistics
false
Market Analysis and Trends
Transportation & Logistics
Multiple Chart
Roland Berger
Add to my slides
Remove from favorites
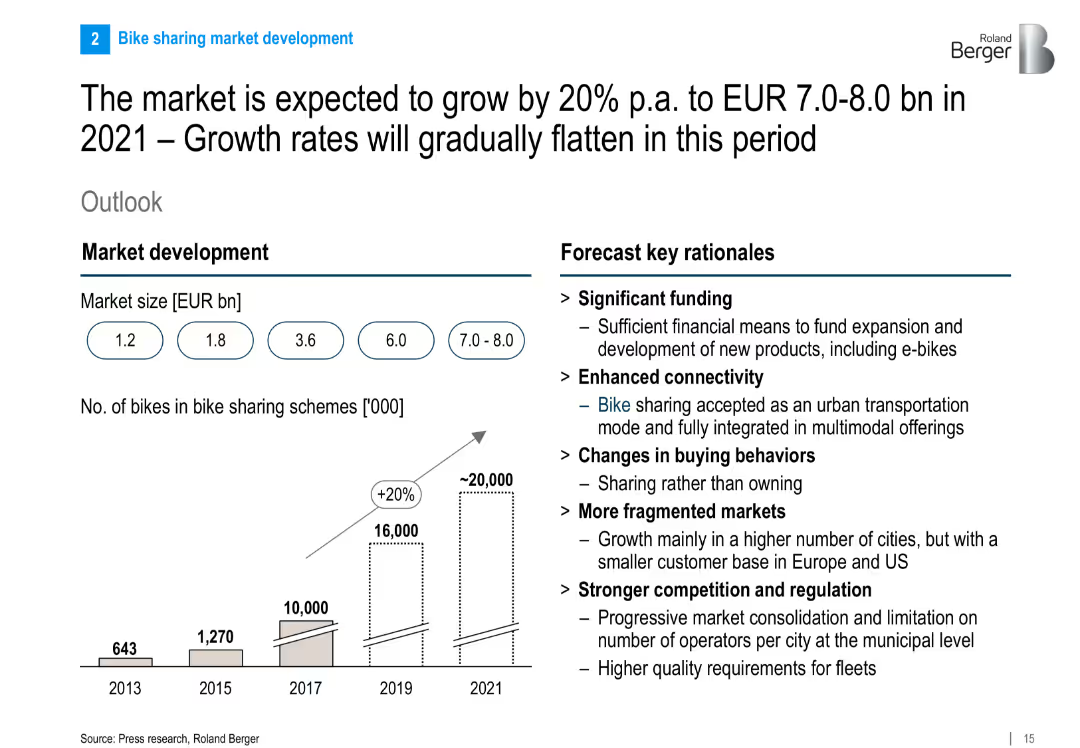
Dual chart layout: growth projection bar chart (market size and number of bikes) and bullet points listing rationale for market growth.
Investment Analysis
Transportation & Logistics
This slide projects strong market growth for bike sharing, citing key drivers such as funding, connectivity, changing behavior, and regulation. It predicts a doubling of market size and a rise in fleet numbers to 20 million bikes by 2021.
bike sharing, market forecast, investment, growth drivers, valuation, connectivity, urban mobility
false
Investment Analysis
Transportation & Logistics
Mixed Chart
Roland Berger
Add to my slides
Remove from favorites
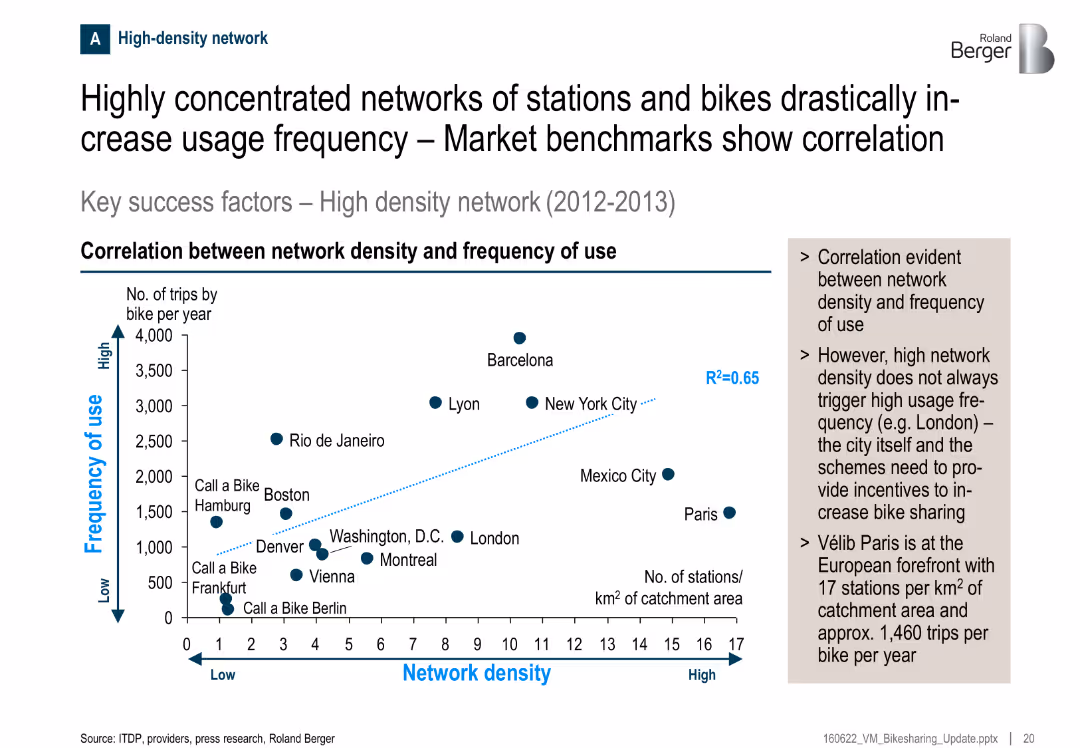
Scatter plot showing correlation between station density and usage frequency; key observations summarized in side box
Performance Metrics and KPIs
Transportation & Logistics
There’s a clear correlation between the density of bike stations and the frequency of use. Cities like Barcelona and New York show high use with dense networks. Paris, despite high density, shows moderate usage, suggesting incentives matter too.
bike sharing, usage frequency, network density, correlation, transportation, Paris, KPIs, stations
false
Performance Metrics and KPIs
Transportation & Logistics
Mixed Chart
Roland Berger
Add to my slides
Remove from favorites
This slide features a pie chart and a column chart, presenting data on billing accuracy and the timeliness of invoice generation, with clear graphical representation.
Financial Performance
Energy & Utilities
The slide provides detailed information on billing accuracy and timeliness, including the percentage of accurate billings and the time taken for invoice generation, visualized through charts.
billing accuracy, timeliness, invoices, utilities, data
false
Financial Performance
Energy & Utilities
Multiple Chart
EY
Add to my slides
Remove from favorites
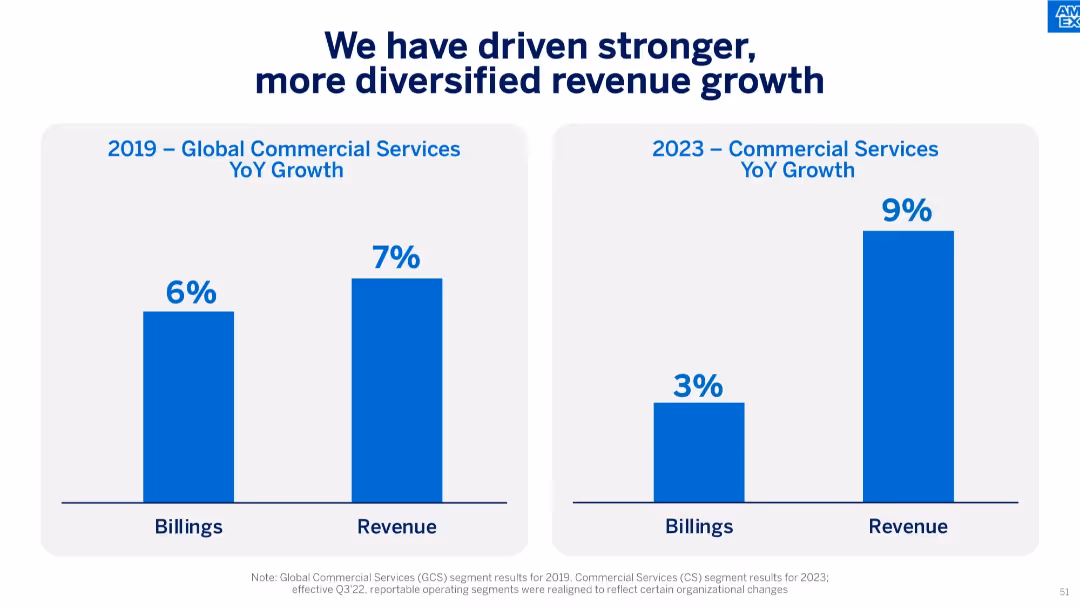
Two side-by-side bar graphs comparing 2019 and 2023 YoY growth in billings and revenue for commercial services.
Financial Performance
Financial Services
The slide demonstrates improvement in revenue diversification and growth from 2019 to 2023. While billing growth declined, revenue growth accelerated, indicating a more efficient business model.
billings, revenue growth, diversification, YoY, commercial services, 2023 performance, financial growth
false
Financial Performance
Financial Services
Single Chart
McKinsey
Add to my slides
Remove from favorites
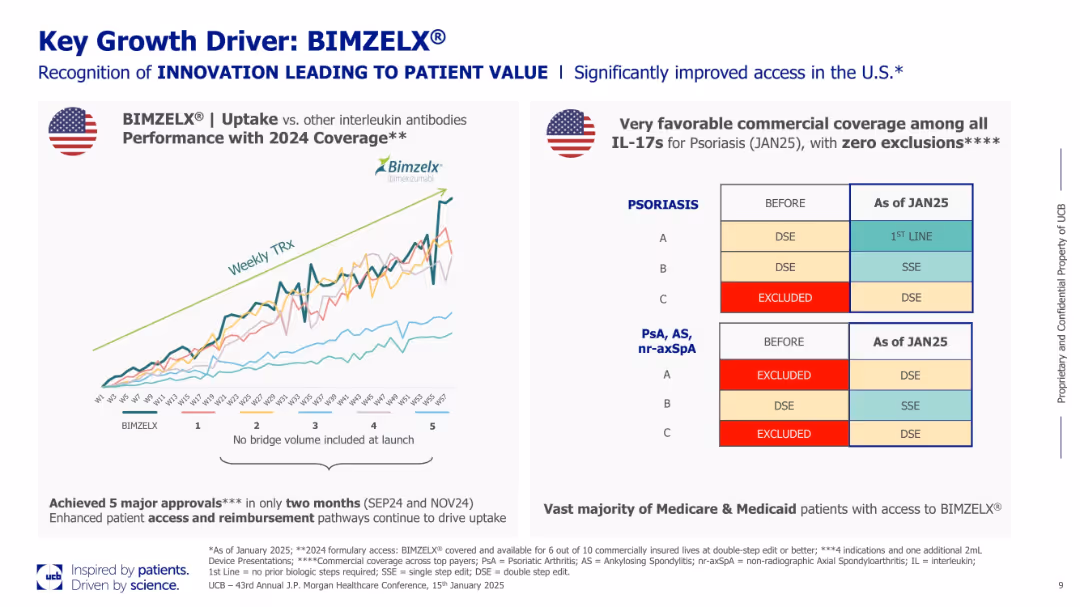
Dual-pane slide with uptake chart on the left and coverage grid on the right. Color-coded lines show BIMZELX® performance versus competitors. Right side emphasizes favorable insurance coverage.
Product and Service Analysis
Healthcare & Pharmaceuticals
BIMZELX® is positioned as a high-growth asset driven by superior uptake and favorable U.S. market access. The slide shows comparative prescription trends and outlines its broad commercial coverage, especially among Medicare and Medicaid patients for psoriasis and PsA.
BIMZELX, psoriasis, IL-17, U.S. market access, prescription trends, innovation
false
Product and Service Analysis
Healthcare & Pharmaceuticals
Mixed Chart
JP Morgan
Add to my slides
Remove from favorites
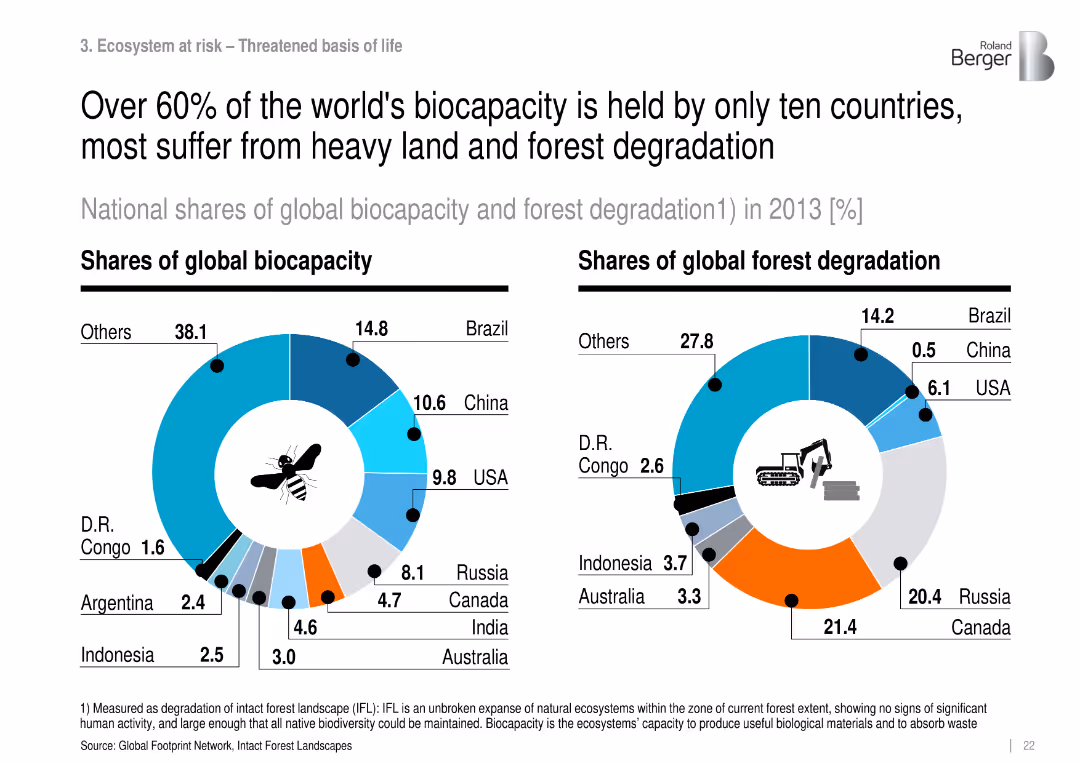
Dual donut charts: biocapacity share by nation and forest degradation share by nation.
Risk Assessment and Management
Environmental Services & Sustainability
Highlights global biocapacity concentration and compares it to forest degradation patterns, indicating critical pressure in high-capacity countries like Brazil and Russia.
biocapacity, forest degradation, land use, biodiversity, ecosystem stress
false
Risk Assessment and Management
Environmental Services & Sustainability
Multiple Chart
Roland Berger
Add to my slides
Remove from favorites
The slide includes text boxes outlining key figures and commitments for future dates, and the 'Act4nature International' logo.
Strategic Planning
Environmental Services & Sustainability
Outlines Michelin's environmental performance in 2022 and its commitments for 2030 to reduce the impact of its operations on biodiversity and ecosystems, highlighting progress and future targets.
Biodiversity, Ecosystems, Environmental Impact, Michelin, Commitments, Sustainability, Life Cycle Analysis, Raw Materials, 2030 Targets, Act4nature
false
Strategic Planning
Environmental Services & Sustainability
Table
Morgan Stanley
Add to my slides
Remove from favorites
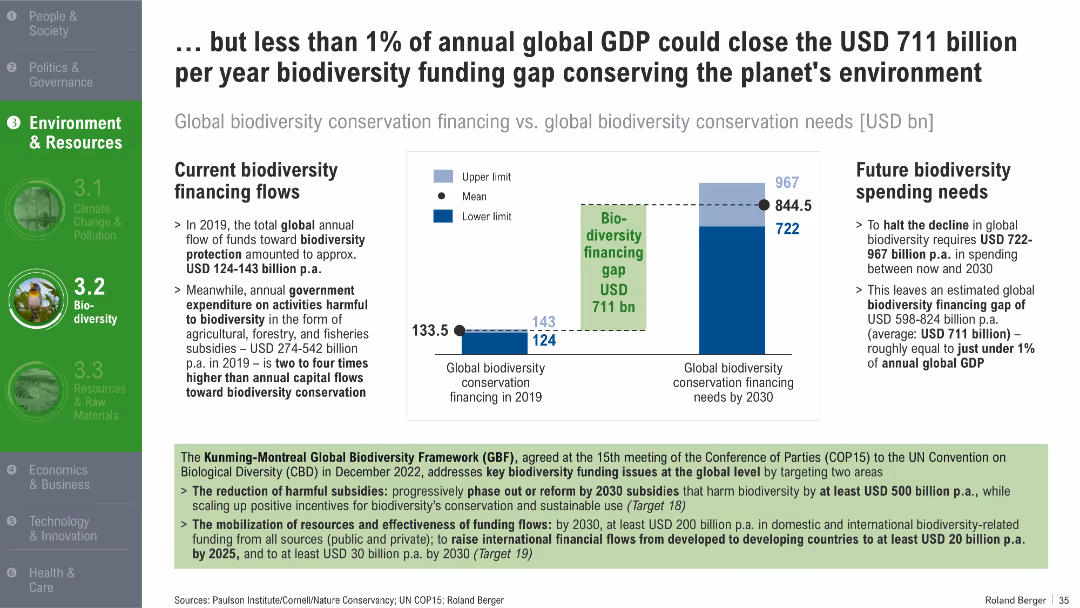
Side-by-side bar graph comparing 2019 funding vs 2030 needs; text boxes on funding gaps, current flows, and solutions
Investment Analysis
Environmental Services & Sustainability
This slide highlights the financial shortfall in biodiversity conservation funding, revealing a gap of USD 711 billion. It argues that less than 1% of global GDP could cover this need and presents strategies from the Global Biodiversity Framework to boost funding and reduce harmful subsidies.
biodiversity finance, funding gap, global GDP, subsidies, conservation needs, COP15, GBF
false
Investment Analysis
Environmental Services & Sustainability
Mixed Chart
Roland Berger
Add to my slides
Remove from favorites
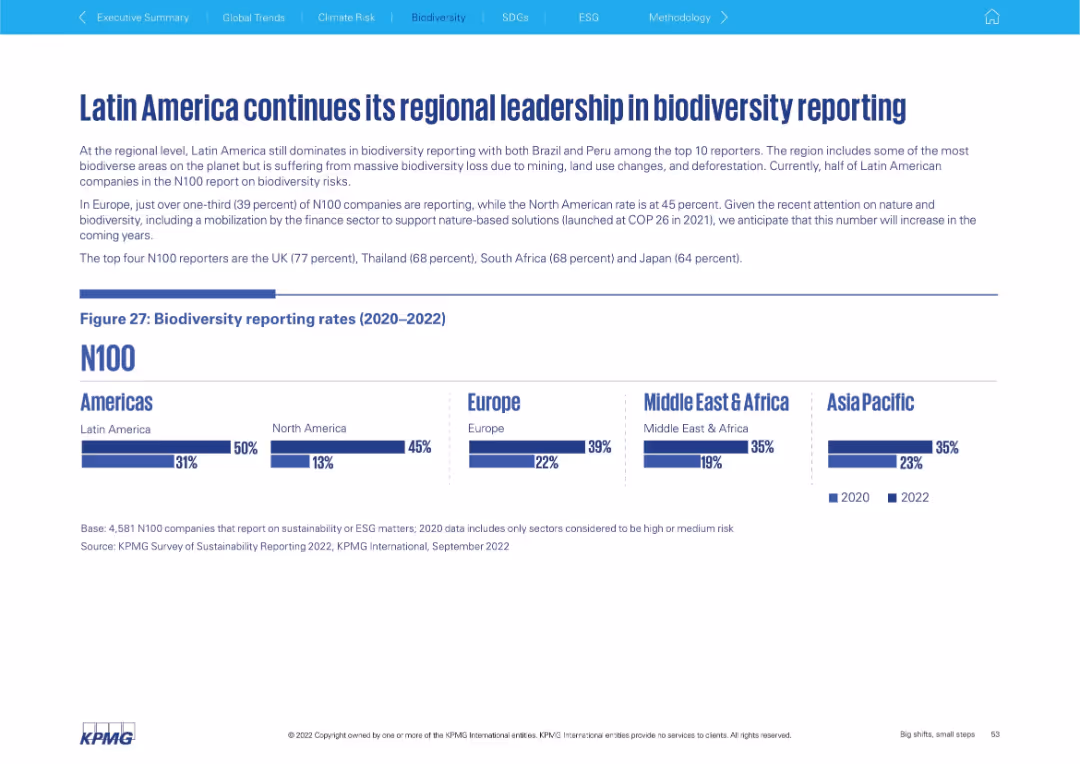
Top: narrative summary; Bottom: bar chart showing 2020–2022 biodiversity reporting by region. Clean design with five global regions.
Risk Assessment and Management
Environmental Services & Sustainability
This slide reveals regional trends in biodiversity reporting, with Latin America leading, particularly due to Brazil and Peru. Europe and Asia Pacific show moderate increases, while North America and the Middle East & Africa still lag.
biodiversity, Latin America, regional reporting, ESG, environment
false
Risk Assessment and Management
Environmental Services & Sustainability
Mixed Chart
KPMG
Add to my slides
Remove from favorites
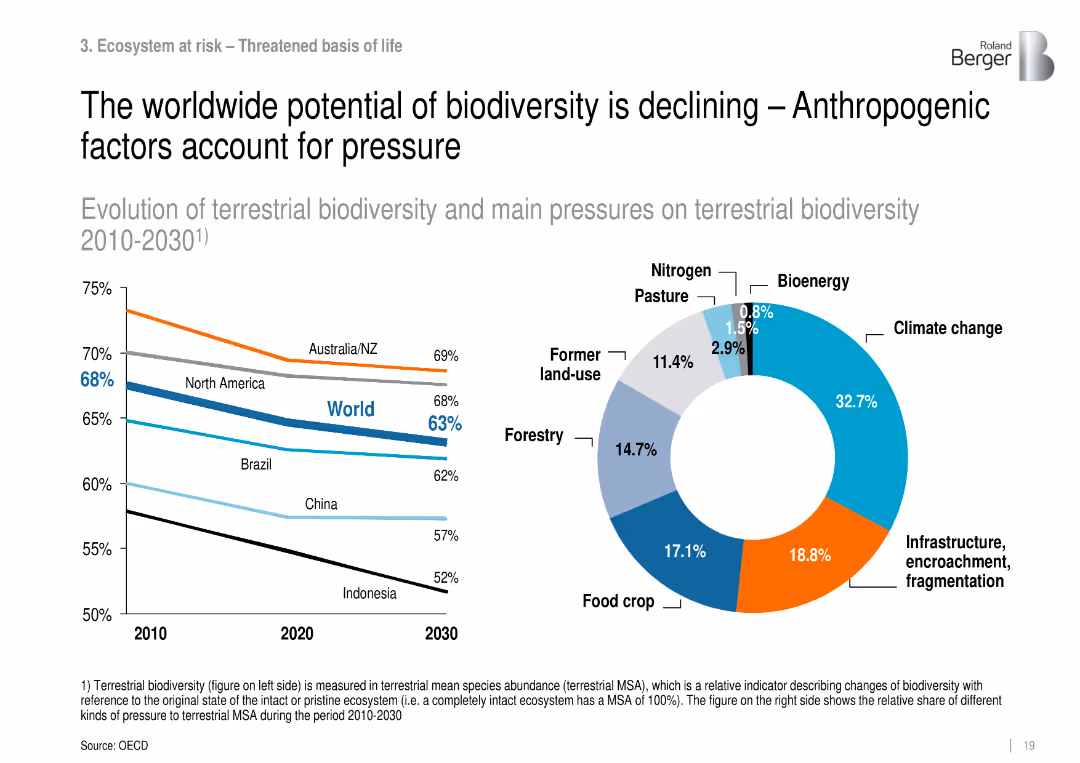
Line graph (2010–2030) with biodiversity trend by region and donut chart of pressure sources.
Risk Assessment and Management
Environmental Services & Sustainability
Shows decline in terrestrial biodiversity globally and identifies anthropogenic pressures—especially climate change and land use change—as the main causes.
biodiversity loss, climate pressure, habitat degradation, MSA, ecosystems
false
Risk Assessment and Management
Environmental Services & Sustainability
Multiple Chart
Roland Berger
Add to my slides
Remove from favorites
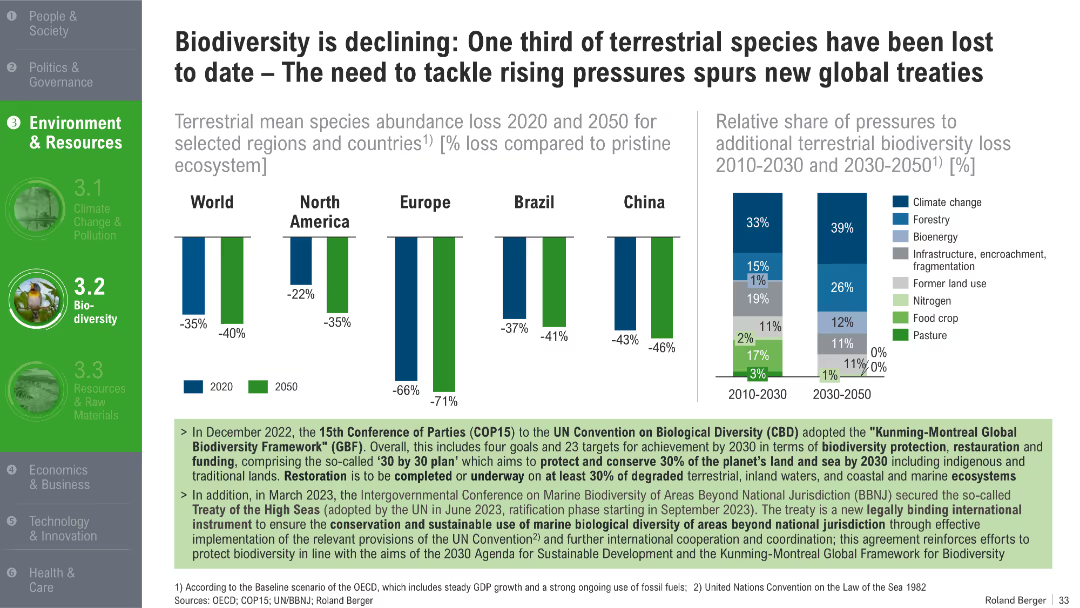
Bar charts showing biodiversity loss by region and projected loss by 2050; stacked bar chart of contributing pressures
Industry Overview
Environmental Services & Sustainability
The slide outlines global and regional declines in species abundance and projects further losses by 2050. It attributes the decline to pressures like climate change, deforestation, and land use. The slide supports the urgency of global biodiversity treaties and restoration initiatives.
biodiversity loss, species decline, ecosystem pressure, COP15, habitat degradation, restoration, 2050 projection
false
Industry Overview
Environmental Services & Sustainability
Multiple Chart
Roland Berger
Add to my slides
Remove from favorites
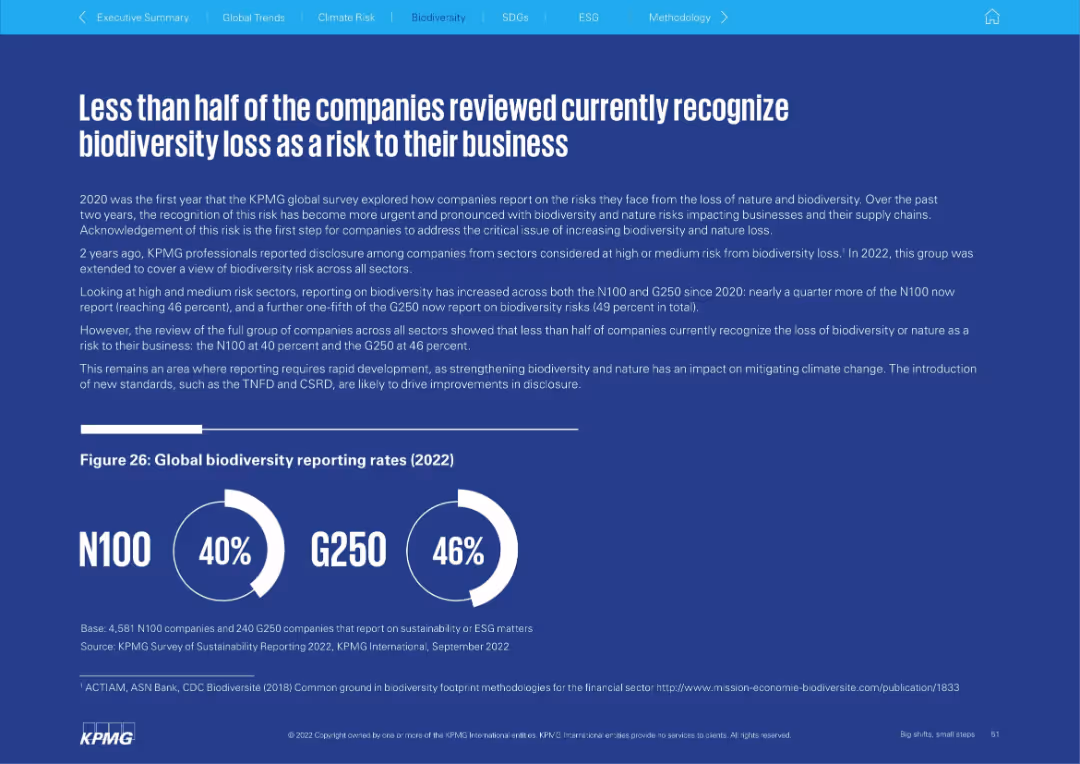
Solid blue background with left-aligned narrative and circular infographic showing biodiversity reporting rates for N100 and G250 in 2022.
Risk Assessment and Management
Environmental Services & Sustainability
The slide discusses how under half of surveyed companies recognize biodiversity loss as a business risk, despite rising urgency. It reports increased biodiversity disclosure in recent years but emphasizes the need for greater recognition and action across sectors.
biodiversity, risk management, disclosure, ESG, sustainability, N100
false
Risk Assessment and Management
Environmental Services & Sustainability
Mixed Chart
KPMG
Add to my slides
Remove from favorites
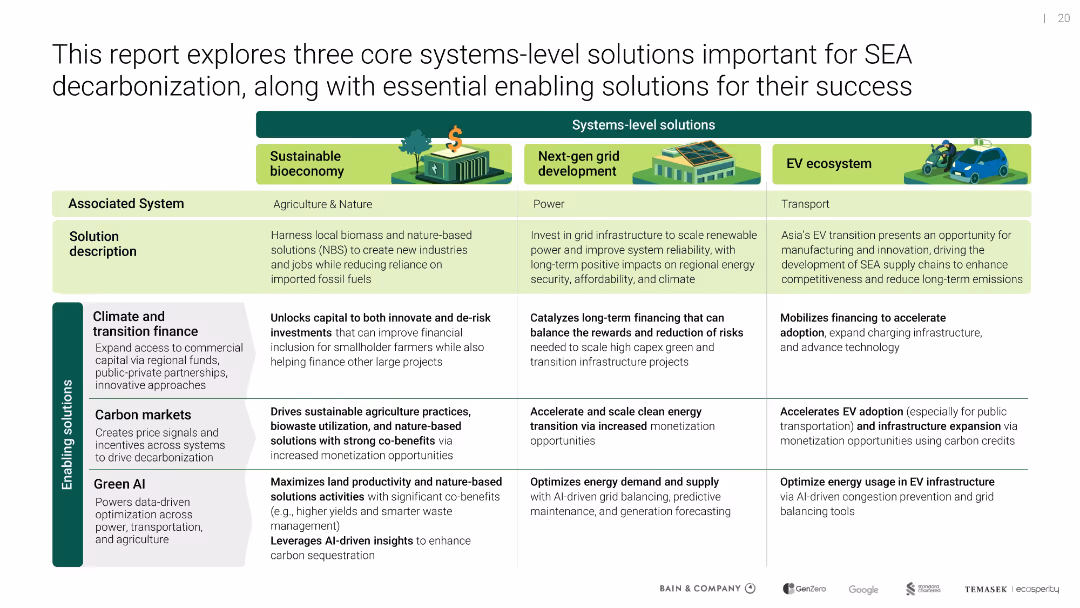
Matrix-style layout with three core solutions across top and three enabling solutions down the side; includes icons
Product and Service Analysis
Environmental Services & Sustainability
Compares systems-level interventions (bioeconomy, grid, EV) with enabling levers (finance, carbon markets, AI), showing synergy between foundational systems and scalable impact tools.
bioeconomy, grid, EV, green AI, climate finance, carbon markets
false
Product and Service Analysis
Environmental Services & Sustainability
Table
Bain
Add to my slides
Remove from favorites
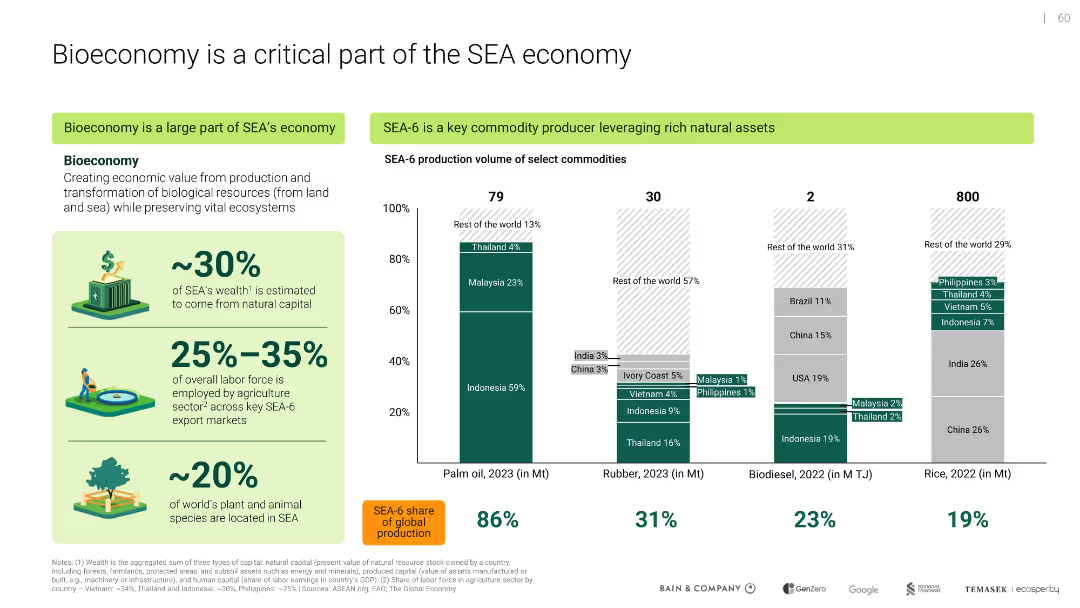
Left-aligned text blocks with key stats, bar charts on the right showing SEA-6 commodity production share
Industry Overview
Agriculture & Food Production
Highlights the economic significance of bioeconomy in SEA, with 30% of wealth from natural capital and 25-35% labor force in agriculture. SEA is a global leader in palm oil and rubber production.
bioeconomy, SEA economy, agriculture, natural capital, commodity production, palm oil, labor force
false
Industry Overview
Agriculture & Food Production
Mixed Chart
Bain
Add to my slides
Remove from favorites
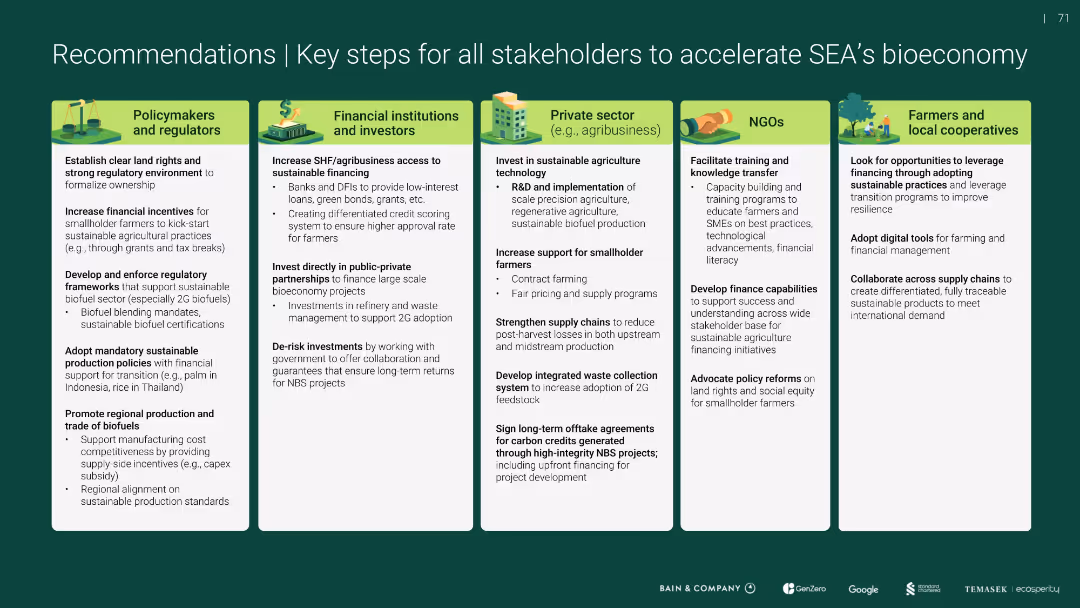
Multi-column layout with icons atop each stakeholder category; green and white color palette; clear headers and bullet points
Strategic Planning
Environmental Services & Sustainability
This slide outlines specific recommendations for various stakeholders (policymakers, investors, private sector, NGOs, farmers) to advance Southeast Asia’s bioeconomy through policy, finance, technology, training, and digital tools.
bioeconomy, stakeholders, sustainability, farming, regulation, finance, agribusiness, training, technology, incentives
false
Strategic Planning
Environmental Services & Sustainability
Pillar
Bain
Add to my slides
Remove from favorites
The slide features a column chart showing bioenergy consumption by sector (energy, transport, industry, buildings) and fuel type (solid biofuels, energy from waste, gaseous biofuels, liquid biofuels) for OECD countries in 2017.
Market Analysis and Trends
Energy & Utilities
This slide analyzes bioenergy consumption across different sectors and fuel types in OECD countries, highlighting the reliance on solid biofuels and the distribution of bioenergy use in transport, industry, and buildings.
bioenergy consumption, sector, fuel type, OECD countries, 2017, solid biofuels, energy from waste, gaseous biofuels, liquid biofuels
false
Market Analysis and Trends
Energy & Utilities
Single Chart
Kearney
Add to my slides
Remove from favorites
The slide features a column chart forecasting bioenergy demand from 2018 to 2040, divided into advanced biomass and traditional biomass. The growth rates are highlighted, showing the contributions of both types to the total bioenergy demand.
Market Analysis and Trends
Energy & Utilities
This slide projects bioenergy demand up to 2040, highlighting the main growth driver as advanced bioenergy, which is expected to grow at 2.5% per year, while traditional bioenergy use remains significant in residential sectors.
bioenergy demand, forecast, advanced biomass, traditional biomass, 2018-2040, growth driver, residential sector
false
Market Analysis and Trends
Energy & Utilities
Single Chart
Kearney
Add to my slides
Remove from favorites
Previous
Next
You don't have any favorites yet.
Please wait loading your favorites slides...
Create a FREE account to continue browsing
Receive Instant Access to 1,000+ slides from companies like McKinsey, Google, and Goldman Sachs
First Name
Last Name
Email
Password
I agree to all
Terms & Privacy Policy
Thank you! Your submission has been received!
Oops! Something went wrong while submitting the form.
Have an account?
Sign in
Upgrade to PRO to Save slides
Advanced Search and Filters
Access to 15,000+ slides
Access to Category Pages
Save/Bookmark Slides
PowerPoint Template Library
Pick a Plan
MONTHLY
$12/month
Billed every month, Cancel anytime.
YEARLY
$9/year
Billed $108 annually, Cancel anytime.
Checkout for $12/month
Checkout for $108/yr
Secured by Stripe | AES-256 bit encryption