My Account
My Slides
Search by Category
Companies
Slide Type
Use Case
Industry
Pricing
Templates
View All Templates
Download Template Slides
✦ AI
AI Prompt Library
AI Search
Feedback
Login
Logout
Get Started
Browse all Slides
Browse all Slides
Create a FREE Account
Instant access to 1,000+ real slides from top companies like McKinsey, BCG, Goldman Sachs, Google and many more!
First Name
Last Name
Email
Password
I agree to all
Terms & Privacy Policy
Thank you! Your submission has been received!
Oops! Something went wrong while submitting the form.
Have an account?
Sign in
Saved Slides
Total No. of slides saved
0
↻ Refresh
✖ Clear all
The slide features a world map showing bioenergy primary energy demand by continent for 2017 and 2040 under a stated policies scenario. It highlights the high demand in Southeast Asia and Africa, and the favorable markets in developed countries for advanced bioenergy.
Market Analysis and Trends
Energy & Utilities
This slide provides an overview of bioenergy primary energy demand across different continents, emphasizing the significant demand in Southeast Asia and Africa, and the potential for advanced bioenergy markets in developed countries.
bioenergy demand, primary energy, continent, Southeast Asia, Africa, advanced bioenergy, 2017, 2040, world map
false
Market Analysis and Trends
Energy & Utilities
Table
Kearney
Add to my slides
Remove from favorites
The slide features a world map showing bioenergy primary energy demand by continent for 2017 and 2040 under a stated policies scenario. Each continent's demand is displayed in terms of traditional biomass and advanced biomass.
Market Analysis and Trends
Energy & Utilities
This slide presents the primary energy demand for bioenergy by continent, comparing the data from 2017 and projections for 2040, highlighting the contributions of traditional and advanced biomass to the overall energy mix.
bioenergy demand, primary energy, continent, traditional biomass, advanced biomass, 2017, 2040, world map
false
Market Analysis and Trends
Energy & Utilities
Multiple Chart
Kearney
Add to my slides
Remove from favorites
The slide presents a column chart comparing the bioenergy sustainable potential against current energy consumption in different sectors (energy, transport, industry, buildings). Each sector's contribution to CO2 reduction is highlighted.
Market Analysis and Trends
Energy & Utilities
This slide illustrates how bioenergy potential can meet the energy demands of different sectors by 2018, focusing on energy, transport, industry, and buildings while highlighting CO2 reduction potential.
bioenergy, energy consumption, sector analysis, CO2 reduction, sustainable potential, 2018, energy, transport, industry, buildings
false
Market Analysis and Trends
Energy & Utilities
Multiple Chart
Kearney
Add to my slides
Remove from favorites
The slide features a maturity curve for various bioenergy products, showing their progression from research to mature technology. Products include biogasoline, biomethanol, biobutanol, bio jet fuel, renewable diesel, biomethane, gas from waste, wood pellets, wood chips, biodiesel, and bioethanol.
Technology and Digital Transformation
Energy & Utilities
This slide illustrates the maturity levels of different bioenergy products, highlighting the stages from lab work to widely deployed commercial-scale projects, and the associated technology risks and capital requirements.
bioenergy products, maturity curve, research, development, deployment, mature technology, biogasoline, biomethanol, biobutanol
false
Technology and Digital Transformation
Energy & Utilities
Single Chart
Kearney
Add to my slides
Remove from favorites
The slide displays a technology maturity curve for bioenergy processing methods, charting the progression from research to mature technology. The curve is segmented into different stages of development and deployment.
Technology and Digital Transformation
Energy & Utilities
This slide outlines the maturity levels of various bioenergy processing technologies, from lab work and pilot scale to large-scale deployment and mature technologies.
bioenergy, technology maturity, processing methods, research, development, deployment, maturity levels
false
Technology and Digital Transformation
Energy & Utilities
Single Chart
Kearney
Add to my slides
Remove from favorites
The slide features a column chart comparing bioenergy potential versus world energy demand for the year 2060. It uses varying shades of purple to represent different stages of bioenergy potential: theoretical, technical, and sustainable.
Strategic Planning
Energy & Utilities
This slide discusses the potential contribution of bioenergy to meet the world energy demand by 2060, emphasizing the need for focused allocation of biomass to decarbonize sectors with no other renewable options.
bioenergy, world energy demand, 2060, theoretical potential, technical potential, sustainable potential, decarbonize, renewable
false
Strategic Planning
Energy & Utilities
Single Chart
Kearney
Add to my slides
Remove from favorites
The slide is an advanced visual complexity level with multiple charts, including a central comparative list differentiating examples of technologies, expected outcomes, benefits, and risks in bioengineering.
Market Analysis and Trends
Technology & Software
Discusses potential disruptions in chemicals, materials, and energy due to bioengineering, showing financial impact forecasts and contrasting benefits vs. risks.
bioengineering, chemicals, energy, risks, benefits, materials, sustainability, disruption, forecast, impact
false
Market Analysis and Trends
Technology & Software
Text Only
McKinsey
Add to my slides
Remove from favorites
Text with bullet points and icons, detailing the impact on consumer goods with a blue and white color scheme.
Technology and Digital Transformation
Consumer Goods
Evaluates the influence of bioengineering on consumer goods industries, with examples of new technologies.
Bioengineering, Consumer Goods, Market Impact, Technologies
false
Technology and Digital Transformation
Consumer Goods
Header Horizontal
McKinsey
Add to my slides
Remove from favorites
Advanced visual complexity, featuring a numbered list and associated detailed text, with a DNA strand graphic emphasizing the subject of bioengineering debate topics.
Strategic Planning
Education & Training
Outlines topics of debate regarding bioengineering such as risk, bioethics, changes to daily life, and future outlooks of the technology.
bioengineering, debate, ethics, daily life, future, bioethics, technology, sustainability, impact, society
false
Strategic Planning
Education & Training
Header Vertical
McKinsey
Add to my slides
Remove from favorites
Four quadrants with icons and text descriptions, dark blue background with light blue details.
Technology and Digital Transformation
Healthcare & Pharmaceuticals
Explains bioengineering trends and their implications in healthcare and technology sectors.
Bioengineering, Healthcare, Technology, Education, Trends
false
Technology and Digital Transformation
Healthcare & Pharmaceuticals
Pillar
McKinsey
Add to my slides
Remove from favorites
A descriptive list with icons. Blue and white color scheme, with a clear layout.
Technology and Digital Transformation
Healthcare & Pharmaceuticals
Discusses the influence of bioengineering across different industries.
Bioengineering, Industry Influence, Comparative Analysis
false
Technology and Digital Transformation
Healthcare & Pharmaceuticals
Header Vertical
McKinsey
Add to my slides
Remove from favorites
List format with icons, descriptive text, and benefits. Blue and white color scheme.
Product and Service Analysis
Healthcare & Pharmaceuticals
Details recent technological advances in bioengineering and their practical applications.
Bioengineering, Technology, Advancements, Healthcare
false
Product and Service Analysis
Healthcare & Pharmaceuticals
Header Vertical
McKinsey
Add to my slides
Remove from favorites
The slide contains three line graphs comparing annual stock levels and price received for corn, soybeans, and wheat from 1995-2015. The design is balanced with textual information below each graph.
Market Analysis and Trends
Agriculture & Food Production
The slide illustrates the impact of biofuel demand on US agriculture, showing stock level changes and price trends for major crops. It could be used for discussing agricultural investments.
biofuel, agriculture, corn, soybean, wheat, market trends, stock levels, price
false
Market Analysis and Trends
Agriculture & Food Production
Multiple Chart
EY
Add to my slides
Remove from favorites
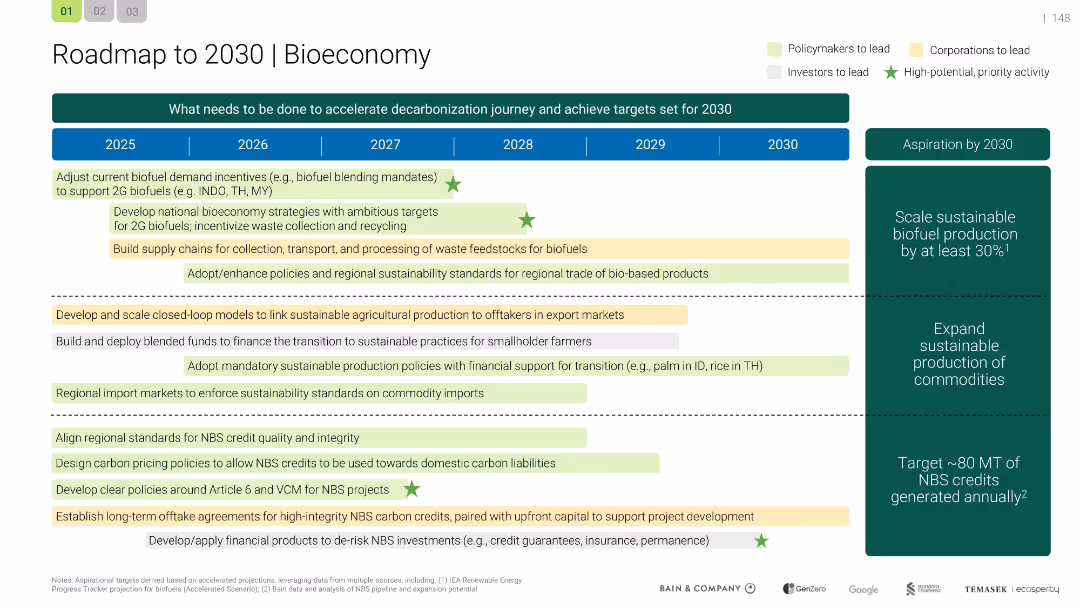
Timeline layout with color-coded stakeholder responsibilities and star-marked priority actions
Strategic Planning
Agriculture & Food Production
Presents a roadmap for advancing the bioeconomy in SEA by 2030. Focus areas include scaling biofuel production, building supply chains, aligning regional sustainability policies, and unlocking financing for sustainable practices. Activities are assigned to policymakers, corporations, and investors.
biofuel, financial sustainability, policies
false
Strategic Planning
Agriculture & Food Production
Table
Bain
Add to my slides
Remove from favorites
The slide features two column charts. The first shows projected biofuel production costs from 2015 to 2045, comparing fossil fuels, 1st-gen biofuels, and advanced biofuels. The second chart shows biomethane production costs for energy crops, manure, and industrial waste.
Technology and Digital Transformation
Energy & Utilities
This slide compares the projected costs of biofuel and biomethane production, highlighting the economic challenges and opportunities driven by country regulations and improvements in production, collection, and transport efficiencies.
biofuel production cost, biomethane production cost, fossil fuels, 1st-gen biofuels, advanced biofuels, energy crops, manure, industrial waste
false
Technology and Digital Transformation
Energy & Utilities
Multiple Chart
Kearney
Add to my slides
Remove from favorites
The slide features a table listing various biofuels, their definitions, conversion methods, pretreatment processes, and feedstock compatibility. Biofuels include biomethanol, bioethanol, biobutanol, biogasoline, biodiesel, renewable diesel, bio jet fuels, biomethane, and biogas.
Technology and Digital Transformation
Energy & Utilities
This slide compares different biofuels based on their processing routes and associated feedstocks, highlighting the versatility and potential applications of each biofuel.
biofuels, biomass conversion, processing routes, feedstocks, biomethanol, bioethanol, biobutanol, biogasoline, biodiesel
false
Technology and Digital Transformation
Energy & Utilities
Table
Kearney
Add to my slides
Remove from favorites
The slide features a detailed diagram explaining the biofuels applications opportunity assessment methodology. It includes steps for biofuel performance assessment, competitive advantage assessment, market potential assessment, and selection of the optimal combination of biofuel and market segment.
Strategic Planning
Energy & Utilities
This slide outlines the methodology for assessing biofuels' attractiveness, focusing on performance, competitive advantage, and market potential to determine the best biofuel-market segment combinations.
biofuels, opportunity assessment, methodology, performance, competitive advantage, market potential, optimal combination
false
Strategic Planning
Energy & Utilities
Header Vertical
Kearney
Add to my slides
Remove from favorites
The slide features a detailed case study on biogas upgrading in China, covering the process description, key metrics, feedstock characteristics, and environmental performance. It includes a column chart showing biogas production by feedstock type in China for 2018.
Client Case Studies
Energy & Utilities
This slide examines the biogas upgrading process in China, detailing the conversion process, key metrics, feedstock characteristics, and environmental impacts associated with biogas production, highlighting its performance and deployment.
biogas upgrading, China, case study, process description, key metrics, feedstock characteristics, environmental performance
false
Client Case Studies
Energy & Utilities
Multiple Chart
Kearney
Add to my slides
Remove from favorites
The slide features a diagram showing the value chain stakeholders for bio jet fuel production, including fuel producers, fuel distributors, aircraft manufacturers, airports, airlines, and governments. It also includes a production cost analysis and key regulations and policies in the US.
Client Case Studies
Transportation & Logistics
This slide emphasizes the need for strong policy support to make bio jet fuel production cost-competitive, highlighting the value chain stakeholders, production costs, and key regulations and policies supporting bio jet fuel development in the US.
bio jet fuel, production cost, policy support, value chain, stakeholders, regulations, US
false
Client Case Studies
Transportation & Logistics
Diagram
Kearney
Add to my slides
Remove from favorites
The slide features a detailed case study on the emerging market for bio jet fuels in the US, covering the description, process characteristics, global market overview, and drivers/barriers. It includes a column chart showing aviation energy consumption forecast by fuel type from 2018 to 2040.
Client Case Studies
Transportation & Logistics
This slide provides an in-depth analysis of the bio jet fuel sector in the US, detailing the process steps, market potential, and the benefits and challenges of developing bio jet fuels as a renewable energy source for aviation.
bio jet fuel, US, case study, process description, market overview, drivers, barriers, aviation energy consumption
false
Client Case Studies
Transportation & Logistics
Mixed Chart
Kearney
Add to my slides
Remove from favorites
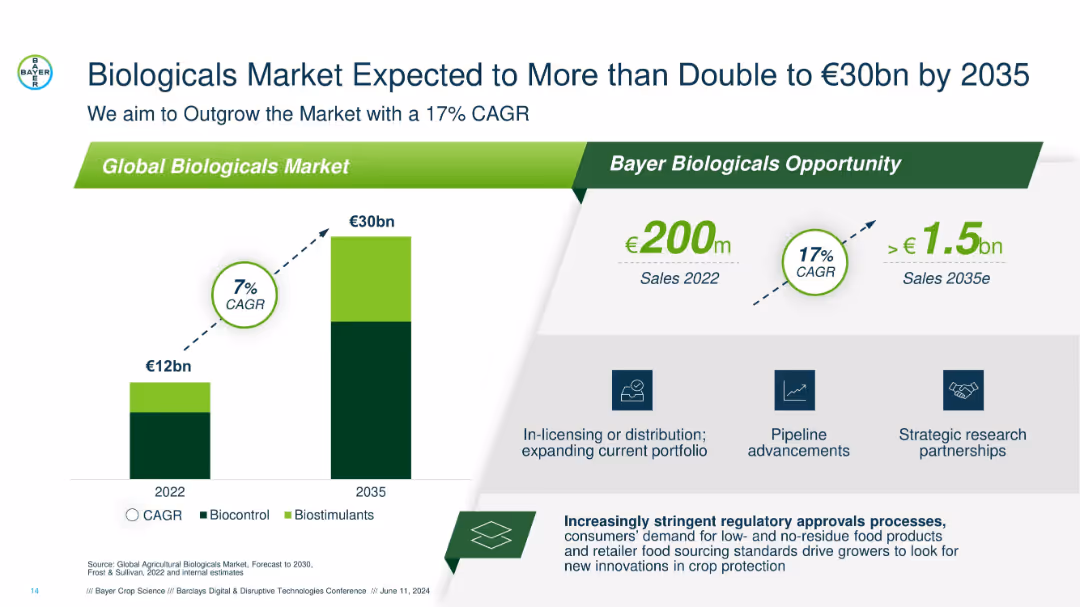
Dual-bar growth chart on the left and opportunity callouts on the right; clean layout with dark green and grey accents.
Market Analysis and Trends
Agriculture & Food Production
Illustrates the projected growth of the global biologicals market from €12bn in 2022 to €30bn in 2035, highlighting Bayer’s 17% CAGR goal and strategies like partnerships and pipeline advancements.
biologicals, CAGR, Bayer, 2035 forecast, market growth, biocontrol, biostimulants, partnerships, pipeline
false
Market Analysis and Trends
Agriculture & Food Production
Mixed Chart
Barclays
Add to my slides
Remove from favorites
The slide features five business cases from Europe, the US, and China, demonstrating the diverse applications of biomass, including waste-to-energy in the UK, bio jet fuel in the US, biomethane in China, renewable diesel in the US, and co-firing in the cement industry.
Client Case Studies
Energy & Utilities
This slide showcases five business cases highlighting the diverse potential applications of biomass energy across different regions and industries, emphasizing the innovative solutions and benefits of biomass utilization.
biomass applications, business cases, waste-to-energy, bio jet fuel, biomethane, renewable diesel, co-firing, cement industry
false
Client Case Studies
Energy & Utilities
Linear Flow
Kearney
Add to my slides
Remove from favorites
The slide features a diagram showing the biomass-to-energy carbon cycle, detailing the flow of CO2 from biofuel production to consumption, and its subsequent absorption by biomass through photosynthesis.
Technology and Digital Transformation
Energy & Utilities
This slide explains the carbon neutrality of bioenergy through the natural carbon cycle of biomass, illustrating how CO2 emissions from biofuel production and consumption are balanced by biomass absorption.
biomass, bioenergy, carbon cycle, CO2 emissions, carbon neutrality, biofuel production
false
Technology and Digital Transformation
Energy & Utilities
Linear Flow
Kearney
Add to my slides
Remove from favorites
The slide features a detailed flowchart showing the various stages from biomass conditioning, pretreatment, intermediates, conversion, to final biofuels. Each stage includes specific processes and the types of feedstocks they are compatible with.
Technology and Digital Transformation
Energy & Utilities
This slide details the comprehensive process of converting biomass into biofuels, highlighting the different conditioning and pretreatment methods and their compatibility with various feedstocks.
biomass, biofuels, conditioning, pretreatment, intermediates, conversion, feedstock compatibility, processing stages
false
Technology and Digital Transformation
Energy & Utilities
Diagram
Kearney
Add to my slides
Remove from favorites
The slide features a detailed case study on biomass co-processing in cement kilns, covering the technical options, key metrics, feedstock characteristics, and environmental performance.
Client Case Studies
Industrial & Manufacturing
This slide examines the technical and environmental aspects of co-processing biomass in cement kilns, detailing the technical options, key metrics, feedstock characteristics, and environmental benefits associated with biomass integration in cement production.
biomass co-processing, cement kilns, case study, technical options, key metrics, feedstock characteristics, environmental performance
false
Client Case Studies
Industrial & Manufacturing
Mixed Chart
Kearney
Add to my slides
Remove from favorites
The slide features a table outlining the evolution of biomass drivers from 2010 to 2050+, covering aspects such as supply of feedstocks, infrastructure maturity, sociopolitical pressures, biofuel technology, and competition.
Market Analysis and Trends
Energy & Utilities
This slide examines the shifting drivers of biomass energy over the next decades, highlighting how factors like feedstock supply, infrastructure development, sociopolitical pressures, and technological advancements will influence B2E penetration.
biomass drivers, feedstock supply, infrastructure maturity, sociopolitical pressures, biofuel technology, competition, 2010-2050
false
Market Analysis and Trends
Energy & Utilities
Table
Kearney
Add to my slides
Remove from favorites
The slide features a detailed flowchart showing biomass feedstock market dynamics, including land demand, land use, consumption pattern, biomass residues, primary biomass, and bioenergy consumption. It illustrates the drivers for biomass residues and primary biomass.
Market Analysis and Trends
Energy & Utilities
This slide analyzes the market dynamics of biomass feedstock, detailing the factors influencing land demand, consumption patterns, and the production of biomass residues and primary biomass, as well as their implications for bioenergy consumption.
biomass feedstock, market dynamics, land demand, land use, consumption pattern, biomass residues, primary biomass, bioenergy consumption
false
Market Analysis and Trends
Energy & Utilities
Linear Flow
Kearney
Add to my slides
Remove from favorites
The slide features a bar chart and analysis showing the biomass potential and infrastructure adaptability, including upstream and downstream factors such as biomass transport, storage, blending limits, and marine biofuels. It includes a survey on barriers to biofuels uptake conducted by IRENA in 2019.
Technology and Digital Transformation
Energy & Utilities
This slide examines the infrastructure adaptability for biomass, highlighting the upstream and downstream factors affecting biofuel uptake, and presenting survey results on the barriers to biofuels adoption, focusing on transport, storage, and blending limits.
biomass potential, infrastructure adaptability, upstream, downstream, biofuels uptake, survey, transport, storage, blending limits, marine biofuels
false
Technology and Digital Transformation
Energy & Utilities
Mixed Chart
Kearney
Add to my slides
Remove from favorites
The slide features a timeline highlighting key milestones in the development of biomass processing technologies from the late 18th century to the 20th century. Key events are marked along the timeline with brief descriptions.
Technology and Digital Transformation
Energy & Utilities
This slide provides a historical overview of the development of biomass processing technologies, highlighting significant discoveries and commercial developments over time.
biomass processing, history, timeline, technology development, discoveries, commercial development, milestones
false
Technology and Digital Transformation
Energy & Utilities
Linear Flow
Kearney
Add to my slides
Remove from favorites
The slide features a column chart illustrating the energy potential of different feedstock types for the year 2060. The chart is color-coded, with each type of feedstock represented in different shades of purple. The data ranges are indicated above each column.
Market Analysis and Trends
Energy & Utilities
This slide highlights the two main sources of biomass supply by 2060, namely agricultural residues and energy crops, showcasing their potential energy contributions.
biomass supply, energy potential, agricultural residues, energy crops, 2060, feedstock, theoretical, technical, sustainable, energy
false
Market Analysis and Trends
Energy & Utilities
Single Chart
Kearney
Add to my slides
Remove from favorites
The slide features a timeline showing key milestones in the development of biomass-to-energy value chain products, starting from 125,000 BC to 2018. Milestones include the first biodigester in India, commercial-scale waste-to-energy plant in the US, and approval for biofuels in aviation.
Market Analysis and Trends
Energy & Utilities
This slide provides a historical overview of significant developments in the biomass-to-energy sector, emphasizing the evolution and advancements in biofuel technologies and applications over time.
biomass-to-energy, value chain, history, timeline, biodigester, biofuels, waste-to-energy, aviation
false
Market Analysis and Trends
Energy & Utilities
Linear Flow
Kearney
Add to my slides
Remove from favorites
The slide features a detailed case study on the use of biomass in cement kilns, covering the country scale market information, global market information, production cost analysis, and other perspectives for the cement industry.
Client Case Studies
Industrial & Manufacturing
This slide analyzes the use of biomass in cement kilns, highlighting the market information, production costs, and additional perspectives for reducing greenhouse gas emissions and enhancing sustainability in the cement industry through biomass integration.
biomass use, cement kilns, case study, market information, production cost, perspectives, cement industry
false
Client Case Studies
Industrial & Manufacturing
Multiple Chart
Kearney
Add to my slides
Remove from favorites
The slide features a detailed case study on biomethane production in China, covering the description, process characteristics, global market overview, and drivers/barriers. It includes a column chart showing biomethane demand forecast by continent from 2018 to 2040.
Client Case Studies
Energy & Utilities
This slide provides an in-depth analysis of the biomethane sector in China, detailing the production process, market potential, and the benefits and challenges of developing biomethane as a renewable energy source for power and transport sectors.
biomethane, China, case study, production process, market overview, drivers, barriers, demand forecast
false
Client Case Studies
Energy & Utilities
Mixed Chart
Kearney
Add to my slides
Remove from favorites
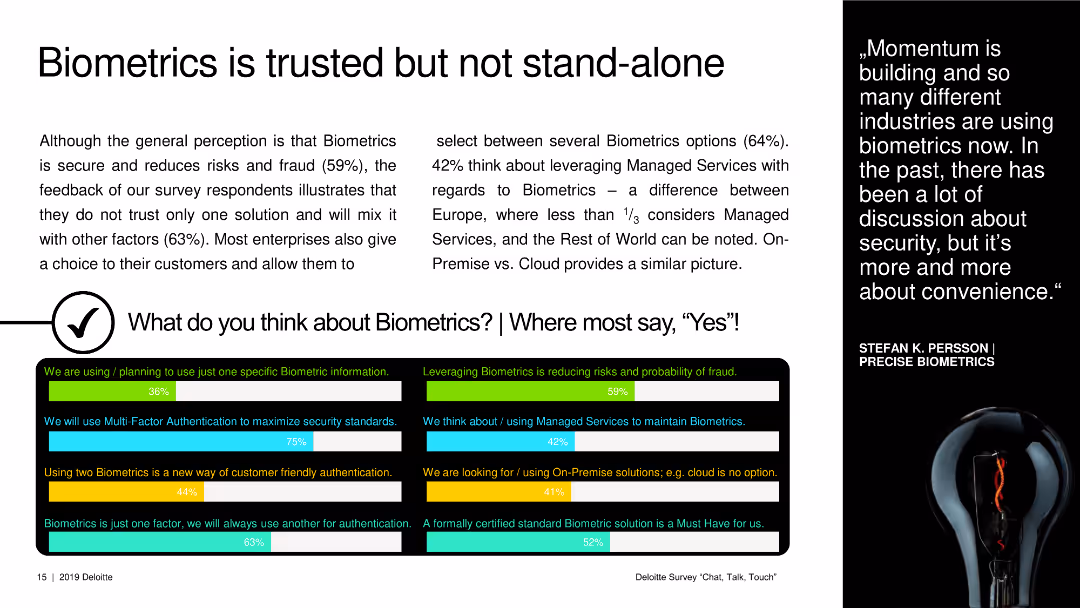
A text slide with small graphical icons and a black box showing survey results on biometric usage and opinions.
Strategic Planning
Technology & Software
This slide discusses the perception and usage of biometrics, highlighting its role in security and customer authentication preferences.
biometrics, security, customer authentication, survey results, technology adoption
false
Strategic Planning
Technology & Software
Multiple Chart
Deloitte
Add to my slides
Remove from favorites
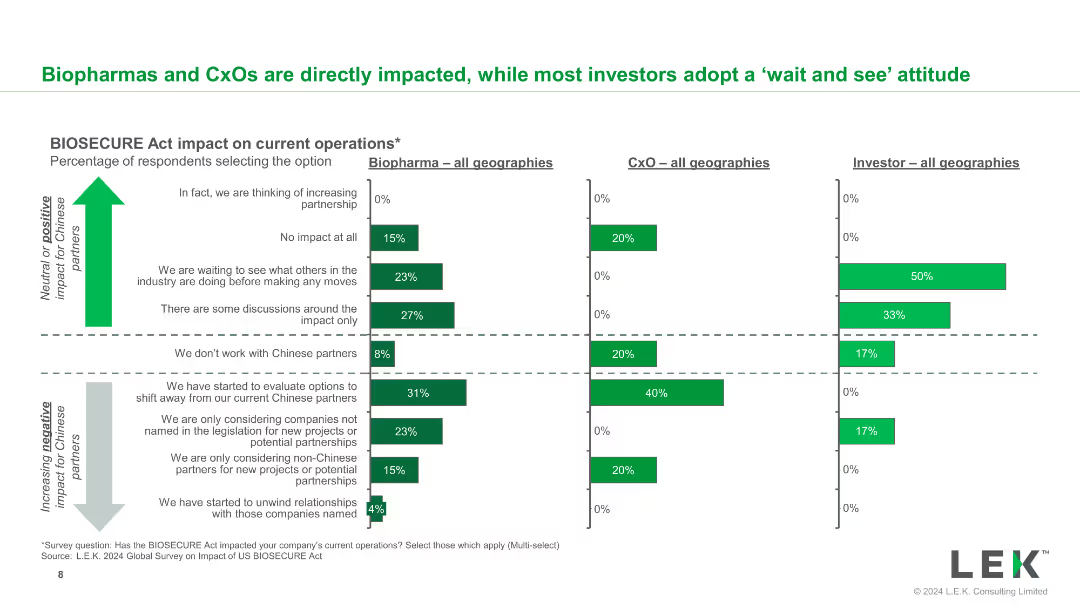
This slide includes a set of bar charts displaying the BIOSECURE Act's impact on current operations for biopharma, CxO, and investors, across all geographies.
Market Analysis and Trends
Healthcare & Pharmaceuticals
It details how the BIOSECURE Act has impacted operations within different segments of the healthcare industry, providing a segmented view of the effects.
BIOSECURE Act, biopharma, CxO, investors, operational impact, segmentation
false
Market Analysis and Trends
Healthcare & Pharmaceuticals
Multiple Chart
LEK
Add to my slides
Remove from favorites
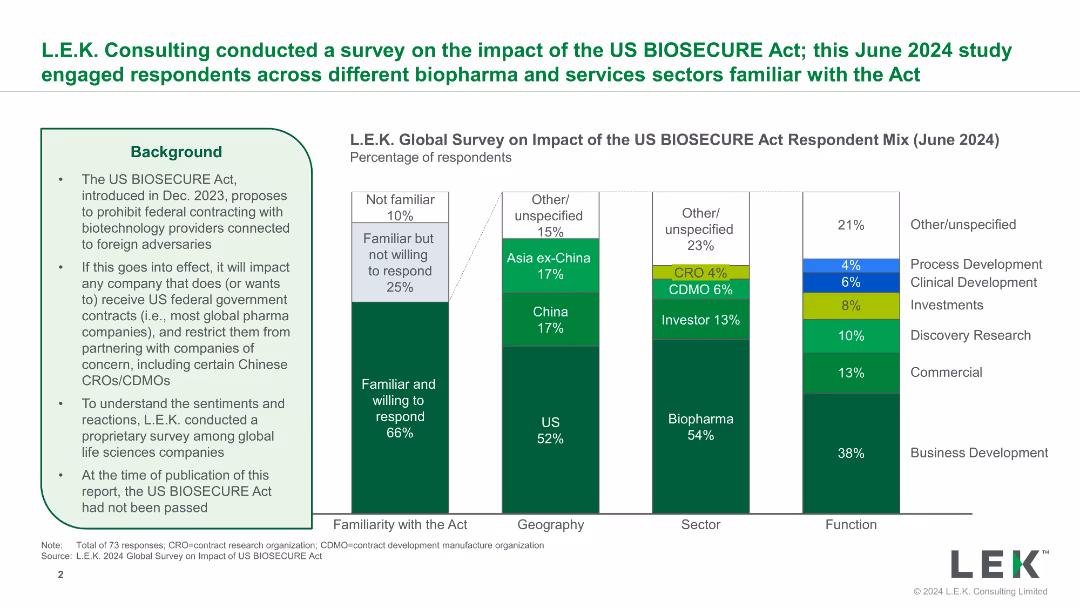
A combination of text and bar charts showing survey results about the impact of the US BIOSECURE Act, with a detailed timeline of the Act's development and key points.
Regulatory and Compliance
Healthcare & Pharmaceuticals
The slide presents survey results on the impact of the US BIOSECURE Act on biotech and services sectors, highlighting familiarity, willingness to respond, and sector-specific effects.
BIOSECURE Act, biotech, survey, impact, regulation
false
Regulatory and Compliance
Healthcare & Pharmaceuticals
Mixed Chart
LEK
Add to my slides
Remove from favorites
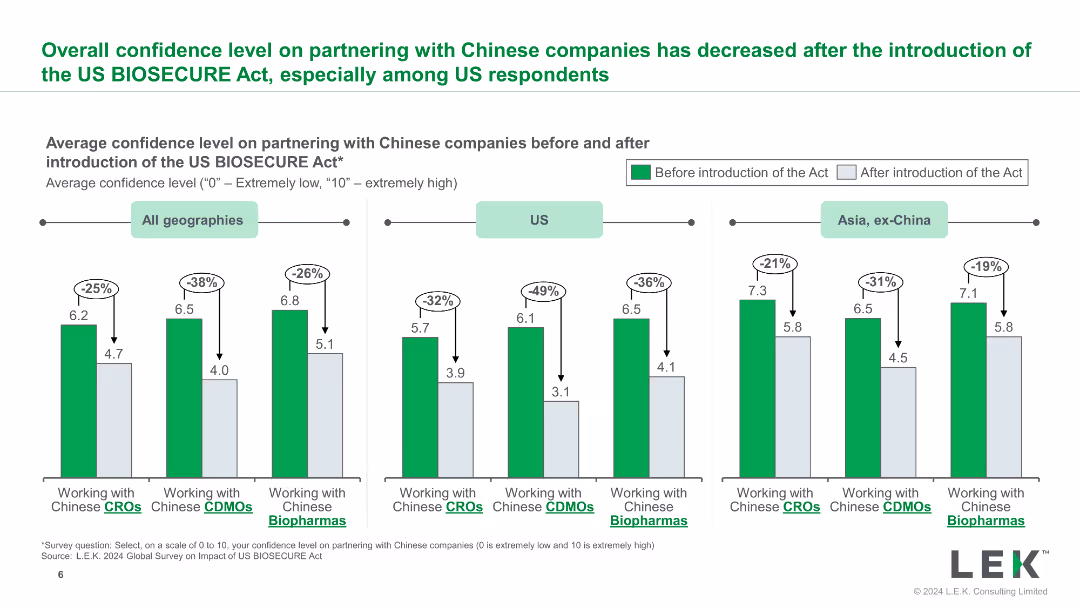
This slide contains a column chart comparing confidence levels in partnering with Chinese companies across different regions before and after the US BioSecure Act. It shows three separate regions with varying confidence levels indicated by green and grey bars.
Risk Assessment and Management
Healthcare & Pharmaceuticals
The slide shows the impact of the US BioSecure Act on the confidence levels of partnering with Chinese companies, with a significant drop observed in the US. This is used to assess changes in partnership dynamics.
BioSecure Act, confidence levels, Chinese companies, partnership, US, impact
false
Risk Assessment and Management
Healthcare & Pharmaceuticals
Multiple Chart
LEK
Add to my slides
Remove from favorites
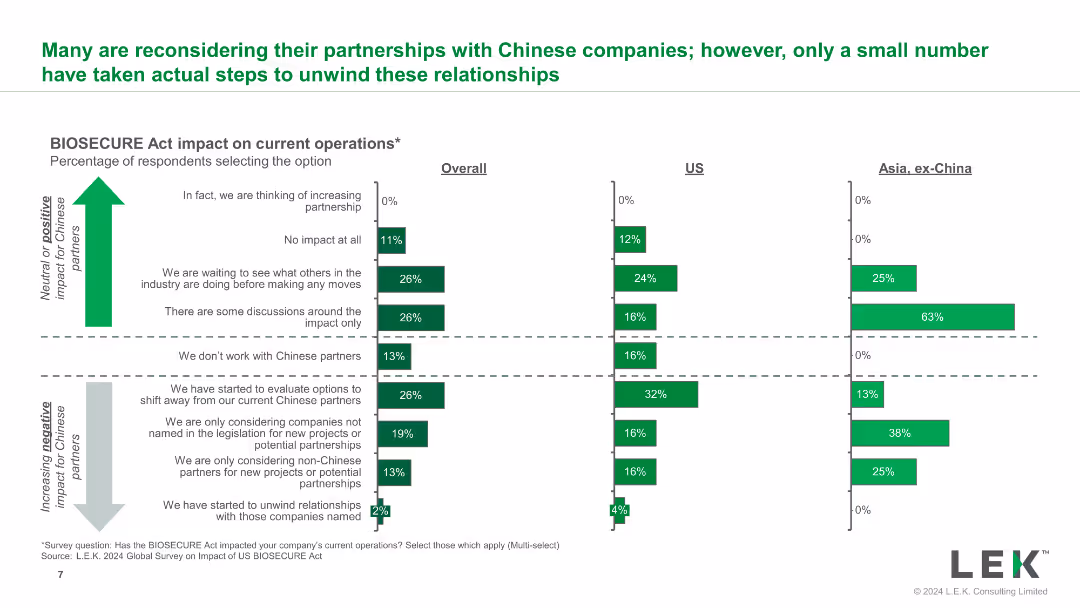
The slide features a bar chart that shows the percentage of respondents selecting various impacts of the BIOSECURE Act on their current operations. The chart is divided into overall, US, and Asia categories.
Regulatory and Compliance
Healthcare & Pharmaceuticals
This slide provides insights into how the BIOSECURE Act has affected current operations across different regions, highlighting the percentage of companies reconsidering their partnerships.
BIOSECURE Act, operations impact, respondents, current operations, Asia, US
false
Regulatory and Compliance
Healthcare & Pharmaceuticals
Multiple Chart
LEK
Add to my slides
Remove from favorites
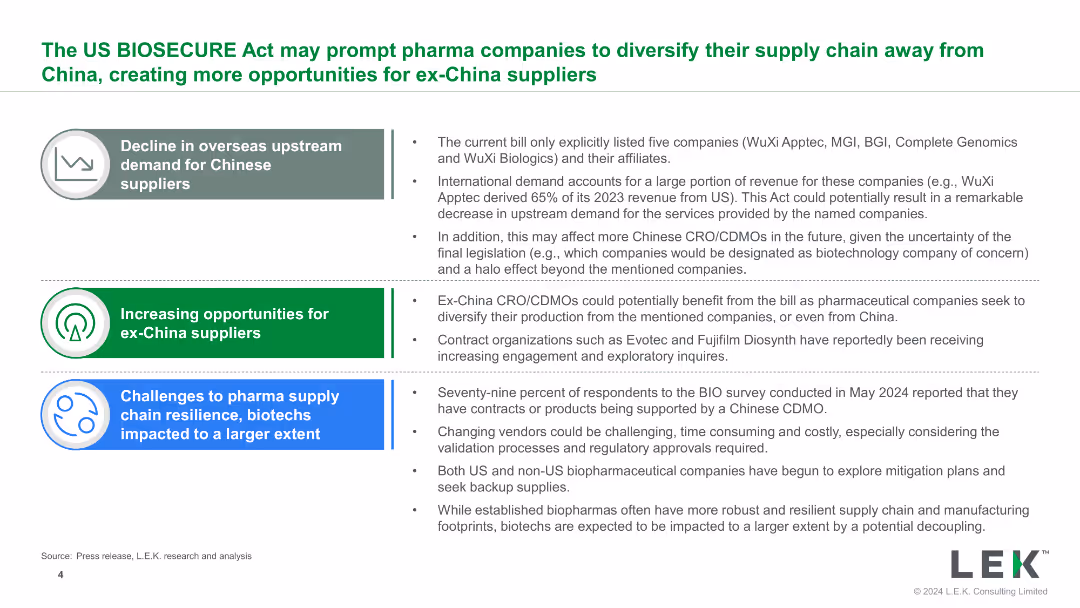
The slide features a mix of text and bullet points, organized into sections with icons, summarizing the decline in demand for Chinese suppliers and the rise in opportunities for others.
Strategic Planning
Healthcare & Pharmaceuticals
The slide discusses the opportunities and challenges for pharmaceutical companies due to the US BIOSECURE Act, focusing on supply chain resilience and the potential shift from China.
BIOSECURE Act, supply chain, opportunities, challenges, pharma
false
Strategic Planning
Healthcare & Pharmaceuticals
Table
LEK
Add to my slides
Remove from favorites
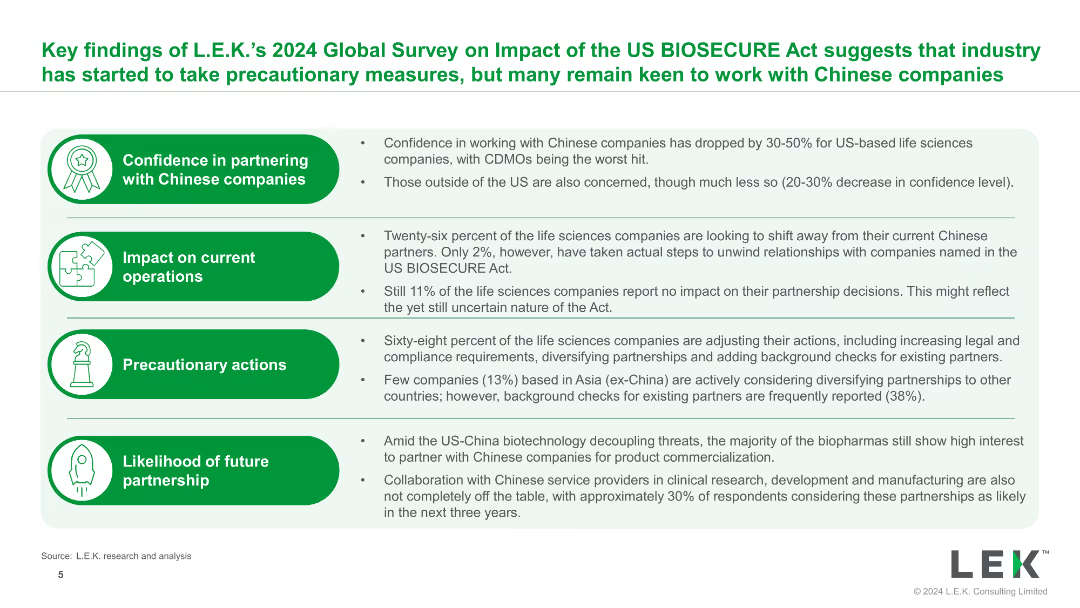
The slide uses bullet points and icons to present key findings from the 2024 Global Survey on the impact of the US BIOSECURE Act, with clear headings and supporting details.
Market Analysis and Trends
Healthcare & Pharmaceuticals
The slide summarizes key findings on the impact of the US BIOSECURE Act, highlighting changes in confidence, operational impacts, precautionary actions, and future partnership likelihoods.
BIOSECURE Act, survey, findings, impact, healthcare
false
Market Analysis and Trends
Healthcare & Pharmaceuticals
Table
LEK
Add to my slides
Remove from favorites
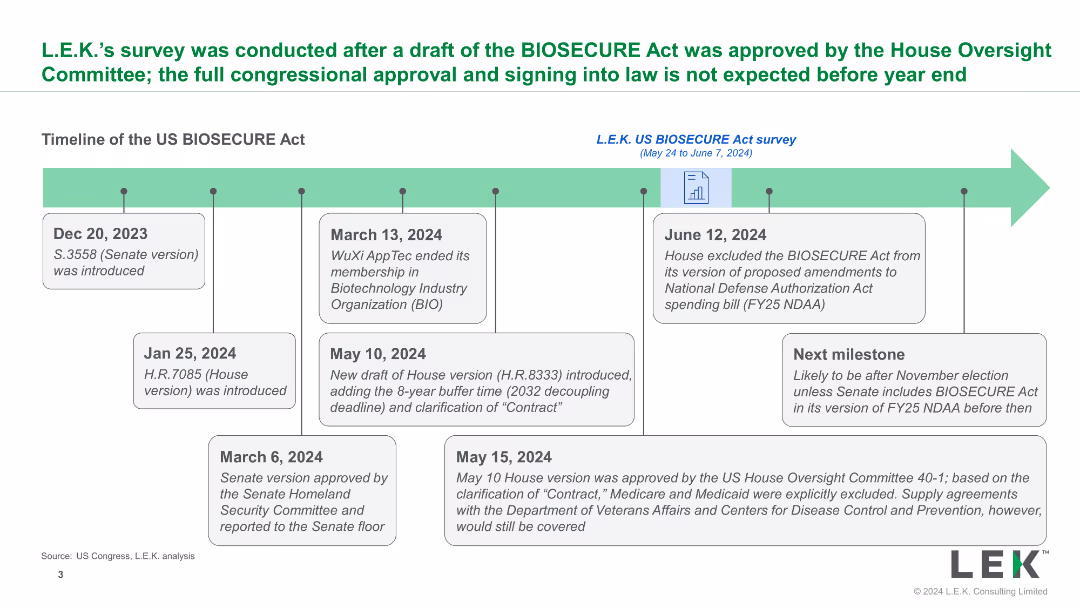
A timeline illustrating key dates and milestones in the development of the US BIOSECURE Act, with descriptive text boxes explaining each step and future projections.
Strategic Planning
Healthcare & Pharmaceuticals
The slide provides a detailed timeline of the US BIOSECURE Act, from its introduction to expected future steps, outlining significant legislative milestones and impacts.
BIOSECURE Act, timeline, legislation, milestones, U.S.
false
Strategic Planning
Healthcare & Pharmaceuticals
Linear Flow
LEK
Add to my slides
Remove from favorites
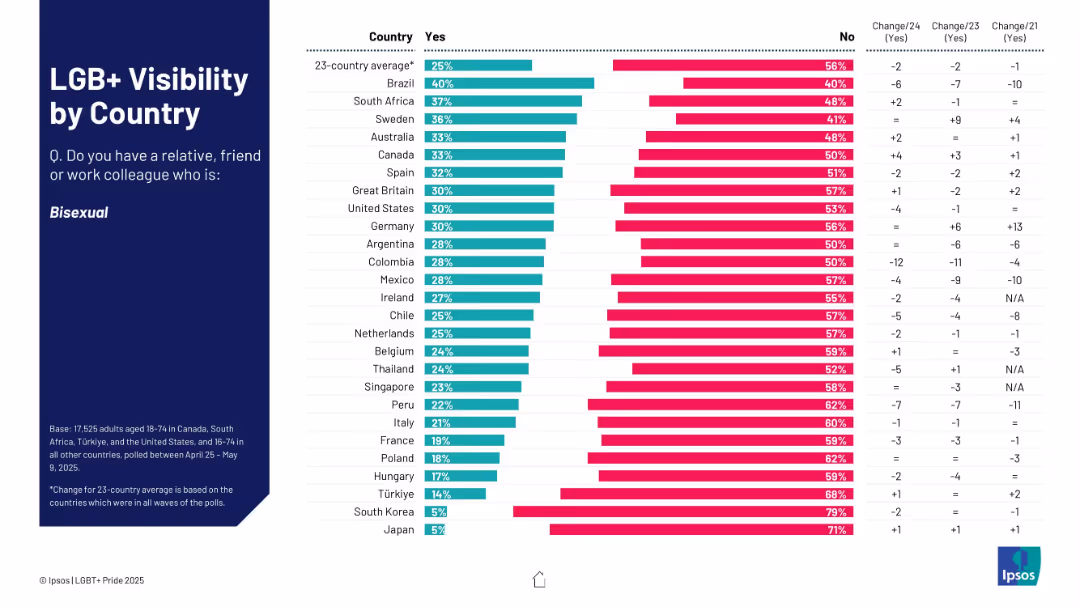
Similar to previous; shows responses to knowing someone bisexual; bar chart with country comparisons.
Market Analysis and Trends
Government & Public Sector
The chart shows the proportion of people in different countries who know someone bisexual. Brazil and South Africa top the list, while Japan and South Korea are at the bottom.
bisexual, relationships, awareness, LGBT+, countries, visibility
false
Market Analysis and Trends
Government & Public Sector
Mixed Chart
IPSOS
Add to my slides
Remove from favorites
Three-column layout with icons representing energy sources and trading. Includes a line graph showing power supply and demand, and a Bitcoin price trend.
Technology and Digital Transformation
Technology & Software
Discusses the role of Bitcoin mining in energy management, acting as a balancing economic battery by leveraging excess energy.
Bitcoin, Blockchain, Energy, Trading, Economic
false
Technology and Digital Transformation
Technology & Software
Mixed Chart
McKinsey
Add to my slides
Remove from favorites
Detailed presentation with column charts showing Bitcoin metrics over years, including price projections and mining outputs.
Technology and Digital Transformation
Financial Services
Analyzes the future economic impact of Bitcoin mining, illustrating projected growth in value and reduction in new coins mined.
Bitcoin, Mining, Growth, Projection, Economy
false
Technology and Digital Transformation
Financial Services
Multiple Chart
McKinsey
Add to my slides
Remove from favorites
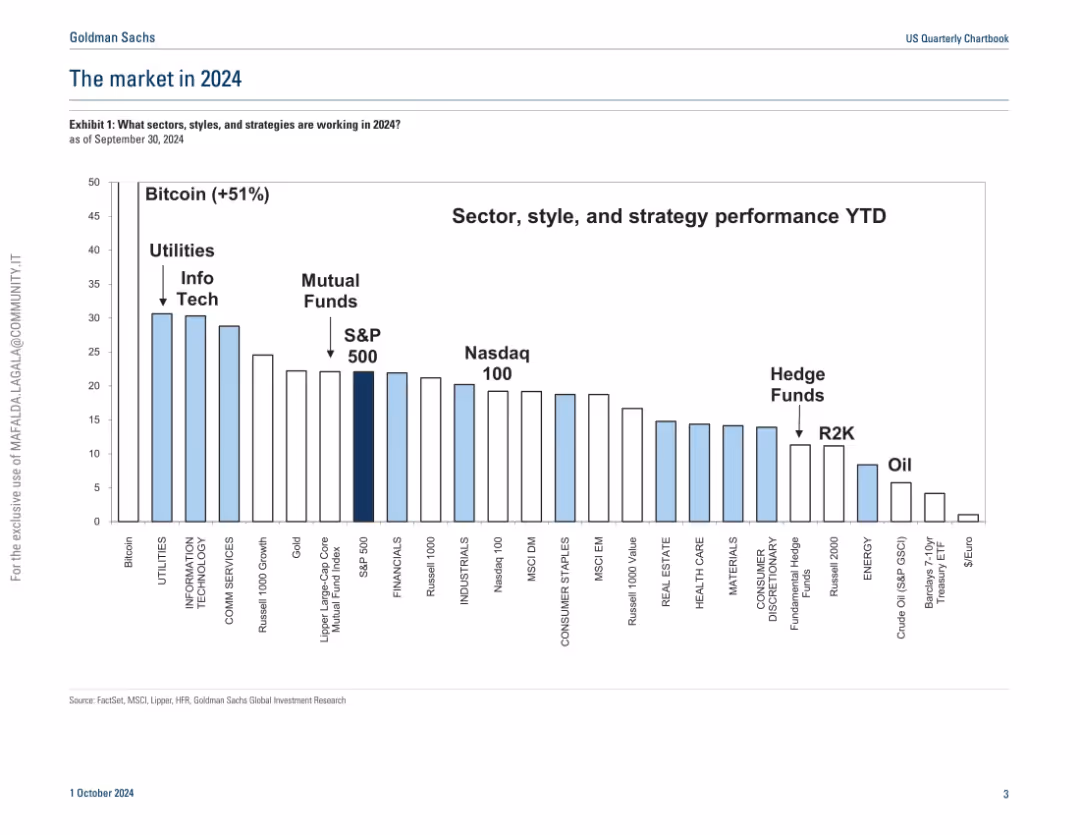
Vertical bar chart in light blue and white; ranks asset classes and strategies by performance year-to-date.
Market Analysis and Trends
Financial Services
A comparative bar chart ranks the YTD performance of various asset classes and investment strategies. Bitcoin leads with +51%, followed by utilities and tech sectors. The S&P 500 and mutual funds fall in the middle, with oil and treasury ETFs underperforming. The chart helps contextualize market winners and laggards.
Bitcoin, YTD performance, utilities, tech, S&P 500, mutual funds, Nasdaq, R2K
false
Market Analysis and Trends
Financial Services
Single Chart
Goldman Sachs
Add to my slides
Remove from favorites
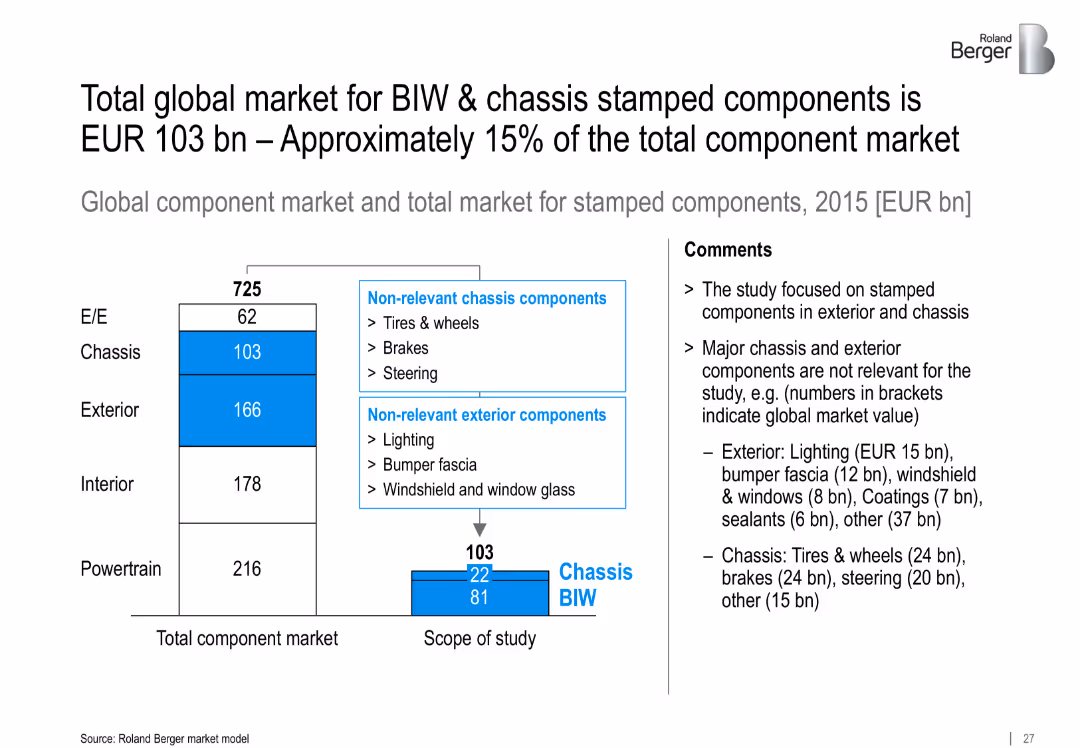
Bar chart showing breakdown of total component market and scope of BIW/chassis stamped components; comments explain exclusions
Investment Analysis
Industrial & Manufacturing
Defines the market scope for BIW and chassis stamped components, valued at EUR 103 bn in 2015. Excludes irrelevant chassis/exterior parts and focuses on relevant segments for detailed analysis.
BIW, chassis, stamped components, market size, EUR 103 bn, exterior, global component market
false
Investment Analysis
Industrial & Manufacturing
Mixed Chart
Roland Berger
Add to my slides
Remove from favorites
The slide displays column charts showing the gender distribution of Black employees across various professional levels within the venture capital industry. Textual notes on survey data are also provided.
Human Resources and Talent Management
Professional Services
This slide examines the gender distribution of Black employees within the venture capital industry, comparing data from 2018, 2020, and 2022, and highlighting trends and disparities.
Black employees, Gender distribution, Diversity, VC industry, Professional levels
false
Human Resources and Talent Management
Professional Services
Multiple Chart
Deloitte
Add to my slides
Remove from favorites
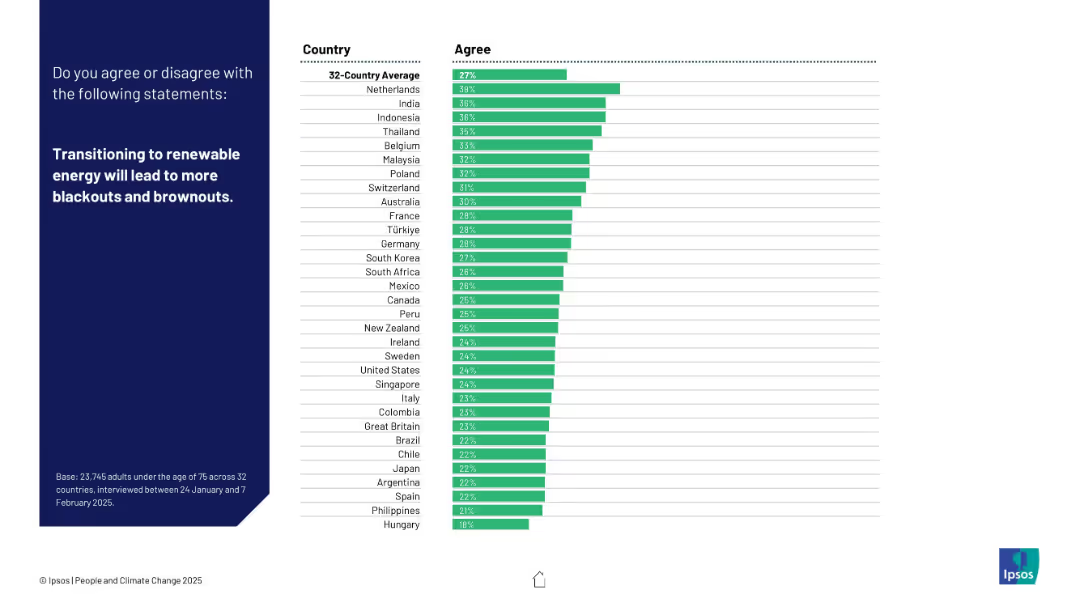
Dark left panel, right side shows ranked bar chart with 32 countries based on agreement level.
Market Analysis and Trends
Energy & Utilities
This slide explores public concerns about the reliability of renewable energy, specifically the risk of blackouts. The Netherlands has the highest concern rate.
blackouts, renewable energy, power grid, energy transition, reliability, public concern, Ipsos, energy security, brownouts, country opinion
false
Market Analysis and Trends
Energy & Utilities
Mixed Chart
IPSOS
Add to my slides
Remove from favorites
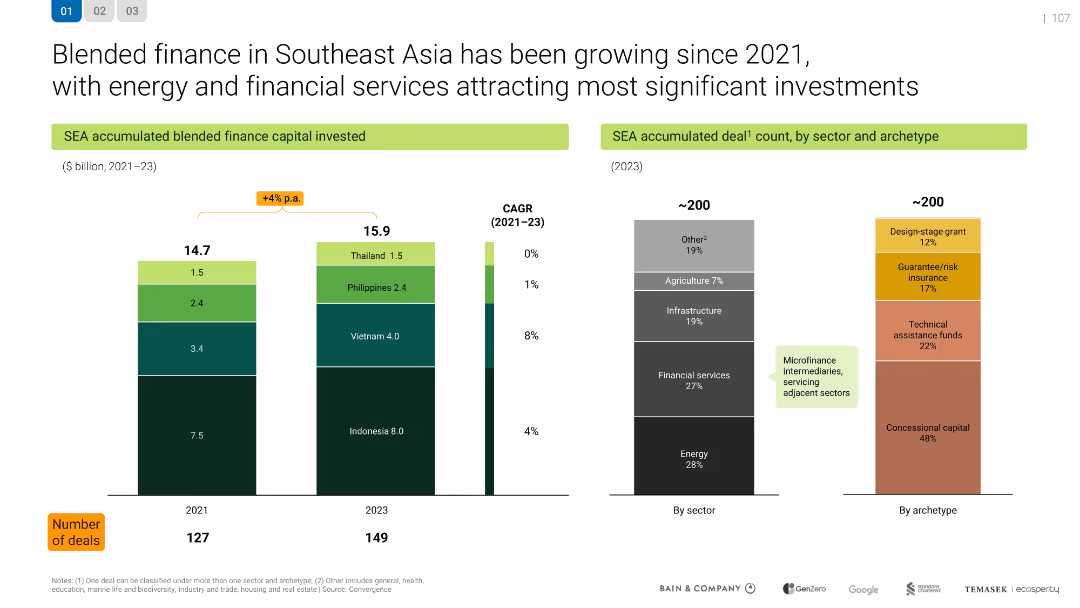
Dual bar charts with stacked components showing capital invested and sector breakdown, accompanied by text highlights and deal count metrics.
Financial Performance
Financial Services
Details Southeast Asia’s blended finance growth (2021–2023), with capital rising from $14.7B to $15.9B. Charts show country-wise investments and sectors attracting deals—energy and finance sectors dominate, with concessional capital as key archetype.
blended finance, capital, Southeast Asia, energy, concessional capital
false
Financial Performance
Financial Services
Multiple Chart
Bain
Add to my slides
Remove from favorites
Features a text block on the left and a horizontal bar chart on the right comparing the deployment of blockchain in advertising strategies between those prioritizing regulatory environments and others.
Regulatory and Compliance
Financial Services
The slide discusses the adoption of blockchain technology in advertising to address regulatory environments, with a horizontal bar chart illustrating the difference in deployment rates between companies prioritizing regulation and others.
Blockchain, advertising, regulatory, deployment, comparison
false
Regulatory and Compliance
Financial Services
Mixed Chart
Deloitte
Add to my slides
Remove from favorites
Highlights the benefits of blockchain through icons and short texts divided into two sections: increased revenue and decreased costs, each listing examples of business benefits like tokenization and transparency.
Technology and Digital Transformation
Financial Services
Examines how blockchain technology can drive business benefits by increasing revenue through authenticity and efficiency, and reducing costs by improving transparency and security. Suitable for business strategy development.
blockchain, business benefits, revenue, costs, efficiency, security
false
Technology and Digital Transformation
Financial Services
Diagram
McKinsey
Add to my slides
Remove from favorites
The slide contrasts centrally controlled marketplaces with public blockchains using two side-by-side diagrams. The left diagram shows a centralized model, while the right illustrates a decentralized blockchain model. Text explanations are included.
Market Analysis and Trends
Financial Services
This slide compares centralized digital marketplaces with decentralized public blockchains, highlighting the advantages of transparency and fairness in blockchain-based systems over traditional centralized intermediaries.
Blockchain, centralization, decentralization, transparency, fairness
false
Market Analysis and Trends
Financial Services
Header Horizontal
EY
Add to my slides
Remove from favorites
Three-part text layout detailing blockchain applications in payments, loyalty rewards, and Metaverse engagement.
Technology and Digital Transformation
Technology & Software
Explores blockchain's role in transforming consumer engagement through payment solutions, rewards, and virtual experiences.
Blockchain, Consumer, Metaverse, Payments, Rewards
false
Technology and Digital Transformation
Technology & Software
Pillar
McKinsey
Add to my slides
Remove from favorites
Circular flow diagram centralizing the key criteria for blockchain application, such as distributed ledger and economic benefits, each represented with an icon and brief description, set against a clean background.
Strategic Planning
Technology & Software
Discusses the critical considerations for applying blockchain technology, focusing on aspects like economic benefits and trust absence. Useful for strategic discussions on where blockchain can be effectively implemented.
blockchain, criteria, application, distributed ledger, trust
false
Strategic Planning
Technology & Software
Linear Flow
McKinsey
Add to my slides
Remove from favorites
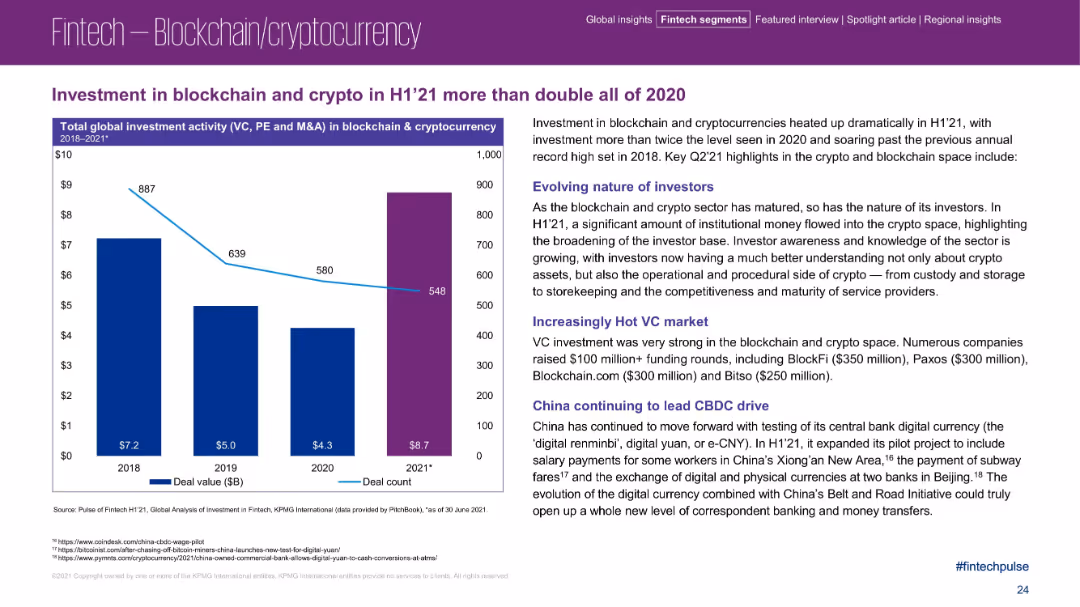
Left-aligned chart with bar and line graph showing deal value and count; right side features three text boxes with bullets and bolded subheadings
Investment Analysis
Financial Services
Investment in blockchain and crypto saw record-breaking growth in H1 2021, more than doubling 2020 figures. Key highlights include institutional adoption, rising VC interest, and China’s aggressive CBDC development. The slide emphasizes evolving investor profiles and increased infrastructure and operational maturity in crypto markets.
blockchain, cryptocurrency, VC funding, CBDC, investor trends, BlockFi, Paxos, China, crypto assets
false
Investment Analysis
Financial Services
Mixed Chart
KPMG
Add to my slides
Remove from favorites
Four sections each with an icon and text: Native tokens, Value transfer, Transaction fees, Token allocation. Icons represent crypto tokens, Bitcoin, coins, magnifier.
Industry Overview
Financial Services
Explains different aspects of digital assets on a blockchain, like native tokens, value transfer, transaction fees, and token allocation. Used in discussions on blockchain technology basics.
Blockchain, Crypto, Tokens, Bitcoin, Transaction, Fees, Allocation, Digital Assets
false
Industry Overview
Financial Services
Pillar
McKinsey
Add to my slides
Remove from favorites
Displays characteristics of blockchain like decentralization and encryption, using icons and short text blocks arranged around a central circular graphic that symbolically represents a blockchain network.
Technology and Digital Transformation
Technology & Software
Highlights the essential attributes of blockchain technology, including security, flexibility, and its decentralized nature. Suitable for discussions on how blockchain can be integrated into various business or technology solutions.
blockchain, decentralization, encryption, data security, flexibility
false
Technology and Digital Transformation
Technology & Software
Diagram
McKinsey
Add to my slides
Remove from favorites
Features two sections: a detailed definition of blockchain and a diagrammatic representation of how blockchain functions, highlighting nodes and blocks with minimalist icons and blue color tones.
Technology and Digital Transformation
Technology & Software
Provides a fundamental explanation of blockchain technology, describing its decentralized nature and the process of adding new data blocks to the network. Aimed at educating viewers new to blockchain concepts.
blockchain, digital ledger, decentralization, nodes, technology
false
Technology and Digital Transformation
Technology & Software
Boxed
McKinsey
Add to my slides
Remove from favorites
The slide compares the economic effects of traditional market dominance with zero marginal cost and open access through blockchains. Diagrams and text highlight how blockchains enable real competition versus market dominance.
Technology and Digital Transformation
Technology & Software
This slide discusses how blockchains can transform the global competitive landscape by reducing marginal costs, fostering network effects, and enabling open access, contrasting it with traditional vendor lock-in and market dominance scenarios.
Blockchain, economy, competition, market dominance, open access
false
Technology and Digital Transformation
Technology & Software
Mixed Chart
EY
Add to my slides
Remove from favorites
Three segmented boxes describing different blockchain ecosystems: DCEP RMB payment system, private domestic blockchains, and global trade connectivity. Each segment includes key players and functionalities.
Technology and Digital Transformation
Technology & Software
Outlines three major blockchain ecosystems in China: DCEP payment system for digital transactions, private domestic blockchains for B2B transactions, and global trade connectivity.
Blockchain, ecosystems, China, DCEP, RMB payment system, private blockchains, global trade, connectivity, B2B transactions, digital payments
false
Technology and Digital Transformation
Technology & Software
Table
EY
Add to my slides
Remove from favorites
Gartner Hype Cycle diagram for blockchain applications in 2021, showing different stages from innovation trigger to plateau of productivity.
Technology and Digital Transformation
Technology & Software
This slide presents the Gartner Hype Cycle for blockchain applications, illustrating the different stages of technology maturity. It predicts that blockchain will significantly decentralize markets and make trade more efficient, highlighting the expected timeline for various blockchain applications to reach mainstream adoption.
Blockchain, Hype Cycle, Decentralization
false
Technology and Digital Transformation
Technology & Software
Mixed Chart
Roland Berger
Add to my slides
Remove from favorites
Column charts from 2020 and 2022 showing low impact levels of blockchain on marketing strategies, with forecast up to the next three years.
Technology and Digital Transformation
Technology & Software
Evaluates the minor impact of blockchain technology on marketing strategies with projections showing little change.
blockchain, marketing strategies, impact assessment, technology trends
false
Technology and Digital Transformation
Technology & Software
Mixed Chart
Deloitte
Add to my slides
Remove from favorites
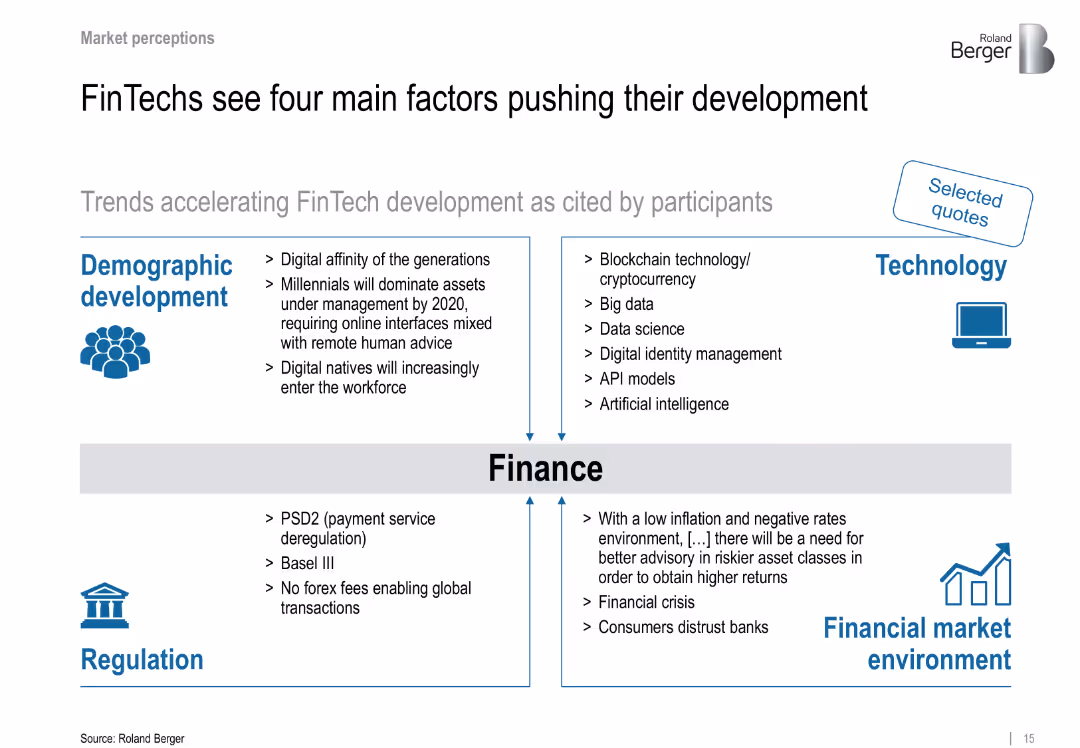
Four-column layout categorizing growth factors: Demographics, Technology, Regulation, Finance
Technology and Digital Transformation
Financial Services
Outlines macro trends influencing FinTech development, including generational shifts, blockchain, regulatory changes, and distrust in banks. Each factor is explained with specific trends.
blockchain, millennials, regulation, distrust in banks, digital transformation
false
Technology and Digital Transformation
Financial Services
Framework
Roland Berger
Add to my slides
Remove from favorites
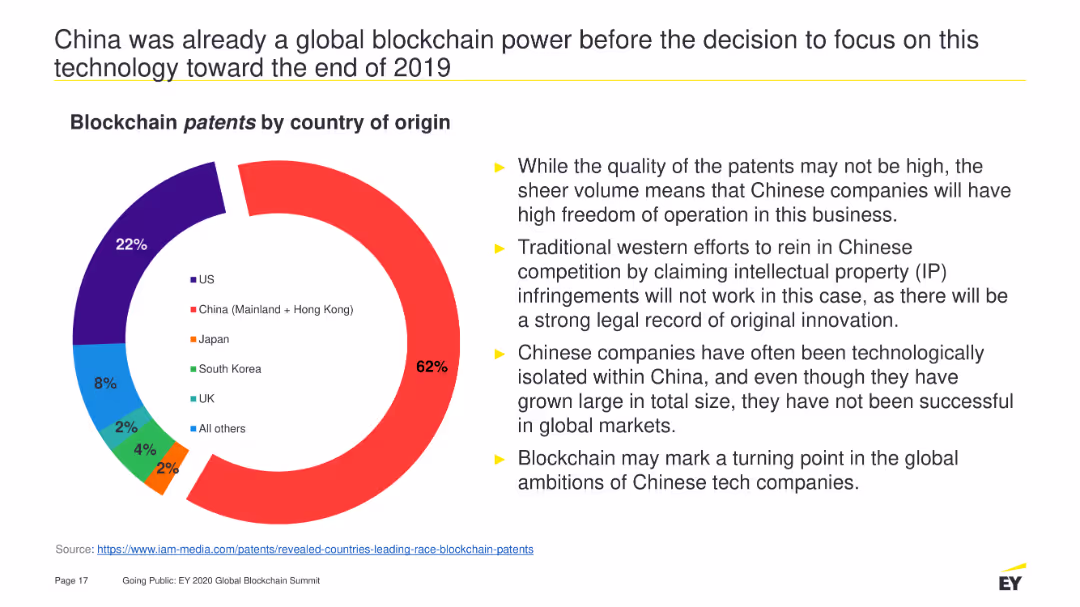
A pie chart depicting the distribution of blockchain patents by country of origin. It is visually dominated by China's portion (62%), followed by the US (22%), Japan (8%), and other countries with smaller percentages. The slide also contains bullet points summarizing the implications.
Market Analysis and Trends
Technology & Software
Highlights China's dominance in blockchain patents, explaining the high volume of patents and their potential impact on global market dynamics and competition strategies.
Blockchain, patents, China, technology, global market, intellectual property, innovation, competition, freedom of operation
false
Market Analysis and Trends
Technology & Software
Mixed Chart
EY
Add to my slides
Remove from favorites
The slide includes a line chart showing the growth of blockchain project volume over several years, with a breakdown of services offered in a box on the right.
Market Analysis and Trends
Technology & Software
This slide illustrates the growth in blockchain project volume, emphasizing a steady increase over time, though not at the high rate of the previous fiscal year, with services like development and advisory.
blockchain, project volume, growth trends, development services, advisory services
false
Market Analysis and Trends
Technology & Software
Single Chart
EY
Add to my slides
Remove from favorites
The slide features a central diagram depicting the roles of buyers and sellers in network procurement, connected through blockchain smart contracts. Various roles such as network leaders, owned subsidiaries, and authorized buyers/sellers are highlighted.
Technology and Digital Transformation
Technology & Software
The slide explains the complex roles within buyer and seller networks in network procurement, emphasizing how smart contracts enforce discounts and track volume. It highlights the importance of blockchain in managing these interactions efficiently.
Blockchain, smart contracts, procurement, network roles, digital transformation
false
Technology and Digital Transformation
Technology & Software
Diagram
EY
Add to my slides
Remove from favorites
Pie chart showing the share of blockchain startups by country and a column chart projecting blockchain business value for different use cases from 2021 to 2030.
Technology and Digital Transformation
Technology & Software
The slide highlights the diverse applications of blockchain technology beyond cryptocurrencies, showcasing its use in various sectors. It includes data on the distribution of blockchain startups globally and projects the significant increase in business value derived from blockchain by 2030.
Blockchain, Startups, Business Value, Use Cases
false
Technology and Digital Transformation
Technology & Software
Multiple Chart
Roland Berger
Add to my slides
Remove from favorites
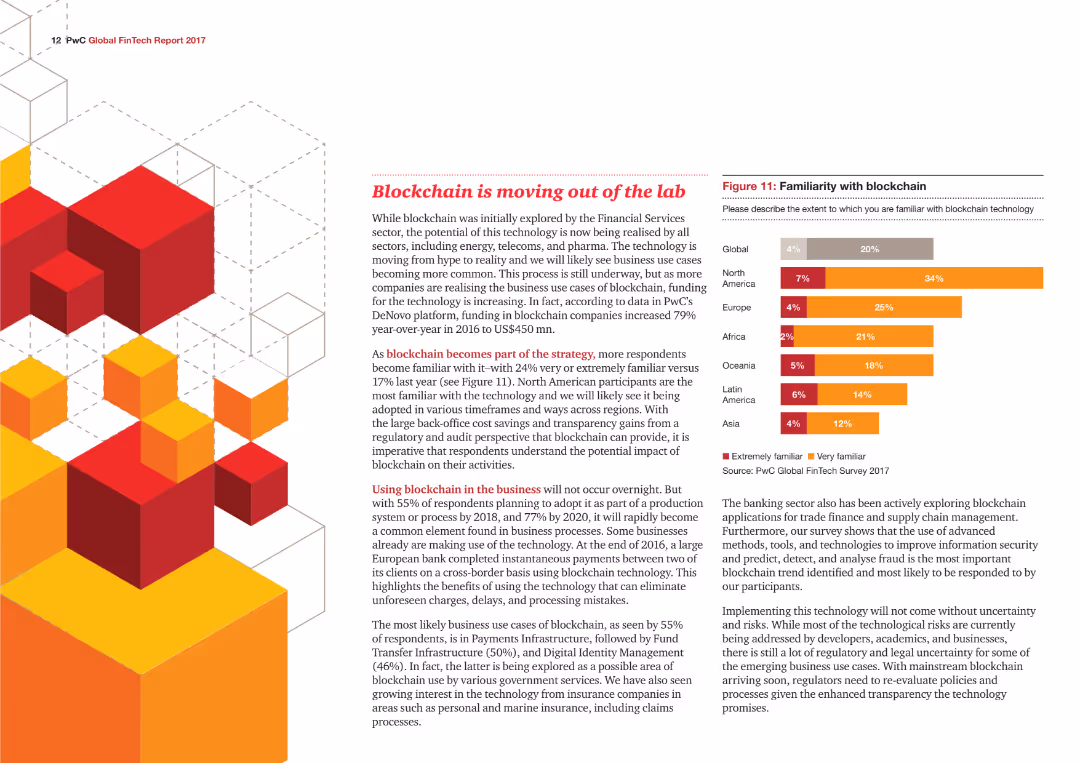
The slide contains a column chart depicting familiarity with blockchain technology across different regions, accompanied by detailed text about blockchain trends and business impact.
Technology and Digital Transformation
Financial Services
The slide discusses the increasing adoption and potential of blockchain technology in various sectors, highlighting regional familiarity and business use cases.
Blockchain, Technology, Adoption, Business, Regions
false
Technology and Digital Transformation
Financial Services
Mixed Chart
PwC/Strategy&
Add to my slides
Remove from favorites
The slide has a column chart and text. The chart depicts familiarity with blockchain technology among respondents.
Technology and Digital Transformation
Financial Services
The slide explores blockchain technology, its potential impact, and the level of familiarity among industry participants.
Blockchain, technology, trends, familiarity, financial services
false
Technology and Digital Transformation
Financial Services
Mixed Chart
PwC/Strategy&
Add to my slides
Remove from favorites
Sequential illustration of blockchain transaction process using a horizontal flow diagram with icons representing each step from transaction initiation to final addition to the blockchain.
Technology and Digital Transformation
Technology & Software
Describes the detailed steps of a blockchain transaction, from initiation to validation, and permanent addition to the digital ledger, emphasizing transparency and security. Designed for educational purposes on blockchain technology mechanics.
blockchain, transactions, digital ledger, security, validation
false
Technology and Digital Transformation
Technology & Software
Linear Flow
McKinsey
Add to my slides
Remove from favorites
A column chart showing VC investments in blockchain over the years, with a focus panel on significant financial entities and their investment details.
Investment Analysis
Financial Services
Analyzes trends in venture capital investments in blockchain technology, highlighting major players and financial commitments over time. Useful for investment analysis and discussions on market trends.
Blockchain, Venture Capital, Investments, Trends, Financial Infrastructure, Entities
false
Investment Analysis
Financial Services
Multiple Chart
McKinsey
Add to my slides
Remove from favorites
The slide includes a bar chart comparing the LCOH evolution for blue, green, and brown hydrogen technologies from 2019 to 2030.
Market Analysis and Trends
Energy & Utilities
The slide forecasts that the costs of blue and green hydrogen will decline, closing the gap with brown hydrogen by 2030, as shown in the bar chart.
blue hydrogen, green hydrogen, LCOH, cost trends, 2030 forecast
false
Market Analysis and Trends
Energy & Utilities
Multiple Chart
Kearney
Add to my slides
Remove from favorites
Text-heavy slide focusing on the 'Blue World' scenario, accompanied by a large circular graphic to the right showing percentages from a survey.
Risk Assessment and Management
Professional Services
Describes the competitive and performance-driven nature of 'The Blue World' work environment, including challenges and attractions. Geared towards risk assessment and management in corporate settings.
Blue World, competition, capitalism, rewards, performance, data-driven, business security, job security, technology
false
Risk Assessment and Management
Professional Services
Mixed Chart
PwC/Strategy&
Add to my slides
Remove from favorites
Contains a large line chart tracking spending via different payment types from January 2020. BNPL shows a sharp increase, highlighted with a callout box. The slide is visually simple with clear distinctions between payment types.
Financial Performance
Financial Services
Showcases the dramatic increase in BNPL service usage over time, specifically noting a spike in recent months. It's beneficial for financial analysis and predicting future consumer payment preferences.
BNPL, Consumer Spending, Trends, 2022, Payment
false
Financial Performance
Financial Services
Mixed Chart
Accenture
Add to my slides
Remove from favorites
Features a column chart and a small portrait, highlighting the drastic increase in BNPL spending among younger generations. The slide uses contrasting colors to differentiate between generations effectively.
Product and Service Analysis
Retail & E-commerce
Highlights the substantial impact of Gen Z and Millennials on BNPL markets, showcasing their growing economic influence. Useful for market analysis and strategic planning in finance sectors.
BNPL, Gen Z, Millennials, Economic Influence
false
Product and Service Analysis
Retail & E-commerce
Mixed Chart
Accenture
Add to my slides
Remove from favorites
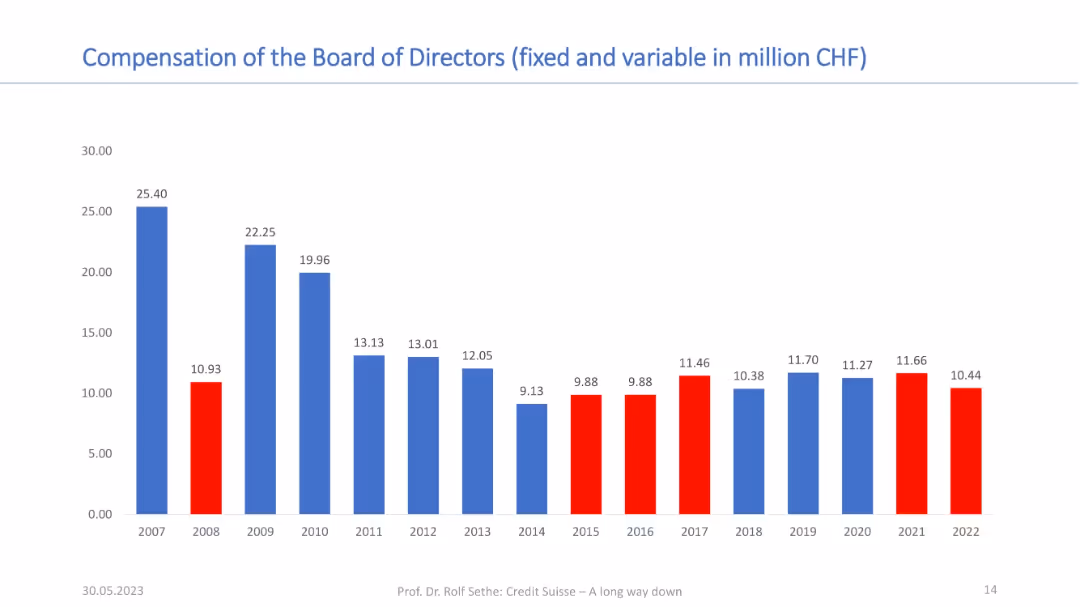
Vertical bar chart with yearly data from 2007 to 2022; red bars highlight specific years; title in blue at the top.
Financial Performance
Financial Services
This slide presents the annual compensation (fixed and variable) of the board of directors in CHF from 2007 to 2022. A declining trend is evident post-2007, with key years highlighted in red to show compensation drops or anomalies.
board compensation, CHF, financials, executive pay, trends, governance
false
Financial Performance
Financial Services
Single Chart
Credit Suisse
Add to my slides
Remove from favorites
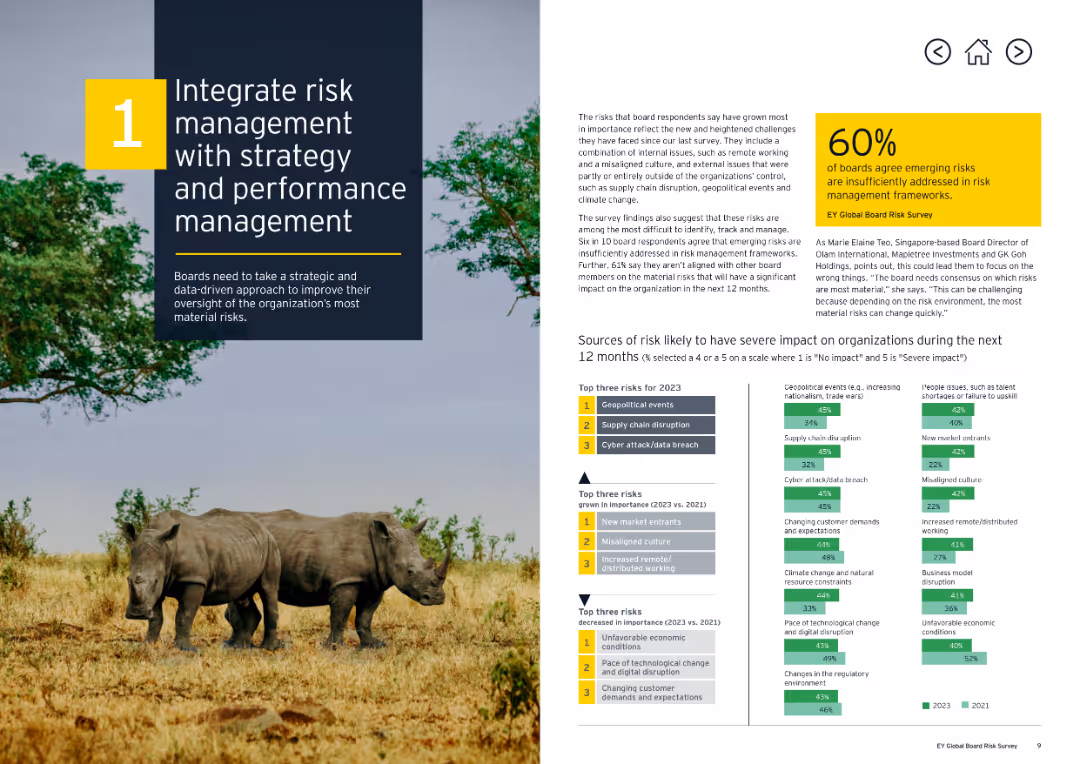
Features a large image of animals crossing a river with a caption discussing the need for board consensus on material risks.
Risk Assessment and Management
Professional Services
The slide metaphorically emphasizes the importance of board consensus in identifying and managing material risks within an organization.
board consensus, material risks, risk management, professional services, metaphor, wildlife image, resilience
false
Risk Assessment and Management
Professional Services
Multiple Chart
EY
Add to my slides
Remove from favorites
Dominated by text, this slide is sectioned into two columns, with bold subheadings and a series of bullet points outlining key information about the board of directors and governance practices.
Regulatory and Compliance
Professional Services
This slide provides an overview of the Board of Directors’ role and their governance structure, highlighting their contribution to sustainable growth, accountability, and strategic oversight at Booz Allen.
board of directors, governance, strategy, oversight, accountability
false
Regulatory and Compliance
Professional Services
Text Only
Booz Allen Hamilton
Add to my slides
Remove from favorites
Similar layout to slide 9345, with a table showing board risk priorities from 2013 to 2022 and a bar chart of top board risk priorities for the next 12 months.
Risk Assessment and Management
Financial Services
The slide highlights the alignment and divergence between CROs and board members on risk priorities, with a focus on credit and geopolitical risks.
Board Risk, Priorities, Credit Risk, Geopolitical Risk, Analysis
false
Risk Assessment and Management
Financial Services
Mixed Chart
EY
Add to my slides
Remove from favorites
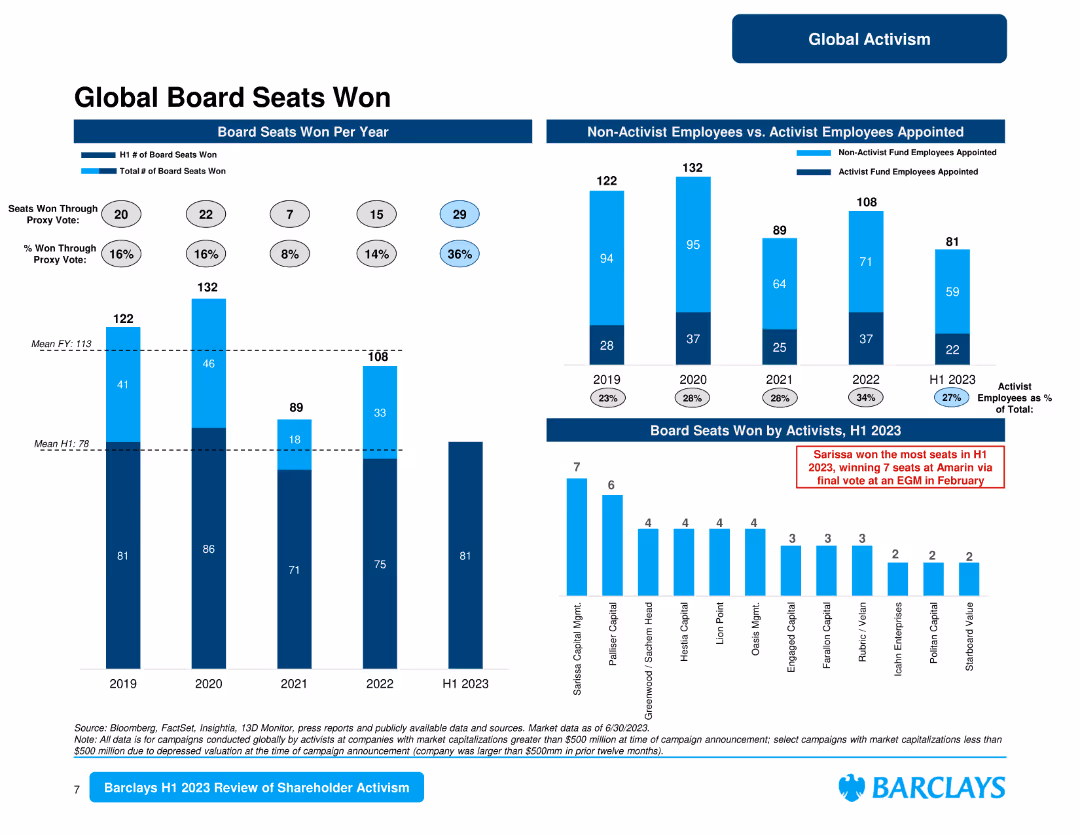
The slide contains multiple column charts depicting the number of board seats won by activists and non-activist employees appointed. It provides a clear visual comparison of board seat activities over the years.
Competitive Landscape
Financial Services
Highlights the board seats won by activist investors, providing a comparison of annual data and focusing on the most successful activists and their influence on corporate boards.
board seats, activists, annual comparison, corporate boards, successful activists
false
Competitive Landscape
Financial Services
Multiple Chart
Barclays
Add to my slides
Remove from favorites
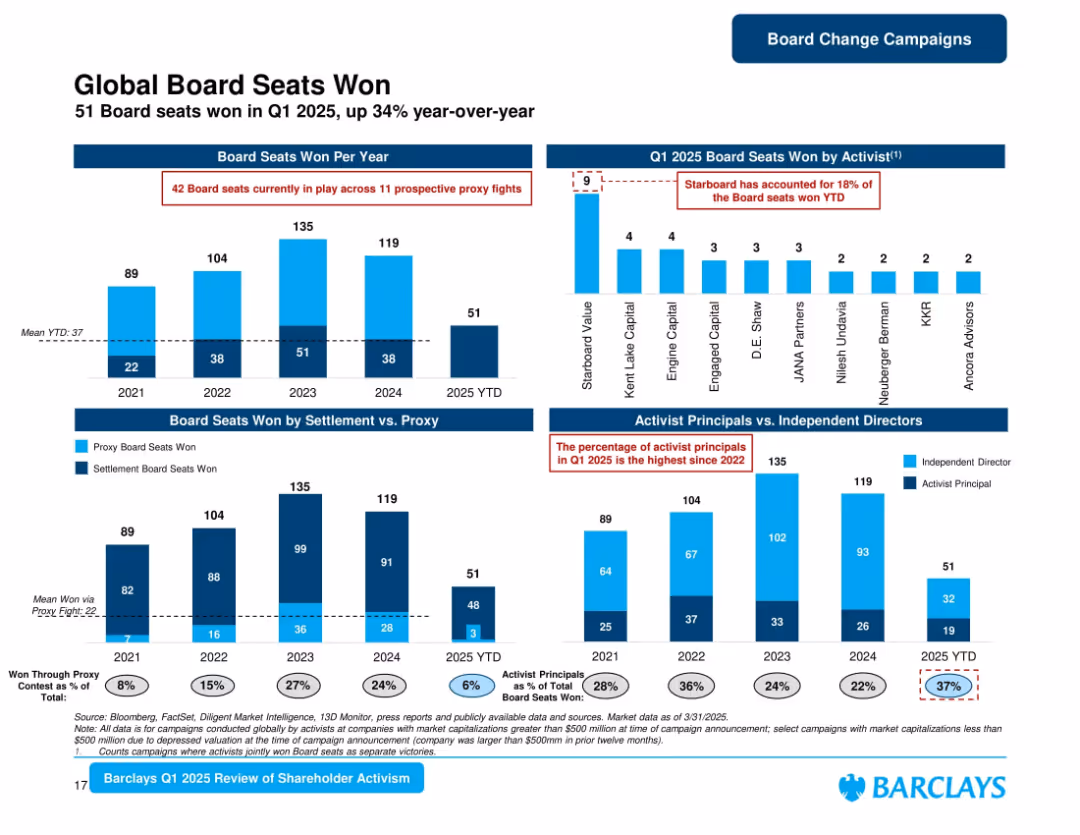
Bar charts split into annual and YTD views, proxy vs. settlement wins, and principal types. Logos and stats for top activists.
Organizational Structure and Change
Financial Services
Analyzes board seats won through shareholder activism, with a 34% increase in 2025 YTD. Starboard Value leads YTD wins. Includes detailed breakdowns of seats by win method and activist type (principal vs. independent director).
Board Seats, Proxy, Activists, Shareholder, Settlements, YTD, 2025, Governance
false
Organizational Structure and Change
Financial Services
Multiple Chart
Barclays
Add to my slides
Remove from favorites
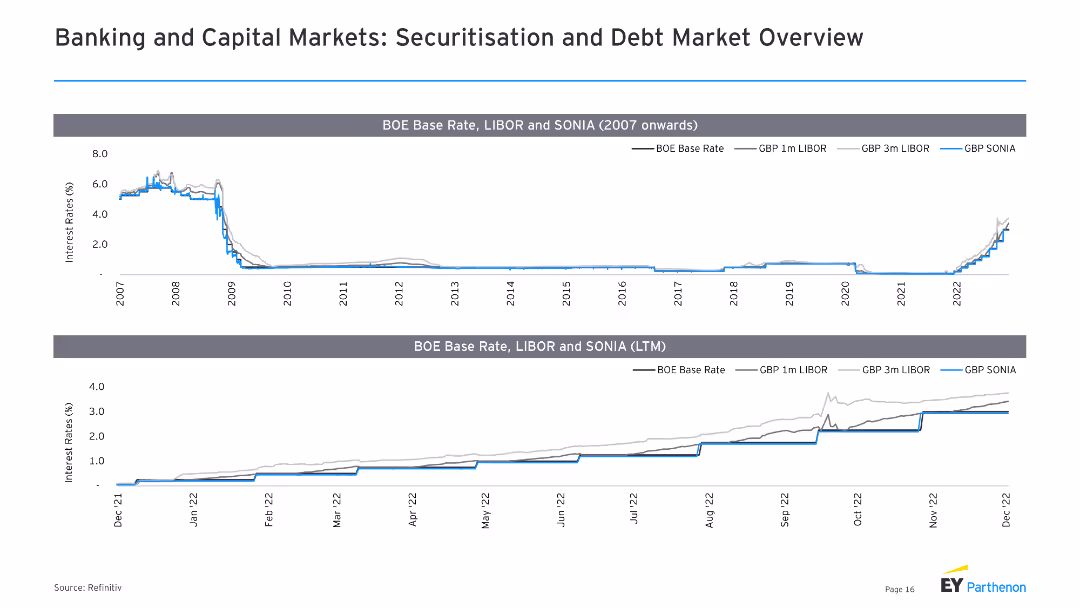
The slide features two line charts, displaying BOE base rate, LIBOR, and SONIA from 2007 onwards and LTM.
Market Analysis and Trends
Financial Services
It analyzes the trends in interest rates, particularly focusing on BOE base rate, LIBOR, and SONIA, useful for understanding monetary policy impacts.
BOE base rate, LIBOR, SONIA, interest rates, trends
false
Market Analysis and Trends
Financial Services
Multiple Chart
EY
Add to my slides
Remove from favorites
Two charts: one shows the Bank of England policy rate expectations with a recession marker, and the other shows UK credit conditions with lending standards tightening for corporates and households.
Regulatory and Compliance
Financial Services
This slide details the policy rate expectations of the Bank of England and the credit conditions in the UK. It highlights the tightening of lending standards and market expectations. Used for policy analysis and economic forecasting.
BoE, policy rate, credit, lending, recession
false
Regulatory and Compliance
Financial Services
Multiple Chart
JP Morgan
Add to my slides
Remove from favorites
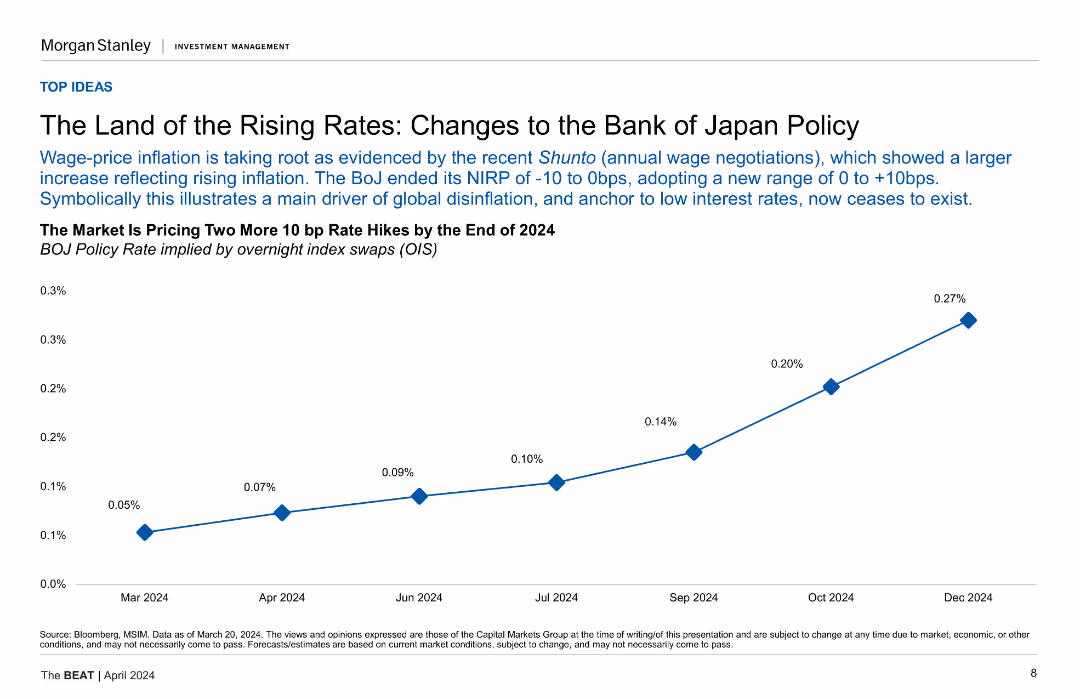
A line chart showing BOJ policy rate projections implied by overnight index swaps (OIS) from Mar-24 to Dec-24.
Market Analysis and Trends
Financial Services
This slide discusses changes to the Bank of Japan's policy and its impact on interest rates, showing the market's projections for future rate hikes.
BOJ Policy, Interest Rates, Japan, Projections, OIS, Rate Hikes
false
Market Analysis and Trends
Financial Services
Mixed Chart
Morgan Stanley
Add to my slides
Remove from favorites
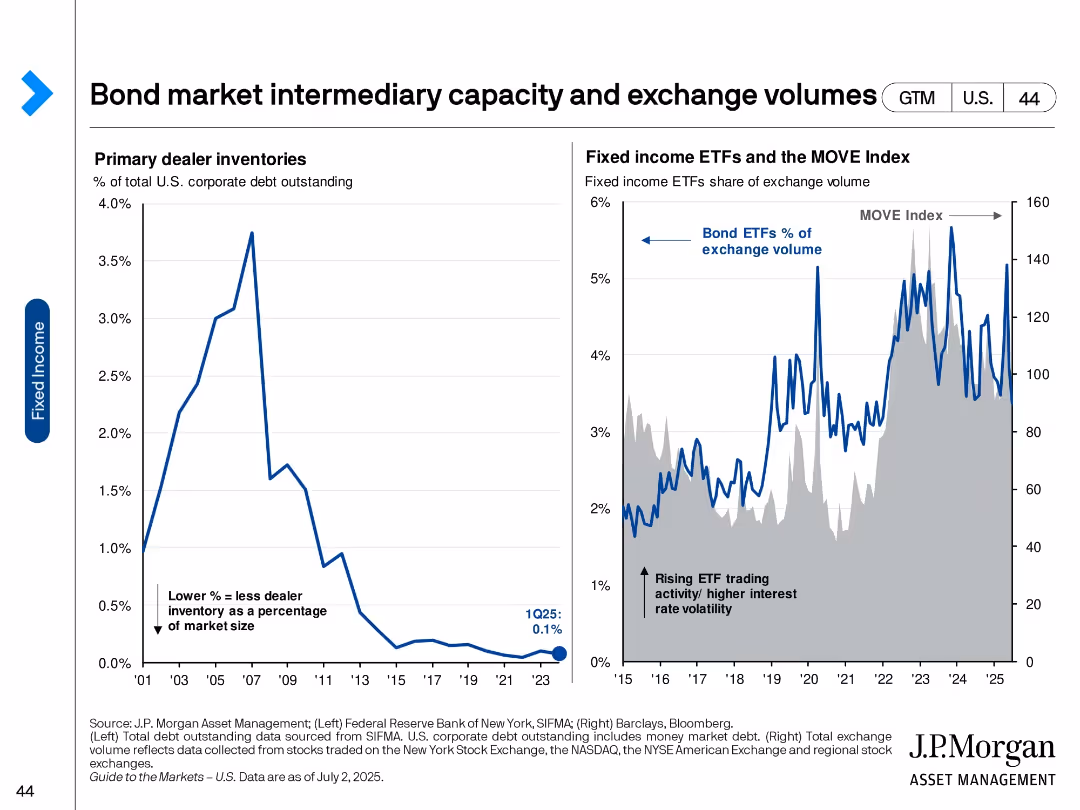
Two-panel slide with line charts on dealer inventories and bond ETF trading volume.
Market Analysis and Trends
Financial Services
Examines the decline in primary dealer bond inventories and the rise of ETF trading in fixed income markets. Suggests a shift in market structure and increased volatility as ETFs become more prominent trading vehicles.
Bond ETFs, market liquidity, dealer inventory, trading volume, volatility, MOVE index, fixed income, market structure
false
Market Analysis and Trends
Financial Services
Multiple Chart
JP Morgan
Add to my slides
Remove from favorites
The slide includes multiple charts showing bond flows, annual flows by currency, and flows by sovereign/corporate/mixed. The layout is data-heavy with several visual elements.
Market Analysis and Trends
Financial Services
The slide analyzes bond flows for 2023, highlighting investor hesitance to allocate to emerging market debt but noting a potential turning point. It includes detailed data on annual flows by currency and other metrics.
bond flows, market analysis, 2023, emerging markets, investment
false
Market Analysis and Trends
Financial Services
Multiple Chart
Morgan Stanley
Add to my slides
Remove from favorites
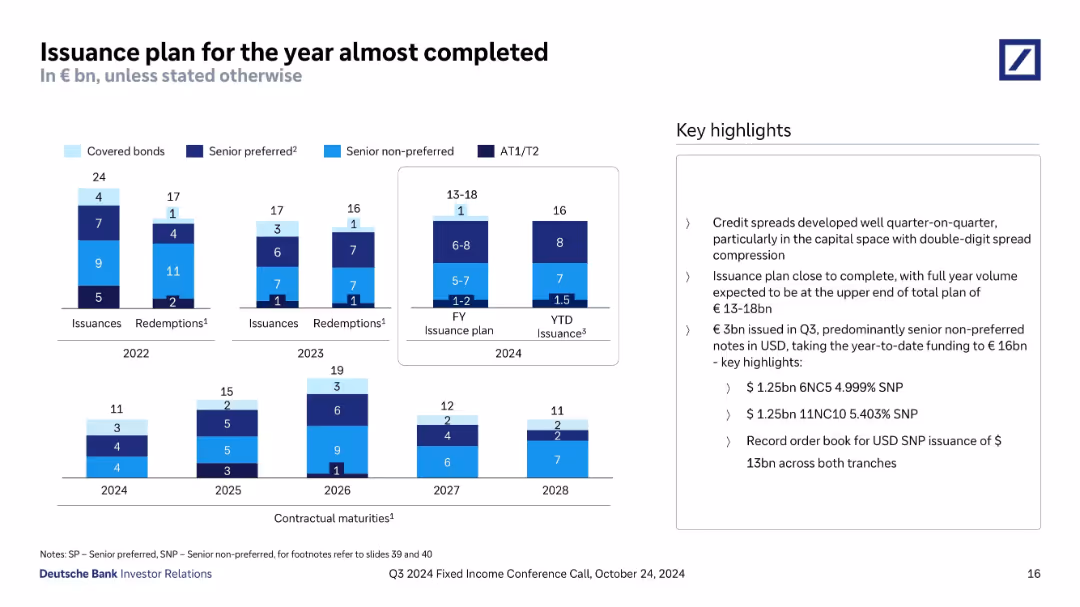
Stacked bar charts detailing issuances, redemptions, and maturities by bond type from 2022 through 2028; highlights listed on the right.
Strategic Planning
Financial Services
Deutsche Bank outlines bond issuance progress, nearing completion of its 2024 plan (€13–18bn range), with €16bn issued YTD. Charts show historical and planned issuances/redemptions. Recent issuances highlight USD-denominated senior non-preferred notes.
bond issuance, maturities, redemptions, capital markets, SNP, 2024 plan, Deutsche Bank
false
Strategic Planning
Financial Services
Mixed Chart
Deutsche Bank
Add to my slides
Remove from favorites
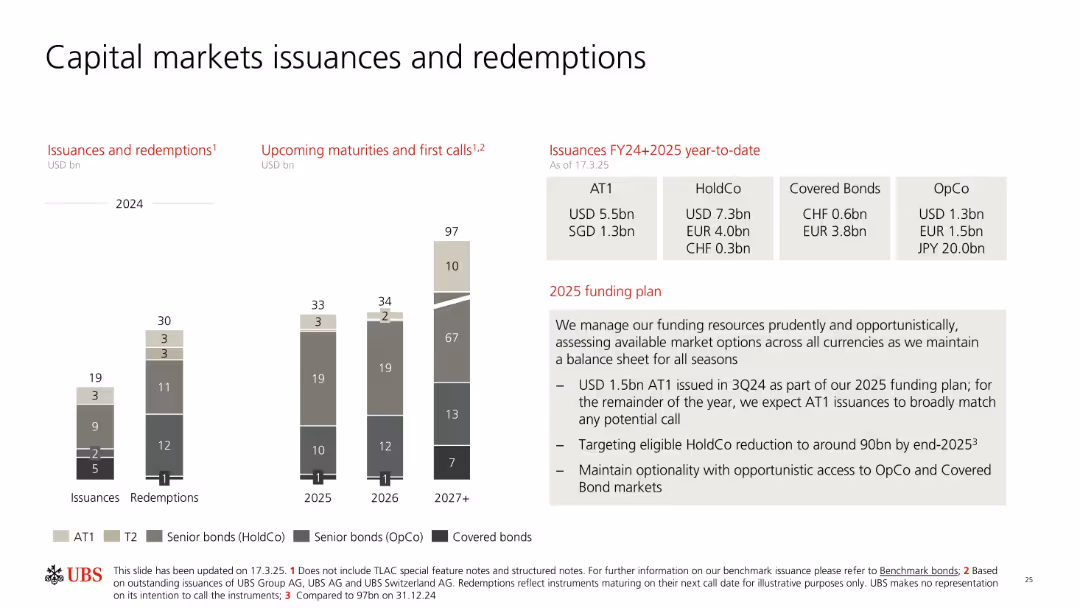
Stacked vertical bar charts with legends for types of bonds; columns separated by years (2024–2027+). Text on the right outlines issuances by type and currency, and a summary of the 2025 funding plan.
Strategic Planning
Financial Services
Provides an overview of UBS's capital market activities including past and upcoming bond issuances and redemptions, broken down by instrument type and maturity year. Details 2025 funding strategy including AT1 issuance goals and risk-adjusted market access approach.
bond issuance, redemption, 2025 funding, AT1, HoldCo, OpCo, UBS, markets
false
Strategic Planning
Financial Services
Mixed Chart
UBS
Add to my slides
Remove from favorites
The slide uses a table format to list various bond issuances with details such as ISIN, instrument, currency, notional amount, coupon rate, and maturity date.
Financial Performance
Financial Services
It outlines year-to-date bond issuances, presenting detailed financial information for each issuance, including key terms and figures.
bond issuances, financial, ISIN, instrument, currency, notional amount, coupon rate, maturity date, UBS
false
Financial Performance
Financial Services
Mixed Chart
UBS
Add to my slides
Remove from favorites
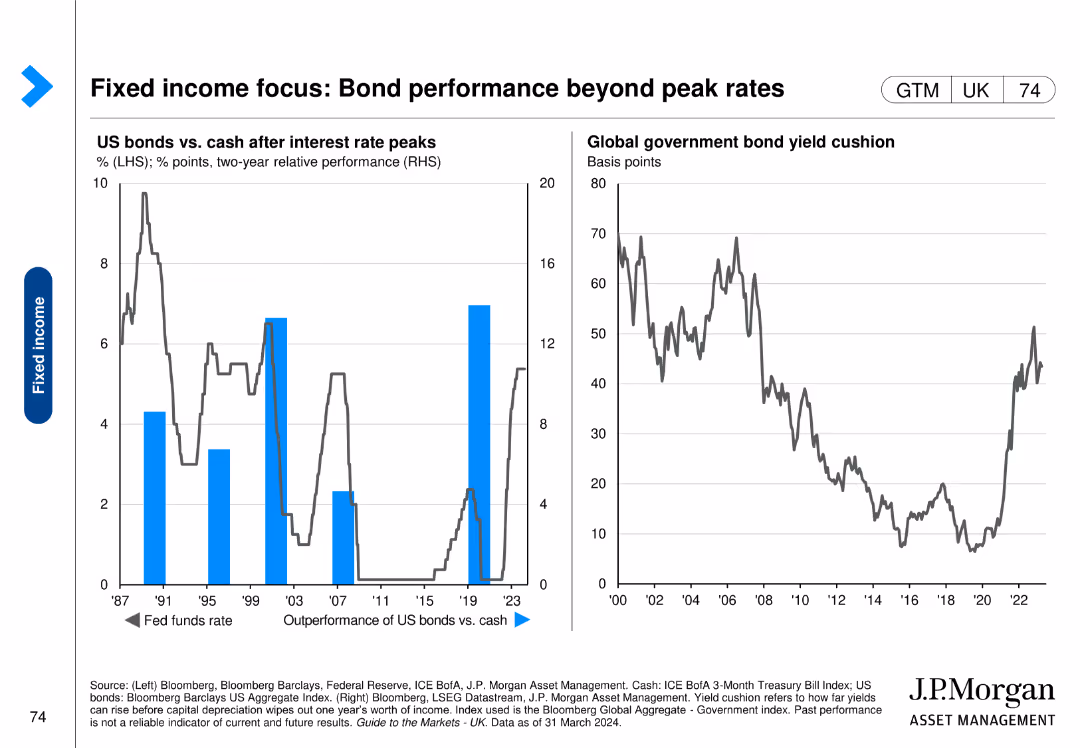
Includes a column chart on the left showing US bonds vs. cash after interest rate peaks and a line chart on the right displaying global government bond yield cushion over time.
Financial Performance
Financial Services
This slide evaluates the performance of US bonds relative to cash after interest rate peaks, and analyzes the yield cushion for global government bonds.
bond performance, interest rates, yield cushion, US bonds, global bonds
false
Financial Performance
Financial Services
Multiple Chart
JP Morgan
Add to my slides
Remove from favorites
This slide features a table listing bond redemptions with details like ISIN, instrument, currency, notional amount, coupon rate, and maturity date.
Financial Performance
Financial Services
It details bond redemptions for the year to date, providing specific information on each redemption, including financial terms and figures.
bond redemptions, financial, ISIN, instrument, currency, notional amount, coupon rate, maturity date, UBS
false
Financial Performance
Financial Services
Mixed Chart
UBS
Add to my slides
Remove from favorites
A table with yields, returns, maturities, and correlations of various bond types, alongside a bar chart of return impact from interest rate changes.
Financial Performance
Financial Services
Evaluates the performance of different bonds and potential returns under changing interest rate scenarios.
Bond returns, yields, performance, interest rates, U.S. Treasuries, correlation, impact, analysis, strong
false
Financial Performance
Financial Services
Mixed Chart
JP Morgan
Add to my slides
Remove from favorites
The slide contains two line charts: 'Average Spread (bps)' and 'Annual Default Rate' with a legend and data table. The charts show trends over time from 2014 to 2024, with varying line styles for different corporate bonds. The layout is clean with clear axis labels and a comparison table.
Market Analysis and Trends
Financial Services
This slide analyzes corporate bond market trends by depicting the average spread in basis points and the annual default rates over a decade. It compares high-yield and investment-grade corporate bonds, providing a quick visual summary of the market's performance, suitable for financial analysts or investors looking at historical trends and current market conditions.
Bonds, Default Rate, Spread, Corporate, Financial Market
false
Market Analysis and Trends
Financial Services
Multiple Chart
Morgan Stanley
Add to my slides
Remove from favorites
Two charts: a line chart showing the 5-year rolling correlation between bonds and equities, and a bar chart displaying cumulative returns during market drawdowns.
Risk Assessment and Management
Financial Services
Highlights the protective role of bonds during large market drawdowns, despite positive correlations to equities, with a detailed historical performance analysis.
bonds, equities, correlation, market drawdowns, financial protection
false
Risk Assessment and Management
Financial Services
Multiple Chart
Goldman Sachs
Add to my slides
Remove from favorites
This slide features a four-step circular process diagram at the left and a three-part list on the right. The background is white, with the header and footer in dark blue. A page number is at the bottom right.
Financial Performance
Financial Services
The slide outlines a comprehensive framework for bond processes, including opportunity identification, investment tagging, and internal review. It also describes the broader integration of project selection, asset tracking, and reporting within the company's sustainability framework. It's ideal for explaining the systematic approach to stakeholders or potential investors and highlighting the organization's transparency and accountability in sustainable finance.
Bonds, Finance, Sustainability, Reporting, Investment, Framework, Process, Guidelines, Auditing
false
Financial Performance
Financial Services
Linear Flow
Goldman Sachs
Add to my slides
Remove from favorites
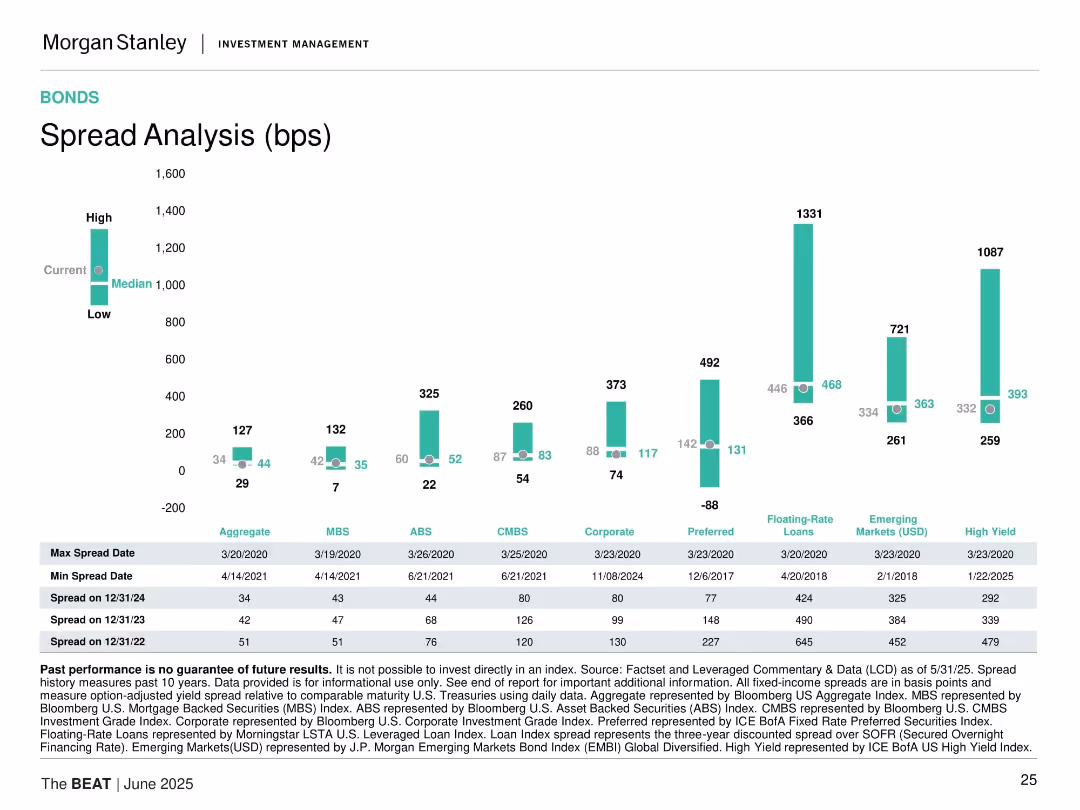
Bar chart comparing spread ranges (low, median, high) for various bond categories, with data tables at the bottom.
Risk Assessment and Management
Financial Services
Compares current bond spreads across sectors such as ABS, MBS, Corporate, High Yield, and EM. Includes historical spread extremes and recent data trends.
bond spreads, credit risk, ABS, MBS, high yield, floating rate, emerging markets, historical data, fixed income
false
Risk Assessment and Management
Financial Services
Mixed Chart
Morgan Stanley
Add to my slides
Remove from favorites
Bar chart showing recent average Z-spread and change relative to average for various sectors with commentary on the right.
Risk Assessment and Management
Financial Services
Highlights the perceived credit risk in the financial, real estate, and energy sectors due to recent US bank failures.
Bond spreads, financial sectors, risk, credit, US
false
Risk Assessment and Management
Financial Services
Mixed Chart
Accenture
Add to my slides
Remove from favorites
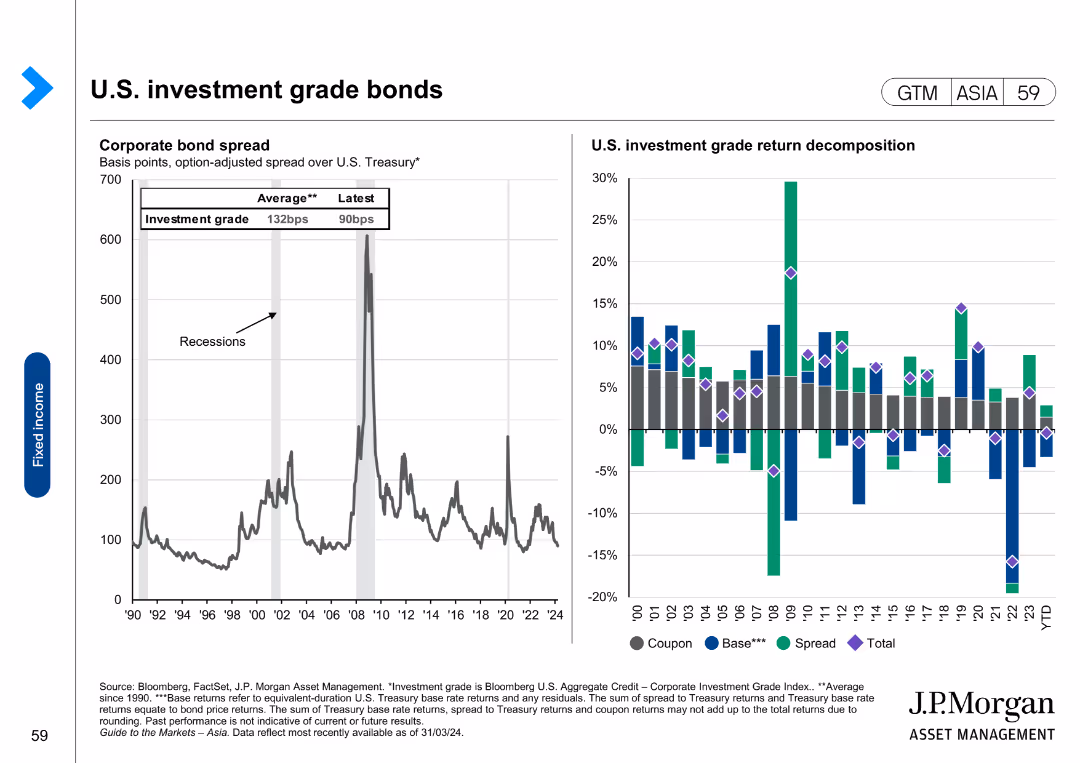
The slide includes a line chart showing corporate bond spreads and a column chart decomposing investment grade returns.
Financial Performance
Financial Services
The slide provides a detailed view of U.S. investment-grade bond spreads and returns, highlighting average spreads and recession impacts.
bond spreads, investment grade, returns, recession, financial analysis
false
Financial Performance
Financial Services
Multiple Chart
JP Morgan
Add to my slides
Remove from favorites
Showcases a pie chart illustrating the breakdown of a bond portfolio and column charts representing maturity breakdown of the bonds with segments labeled as up to 1 year, 1-5 years, etc.
Financial Performance
Financial Services
Provides an analysis of a bond portfolio focused on hold-to-collect debt securities, detailing their types, maturity, and fair value gap, which is essential for financial strategy and risk assessment.
bonds, securities, portfolio, maturity, finance
false
Financial Performance
Financial Services
Multiple Chart
Deutsche Bank
Add to my slides
Remove from favorites
Graph and bar layout: yield vs maturity bond chart, cost comparison for funding instruments, and spread analysis with peer companies; text boxes used for annotations.
Investment Analysis
Consumer Goods
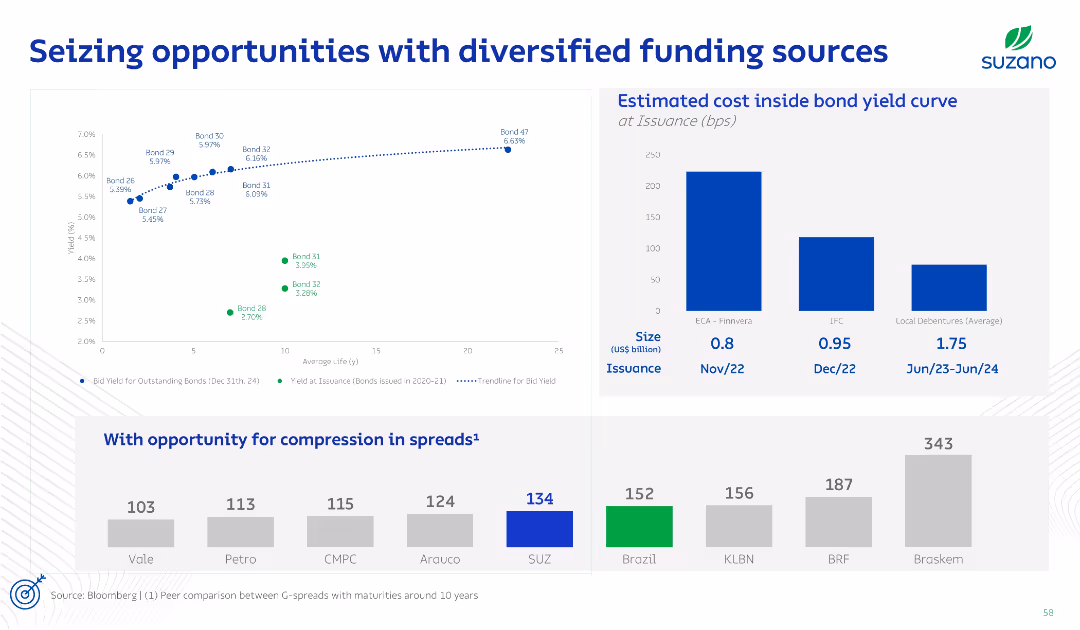
The slide focuses on Suzano’s bond issuance strategy and cost of funding, showing yields at issuance versus market benchmarks. It also explores potential for spread compression relative to peers, indicating room for cost efficiency.
Bonds, Yield Curve, Funding Cost, Spreads, Financing
false
Investment Analysis
Consumer Goods
Multiple Chart
Goldman Sachs
Add to my slides
Remove from favorites
Previous
Next
You don't have any favorites yet.
Please wait loading your favorites slides...
Create a FREE account to continue browsing
Receive Instant Access to 1,000+ slides from companies like McKinsey, Google, and Goldman Sachs
First Name
Last Name
Email
Password
I agree to all
Terms & Privacy Policy
Thank you! Your submission has been received!
Oops! Something went wrong while submitting the form.
Have an account?
Sign in
Upgrade to PRO to Save slides
Advanced Search and Filters
Access to 15,000+ slides
Access to Category Pages
Save/Bookmark Slides
PowerPoint Template Library
Pick a Plan
MONTHLY
$12/month
Billed every month, Cancel anytime.
YEARLY
$9/year
Billed $108 annually, Cancel anytime.
Checkout for $12/month
Checkout for $108/yr
Secured by Stripe | AES-256 bit encryption