My Account
My Slides
Search by Category
Companies
Slide Type
Use Case
Industry
Pricing
Templates
View All Templates
Download Template Slides
✦ AI
AI Prompt Library
AI Search
Feedback
Login
Logout
Get Started
Browse all Slides
Browse all Slides
Create a FREE Account
Instant access to 1,000+ real slides from top companies like McKinsey, BCG, Goldman Sachs, Google and many more!
First Name
Last Name
Email
Password
I agree to all
Terms & Privacy Policy
Thank you! Your submission has been received!
Oops! Something went wrong while submitting the form.
Have an account?
Sign in
Saved Slides
Total No. of slides saved
0
↻ Refresh
✖ Clear all
Shows a flow diagram connecting parts of the presentation with business divisions and technology booths, illustrating the overall strategy and value delivery process.
Technology and Digital Transformation
Financial Services
This slide describes how business divisions and corporate functions use technology to deliver client value, detailing the role of technology booths in the digital transformation process.
business divisions, corporate functions, technology, client value, profitability, technology booths, digital transformation, strategy, value delivery
false
Technology and Digital Transformation
Financial Services
Diagram
Credit Suisse
Add to my slides
Remove from favorites
The slide features a large, smiling person in the foreground with a blurred background. Text to the right highlights "6 action items".
Strategic Planning
Technology & Software
This slide is likely used to present strategic action items that businesses need to address for future planning.
businesses, action items, strategic, planning, future, address, presentation
false
Strategic Planning
Technology & Software
Title
Bain
Add to my slides
Remove from favorites
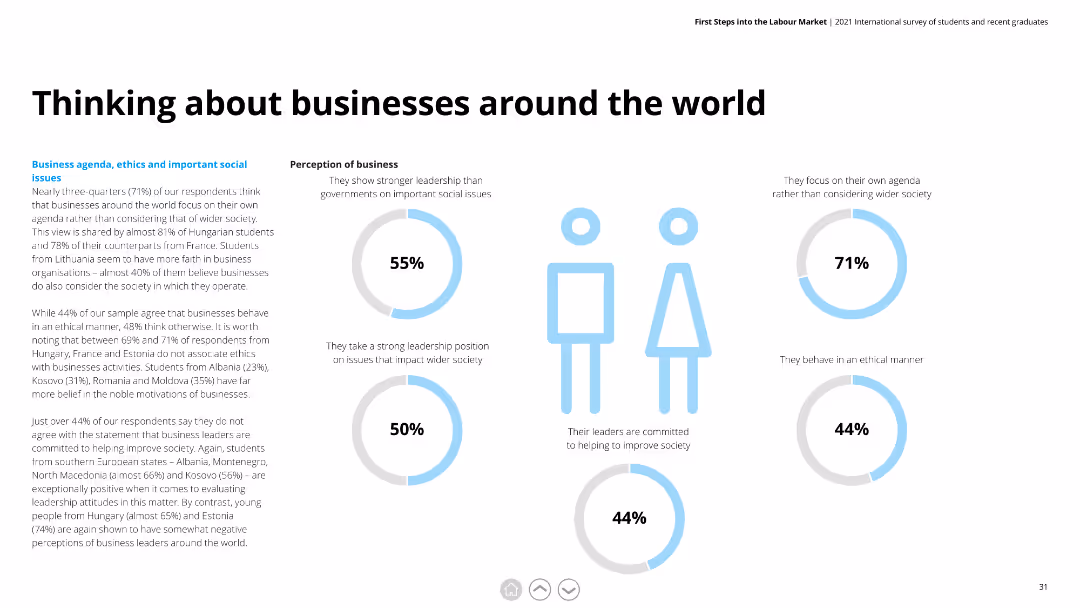
Multiple pie charts showing perceptions of business ethics and leadership compared to government, with detailed text explaining the global perspectives.
Human Resources and Talent Management
Education & Training
This slide discusses global perceptions of business leadership and ethics, noting that businesses are seen as stronger leaders on social issues than governments.
business ethics, leadership, global perceptions, social issues, government comparison
false
Human Resources and Talent Management
Education & Training
Multiple Chart
Deloitte
Add to my slides
Remove from favorites
The slide features multiple visualizations, including a line graph for daily exceptions, a pie chart for open exceptions per department, and various data tables showing exceptions by category and aging analysis.
Operational Efficiency
Energy & Utilities
The slide provides insights into managing business exceptions, displaying data on daily exceptions, departmental exceptions, and aging analysis of open exceptions, helping in operational decision-making.
Business, Exceptions, Management, Analysis, Operational
false
Operational Efficiency
Energy & Utilities
Multiple Chart
EY
Add to my slides
Remove from favorites
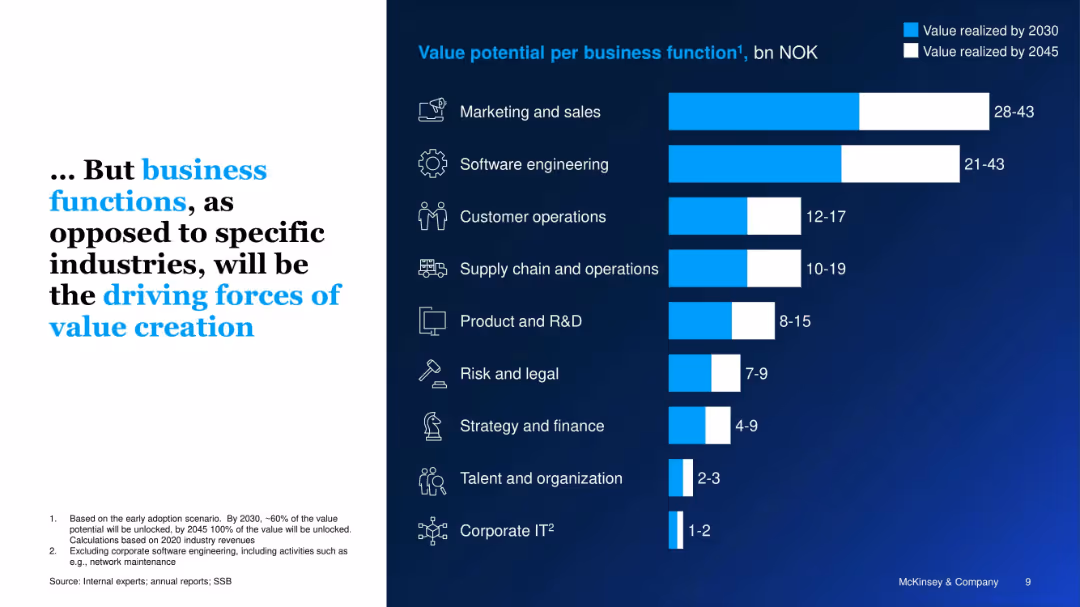
Mirror design to previous slide; bar chart shows value potential by business function (not industry). Blue/white bars differentiate timelines.
Strategic Planning
Artificial Intelligence
The slide argues that GenAI’s greatest value will come from business functions like marketing, software engineering, and operations rather than specific industries, estimating NOK 28–43 billion in marketing alone.
business functions, GenAI, marketing, operations, Norway, productivity, value creation, software
false
Strategic Planning
Artificial Intelligence
Single Chart
McKinsey
Add to my slides
Remove from favorites
The slide contains a series of column charts with detailed annotations and data highlights. It uses shades of blue and text callouts to emphasize key growth metrics.
Financial Performance
Financial Services
The slide evaluates the significant growth of Chase's business sector over time, focusing on client numbers and economic contributions, emphasizing the strong economics of customer relationships. It's intended for financial performance reviews and strategic planning.
Business growth, Chase, Client numbers, Economics, Performance review, Strategy, Financial contributions, Economic metrics
false
Financial Performance
Financial Services
Single Chart
JP Morgan
Add to my slides
Remove from favorites
Complex slide with three sets of column charts representing business growth, customer balances, and financial metrics over time. Uses color contrasts and percentage changes for clarity.
Financial Performance
Financial Services
This slide provides a comprehensive view of JP Morgan Chase & Co.'s growth, customer balance changes, and financial metrics, illustrating the firm's performance over recent years and is likely used for financial analysis and investor relations.
business growth, customer balances, financial metrics, JP Morgan Chase, financial analysis, investor relations
false
Financial Performance
Financial Services
Multiple Chart
JP Morgan
Add to my slides
Remove from favorites
Slide with title, two comparative column charts on revenues and rankings for different financial services, showing growth over time with arrows and brief text descriptions.
Financial Performance
Financial Services
Summarizes the growth and improvement in rankings of the firm's debt underwriting and asset & wealth management, showcasing its track record in building successful businesses.
Business Growth, Debt Underwriting, Wealth Management, Rankings
false
Financial Performance
Financial Services
Multiple Chart
Goldman Sachs
Add to my slides
Remove from favorites
A structured slide with four columns listing key business areas and metrics on the left and future investment leverage and propositions on the right.
Operational Efficiency
Financial Services
Discusses strategies to extend leadership in banking and commerce, with insights on market share and investment focus.
business growth, leadership strategy, market share, investments, financial services, commerce expansion
false
Operational Efficiency
Financial Services
Table
JP Morgan
Add to my slides
Remove from favorites
Bar charts showing future business focus and projections.
Strategic Planning
Financial Services
Details plans and projections for future business areas with potential for growth.
Business Growth, Projections, Strategic Focus, Financial Services
false
Strategic Planning
Financial Services
Multiple Chart
Barclays
Add to my slides
Remove from favorites
Featuring multiple column charts, the slide visually differentiates between half-year and last twelve months revenues with blue tones. Annotations provide explanations for observed trends and future projections.
Strategic Planning
Financial Services
Discusses the growth driven by Deutsche Bank's diverse business portfolio, emphasizing revenue trajectories and contributions from different banking sectors. It provides insights into strategic positioning for future growth.
business growth, revenue trajectory, strategic planning, banking
false
Strategic Planning
Financial Services
Multiple Chart
Deutsche Bank
Add to my slides
Remove from favorites
A structured layout featuring four main content blocks: about Palsgaard, challenge/opportunity, solution, and results and benefits, with accompanying icons and bullet points.
Client Case Studies
Environmental Services & Sustainability
This slide presents a case study on Palsgaard, illustrating how integrating SDG 12 (Responsible Consumption) and SDG 13 (Climate Action) into their core strategy has fueled business growth and decreased externalities, focusing on sustainable operations and CO2 reduction initiatives across global production sites.
Business Growth, Sustainability, SDG 12, SDG 13, Case Study
false
Client Case Studies
Environmental Services & Sustainability
Table
McKinsey
Add to my slides
Remove from favorites
The slide has a text area with a header and two line graphs comparing the perspectives of millennials and Gen Z on businesses' societal impact from 2016 to 2021. The design is straightforward with a mix of green and yellow lines against a white backdrop.
Organizational Structure and Change
Technology & Software
This slide reflects the shifting perspectives of millennials and Gen Z regarding the role of businesses in society. It discusses a trend where fewer individuals view businesses as a force for good, with line graphs showing the percentage of those who agree with this sentiment from 2016 to 2021. The information is vital for understanding corporate reputation and social responsibility practices.
Business Impact, Society, Millennials, Gen Z, Line Graph, Corporate Responsibility, Trends, Sentiment Analysis
false
Organizational Structure and Change
Technology & Software
Mixed Chart
Deloitte
Add to my slides
Remove from favorites
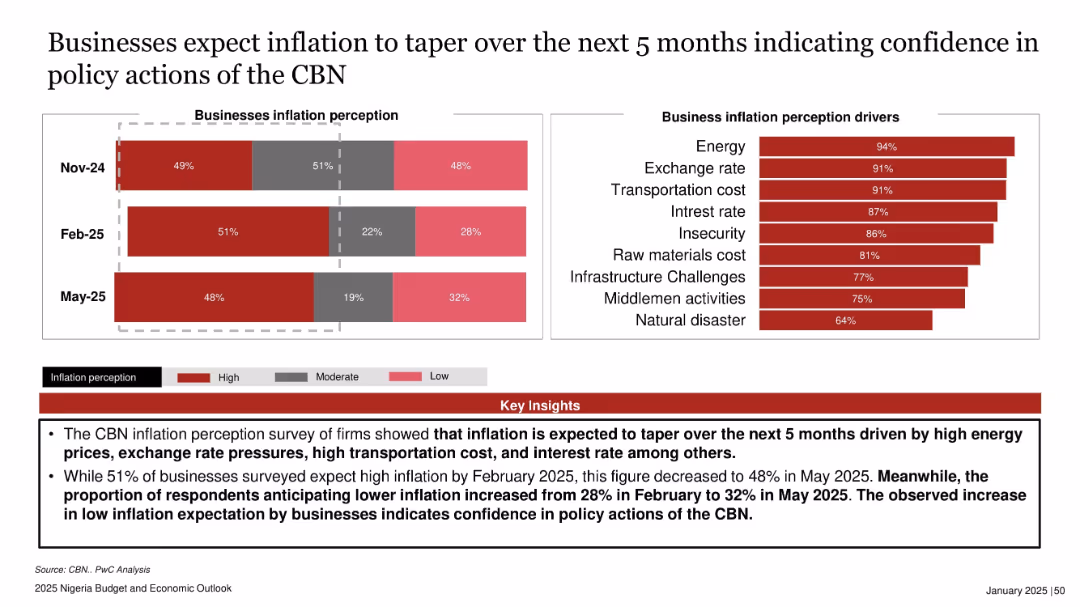
Bar chart showing inflation perception over three months on the left and another showing drivers on the right. Bottom section contains red key insights box.
Market Analysis and Trends
Financial Services
The slide presents businesses’ inflation expectations, indicating a decline in high inflation sentiment from Feb to May 2025. Increased optimism in policy actions by the Central Bank of Nigeria (CBN) is evident, driven by major cost factors like energy and exchange rates.
business inflation, perception, CBN, energy costs, Nigeria, confidence, inflation drivers, May 2025
false
Market Analysis and Trends
Financial Services
Multiple Chart
PwC/Strategy&
Add to my slides
Remove from favorites
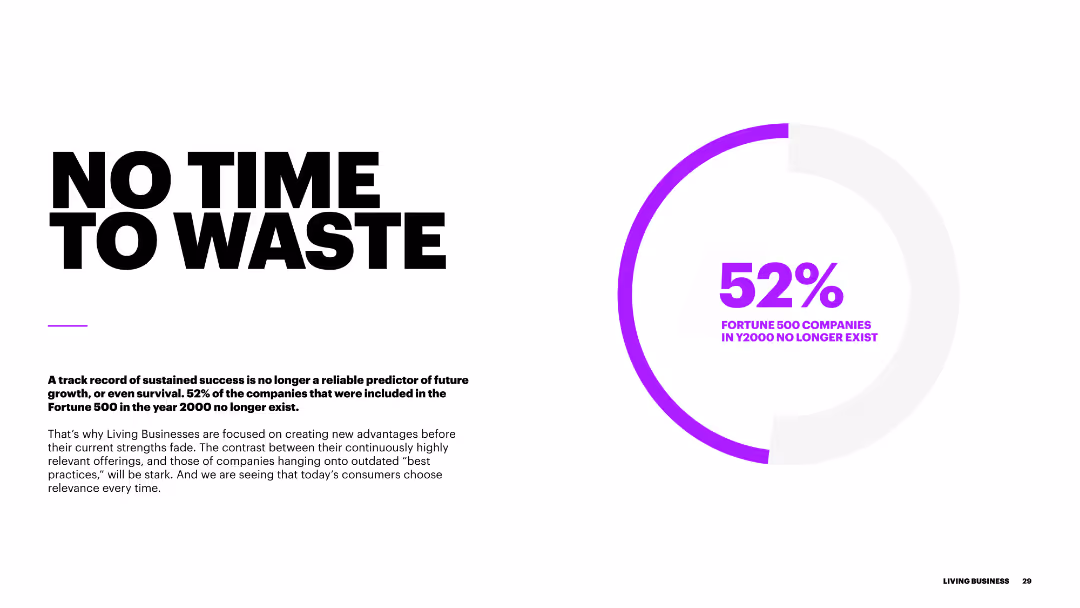
The slide has a large bold title on the left "NO TIME TO WASTE", with a purple circular chart on the right showing 52% in the center. The background is white with minimal design elements, making it clear and easy to read.
Strategic Planning
Professional Services
Highlights the urgency for businesses to innovate and stay relevant. It mentions that 52% of Fortune 500 companies from 2000 no longer exist, emphasizing the need for creating new advantages and remaining relevant in the market.
business innovation, relevance, strategy, survival, transformation
false
Strategic Planning
Professional Services
Mixed Chart
Accenture
Add to my slides
Remove from favorites
Two column charts comparing U.S. real business investment, future capex intentions, personal interest payments, and credit card delinquencies.
Market Analysis and Trends
Financial Services
The slide presents trends in U.S. business investment and consumer finances, focusing on capex intentions and personal interest payments over time.
business investment, capex, consumer finance, credit card delinquencies, U.S. economy
false
Market Analysis and Trends
Financial Services
Multiple Chart
JP Morgan
Add to my slides
Remove from favorites
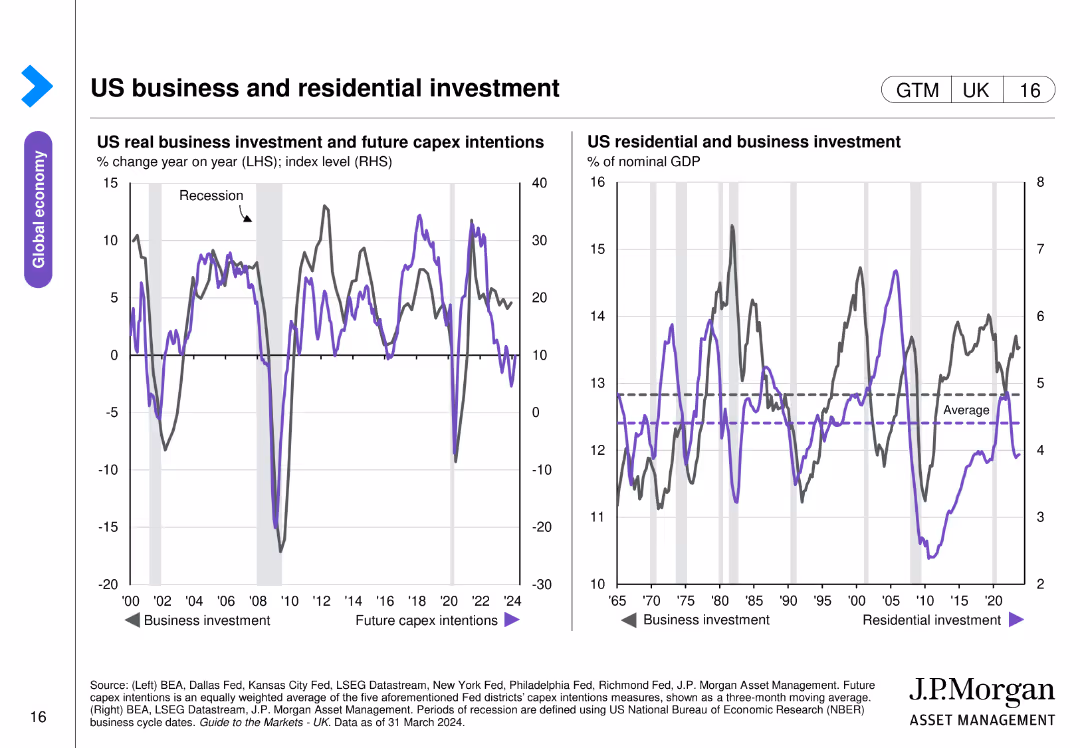
Two line charts side by side, showing trends in business investment and residential investment in the US. Uses color coding for different data series.
Market Analysis and Trends
Financial Services
Analyzes trends in US real business investment, future capex intentions, and residential investment over time, indicating periods of recession.
business, investment, residential, US, GDP
false
Market Analysis and Trends
Financial Services
Multiple Chart
JP Morgan
Add to my slides
Remove from favorites
Overhead view of people walking, with a focus on two individuals in the center. Text block with bold white font.
Strategic Planning
Professional Services
This slide emphasizes the societal expectation that business leaders should speak out on important issues, portraying leadership as both a responsibility and a platform for impact.
business leaders, duty, trust, leadership, responsibility, public issues, Ipsos, social impact, trustworthiness, strategic communication
false
Strategic Planning
Professional Services
Uncategorized
IPSOS
Add to my slides
Remove from favorites
Slide with pie charts and icons with percentages showing respondent demographics and industry distribution, using a minimalistic design to focus on data clarity.
Market Analysis and Trends
Professional Services
Summarizes the responses of business leaders from different regions and industries regarding market uncertainties.
business leaders, survey, industry, regions, insights
false
Market Analysis and Trends
Professional Services
Multiple Chart
BCG
Add to my slides
Remove from favorites
A column chart showing the percentage of people who trust business leaders to tell the truth across various countries, with global averages highlighted.
Market Analysis and Trends
Government & Public Sector
The slide presents data on trust in business leaders globally, showing higher trust in emerging markets compared to developed ones.
business leaders, trust, emerging markets, developed markets, column chart, percentages
false
Market Analysis and Trends
Government & Public Sector
Multiple Chart
IPSOS
Add to my slides
Remove from favorites
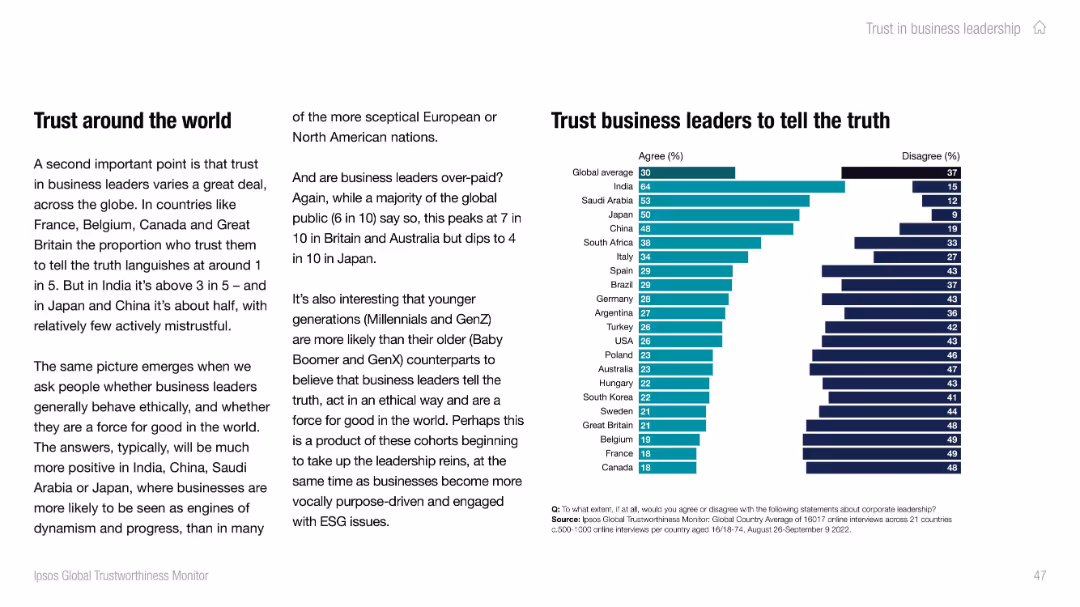
Left-aligned paragraph text and right-side stacked bar chart showing agree/disagree rates by country. Modern, clean design with teal and dark navy bars.
Strategic Planning
Professional Services
This slide reveals global public trust levels in business leaders' truthfulness. India and Saudi Arabia show the highest trust, while Canada and France show the least. Cultural and generational factors are discussed, highlighting varying ethical perceptions.
business leaders, trust, truthfulness, Ipsos, country comparison, ethics, global
false
Strategic Planning
Professional Services
Mixed Chart
IPSOS
Add to my slides
Remove from favorites
Features a pie chart of market opportunities and a column chart showing annual revenue run rate by business vertical.
Market Analysis and Trends
Financial Services
Details the company's new business verticals in North America, focusing on the financial potential and strategic importance of each sector, from insurance to personal loans, highlighting both current investments and future opportunities.
business lines, market opportunity, investment, revenue, strategic planning
false
Market Analysis and Trends
Financial Services
Multiple Chart
Barclays
Add to my slides
Remove from favorites
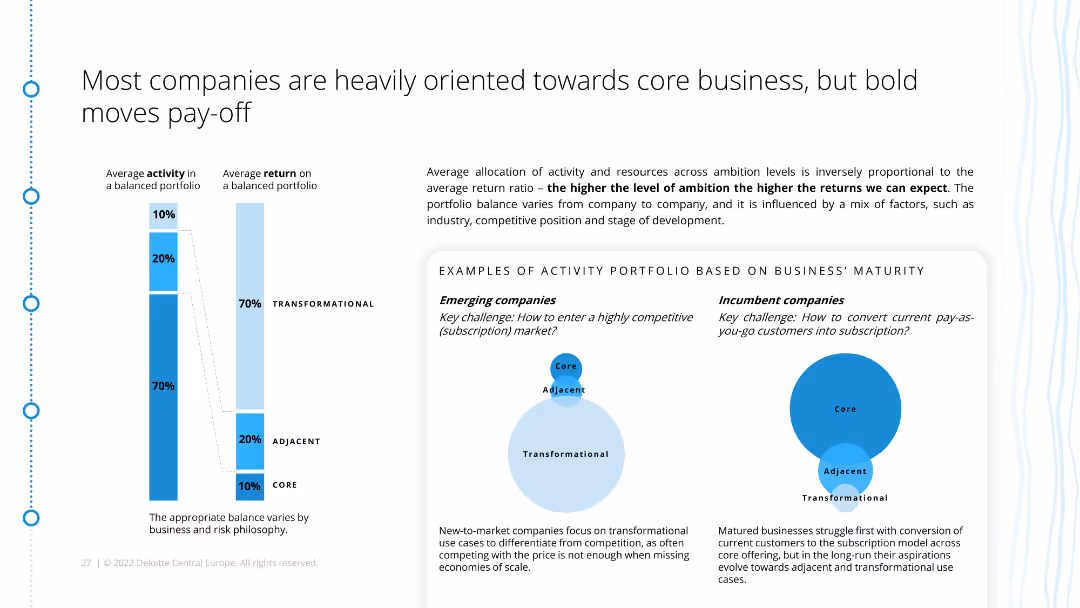
The slide features a diagram comparing the activity portfolios of emerging and incumbent companies, showing different approaches to subscription models. It includes explanatory text and examples.
Strategic Planning
Consumer Goods
This slide contrasts the subscription strategies of emerging and mature companies, emphasizing the balance between core, adjacent, and transformational activities for optimal returns.
business maturity, activity portfolio, subscription models, strategic planning, emerging companies, incumbents, ecommerce, retail
false
Strategic Planning
Consumer Goods
Mixed Chart
Deloitte
Add to my slides
Remove from favorites
A bar graph showing the percentage spend allocation on different e-commerce categories across several Southeast Asian countries, with clear segmentation.
Market Analysis and Trends
Retail & E-commerce
Analyzes the rise of business messaging as part of digital shopping, giving a breakdown of e-commerce spending across Southeast Asian countries.
business messaging, e-commerce, digital shopping, spend allocation, Southeast Asia, trends, rise, analysis
false
Market Analysis and Trends
Retail & E-commerce
Multiple Chart
Bain
Add to my slides
Remove from favorites
This slide features a comparative layout with percentage data across various Southeast Asian countries, highlighting the use of business messaging. It uses a mix of text, rectangular elements for data representation, and an image of a woman using her phone, likely to represent the practical use of business messaging. The design is modern and clean with a balance between visual elements and informational content.
Market Analysis and Trends
Retail & E-commerce
The slide presents statistics on business messaging use in Southeast Asia, comparing it by country. It includes a key message about the challenges of integration and automation in business messaging for large organizations and reasons for using business messaging, emphasizing convenience and communication.
Business Messaging, Southeast Asia, Market Comparison, Communication Trends, Automation Challenges, Convenience, Integration, Usage Statistics, Digital Interaction
false
Market Analysis and Trends
Retail & E-commerce
Boxed
Bain
Add to my slides
Remove from favorites
A pie chart detailing the line of business revenue and a column chart displaying volatility. The layout is clean, with a focus on visual data representation in purple tones.
Risk Assessment and Management
Financial Services
Illustrates financial diversification and stability, suitable for discussions on risk management and financial planning, highlighting the benefits of a diverse business model in mitigating market volatility.
business mix, financial stability, risk management, volatility, diversification
false
Risk Assessment and Management
Financial Services
Multiple Chart
Goldman Sachs
Add to my slides
Remove from favorites
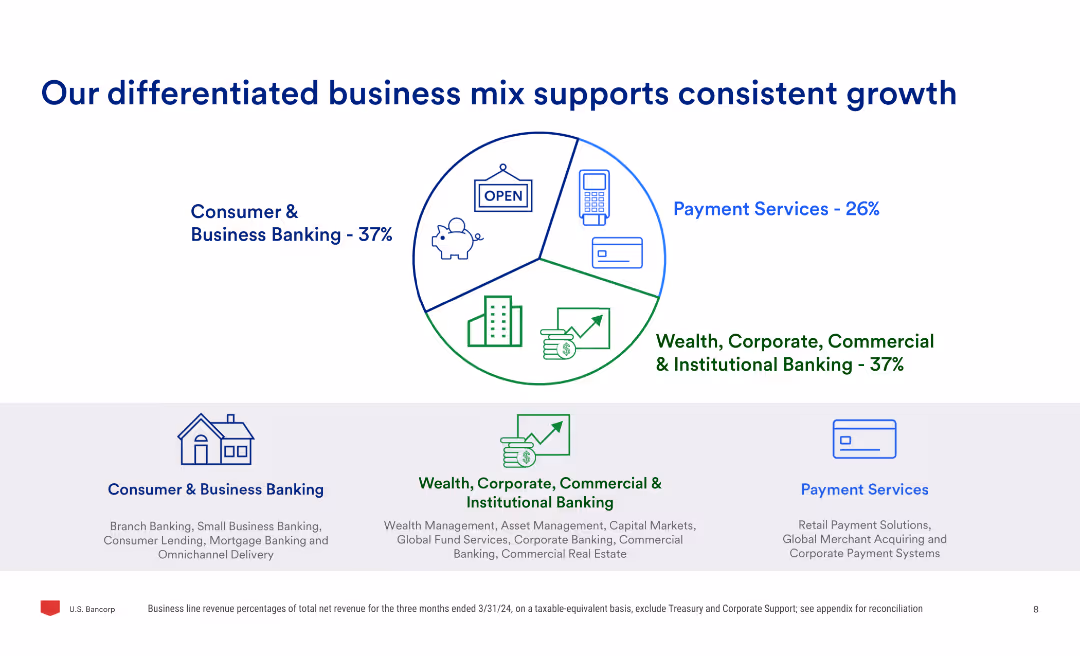
The slide uses a pie chart to show the business mix percentages and three sub-sections detailing consumer & business banking, payment services, and wealth, corporate, commercial & institutional banking.
Market Analysis and Trends
Financial Services
Highlights the company's diversified business model, showing the percentage contribution of different business segments and explaining the services offered in consumer & business banking, payment services, and institutional banking.
business mix, growth, banking, payment services, wealth, commercial, institutional, market analysis
false
Market Analysis and Trends
Financial Services
Mixed Chart
Barclays
Add to my slides
Remove from favorites
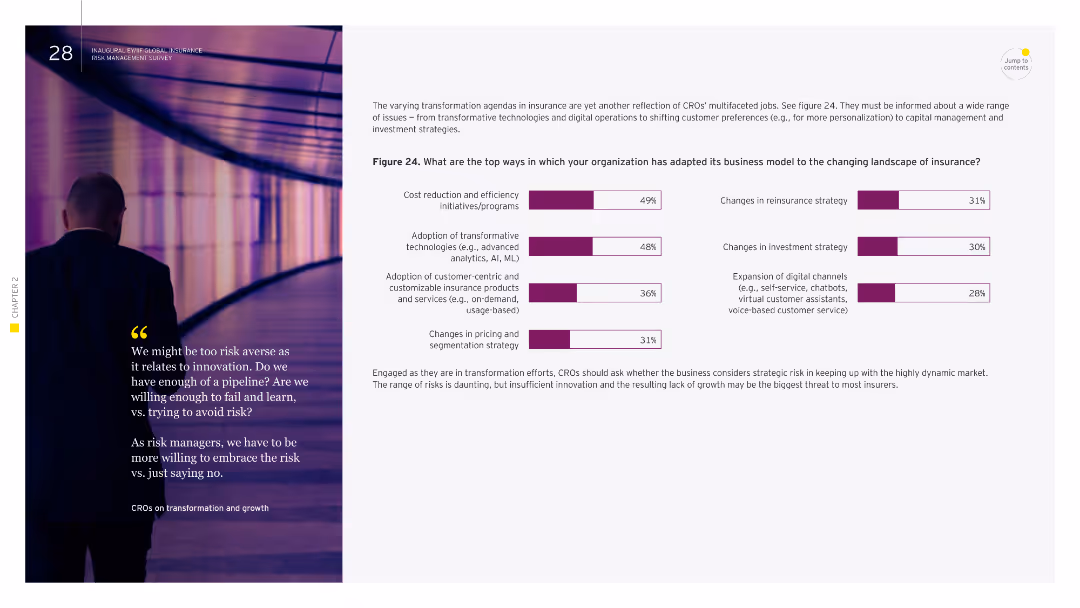
Image of a person walking in a hallway. Column chart showing top ways organizations have adapted their business model to changing insurance landscapes.
Strategic Planning
Financial Services
This slide outlines how organizations have adapted their business models to changing insurance landscapes, including cost reduction initiatives, adoption of transformative technologies, and changes in pricing strategies. It emphasizes the importance of innovation and adaptation to remain competitive in the insurance sector.
business model, adaptation, insurance, innovation, technologies
false
Strategic Planning
Financial Services
Multiple Chart
EY
Add to my slides
Remove from favorites
A mix of column chart, a pie chart, and line graph that give an overview of the bank's customer-centric model, geographical diversification, and resilient earnings.
Market Analysis and Trends
Financial Services
This slide outlines BBVA's business model, showing a customer-focused approach, geographical diversification, and steady income. It’s useful for investor presentations and strategic market positioning discussions.
Business Model, Customer-Centric, Diversification, Resilient Earnings, Geographical Spread, Financial Stability
false
Market Analysis and Trends
Financial Services
Multiple Chart
Morgan Stanley
Add to my slides
Remove from favorites
The slide contains three pie charts, each representing different categories: geographies, sectors, and clients. The layout is comparative, visually clear, and provides a broad overview of diversity in business operations.
Organizational Structure and Change
Professional Services
The slide illustrates the diverse business model of Ipsos, showing distribution across geographies, sectors, and client concentration, highlighting resilience and adaptability.
business model, diversity, geographies, sectors, clients
false
Organizational Structure and Change
Professional Services
Multiple Chart
IPSOS
Add to my slides
Remove from favorites
The slide lists characteristics of an attractive business model, with each characteristic accompanied by an icon. The characteristics include real price growth, resilience, price insensitivity, long-term revenue visibility, barriers to entry, negative working capital, and high ROI.
Strategic Planning
Education & Training
This slide outlines key characteristics of an attractive business model in the education sector, highlighting factors such as resilience, long-term revenue visibility, high ROI, and barriers to entry, providing insights into the elements that make education a profitable market.
business model, education, profitability, revenue, resilience
false
Strategic Planning
Education & Training
Diagram
LEK
Add to my slides
Remove from favorites
Circular diagram showing factors interconnected with business model innovation and column charts projecting global retail e-commerce sales and its share of total retail sales from 2015 to 2024.
Technology and Digital Transformation
Technology & Software
This slide explores the dynamics of business model innovation within Industry 4.0, highlighting factors such as digital communications and emerging markets. It projects significant growth in global retail e-commerce sales and its increasing share of total retail sales, indicating a shift towards online business models.
Business Model Innovation, E-commerce, Industry 4.0
false
Technology and Digital Transformation
Technology & Software
Mixed Chart
Roland Berger
Add to my slides
Remove from favorites
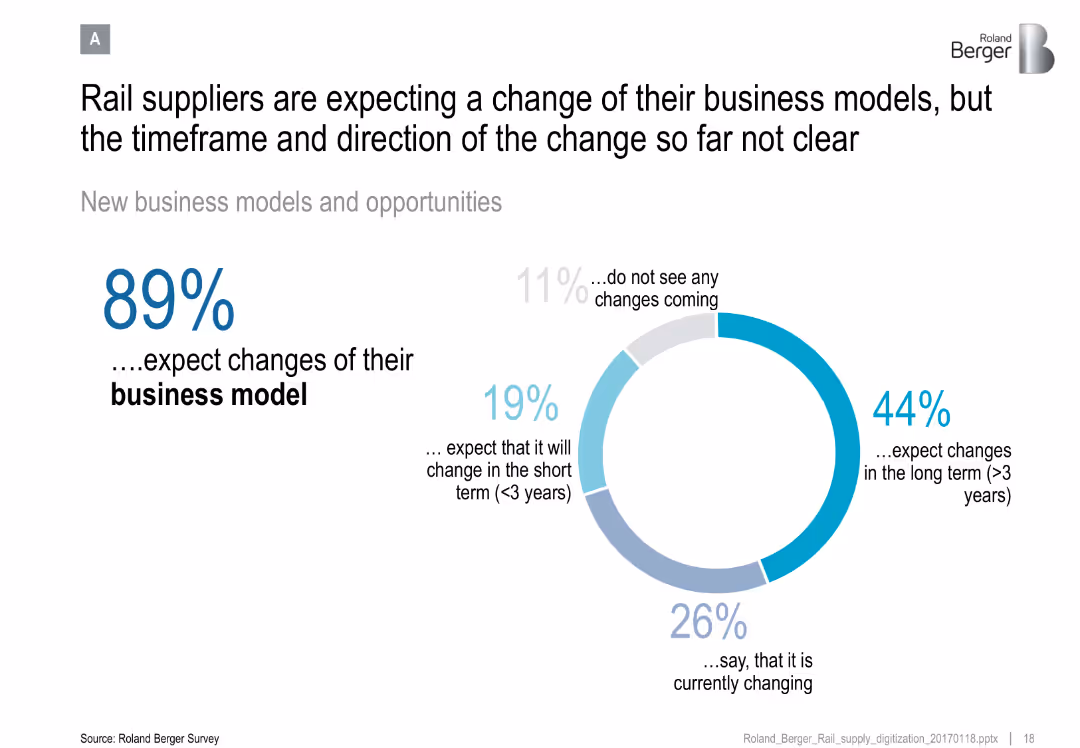
Donut chart showing supplier expectations for business model change, with segmented outlook (short/long term, current)
Organizational Structure and Change
Transportation & Logistics
Reveals that the majority of rail suppliers anticipate changes to their business models, though the timing and direction remain uncertain.
business model, rail suppliers, industry change, organizational strategy, transformation timeline
false
Organizational Structure and Change
Transportation & Logistics
Mixed Chart
Roland Berger
Add to my slides
Remove from favorites
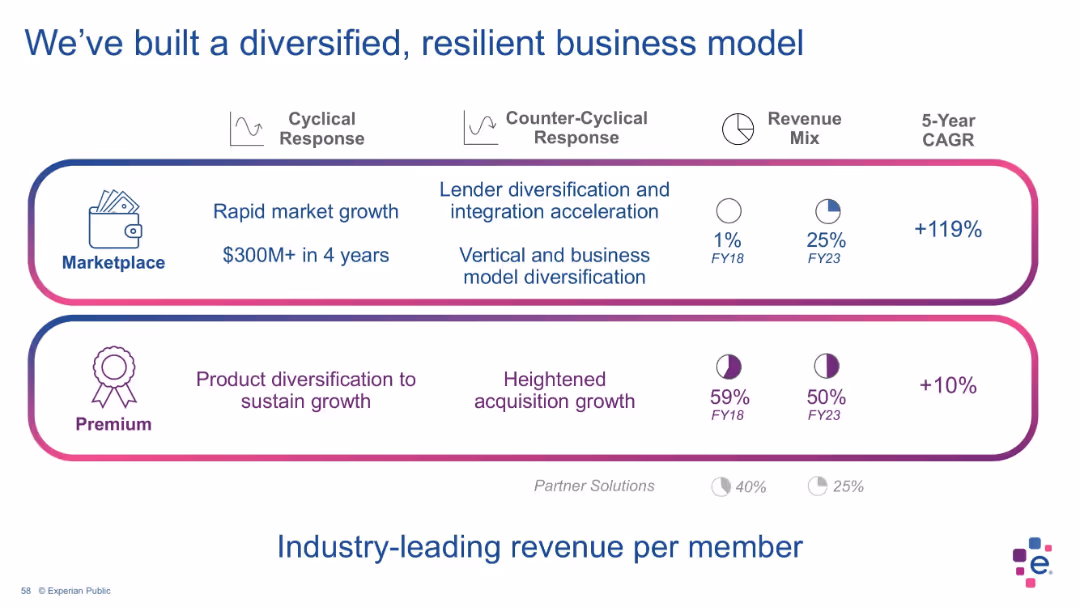
Two-section layout with bordered blocks for “Marketplace” and “Premium”; includes pie charts for revenue mix over time, CAGR figures, and icons representing features.
Strategic Planning
Financial Services
This slide outlines Experian’s dual revenue streams—Marketplace and Premium—showing significant growth in Marketplace revenue and highlighting diversification and resilience. Visual indicators display changes in revenue contribution from FY18 to FY23, with notable growth in Marketplace (from 1% to 25% of revenue).
business model, revenue mix, diversification, premium services, marketplace, Experian, CAGR, financial strategy, resilient model, financial planning
false
Strategic Planning
Financial Services
Mixed Chart
Barclays
Add to my slides
Remove from favorites
Comparative pie charts showing revenue mix of UBS versus North American and European GSIB averages, highlighting different business segments.
Strategic Planning
Financial Services
Compares UBS's business model and revenue mix with North American and European GSIB averages, emphasizing unique global asset gathering.
Business Model, Revenue Mix, UBS, GSIB, Comparison
false
Strategic Planning
Financial Services
Multiple Chart
UBS
Add to my slides
Remove from favorites
The slide shows a PBT contribution table, technology investment icons, and text blocks on risk management.
Risk Assessment and Management
Financial Services
Emphasizes the successful business model, technology investments, and business continuity planning.
business model, risk management, technology investment, resilience, continuity
false
Risk Assessment and Management
Financial Services
Mixed Chart
UBS
Add to my slides
Remove from favorites
Before-and-after comparison with two columns contrasting past and current business models. Lists key aspects with numbers and uses blue color highlights.
Organizational Structure and Change
Financial Services
Explains the shift in Morgan Stanley's business model, highlighting increased scale, added channels, and expanded service models.
Business model, scale increase, service expansion, channels, Morgan Stanley, organizational change, evolution
false
Organizational Structure and Change
Financial Services
Table
Goldman Sachs
Add to my slides
Remove from favorites
The slide compares different business models for CCUS projects in the UK, including transport and storage fees, contract for difference, carbon tax, and hydrogen production.
Strategic Planning
Energy & Utilities
The slide outlines new business models for CCUS clusters in the UK, comparing government and private sector roles in funding and operating these projects. It highlights different models such as transport and storage fees, contract for difference, carbon tax, and hydrogen production.
business models, CCUS, UK, strategic planning
false
Strategic Planning
Energy & Utilities
Table
Kearney
Add to my slides
Remove from favorites
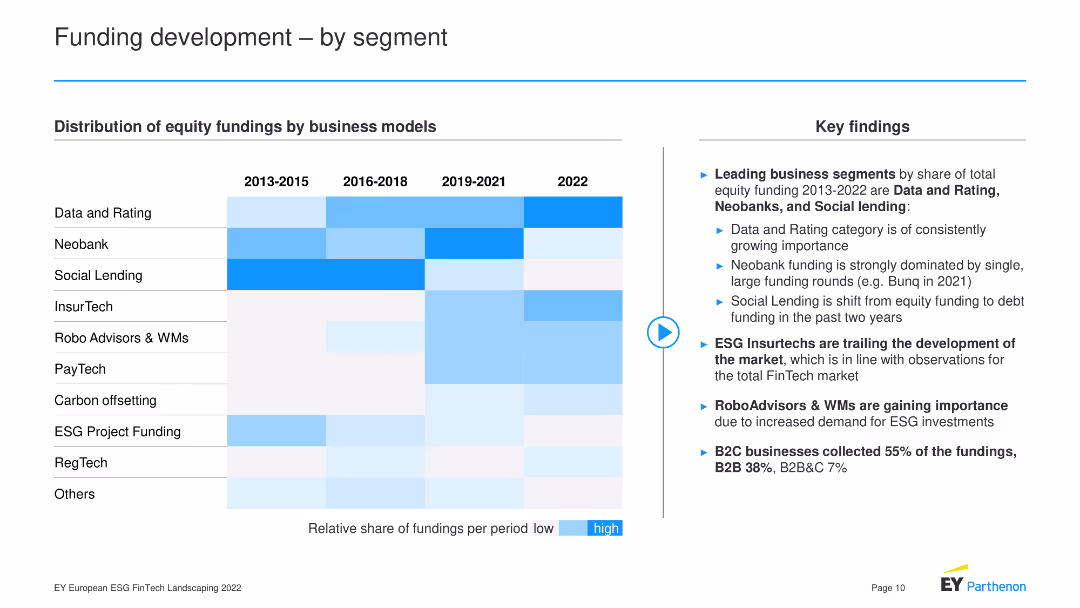
A heatmap chart displaying distribution of equity fundings by business models over different periods.
Market Analysis and Trends
Financial Services
The slide illustrates the distribution of equity fundings across various business models from 2013 to 2022, noting leading segments like Data and Rating, Neobank, and Social Lending, with insights into the growth trends and shifts in ESG investments, RoboAdvisors, and B2C business funding.
Business Models, Equity Funding, Segments, Trends
false
Market Analysis and Trends
Financial Services
Header Horizontal
EY
Add to my slides
Remove from favorites
The slide features a detailed diagram of business models in industrial automation, showing different roles such as component suppliers, module manufacturers, and integrators across the value chain.
Strategic Planning
Industrial & Manufacturing
The slide explains various business models in industrial automation, highlighting the differences in growth and margin profiles across the value chain.
business models, industrial automation, value chain, component suppliers, module manufacturers, integrators
false
Strategic Planning
Industrial & Manufacturing
Table
LEK
Add to my slides
Remove from favorites
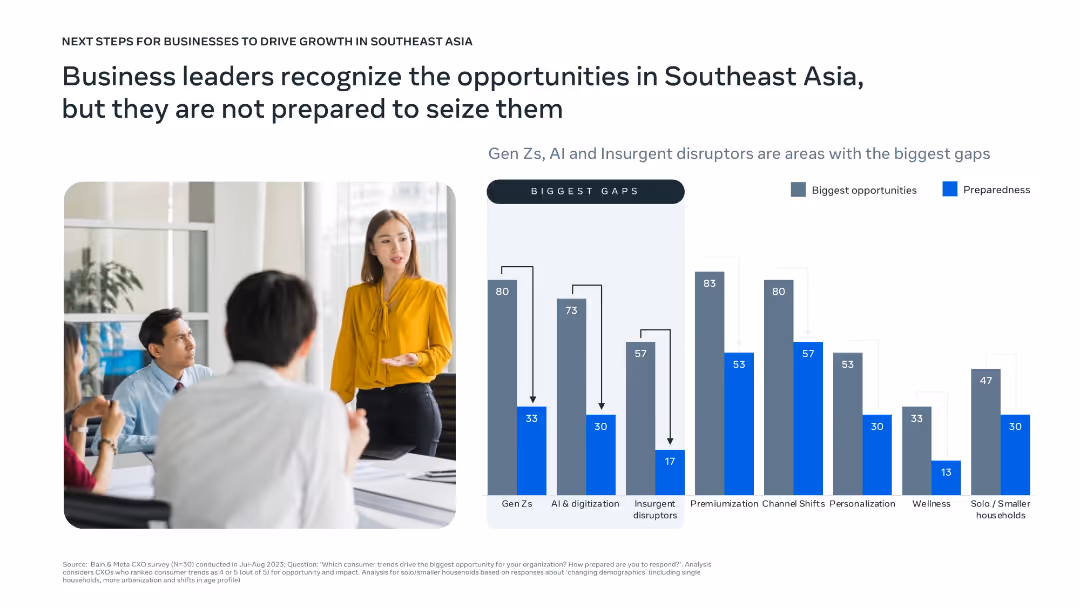
Bar chart compares opportunity vs. preparedness across categories like Gen Z, AI, insurgents, and personalization; photo of business meeting adds contextual visual.
Strategic Planning
Professional Services
Highlights the readiness gap among business leaders in seizing Southeast Asian opportunities. While areas like Gen Z, AI, and personalization are seen as high-potential, preparedness to address them is low. The slide calls attention to misalignment between market opportunity and corporate readiness.
business opportunity, SEA, readiness gap, Gen Z, AI, strategy
false
Strategic Planning
Professional Services
Mixed Chart
Bain
Add to my slides
Remove from favorites
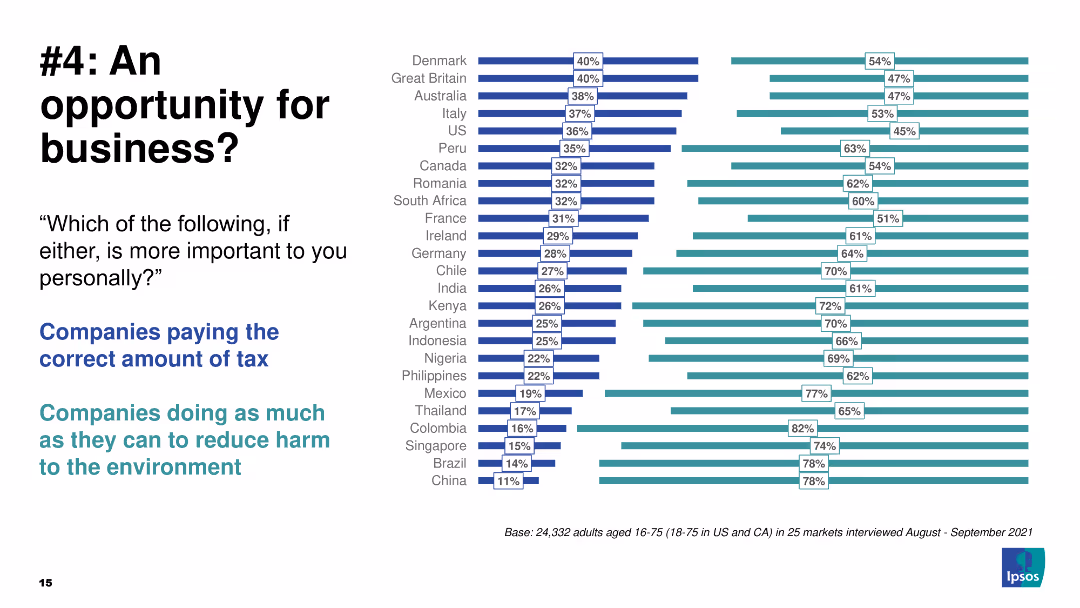
Comparative column chart highlighting the importance of tax payment vs environmental harm reduction.
Strategic Planning
Environmental Services & Sustainability
The slide compares the importance of companies paying taxes vs reducing environmental harm.
business, opportunity, taxes, environment, global
false
Strategic Planning
Environmental Services & Sustainability
Multiple Chart
IPSOS
Add to my slides
Remove from favorites
Comparative column chart with additional highlighted focus on environmental harm reduction.
Strategic Planning
Environmental Services & Sustainability
Same as previous with an emphasis circle on the importance of reducing harm to the environment.
business, opportunity, taxes, environment, global
false
Strategic Planning
Environmental Services & Sustainability
Multiple Chart
IPSOS
Add to my slides
Remove from favorites
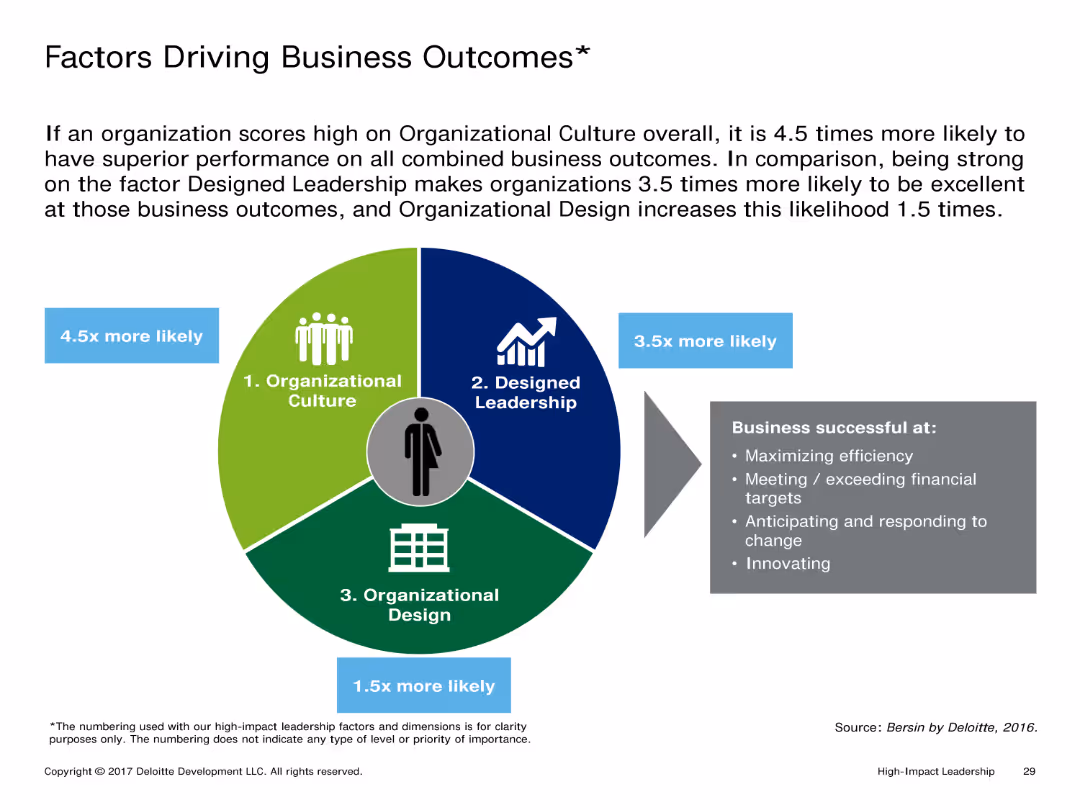
The slide includes a circular diagram divided into three segments representing Organizational Culture, Designed Leadership, and Organizational Design. Each segment lists factors that drive business outcomes.
Market Analysis and Trends
Professional Services
It presents the relationship between high scores in Organizational Culture, Designed Leadership, and Organizational Design, and superior business outcomes. The slide emphasizes the likelihood of business success based on these factors.
Business Outcomes, Organizational Culture, Leadership, Design, Performance
false
Market Analysis and Trends
Professional Services
Diagram
Deloitte
Add to my slides
Remove from favorites
Column chart represents CFO sentiments about the business outlook over the next 12 months, using shades of green to indicate varying levels of optimism and pessimism. The 'somewhat optimistic' category shows the highest count.
Investment Analysis
Financial Services
Reflects the mixed sentiments of CFOs regarding the future business climate, with a lean towards a somewhat optimistic outlook. This sentiment analysis can aid in understanding the confidence levels of business leaders in financial planning and strategy adjustments amidst ongoing economic uncertainties.
business outlook, CFO, sentiment analysis, financial planning, optimism
false
Investment Analysis
Financial Services
Single Chart
Deloitte
Add to my slides
Remove from favorites
The slide presents a composite of bar charts and a list, comparing data between the years 2023 and 2024 in terms of business leaders' expectations for revenue, profits, and headcount. It also shows business planning priorities in a vertical list layout. The graphical elements are well organized, using color differentiation for each year.
Strategic Planning
Financial Services
This analytical slide illustrates the optimistic projections for 2024 by business leaders, with a focus on revenue, profits, headcount, and strategic planning. It provides valuable insights for companies preparing for the year ahead and serves as a tool for strategic business planning, indicating areas of expected growth and potential changes in operational focus.
Business Outlook, Revenue Growth, Profit Expectations, Strategic Planning, Operational Focus
false
Strategic Planning
Financial Services
Multiple Chart
JP Morgan
Add to my slides
Remove from favorites
This slide has a minimal design with key achievements highlighted using blue boxes and descriptive text. It's separated into three sections, each showcasing different aspects of business strength and breadth, including graphics illustrating scale and multi-line business relationships.
Competitive Landscape
Financial Services
The slide highlights JPMorgan Chase & Co.'s strong position in various business domains, emphasizing its scale and offering breadth. It likely serves to assert the company's competitive advantage and market leadership to stakeholders or in competitive analysis briefings.
Business Positions, Scale, Offerings, Market Leadership, Competitive Advantage, JPMorgan Chase & Co., Stakeholders
false
Competitive Landscape
Financial Services
Header Horizontal
JP Morgan
Add to my slides
Remove from favorites
Slide features column charts depicting adjustments in operating profits across several business units. It includes green, red, and blue bars, some with growth indicators, and integrates real-world imagery of a building's balcony.
Financial Performance
Real Estate & Construction
Analyzes adjusted operating profit by business segment for Q1 2020 compared to Q1 2021, highlighting changes and trends in the real estate and construction industry.
Business premises, operating profit, real estate, financial analysis, construction
false
Financial Performance
Real Estate & Construction
Single Chart
Goldman Sachs
Add to my slides
Remove from favorites
The slide features a complex multi-line graph depicting the recovery of business activities across various sectors over time, with different colors representing sectors like healthcare, technology, and financial services. It tracks the year-over-year changes in business activity, indicating points of lockdown and economic reopening. The graph is detailed, with a legend explaining each color code and significant annotations about the phases of recovery, providing a comprehensive view of economic health across multiple industries.
Strategic Planning
Financial Services
This slide is essential for strategic planning as it provides a detailed view of business activity fluctuations across different sectors. It helps in assessing which sectors are recovering faster and which are lagging, guiding strategic investments and operational decisions. The clear visualization of data supports comparison and trend analysis, crucial for executives and policymakers planning for future economic scenarios. It helps in understanding the resilience of sectors like healthcare and technology compared to more vulnerable sectors during the pandemic.
business recovery, sectors, strategic planning, economic health, technology, healthcare, financial services, COVID-19
false
Strategic Planning
Financial Services
Mixed Chart
BCG
Add to my slides
Remove from favorites
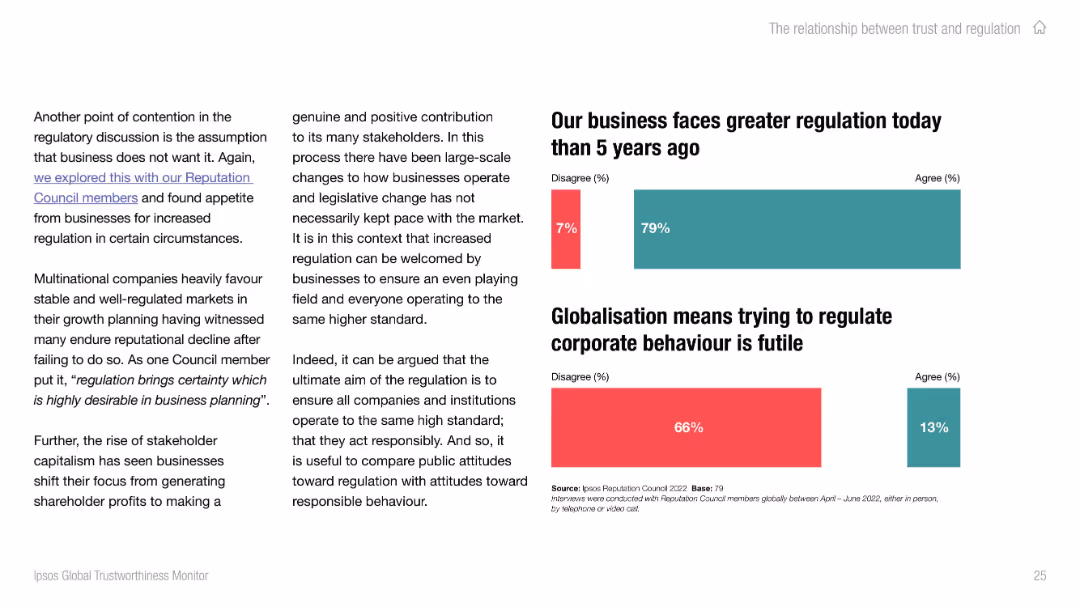
Left-aligned text with two bar charts on the right. Uses red and teal to indicate disagreement/agreement on corporate regulation perceptions. Clean, modern layout.
Strategic Planning
Professional Services
This slide discusses business sentiment around regulatory change, showing that most agree regulation has increased. It also addresses skepticism about regulating corporate behavior in a globalized world, with a majority disagreeing that it's futile.
business regulation, globalization, stakeholder, perception, corporate behavior, Ipsos
false
Strategic Planning
Professional Services
Mixed Chart
IPSOS
Add to my slides
Remove from favorites
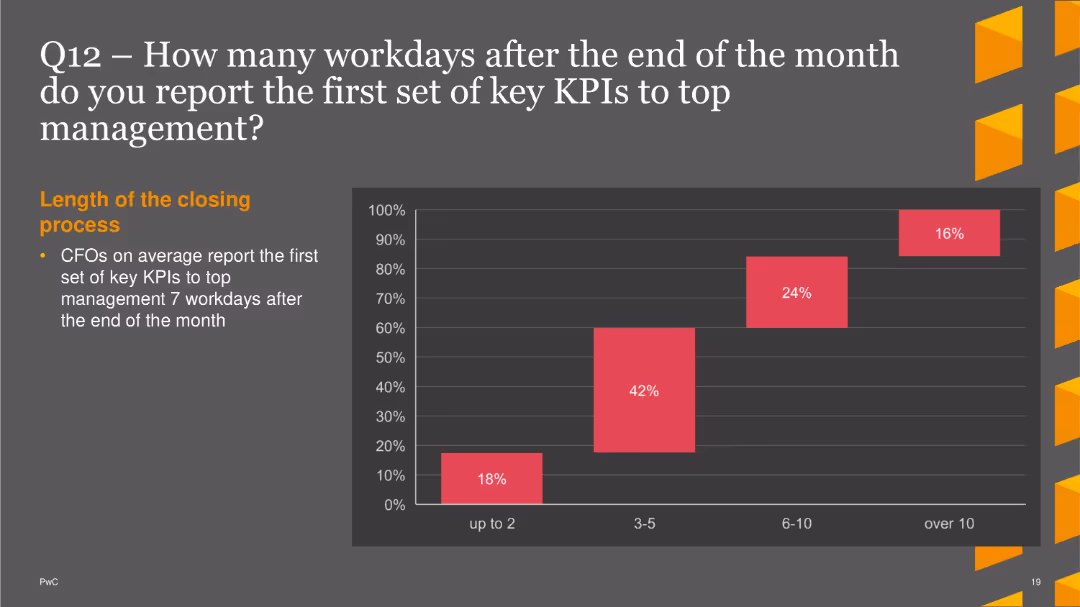
A pie chart showing the distribution of concerns related to business reporting. Different segments represent various concerns like data quality and processing
Risk Assessment and Management
Financial Services
This slide identifies the primary concerns CFOs have regarding business reporting, with a focus on manual processing and data quality issues.
business reporting, concerns, data quality, manual processing, CFO concerns
false
Risk Assessment and Management
Financial Services
Single Chart
PwC/Strategy&
Add to my slides
Remove from favorites
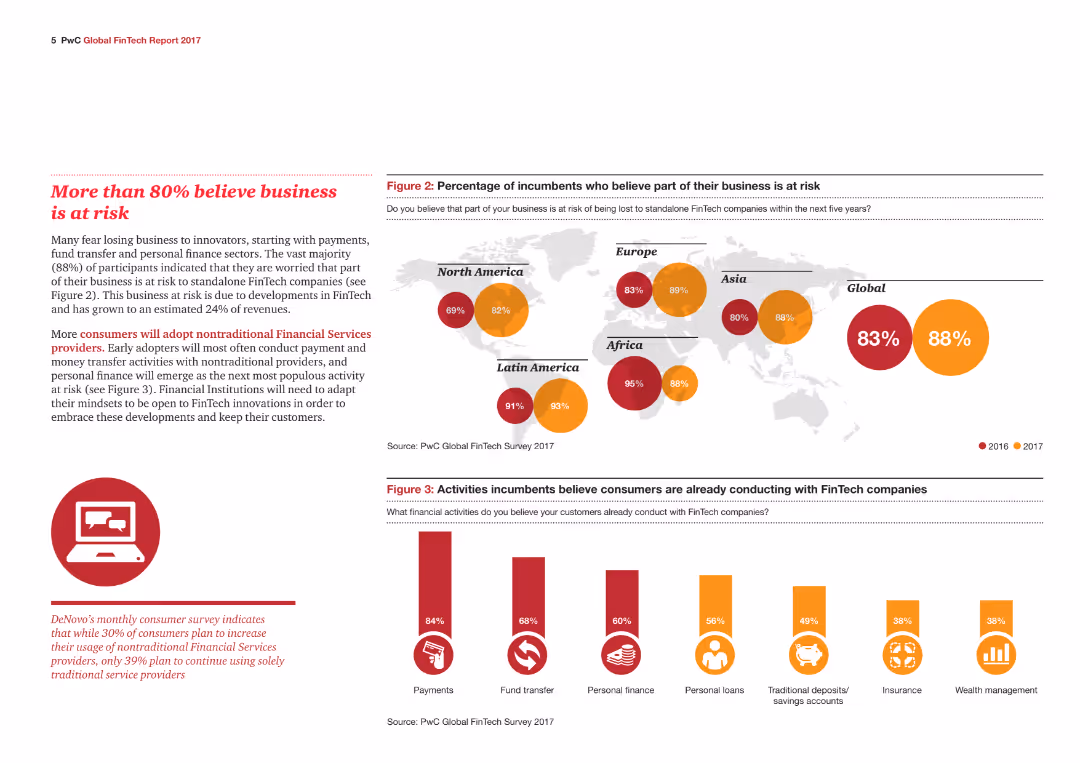
A world map highlighting regions' beliefs about business risks with percentages and a column chart showing incumbents' views on FinTech-related risks and activities.
Risk Assessment and Management
Financial Services
The slide highlights global concerns about business risks due to FinTech, supported by geographical data and incumbents' perceptions of risk.
Business risk, FinTech, Global, Incumbents, Perceptions, Activities, Concerns, Technology, Regions, Financial services
false
Risk Assessment and Management
Financial Services
Multiple Chart
PwC/Strategy&
Add to my slides
Remove from favorites
A structured list detailing various business, technology, and workforce risks associated with inadequate network infrastructure.
Risk Assessment and Management
Telecommunications
Highlights the key risks businesses face due to inadequate network infrastructure including technology failures and workforce inefficiencies.
business risks, network infrastructure, technology risks, workforce efficiency, cyber security, environmental impact
false
Risk Assessment and Management
Telecommunications
Diagram
Accenture
Add to my slides
Remove from favorites
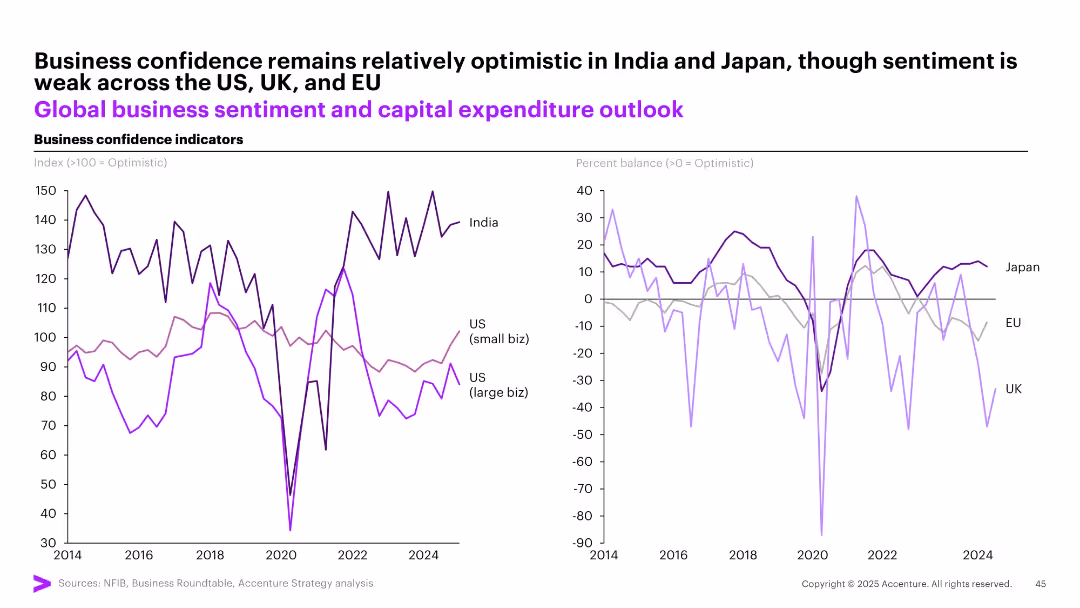
Dual-panel line chart showing business confidence (India, US small/large biz, EU, UK, Japan); left = index >100, right = percent balance
Strategic Planning
Professional Services
This slide illustrates global business sentiment trends, showing that India and Japan maintain optimistic outlooks, while the US, UK, and EU face weaker sentiment. It highlights disparity between small and large businesses in the US, with both showing different levels of capital expenditure optimism.
business sentiment, capital outlook, India, US, Japan, confidence, global economy
false
Strategic Planning
Professional Services
Multiple Chart
Accenture
Add to my slides
Remove from favorites
Slide contains multiple infographics and text blocks summarizing key survey findings about global business services.
Strategic Planning
Professional Services
Discusses the main findings from a global business services survey, focusing on cost reduction and the role of ESG in business strategy.
business services, ESG, survey findings, cost reduction, infographics
false
Strategic Planning
Professional Services
Header Horizontal
Deloitte
Add to my slides
Remove from favorites
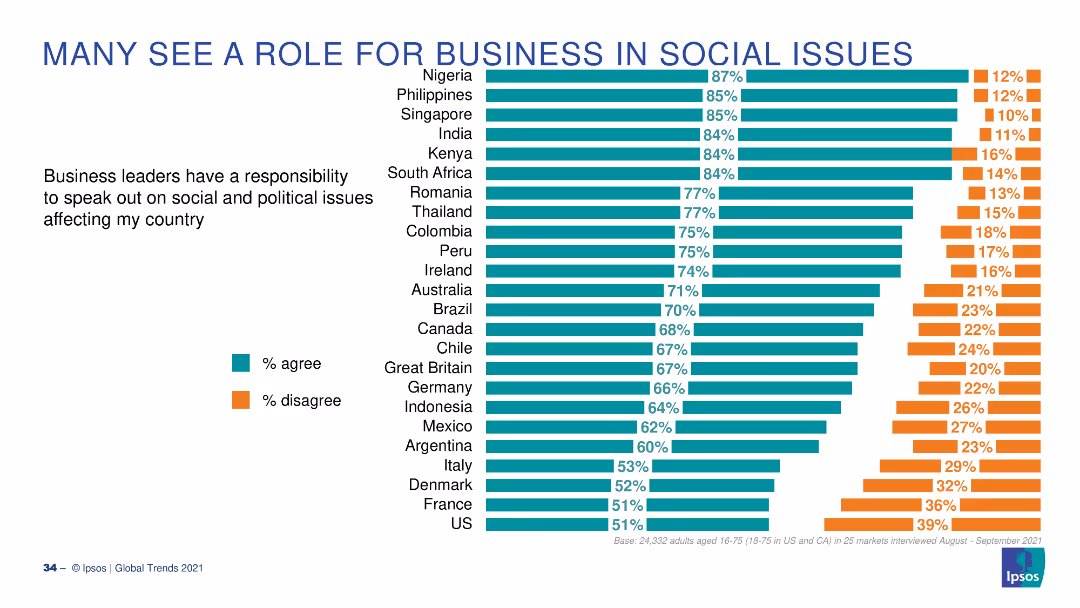
A bar chart with horizontal bars showing the percentage of people agreeing or disagreeing that business leaders should speak on social issues, across different countries.
Market Analysis and Trends
Professional Services
This slide presents survey results on whether business leaders should address social and political issues, with data from multiple countries and respondent percentages.
business, social issues, survey, opinions, global
false
Market Analysis and Trends
Professional Services
Multiple Chart
IPSOS
Add to my slides
Remove from favorites
Contains images, column charts, and textual information comparing strategies for small businesses with visual elements indicating growth and engagement.
Sales and Business Development
Financial Services
This slide is likely used to discuss strategic initiatives for engaging with small businesses, highlighting growth and client coverage.
business, strategies, growth, engagement, banking, small business, relationship management, customer insights, data
false
Sales and Business Development
Financial Services
Multiple Chart
JP Morgan
Add to my slides
Remove from favorites
Basic visual complexity, contrasting textual information with a relatable image.
Strategic Planning
Professional Services
Discusses the need for businesses to adapt to changes and disruptions, hinting at strategies for maintaining competitiveness and relevance.
business strategy, adaptability, global trends, disruptions
false
Strategic Planning
Professional Services
Mixed Chart
Bain
Add to my slides
Remove from favorites
The slide contains three key strategy blocks with associated actions, displayed in a columnar format. The content is supported by performance metrics, depicted in a clear and structured manner.
Strategic Planning
Financial Services
Outlining strategies for sustained business success, the slide discusses expanding the card member base, engaging through experiences, and creating deeper customer relationships, accompanied by goals and performance indicators.
Business Strategy, Card Members, Customer Engagement, Relationship Building, Performance Metrics
false
Strategic Planning
Financial Services
Table
JP Morgan
Add to my slides
Remove from favorites
The slide includes icons on top of headers, describing major business and economic changes due to external factors.
Strategic Planning
Professional Services
Outlines various forces like metamorphosis of demand and altered workforce, impacting business strategies and operational resilience, with a focus on adapting to post-COVID realities.
Business, Strategy, COVID-19, Resilience, Adaptation
false
Strategic Planning
Professional Services
Pillar
McKinsey
Add to my slides
Remove from favorites
Consists of a column chart showcasing planned growth strategies and a pie chart detailing ownership transition plans, set against a clear, textual backdrop.
Strategic Planning
Technology & Software
Presents strategic initiatives and ownership transition plans as pivotal components of business strategy, highlighting the directional shifts businesses may undertake to foster growth.
Business Strategy, Growth, Transition, Planning
false
Strategic Planning
Technology & Software
Multiple Chart
JP Morgan
Add to my slides
Remove from favorites
The slide utilizes a circular diagram and supporting text to depict the company's investment in relationships, people, and innovation.
Strategic Planning
Financial Services
Explores the strategic investment in business relationships, workforce development, and innovative processes for growth.
Business Strategy, Relationships, People, Execution, Innovation, Diagram, Investment, Growth
false
Strategic Planning
Financial Services
Framework
JP Morgan
Add to my slides
Remove from favorites
The slide features a diagonal line dividing it into four segments, each labeled as Turnaround, Fund, Grow, Transform, with icons and brief descriptions.
Strategic Planning
Professional Services
The slide presents a strategic shift from a save-to-grow to a save-to-transform approach in business, emphasizing different strategic phases like Turnaround, Fund, Grow, and Transform with concise definitions and implications for business strategy.
Business Strategy, Transformation, Growth, Cost Management, Stability
false
Strategic Planning
Professional Services
Vertical Flow
Deloitte
Add to my slides
Remove from favorites
This slide presents two side-by-side bar charts showing the top ten business threats for 2018 and 2019, with percentage values. The design is clean with contrasting colors for different years.
Risk Assessment and Management
Financial Services
It identifies top concerns for businesses globally, comparing year-over-year changes in threat perception, useful for risk management and strategic decision-making.
business threats, risk management, year-over-year comparison, strategic planning, CEO concerns, global survey, perception change.
false
Risk Assessment and Management
Financial Services
Multiple Chart
PwC/Strategy&
Add to my slides
Remove from favorites
Features a diagram showing three phases of business model transformation over time, labeled "Explore & Shape," "Attract & Win," and "Scale Fast & Keep Growing."
Strategic Planning
Environmental Services & Sustainability
This slide outlines a three-phase process for transitioning to a new business model focused on sustainability and circular economy principles. Useful for strategic planning sessions focusing on long-term business transformations towards sustainability.
Business transformation, Sustainability, Circular economy, Strategic planning, Phases, New business model, Growth, Scalability, Partnership development, Innovation
false
Strategic Planning
Environmental Services & Sustainability
Linear Flow
Accenture
Add to my slides
Remove from favorites
Horizontal phase timeline with four sections marked by year ranges, showing evolution of Morgan Stanley's business. Each phase includes a brief descriptor and financial figures. Predominant use of blue and white color scheme.
Strategic Planning
Financial Services
Shows the strategic transformation of Morgan Stanley's wealth management over different phases marked by key milestones.
Business transformation, wealth management, strategic phases, Morgan Stanley, growth, technology integration
false
Strategic Planning
Financial Services
Linear Flow
Goldman Sachs
Add to my slides
Remove from favorites
Contains bar charts and graphics explaining the future of business travel and its operational changes.
Strategic Planning
Transportation & Logistics
Discusses the evolving nature of business travel, advocating for flexibility and hybrid work models as key factors in future planning.
business travel, hybrid work, operational change, flexibility, travel management, future planning
false
Strategic Planning
Transportation & Logistics
Vertical Flow
BCG
Add to my slides
Remove from favorites
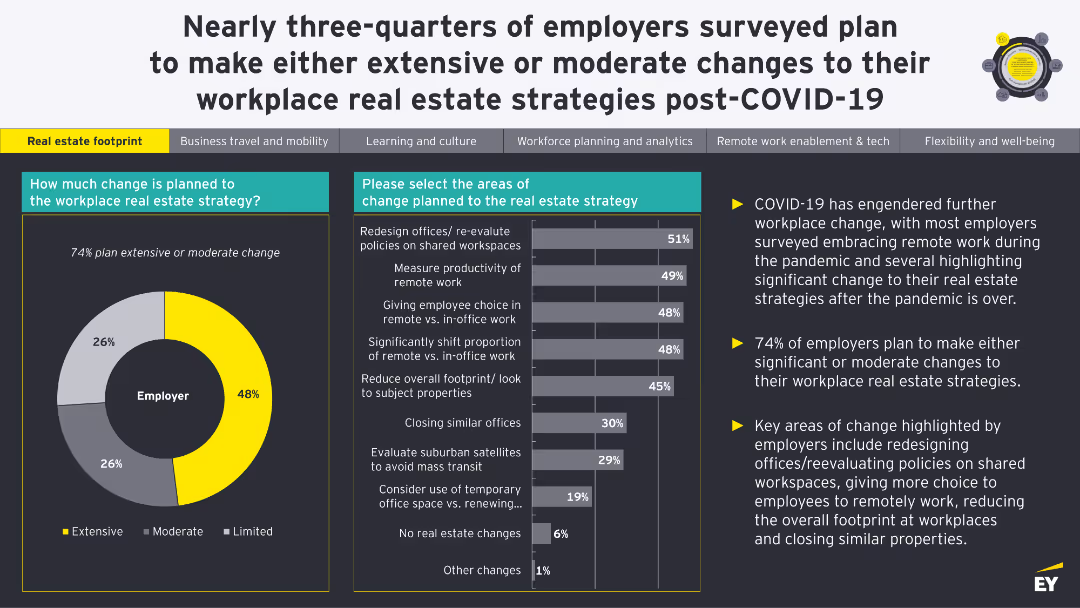
The slide includes bar charts and pie charts depicting changes in business travel and mobility plans post-COVID-19, highlighting employee preferences and employer strategies.
Market Analysis and Trends
Transportation & Logistics
The slide focuses on changes in business travel and mobility post-COVID-19, showing how employee travel frequency and preferences have shifted, and detailing employer plans to adapt to these changes.
business travel, mobility, COVID-19, changes, strategies
false
Market Analysis and Trends
Transportation & Logistics
Multiple Chart
EY
Add to my slides
Remove from favorites
This slide features a pie chart and a bar chart. The pie chart displays preferences for business travel levels post-COVID-19. The bar chart shows preferences for business travel processes.
Market Analysis and Trends
Professional Services
Describes employee preferences for business travel after COVID-19, including types of travel desired and preferences for internal and external travel events.
Business travel, Post-pandemic, Preferences, Internal travel, External events, Employee survey
false
Market Analysis and Trends
Professional Services
Multiple Chart
EY
Add to my slides
Remove from favorites
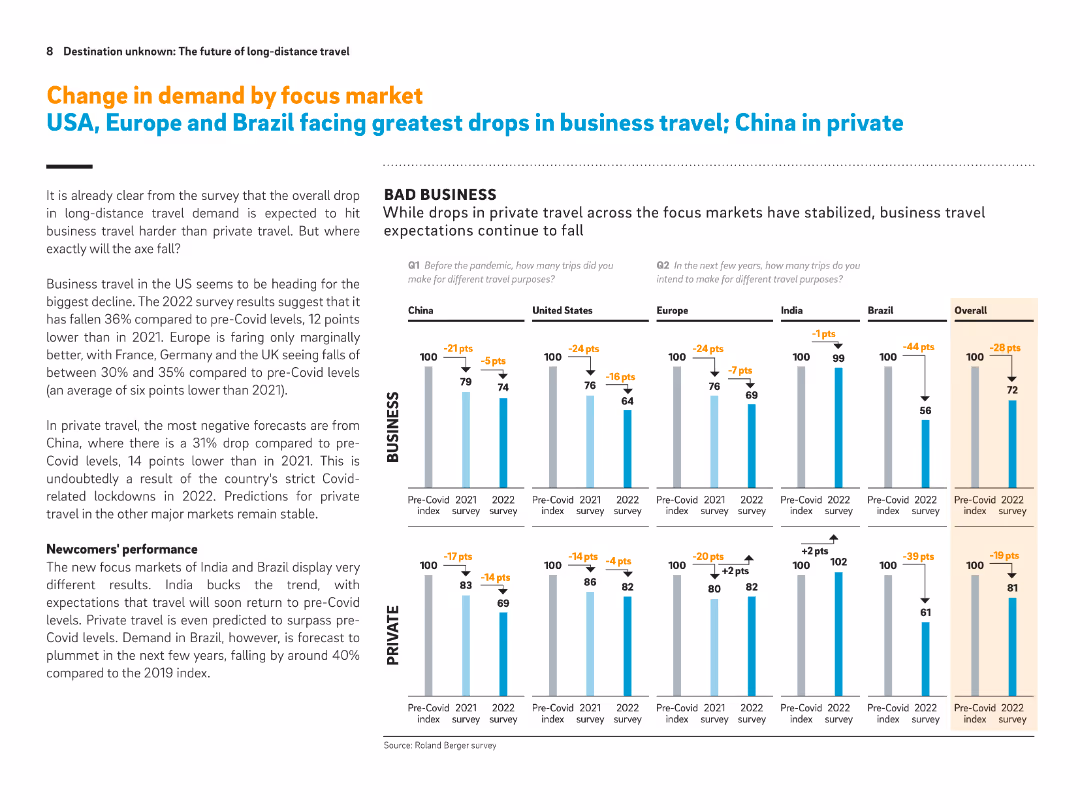
Multiple comparative bar charts for six regions (China, US, Europe, etc.). Focused on business vs. private travel drops.
Market Analysis and Trends
Transportation & Logistics
Business travel demand is falling across all markets, with the US and Brazil showing the steepest declines. Private travel is somewhat more stable, though China shows the largest drop in this category. India and Europe show resilience or improvement.
Business travel, private travel, regional differences, post-Covid demand, long-distance travel, China, Brazil, US, India
false
Market Analysis and Trends
Transportation & Logistics
Multiple Chart
Roland Berger
Add to my slides
Remove from favorites
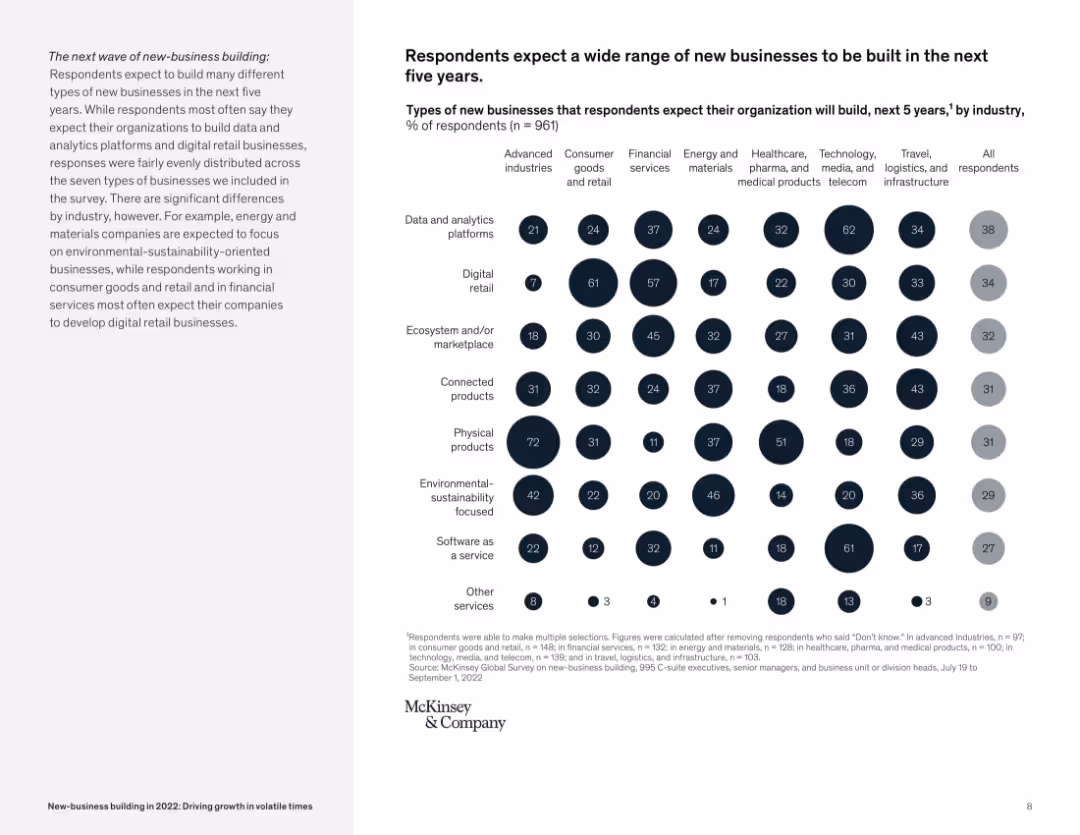
Bubble matrix comparing business types and industry expectations; clean layout, grayscale + highlight tones.
Market Analysis and Trends
Professional Services
The slide displays expected types of new businesses by industry, with categories like physical products, connected products, and digital retail. It highlights the wide variety of innovation areas organizations plan to invest in.
business types, industry forecast, digital platforms, innovation, connected products, new-business
false
Market Analysis and Trends
Professional Services
Mixed Chart
McKinsey
Add to my slides
Remove from favorites
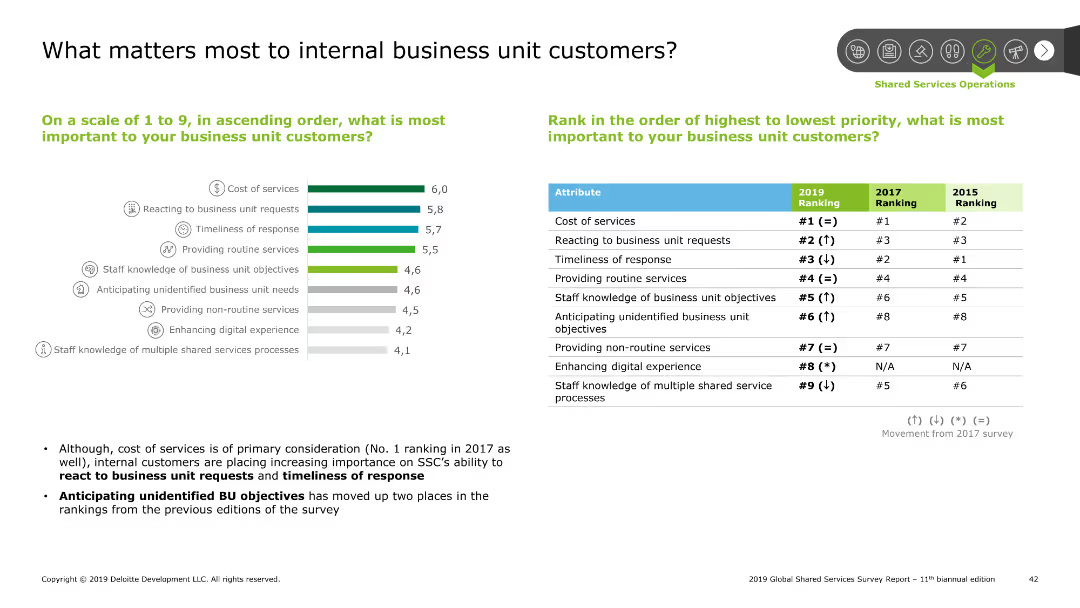
The slide features a combination of a column chart and a table. The column chart ranks importance factors for business unit customers, and the table shows rankings by year.
Customer and Market Segmentation
Professional Services
This slide identifies and ranks the factors most important to internal business unit customers, including cost of services and responsiveness, based on survey results.
Business unit customers, importance factors, ranking, survey
false
Customer and Market Segmentation
Professional Services
Mixed Chart
Deloitte
Add to my slides
Remove from favorites
Contains sections with icons and brief descriptions of various business units. Design is clean, using a blue and white color scheme.
Product and Service Analysis
Technology & Software
Provides an overview of different business units and their products, highlighting data assets across sectors. Useful for internal company presentations or product portfolio reviews.
business units, product overview, data assets, market segmentation
false
Product and Service Analysis
Technology & Software
Pillar
Barclays
Add to my slides
Remove from favorites
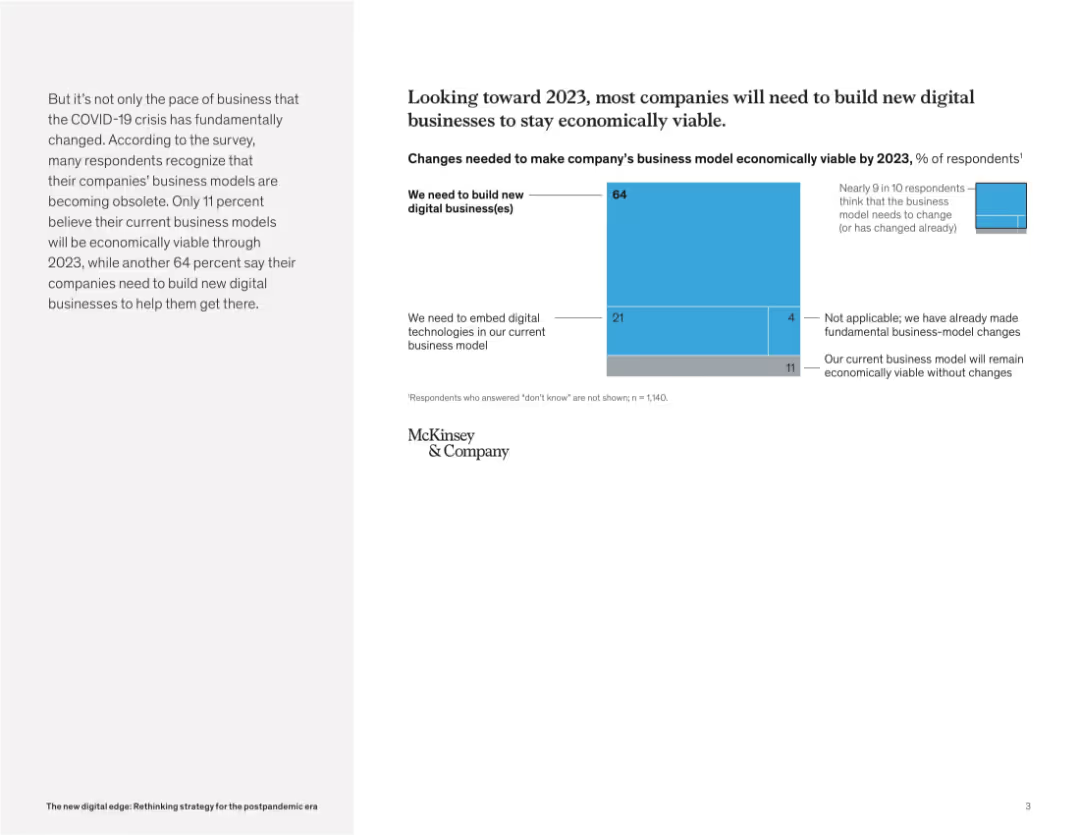
Simple layout with a stacked bar chart showing response breakdown. Left-aligned narrative block highlights survey insights.
Strategic Planning
Technology & Software
This slide shows that 64% of companies expect to build new digital businesses by 2023 to remain viable. Only 11% believe their current model is sustainable. It emphasizes the urgency for innovation and digital reinvention.
business viability, digital transformation, strategic change, digital model, innovation need, post-COVID recovery, McKinsey insights
false
Strategic Planning
Technology & Software
Mixed Chart
McKinsey
Add to my slides
Remove from favorites
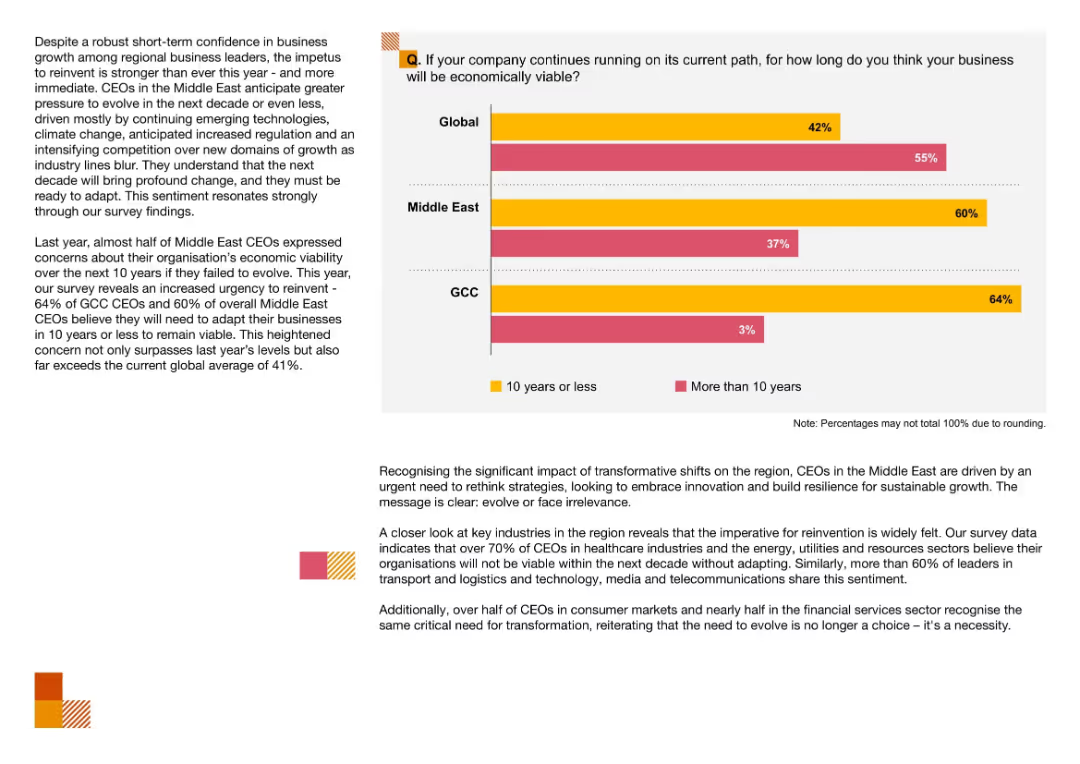
Horizontal bar chart for Global, Middle East, and GCC comparing viability for 10 years or less vs. more than 10 years; surrounded by analysis and trend interpretation
Strategic Planning
Financial Services
This slide highlights growing urgency among Middle East and GCC CEOs to evolve or risk economic irrelevance, with over 60% anticipating their business models must adapt within 10 years to remain viable.
Business Viability, Strategic Planning, Reinvention, Middle East, GCC, CEO Concerns, Economic Risk
false
Strategic Planning
Financial Services
Mixed Chart
PwC/Strategy&
Add to my slides
Remove from favorites
Line chart showing the evolution of business volumes per employee and per branch from 2008 to 2023. Purple and grey color scheme with clear markers for each year.
Market Analysis and Trends
Financial Services
Tracks the growth of business volumes per employee and branch over 15 years, highlighting significant increases in recent years.
business volumes, growth, employee, branch, evolution
false
Market Analysis and Trends
Financial Services
Multiple Chart
Kearney
Add to my slides
Remove from favorites
The slide includes a line chart with a single dark blue line representing the price of Butadiene in Europe from 2016 to 2023. The design is straightforward with vertical gridlines and a clear indication of the time scale.
Market Analysis and Trends
Industrial & Manufacturing
Presenting the historical price data for Butadiene in Europe, this line chart is likely used to analyze the impact of raw material costs on production or to forecast future price movements. It could be particularly relevant to companies in the synthetic rubber or plastics manufacturing sectors.
Butadiene, price history, Europe, line chart
false
Market Analysis and Trends
Industrial & Manufacturing
Single Chart
Morgan Stanley
Add to my slides
Remove from favorites
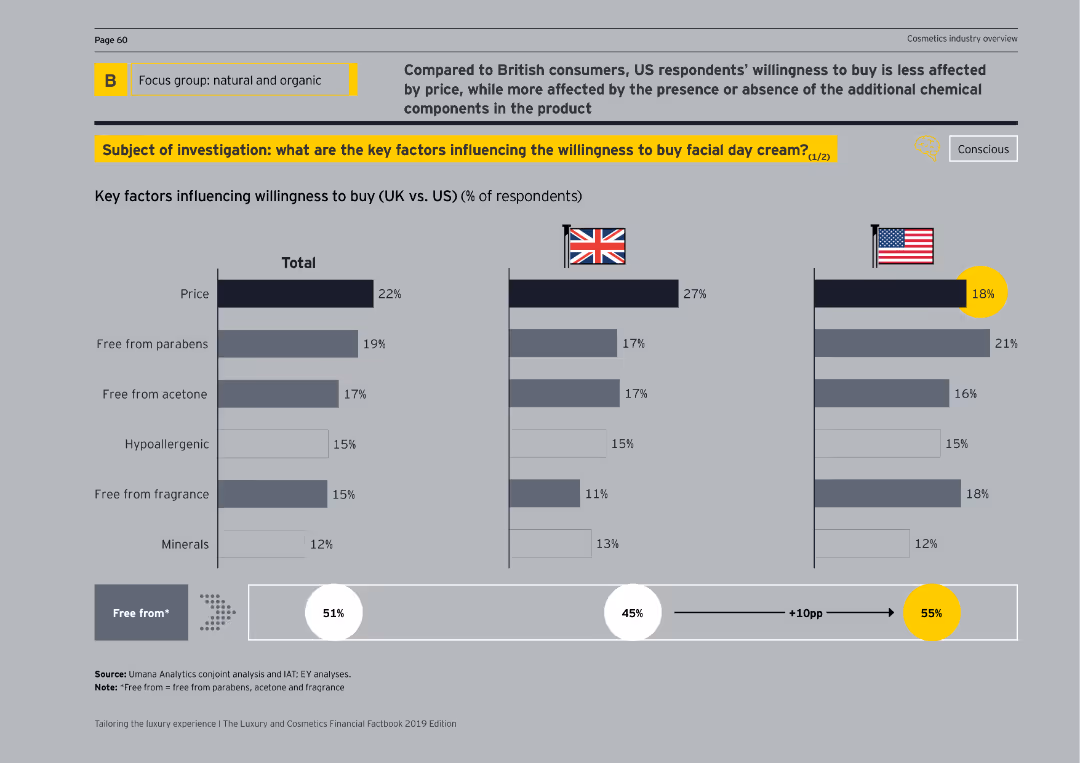
This slide includes a bar chart comparing key factors influencing the willingness to buy facial day cream between UK and US respondents.
Customer and Market Segmentation
Consumer Goods
The slide examines factors like price, parabens-free, acetone-free, and hypoallergenic qualities affecting the willingness to buy facial day creams among UK and US consumers.
buying factors, UK, US, facial creams, comparison
false
Customer and Market Segmentation
Consumer Goods
Multiple Chart
EY
Add to my slides
Remove from favorites
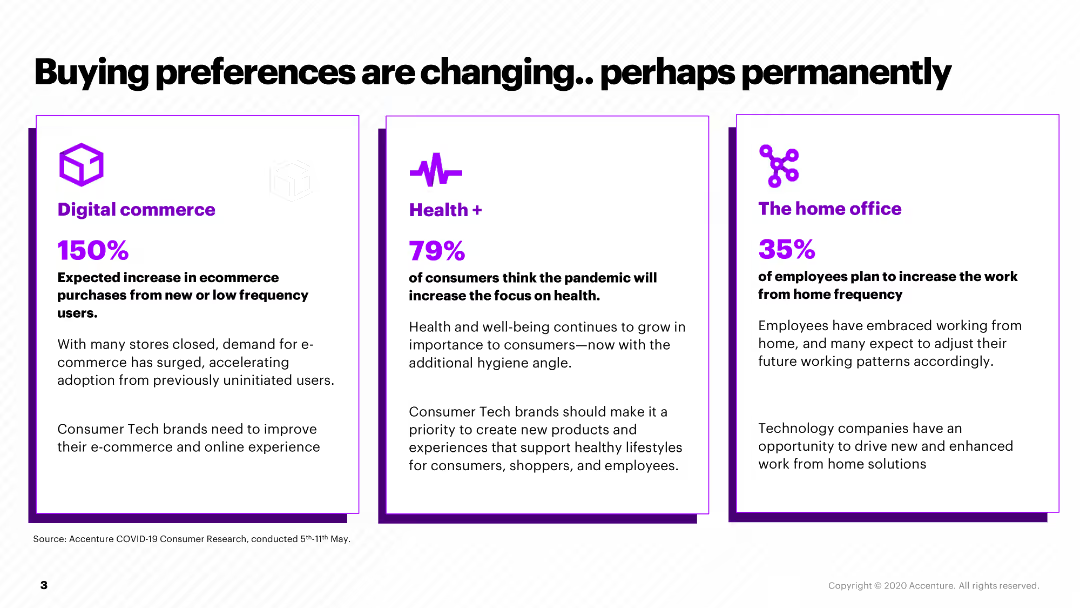
This slide presents three sections comparing changes in consumer preferences: Digital commerce, Health, and Home office, each with a percentage and brief description.
Market Analysis and Trends
Retail & E-commerce
It outlines how consumer buying preferences have shifted due to the pandemic, with increases in digital commerce, health focus, and remote work, suggesting strategic areas for companies to address.
buying preferences, digital commerce, health, home office, pandemic impact
false
Market Analysis and Trends
Retail & E-commerce
Pillar
Accenture
Add to my slides
Remove from favorites
A quadrant scatter plot categorizes technologies and services based on their market positioning before and after signing contracts. Dots represent companies; color indicates service or goods focus.
Risk Assessment and Management
Technology & Software
Evaluates the challenges in purchasing services versus goods, illustrating the technology landscape's division into pre and post-contract signing phases, focusing on areas like risk and contract management.
Buying, Services, Challenges, Technology, Market
false
Risk Assessment and Management
Technology & Software
Single Chart
Kearney
Add to my slides
Remove from favorites
This slide presents a bar chart titled "Global buyout-backed exit value", showing a downward trend in exits via IPOs, and Sponsor to Sponsor or Strategic channels. The years span from 2005 to 2022, with a significant drop marked in red for 2022 at "$565B".
Market Analysis and Trends
Financial Services
This slide portrays a sharp decrease in the value of buyout-backed exits, crucial for discussing the implications on return strategies and the broader exit environment within the private equity sector.
Buyout-Backed Exits, IPO, Decrease, Strategic Exits, Private Equity, Valuation, Trend Analysis
false
Market Analysis and Trends
Financial Services
Multiple Chart
Bain
Add to my slides
Remove from favorites
The slide presents a bar chart titled "Distribution of buyout funds closed by fundraising success, time and target achievement", comparing percentages from 2017 to 2022 with various shades of gray indicating the time taken to close funds and whether they met their targets.
Investment Analysis
Financial Services
Analyzes the real success rate of buyout funds closing relative to targets and timeframes, valuable for investors' expectations and market realities' assessment.
Buyout Funds, Fundraising Success, Targets, Timeframes, Investment, Market Reality
false
Investment Analysis
Financial Services
Single Chart
Bain
Add to my slides
Remove from favorites
A bar chart with overlaid line graph titled "Global buyout fund capital contributions and distributions". It contrasts contributions and distributions from 2005 to Q3 22, with a red line indicating net cash flows. There's a notable shift towards negative net cash flows in the recent quarter.
Investment Analysis
Financial Services
Highlights the trends in capital contributions versus distributions to Limited Partners (LPs) in global buyout funds, key for analyzing fund performance, investor returns, and market health.
Buyout Funds, LPs, Capital Contributions, Distributions, Cash Flows, Fund Performance
false
Investment Analysis
Financial Services
Single Chart
Bain
Add to my slides
Remove from favorites
A bubble chart similar to the previous slide but focused on 'Buy' versus 'Build' strategies. It compares the CARG and growth rates of various IT services, with bubbles sized by market impact.
Strategic Planning
Technology & Software
The slide compares the 'Buy' and 'Build' approaches in IT services, showing growth trends and CARG for different service categories, helping organizations decide on strategic investment directions.
Buy vs Build, IT Services, Growth Rates, Strategic Planning, Market Impact
false
Strategic Planning
Technology & Software
Single Chart
Gartner
Add to my slides
Remove from favorites
The slide presents a column chart showing CO2 avoided and the avoidance cost for various train types, emphasizing the chlorine industry's by-product H2.
Risk Assessment and Management
Industrial & Manufacturing
The slide analyzes the cost-effectiveness of using by-product hydrogen from the chlorine industry for trains, highlighting the cheapest CO2 avoidance cost compared to other methods.
by-product hydrogen, chlorine industry, CO2 avoidance, cost analysis, trains
false
Risk Assessment and Management
Industrial & Manufacturing
Multiple Chart
Kearney
Add to my slides
Remove from favorites
The slide includes a column chart showing daily crew rates for vessels carrying domestic cargoes, comparing internationally and Australian flagged vessels before and after the Coastal Trading Act 2012.
Regulatory and Compliance
Transportation & Logistics
It examines how cabotage regulations have increased coastal shipping costs for the cement industry in Australia, comparing costs before and after the Coastal Trading Act 2012 and highlighting cost implications.
cabotage, coastal shipping, cement industry, Australia, Coastal Trading Act
false
Regulatory and Compliance
Transportation & Logistics
Mixed Chart
LEK
Add to my slides
Remove from favorites
The slide includes line graphs comparing CAC vs CO2 emissions from electricity generation for FCEV and BEV under different scenarios.
Regulatory and Compliance
Energy & Utilities
The slide analyzes the carbon abatement cost and CO2 emissions for fuel cell electric vehicles and battery electric vehicles, considering the impact of grid emissions on savings.
CAC, CO2, FCEV, BEV, emissions, savings
false
Regulatory and Compliance
Energy & Utilities
Mixed Chart
Kearney
Add to my slides
Remove from favorites
The slide has two pie charts illustrating the distribution of CA Directors reporting directly to the CEO versus those not on ExCo. It includes textual explanations and quotes in a two-column format with highlighted statements in blue.
Organizational Structure and Change
Professional Services
This slide explains the reporting structure of Corporate Affairs Directors, highlighting the role of Chief Officers and emphasizing the strategic importance of these positions within the company.
CA Directors, CEO reporting, Corporate Affairs, Governance, ExCo
false
Organizational Structure and Change
Professional Services
Multiple Chart
Deloitte
Add to my slides
Remove from favorites
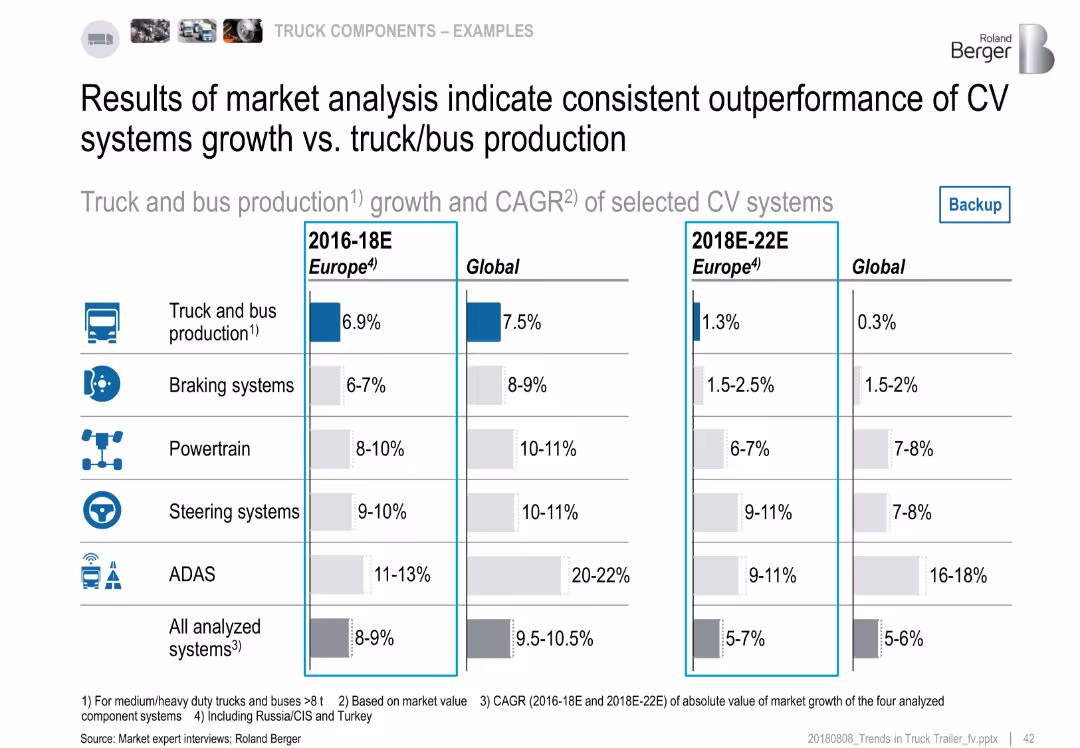
Split panel layout comparing CAGR (2016–18E and 2018E–22E) for Europe and Global in CV components and truck production
Market Analysis and Trends
Industrial & Manufacturing
This backup slide provides detailed CAGR estimates for two time periods, confirming that CV systems consistently outperform truck/bus production growth. ADAS shows the highest increase globally, while steering and powertrain components follow. The analysis is segmented by Europe and Global figures.
CAGR, CV growth, truck production, ADAS, Europe, global, forecasting
false
Market Analysis and Trends
Industrial & Manufacturing
Multiple Chart
Roland Berger
Add to my slides
Remove from favorites
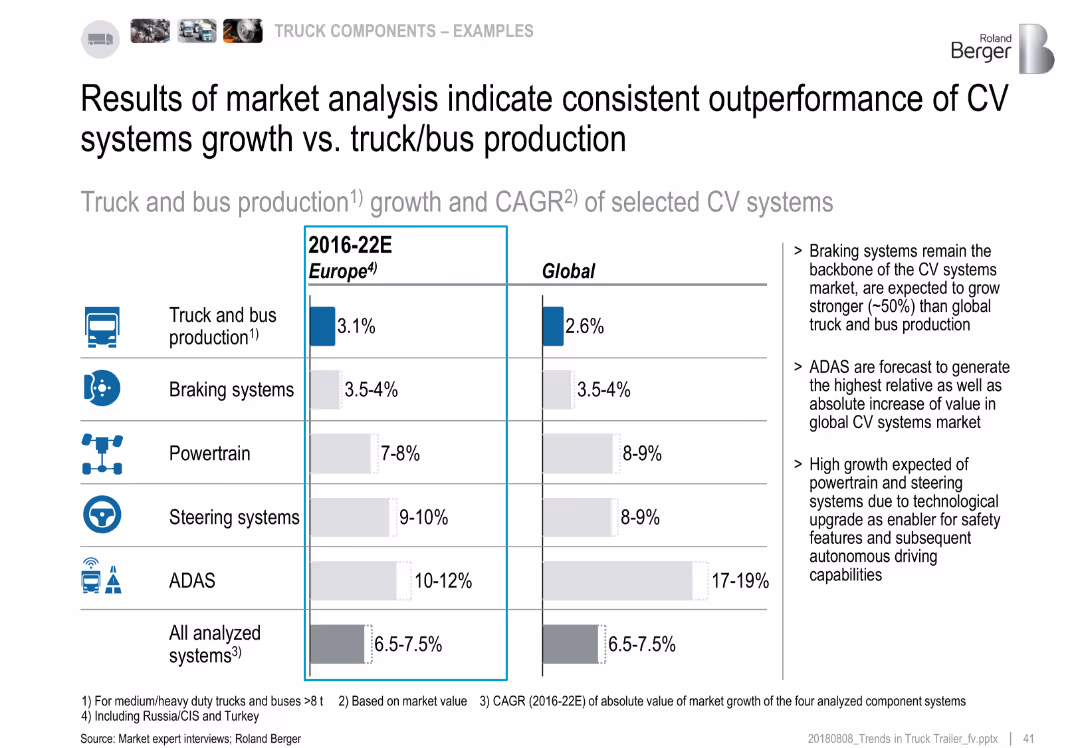
Comparative bar chart showing CAGR (2016–22E) for Europe and Global markets across truck production and CV systems
Market Analysis and Trends
Industrial & Manufacturing
The slide shows that CV system components (brakes, powertrain, steering, ADAS) are growing faster than truck and bus production globally and in Europe. ADAS leads in growth, followed by steering and powertrain. The insights point to technological innovation as a driver of value increase.
CAGR, CV systems, market growth, truck production, ADAS, Europe, global, steering
false
Market Analysis and Trends
Industrial & Manufacturing
Multiple Chart
Roland Berger
Add to my slides
Remove from favorites
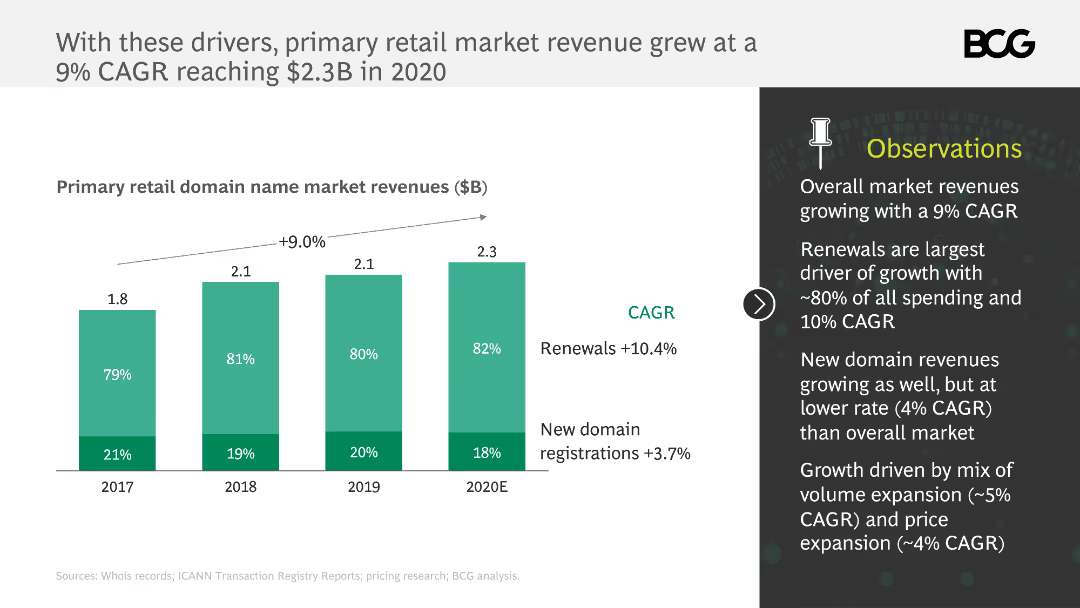
The slide contains a column chart depicting primary retail domain name market revenues from 2017 to 2020E, with a trend line showing a 9% CAGR. Observations are listed on the right.
Market Analysis and Trends
Retail & E-commerce
The slide highlights the growth in the primary retail market revenue, driven by renewals and new domain registrations. It explains the contribution of each factor to the overall market.
CAGR, domain, retail, revenue, renewals, growth, market
false
Market Analysis and Trends
Retail & E-commerce
Mixed Chart
BCG
Add to my slides
Remove from favorites
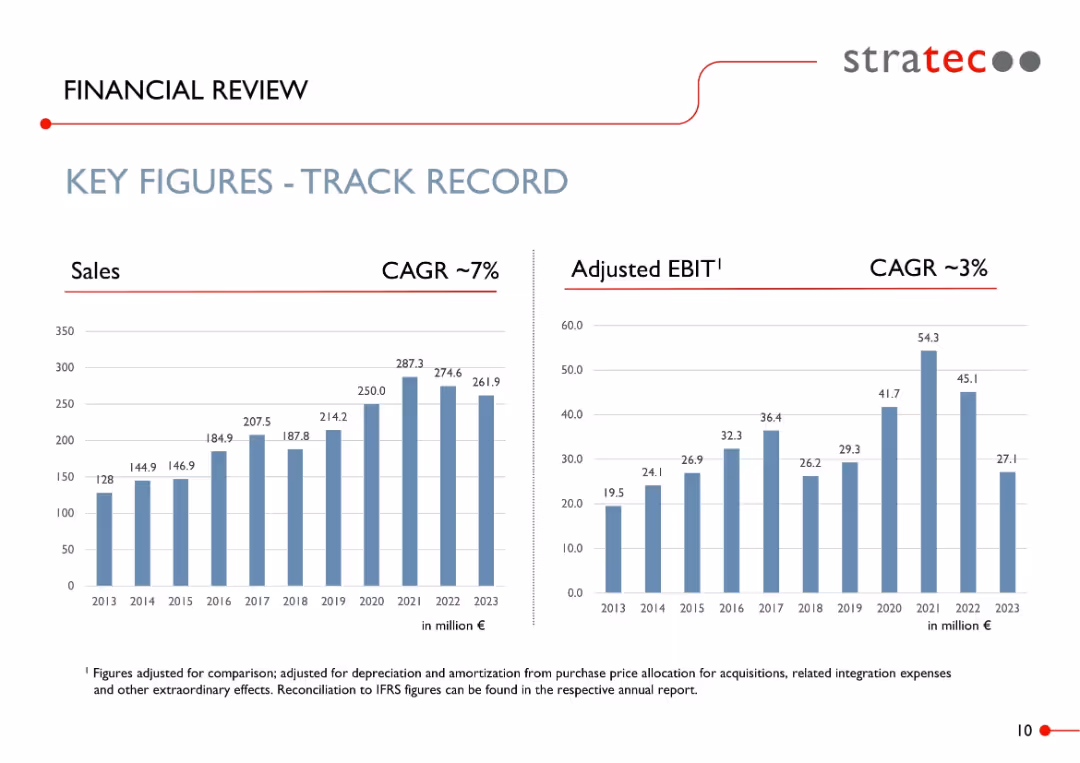
Two-panel bar chart layout: left for sales (CAGR ~7%), right for adjusted EBIT (CAGR ~3%); clean and minimalistic.
Financial Performance
Healthcare & Pharmaceuticals
Presents STRATEC’s historical performance from 2013–2023, showing steady growth in sales and a more modest increase in EBIT. CAGR highlights overall business expansion. Figures are adjusted for comparability and extraordinary effects.
CAGR, EBIT, sales growth, financial performance, diagnostics, STRATEC, revenue trend, adjusted figures
false
Financial Performance
Healthcare & Pharmaceuticals
Multiple Chart
Goldman Sachs
Add to my slides
Remove from favorites
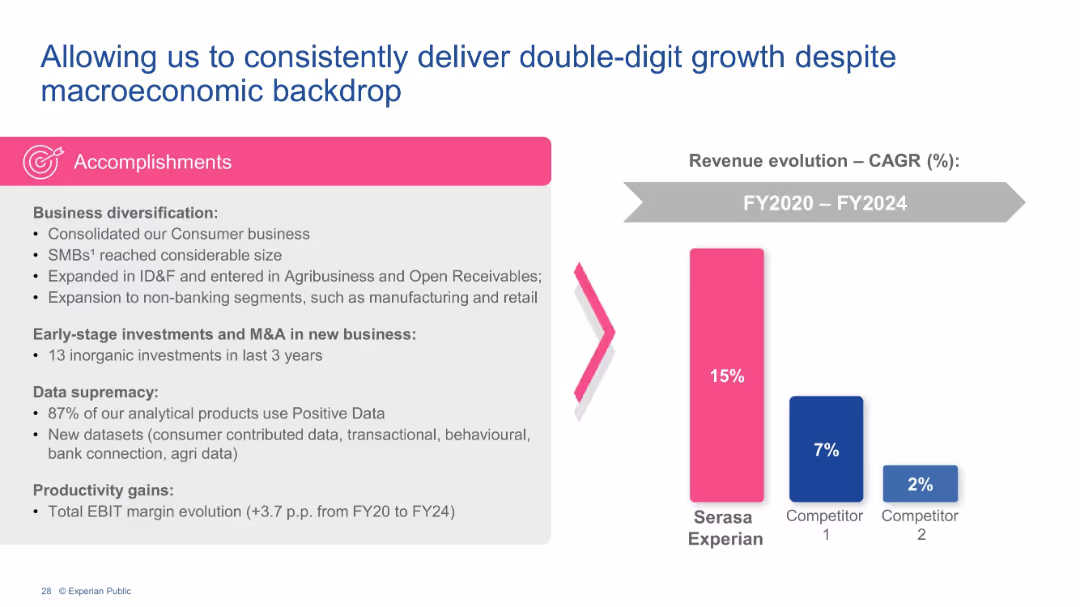
Two-column layout with business diversification text and a vertical bar chart comparing CAGR of Experian vs competitors.
Strategic Planning
Financial Services
Emphasizes Experian’s consistent double-digit revenue growth (15% CAGR FY20–FY24) versus competitors. Cites diversification, SMB growth, non-banking expansion, M&A, and use of Positive Data as key drivers.
CAGR, Experian, revenue growth, diversification, SMB, data analytics, M&A, macroeconomics
false
Strategic Planning
Financial Services
Mixed Chart
Barclays
Add to my slides
Remove from favorites
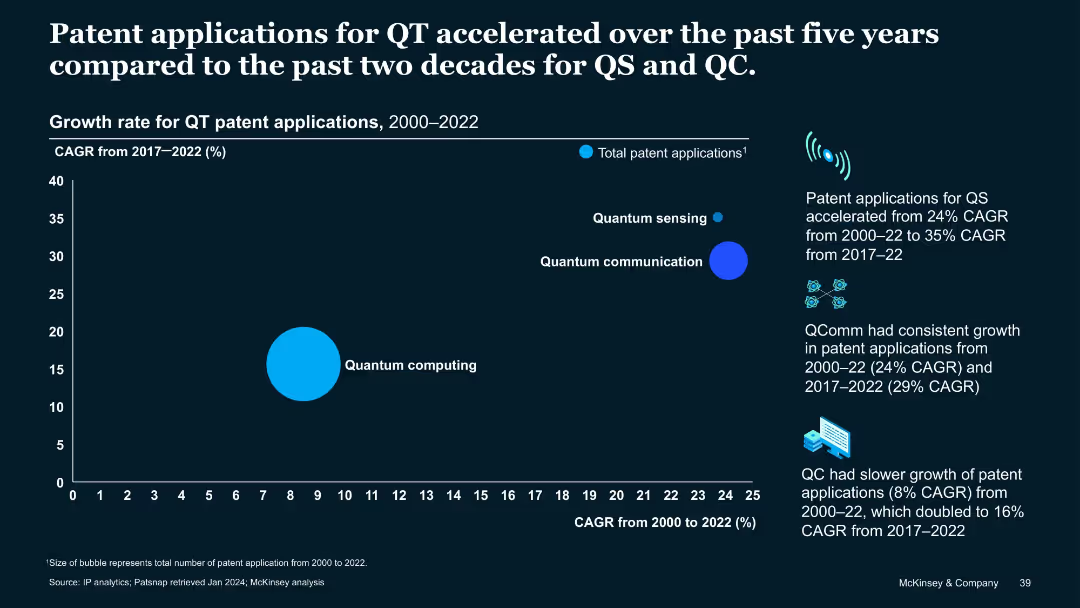
Bubble chart comparing CAGR of QT patent apps in QS, QC, QComm over 2000–2022 and 2017–2022 periods.
Performance Metrics and KPIs
Technology & Software
Visualizes how QT patent application growth accelerated from 2017–2022, especially in QS (35%) and QComm (29%). QC had slower historical growth but doubled in the last five years. Demonstrates growing momentum in quantum technology subfields.
CAGR, growth rate, quantum sensing, quantum communication, QC, patent growth, acceleration
false
Performance Metrics and KPIs
Technology & Software
Mixed Chart
McKinsey
Add to my slides
Remove from favorites
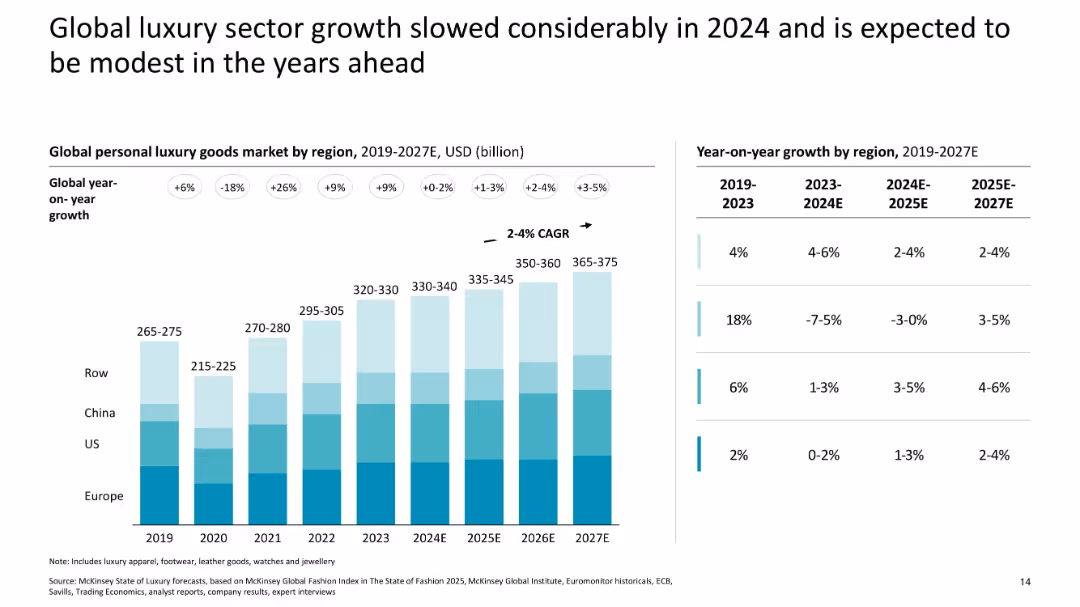
Stacked bar chart with YoY growth by region; table with forecasts
Market Analysis and Trends
Consumer Goods
This slide indicates a slowdown in global luxury growth for 2024 and modest projections through 2027, with significant regional variation, especially a dip and rebound in China.
CAGR, growth slowdown, forecast, China, US, Europe, market size, region
false
Market Analysis and Trends
Consumer Goods
Mixed Chart
McKinsey
Add to my slides
Remove from favorites
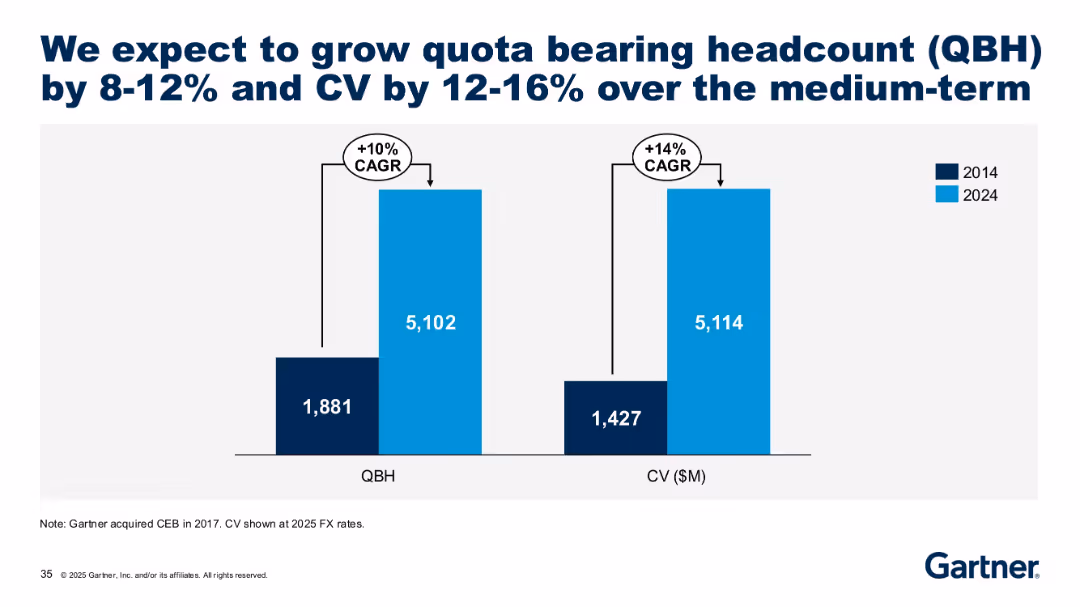
Two vertical bar charts comparing 2014 vs 2024 QBH and CV levels with CAGR bubbles.
Performance Metrics and KPIs
Professional Services
Gartner shows strong historical growth in quota-bearing headcount (QBH) and contract value (CV), with projected CAGRs of 10% and 14%, respectively, from 2014 to 2024. This indicates consistent expansion of its sales force and impact.
CAGR, headcount, CV growth, sales force, medium-term, 2024 projection, KPIs, performance, Gartner
false
Performance Metrics and KPIs
Professional Services
Single Chart
Gartner
Add to my slides
Remove from favorites
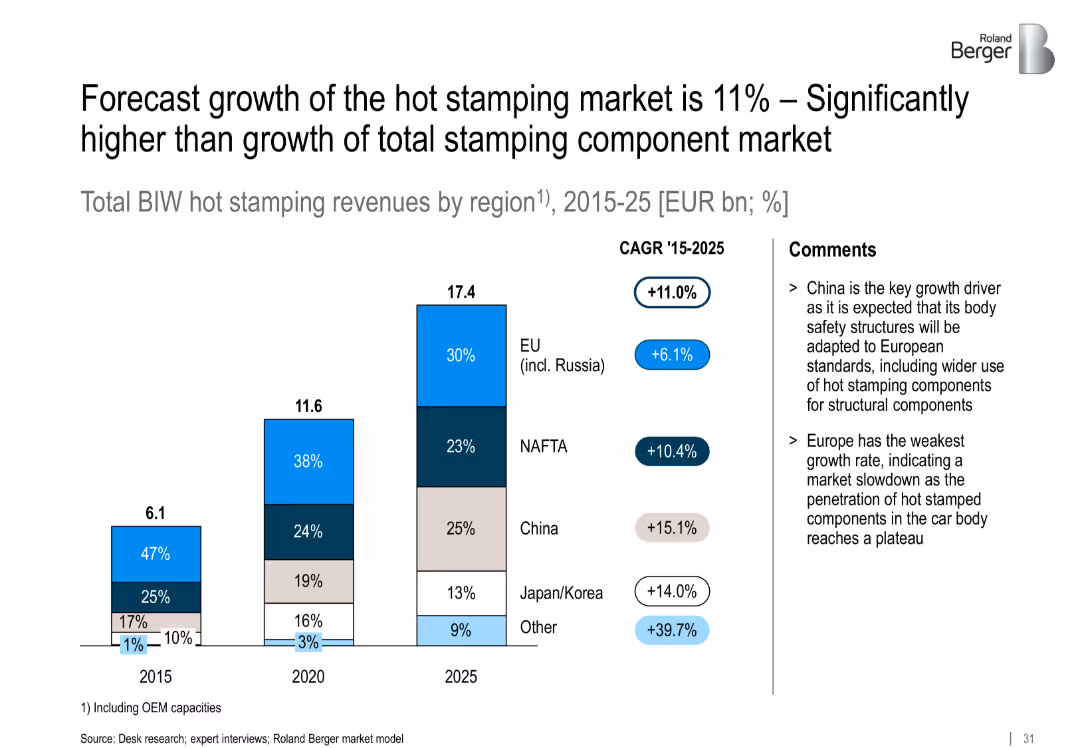
Stacked vertical bar charts (2015, 2020, 2025) comparing regional revenue contributions to hot stamping market. CAGR figures appear alongside a right-side comment box.
Market Analysis and Trends
Industrial & Manufacturing
This slide shows regional CAGR differences in hot stamping adoption. China and Other markets lead in growth, while Europe lags. Hot stamping is becoming essential in body safety designs globally.
CAGR, hot stamping, automotive regions, revenue growth, structural parts, OEM
false
Market Analysis and Trends
Industrial & Manufacturing
Pillar
Roland Berger
Add to my slides
Remove from favorites
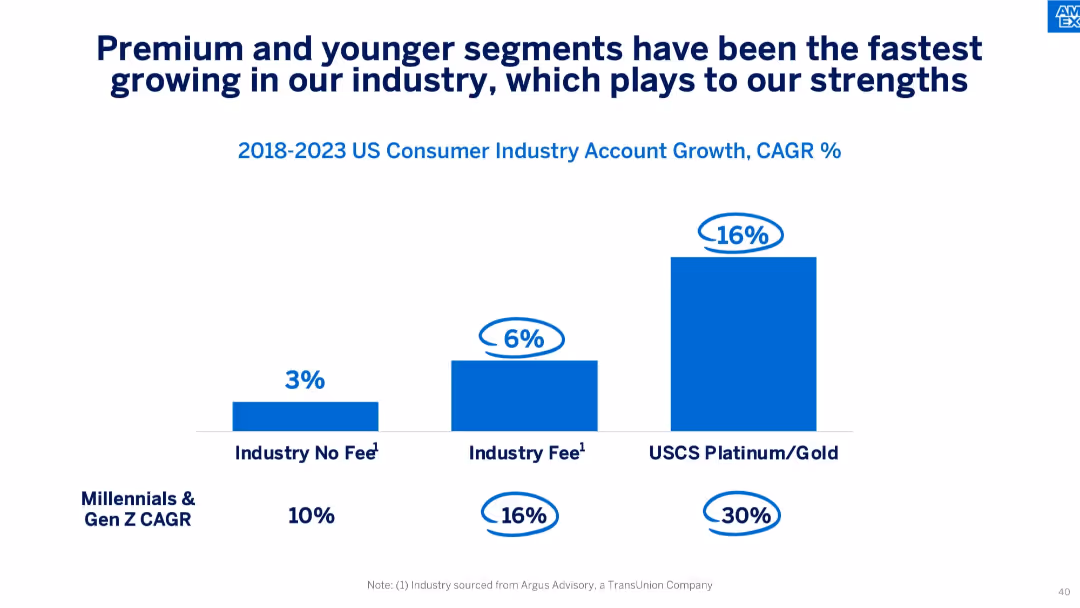
A clean slide with a large title at the top, a subtitle indicating data coverage, and a horizontal bar chart with three blue bars representing CAGR data for different segments. Emphasis is placed using circled growth percentages.
Market Analysis and Trends
Financial Services
This slide shows account growth from 2018 to 2023 across three consumer industry segments, highlighting faster growth in premium and younger segments like Millennials and Gen Z. It positions these trends as aligned with the company's strengths, especially in premium products.
CAGR, Millennials, Gen Z, Platinum/Gold, growth segments, premium, fee-based, account growth, US market, financial trends
false
Market Analysis and Trends
Financial Services
Single Chart
McKinsey
Add to my slides
Remove from favorites
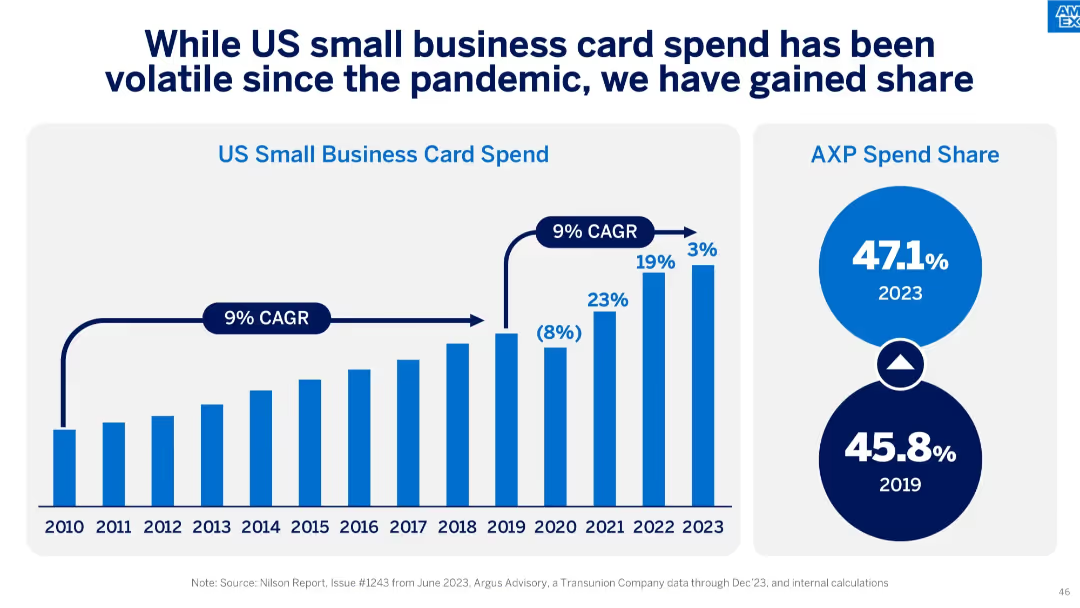
Left side features a vertical bar chart showing US small business card spend (2010–2023), while the right side includes two circular infographics showing AXP spend share for 2019 and 2023.
Financial Performance
Financial Services
The slide outlines the US small business card spending trend and highlights American Express’ increasing share, rising from 45.8% in 2019 to 47.1% in 2023, despite pandemic-related volatility.
CAGR, small business, card spend, AXP, market share, volatility, growth, pandemic impact, Nilson Report
false
Financial Performance
Financial Services
Single Chart
McKinsey
Add to my slides
Remove from favorites
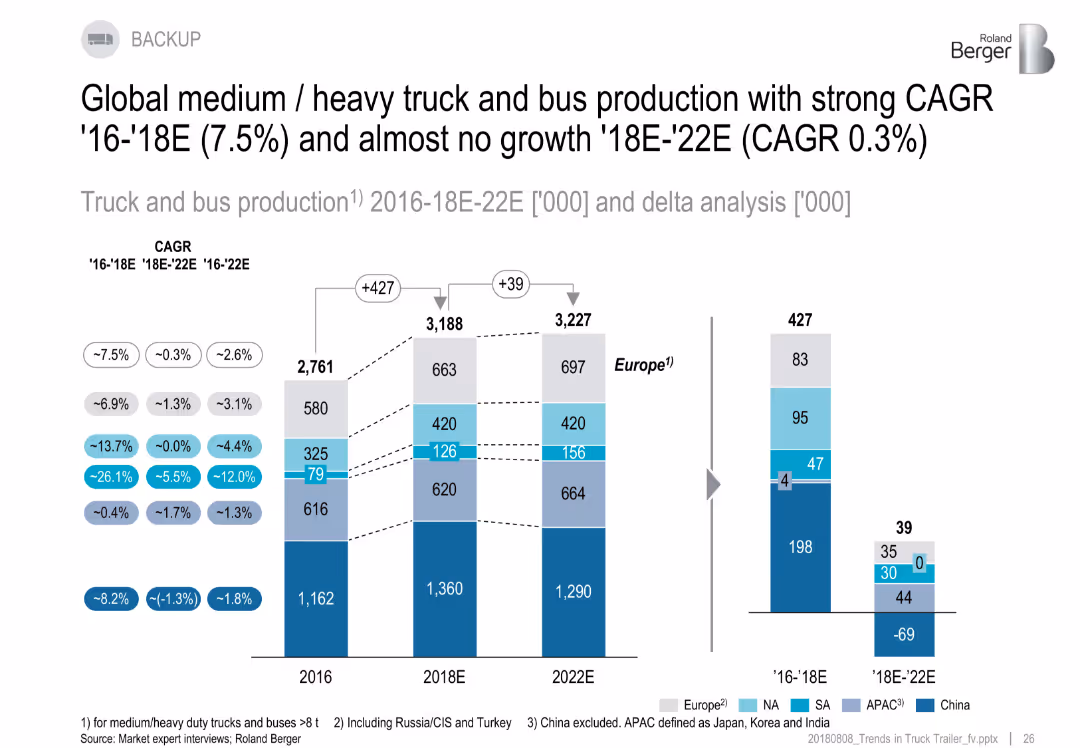
Stacked bar chart comparing truck and bus production from 2016–2022E, including deltas and CAGR bubbles.
Performance Metrics and KPIs
Industrial & Manufacturing
This slide contrasts two periods: strong growth from 2016–2018 (CAGR 7.5%) and a flattening trend from 2018–2022 (CAGR 0.3%). Regional data is presented, highlighting China’s significant role and slowing output beyond 2018.
CAGR, truck production, bus, global growth, KPIs, 2016–2022, regions
false
Performance Metrics and KPIs
Industrial & Manufacturing
Multiple Chart
Roland Berger
Add to my slides
Remove from favorites
Previous
Next
You don't have any favorites yet.
Please wait loading your favorites slides...
Create a FREE account to continue browsing
Receive Instant Access to 1,000+ slides from companies like McKinsey, Google, and Goldman Sachs
First Name
Last Name
Email
Password
I agree to all
Terms & Privacy Policy
Thank you! Your submission has been received!
Oops! Something went wrong while submitting the form.
Have an account?
Sign in
Upgrade to PRO to Save slides
Advanced Search and Filters
Access to 15,000+ slides
Access to Category Pages
Save/Bookmark Slides
PowerPoint Template Library
Pick a Plan
MONTHLY
$12/month
Billed every month, Cancel anytime.
YEARLY
$9/year
Billed $108 annually, Cancel anytime.
Checkout for $12/month
Checkout for $108/yr
Secured by Stripe | AES-256 bit encryption