My Account
My Slides
Search by Category
Companies
Slide Type
Use Case
Industry
Pricing
Templates
View All Templates
Download Template Slides
✦ AI
AI Prompt Library
AI Search
Feedback
Login
Logout
Get Started
Browse all Slides
Browse all Slides
Create a FREE Account
Instant access to 1,000+ real slides from top companies like McKinsey, BCG, Goldman Sachs, Google and many more!
First Name
Last Name
Email
Password
I agree to all
Terms & Privacy Policy
Thank you! Your submission has been received!
Oops! Something went wrong while submitting the form.
Have an account?
Sign in
Saved Slides
Total No. of slides saved
0
↻ Refresh
✖ Clear all
The slide features a dark blue color scheme with a line chart comparing Goldman Sachs and U.S. Peer Average BVPS growth over a 10-year period, and a bar chart showing GS's outperformance in 3, 5, and 10-year spans. There's a bullet point list on the left outlining capital management philosophy.
Financial Performance
Financial Services
This slide presents Goldman Sachs' prudent capital management over the years, highlighting significant returns of capital, net income, and growth in BVPS compared to its peers, likely used in financial reviews or investor presentations.
Capital management, BVPS, financial growth, performance, Goldman Sachs
false
Financial Performance
Financial Services
Multiple Chart
Goldman Sachs
Add to my slides
Remove from favorites
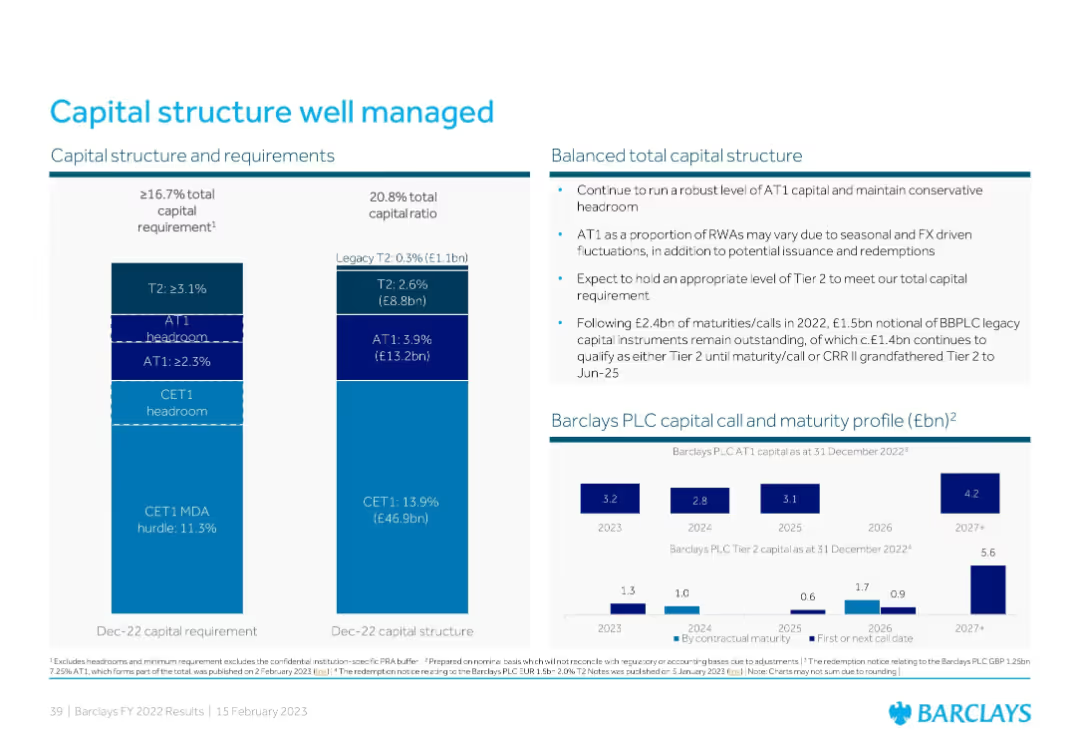
Comprising mainly of column charts, this slide illustrates 'Resilient Capital Ratios' over time and the 'Track Record of Dynamic Capital Management'. Each bar chart is accompanied by bullet points that explain the capital management strategy.
Regulatory and Compliance
Financial Services
The slide reviews capital ratios and management strategies, crucial for stakeholders assessing compliance with financial regulations and the company's financial prudence.
capital management, CET1 ratio, bar chart, financial compliance, regulatory standards, capital ratios, dynamic management, financial prudence, strategic oversight, stakeholder communication
false
Regulatory and Compliance
Financial Services
Multiple Chart
Goldman Sachs
Add to my slides
Remove from favorites
Left: CET1 ratio movement chart; Right: bullet points of future capital considerations. Color-coded waterfall bars represent capital impacts, with numeric annotations.
Corporate Finance and Valuation
Financial Services
Describes CET1 ratio changes in Q422, detailing capital impacts and management strategies. Lists future considerations including share buybacks, buffer increases, IFRS 9 adjustments, and medium-term capital planning targets.
capital management, CET1 ratio, IFRS 9, share buyback, buffers, risk-weighted assets, Q422, Barclays
false
Corporate Finance and Valuation
Financial Services
Mixed Chart
Barclays
Add to my slides
Remove from favorites
Contains a column chart illustrating the standardized CET1 ratio over time and a checklist describing the capital management philosophy. The chart shows a base minimum and adjustments for various factors. The layout is organized for a professional audience.
Strategic Planning
Financial Services
The slide offers insights into the firm's capital management over time, reflecting changes in capital requirements and strategy. It's designed for presentations to stakeholders or regulators, explaining dynamic capital adjustments and the overarching capital management philosophy.
Capital Management, CET1 Ratio, Regulatory Requirements, Strategic Adjustments
false
Strategic Planning
Financial Services
Mixed Chart
Goldman Sachs
Add to my slides
Remove from favorites
Column charts showing CET1 ratio movements and future considerations. Details on Q123 and medium/long-term plans.
Strategic Planning
Financial Services
The slide covers disciplined capital management with CET1 ratio movements and strategic planning for future.
capital management, CET1 ratio, strategic planning, future considerations, Q123
false
Strategic Planning
Financial Services
Multiple Chart
Barclays
Add to my slides
Remove from favorites
This slide is divided into two sections: the left side lists key forward drivers of capital management, and the right side presents a column chart illustrating the CET1 Ratio targets and components, including the Stress Capital Buffer and G-SIB.
Risk Assessment and Management
Financial Services
The slide details forward-looking statements on capital management, focusing on stress capital buffer improvements, G-SIB surcharge expectations, and management buffer estimates, useful for discussions on future financial strategies and regulatory requirements.
Capital management, CET1 Ratio, stress test, G-SIB, financial strategy
false
Risk Assessment and Management
Financial Services
Mixed Chart
Goldman Sachs
Add to my slides
Remove from favorites
A circular diagram split in two, showing how capital is allocated between operations and strategic investments.
Investment Analysis
Financial Services
Discusses the balanced approach to capital management, focusing on equal distribution of resources for expenditures and dividends.
capital management, expenditures, dividends, strategic investments, diagram
false
Investment Analysis
Financial Services
Single Chart
Barclays
Add to my slides
Remove from favorites
Contains a vertical column chart with details on capital requirements and text boxes with key capital management philosophies and forward drivers on a white and blue theme.
Strategic Planning
Financial Services
This slide outlines the strategy for managing capital to support growth and returns. It highlights current capital requirements, future targets, and key drivers affecting the strategic approach to capital allocation, growth, and shareholder returns.
capital management, growth, returns, strategy
false
Strategic Planning
Financial Services
Mixed Chart
Goldman Sachs
Add to my slides
Remove from favorites
Graphically rich slide with column charts depicting capital usage and developments in regulatory capital efficiency, alongside explanatory texts and arrows for emphasis.
Strategic Planning
Financial Services
Details the bank's strategic adjustments in capital management aimed at enhancing long-term shareholder value and financial stability through sustainable investments and efficiency improvements.
capital management, long-term value, financial stability, shareholder value, regulatory efficiency
false
Strategic Planning
Financial Services
Mixed Chart
Deutsche Bank
Add to my slides
Remove from favorites
Includes column charts for financial projections.
Strategic Planning
Financial Services
Focuses on capital management strategies through 2025.
capital, management, strategy, 2025
false
Strategic Planning
Financial Services
Mixed Chart
Deutsche Bank
Add to my slides
Remove from favorites
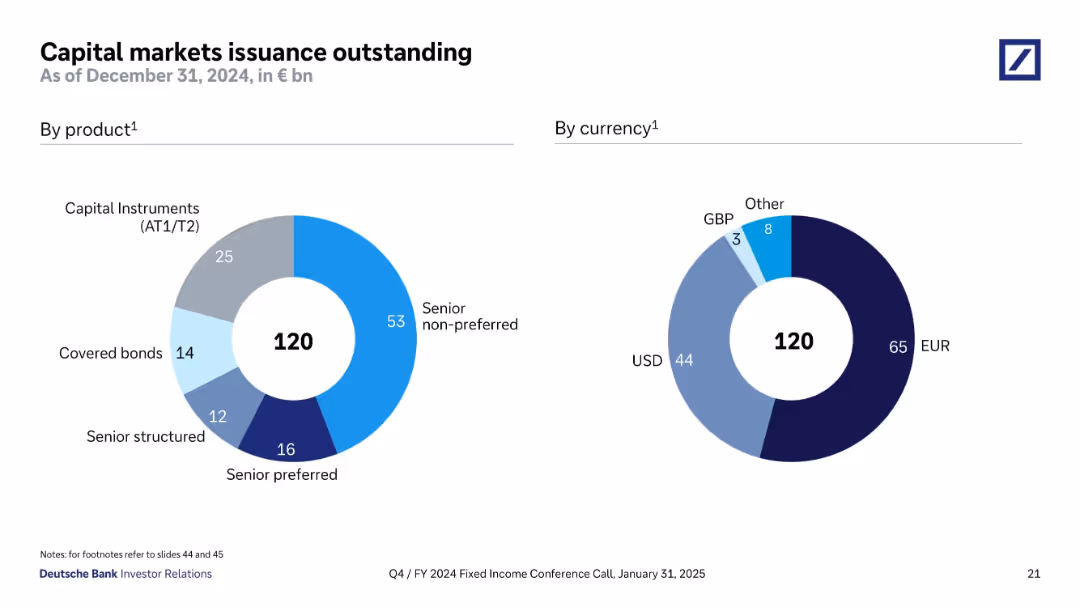
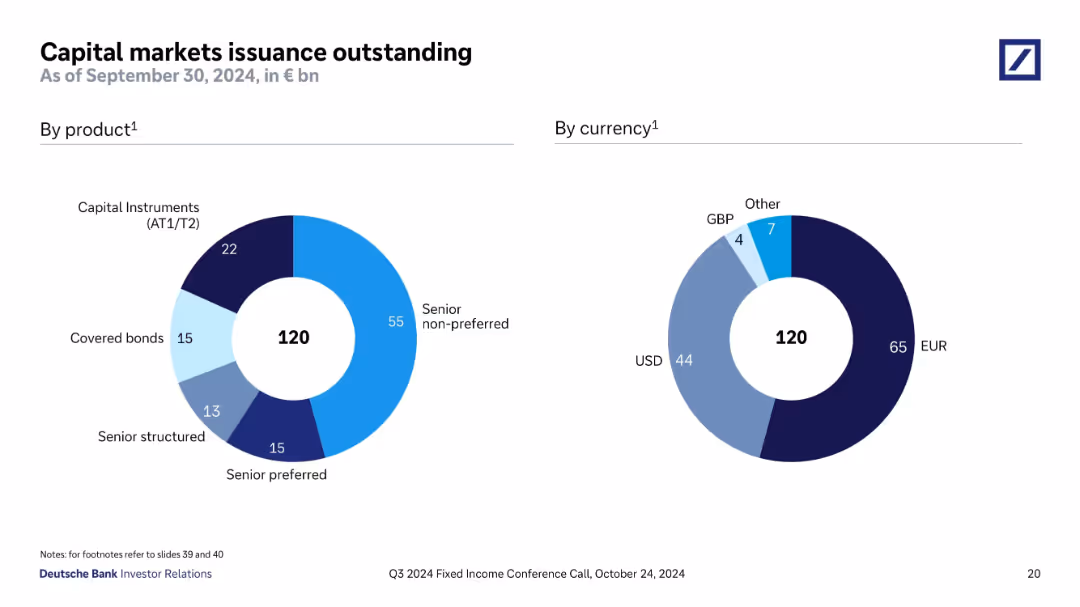
Two donut charts show capital markets issuance outstanding (€119bn) by product type (AT1/T2, senior non-preferred, etc.) and by currency (EUR, USD, others). Clear color coding distinguishes categories.
Financial Performance
Financial Services
This slide breaks down Deutsche Bank’s outstanding capital market issuances totaling €119bn by both product and currency. Senior non-preferred debt is the largest component (€53bn), followed by capital instruments. Issuance is diversified by currency, with 64bn in EUR and 44bn in USD. The visual reinforces the bank's diversified funding structure and balance between instrument types and currency exposures.
capital markets, bond issuance, senior non-preferred, AT1, EUR, USD, covered bonds, diversification
false
Financial Performance
Financial Services
Single Chart
Deutsche Bank
Add to my slides
Remove from favorites
Bar charts comparing issuances and redemptions by instrument type; callouts for future maturities.
Investment Analysis
Financial Services
Provides an overview of UBS’s capital markets activity in 2024 and projected maturities. Details types of instruments issued or redeemed and includes guidance on 2025 funding plans. Highlights diversity of funding sources and currencies.
capital markets, bonds, issuance, redemption, UBS, funding, maturities
false
Investment Analysis
Financial Services
Mixed Chart
UBS
Add to my slides
Remove from favorites
The slide includes four line charts depicting trends in equities (S&P 500 P/E & VIX), rates (10Y U.S. Treasury), investment grade spreads, and high yield all-in-yield from Jan 2023 to Dec 2023.
Market Analysis and Trends
Financial Services
This slide analyzes various capital market indicators suggesting that 2024 will be favorable for market activities such as IPOs and debt issuance.
capital markets, equities, treasury rates, investment grade, high yield
false
Market Analysis and Trends
Financial Services
Multiple Chart
JP Morgan
Add to my slides
Remove from favorites
Pie charts breaking down capital market issuances by product and currency as of a specific date.
Investment Analysis
Financial Services
Provides an overview of the bank's capital structure and funding sources, emphasizing diversity and stability in funding.
capital markets, funding, finance, disclosure, diversity, stability
false
Investment Analysis
Financial Services
Multiple Chart
Deutsche Bank
Add to my slides
Remove from favorites
Two pie charts in shades of blue, detailing types of funding products and currencies.
Financial Performance
Financial Services
Summarizes capital markets issuance and outstanding amounts, crucial for understanding funding strategies and financial health.
Capital markets, funding, financial health, currencies, financial strategy, issuance, banking
false
Financial Performance
Financial Services
Multiple Chart
Deutsche Bank
Add to my slides
Remove from favorites
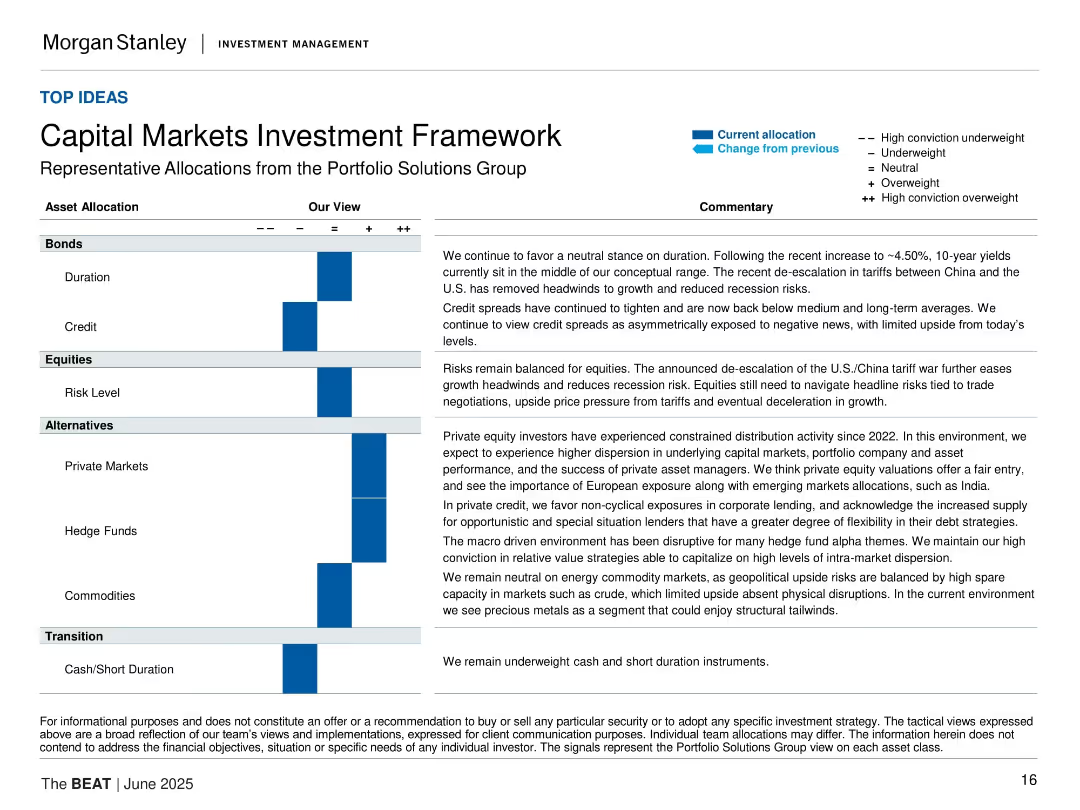
Matrix of asset allocation views with horizontal bars and textual commentary; structured, corporate layout.
Strategic Planning
Financial Services
The slide presents the Portfolio Solutions Group’s tactical asset allocation views across bonds, equities, alternatives, and cash. Commentary explains each allocation decision within a macroeconomic context.
capital markets, investment strategy, asset allocation, portfolio, tactical view, duration, credit, equities, alternatives
false
Strategic Planning
Financial Services
Table
Morgan Stanley
Add to my slides
Remove from favorites
Two donut charts show issuance volume by product type and currency. Each chart uses distinct, muted colors to differentiate categories. Simple, clean layout with centered total value (€120bn).
Corporate Finance and Valuation
Financial Services
This slide presents Deutsche Bank's €120bn in outstanding capital market issuances as of December 2024. The product chart highlights that senior non-preferred instruments dominate, followed by AT1/T2 and covered bonds. The currency distribution shows that EUR and USD are the main issuance currencies, making up 91% of total issuance.
capital markets, issuance, EUR, USD, senior non-preferred, AT1, T2, covered bonds, Deutsche Bank
false
Corporate Finance and Valuation
Financial Services
Single Chart
Deutsche Bank
Add to my slides
Remove from favorites
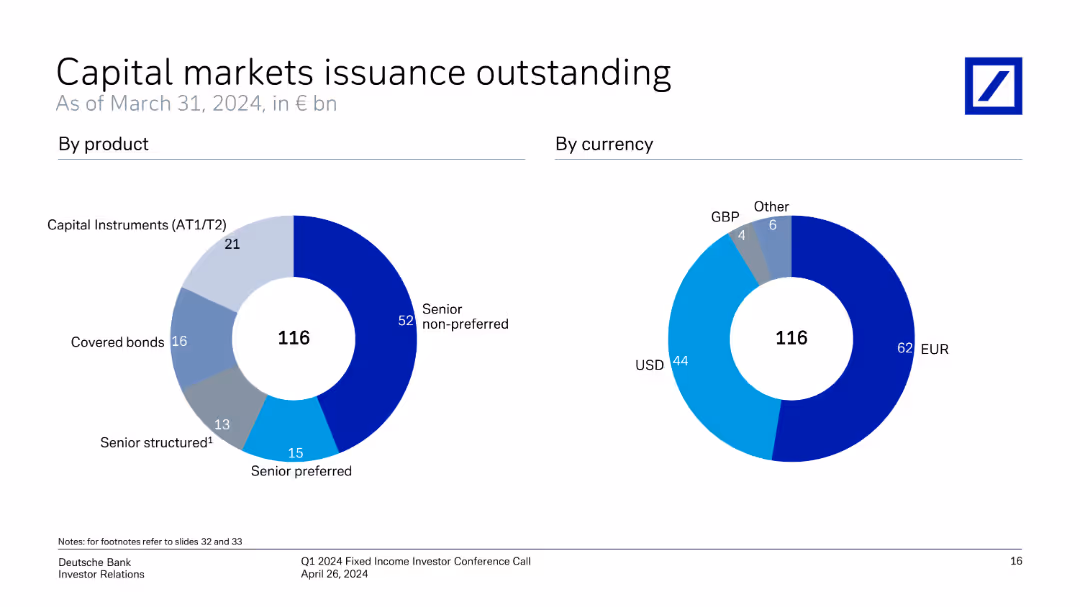
The slide presents two pie charts. The first shows capital market issuance by product, and the second by currency as of March 31, 2024.
Financial Performance
Financial Services
The slide provides a breakdown of capital markets issuance outstanding by product and currency, highlighting key metrics and totals.
capital, markets, issuance, product, currency, outstanding, breakdown, financial, analysis, Deutsche Bank
false
Financial Performance
Financial Services
Multiple Chart
Deutsche Bank
Add to my slides
Remove from favorites
The slide presents a column chart showing issuances and redemptions for 2022 and 1H23, with upcoming maturities and first calls for the future, providing a visual breakdown of different bond types.
Financial Performance
Financial Services
The slide outlines UBS's capital markets activities, detailing the issuances and redemptions of bonds and future maturities, to demonstrate the bank's funding activities and plans for the coming years.
capital markets, issuances, redemptions, bonds, maturities
false
Financial Performance
Financial Services
Multiple Chart
UBS
Add to my slides
Remove from favorites
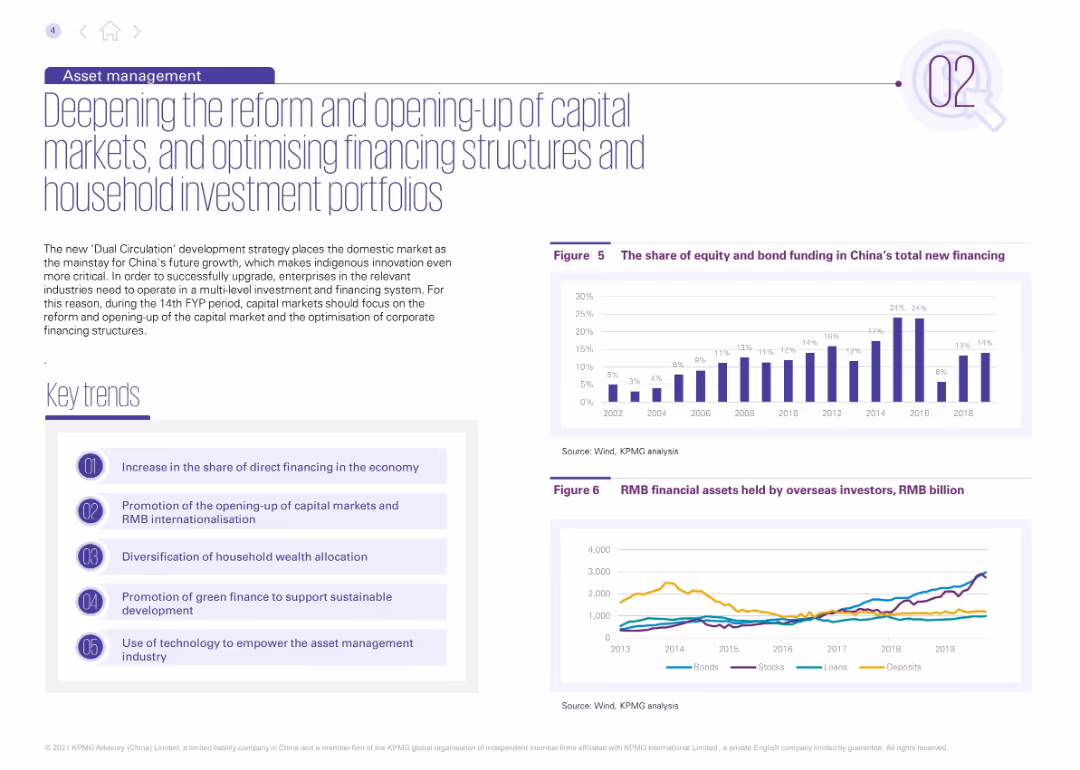
Purple-themed layout with two charts and five key trends. Describes financial reforms and household wealth shifts. Charts show the share of direct financing and RMB assets held by foreign investors.
Corporate Finance and Valuation
Financial Services
Focuses on reforms in China’s capital markets during the 14th FYP, including increased direct financing and RMB internationalization. It emphasizes innovation and technology’s role in asset management.
capital markets, RMB, foreign investment, wealth management, finance reform, FYP
false
Corporate Finance and Valuation
Financial Services
Multiple Chart
KPMG
Add to my slides
Remove from favorites
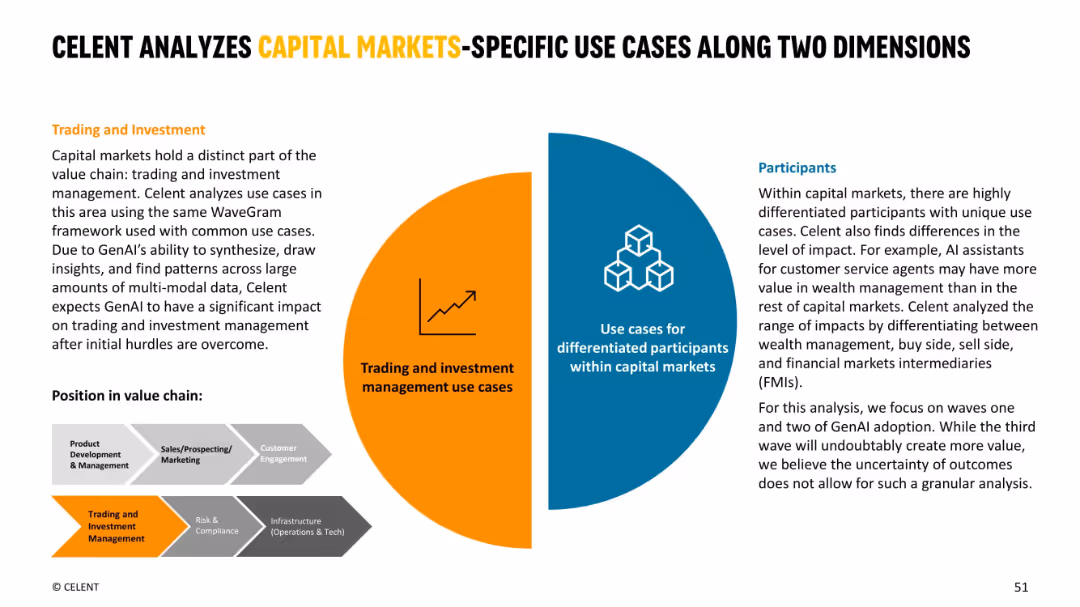
Visual half-pie chart and text blocks explain segmentation of capital markets use cases; infographic style with icons
Industry Overview
Financial Services
Introduces Celent’s method for classifying capital markets use cases by trading focus and participant roles. Describes the analytical framework and phases of AI adoption with an emphasis on differentiation in value and strategy.
capital markets, segmentation, AI phases, GenAI, trading and investment
false
Industry Overview
Financial Services
Header Horizontal
Oliver Wyman
Add to my slides
Remove from favorites
Two donut charts showing €120bn issuance breakdown by product and currency; product types include SNP, AT1/T2, and covered bonds.
Investment Analysis
Financial Services
This slide breaks down Deutsche Bank’s €120bn outstanding capital markets issuance as of Q3 2024. The product distribution is led by senior non-preferred (55), with the majority of currency exposure in EUR (65) and USD (44), indicating strong Euro and Dollar market activity.
capital markets, senior non-preferred, EUR, USD, issuance, bonds, Deutsche Bank
false
Investment Analysis
Financial Services
Single Chart
Deutsche Bank
Add to my slides
Remove from favorites
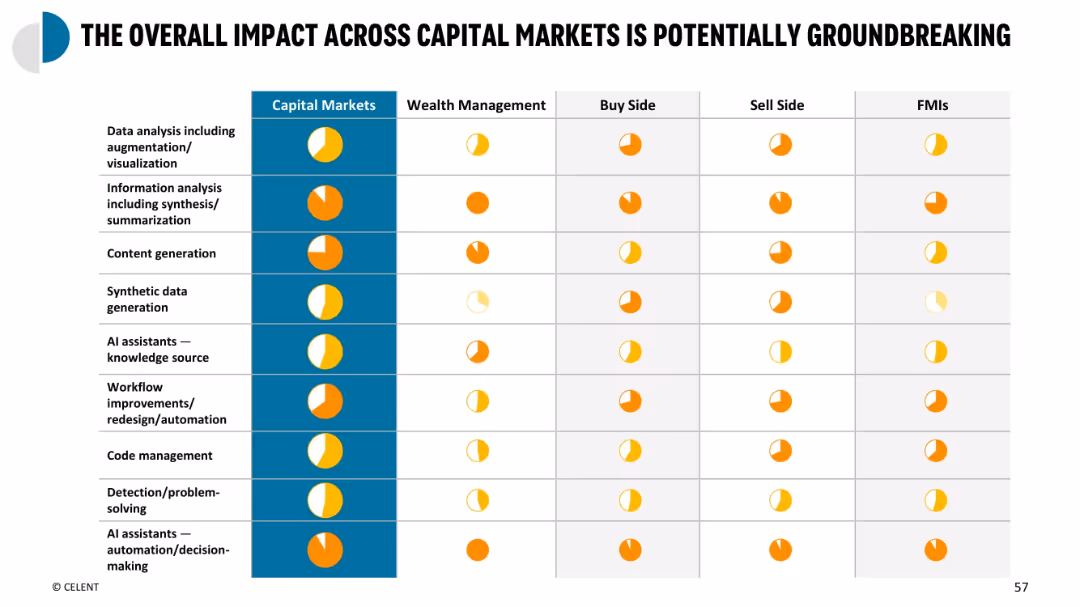
Heatmap-style summary table with use cases on Y-axis and market segments on X-axis; colored circles indicate impact
Performance Metrics and KPIs
Financial Services
Summary matrix showing cross-segment impact of GenAI use cases across capital markets participants. Measures impact level for each use case type in wealth management, buy side, sell side, and FMIs, highlighting where GenAI adds most value.
capital markets summary, KPI impact, GenAI matrix, cross-sector use, impact overview
false
Performance Metrics and KPIs
Financial Services
Single Chart
Oliver Wyman
Add to my slides
Remove from favorites
Slide with bar and column charts on capital metrics.
Regulatory and Compliance
Financial Services
Details changes in capital metrics including CET1 and leverage ratios.
capital, metrics, CET1, leverage
false
Regulatory and Compliance
Financial Services
Multiple Chart
Deutsche Bank
Add to my slides
Remove from favorites
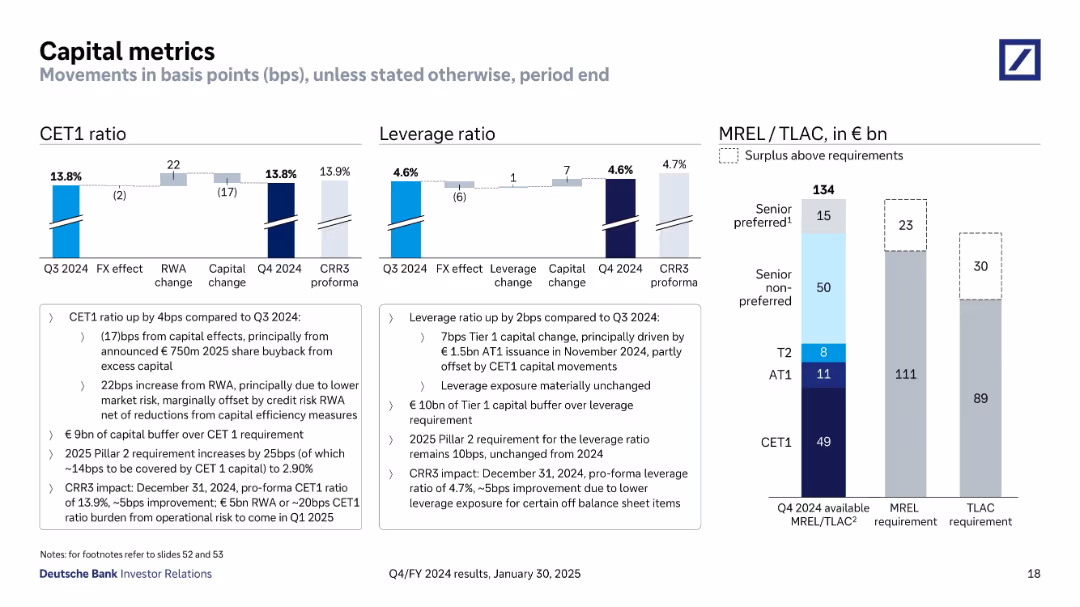
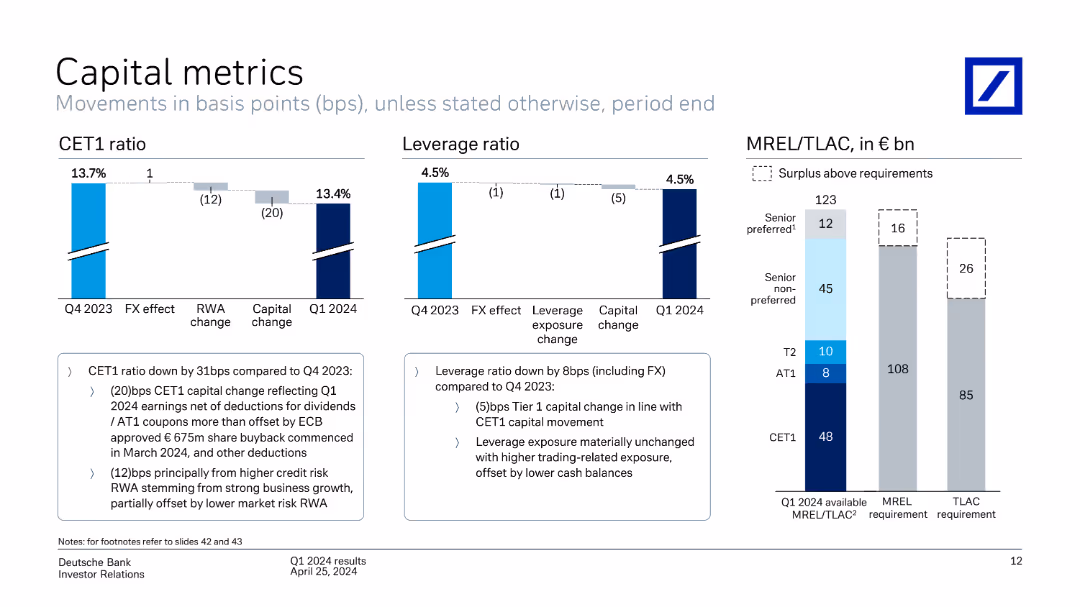
Three-part layout showing CET1 ratio, leverage ratio, and MREL/TLAC surplus. Includes annotated arrows and percentage point breakdowns.
Regulatory and Compliance
Financial Services
Details movements in Deutsche Bank’s CET1 and leverage ratios with explanations for changes in capital, FX, and risk-weighted assets. Includes surplus buffers over regulatory capital requirements for MREL and TLAC. Emphasizes strong capital position.
capital metrics, CET1, leverage, MREL, TLAC, regulatory capital
false
Regulatory and Compliance
Financial Services
Multiple Chart
Deutsche Bank
Add to my slides
Remove from favorites
Includes multiple column charts showing CET1 ratio, leverage ratio, and MREL/TLAC metrics, with explanatory text. The slide is detailed with several visual elements.
Financial Performance
Financial Services
The slide presents key capital metrics for Deutsche Bank, including CET1 ratio, leverage ratio, and MREL/TLAC, providing a detailed breakdown of changes and regulatory compliance.
Capital metrics, CET1 ratio, leverage ratio, MREL, TLAC
false
Financial Performance
Financial Services
Multiple Chart
Deutsche Bank
Add to my slides
Remove from favorites
Slide includes column charts depicting changes in CET1 and leverage ratios, and a complex column chart showing MREL/TLAC requirements.
Regulatory and Compliance
Financial Services
Outlines recent developments in Deutsche Bank's capital metrics, focusing on regulatory adjustments and compliance with financial safety standards.
capital metrics, regulatory compliance, banking, CET1 ratio, leverage
false
Regulatory and Compliance
Financial Services
Multiple Chart
Deutsche Bank
Add to my slides
Remove from favorites
The slide presents a sequence of column charts and textual analysis. It visually communicates the historical capital allocation and expectations for future returns with a clear graphical representation using shades of blue and gray.
Investment Analysis
Financial Services
The slide from JPMorgan Chase focuses on capital optimization and projected return on equity (ROE). It is designed for financial presentations that detail capital allocation strategies and the expected outcomes in terms of growth and returns, highlighting both the cost of capital and the benefits of disciplined capital deployment.
Capital Optimization, Growth, Returns, ROE, Cost of Capital, Investment, Disciplined Deployment, Client Wallet, Market Completeness
false
Investment Analysis
Financial Services
Multiple Chart
JP Morgan
Add to my slides
Remove from favorites
This slide lists key points related to capital allocation optimization, using icons and short texts in bullet points. There's a small column chart comparing Group RoRWA percentages over time, with a projected mid-term goal. The visual is straightforward, with icons illustrating each bullet point, and uses a blue and grey color scheme. Santander's logo appears at the top, with a cogwheel icon indicating optimization.
Strategic Planning
Financial Services
The slide provides an overview of strategies for capital allocation to improve profitability, coupled with a chart showing historical and targeted RoRWA. It's suitable for financial planning and strategy meetings to discuss and plan for improved financial performance.
Capital Optimization, Profitability, RoRWA, Financial Strategy, Santander, Business Optimization, Allocation Strategies, Financial Improvement
false
Strategic Planning
Financial Services
Mixed Chart
Morgan Stanley
Add to my slides
Remove from favorites
Slide includes timelines and column charts detailing planned capital distributions over several years.
Strategic Planning
Financial Services
Outlines a multi-year plan for capital returns to shareholders, with specific targets set for 2024-2026.
capital, planning, 2026, returns, shareholders
false
Strategic Planning
Financial Services
Linear Flow
Barclays
Add to my slides
Remove from favorites
Slide features a column chart showing the CET1 ratio over time, with additional notes on capital allocation and a side panel for strategic progress, all in a blue and white theme.
Financial Performance
Financial Services
This slide emphasizes a strong capital position with a focus on how capital is allocated to support growth and returns. It's used to illustrate financial stability and strategic capital management, providing reassurance to investors and stakeholders.
capital position, CET1 ratio, growth, strategy
false
Financial Performance
Financial Services
Mixed Chart
Goldman Sachs
Add to my slides
Remove from favorites
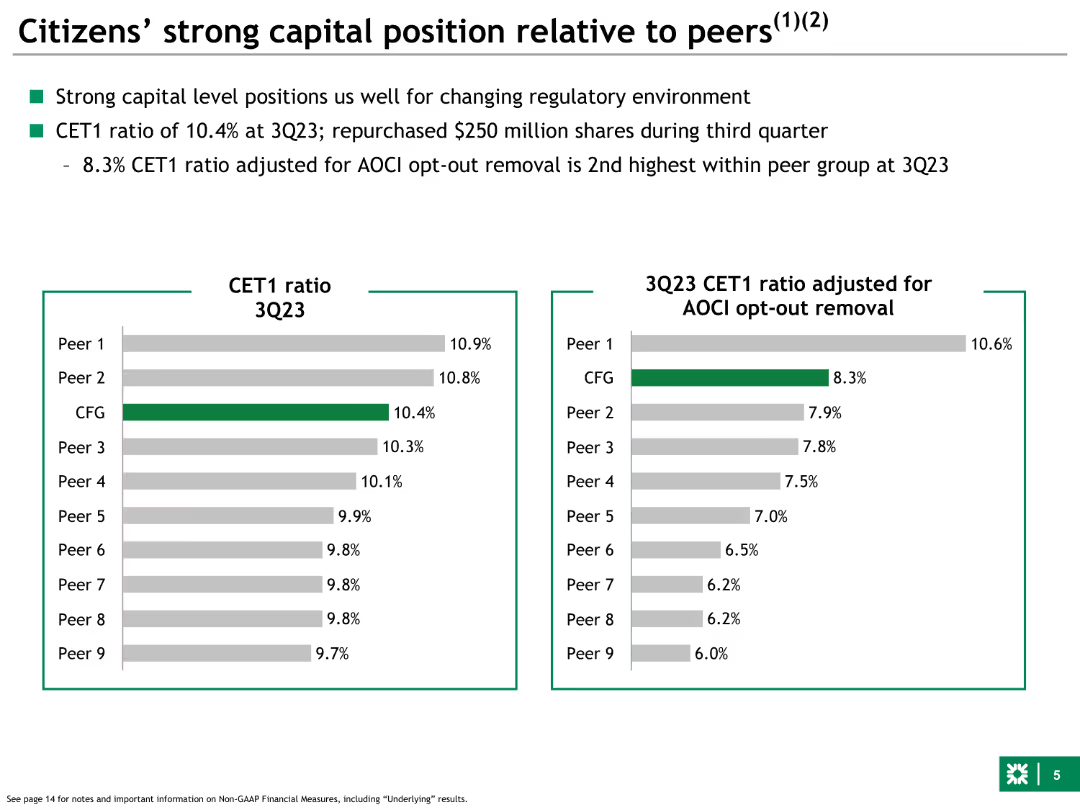
Left side features a bar chart comparing CET1 ratios of Citizens and peers. Right side adjusts CET1 ratios for AOCI opt-out removal, showing comparative financial positions.
Competitive Landscape
Financial Services
Compares Citizens' CET1 capital ratios to peers, both standard and adjusted for AOCI opt-out removal, highlighting strong capital positioning within the industry.
capital, position, Citizens, peers, CET1, comparative, AOCI, financial, ratios
false
Competitive Landscape
Financial Services
Multiple Chart
Goldman Sachs
Add to my slides
Remove from favorites
The slide includes column charts showing CET1 ratio, liquidity coverage ratio, and Tier 1 leverage ratio comparisons among peers.
Financial Performance
Financial Services
This slide highlights Credit Suisse's strong capital and liquidity position with comparisons to peers, indicating robust financial health.
capital position, liquidity, CET1 ratio, Tier 1 leverage, financial health
false
Financial Performance
Financial Services
Multiple Chart
Credit Suisse
Add to my slides
Remove from favorites
The slide contains two column charts showing capital development and ratios at different stages, with notes on funding cost saves and capital ratio requirements.
Financial Performance
Financial Services
This slide discusses the group's strong capital position and outlines the expected development of capital ratios from 2023 to 2026, emphasizing funding cost savings.
capital position, ratios, funding cost, development, 2026
false
Financial Performance
Financial Services
Multiple Chart
UBS
Add to my slides
Remove from favorites
This slide includes column charts and a pie chart, providing a visual representation of net profit contributions and income by region. It utilizes a straightforward layout with complementary colors for clarity.
Financial Performance
Financial Services
Analyzes financial contributions and regional income distribution for Macquarie Capital. It conveys financial growth and geographic market influence, useful for discussing strategic regional focus or investment decisions.
Capital, Profit Contribution, Regional Income, Financial Growth, Strategy
false
Financial Performance
Financial Services
Multiple Chart
Goldman Sachs
Add to my slides
Remove from favorites
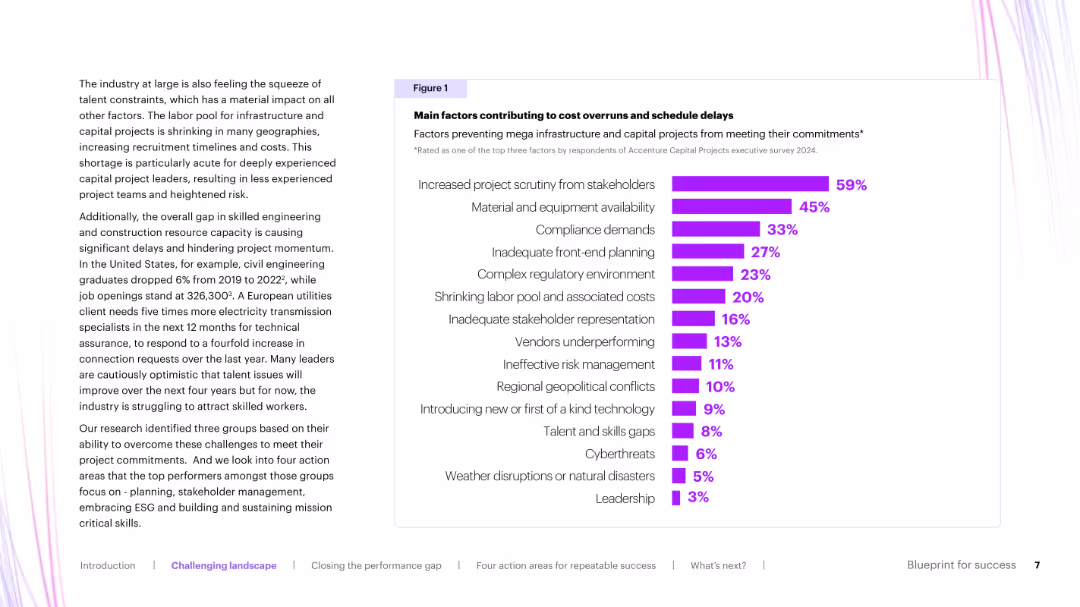
Split layout with left-aligned text and a right-side horizontal bar chart in purple showing ranked causes of delays in capital projects.
Risk Assessment and Management
Real Estate & Construction
The slide identifies and quantifies the primary factors that contribute to schedule delays and cost overruns in mega infrastructure projects. Top issues include stakeholder scrutiny, compliance, and material availability.
capital projects, risk factors, delays, overruns, stakeholder scrutiny
false
Risk Assessment and Management
Real Estate & Construction
Mixed Chart
Accenture
Add to my slides
Remove from favorites
Slide contains multiple horizontal bars showing percentages of Lloyd’s capital providers by source and location.
Risk Assessment and Management
Financial Services
Discusses the diverse sources of Lloyd's capital, with a focus on the contributions by the Bermudian and UK insurance industries, among others. Highlights unexpected sources.
Capital, Providers, Insurance, International, Sources
false
Risk Assessment and Management
Financial Services
Single Chart
PwC/Strategy&
Add to my slides
Remove from favorites
The slide contains a structured table on the top outlining proposed capital raises. Below, there's a timeline detailing the indicative timeline for these raises.
Investment Analysis
Financial Services
This slide provides an overview of the proposed capital raises, including a breakdown of the structure and size, followed by a detailed timeline for the execution of these raises.
capital raises, timeline, financial planning, investment, strategy
false
Investment Analysis
Financial Services
Linear Flow
Credit Suisse
Add to my slides
Remove from favorites
This slide features a bar chart displaying the challenges businesses face in raising capital, along with cohort data of companies not yet raising subsequent funding rounds. The charts use contrasting colors and are labeled for clarity.
Investment Analysis
Financial Services
It highlights the increasing difficulty for businesses in securing capital, providing an analysis of the current funding environment, and underlining the challenges and delays companies face. This slide is vital for discussions on capital raising strategies and investor expectations, particularly in volatile economic conditions.
Capital Raising, Business Challenges, Funding Delays, Investment Climate, Strategic Planning
false
Investment Analysis
Financial Services
Mixed Chart
JP Morgan
Add to my slides
Remove from favorites
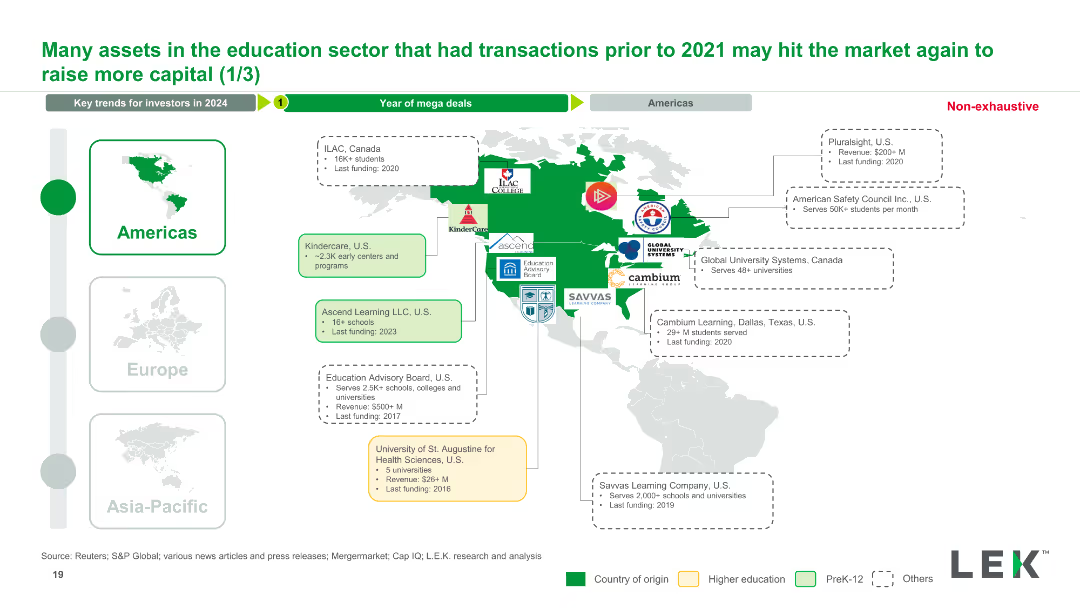
The slide presents a map of the Americas with logos and brief details of education companies likely to raise capital, accompanied by icons indicating educational sectors.
Market Analysis and Trends
Education & Training
This slide maps out education companies in the Americas that had transactions before 2021 and may raise capital again, providing company names, locations, and details.
capital raising, education assets, Americas, market analysis, transaction history, education companies, investment opportunities
false
Market Analysis and Trends
Education & Training
Graphic
LEK
Add to my slides
Remove from favorites
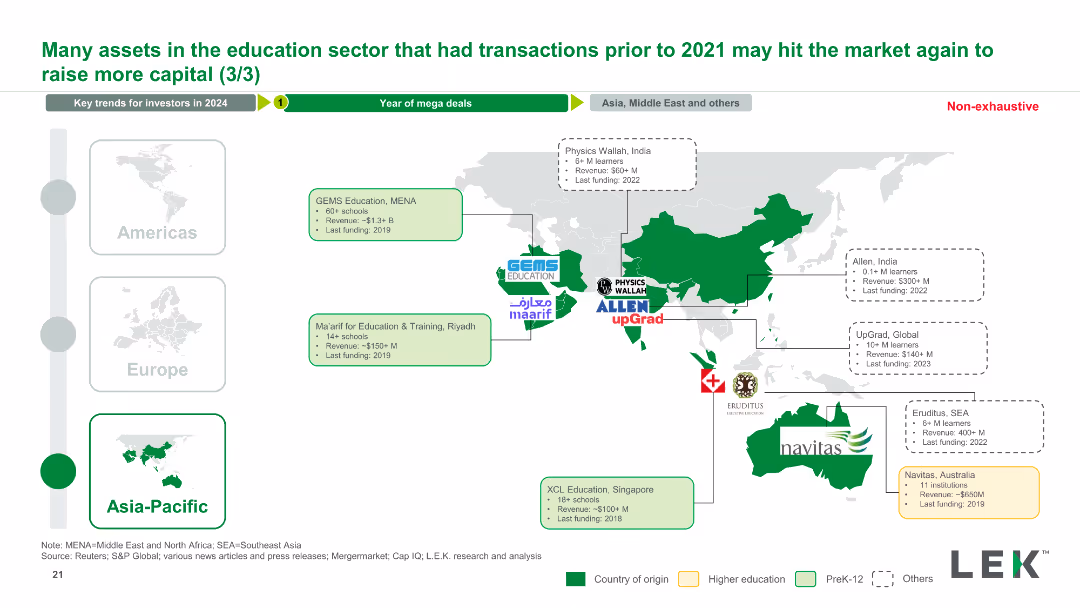
The slide features a map of Asia-Pacific with logos and brief details of education companies, accompanied by icons indicating educational sectors and financial data.
Market Analysis and Trends
Education & Training
This slide outlines Asia-Pacific education companies that had transactions before 2021 and may raise capital, listing company names, locations, and sector details.
capital raising, education assets, Asia-Pacific, market analysis, transaction history, education companies, investment opportunities
false
Market Analysis and Trends
Education & Training
Graphic
LEK
Add to my slides
Remove from favorites
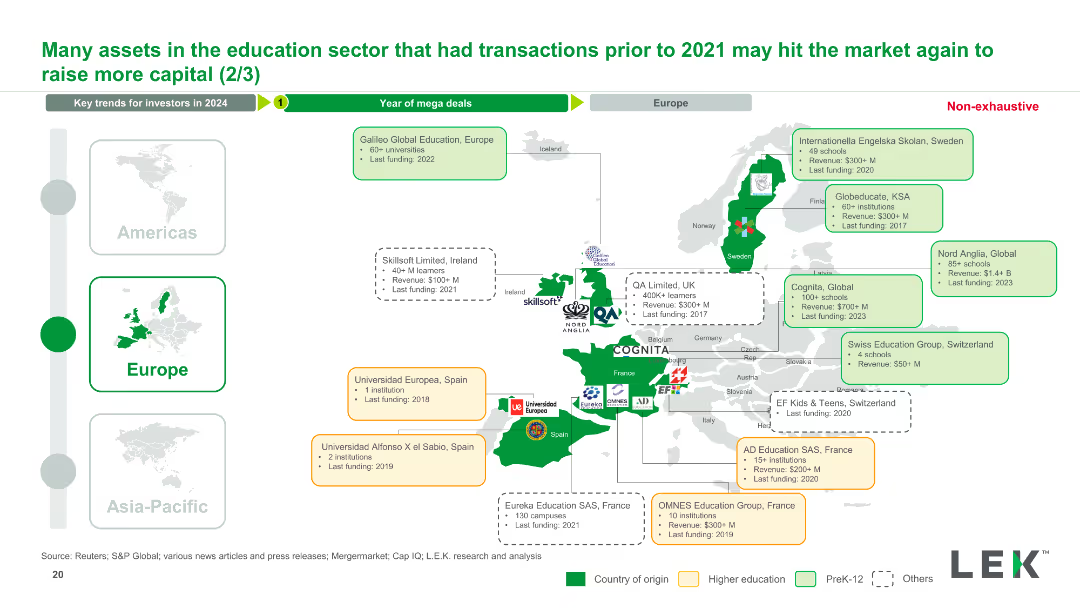
The slide displays a map of Europe with logos and details of education companies, using icons to indicate sectors like higher education and PreK-12.
Market Analysis and Trends
Education & Training
This slide details European education companies that had transactions before 2021 and may seek capital again, showing company names, locations, and financial data.
capital raising, education assets, Europe, market analysis, transaction history, education companies, investment opportunities
false
Market Analysis and Trends
Education & Training
Graphic
LEK
Add to my slides
Remove from favorites
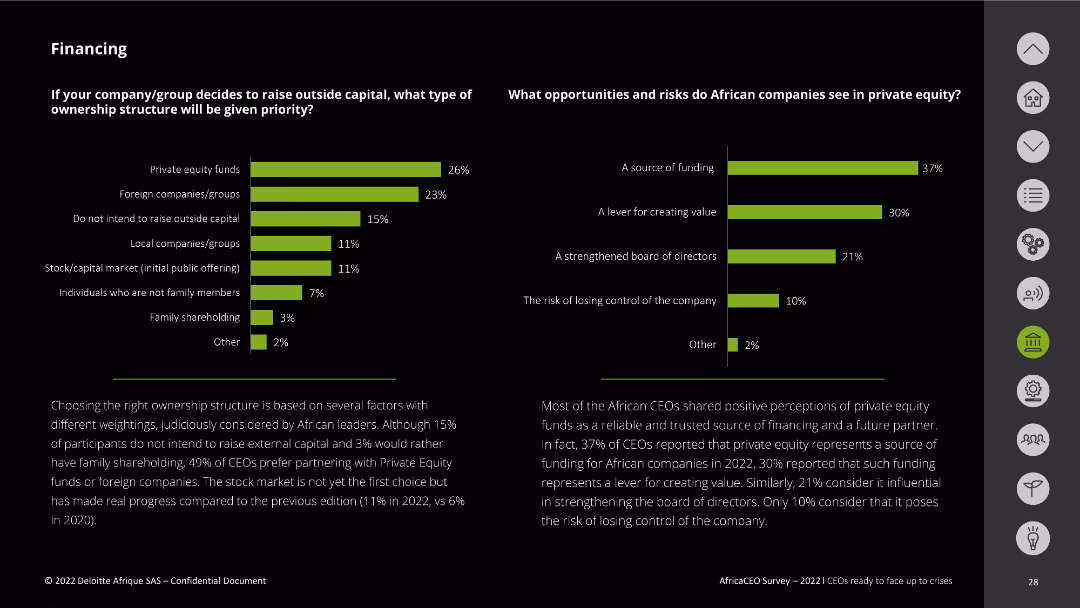
The slide contains two bar charts. The first chart displays preferred ownership structures for raising outside capital. The second chart shows the opportunities and risks associated with private equity. Text explanations are provided at the bottom.
Investment Analysis
Financial Services
This slide examines preferred ownership structures when raising outside capital and the opportunities and risks of private equity. It highlights that private equity funds and foreign companies/groups are top choices, while risks include loss of company control.
capital raising, ownership structure, private equity, opportunities, risks
false
Investment Analysis
Financial Services
Multiple Chart
Deloitte
Add to my slides
Remove from favorites
This slide features a sophisticated layout with multiple data presentations. It includes multiple tables, showcasing financial metrics such as capital ratios and balance sheet data over different quarters, differentiated by color and clearly labeled.
Financial Performance
Financial Services
The slide presents a detailed comparison of a company's capital and balance sheet data across several quarters. It is used to highlight financial stability and changes in capital structure, relevant for financial analysts and stakeholders assessing the company’s financial health.
capital ratio, balance sheet, financial data, comparison, stability
false
Financial Performance
Financial Services
Table
Goldman Sachs
Add to my slides
Remove from favorites
This slide contains pie charts, a leverage ratio comparison, and bullet points emphasizing the bank's strong capital position and strategies.
Financial Performance
Financial Services
The slide provides an overview of BBVA's capital ratios and risk-weighted assets, evidencing a robust capital position. Useful for discussions on financial solidity and regulatory compliance.
Capital Ratios, Financial Strength, Risk Management, Leverage Ratio, Regulatory Compliance, Capital Generation
false
Financial Performance
Financial Services
Multiple Chart
Morgan Stanley
Add to my slides
Remove from favorites
The slide includes two vertical column charts comparing CET1 capital ratio and leverage ratio for 3Q23 against requirements.
Financial Performance
Financial Services
This slide provides an overview of capital and leverage ratios, focusing on CET1 capital ratio and regulatory requirements.
capital ratios, leverage ratios, CET1, regulatory requirements, financial performance
false
Financial Performance
Financial Services
Multiple Chart
UBS
Add to my slides
Remove from favorites
The slide features two vertical bar charts showing capital and leverage ratios, with recent FINMA rulings and guidance text on the right side, illustrating financial regulatory compliance.
Risk Assessment and Management
Financial Services
The slide discusses UBS's capital and leverage ratios, including recent FINMA rulings and future guidance, to illustrate the bank's regulatory compliance and capital management strategies.
capital ratios, leverage ratios, FINMA rulings, regulatory compliance, UBS
false
Risk Assessment and Management
Financial Services
Multiple Chart
UBS
Add to my slides
Remove from favorites
Consists of a large blue column chart illustrating different capital components against regulatory requirements with a dotted line representing required thresholds. Key points are summarized to the right, explaining the strategic significance of the buffer levels.
Risk Assessment and Management
Financial Services
Analyzes the capital adequacy of a financial institution, showing various capital ratios in relation to regulatory requirements. It highlights the strategic management of capital to maintain regulatory compliance and financial health.
capital ratios, regulatory, compliance, financial
false
Risk Assessment and Management
Financial Services
Mixed Chart
Deutsche Bank
Add to my slides
Remove from favorites
Includes stacked column chart illustrating capital ratios against regulatory requirements with detailed annotations explaining the data points.
Regulatory and Compliance
Financial Services
Provides a detailed review of capital ratios like CET1, AT1, and T2, showing how they stand against regulatory requirements at the end of Q4 2023. It focuses on the bank's financial health and capital strategy, ensuring compliance and buffer maintenance above the minimum required levels.
Capital Ratios, Regulatory Compliance, Financial Health, Banking, Capital Strategy
false
Regulatory and Compliance
Financial Services
Mixed Chart
Deutsche Bank
Add to my slides
Remove from favorites
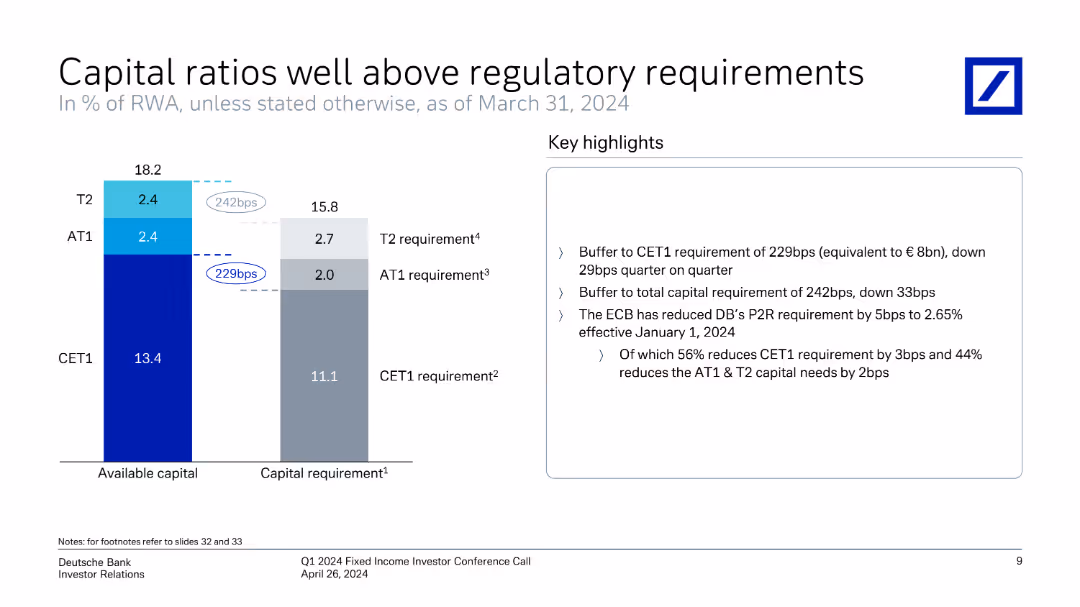
The slide features a vertical bar chart comparing available capital ratios with regulatory requirements, with key highlights on the right.
Risk Assessment and Management
Financial Services
The slide shows Deutsche Bank's capital ratios, emphasizing their alignment and exceedance of regulatory requirements as of March 31, 2024.
capital ratios, regulatory compliance, financial health, Deutsche Bank, Q1 2024, investor relations, capital adequacy, regulatory standards, financial metrics
false
Risk Assessment and Management
Financial Services
Mixed Chart
Deutsche Bank
Add to my slides
Remove from favorites
The slide features column charts of total TLAC, total T1 capital, and CET1 capital ratios with corresponding metrics.
Financial Performance
Financial Services
It provides a detailed analysis of capital and leverage ratios, including total TLAC, T1, and CET1 capital ratios.
capital ratios, TLAC, T1 capital, CET1, financial analysis
false
Financial Performance
Financial Services
Multiple Chart
UBS
Add to my slides
Remove from favorites
Column charts show the current and projected regulatory requirements, complemented by a text box describing the capital management approach.
Regulatory and Compliance
Financial Services
The slide outlines changes in regulatory capital requirements and the firm's strategy to manage capital effectively during this transition.
capital, regulatory, requirements, transition, compliance, column charts, JPMorgan
false
Regulatory and Compliance
Financial Services
Mixed Chart
JP Morgan
Add to my slides
Remove from favorites
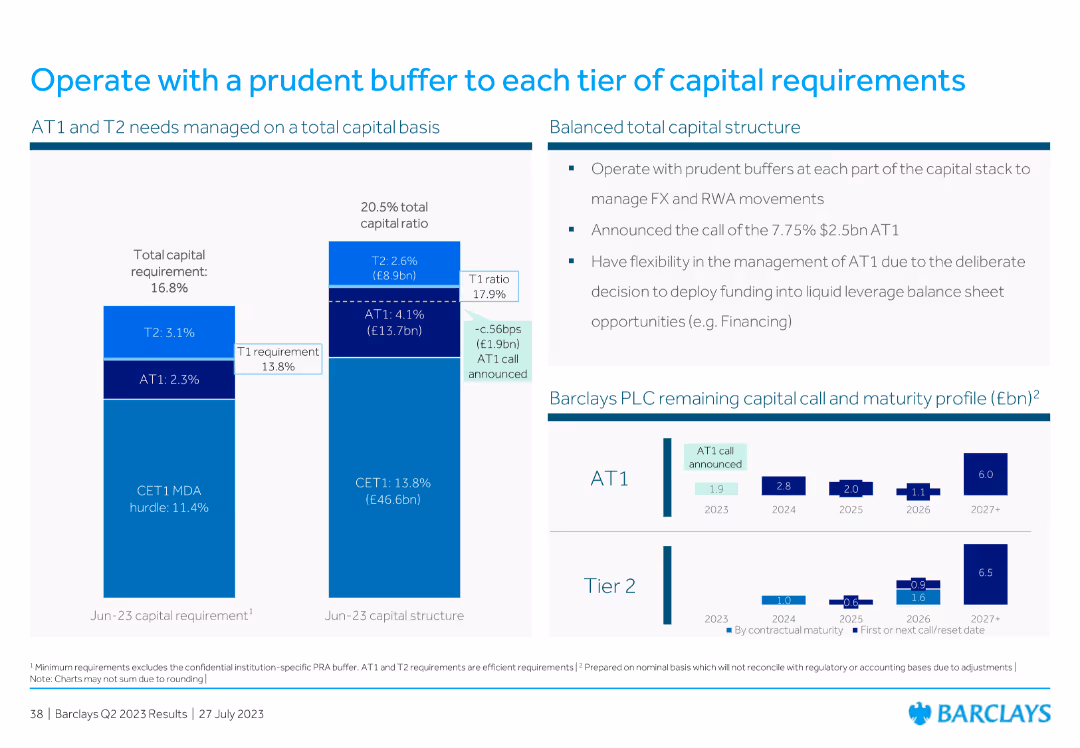
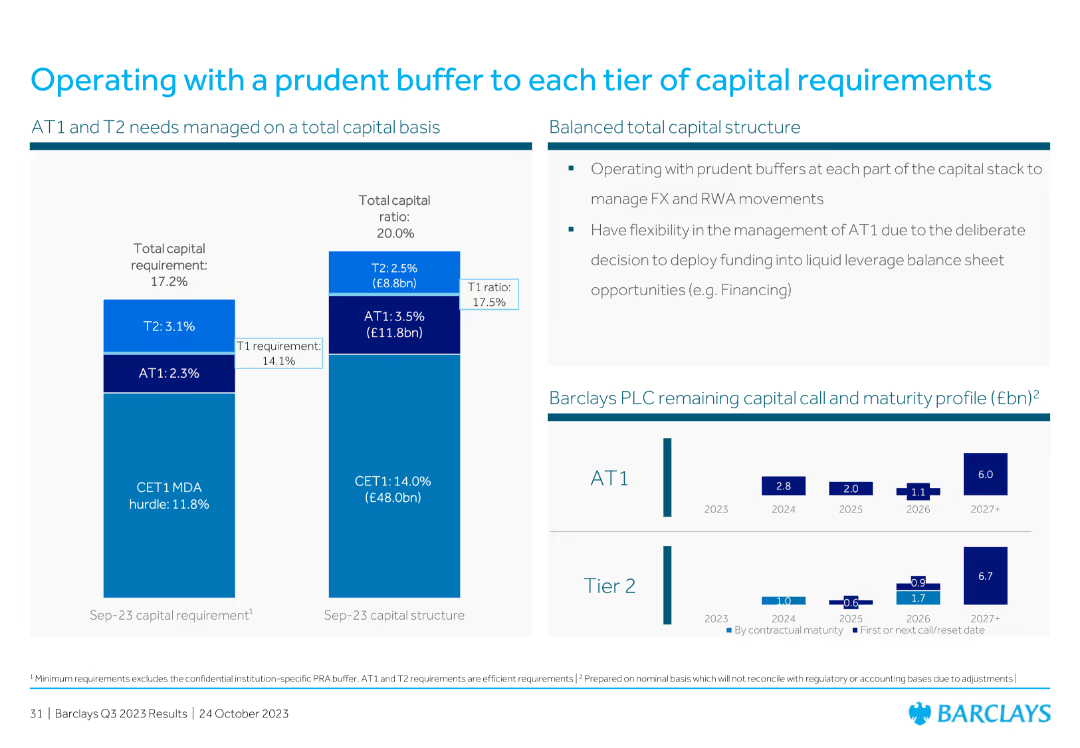
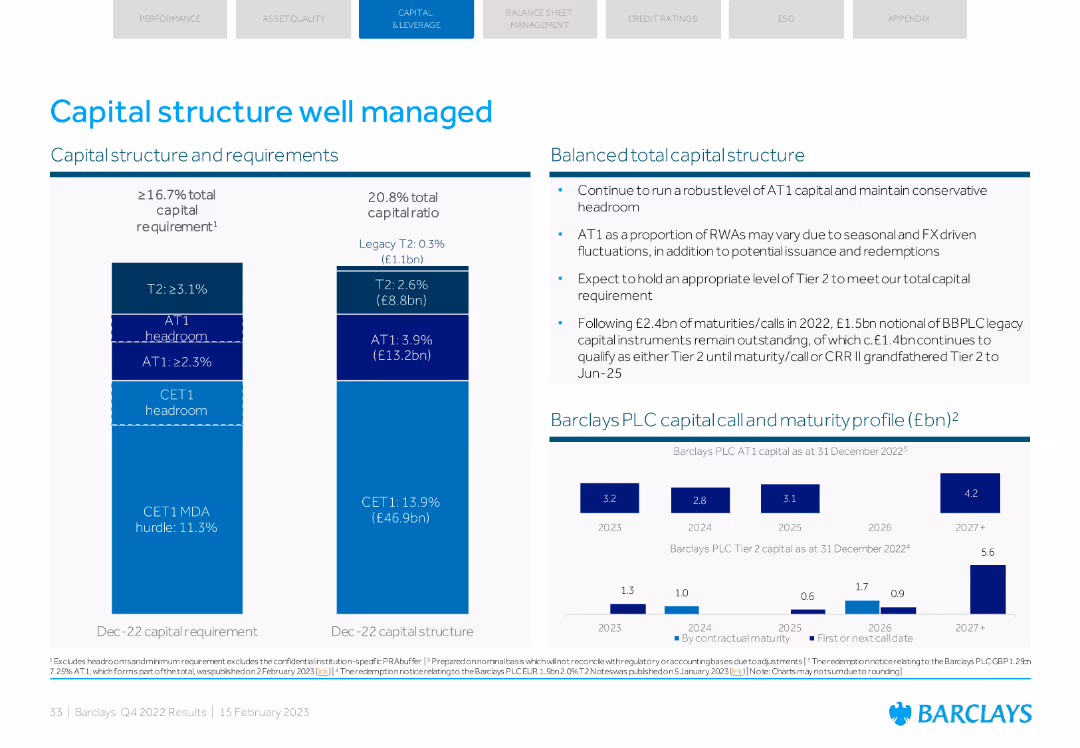
The slide includes a column chart for total capital requirements and structure, highlighting AT1 and T2 needs. It also features a commentary section and a chart showing Barclays PLC’s remaining capital call and maturity profile.
Risk Assessment and Management
Financial Services
The slide outlines the capital requirements and structure, focusing on AT1 and T2 needs and the remaining capital call profile. It includes strategic commentary on managing FX and RWA movements.
capital requirements, AT1, T2, Barclays PLC, maturity profile
false
Risk Assessment and Management
Financial Services
Multiple Chart
Barclays
Add to my slides
Remove from favorites
Presents a series of column chart with quantitative data about Macquarie's capital requirements, accompanied by a side panel detailing key drivers affecting these figures.
Operational Efficiency
Financial Services
This slide analyzes business capital requirements and the key drivers affecting them within Macquarie. It is relevant for discussions on financial planning and operational efficiency.
Capital Requirements, Financial Planning, Key Drivers, Operational Efficiency
false
Operational Efficiency
Financial Services
Mixed Chart
Morgan Stanley
Add to my slides
Remove from favorites
Features column chart indicating business capital requirements over time, with accompanying text boxes detailing key drivers affecting the 3Q20 growth.
Financial Performance
Financial Services
This slide details the growth in business capital requirements as of December 2019, showing the influence of different operating groups and market activities, suitable for financial strategy or market analysis discussions.
capital, requirements, growth, financial, business, MAM, BFS, CGM, MacCap
false
Financial Performance
Financial Services
Mixed Chart
Goldman Sachs
Add to my slides
Remove from favorites
This slide presents a column chart comparing economic capital assessments versus exposure over several years, with clear annotations and color highlights.
Financial Performance
Financial Services
Discusses the significant increase in capital requirements for insurance syndicates, reflecting on market conditions and the implications for risk management strategies.
capital requirements, insurance syndicates, risk management, market conditions, 2019
false
Financial Performance
Financial Services
Mixed Chart
PwC/Strategy&
Add to my slides
Remove from favorites
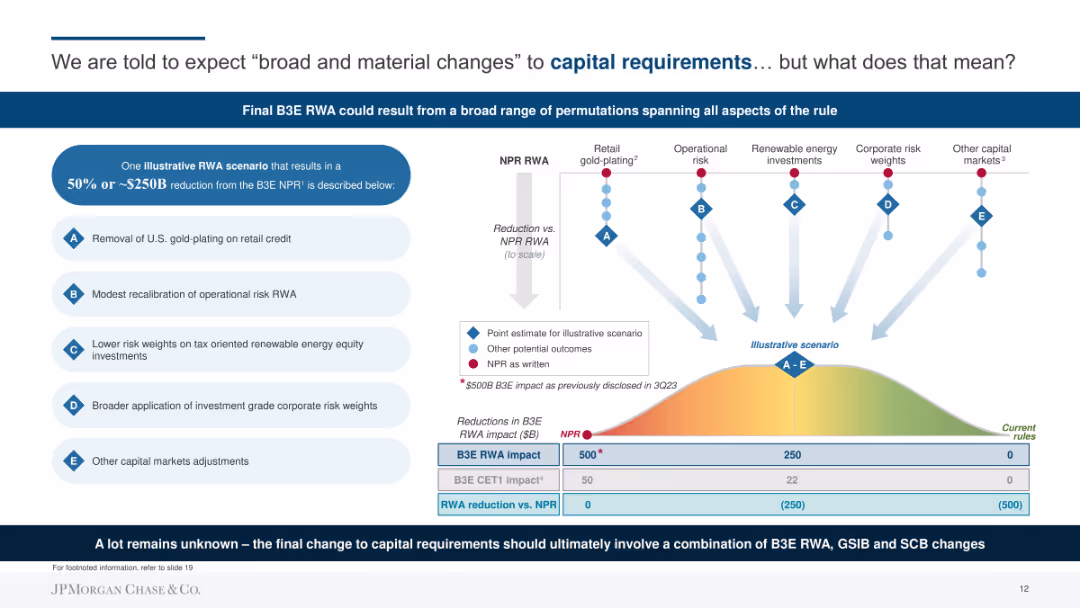
Diagram illustrating possible changes to capital requirements with multiple scenarios and their impacts. Uses arrows and color-coded sections to depict different aspects like operational risk, renewable energy investments, and corporate risk weights.
Regulatory and Compliance
Financial Services
Explains potential changes in capital requirements, highlighting a scenario where B3E RWA could be reduced by 50% or ~$250B. Includes details on operational risk recalibration and other adjustments.
Capital, Requirements, RWA, Risk, Compliance, Regulatory, Financial
false
Regulatory and Compliance
Financial Services
Diagram
JP Morgan
Add to my slides
Remove from favorites
Uses column charts to show T1 and T2 capital structures, headroom, and a balanced total capital structure. Also features text explanations.
Regulatory and Compliance
Financial Services
Describes how Barclays manages capital requirements with buffers for T1 and T2 capital, showing the remaining capital call and maturity profile.
capital requirements, T1, T2, capital structure, headroom, regulatory compliance, capital call, maturity profile, FX, financing
false
Regulatory and Compliance
Financial Services
Multiple Chart
Barclays
Add to my slides
Remove from favorites
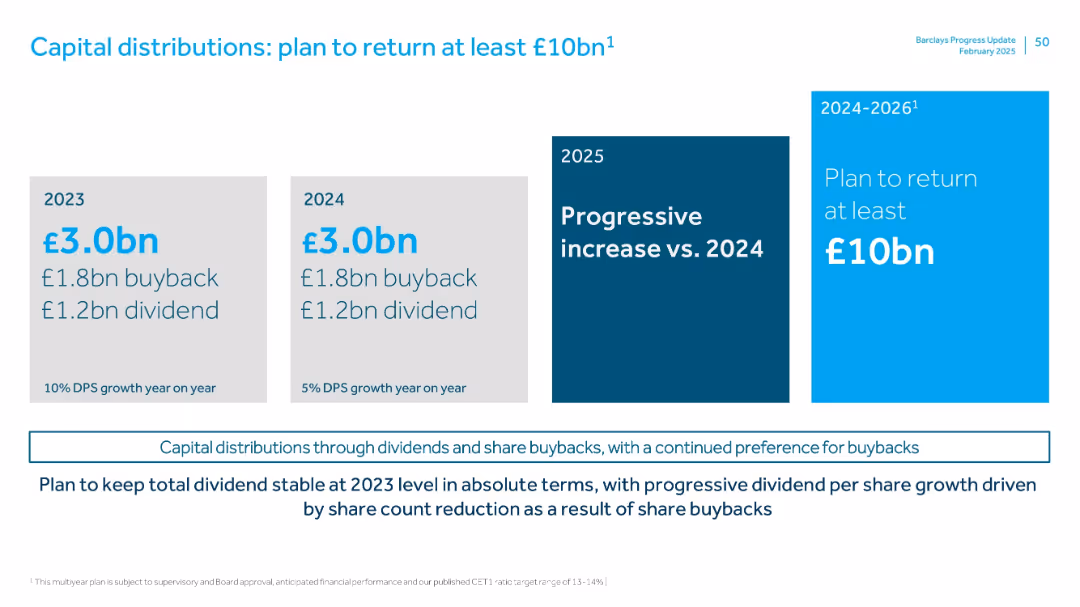
Simple three-block layout with financial highlights per year (2023–2026). Blue and white color-coded tiles.
Corporate Finance and Valuation
Financial Services
Communicates Barclays’ intent to return at least £10bn to shareholders from 2024–2026 via dividends and share buybacks. Describes dividend growth and buyback preferences, with progressive increases in payouts.
capital return, buybacks, dividends, shareholder value, distribution plan
false
Corporate Finance and Valuation
Financial Services
Mixed Chart
Barclays
Add to my slides
Remove from favorites
The slide presents multiple donut charts comparing the return on equity and asset growth across different banking divisions, with textual analysis on the side.
Financial Performance
Financial Services
This slide analyzes the capital allocation and returns on equity across various banking divisions, projecting significant financial growth and detailing the drivers behind these projections, which are essential for understanding strategic financial management within the bank.
Capital, RoTE, Banking Divisions, Growth, Assets
false
Financial Performance
Financial Services
Multiple Chart
Barclays
Add to my slides
Remove from favorites
Utilizes flowcharts and column charts to outline shareholder returns and investment strategies.
Corporate Finance and Valuation
Financial Services
Discusses strategies for capital distribution, focusing on shareholder returns through 2026.
capital, shareholders, 2026, returns, strategy
false
Corporate Finance and Valuation
Financial Services
Linear Flow
Barclays
Add to my slides
Remove from favorites
Two pie charts compare the nature of capital spending today versus the next 30 years. Blue and black are used to illustrate the contrast in spending on high-emissions versus low-emissions assets.
Strategic Planning
Environmental Services & Sustainability
Highlights the shift in capital spending required under a net-zero transition scenario, focusing on the allocation between high-emissions and low-emissions assets. Details the predicted change over the next three decades.
Capital Spending, Net-Zero, Emissions, Transition, Assets, Investment
false
Strategic Planning
Environmental Services & Sustainability
Boxed
McKinsey
Add to my slides
Remove from favorites
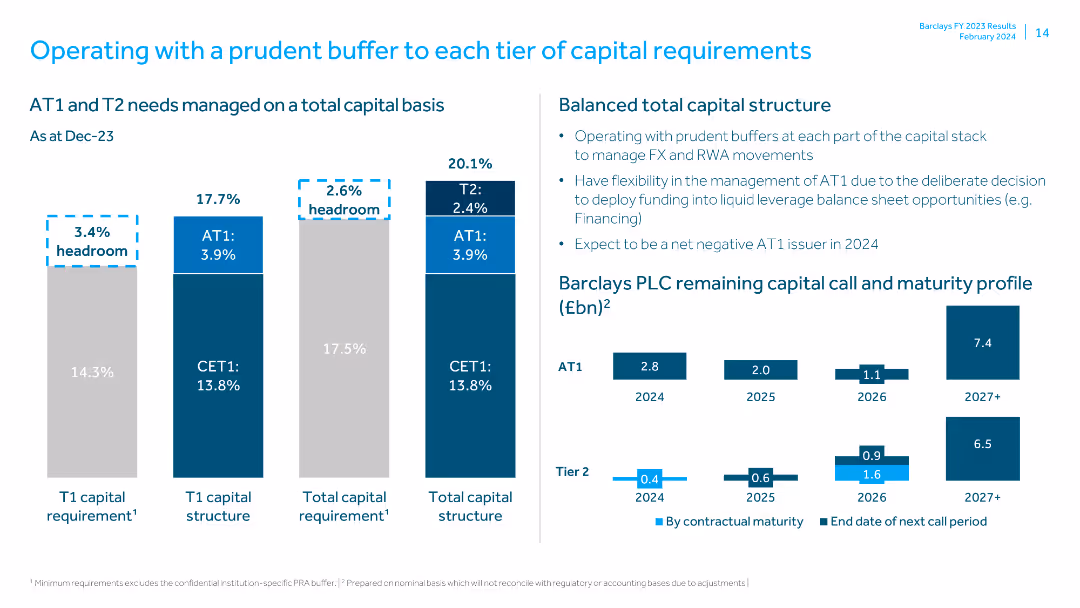
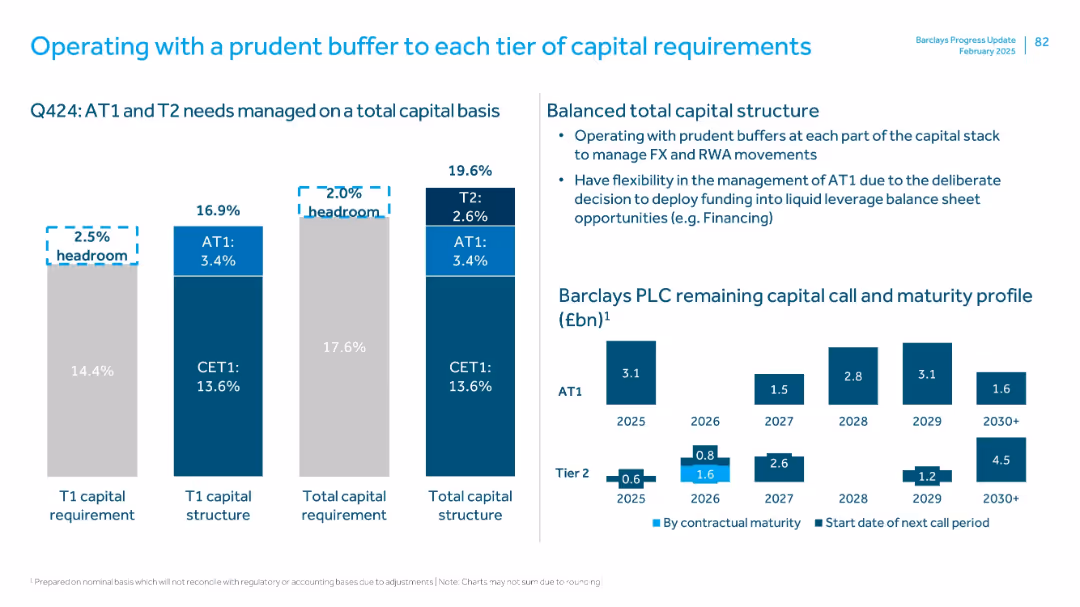
Includes vertical bar charts detailing AT1 and T2 needs, total capital structure, and capital call/maturity profile. The layout is detailed yet clear, focusing on capital management.
Financial Performance
Financial Services
The slide outlines the capital structure, detailing AT1 and T2 requirements, and highlights the bank's strategy to manage FX and RWA movements, ensuring prudent financial management.
capital structure, AT1, T2, capital management, FX, RWA, financial management, maturity profile
false
Financial Performance
Financial Services
Multiple Chart
Barclays
Add to my slides
Remove from favorites
Multiple bar charts comparing capital requirements and structure. Right section shows capital call/maturity profile.
Risk Assessment and Management
Financial Services
Depicts Barclays’ capital structure with headroom in Tier 1 and Total Capital. Shows maturity profile of AT1 and Tier 2 instruments through 2030+. Reinforces prudent buffer strategy and flexible management of capital stack.
capital structure, AT1, T2, CET1, headroom, maturity profile, Barclays
false
Risk Assessment and Management
Financial Services
Multiple Chart
Barclays
Add to my slides
Remove from favorites
Three-part layout: a stacked bar chart for regulatory capital requirement, a current capital structure bar, and a capital maturity profile showing AT1 and Tier 2 maturity timelines.
Corporate Finance and Valuation
Financial Services
Barclays outlines its well-managed capital structure, breaking down its CET1, AT1, and Tier 2 capital layers and maturity profiles. It highlights regulatory requirements, headroom levels, and future capital instrument call/maturity expectations through 2027+.
capital structure, AT1, Tier 2, maturity profile, Barclays
false
Corporate Finance and Valuation
Financial Services
Multiple Chart
Barclays
Add to my slides
Remove from favorites
Similar to slide 3613, it has updated information in its tables of balance sheet data, visualizing book value distribution, in a clean blue and gray layout.
Financial Performance
Financial Services
Provides a current snapshot of the company's capital and balance sheet, useful for financial analysis sessions or presentations to investors concerning the company's capital structure and liquidity.
Capital Structure, Balance Sheet, Liquidity, Valuation
false
Financial Performance
Financial Services
Table
Goldman Sachs
Add to my slides
Remove from favorites
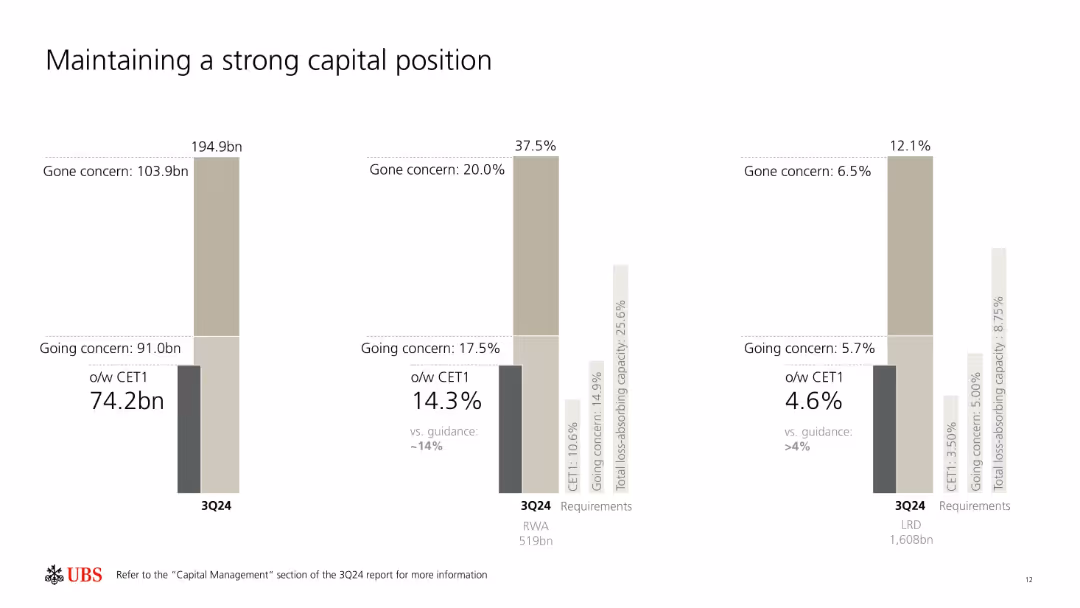
Three vertical bar charts with numerical breakdowns of capital structure and regulatory metrics.
Corporate Finance and Valuation
Financial Services
Emphasizes UBS’s capital structure with a focus on going and gone concern capital, CET1 values, and regulatory compliance. Shows strong CET1 coverage compared to minimum requirements, indicating healthy financial resilience.
capital structure, CET1, UBS, regulatory, 3Q24, capital position
false
Corporate Finance and Valuation
Financial Services
Single Chart
UBS
Add to my slides
Remove from favorites
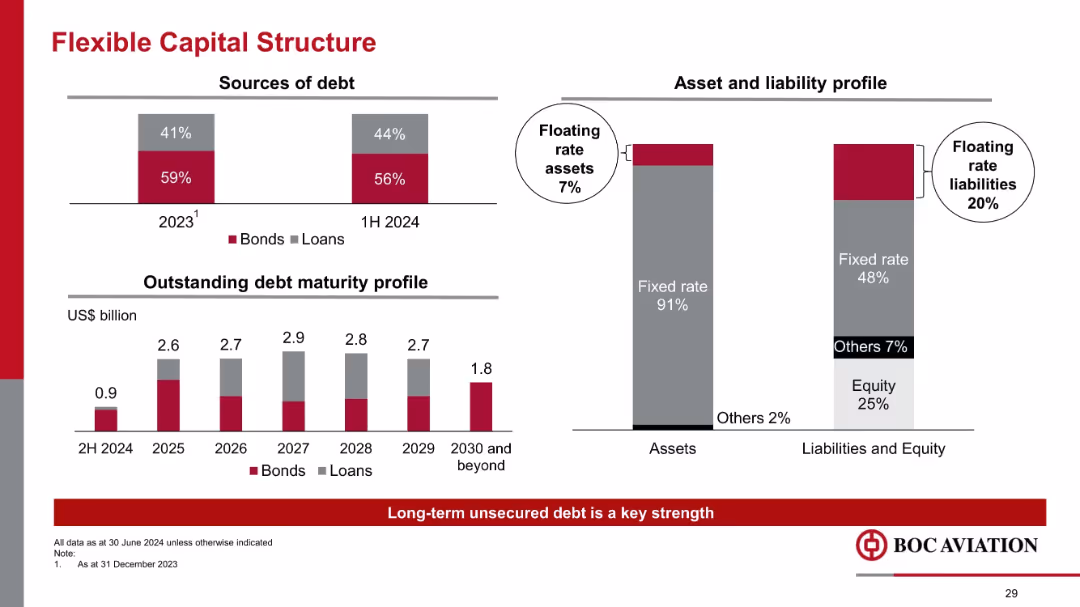
Stacked bar charts and vertical bar layout; financial breakdowns with debt maturity and asset-liability alignment
Risk Assessment and Management
Financial Services
Describes capital structure with a balance between bonds and loans, and maturity profile of debt through 2030. Emphasizes low exposure to floating rate liabilities versus floating rate assets, mitigating interest rate risk.
capital structure, debt maturity, bonds, loans, interest rate risk, fixed rate, liabilities, floating rate
false
Risk Assessment and Management
Financial Services
Multiple Chart
Goldman Sachs
Add to my slides
Remove from favorites
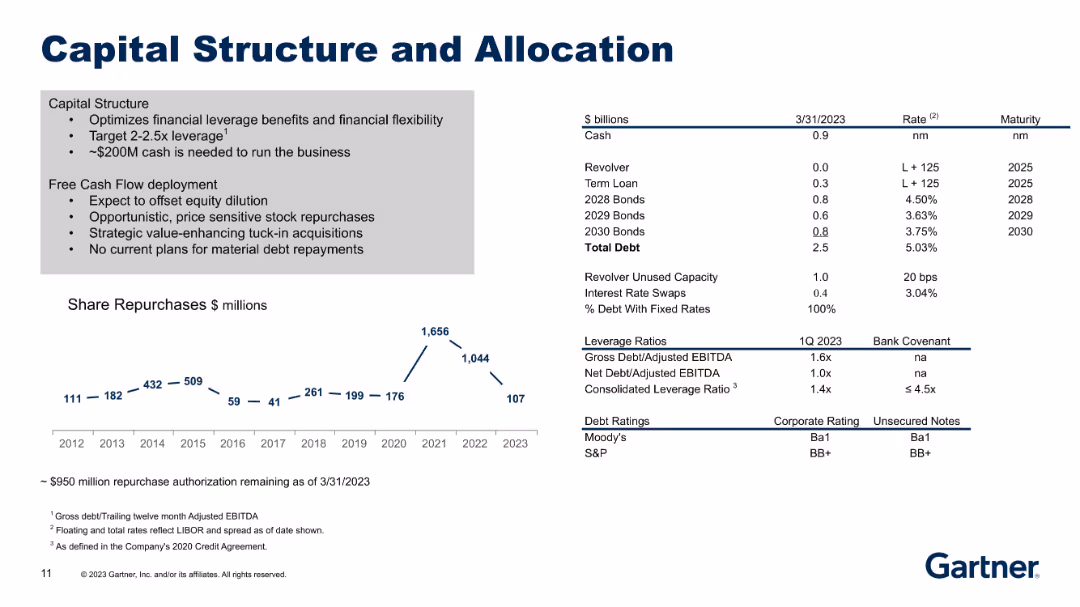
Three sections: capital structure strategy, a share repurchase line chart, and a financial debt table.
Corporate Finance and Valuation
Financial Services
Outlines Gartner’s approach to capital structure, free cash flow use, and debt levels. Shows share repurchase trends from 2012–2023, detailed debt instruments, and leverage ratios. Emphasizes maintaining financial flexibility and offsetting equity dilution.
capital structure, leverage, debt, repurchase, allocation, cash flow
false
Corporate Finance and Valuation
Financial Services
Mixed Chart
Gartner
Add to my slides
Remove from favorites
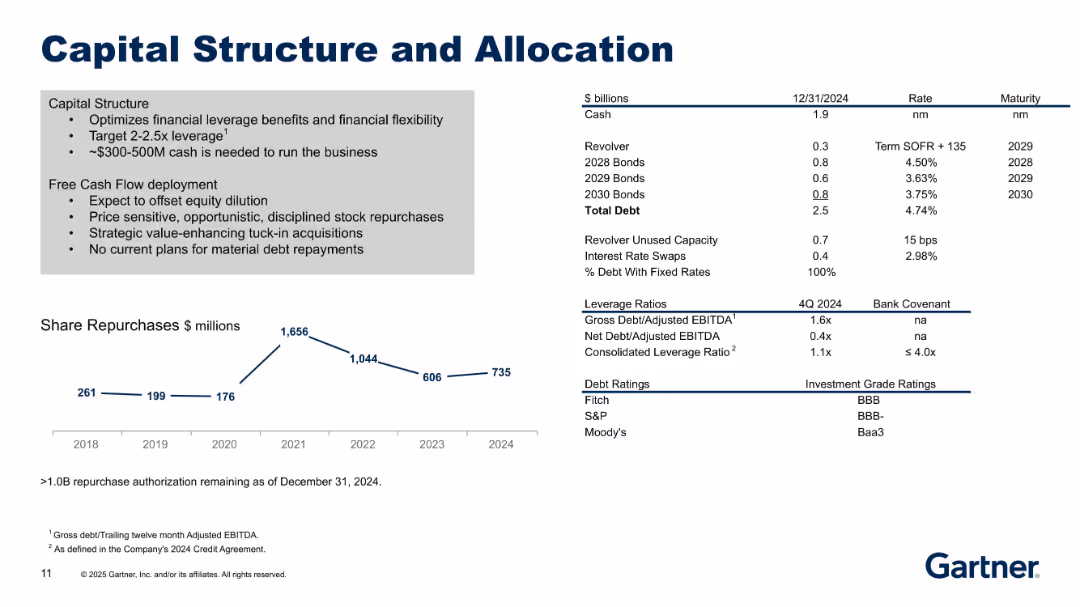
The slide combines text and a line chart. The text details the capital structure and free cash flow deployment, while the chart shows share repurchases over time.
Financial Performance
Financial Services
The slide discusses the capital structure, financial leverage, and free cash flow deployment strategies, including share repurchases and debt metrics.
Capital Structure, Leverage, Free Cash Flow, Share Repurchases, Debt Ratings, Investment Grade
false
Financial Performance
Financial Services
Mixed Chart
Gartner
Add to my slides
Remove from favorites
The slide combines text and a line chart. The text details the capital structure and free cash flow deployment, while the chart shows share repurchases over time.
Financial Performance
Financial Services
It discusses capital structure, financial leverage, free cash flow deployment, including strategic acquisitions, and debt ratings.
Capital Structure, Leverage, Free Cash Flow, Share Repurchases, Debt Ratings, Investment Grade
false
Financial Performance
Financial Services
Mixed Chart
Gartner
Add to my slides
Remove from favorites
Split layout: Left side outlines strategy in bullet points; right side shows financial stats. Bottom line chart of share repurchases over time (2018–2024).
Corporate Finance and Valuation
Financial Services
Describes Gartner's capital allocation strategy including leverage targets, debt structure, and share repurchases. Emphasizes disciplined use of free cash flow, debt profile, and equity dilution considerations.
capital structure, leverage, repurchase, debt, cash flow, allocation
false
Corporate Finance and Valuation
Financial Services
Mixed Chart
Gartner
Add to my slides
Remove from favorites
Balanced layout: left section lists capital structure policies, center shows share repurchase trend, and right contains a table of debt breakdowns.
Corporate Finance and Valuation
Financial Services
The slide highlights capital strategy, share repurchases, debt structure, and leverage ratios. It shows Gartner’s cash levels, bond maturities, interest rates, and debt ratings, along with policies on cash deployment and leverage targets.
Capital Structure, Leverage, Share Repurchase, Debt, Ratings, Cash Flow
false
Corporate Finance and Valuation
Financial Services
Mixed Chart
Gartner
Add to my slides
Remove from favorites
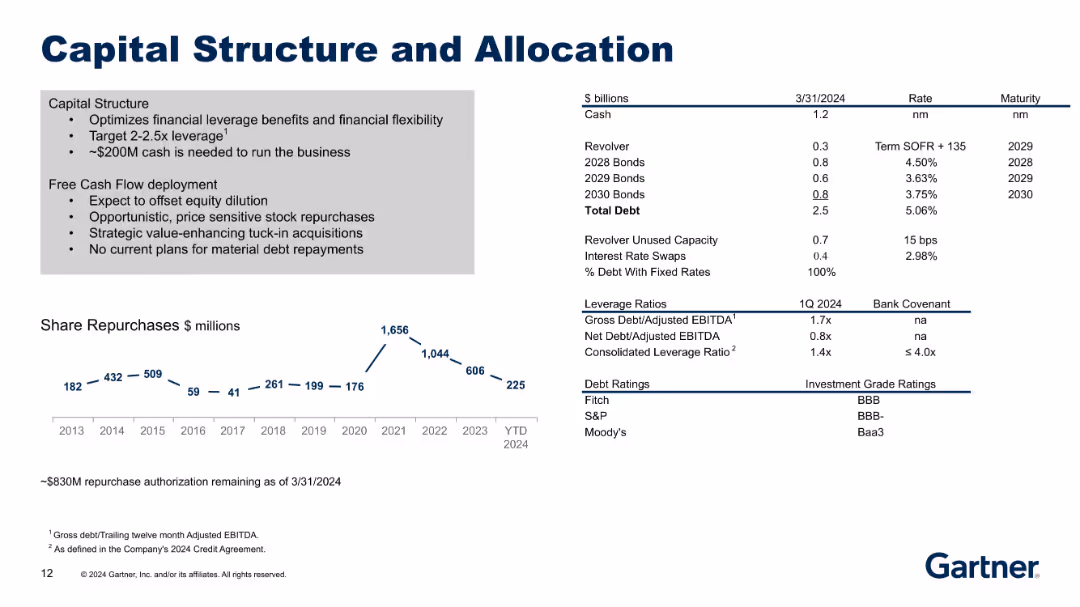
Left side contains bullet points and a line graph for share repurchases; right side features a structured financial table on debt, cash, and leverage ratios.
Corporate Finance and Valuation
Financial Services
Details the company’s capital structure strategy, free cash flow deployment policies, and historical share repurchase data. It includes leverage ratios, debt structure, interest rates, and credit ratings as of Q1 2024.
capital structure, leverage, share repurchases, debt, ratings, cash flow
false
Corporate Finance and Valuation
Financial Services
Mixed Chart
Gartner
Add to my slides
Remove from favorites
A detailed visual with column charts and text explaining capital structure and requirements, along with maturity profile.
Strategic Planning
Financial Services
Describes Barclays' capital structure, requirements, and balanced total capital structure. Includes maturity profiles and expectations for future capital requirements.
capital structure, requirements, maturity, total capital, planning
false
Strategic Planning
Financial Services
Multiple Chart
Barclays
Add to my slides
Remove from favorites
The slide contains multiple bar charts and graphical elements depicting capital structure requirements and surplus metrics, along with maturity profiles.
Strategic Planning
Financial Services
This slide illustrates the capital structure, showing total capital ratios, specific tier requirements, and the maturity profile of remaining capital calls. It emphasizes balanced capital management and future financial planning.
capital structure, surplus, maturity profile, tier
false
Strategic Planning
Financial Services
Multiple Chart
Barclays
Add to my slides
Remove from favorites
This slide contains two column charts with a text box on the side explaining the targets and capital deployment strategies.
Corporate Finance and Valuation
Financial Services
Discusses capital ratio targets and allocation strategies, aimed at financial strategists and investors.
capital targets, CET1 ratio, capital allocation, dividends
false
Corporate Finance and Valuation
Financial Services
Mixed Chart
JP Morgan
Add to my slides
Remove from favorites
The slide features a comparison of RWA composition in 3Q22 and projected 2025, showing a shift towards a capital-light business model with more emphasis on wealth management.
Strategic Planning
Financial Services
The slide outlines the plan to transform into a capital-light model by 2025, reducing investment bank RWA and focusing on wealth management and asset management sectors.
capital, transformation, RWA, wealth, management
false
Strategic Planning
Financial Services
Multiple Chart
Credit Suisse
Add to my slides
Remove from favorites
The slide features a line graph depicting capital deployment and TSR performance, along with bar graphs for dividends.
Financial Performance
Financial Services
This slide presents Booz Allen's financial performance in terms of capital deployment and shareholder dividends. It’s useful for financial reviews and showcasing company growth.
Capital, TSR, Dividends, Performance, Value
false
Financial Performance
Financial Services
Multiple Chart
Booz Allen Hamilton
Add to my slides
Remove from favorites
The slide has two line charts. The left chart shows U.S. real estate cap rates and 10-year U.S. Treasury yield from 1Q82 to 4Q23. The right chart presents the cap rate spreads over the same period.
Market Analysis and Trends
Real Estate & Construction
The slide analyzes the relationship between U.S. real estate cap rates and the 10-year U.S. Treasury yield, providing insights into investment yields and spreads over time. It's valuable for investors seeking to understand cap rate trends and their implications.
cap rates, Treasury yield, investment analysis, real estate, spreads, historical data
false
Market Analysis and Trends
Real Estate & Construction
Multiple Chart
JP Morgan
Add to my slides
Remove from favorites
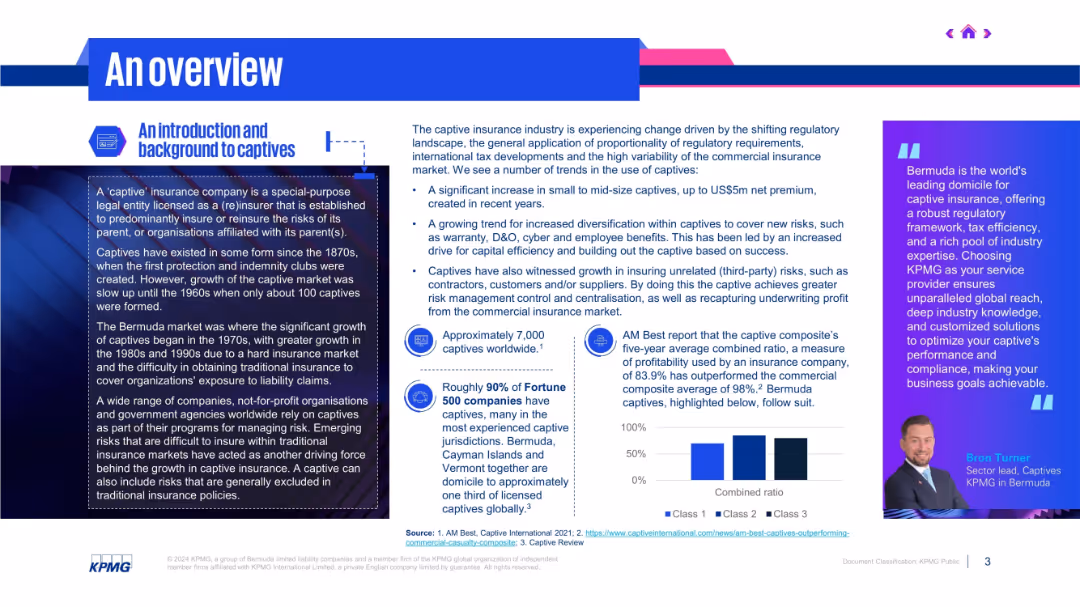
Two-column layout; left side defines captives and history; right side explains market shifts and trends in bullet form.
Industry Overview
Financial Services
The slide introduces the captive insurance market, noting increased adoption due to regulatory changes, cost control, and risk management benefits. It mentions Bermuda’s prominence and growth in third-party risk insurance and diversification within captive structures.
captive insurance, regulation, Bermuda, risk management, diversification
false
Industry Overview
Financial Services
Mixed Chart
KPMG
Add to my slides
Remove from favorites
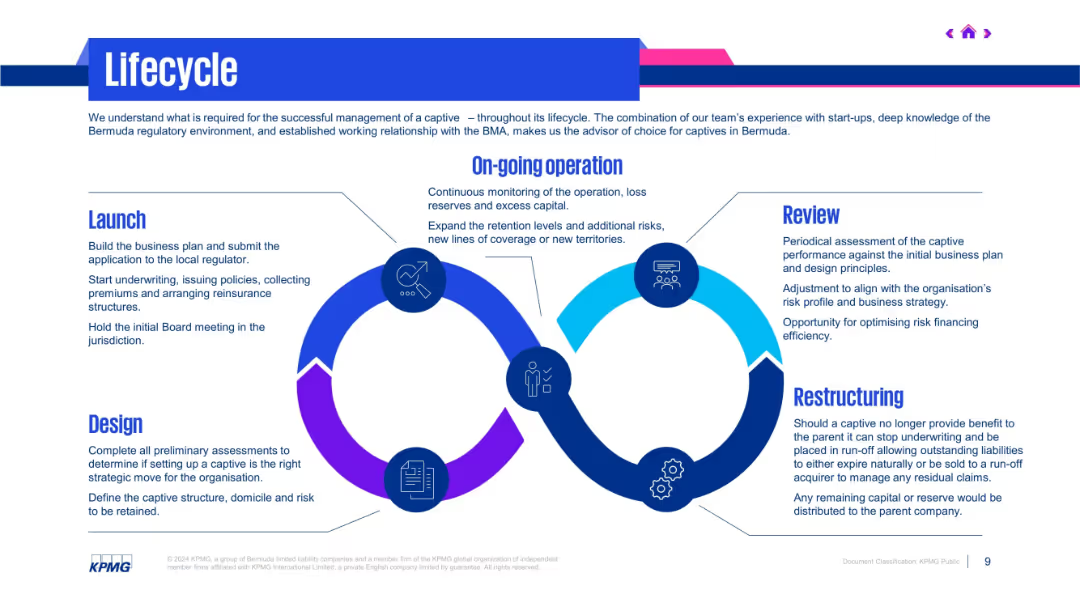
Circular flowchart showing five lifecycle stages with icons and text around it. Modern blue and purple tones.
Operational Efficiency
Professional Services
Illustrates the full lifecycle of managing a captive—from design and launch to ongoing operations, review, and potential restructuring. It emphasizes monitoring, strategic alignment, and regulatory requirements in Bermuda.
captive lifecycle, design, launch, review, restructuring, KPMG
false
Operational Efficiency
Professional Services
Vertical Flow
KPMG
Add to my slides
Remove from favorites
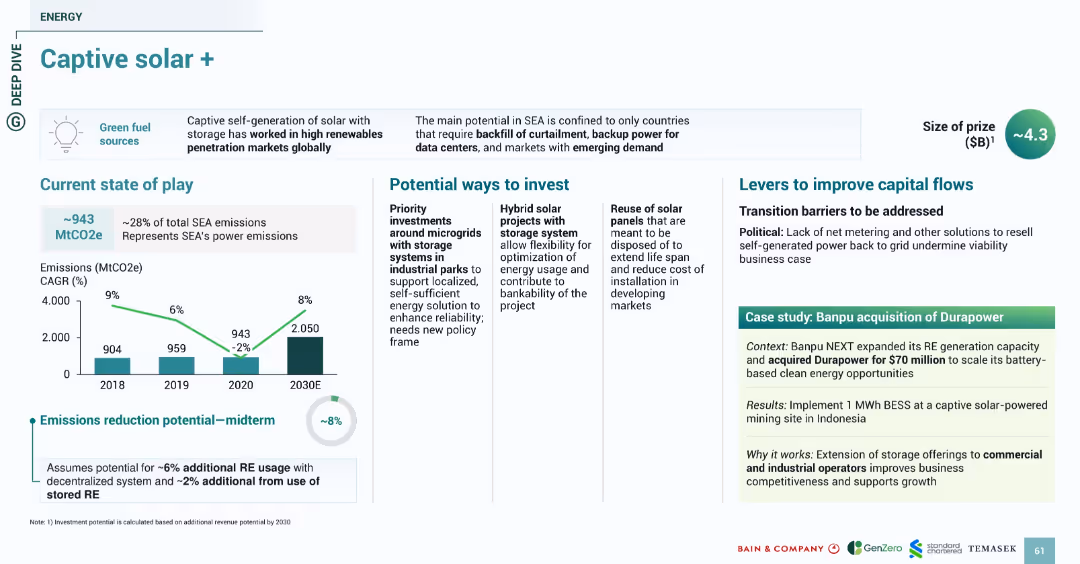
Standard slide format with clear sections, bar chart, and green-accented case study. Layout aligns with prior energy-focused slides for coherence.
Investment Analysis
Energy & Utilities
This slide introduces captive solar generation with storage as a decentralized renewable energy solution, especially for industrial parks. Midterm reduction potential is ~8%. Investment opportunities include microgrids, hybrid solar-storage systems, and panel reuse. Banpu’s $70M acquisition of Durapower is cited as a case supporting commercial/industrial storage solutions for competitiveness and growth.
captive solar, microgrid, battery storage, Banpu, Durapower, energy, emissions, SEA
false
Investment Analysis
Energy & Utilities
Multiple Chart
Bain
Add to my slides
Remove from favorites
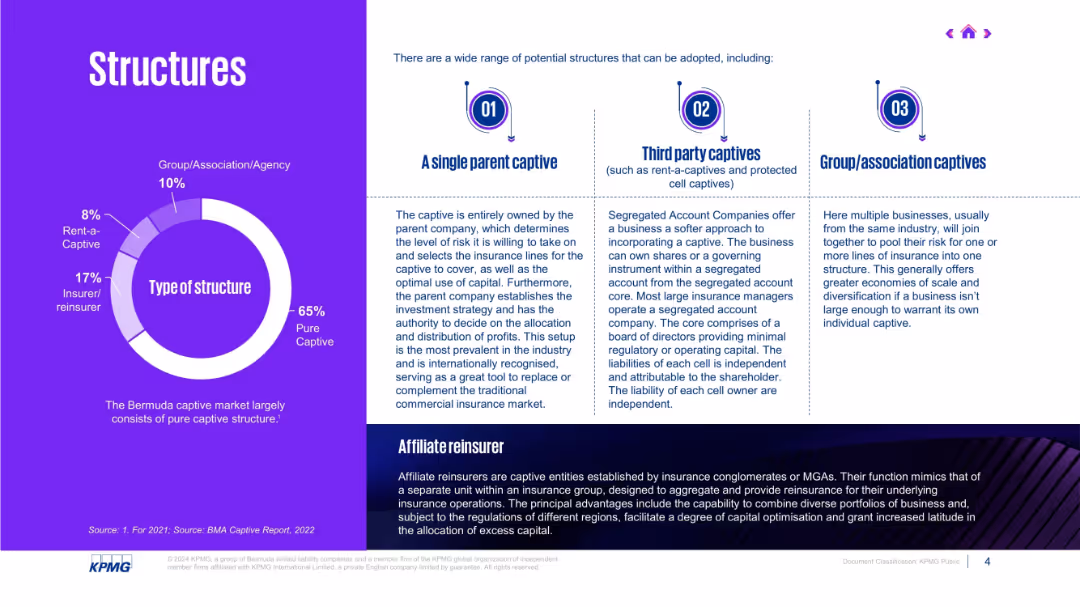
Donut chart on captive structures with accompanying definitions; 3-column layout for captive types.
Product and Service Analysis
Financial Services
The slide details the different types of captive structures (e.g., pure, third-party, group), noting that 65% are pure captives. It also describes the strategic benefits of each structure, from capital efficiency to group risk pooling, emphasizing their flexibility in modern insurance strategies.
captive types, insurance, structure, pure captive, group, rent-a-captive
false
Product and Service Analysis
Financial Services
Mixed Chart
KPMG
Add to my slides
Remove from favorites
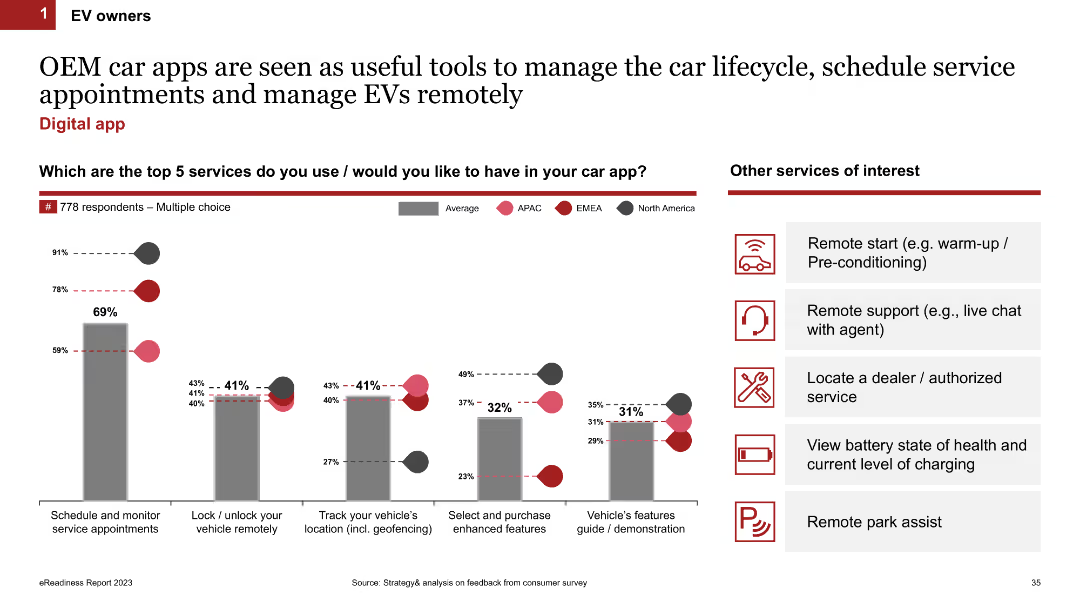
The slide features a column chart showing the top five services EV owners use or would like to have in their car app, with regional breakdowns (APAC, EMEA, North America). It also includes icons representing additional services of interest.
Technology and Digital Transformation
Transportation & Logistics
This slide discusses the popularity and desired features of OEM car apps for EV owners, with a focus on managing the car lifecycle and scheduling service appointments. It highlights regional preferences and additional desired services.
car apps, OEM, lifecycle management, services, regional differences, EV owners
false
Technology and Digital Transformation
Transportation & Logistics
Mixed Chart
PwC/Strategy&
Add to my slides
Remove from favorites
A slide with three vertical column charts showing the percentage share of respondents' preferences for car body styles (SUV, Sedan, Hatchback) across global, new car, and used car segments.
Customer and Market Segmentation
Transportation & Logistics
This slide presents survey data on car body style preferences, showing that 43% of respondents favor SUVs for new cars, while preferences for used cars are more evenly distributed.
car body style, SUV, sedan, hatchback, survey, market preference, new cars, used cars, global, data visualization
false
Customer and Market Segmentation
Transportation & Logistics
Mixed Chart
EY
Add to my slides
Remove from favorites
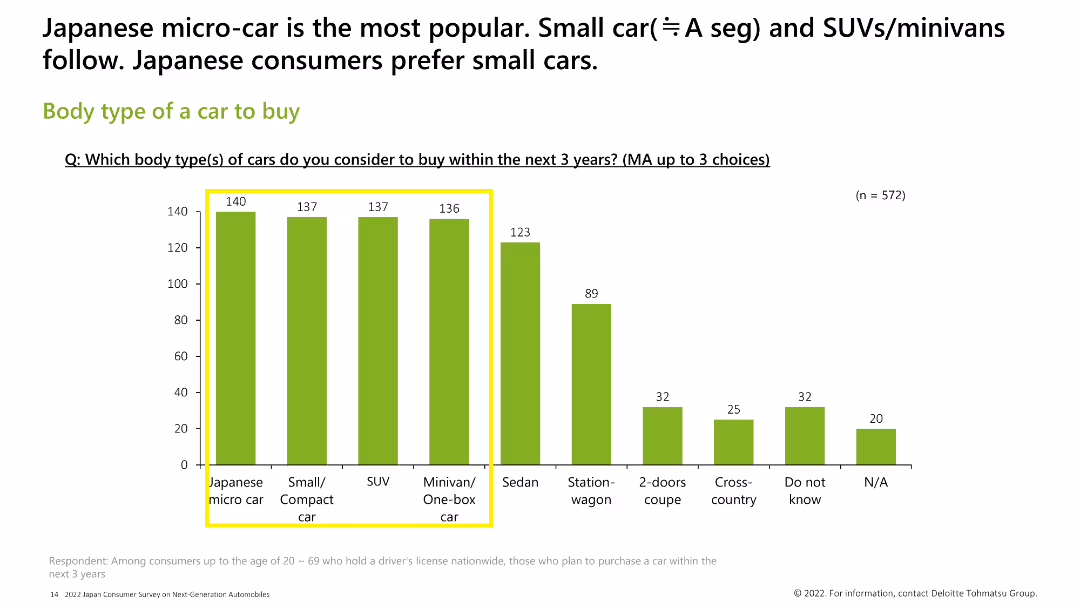
Contains a horizontal bar chart showing the preferred body types of cars for future purchases among respondents.
Market Analysis and Trends
Consumer Goods
The slide presents data on the types of cars respondents plan to buy within the next three years, with small/compact cars and SUVs being the most popular choices.
car body types, future purchases, preferences, survey
false
Market Analysis and Trends
Consumer Goods
Single Chart
Deloitte
Add to my slides
Remove from favorites
This slide contains a table that lists various business cases for hydrogen production, their extra costs, and associated carbon abatement costs, with some horizontal bar charts for visualization.
Risk Assessment and Management
Energy & Utilities
The slide presents different business cases for hydrogen production in 2030, including centralized production, power-to-gas, power-to-power, power-to-molecule, and hydrogen vehicles. It details the additional costs and carbon abatement costs for each case.
carbon abatement, costs, hydrogen, business cases, 2030
false
Risk Assessment and Management
Energy & Utilities
Mixed Chart
Kearney
Add to my slides
Remove from favorites
Includes a grid analysis of different sectors based on carbon abatement potential and various investment criteria like economics and public sentiment.
Risk Assessment and Management
Environmental Services & Sustainability
Evaluates sectors for investment based on carbon abatement potential and attractiveness up to 2030.
carbon abatement, investment attractiveness, sector analysis, SEA
false
Risk Assessment and Management
Environmental Services & Sustainability
Table
Bain
Add to my slides
Remove from favorites
The slide features a line chart comparing CAC vs. CO₂ emissions from electricity generation for various scenarios. It is detailed with clear comparative data.
Risk Assessment and Management
Energy & Utilities
Analyzes the carbon abatement cost compared to IPCC recommendations, even with a fully decarbonized electrical mix, using comparative emissions data.
carbon abatement, IPCC recommendation, decarbonized mix, electricity generation, CO₂ emissions, comparative analysis
false
Risk Assessment and Management
Energy & Utilities
Mixed Chart
Kearney
Add to my slides
Remove from favorites
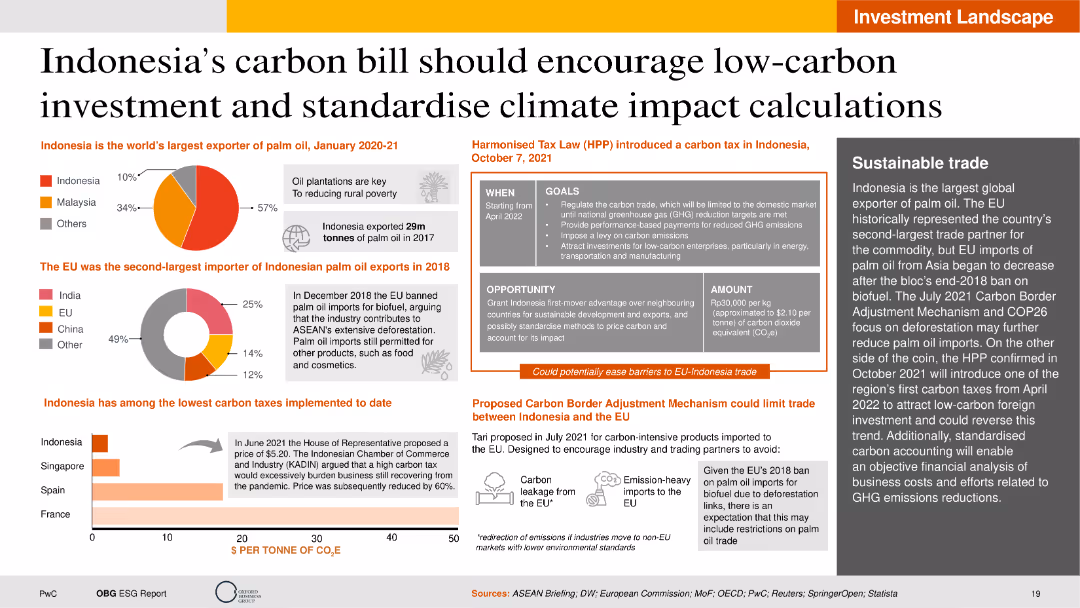
This slide contains pie charts, column charts, and tables, providing visual representations of Indonesia's carbon bill, global palm oil exportation data, and carbon tax implementations. The layout is detailed, with varied graphical data and supporting text.
Regulatory and Compliance
Energy & Utilities
The slide explains the implications of Indonesia's carbon bill in encouraging low-carbon investments and standardizing climate impact calculations. It details the global export of palm oil, EU import bans, and the harmonized tax law for carbon taxation in Indonesia. It also presents a comparative analysis of carbon taxes implemented by different countries and the potential effects of the carbon border adjustment mechanism.
Carbon bill, low-carbon investment, palm oil export, carbon tax, EU ban
false
Regulatory and Compliance
Energy & Utilities
Multiple Chart
PwC/Strategy&
Add to my slides
Remove from favorites
Features a detailed diagram of the integration of CCS with SMR, listing various options for CO2 capture, their descriptions, maturity, and capture rates.
Technology and Digital Transformation
Energy & Utilities
Explains how combining carbon capture and storage (CCS) with steam methane reforming (SMR) can reduce CO2 emissions, detailing different capture options and efficiencies.
Carbon capture, CCS, SMR, CO2 emissions, production integration
false
Technology and Digital Transformation
Energy & Utilities
Diagram
Kearney
Add to my slides
Remove from favorites
Includes a flow diagram illustrating the CCS value chain, from CO2 capture to transport and storage, with text explanations for each stage.
Regulatory and Compliance
Energy & Utilities
Describes the carbon capture and storage (CCS) process, detailing the stages from capturing CO2 emissions to transporting and storing them, emphasizing abatement technologies.
Carbon capture, storage, CCS, CO2 emissions, value chain
false
Regulatory and Compliance
Energy & Utilities
Linear Flow
Kearney
Add to my slides
Remove from favorites
The slide includes column charts showing the avoided CO₂ emissions and abatement costs for different energy sources and scenarios. It's visually clear and complex.
Regulatory and Compliance
Energy & Utilities
Discusses the necessary carbon pricing for methanation to be competitive with natural gas, presenting detailed CO₂ emissions and abatement cost analysis.
carbon cost, methanation, natural gas, CO₂ emissions, abatement cost, competitive pricing, regulatory analysis
false
Regulatory and Compliance
Energy & Utilities
Multiple Chart
Kearney
Add to my slides
Remove from favorites
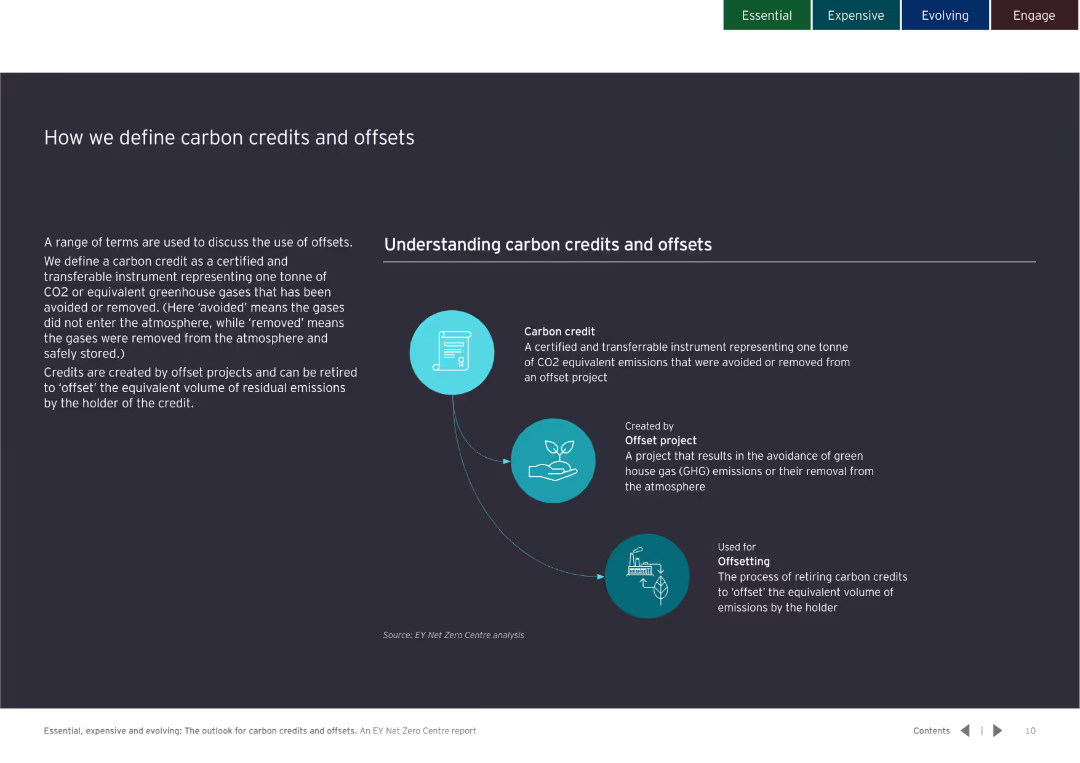
Contains detailed text definitions and an infographic explaining carbon credits and offsets, including creation and use.
Regulatory and Compliance
Environmental Services & Sustainability
Defines carbon credits as instruments for avoided or removed CO2 emissions, explaining their creation through offset projects and usage in emission reductions.
Carbon, credit, offset, definition, regulation, compliance, CO2, emissions, reduction
false
Regulatory and Compliance
Environmental Services & Sustainability
Diagram
EY
Add to my slides
Remove from favorites
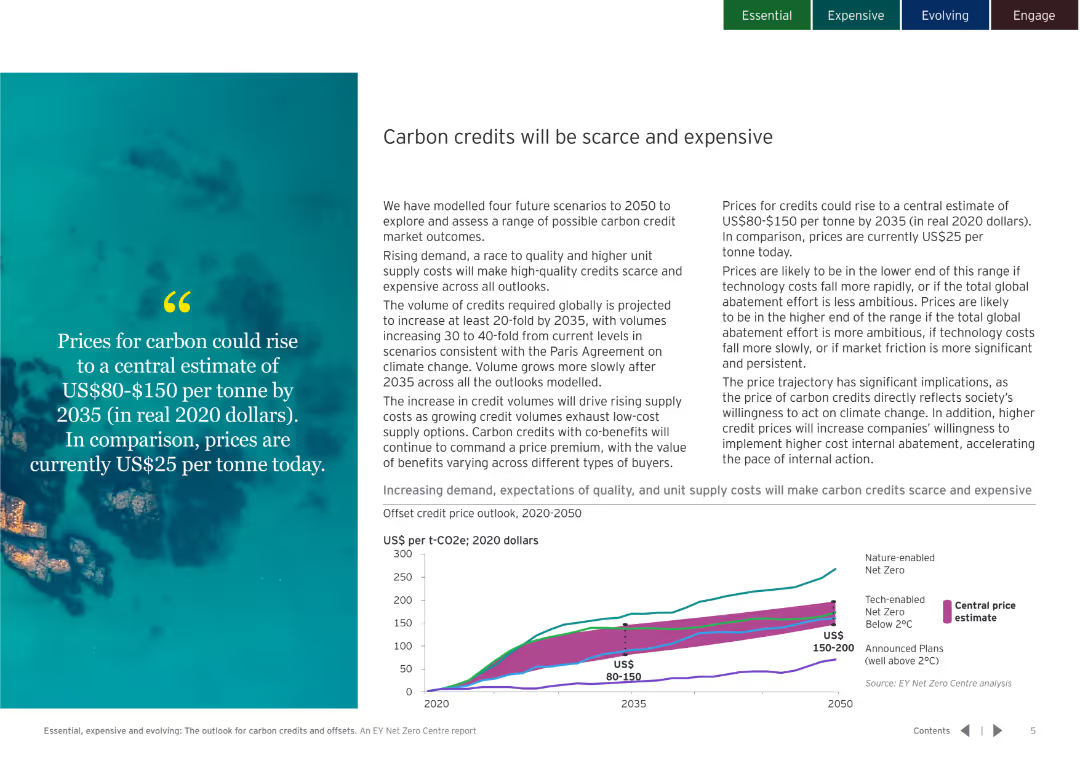
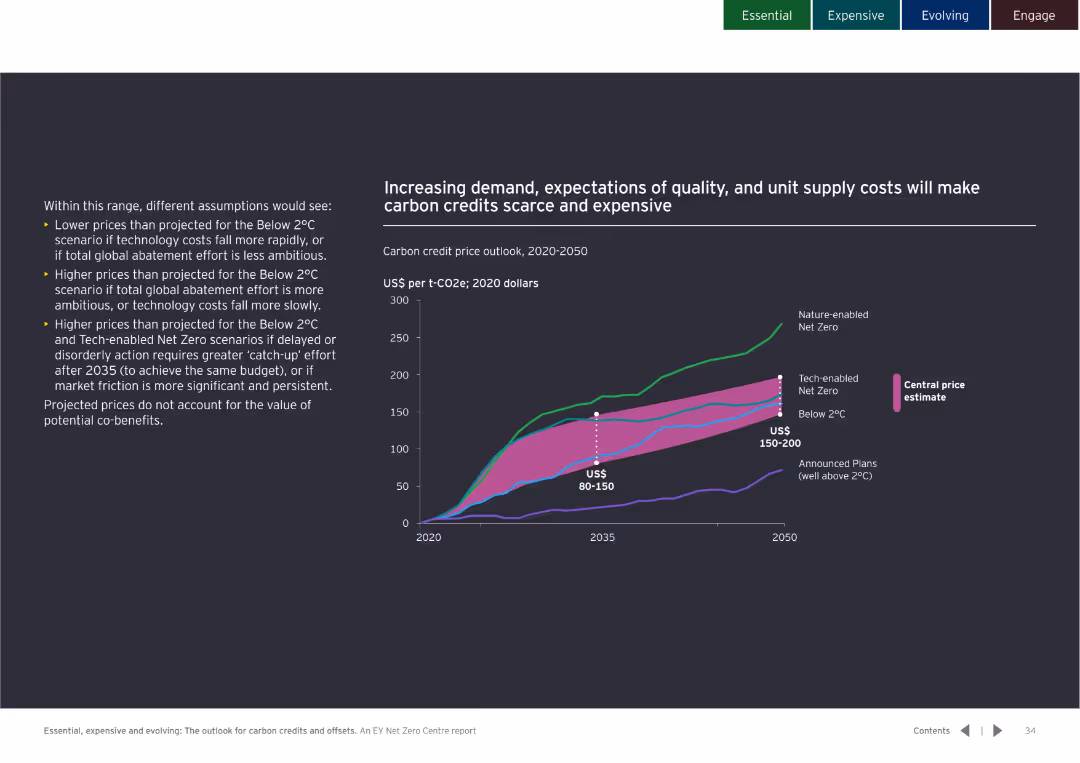
The slide combines text with an image and a line chart. The line chart shows projected carbon credit prices from 2020 to 2050 under different scenarios.
Strategic Planning
Environmental Services & Sustainability
It discusses the rising demand and costs for carbon credits by 2035, projecting prices to be between US$80-$150 per tonne. Emphasizes the importance of high-quality credits.
Carbon, credit, price, forecast, demand, 2035, scenario, cost, sustainability
false
Strategic Planning
Environmental Services & Sustainability
Mixed Chart
EY
Add to my slides
Remove from favorites
Dark background with a line graph showing the projected carbon credit prices up to 2050. Different scenarios color-coded for clarity.
Financial Performance
Environmental Services & Sustainability
Provides projections for carbon credit prices, factoring in various scenarios and their impact on pricing trends and market conditions.
carbon credit prices, market conditions, projections
false
Financial Performance
Environmental Services & Sustainability
Mixed Chart
EY
Add to my slides
Remove from favorites
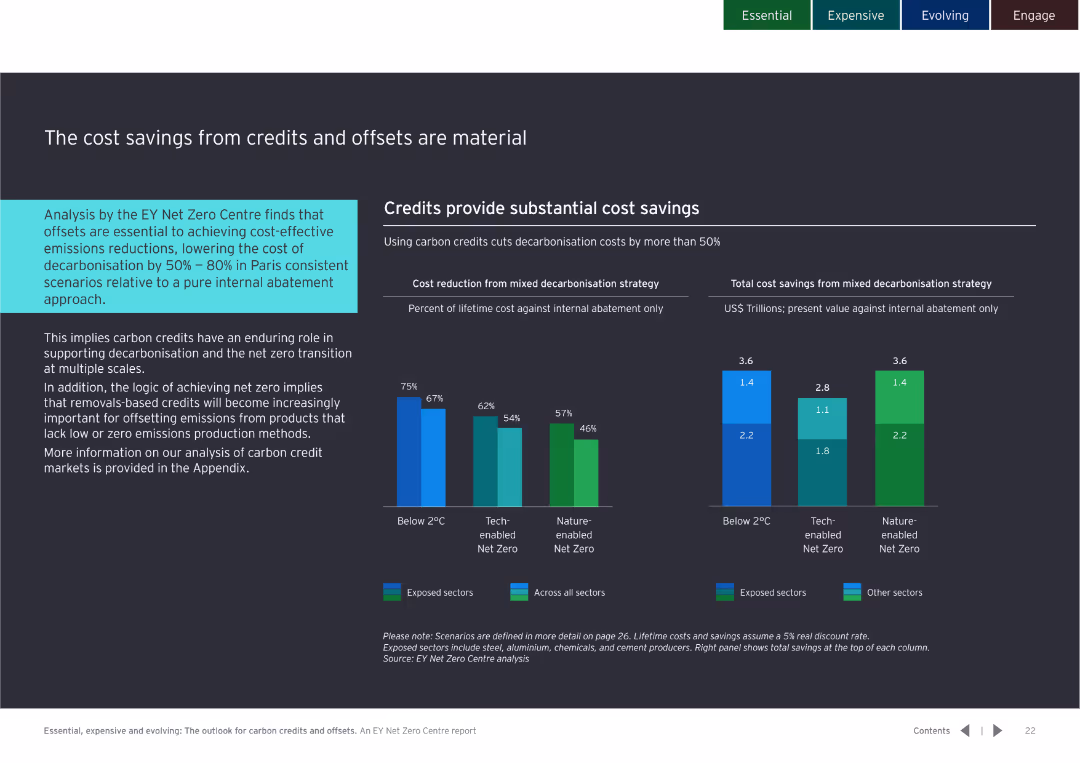
Dark background with bar and column charts showing cost savings and carbon credits; text blocks providing analysis and implications.
Financial Performance
Environmental Services & Sustainability
Highlights the importance of carbon credits in achieving cost-effective emissions reductions. Provides detailed cost-saving scenarios.
carbon credits, cost savings, emissions reduction
false
Financial Performance
Environmental Services & Sustainability
Multiple Chart
EY
Add to my slides
Remove from favorites
Contains a table and textual information arranged in a balanced format. Visual elements are used to represent data effectively, with contrasting colors for different categories and detailed annotations for clarity.
Investment Analysis
Environmental Services & Sustainability
Details the investment opportunities in project development for carbon credit trading in Indonesia and Malaysia, discussing the market size, potential profits, and strategic development opportunities in the forestry sector.
carbon credits, Indonesia, Malaysia, forestry, investment opportunities
false
Investment Analysis
Environmental Services & Sustainability
Header Horizontal
Bain
Add to my slides
Remove from favorites
Features a table with a well-organized layout. Each section is divided by clear headings, and the color scheme is consistent, enhancing readability. Information is presented through a mix of visuals and brief textual explanations.
Market Analysis and Trends
Environmental Services & Sustainability
Explores the potential value in developing projects related to carbon credit trading, focusing on the Southeast Asian market. It assesses various phases such as project design, implementation, and monitoring, providing estimated market sizes and profit margins.
carbon credits, market value, SEA, project development, trading
false
Market Analysis and Trends
Environmental Services & Sustainability
Table
Bain
Add to my slides
Remove from favorites
Previous
Next
You don't have any favorites yet.
Please wait loading your favorites slides...
Create a FREE account to continue browsing
Receive Instant Access to 1,000+ slides from companies like McKinsey, Google, and Goldman Sachs
First Name
Last Name
Email
Password
I agree to all
Terms & Privacy Policy
Thank you! Your submission has been received!
Oops! Something went wrong while submitting the form.
Have an account?
Sign in
Upgrade to PRO to Save slides
Advanced Search and Filters
Access to 15,000+ slides
Access to Category Pages
Save/Bookmark Slides
PowerPoint Template Library
Pick a Plan
MONTHLY
$12/month
Billed every month, Cancel anytime.
YEARLY
$9/year
Billed $108 annually, Cancel anytime.
Checkout for $12/month
Checkout for $108/yr
Secured by Stripe | AES-256 bit encryption