My Account
My Slides
Search by Category
Companies
Slide Type
Use Case
Industry
Pricing
Templates
View All Templates
Download Template Slides
✦ AI
AI Prompt Library
AI Search
Feedback
Login
Logout
Get Started
Browse all Slides
Browse all Slides
Create a FREE Account
Instant access to 1,000+ real slides from top companies like McKinsey, BCG, Goldman Sachs, Google and many more!
First Name
Last Name
Email
Password
I agree to all
Terms & Privacy Policy
Thank you! Your submission has been received!
Oops! Something went wrong while submitting the form.
Have an account?
Sign in
Saved Slides
Total No. of slides saved
0
↻ Refresh
✖ Clear all
This slide features bar charts comparing carbon emissions across different regions using both accounting methods. The bar charts are displayed side-by-side, with clear labels and distinct color coding for consumption-based and production-based emissions.
Market Analysis and Trends
Government & Public Sector
The slide compares regional carbon emissions under production-based and consumption-based accounting methods, highlighting the differences in reported emissions. It underscores how consumption-based accounting reveals higher emissions for regions like the US and EU due to their imported goods, advocating for more comprehensive emissions tracking.
Carbon Emissions, Accounting, Regional Comparison, Consumption, Production
false
Market Analysis and Trends
Government & Public Sector
Multiple Chart
EY
Add to my slides
Remove from favorites
Features a world map highlighting the top five carbon-emitting countries, using color coding and percentages to show the proportion of emissions each country contributes.
Regulatory and Compliance
Environmental Services & Sustainability
Analyzes the carbon emission contributions of the top five countries, highlighting the significant role of major economies in global emissions. Useful for discussions on international cooperation and policy-making for emission reduction.
Carbon emissions, Countries, Global share, Climate policy
false
Regulatory and Compliance
Environmental Services & Sustainability
Multiple Chart
BCG
Add to my slides
Remove from favorites
Features stacked column charts displaying carbon emissions by sector across different countries in Southeast Asia.
Regulatory and Compliance
Energy & Utilities
Details the contribution of different sectors to carbon emissions in Southeast Asia, emphasizing energy and agri-food.
carbon emissions, energy sector, agri-food, SEA, regulatory compliance
false
Regulatory and Compliance
Energy & Utilities
Multiple Chart
Bain
Add to my slides
Remove from favorites
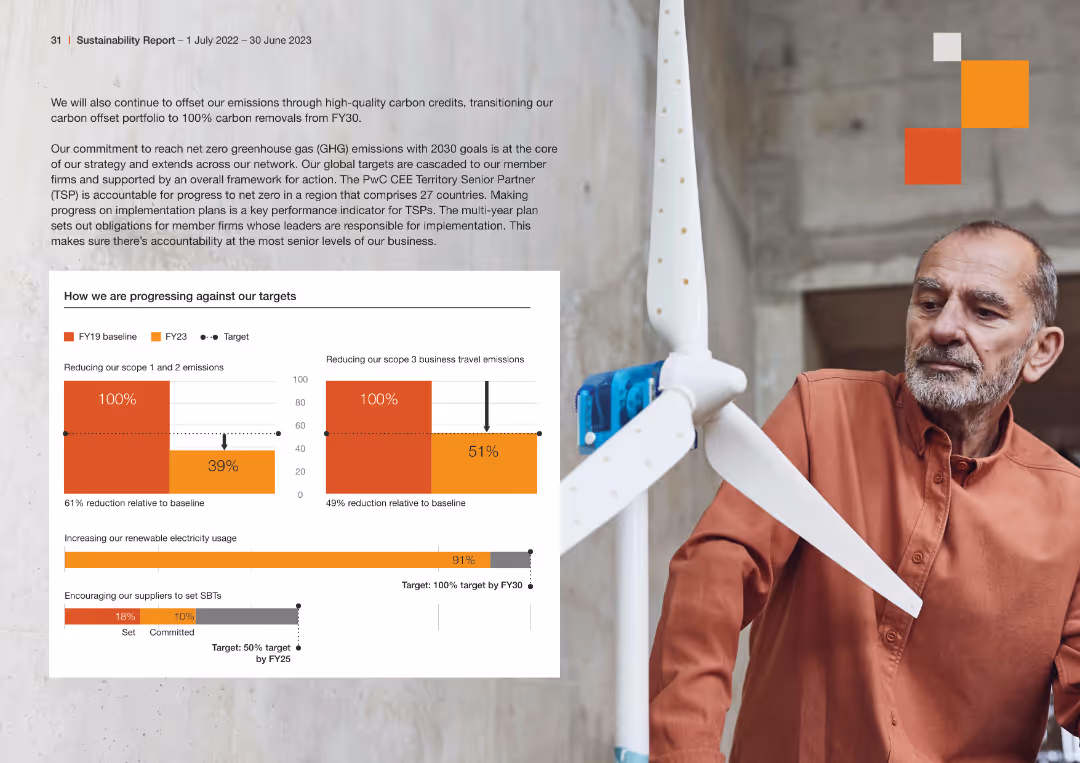
Bar charts showing progress against targets for reducing scope 1, 2, and 3 emissions, increasing renewable electricity usage
Regulatory and Compliance
Environmental Services & Sustainability
The slide outlines the progress made in FY23 towards reducing carbon emissions and increasing renewable energy usage, comparing it against baseline targets, highlighting significant reductions and ongoing commitments
carbon emissions, progress, renewable energy, regulatory compliance, FY23
false
Regulatory and Compliance
Environmental Services & Sustainability
Multiple Chart
PwC/Strategy&
Add to my slides
Remove from favorites
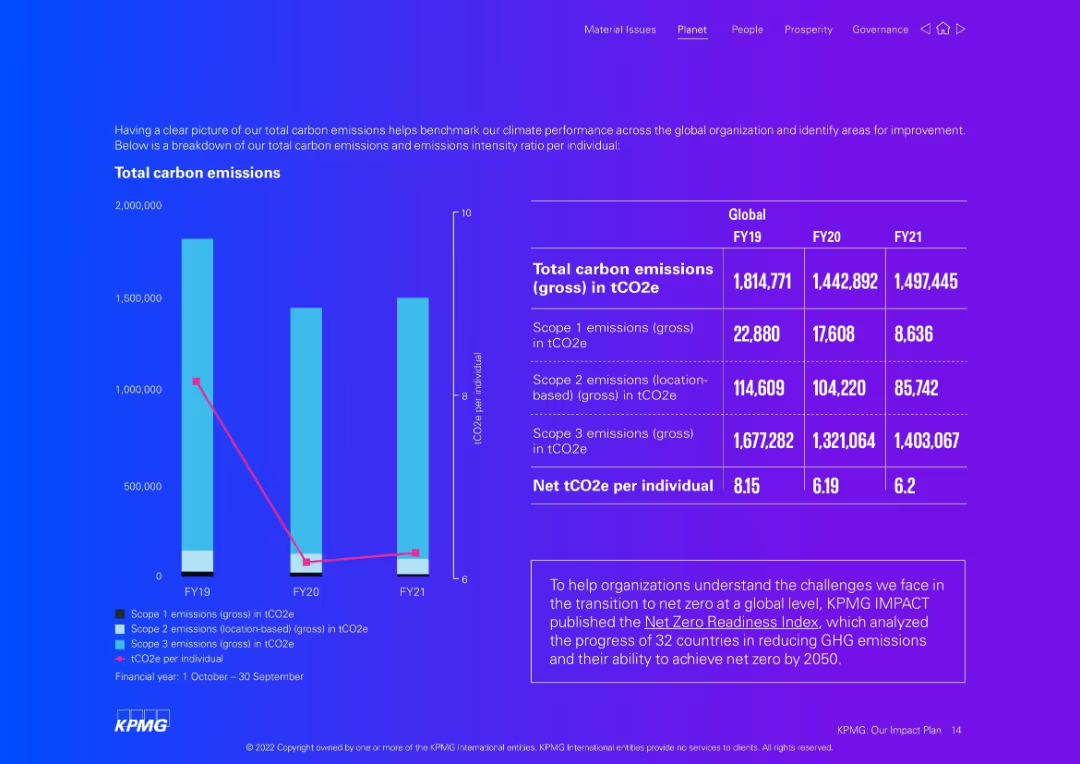
Split layout with a large bar and line chart on the left showing emission levels and intensity. A table on the right breaks down total emissions by scope and per individual for FY19–FY21. Bright gradient background in purple-blue.
Risk Assessment and Management
Environmental Services & Sustainability
Displays KPMG’s carbon emissions by scope and year from FY19 to FY21, highlighting a gradual reduction. Scope 3 emissions dominate. Also shows emissions per individual. The slide supports sustainability tracking and benchmarking.
carbon emissions, scope 1-3, sustainability, KPMG, tCO2e, environmental performance
false
Risk Assessment and Management
Environmental Services & Sustainability
Mixed Chart
KPMG
Add to my slides
Remove from favorites
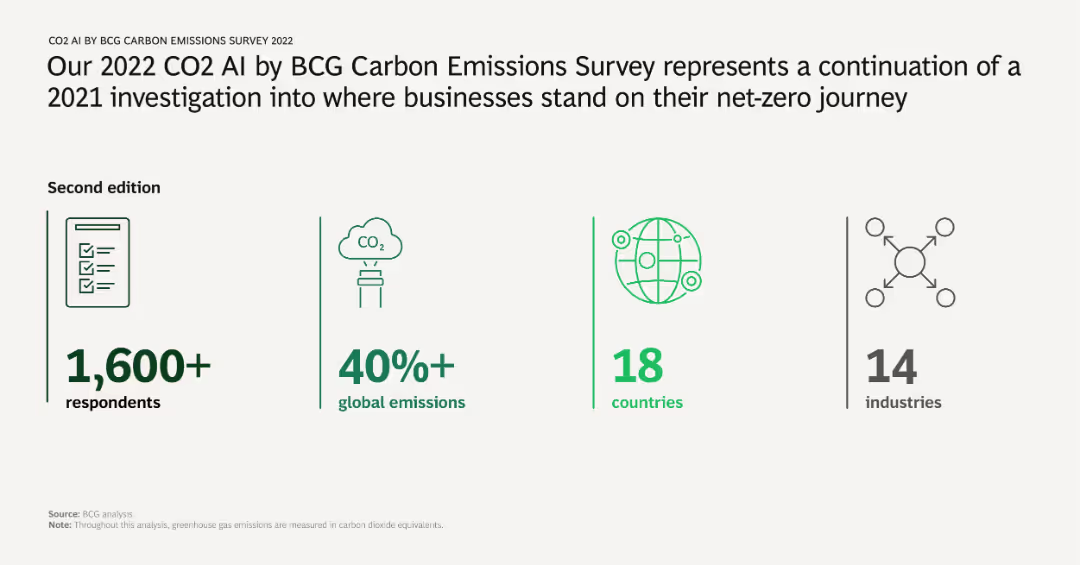
The slide features key statistics from the CO2 AI by BCG Carbon Emissions Survey 2022, including the number of respondents, percentage of global emissions covered, countries involved, and industries surveyed. Icons and brief text highlight these statistics.
Market Analysis and Trends
Environmental Services & Sustainability
Summarizes the scope and reach of the 2022 CO2 AI by BCG Carbon Emissions Survey, indicating the survey's extensive coverage across respondents, global emissions, countries, and industries. This sets the context for the following analysis and findings.
carbon emissions, survey, global reach, industries, respondents
false
Market Analysis and Trends
Environmental Services & Sustainability
Pillar
BCG
Add to my slides
Remove from favorites
The slide features infographics and charts predicting future carbon farming benefits in Maranoa, including additional ACCUs generated, revenue, and supported jobs.
Client Case Studies
Agriculture & Food Production
This slide forecasts the potential future of Maranoa through carbon farming, estimating additional ACCUs generated, revenue growth, and job support from 2021 to 2030. It highlights various carbon farming practices and their economic impact.
Carbon farming, Maranoa, Future projections, Revenue, Jobs
false
Client Case Studies
Agriculture & Food Production
Mixed Chart
EY
Add to my slides
Remove from favorites
Similar to the previous slide, this one presents data for Great Britain, showing the mean estimate of CO2 emissions from a beef burger and the percentage of respondents who couldn't estimate the distance.
Market Analysis and Trends
Environmental Services & Sustainability
This slide focuses on the British respondents' awareness of the carbon footprint of beef burgers, highlighting that 83% couldn't estimate the distance, with an average estimate of 24 miles.
Carbon footprint, beef burger, emissions, Great Britain, public perception
false
Market Analysis and Trends
Environmental Services & Sustainability
Mixed Chart
IPSOS
Add to my slides
Remove from favorites
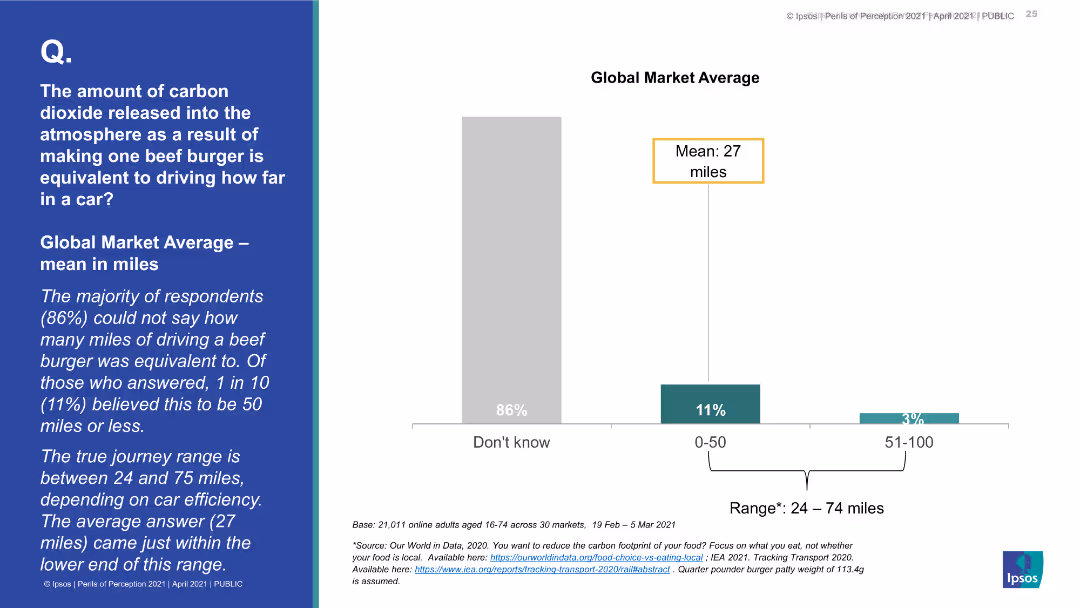
This slide features a column chart showing the percentage of respondents who could estimate the distance equivalent of CO2 emissions from a beef burger. The chart includes 'Don't know', '0-50 miles', and '51-100 miles' categories.
Market Analysis and Trends
Environmental Services & Sustainability
The slide illustrates the lack of knowledge among respondents about the carbon footprint of beef burgers, with most unable to estimate the distance. The mean estimate given is 27 miles.
Carbon footprint, beef burger, emissions, public perception, environmental impact
false
Market Analysis and Trends
Environmental Services & Sustainability
Mixed Chart
IPSOS
Add to my slides
Remove from favorites
A clear title is followed by a column chart comparing traditional commerce and e-commerce carbon footprints, with a scenario for optimized e-commerce. Text to the right provides strategies for footprint reduction. The blue color scheme is consistent and visually appealing.
Operational Efficiency
Technology & Software
This slide offers a comparison of carbon footprints between traditional and digital commerce and suggests that optimized e-commerce can significantly reduce carbon emissions. It serves to guide strategies for operational efficiency in reducing carbon footprints within the digital economy.
carbon footprint, e-commerce, optimization, traditional commerce, reduction strategies, digital channels
false
Operational Efficiency
Technology & Software
Multiple Chart
Bain
Add to my slides
Remove from favorites
This slide features a column chart on the left comparing avoided CO2 emissions for different grid utilization scenarios and a bar chart on the right showing avoidance costs versus SMR. Text below explains the results.
Regulatory and Compliance
Energy & Utilities
The slide evaluates the carbon footprint reduction potential of hydrogen production via electrolysis when powered by renewable sources. It compares various scenarios and discusses the abatement costs related to SMR (Steam Methane Reforming).
carbon footprint, electrolysis, renewable sources, CO2 emissions, SMR
false
Regulatory and Compliance
Energy & Utilities
Multiple Chart
Kearney
Add to my slides
Remove from favorites
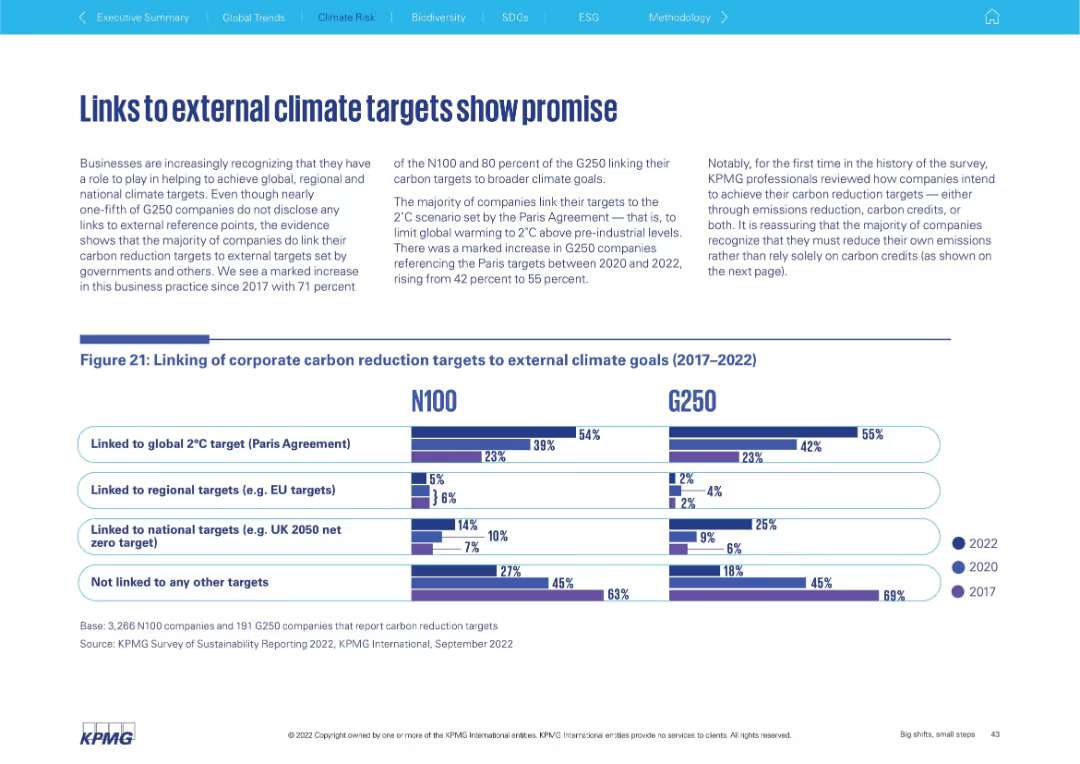
Left: textual explanation of target-linking trends; Right: bar chart showing percentage of N100 and G250 companies linking carbon targets to global/regional/national goals from 2017 to 2022.
Regulatory and Compliance
Environmental Services & Sustainability
This slide presents how companies are increasingly linking carbon targets to external goals like the Paris Agreement and national policies. It emphasizes the rise in such linking practices, especially within the G250, although a significant number still do not link to any external targets.
carbon goals, Paris Agreement, target linking, external goals, ESG
false
Regulatory and Compliance
Environmental Services & Sustainability
Mixed Chart
KPMG
Add to my slides
Remove from favorites
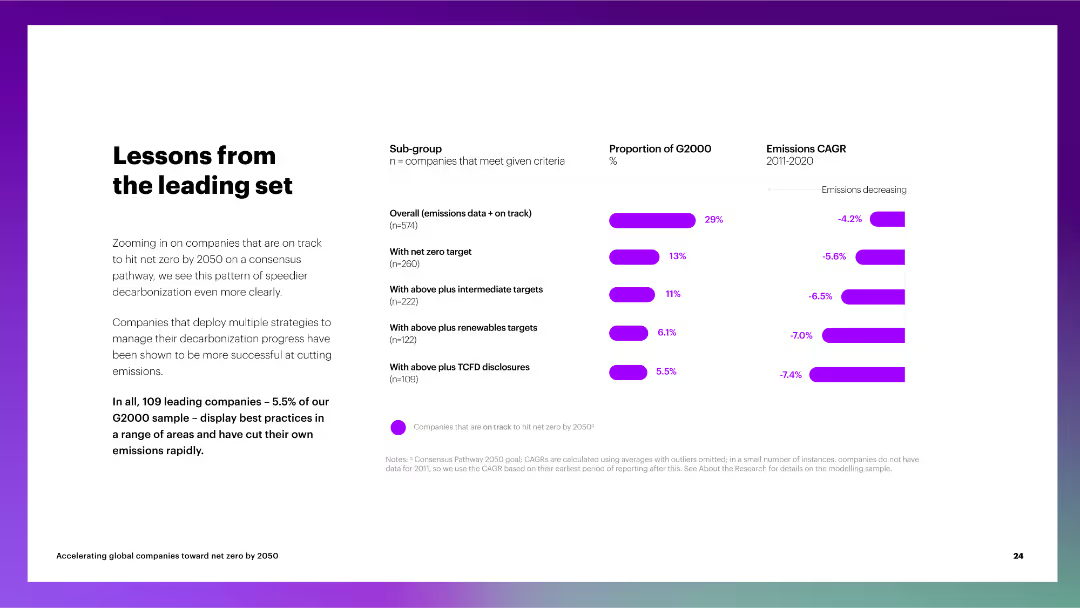
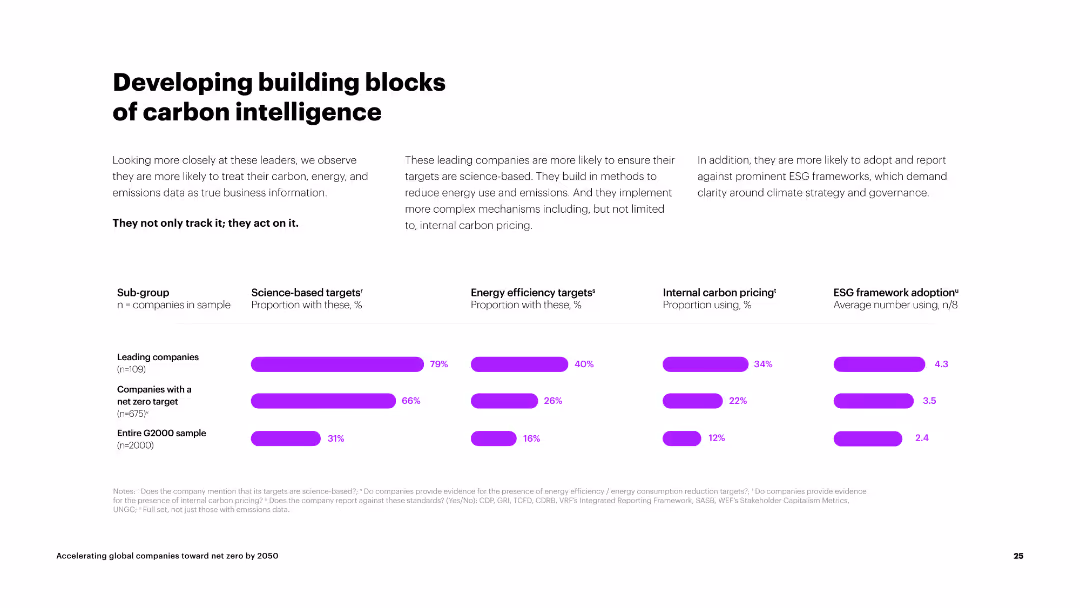
This slide contains multiple horizontal bar charts comparing leading companies, companies with a net zero target, and the entire G2000 sample. It uses vibrant colors to highlight differences.
Technology and Digital Transformation
Energy & Utilities
The slide discusses the development of carbon intelligence among companies, focusing on their science-based targets, energy efficiency targets, internal carbon pricing, and ESG framework adoption.
carbon intelligence, targets, energy efficiency, carbon pricing, ESG framework
false
Technology and Digital Transformation
Energy & Utilities
Multiple Chart
Accenture
Add to my slides
Remove from favorites
Contains multiple line graphs comparing the carbon intensity and emissions per capita for several countries, with projections for 2050 under current policies and ideal targets for a 2°C warming scenario. Each country's trajectory is marked distinctly.
Regulatory and Compliance
Environmental Services & Sustainability
Compares the carbon intensity and emissions per capita of key countries, projecting their future paths and comparing them to the required levels for meeting the 2°C warming limit. Highlights disparities in emissions intensity and the challenges different countries face in achieving climate goals.
Carbon intensity, Emissions, GDP, 2050, Country comparison
false
Regulatory and Compliance
Environmental Services & Sustainability
Single Chart
BCG
Add to my slides
Remove from favorites
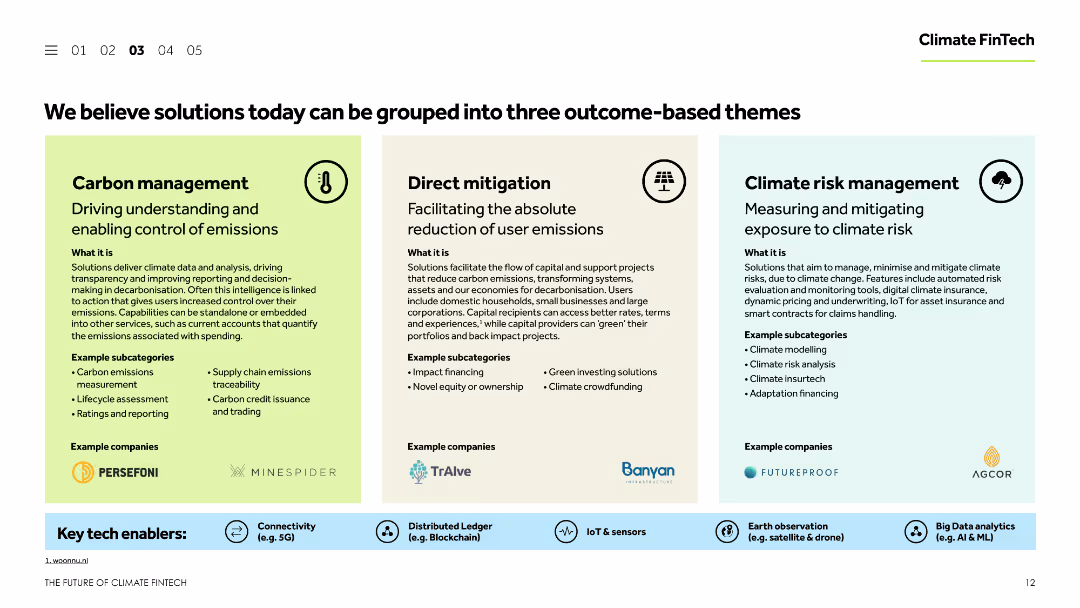
This slide is organized into three columns, each representing a different theme: carbon management, direct mitigation, and climate risk management. Each column includes textual descriptions and example companies, supported by relevant icons and colors.
Strategic Planning
Environmental Services & Sustainability
The slide categorizes Climate FinTech solutions into three main themes: carbon management, direct mitigation, and climate risk management. It provides detailed descriptions of each theme, including example subcategories and companies involved in these areas.
Carbon management, direct mitigation, climate risk management, Climate FinTech, themes
false
Strategic Planning
Environmental Services & Sustainability
Pillar
Barclays
Add to my slides
Remove from favorites
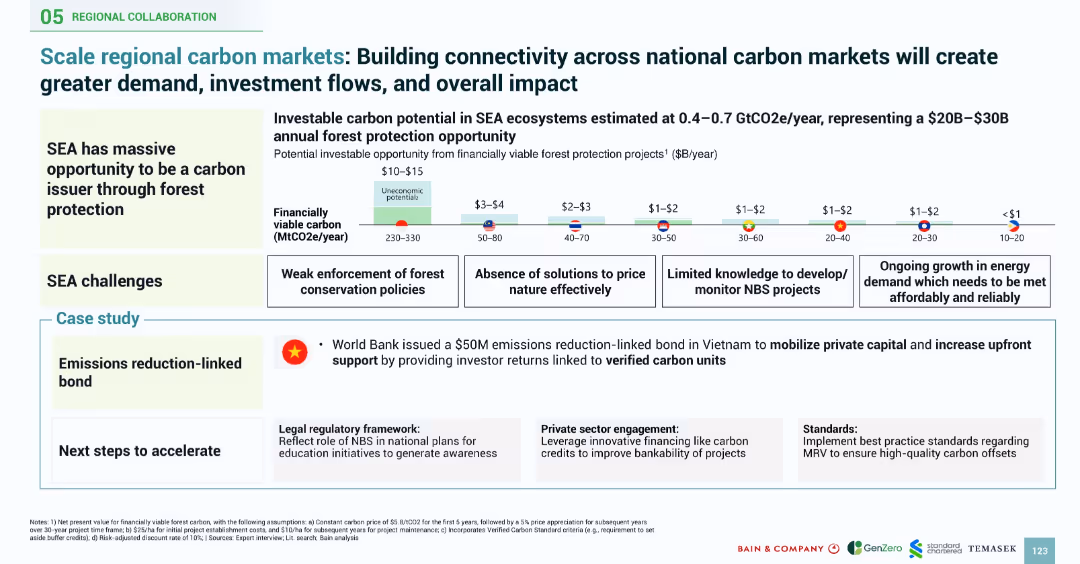
Graphical estimate of carbon value potential by country, paired with challenges, opportunities, and a Vietnam case study
Market Analysis and Trends
Environmental Services & Sustainability
Details SEA’s potential in forest-based carbon markets, emphasizing funding mechanisms, challenges like policy enforcement and pricing tools, and showcases a World Bank-backed bond case study in Vietnam
carbon market, forest protection, NBS, emissions reduction, Vietnam, investment, private capital
false
Market Analysis and Trends
Environmental Services & Sustainability
Mixed Chart
Bain
Add to my slides
Remove from favorites
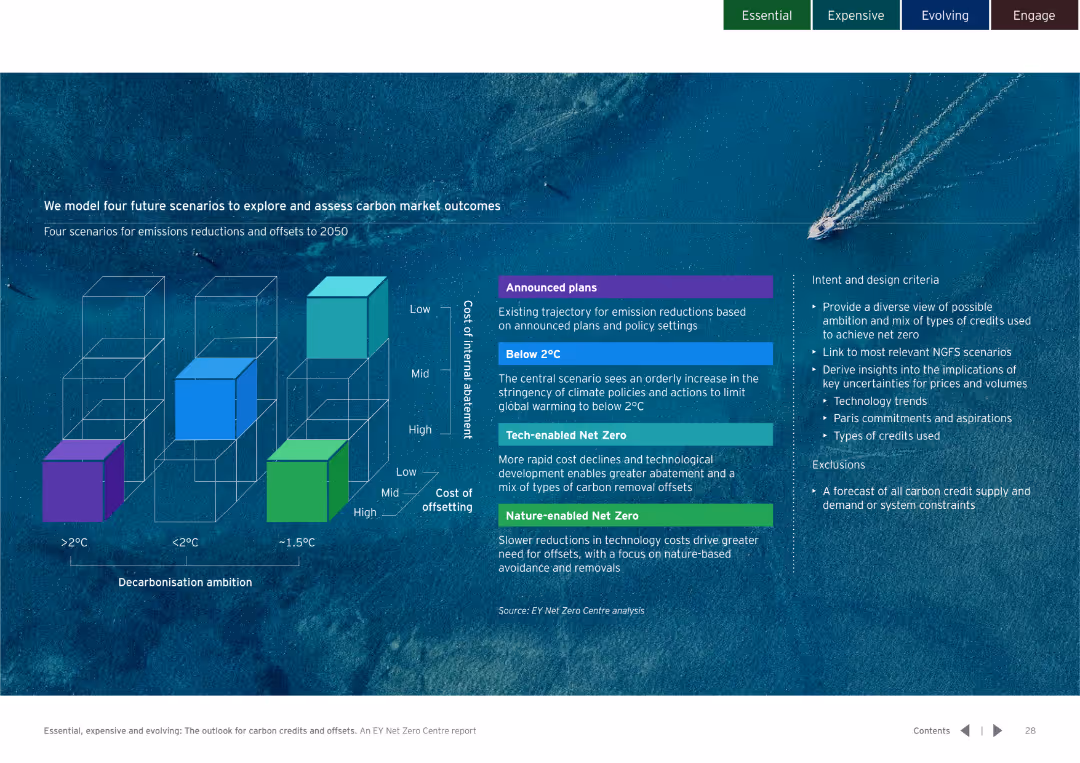
Three-dimensional block diagram comparing different decarbonisation scenarios and strategies. Clear color-coded sections for easy understanding.
Strategic Planning
Environmental Services & Sustainability
Models four scenarios for carbon market outcomes up to 2050. Details the potential impacts and design criteria for each scenario.
carbon market, future scenarios, decarbonisation
false
Strategic Planning
Environmental Services & Sustainability
Diagram
EY
Add to my slides
Remove from favorites
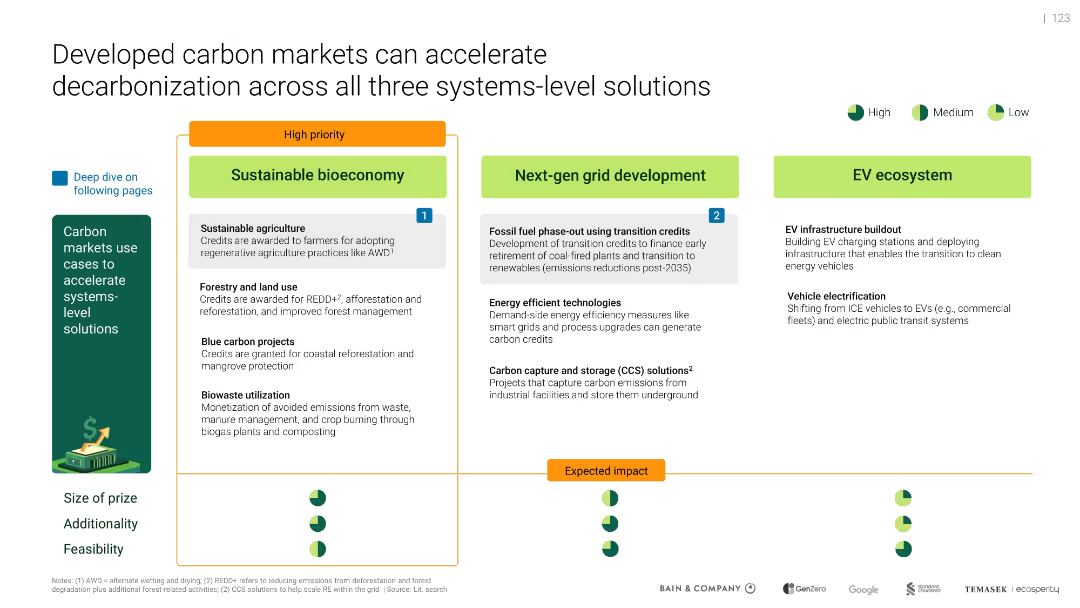
Three-block layout of system-level solutions (bioeconomy, grid, EV ecosystem), with icons indicating priority and feasibility; color-coded impact indicators below.
Product and Service Analysis
Environmental Services & Sustainability
Highlights how carbon markets support systemic decarbonization. Prioritizes sustainable bioeconomy (agriculture, forestry), next-gen grid (CCS, phase-out), and EV infrastructure. Rates each for feasibility and impact.
carbon markets, decarbonization, bioeconomy, CCS, EV, grid
false
Product and Service Analysis
Environmental Services & Sustainability
Mixed Chart
Bain
Add to my slides
Remove from favorites
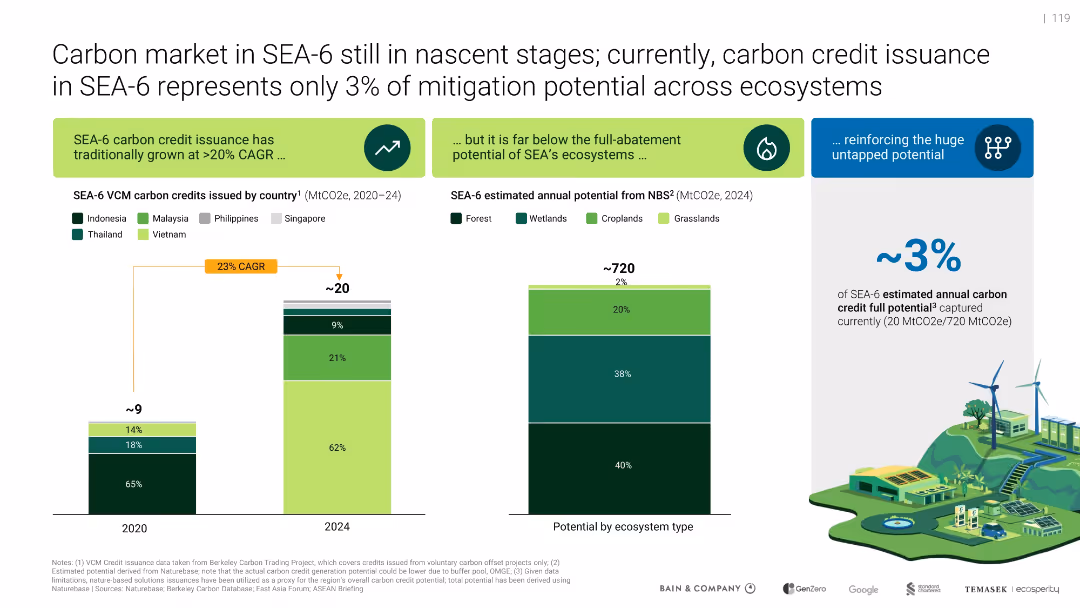
Side-by-side bar charts: carbon credits by country and mitigation potential by ecosystem type; includes CAGR arrow and ecosystem illustration.
Market Analysis and Trends
Environmental Services & Sustainability
Shows SEA-6 carbon market issuance (~3% of potential), with a CAGR of 23% (2020–2024). Emphasizes vast untapped mitigation potential across forest, wetlands, croplands. Illustrates current underperformance relative to ecosystem capacity.
carbon market, SEA-6, mitigation, VCM, ecosystems, CAGR
false
Market Analysis and Trends
Environmental Services & Sustainability
Multiple Chart
Bain
Add to my slides
Remove from favorites
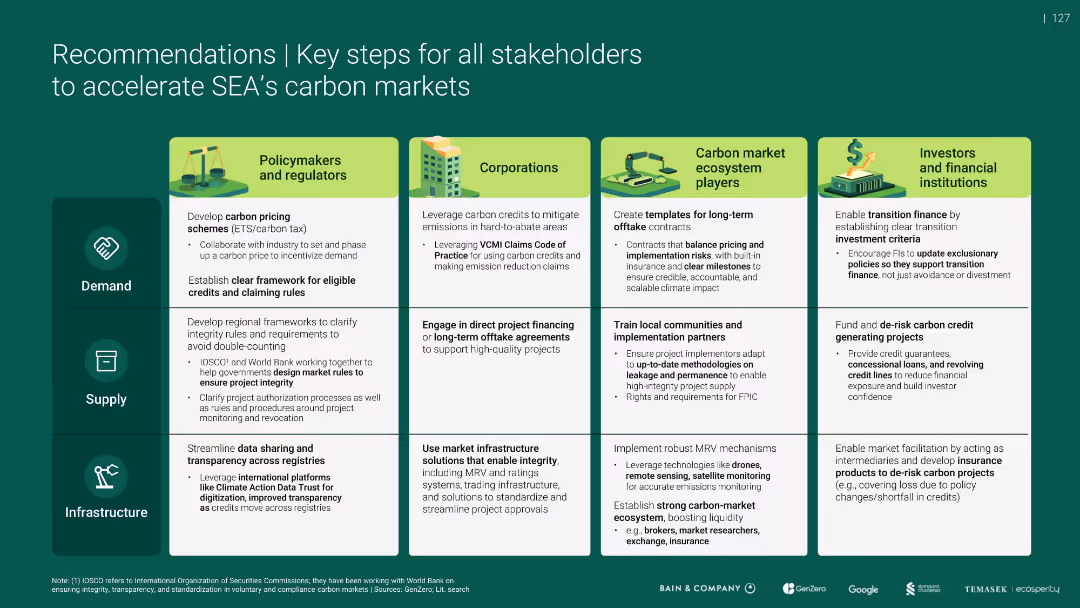
Matrix-style table showing recommendations by stakeholder group across demand, supply, and infrastructure dimensions; color-coded icons and categories.
Strategic Planning
Environmental Services & Sustainability
Presents detailed recommendations for regulators, corporations, ecosystem players, and investors. Covers actions like policy development, financing mechanisms, infrastructure upgrades, and integrity systems to grow the carbon market in SEA.
carbon markets, SEA, stakeholders, investment, regulation, roadmap
false
Strategic Planning
Environmental Services & Sustainability
Table
Bain
Add to my slides
Remove from favorites
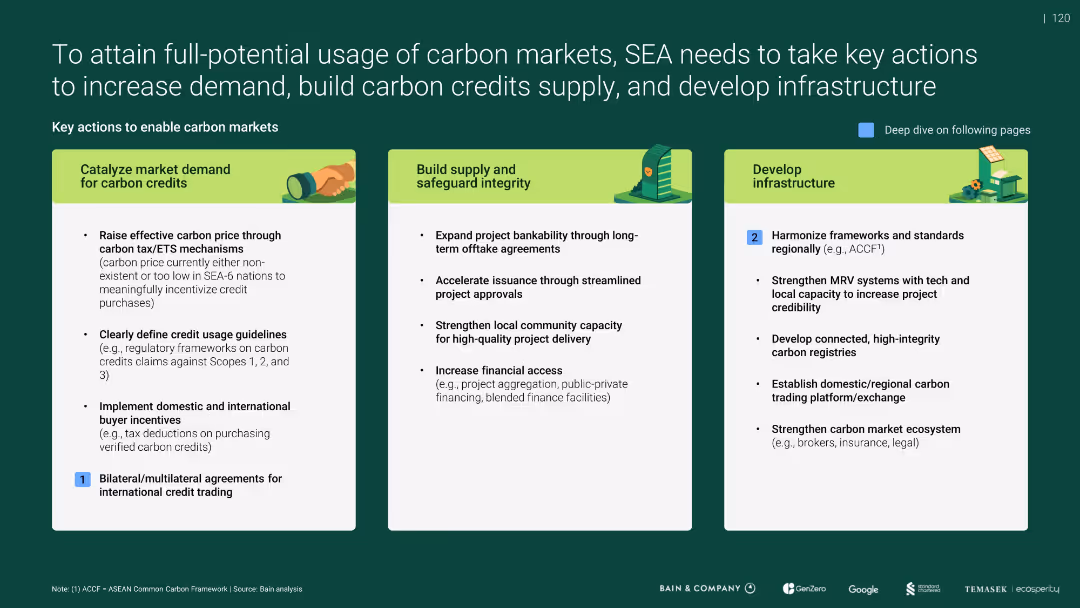
Three-column layout for action pillars: demand, supply, infrastructure; bulleted strategies under each pillar; icons and color blocks guide focus.
Strategic Planning
Environmental Services & Sustainability
Proposes actions to scale SEA’s carbon market: raise demand via policy incentives, expand credible supply through offtake contracts, and develop infrastructure like carbon exchanges. Links strategy to regional harmonization and market mechanisms.
carbon markets, SEA, supply, demand, infrastructure, strategy
false
Strategic Planning
Environmental Services & Sustainability
Pillar
Bain
Add to my slides
Remove from favorites
Table comparing carbon neutrality targets for major oil and gas companies in Europe, indicating targets for Scope 1, 2, and 3 emissions for 2030, 2040, and 2050.
Strategic Planning
Energy & Utilities
The slide details carbon neutrality targets set by major European oil and gas companies, focusing on different scopes and timelines to achieve net zero emissions.
carbon neutrality, Scope 3, O&G, net zero, Europe
false
Strategic Planning
Energy & Utilities
Single Chart
Kearney
Add to my slides
Remove from favorites
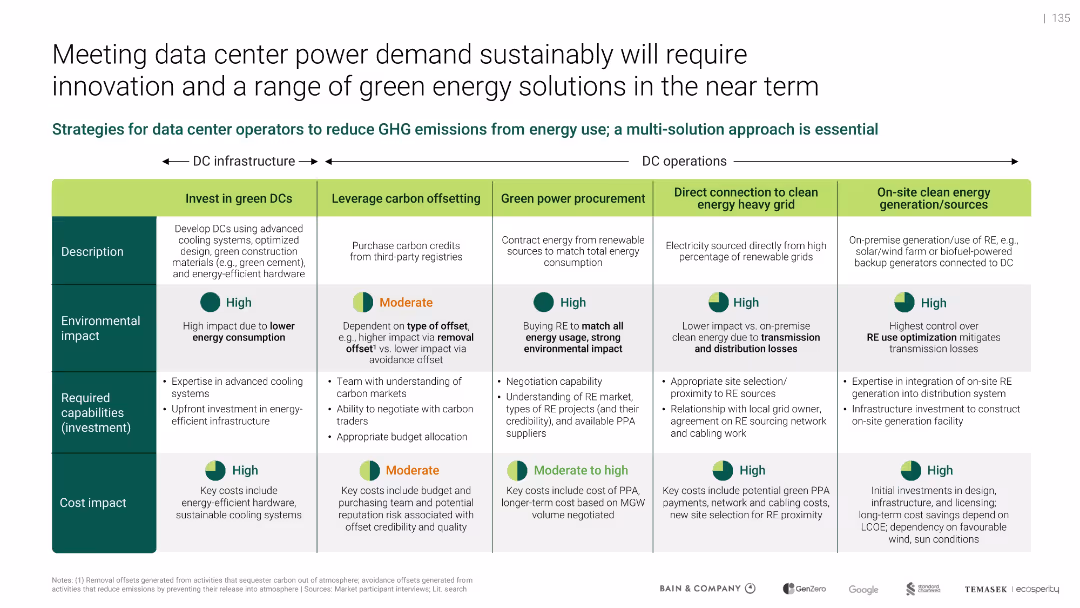
Matrix table format categorizing five decarbonization strategies; green-themed visuals
Operational Efficiency
Technology & Software
Proposes a multi-solution strategy for reducing emissions from data center energy use. Outlines five approaches including investing in green DCs, carbon offsetting, renewable procurement, grid connection, and on-site generation. Each is evaluated by environmental impact, required investment, and cost impact.
carbon offsetting, green power, infrastructure, emissions, PUE, RE sources, sustainability, DC operations
false
Operational Efficiency
Technology & Software
Mixed Chart
Bain
Add to my slides
Remove from favorites
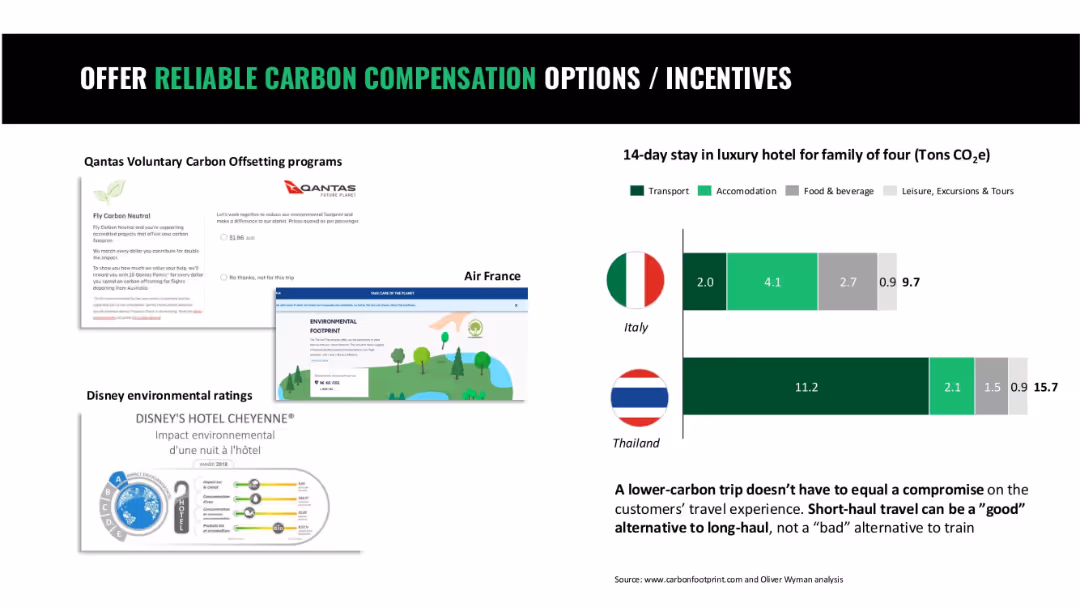
Four-part layout with screenshots of airline and hotel initiatives and bar chart comparing vacation CO2 footprints
Operational Efficiency
Hospitality & Tourism
This slide showcases carbon offset programs by airlines and hospitality providers and compares carbon footprints of short-term travel by country to emphasize low-carbon options.
carbon offset, tourism, hotel footprint, airline programs, travel sustainability
false
Operational Efficiency
Hospitality & Tourism
Mixed Chart
Oliver Wyman
Add to my slides
Remove from favorites
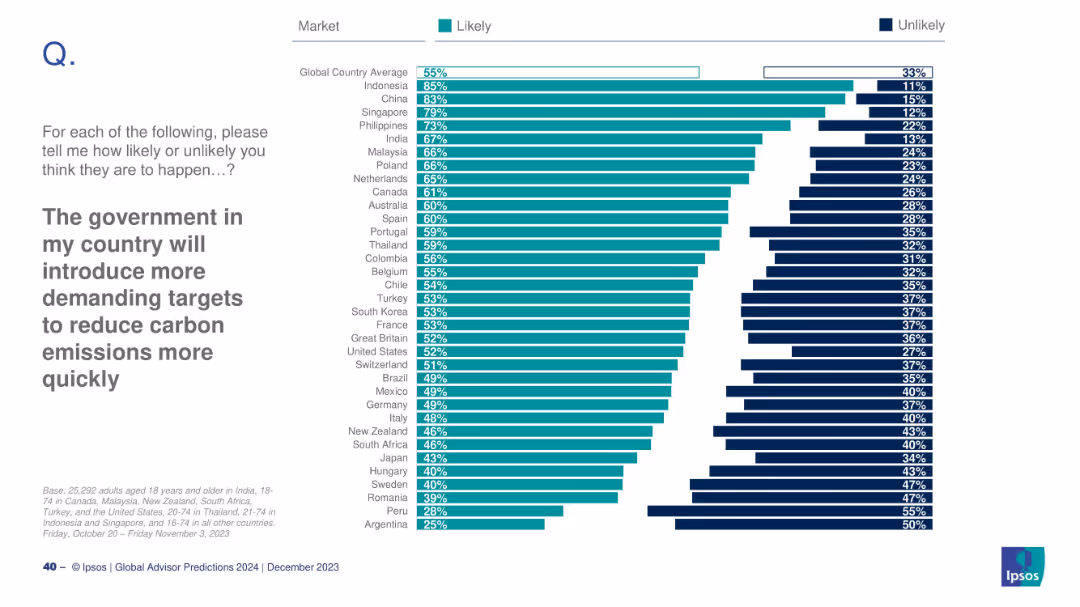
Country-based likelihood chart showing where citizens expect stricter carbon policy.
Regulatory and Compliance
Environmental Services & Sustainability
This slide explores public expectations for stricter carbon emission regulations. Countries like Indonesia and China show high confidence in future policy shifts. The global average is 55%, indicating moderate overall optimism.
carbon policy, climate action, regulations, Ipsos, government response, emissions
false
Regulatory and Compliance
Environmental Services & Sustainability
Mixed Chart
IPSOS
Add to my slides
Remove from favorites
The slide features a line chart showing the carbon price in USD per ton over time (1990-2020) for various countries, with a legend on the left side listing the different carbon taxes and ETS initiatives tracked.
Regulatory and Compliance
Energy & Utilities
This slide shows the historical carbon price trends in Nordic countries and other regions, highlighting Sweden as having the highest carbon tax. It provides comparative data for different carbon pricing mechanisms over time.
carbon price, Nordic countries, Sweden, ETS, tax
false
Regulatory and Compliance
Energy & Utilities
Single Chart
Kearney
Add to my slides
Remove from favorites
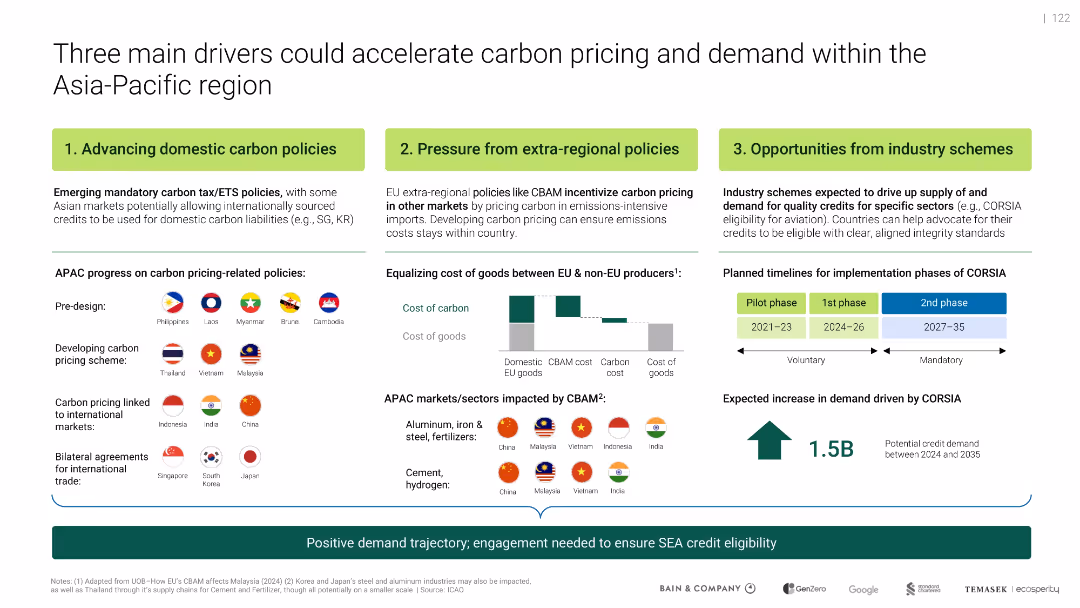
Horizontal layout showing 3 drivers: domestic policy, extra-regional pressure, industry schemes; charts illustrate timelines and CBAM cost shifts.
Regulatory and Compliance
Government & Public Sector
Identifies three forces driving SEA carbon credit demand: local policy reforms, CBAM pressure from EU, and sector initiatives like CORSIA. Illustrates APAC market readiness and implementation timelines through flags and schematics.
carbon pricing, CBAM, CORSIA, Asia-Pacific, ETS, compliance
false
Regulatory and Compliance
Government & Public Sector
Mixed Chart
Bain
Add to my slides
Remove from favorites
This slide includes a text section on the left discussing carbon pricing as a commodity and two column charts on the right. One chart shows trades in CO2 emissions, and the other displays CO2 emissions intensity by region, both with clear color distinctions.
Market Analysis and Trends
Government & Public Sector
It argues for the benefits of treating carbon as a tradable commodity to drive global emissions reduction. The slide presents data on CO2 trades between regions and the carbon intensity of goods production, highlighting how regions can leverage carbon pricing to achieve more significant environmental and economic benefits.
Carbon Pricing, CO2 Emissions, Trades, Commodity, Intensity
false
Market Analysis and Trends
Government & Public Sector
Multiple Chart
EY
Add to my slides
Remove from favorites
Features a line chart showing global change in CO2 emissions generated by the power sector under different scenarios. Includes numbered points summarizing three carbon pricing scenarios and their impacts on emissions and tax revenues.
Strategic Planning
Energy & Utilities
Highlights three carbon pricing scenarios, comparing impacts on CO2 emissions and tax revenues, indicating significant reduction potential in emissions and variation in government tax revenues depending on the scenario.
carbon pricing, emissions, energy transition, tax revenues, scenarios
false
Strategic Planning
Energy & Utilities
Mixed Chart
EY
Add to my slides
Remove from favorites
This slide has two charts: a stacked bar chart showing global emissions covered by carbon pricing initiatives and a line chart showing emission trading system prices over time.
Regulatory and Compliance
Environmental Services & Sustainability
The slide provides data on the effectiveness of carbon pricing in reducing global emissions and compares the prices of emission trading systems across different regions.
carbon pricing, emissions, sustainability, regulatory compliance, emission trading system, global impact, J.P. Morgan, environmental policy, carbon tax, climate change
false
Regulatory and Compliance
Environmental Services & Sustainability
Multiple Chart
JP Morgan
Add to my slides
Remove from favorites
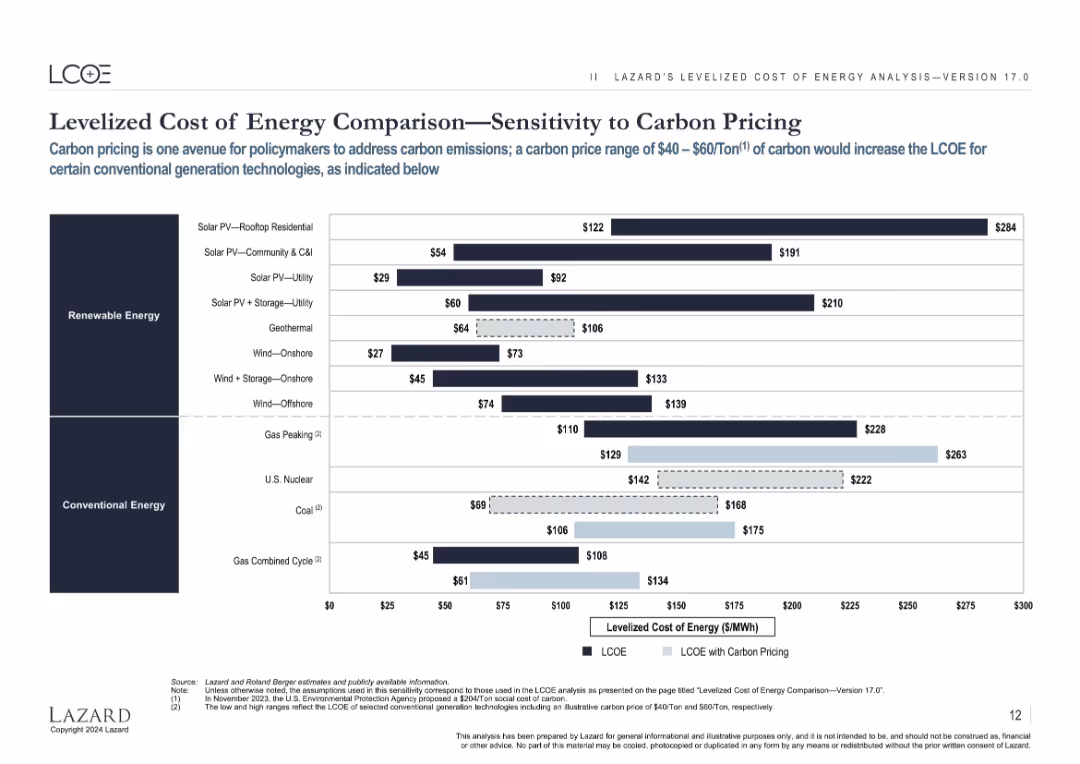
This slide shows a horizontal bar chart comparing the levelized cost of energy for renewable and conventional energy sources under different carbon pricing scenarios.
Regulatory and Compliance
Energy & Utilities
The slide evaluates the impact of carbon pricing on the cost competitiveness of various energy sources, highlighting the influence of carbon costs on renewable and conventional energy generation.
Carbon Pricing, Energy Costs, LCOE, Regulation, Comparison
false
Regulatory and Compliance
Energy & Utilities
Single Chart
Roland Berger
Add to my slides
Remove from favorites
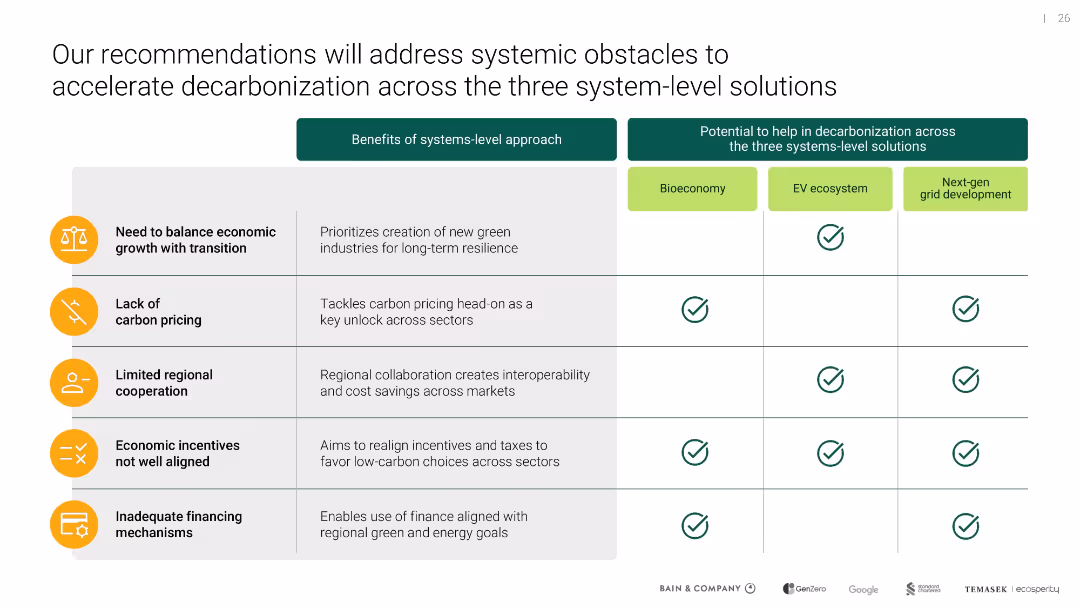
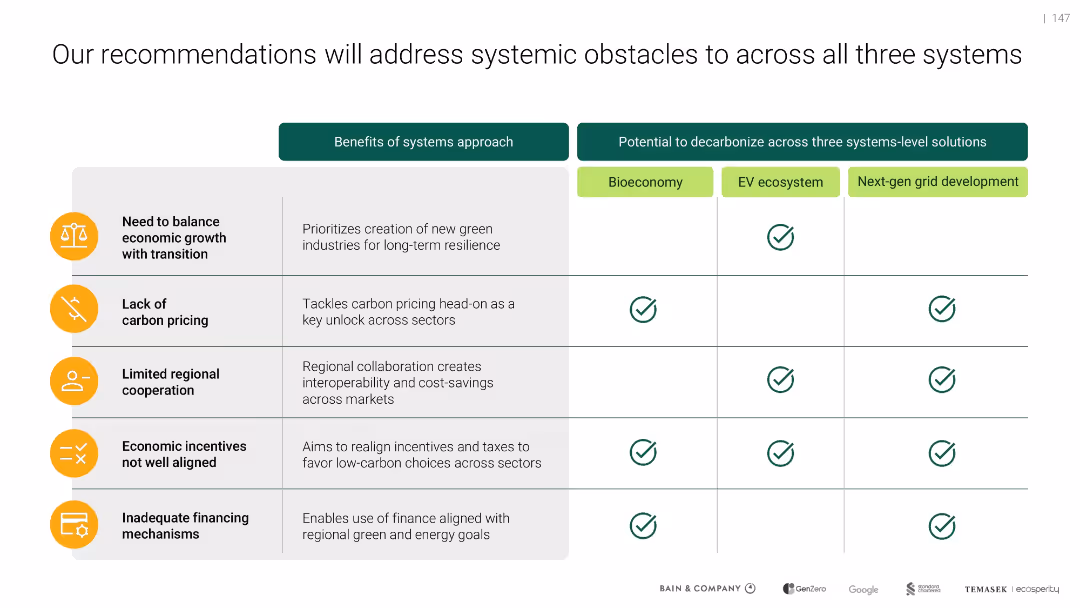
Matrix table format with icons and checkmarks; three top-level system solutions across the top and five systemic issues listed on the left
Technology and Digital Transformation
Environmental Services & Sustainability
Highlights five key barriers (like financing, pricing, incentives) and their impacts across three green transition strategies—bioeconomy, EV ecosystem, and next-gen grid—showing how a system-level approach helps overcome these obstacles.
carbon pricing, energy transition, systemic issues, EV, bioeconomy, grid
false
Technology and Digital Transformation
Environmental Services & Sustainability
Table
Bain
Add to my slides
Remove from favorites
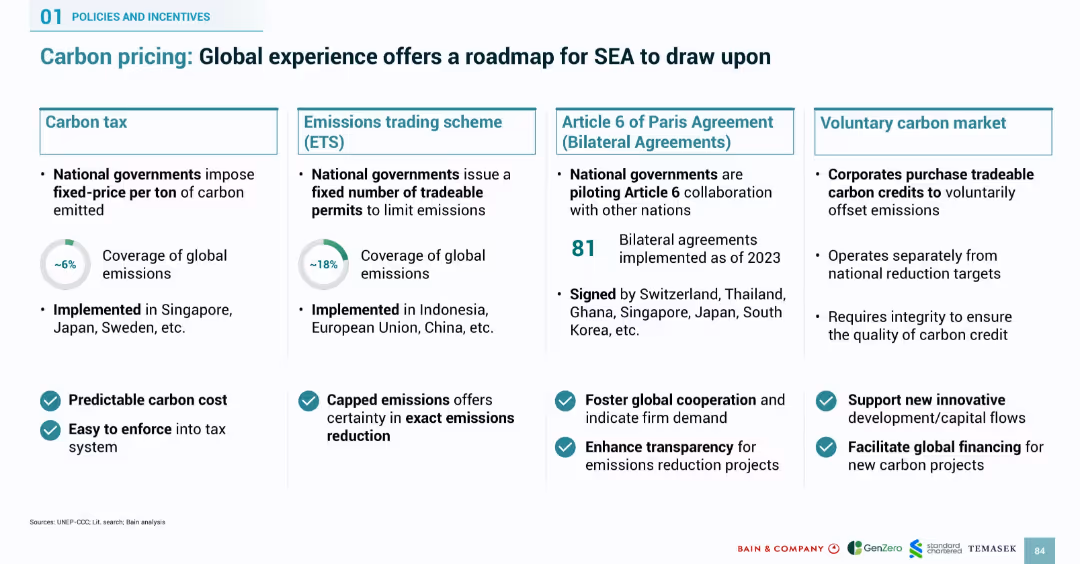
Four-column layout covering carbon tax, emissions trading, Article 6 bilateral agreements, and voluntary carbon markets. Uses icons and checkmarks for benefits.
Regulatory and Compliance
Environmental Services & Sustainability
Outlines four global carbon pricing models that SEA can adopt: carbon tax, emissions trading, bilateral agreements, and voluntary markets. Includes global adoption stats, benefits such as transparency and enforceability, and lists of countries that have implemented them. The slide serves as a strategic framework for SEA carbon policy design.
carbon pricing, ETS, carbon tax, bilateral agreements, voluntary market, emissions, SEA, regulation, global roadmap
false
Regulatory and Compliance
Environmental Services & Sustainability
Mixed Chart
Bain
Add to my slides
Remove from favorites
World map with carbon prices, various regions colored to indicate different carbon prices. Table below the map shows operational and scheduled ETS details.
Regulatory and Compliance
Energy & Utilities
The slide explains the adoption of carbon pricing in OECD countries, highlighting different carbon prices and summarizing operational and scheduled ETS emissions data.
carbon pricing, ETS, emissions, OECD, regulatory
false
Regulatory and Compliance
Energy & Utilities
Graphic
Kearney
Add to my slides
Remove from favorites
The slide is a content slide featuring a combination of text and a large pie chart illustrating the share of global GHG emissions by ETSs in 2022. The background is dark, with highlighted sections for emphasis on key points.
Regulatory and Compliance
Government & Public Sector
It explains the principles of carbon pricing, comparing ETS and carbon taxes, and discusses their implementation challenges and benefits. The slide includes data on the global GHG emissions covered by ETSs and insights into various countries' carbon pricing strategies to foster sustainability and emissions reduction.
Carbon Pricing, ETS, GHG Emissions, Regulatory, Compliance
false
Regulatory and Compliance
Government & Public Sector
Mixed Chart
EY
Add to my slides
Remove from favorites
Same layout as previous LCOE slides, with an overlay showing impact of $40–$60/ton carbon pricing on conventional energy LCOEs.
Regulatory and Compliance
Energy & Utilities
Highlights how carbon pricing can raise the LCOE of fossil fuel-based energy sources, making renewables more favorable by comparison in policy-driven environments.
carbon pricing, LCOE, emissions, policy, fossil fuel, cost, sensitivity, regulation
false
Regulatory and Compliance
Energy & Utilities
Single Chart
Roland Berger
Add to my slides
Remove from favorites
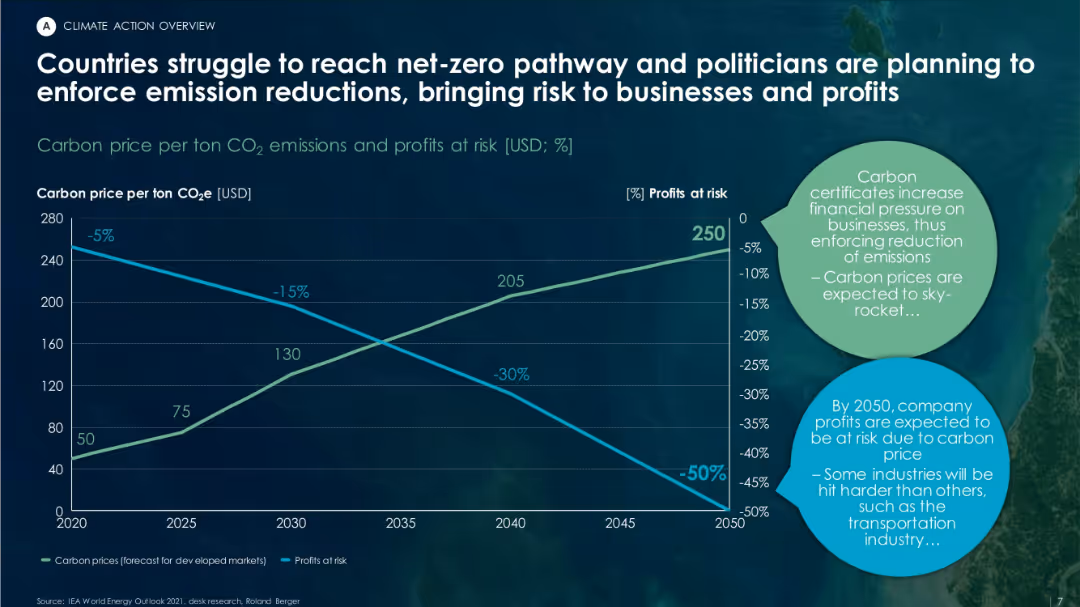
Dual-axis line graph showing increasing carbon prices and declining profit margins over time. Features circular text bubbles summarizing business impacts.
Risk Assessment and Management
Environmental Services & Sustainability
This slide projects the increasing financial burden of carbon pricing and regulatory pressure on companies through 2050. It forecasts higher carbon prices and decreasing profits, particularly for carbon-intensive industries like transportation.
carbon pricing, net-zero, emissions, regulatory risk, business impact, CO₂ cost
false
Risk Assessment and Management
Environmental Services & Sustainability
Mixed Chart
Roland Berger
Add to my slides
Remove from favorites
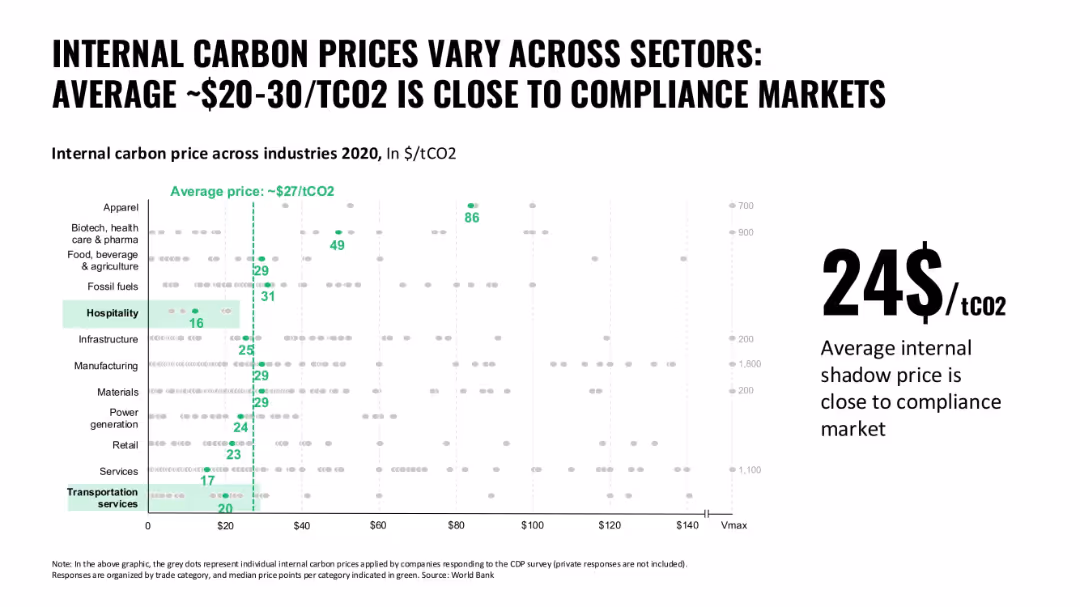
Dot plot with vertical green line showing average carbon price; multiple industries listed on the y-axis
Pricing Strategies
Environmental Services & Sustainability
The slide visualizes the variation of internal carbon prices used by industries. It highlights a convergence toward ~$27/tCO2, close to compliance market rates, with wide variance between sectors.
carbon pricing, shadow price, industry comparison, sustainability, emissions cost
false
Pricing Strategies
Environmental Services & Sustainability
Single Chart
Oliver Wyman
Add to my slides
Remove from favorites
Two-column benefit and impact matrix with checkmarks and icons
Regulatory and Compliance
Environmental Services & Sustainability
Summarizes how systemic barriers like lack of carbon pricing, regional cooperation, and misaligned incentives can be addressed through a systems approach. Emphasizes the role of cross-sector decarbonization strategies such as bioeconomy, EV ecosystems, and grid modernization.
carbon pricing, systemic barriers, decarbonization, EV, grid, bioeconomy, incentives, policy alignment
false
Regulatory and Compliance
Environmental Services & Sustainability
Table
Bain
Add to my slides
Remove from favorites
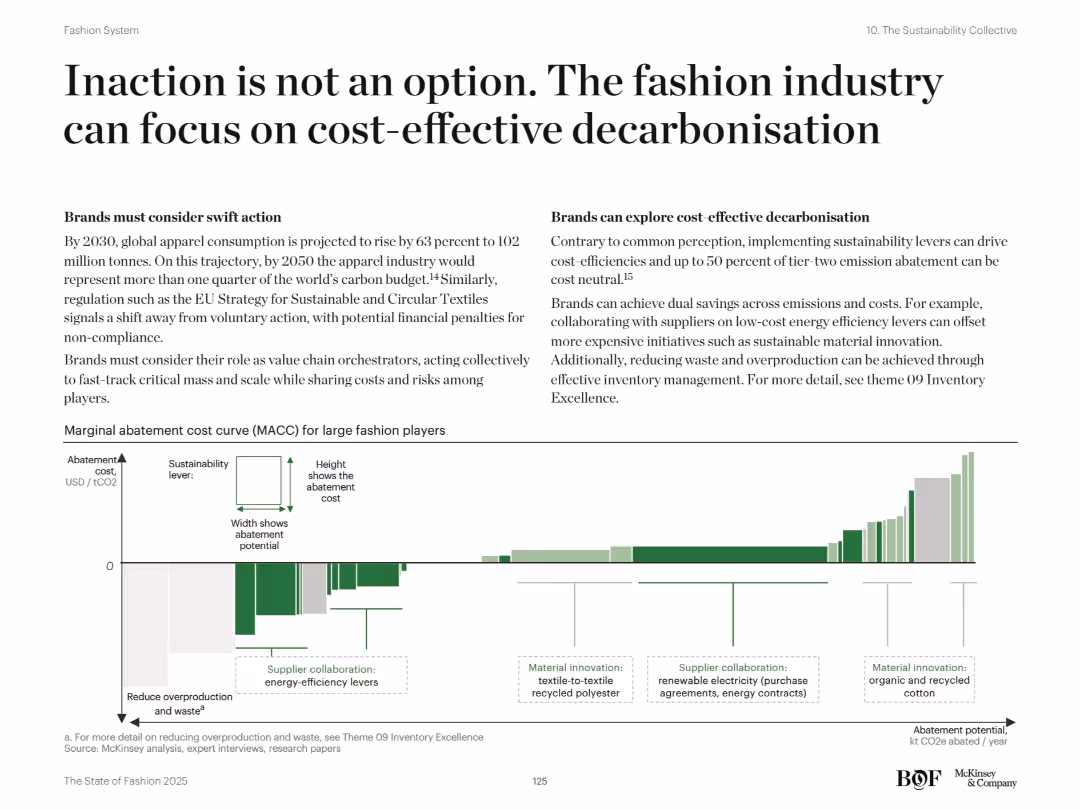
Two-column layout: left focuses on urgency and collective action, right promotes cost-efficient abatement strategies. Bottom shows a marginal abatement cost curve (MACC) chart.
Risk Assessment and Management
Retail & E-commerce
This slide promotes cost-effective approaches to decarbonization in the fashion industry. It underscores the financial and regulatory risks of inaction and showcases how low-cost measures like energy efficiency and inventory optimization can deliver high sustainability impact.
Carbon reduction, decarbonisation, energy efficiency, inventory waste, cost abatement, ESG, sustainability levers, supply chain emissions, MACC, fashion regulation
false
Risk Assessment and Management
Retail & E-commerce
Mixed Chart
McKinsey
Add to my slides
Remove from favorites
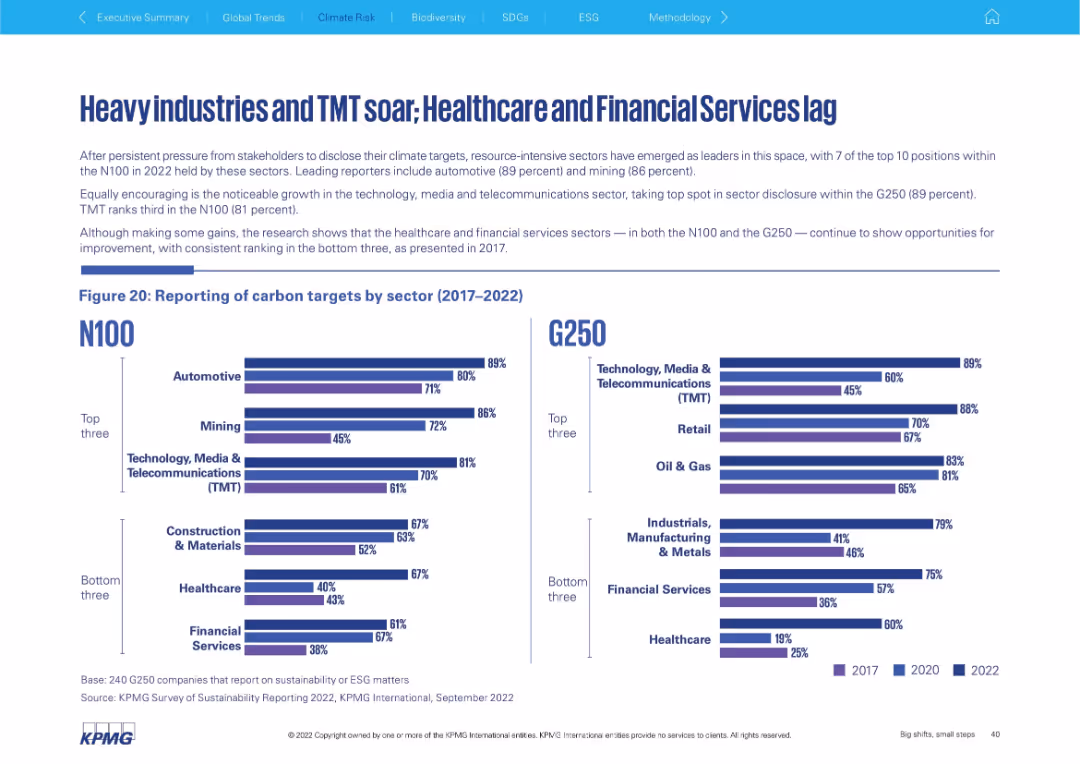
Left: text and bar chart for N100 sector reporting; Right: G250 sector reporting chart. Emphasis on top/bottom 3 sectors in both groups. Clear visual comparison.
Performance Metrics and KPIs
Environmental Services & Sustainability
The slide contrasts carbon target reporting by industry, showing strong adoption in sectors like Automotive, Mining, and TMT, while Healthcare and Financial Services continue to trail. Both N100 and G250 datasets show similar trends, emphasizing resource-intensive sectors' leadership.
carbon reporting, TMT, automotive, healthcare, mining, sectors, N100
false
Performance Metrics and KPIs
Environmental Services & Sustainability
Mixed Chart
KPMG
Add to my slides
Remove from favorites
The slide presents a diagram categorizing different carbon separation technologies. It uses a hierarchical structure with boxes and arrows, featuring both text and colored elements.
Technology and Digital Transformation
Energy & Utilities
The slide categorizes various CO₂ separation technologies, detailing methods like absorption, adsorption, membranes, liquid/supercritical CO₂, and novel technologies.
Carbon separation, absorption, adsorption, membranes, CO₂ technologies, energy, utilities, chemical processes
false
Technology and Digital Transformation
Energy & Utilities
Diagram
Kearney
Add to my slides
Remove from favorites
The slide is divided into three sections, each with an icon and text block. The background is white with purple accents, creating a clean and organized look.
Strategic Planning
Energy & Utilities
The slide outlines steps for companies at different stages of carbon intelligence: setting targets, prioritizing investments, and placing bold bets. It provides guidance for companies at various stages of their journey.
carbon targets, investments, energy efficiency, milestones, carbon pricing
false
Strategic Planning
Energy & Utilities
Multiple Chart
Accenture
Add to my slides
Remove from favorites
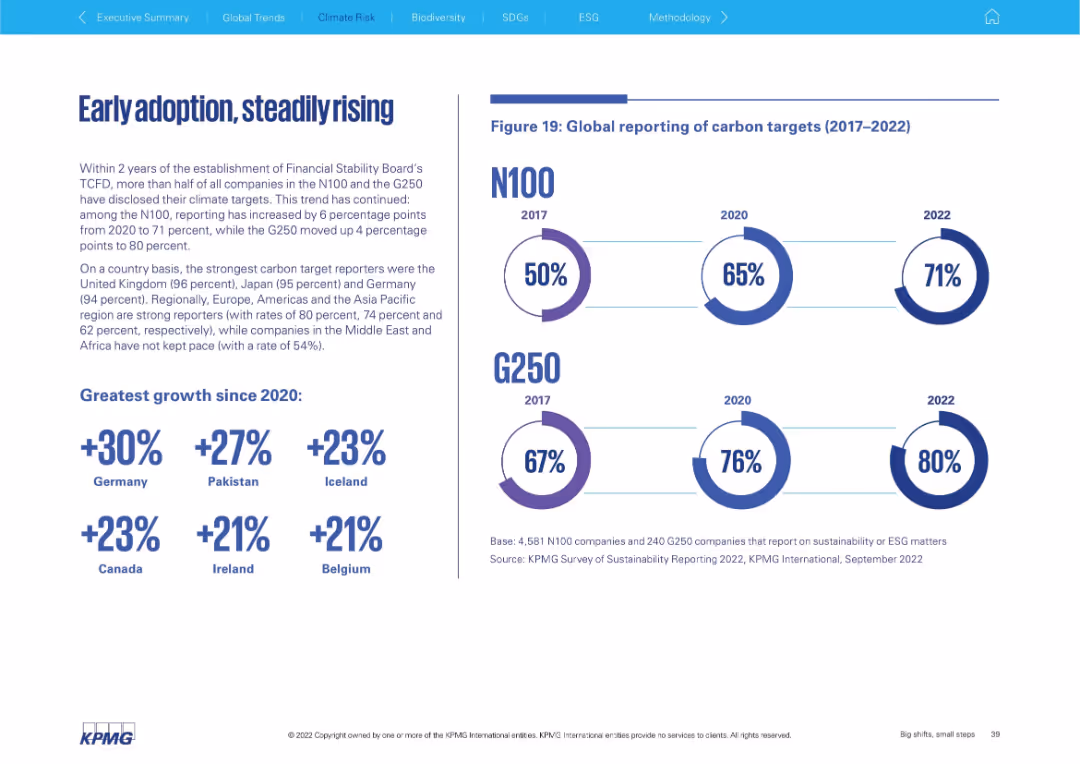
Left: narrative and country growth highlights; Right: circular progress indicators for N100 and G250 (2017, 2020, 2022) showing global carbon target reporting. Balanced layout.
Regulatory and Compliance
Environmental Services & Sustainability
This slide illustrates the global increase in carbon target reporting among companies since the establishment of the TCFD. It highlights strong country-level growth and identifies the UK, Japan, and Germany as leading reporters, with notable gains in Pakistan and Iceland.
carbon targets, TCFD, climate, Germany, Pakistan, reporting, adoption
false
Regulatory and Compliance
Environmental Services & Sustainability
Mixed Chart
KPMG
Add to my slides
Remove from favorites
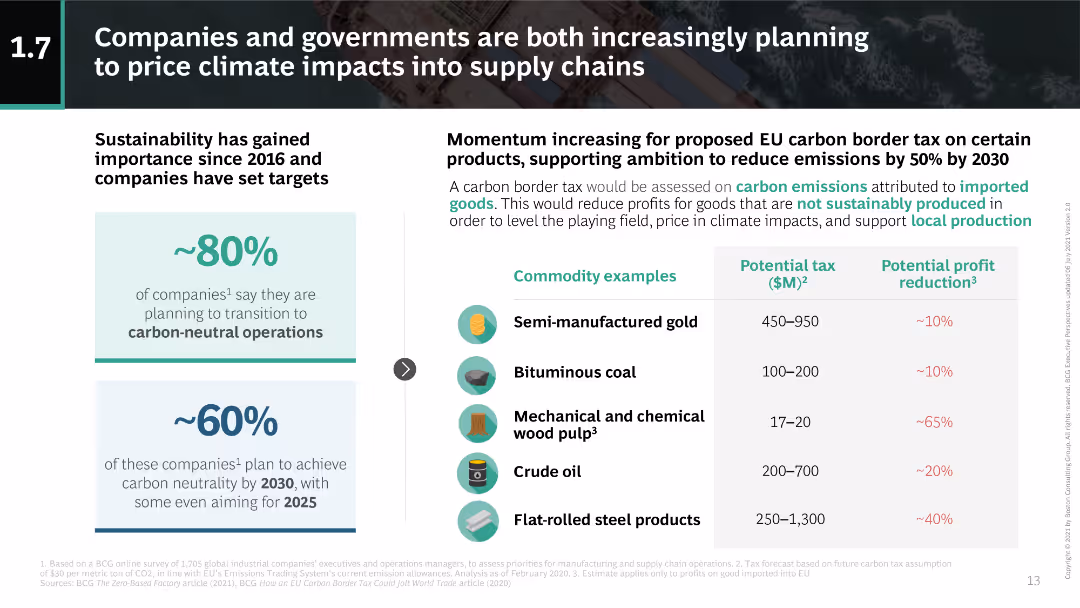
The slide uses a combination of text and a table to discuss the proposed EU carbon border tax. Icons and figures highlight the potential tax impacts on various commodities.
Regulatory and Compliance
Environmental Services & Sustainability
The slide explains the EU carbon border tax proposal, its expected impact on commodity prices, and how companies plan to achieve carbon neutrality by 2030.
carbon tax, EU, sustainability, commodities, carbon neutrality
false
Regulatory and Compliance
Environmental Services & Sustainability
Header Horizontal
BCG
Add to my slides
Remove from favorites
The slide includes icons and tables. The design is modern, with a clean layout and clear segmentation of sections. Labeled clearly with concise text explanations.
Market Analysis and Trends
Environmental Services & Sustainability
This slide presents a detailed analysis of the investment potential and economic viability of nature-based solutions and carbon credit trading, emphasizing the role of forest conservation in achieving net zero carbon emissions. It highlights different stages of capital investment and potential returns.
carbon trading, net zero, forest conservation, investment, economic viability
false
Market Analysis and Trends
Environmental Services & Sustainability
Header Vertical
Bain
Add to my slides
Remove from favorites
A comparative slide with a grid layout, comparing offline and online channels for different stages of vehicle purchase and aftersales, including information gathering, testing, purchase, and care.
Sales and Business Development
Retail & E-commerce
The slide compares online and offline channels for different stages of the vehicle purchase process, highlighting that online channels dominate for information gathering, but offline for testing and purchase.
car buyers, online channel, offline channel, vehicle purchase, customer lifecycle, information gathering, pre-purchase testing, purchase, customer care
false
Sales and Business Development
Retail & E-commerce
Multiple Chart
EY
Add to my slides
Remove from favorites
Column charts showing car-buying intent and timing; segmented by new and used cars
Market Analysis and Trends
Consumer Goods
Analyzes the intent to buy cars among respondents, highlighting trends and timelines for new and used cars
Car-buying, intent, new cars, used cars, trends
false
Market Analysis and Trends
Consumer Goods
Multiple Chart
EY
Add to my slides
Remove from favorites
Slide includes side-by-side column charts comparing the purchase intent for new and used cars over time.
Market Analysis and Trends
Transportation & Logistics
Details the changes in new and used car purchase intent over successive time periods during the COVID-19 pandemic.
car buying, market trends, new cars, used cars, consumer insight
false
Market Analysis and Trends
Transportation & Logistics
Multiple Chart
McKinsey
Add to my slides
Remove from favorites
Presents line graphs tracking the purchase intent for new vs. used cars across the US, Europe, and Asia.
Market Analysis and Trends
Transportation & Logistics
Compares the recovery patterns of new and used car markets across different regions following COVID-19 disruptions.
car demand, US, Europe, Asia, market recovery
false
Market Analysis and Trends
Transportation & Logistics
Multiple Chart
McKinsey
Add to my slides
Remove from favorites
This slide includes a collection of bar graphs, column charts, and key metric callouts arranged in a clean layout, with contrasting colors to highlight different data sets.
Financial Performance
Financial Services
Focused on the card franchise's industry leadership, the slide provides data on card sales, active accounts, and customer retention. Key figures show growth in sales volume and a sustained number 1 position in card outstandings.
Card Franchise, Industry Leadership, Sales Volume, Customer Retention, Financial Data
false
Financial Performance
Financial Services
Multiple Chart
JP Morgan
Add to my slides
Remove from favorites
A combination of cycle diagrams and column charts, this slide showcases financial growth metrics, such as sales volume and net revenue. It's visually balanced with clear demarcations between different sections and graphical elements.
Financial Performance
Financial Services
The slide describes the growth strategy and financial performance of a card franchise, with a focus on scaling, engaging, and deepening customer relationships. It’s intended for illustrating successful financial strategies and growth patterns within the industry.
Card franchise, Industry position, Sales volume, Net revenue, Financial growth, Strategy implementation
false
Financial Performance
Financial Services
Multiple Chart
JP Morgan
Add to my slides
Remove from favorites
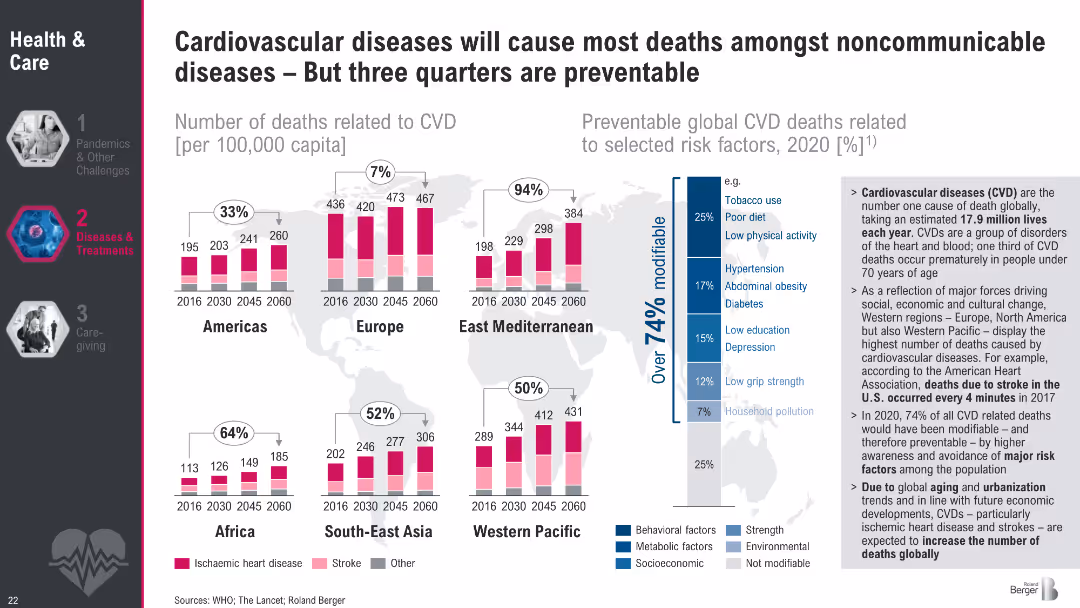
Regional bar charts showing trends in CVD mortality (2016–2060) with a stacked breakdown (ischemic, stroke, other). Sidebar includes a risk factor analysis.
Risk Assessment and Management
Healthcare & Pharmaceuticals
This slide presents CVD mortality trends across six global regions, identifying ischemic heart disease and stroke as leading causes. It emphasizes that over 74% of CVD deaths are preventable through modifiable risk factors like tobacco use, poor diet, and hypertension. The sidebar underlines the urgency of prevention and regional disparities in outcomes.
Cardiovascular disease, stroke, ischemic, mortality, preventable, risk factors, global health
false
Risk Assessment and Management
Healthcare & Pharmaceuticals
Multiple Chart
Roland Berger
Add to my slides
Remove from favorites
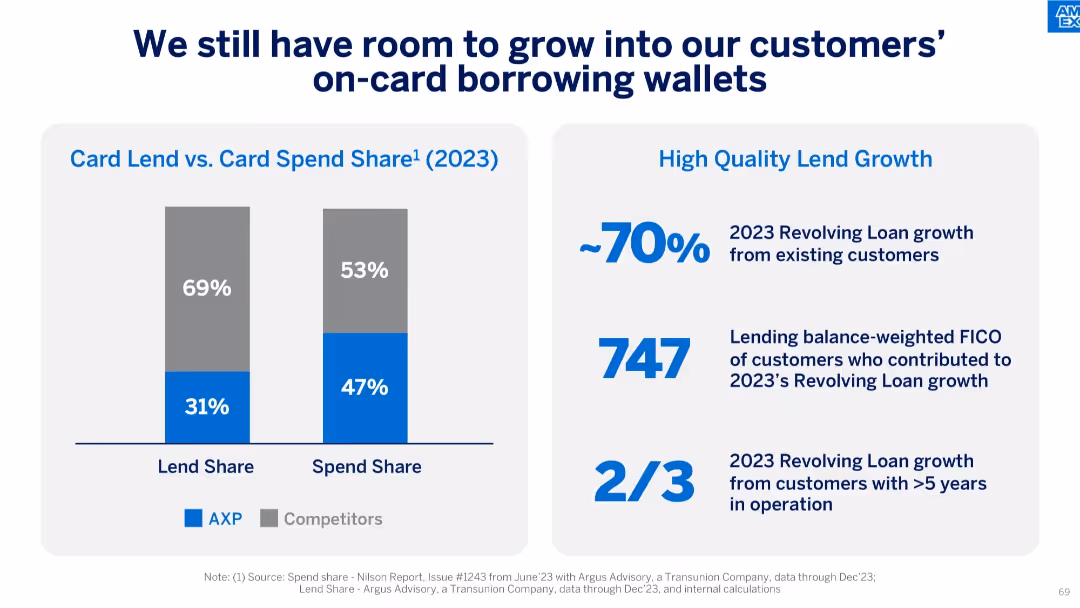
Split design with bar graphs on the left and text metrics on the right, clean and data-heavy layout.
Strategic Planning
Financial Services
This slide shows that while AXP has a high spend share (47%), its lend share (31%) is lower than competitors. It highlights the potential for growth in lending from existing customers and those with long-term accounts and strong FICO scores.
card lending, spend share, FICO, customer growth, revolving loans, strategic planning, credit, lending opportunity
false
Strategic Planning
Financial Services
Mixed Chart
McKinsey
Add to my slides
Remove from favorites
This slide shows column charts with incremental changes and text boxes with bullet points. Visual hierarchy is used to guide the viewer through the content.
Risk Assessment and Management
Financial Services
Analyzes improvements in card marketing productivity and acquisition gains. Likely to be used in risk management and strategic investment discussions.
card marketing, productivity, acquisition gains, risk management
false
Risk Assessment and Management
Financial Services
Multiple Chart
JP Morgan
Add to my slides
Remove from favorites
Features a split layout with half dedicated to card highlights including photos and logos, and the other half displaying line graphs comparing market performance. The design is sleek with a corporate color scheme.
Product and Service Analysis
Financial Services
Showcasing ongoing efforts to innovate in card products, the slide highlights new launches and market performance data. It notes the success in sales share and outstandings share, suggesting strong market engagement and strategic partnerships.
Card Products, Market Performance, Product Launch, Strategic Partnerships, Engagement
false
Product and Service Analysis
Financial Services
Multiple Chart
JP Morgan
Add to my slides
Remove from favorites
Displays a column chart showing growth in card revenue driven by lending, with a list of innovative strategies and products to the right.
Financial Performance
Financial Services
Illustrates the trend in card revenue growth at JPMorgan Chase, emphasizing innovation and customer borrowing needs.
Card revenue, lending, innovation, JPMorgan Chase, borrowing needs
false
Financial Performance
Financial Services
Mixed Chart
JP Morgan
Add to my slides
Remove from favorites
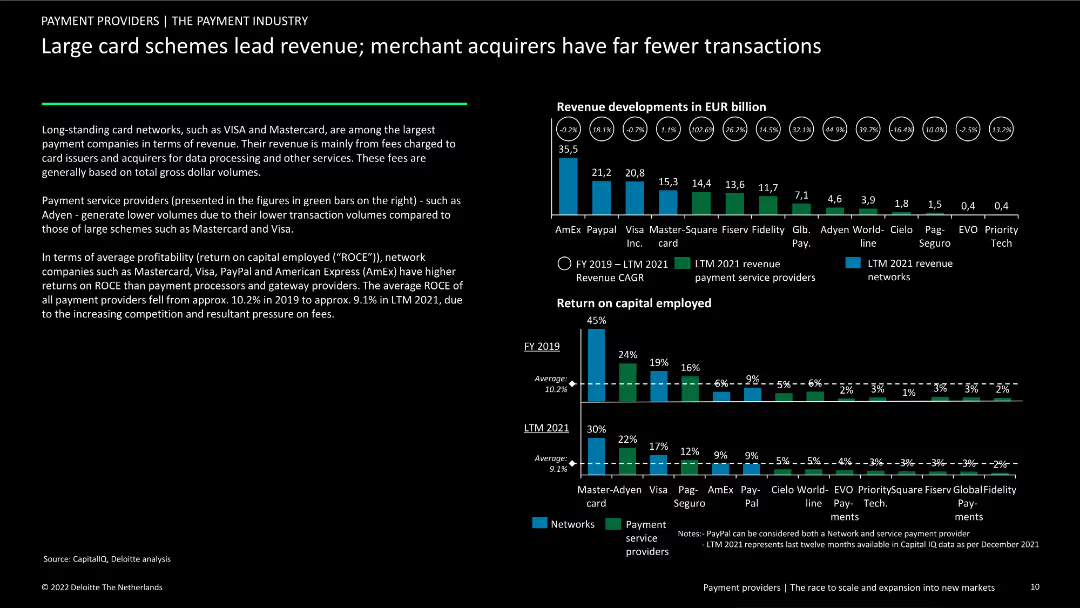
The slide features a column chart comparing revenue developments of major card schemes and payment service providers, and another showing return on capital employed (ROCE) for these entities. Text discusses revenue and profitability trends.
Financial Performance
Financial Services
This slide compares the revenue and profitability of large card schemes like Visa and Mastercard with payment service providers such as PayPal. It highlights differences in transaction volumes and return on capital employed (ROCE).
card schemes, revenue, payment service providers, ROCE, trends
false
Financial Performance
Financial Services
Multiple Chart
Deloitte
Add to my slides
Remove from favorites
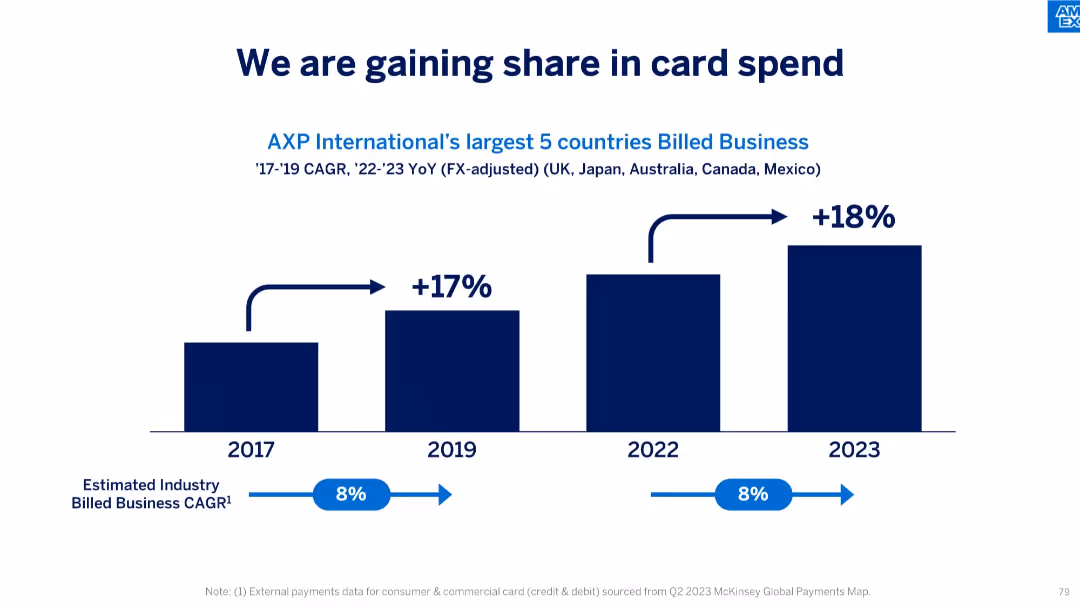
Similar format to previous, stacked bar chart showing card spend growth, 2017–2023.
Performance Metrics and KPIs
Financial Services
Demonstrates AXP's increased share in billed card business across its top 5 international countries, significantly outperforming the estimated industry CAGR of 8%, especially in 2023 with 18% growth.
card spend, share gain, billed business, international markets, CAGR, KPIs, performance tracking, industry benchmark
false
Performance Metrics and KPIs
Financial Services
Single Chart
McKinsey
Add to my slides
Remove from favorites
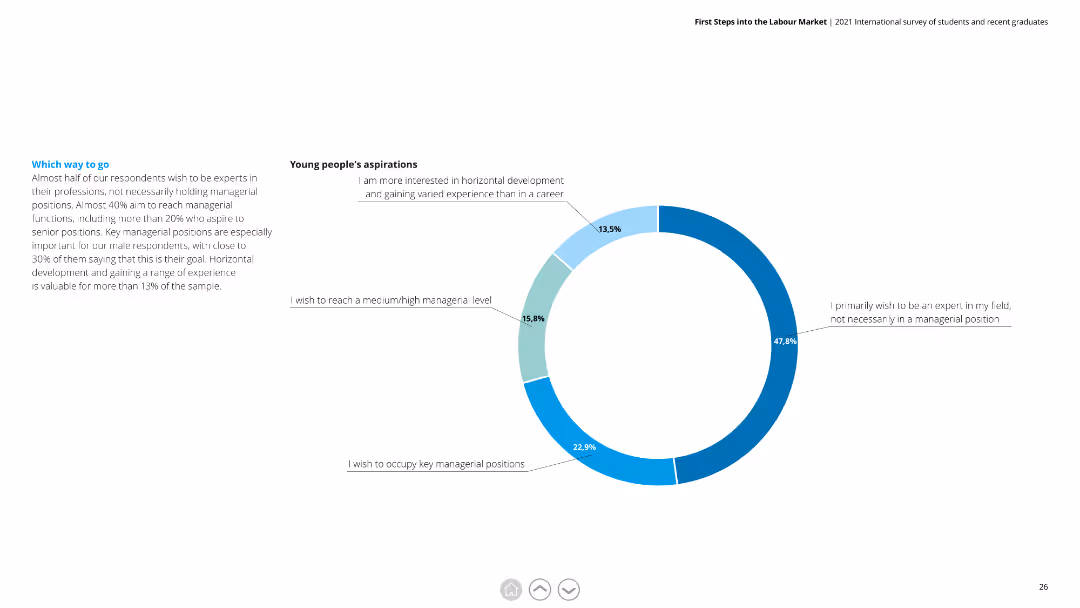
Donut chart showing various career aspirations among young people, with detailed text on the left explaining the importance of different career paths.
Human Resources and Talent Management
Education & Training
This slide presents the career aspirations of young people, showing a preference for expertise over managerial roles and the value of varied experiences.
career aspirations, expertise, managerial roles, horizontal development, young professionals
false
Human Resources and Talent Management
Education & Training
Mixed Chart
Deloitte
Add to my slides
Remove from favorites
The slide includes text explanations and a column chart showing areas where Gen Zs and Millennials feel they can influence their organization. The layout is balanced with text on the left and charts on the right.
Human Resources and Talent Management
Education & Training
The slide highlights the importance of values in career decisions for Gen Zs and Millennials, detailing areas where they feel empowered to influence organizational changes, including social issues, DEI, personal development, and sustainability efforts.
Career decisions, values, empowerment, Gen Z, Millennials, change
false
Human Resources and Talent Management
Education & Training
Mixed Chart
Deloitte
Add to my slides
Remove from favorites
This slide is designed with a circular diagram at the center, surrounded by text blocks, icons, and a title, all unified by a consistent blue color palette.
Human Resources and Talent Management
Technology & Software
It stresses the importance of investing in employees’ career growth, suitable for discussions on HR development strategies and managerial training.
career growth, HR, investment, training, enablement, employees, performance management
false
Human Resources and Talent Management
Technology & Software
Diagram
Kearney
Add to my slides
Remove from favorites
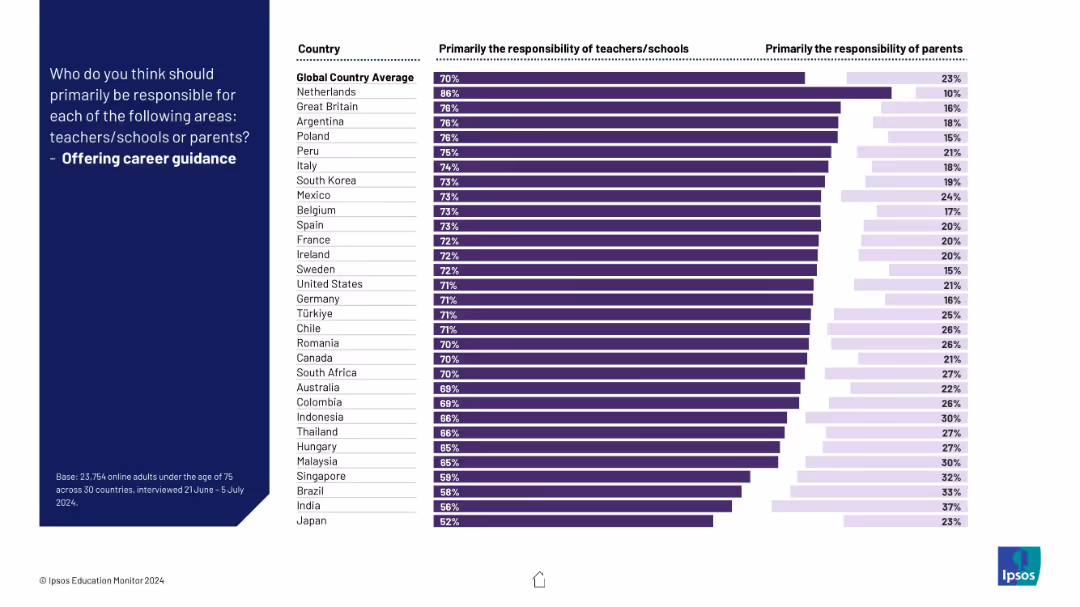
Horizontal bar chart with two categories per country (teachers/schools vs parents); dark purple vs light purple bars; countries listed vertically.
Human Resources and Talent Management
Education & Training
This slide reveals public opinion on who should guide students in career choices. Most countries favor teachers/schools over parents for career guidance.
career guidance, teachers, schools, parents, responsibility, education, survey, Ipsos, global, workforce
false
Human Resources and Talent Management
Education & Training
Mixed Chart
IPSOS
Add to my slides
Remove from favorites
Light background with teal and black text. It includes a column chart on job satisfaction and career progression, and a column chart on work motivation, with icons.
Human Resources and Talent Management
Healthcare & Pharmaceuticals
Examines declining career optimism among women, lower job satisfaction, and motivation, with detailed statistics on career progression and work motivation.
career optimism, job satisfaction, motivation, women
false
Human Resources and Talent Management
Healthcare & Pharmaceuticals
Multiple Chart
Deloitte
Add to my slides
Remove from favorites
Features two donut charts and a gauge chart. Each donut chart is segmented with various responses about employee awareness of career paths, colored distinctly for clarity. The gauge chart highlights a percentage.
Human Resources and Talent Management
Professional Services
Analyzes the level of employee awareness regarding career progression within the company, illustrated through clear visual charts. Suitable for internal reviews or strategic HR planning.
career paths, employee awareness, HR, charts
false
Human Resources and Talent Management
Professional Services
Multiple Chart
PwC/Strategy&
Add to my slides
Remove from favorites
Slide includes heatmap comparing preferences among managers in different countries.
Market Analysis and Trends
Professional Services
Analyzes managerial career preferences across various countries, highlighting shifts in career goals.
career progression, management, global trends, preferences, comparative analysis
false
Market Analysis and Trends
Professional Services
Table
BCG
Add to my slides
Remove from favorites
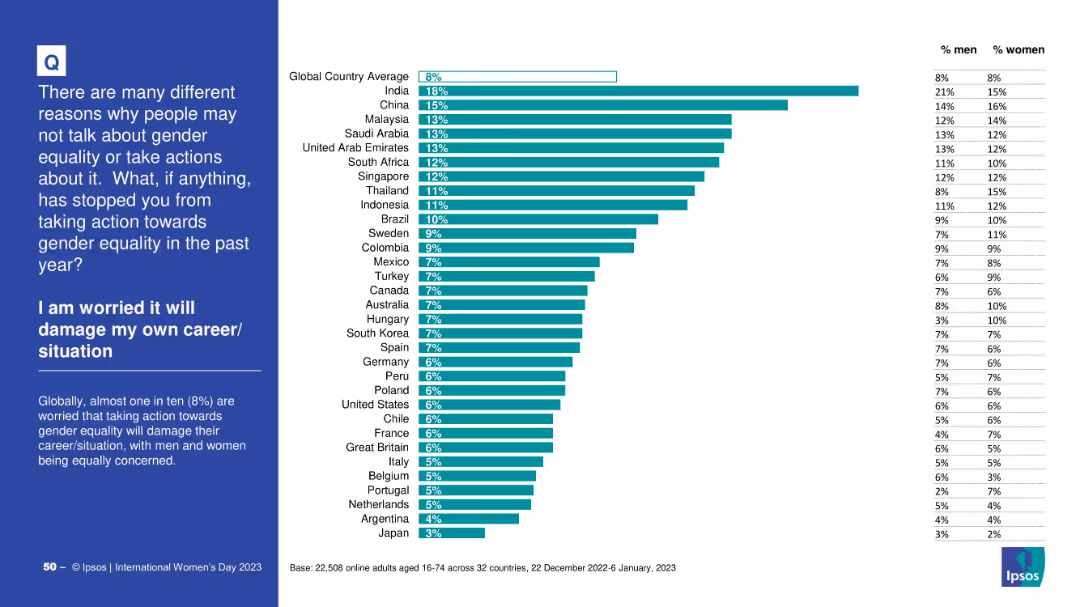
Clean horizontal bar chart with countries listed; global average marked; left panel highlights context and gender breakdown.
Risk Assessment and Management
Government & Public Sector
The slide displays survey responses from people who fear taking action on gender equality might harm their career. The global average is 8%, with India at 18%. The data is segmented by gender and region.
career risk, equality, fear, gender impact, Ipsos, public opinion, professional consequences
false
Risk Assessment and Management
Government & Public Sector
Mixed Chart
IPSOS
Add to my slides
Remove from favorites
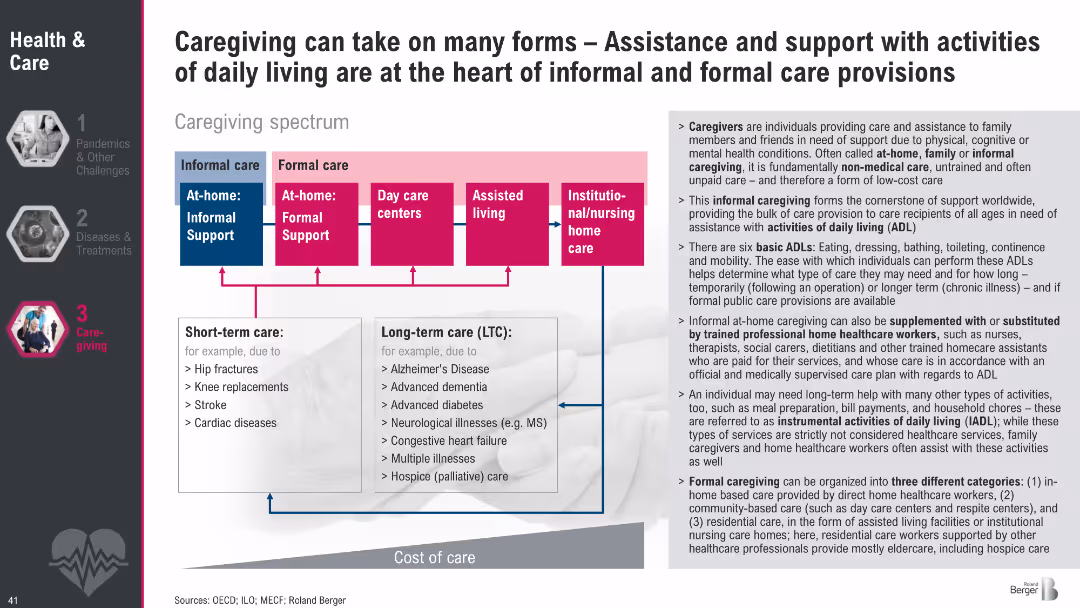
Diagram of caregiving spectrum from informal to formal care with color-coded boxes; side text explains caregiving types, ADLs, and care roles.
Human Resources and Talent Management
Healthcare & Pharmaceuticals
This slide outlines the caregiving spectrum, showing informal vs. formal care types and short-term vs. long-term needs. It also defines the roles of caregivers and the activities they support, emphasizing the importance of both unpaid and professional care structures in supporting daily living.
caregiving, informal care, formal care, ADLs, long-term care, support systems, care spectrum, eldercare
false
Human Resources and Talent Management
Healthcare & Pharmaceuticals
Diagram
Roland Berger
Add to my slides
Remove from favorites
Bubble chart showing CARG and growth for various IT segments from 2020-2025. Segments like Supply Chain Management, IaaS, and Business Intelligence Platforms are plotted with bubbles varying in size to represent different scales of impact.
Strategic Planning
Technology & Software
The slide analyzes the shift from purchasing solutions to building them in-house across various IT segments, with a focus on growth and CARG predictions.
CARG, growth, IT segments, bubble chart, strategy
false
Strategic Planning
Technology & Software
Single Chart
Gartner
Add to my slides
Remove from favorites
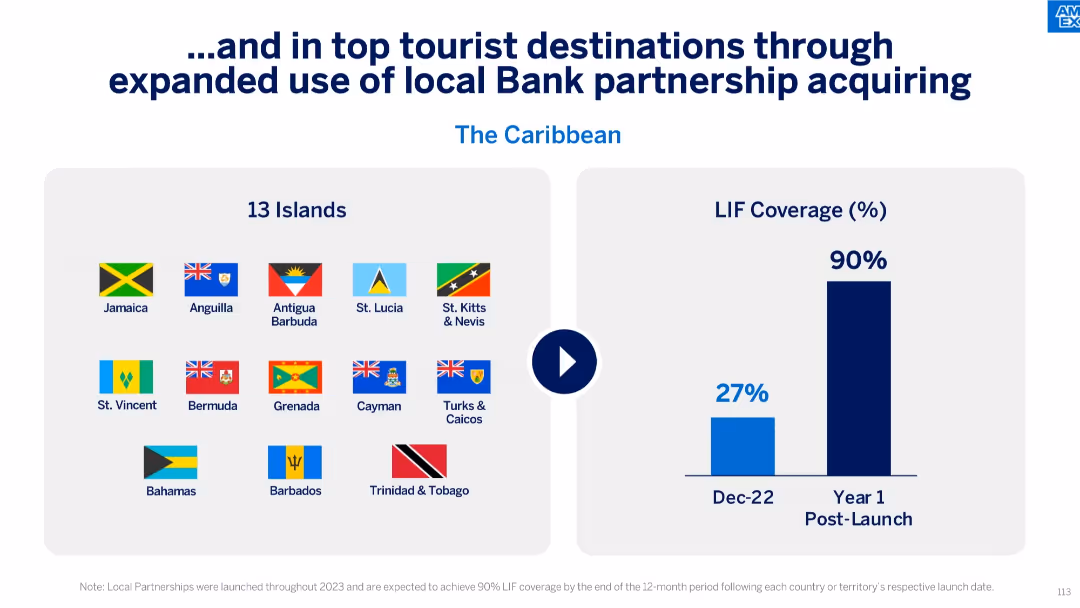
Split slide with country flags (left) and bar graph (right); left highlights 13 Caribbean islands, right shows LIF coverage growth.
Strategic Planning
Financial Services
This slide presents how expanded bank partnerships in the Caribbean are boosting LIF coverage. It emphasizes the growth from 27% coverage in Dec 2022 to a projected 90% within a year, covering 13 tourist-heavy islands.
Caribbean, bank partnerships, LIF growth, tourist destinations, Amex, merchant acquiring, coverage expansion, bar chart
false
Strategic Planning
Financial Services
Mixed Chart
McKinsey
Add to my slides
Remove from favorites
The slide displays column charts for multiple countries, comparing the change in new car purchase intent.
Market Analysis and Trends
Transportation & Logistics
Discusses the varying degrees of recovery in new car purchase intent across different markets during the pandemic.
car market, international, purchase intent, recovery trends
false
Market Analysis and Trends
Transportation & Logistics
Multiple Chart
McKinsey
Add to my slides
Remove from favorites
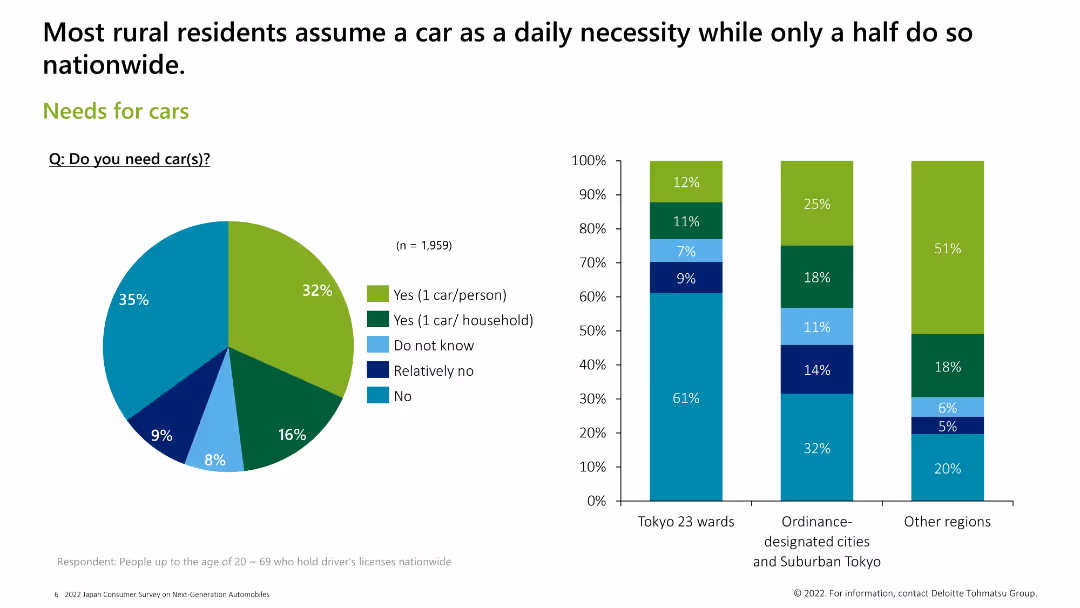
Includes a pie chart and three column charts to illustrate the need for cars across different regions and demographics.
Market Analysis and Trends
Consumer Goods
The slide discusses the necessity of cars among rural and urban residents, with data on how many cars they need and why.
car necessity, rural, urban, survey, demographics
false
Market Analysis and Trends
Consumer Goods
Multiple Chart
Deloitte
Add to my slides
Remove from favorites
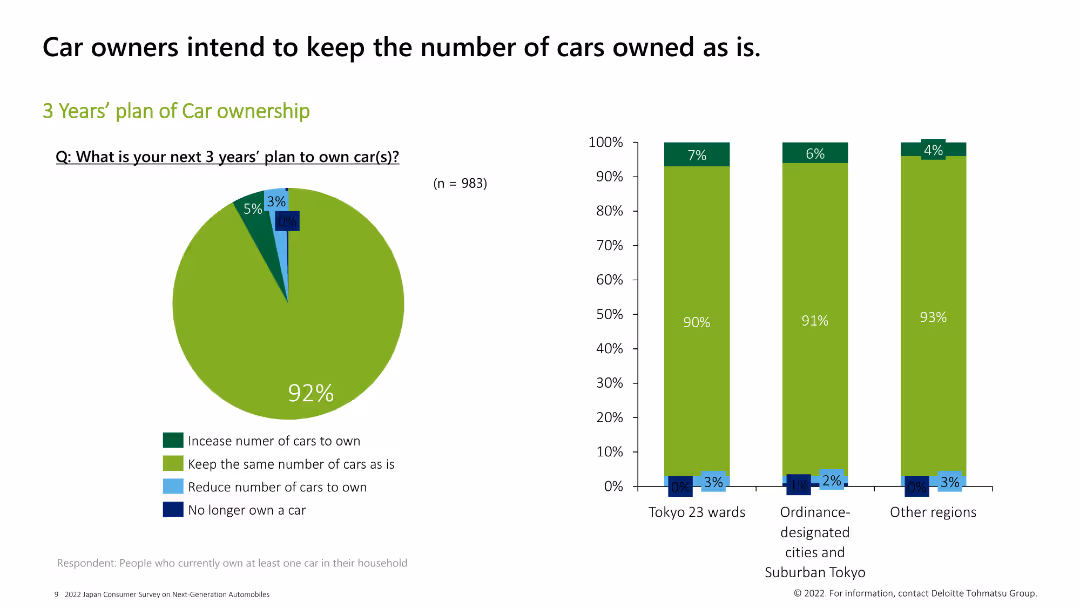
Includes a pie chart and three column charts showing future car ownership plans among respondents.
Strategic Planning
Consumer Goods
The slide outlines respondents' plans for car ownership over the next three years, indicating whether they plan to keep, increase, or decrease the number of cars.
car ownership plans, future, strategic planning, survey
false
Strategic Planning
Consumer Goods
Multiple Chart
Deloitte
Add to my slides
Remove from favorites
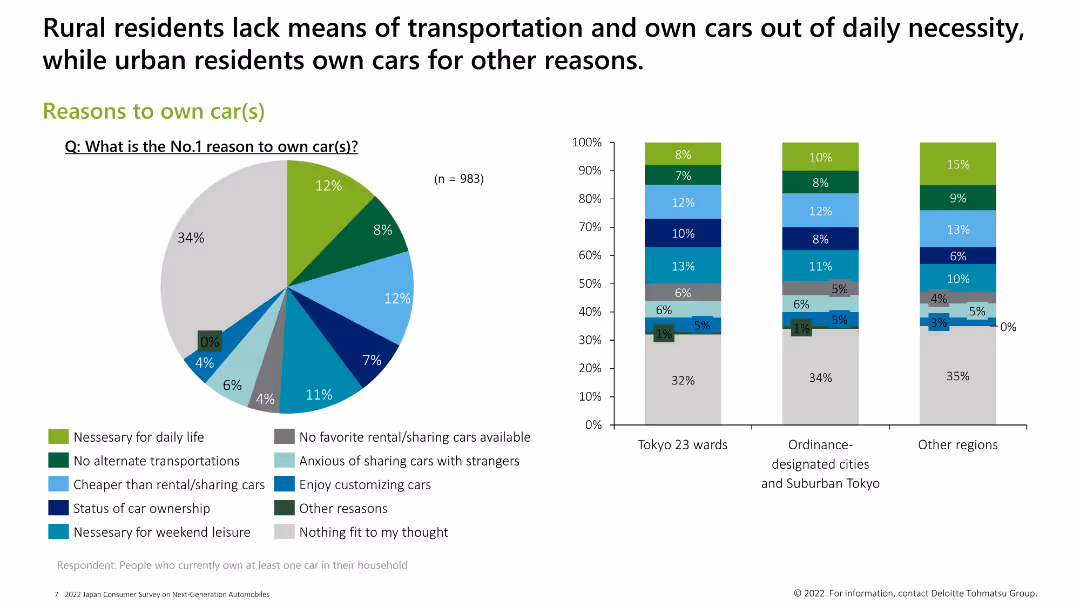
Contains a pie chart and three column charts showing various reasons people own cars, categorized by region.
Market Analysis and Trends
Consumer Goods
The slide highlights the primary reasons for car ownership, such as daily necessity, lack of alternative transportation, and personal preferences.
car ownership reasons, necessity, transportation, preferences
false
Market Analysis and Trends
Consumer Goods
Multiple Chart
Deloitte
Add to my slides
Remove from favorites
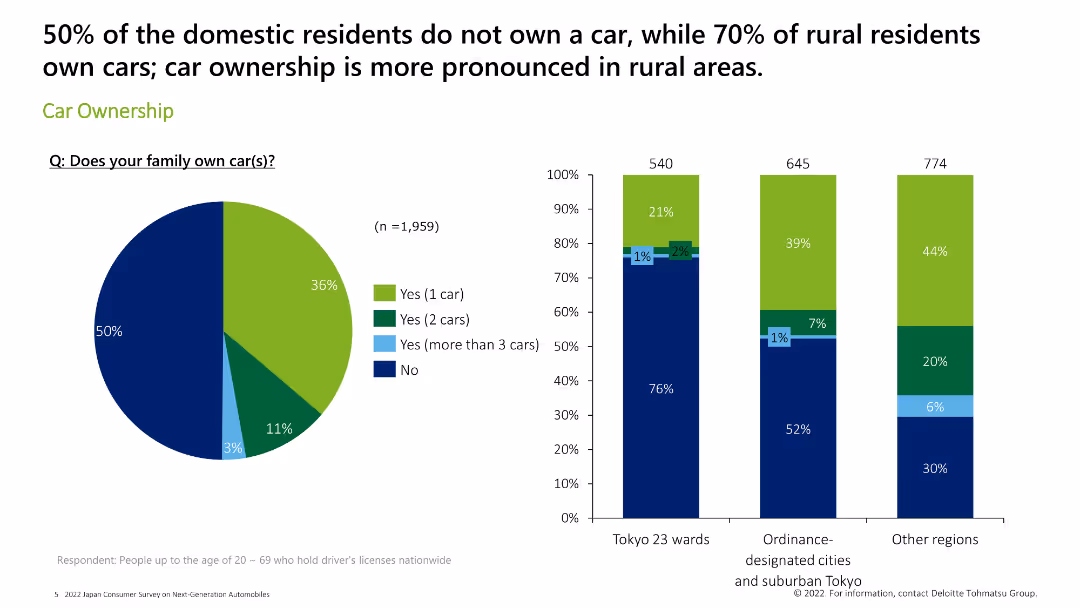
Features a pie chart on the left and three column charts on the right, displaying car ownership statistics across various regions.
Market Analysis and Trends
Consumer Goods
The slide details car ownership statistics, showing the percentage of domestic residents who own cars, with a focus on rural vs. urban areas.
car ownership, statistics, rural, urban, survey
false
Market Analysis and Trends
Consumer Goods
Multiple Chart
Deloitte
Add to my slides
Remove from favorites
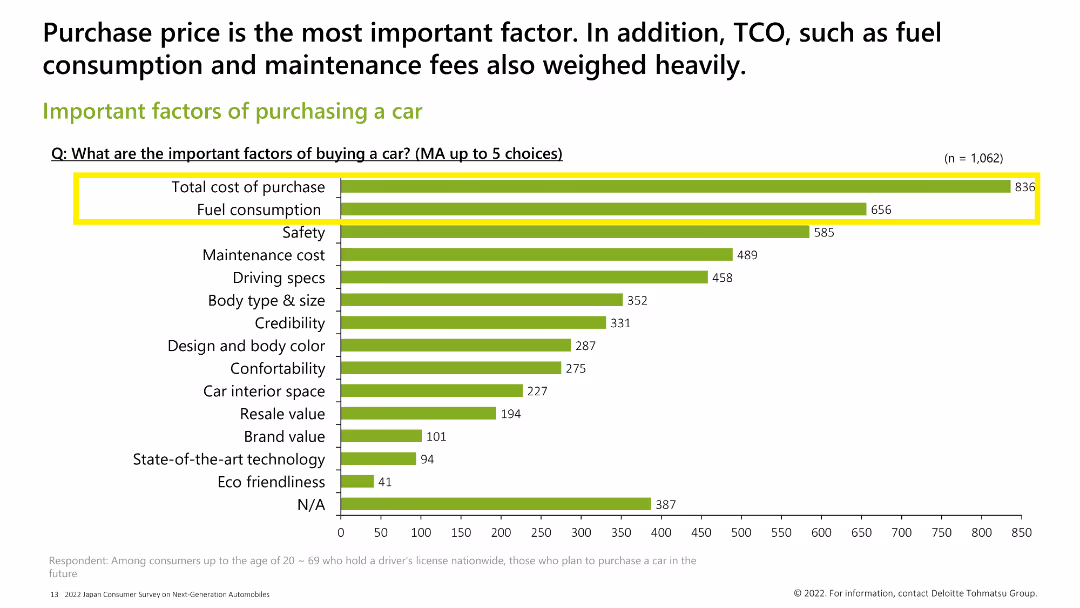
Features a horizontal bar chart highlighting the most important factors for car buyers, such as purchase price and fuel consumption.
Market Analysis and Trends
Consumer Goods
The slide identifies the top factors that influence car purchasing decisions, including cost, fuel consumption, safety, and maintenance costs.
car purchase factors, cost, fuel consumption, safety, survey
false
Market Analysis and Trends
Consumer Goods
Single Chart
Deloitte
Add to my slides
Remove from favorites
The slide features a column chart showing preferences for purchasing, leasing, or subscribing to cars in Germany, the US, and China, with percentage bars for each option.
Market Analysis and Trends
Transportation & Logistics
The slide indicates that purchasing new or used cars is the dominant preference among respondents, but interest in car subscription models is growing, especially in China.
car purchase, leasing, subscription, Germany, US, China, consumer preferences, automotive, market trends
false
Market Analysis and Trends
Transportation & Logistics
Multiple Chart
PwC/Strategy&
Add to my slides
Remove from favorites
Utilizes color-graded bar graphs to compare monthly passenger car sales, with annotations for different periods.
Market Analysis and Trends
Transportation & Logistics
Explores monthly passenger car sales data to assess the recovery in discretionary spending post-COVID-19.
car sales, discretionary spending, COVID-19 recovery
false
Market Analysis and Trends
Transportation & Logistics
Multiple Chart
BCG
Add to my slides
Remove from favorites
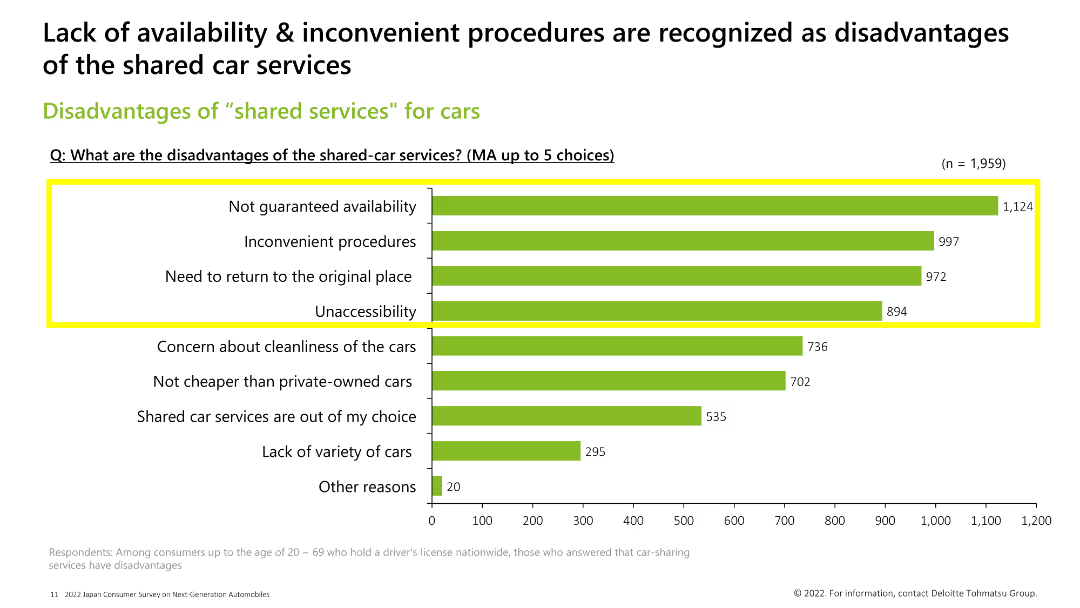
Includes a horizontal bar chart showing the disadvantages of car sharing services as perceived by respondents.
Market Analysis and Trends
Consumer Goods
The slide discusses the drawbacks of car sharing, such as lack of availability, inconvenient procedures, and the need to return cars to original locations.
car sharing, disadvantages, availability, survey, procedures
false
Market Analysis and Trends
Consumer Goods
Single Chart
Deloitte
Add to my slides
Remove from favorites
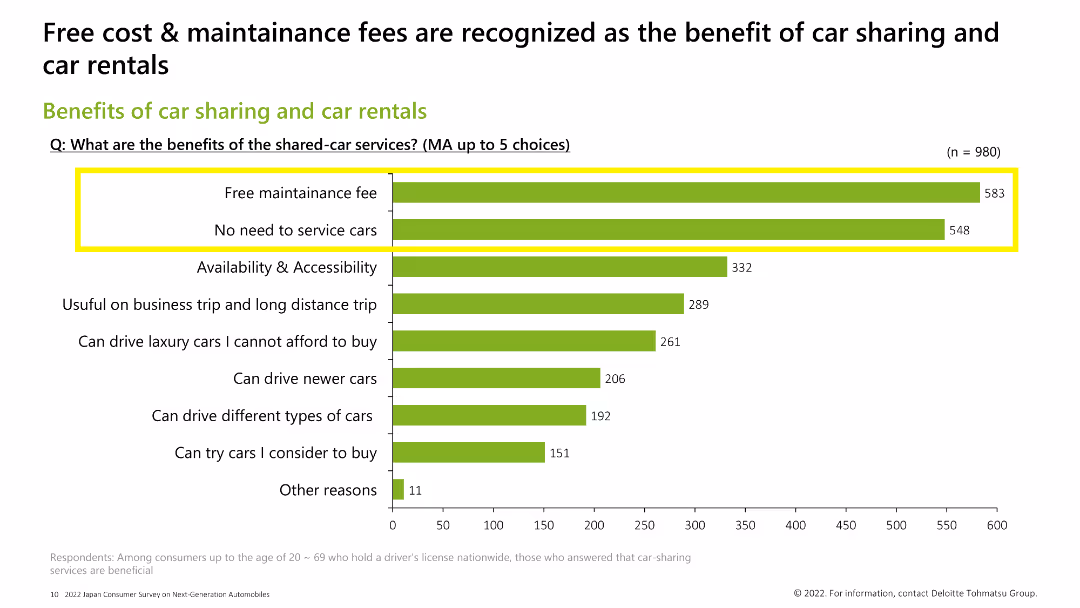
Features a horizontal bar chart listing the benefits of car sharing and car rentals, highlighting the top responses.
Market Analysis and Trends
Consumer Goods
The slide lists the key benefits of using car sharing and rental services, such as free maintenance and no need to service cars.
car sharing, rentals, benefits, maintenance, survey
false
Market Analysis and Trends
Consumer Goods
Single Chart
Deloitte
Add to my slides
Remove from favorites
The slide contains a combination of bar charts and tables. It compares typical car tenure, importance of residual value, and awareness of car resale value among EV owners, prospects, and sceptics across different regions (APAC, EMEA, North America).
Market Analysis and Trends
Transportation & Logistics
The slide provides insights into the importance of residual value for EV owners compared to sceptics and prospects. It also shows the average car tenure and awareness of resale value among different groups and regions.
car tenure, residual value, resale value, EV owners, prospects, sceptics, regional differences
false
Market Analysis and Trends
Transportation & Logistics
Multiple Chart
PwC/Strategy&
Add to my slides
Remove from favorites
Features a column chart tracking the appeal caseload over multiple years. The slide is data-dense, with a significant amount of textual information supporting the graphical elements.
Operational Efficiency
Government & Public Sector
It details the Appeal Division's caseload over several years, showing filed, finalized, and pending appeals, which provides insights into the trends and workload of the division.
caseload, appeals, finalization, trend analysis, workload
false
Operational Efficiency
Government & Public Sector
Mixed Chart
PwC/Strategy&
Add to my slides
Remove from favorites
This slide features a central column chart surrounded by explanatory text and smaller charts, highlighting the caseload distribution in two courts with a focus on family law. The layout is organized and color-coded for clarity.
Operational Efficiency
Government & Public Sector
It showcases the total number of court cases handled by two courts, emphasizing the distribution and percentage of family law cases, useful for workload analysis and operational insights.
caseload, courts, distribution, family law, analysis
false
Operational Efficiency
Government & Public Sector
Single Chart
PwC/Strategy&
Add to my slides
Remove from favorites
Contains column charts comparing caseloads, with a focus on color contrasts between red, brown, and beige to highlight differences among locations.
Regulatory and Compliance
Government & Public Sector
Presents a comparative analysis of the caseloads in different court locations and the trend in the number of case finalizations.
Caseload, courts, family law, applications, finalizations, judicial system, comparative analysis, trend
false
Regulatory and Compliance
Government & Public Sector
Multiple Chart
PwC/Strategy&
Add to my slides
Remove from favorites
This slide features a flowchart with color-coded sections indicating different stages of a family law case process, accompanied by icons and a timeline.
Strategic Planning
Government & Public Sector
The slide outlines a future case management system for family law, suggesting improvements in process flow, aiming to expedite resolution and reduce litigation costs.
case management, family law, process improvement, timeline, flowchart, mediation, adjudication
false
Strategic Planning
Government & Public Sector
Diagram
PwC/Strategy&
Add to my slides
Remove from favorites
Logos and brief case studies of companies using AR in operations, including icons representing each industry.
Technology and Digital Transformation
Technology & Software
Highlights companies in different sectors that have leveraged AR for improvements in sales, training, manufacturing efficiency, and operational time.
Case studies, AR, sales, training, efficiency, innovation
false
Technology and Digital Transformation
Technology & Software
Header Vertical
McKinsey
Add to my slides
Remove from favorites
The slide is divided into two vertical sections with headers in dark blue. Each section has a thematic icon and contains text blocks describing company case studies. Page number is at the bottom right.
Client Case Studies
Financial Services
This slide presents two case studies related to sustainable finance: one focusing on clean energy through a partnership with BlocPower, and the other on community empowerment with the National Urban League. The slide details the company's contributions and solutions, such as providing equity and debt financing, and is suitable for demonstrating the impact and scope of the presenter's sustainable finance initiatives in real-world applications.
Case Studies, Clean Energy, Community, Finance, Equity, Debt, Empowerment, Sustainability
false
Client Case Studies
Financial Services
Table
Goldman Sachs
Add to my slides
Remove from favorites
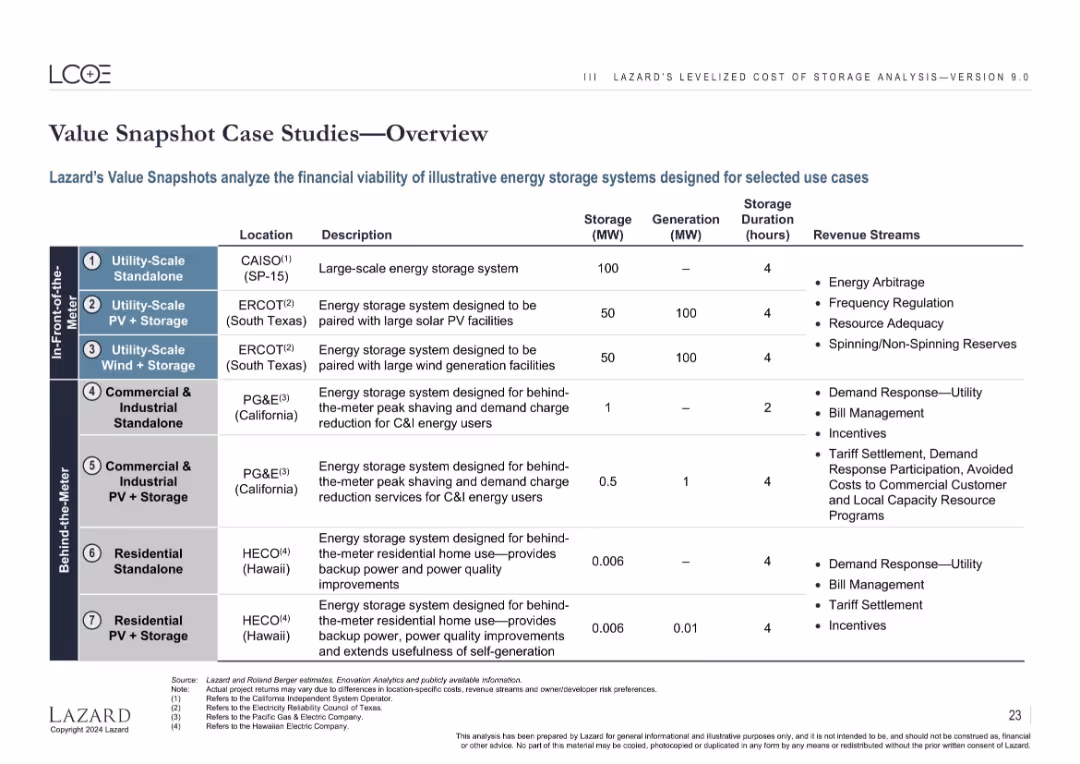
Tabular layout listing 7 case studies categorized by location, configuration, and revenue stream.
Client Case Studies
Energy & Utilities
Summarizes 7 case studies of standalone and hybrid energy storage systems across use cases (utility-scale, commercial, residential). Details include location, generation/storage capacity, and expected revenue sources like arbitrage, incentives, and demand response.
case studies, energy storage, PV, wind, residential, utility-scale, C&I, duration
false
Client Case Studies
Energy & Utilities
Table
Roland Berger
Add to my slides
Remove from favorites
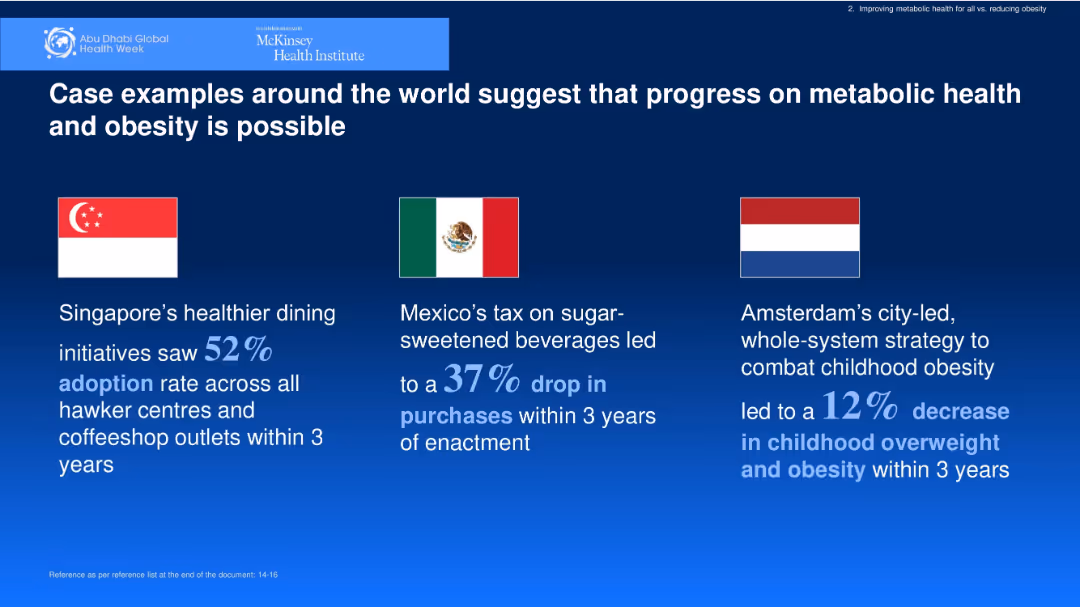
Horizontal layout with flags and country-specific outcomes. Dark blue background with white and blue text.
Client Case Studies
Healthcare & Pharmaceuticals
Shares global case studies from Singapore, Mexico, and Amsterdam demonstrating successful interventions in improving metabolic health and reducing obesity. Shows measurable results within a three-year timeframe.
case studies, obesity, public health, interventions, global examples
false
Client Case Studies
Healthcare & Pharmaceuticals
Pillar
McKinsey
Add to my slides
Remove from favorites
The slide shows a column chart displaying the growth in Global Alternatives AUM with predictions up to 2027, complemented by bullet points discussing industry dynamics on the side. The color blue is used to represent data points effectively against the dark background.
Client Case Studies
Financial Services
Highlights a case study on the collaboration between global banking and market sectors to show growth opportunities, suitable for illustrating market expansion and client base growth.
Case study, banking, market growth
false
Client Case Studies
Financial Services
Mixed Chart
Goldman Sachs
Add to my slides
Remove from favorites
Three sections with photos and text describing the case examples in the context of cloud and edge computing's impact on different industries.
Technology and Digital Transformation
Technology & Software
Examines specific cases of companies like AT&T, Tesla, and Walmart, showcasing how they are utilizing cloud and edge computing.
case study, cloud computing, edge computing, industry applications, business impact
false
Technology and Digital Transformation
Technology & Software
Header Vertical
McKinsey
Add to my slides
Remove from favorites
A two-part slide with one side outlining a client scenario in bullet points, and the other side titled "Elevate your experience" with a list of operational benefits. A faded background image depicts a person using a mobile phone.
Client Case Studies
Transportation & Logistics
Provides a case study on improving rush hour efficiency with contactless payments, suitable for discussing transportation management and customer experience optimization.
case study, contactless payments, transportation, customer experience, operational benefits
false
Client Case Studies
Transportation & Logistics
Boxed
JP Morgan
Add to my slides
Remove from favorites
Features logos of Athena, Chase.com, and ServiceNow with bullet points outlining improvements and efficiencies gained in each case. It highlights specific achievements such as cost reductions, enhanced customer support, and platform optimizations.
Technology and Digital Transformation
Technology & Software
Showcases technology-driven operational enhancements and cost efficiency improvements through three distinct case studies.
Case Study, Digital Strategy, Capacity, Performance, Cost Savings, Technology Platforms, Financial Services, Cloud-Native, Automation
false
Technology and Digital Transformation
Technology & Software
Pillar
JP Morgan
Add to my slides
Remove from favorites
The slide features bullet points describing a case study of a global retailer. There are two small visual charts on the right: a colorful bar chart and a heat map.
Market Analysis and Trends
Consumer Goods
The slide outlines a case study for a global retailer, including course details, data sources, and an overview of the two-part case study involving sales analysis and recommendations.
case study, global retailer, data analytics, Tableau, sales variance
false
Market Analysis and Trends
Consumer Goods
Mixed Chart
EY
Add to my slides
Remove from favorites
The slide contains a mix of text, pie charts, and infographics. The layout is structured into sections including an analysis of business cases, development sources, and risks.
Strategic Planning
Government & Public Sector
This slide presents a case study for Indonesia’s planned new capital, using a five-case model to analyze its strategic, financial, commercial, economic, and management cases.
Case study, green city, inclusive, smart, capital, strategic planning, Indonesia, development, financial, risks
false
Strategic Planning
Government & Public Sector
Single Chart
BCG
Add to my slides
Remove from favorites
Various charts including a column chart for integration cost timing and a breakdown of cost categories, presented in a clear, visual format.
Mergers and Acquisitions
Professional Services
Provides a case study on the integration costs of a successful merger, detailing the cost breakdown and timing of expenses.
case study, integration, merger, costs, financial breakdown, cost timing, professional services
false
Mergers and Acquisitions
Professional Services
Multiple Chart
Deloitte
Add to my slides
Remove from favorites
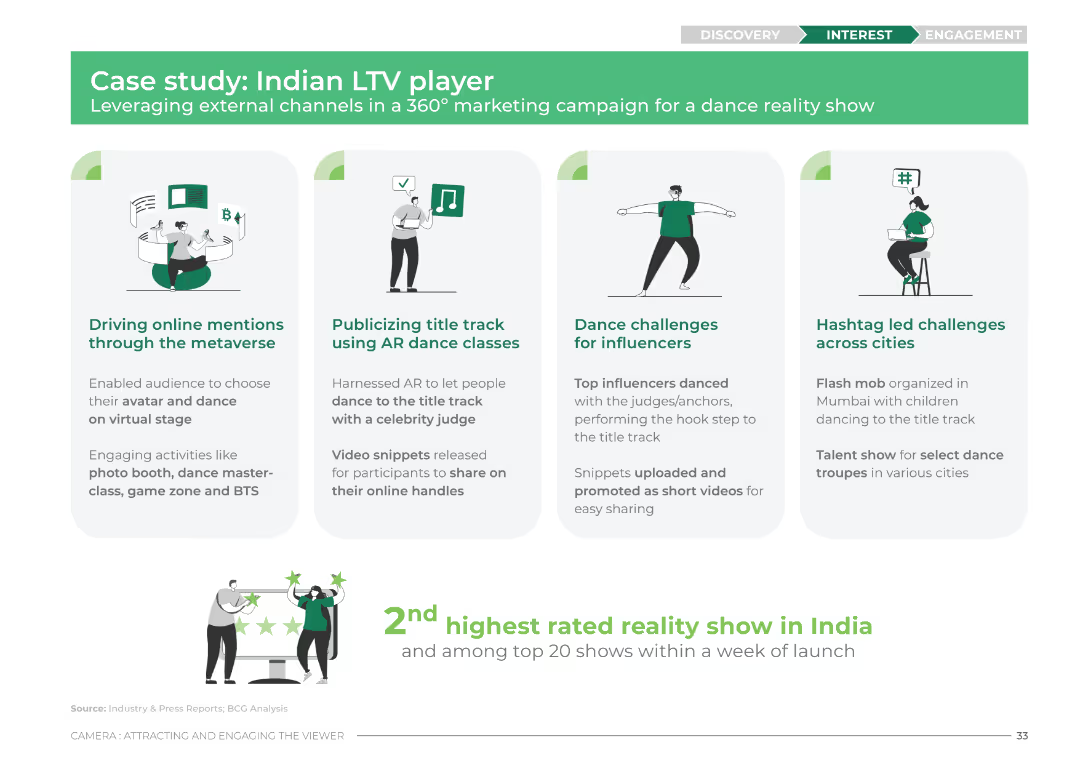
The slide features four columns with icons and brief descriptions for each aspect of the marketing campaign. The design uses green and white colors with icons representing the metaverse, AR dance classes, dance challenges, and hashtag challenges.
Client Case Studies
Media & Entertainment
This slide outlines a case study of an Indian LTV player's marketing campaign. It details the use of metaverse, AR dance classes, influencer dance challenges, and hashtag challenges to drive engagement and mentions the show's high rating and popularity.
case study, LTV, marketing campaign, metaverse, AR dance, influencers, hashtag challenges, engagement
false
Client Case Studies
Media & Entertainment
Pillar
BCG
Add to my slides
Remove from favorites
Case studies of companies that have leveraged ML for significant operational improvements, with stats on impacts.
Technology and Digital Transformation
Technology & Software
Profiles the transformative impact of ML in three different companies, showing improvements in efficiency and operations.
Case study, ML, impact, efficiency, operational improvements
false
Technology and Digital Transformation
Technology & Software
Linear Flow
McKinsey
Add to my slides
Remove from favorites
A dark-themed slide split into two halves, one detailing businesses involved, the other outlining solutions provided by the firm, complemented by a client testimonial.
Mergers and Acquisitions
Financial Services
A case study slide showcasing how the firm’s integrated solutions across various departments contributed to a client's success story.
Case Study, Solutions, Wealth, Investment, Asset, Management, Client, Testimonial
false
Mergers and Acquisitions
Financial Services
Table
Goldman Sachs
Add to my slides
Remove from favorites
The slide includes a line chart showing the price of Suriname '26 bonds over time. The layout is clear with a focus on the case study.
Financial Performance
Financial Services
The slide presents a case study on Suriname's debt restructuring, detailing the process, the role of creditor committees, and the positive outcome on bond prices.
case study, Suriname, debt restructuring, bonds, financial performance
false
Financial Performance
Financial Services
Mixed Chart
Morgan Stanley
Add to my slides
Remove from favorites
Previous
Next
You don't have any favorites yet.
Please wait loading your favorites slides...
Create a FREE account to continue browsing
Receive Instant Access to 1,000+ slides from companies like McKinsey, Google, and Goldman Sachs
First Name
Last Name
Email
Password
I agree to all
Terms & Privacy Policy
Thank you! Your submission has been received!
Oops! Something went wrong while submitting the form.
Have an account?
Sign in
Upgrade to PRO to Save slides
Advanced Search and Filters
Access to 15,000+ slides
Access to Category Pages
Save/Bookmark Slides
PowerPoint Template Library
Pick a Plan
MONTHLY
$12/month
Billed every month, Cancel anytime.
YEARLY
$9/year
Billed $108 annually, Cancel anytime.
Checkout for $12/month
Checkout for $108/yr
Secured by Stripe | AES-256 bit encryption