My Account
My Slides
Search by Category
Companies
Slide Type
Use Case
Industry
Pricing
Templates
View All Templates
Download Template Slides
✦ AI
AI Prompt Library
AI Search
Feedback
Login
Logout
Get Started
Browse all Slides
Browse all Slides
Create a FREE Account
Instant access to 1,000+ real slides from top companies like McKinsey, BCG, Goldman Sachs, Google and many more!
First Name
Last Name
Email
Password
I agree to all
Terms & Privacy Policy
Thank you! Your submission has been received!
Oops! Something went wrong while submitting the form.
Have an account?
Sign in
Saved Slides
Total No. of slides saved
0
↻ Refresh
✖ Clear all
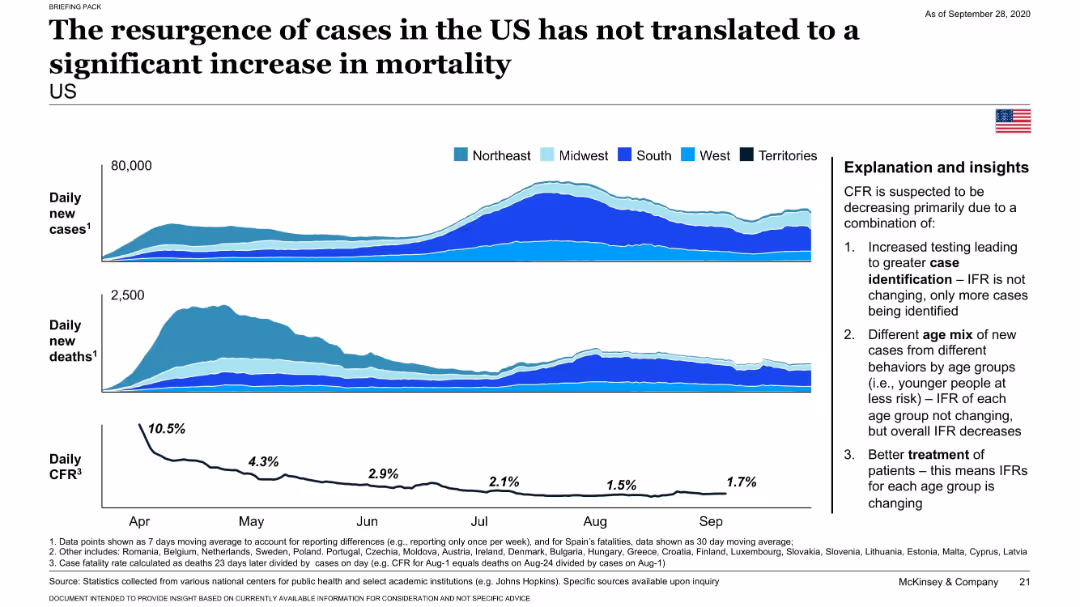
Stacked area charts for daily new cases and deaths, and a line graph for CFR, segmented by U.S. regions; includes a text box with bullet points explaining insights.
Risk Assessment and Management
Healthcare & Pharmaceuticals
Shows that despite a spike in COVID-19 cases in the U.S., the case fatality rate (CFR) and deaths have not risen proportionately. Explains this trend with factors such as increased testing, changes in age mix of cases, and better treatment protocols.
CFR, COVID-19, testing, mortality, case surge, regional analysis, insights
false
Risk Assessment and Management
Healthcare & Pharmaceuticals
Mixed Chart
McKinsey
Add to my slides
Remove from favorites
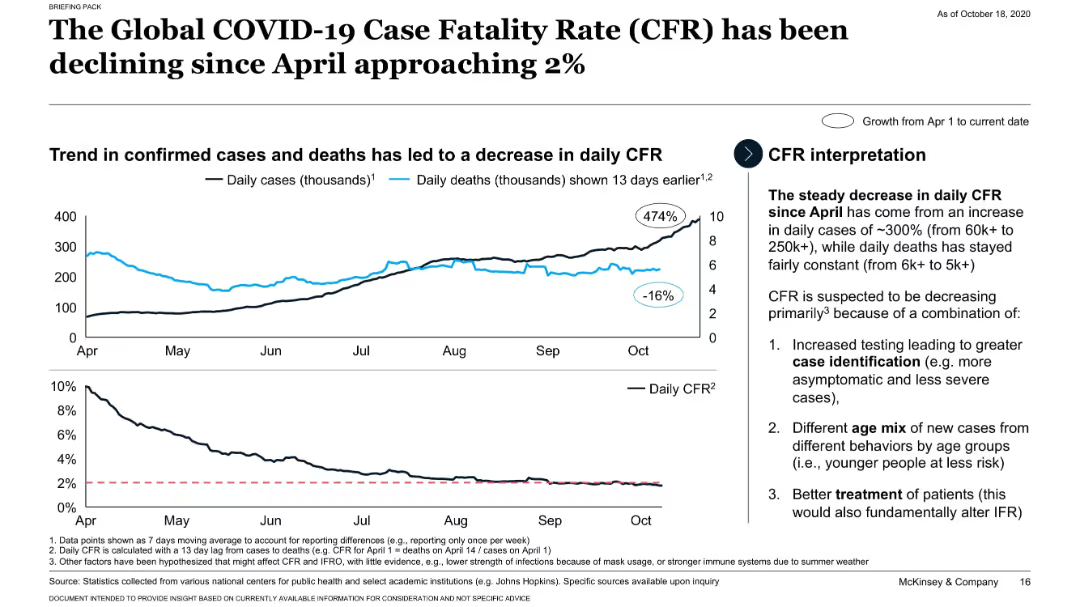
Line charts showing CFR decline alongside increase in daily cases and relative constancy in deaths.
Performance Metrics and KPIs
Healthcare & Pharmaceuticals
Analyzes the inverse relationship between rising COVID-19 cases and falling case fatality rates globally, with three main causes: better identification, different age mix, and improved treatment.
CFR decline, COVID-19, testing, treatment, case surge
false
Performance Metrics and KPIs
Healthcare & Pharmaceuticals
Mixed Chart
McKinsey
Add to my slides
Remove from favorites
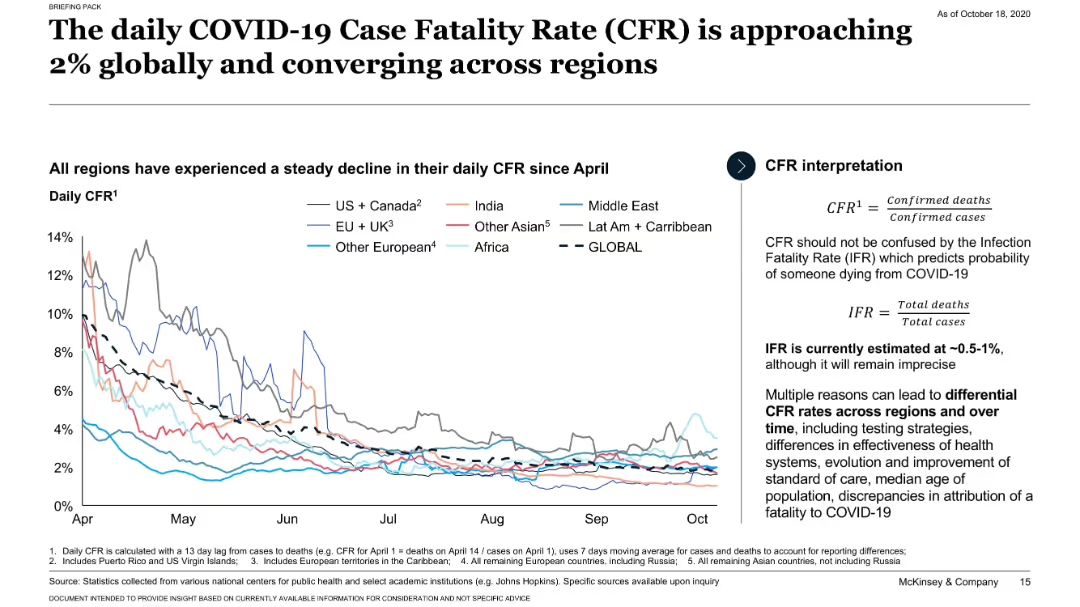
Line chart tracking daily CFR trends globally and by region since April; CFR definitions provided.
Performance Metrics and KPIs
Healthcare & Pharmaceuticals
Shows that the global daily COVID-19 CFR has declined and converged around 2% across regions. Introduces the distinction between CFR and IFR and discusses why CFR may vary.
CFR, global trends, IFR, regional comparison, COVID-19
false
Performance Metrics and KPIs
Healthcare & Pharmaceuticals
Mixed Chart
McKinsey
Add to my slides
Remove from favorites
This slide features a column chart breaking down the global foodservice market by ownership and geography for 2022. Different colors represent chains and independent establishments, with a yellow highlight on Italy.
Market Analysis and Trends
Hospitality & Tourism
This slide discusses the market share and growth of chain restaurants globally, emphasizing the significant growth driven by North America. It provides a geographical breakdown of market share for chains vs. independent establishments.
Chains, market share, growth, foodservice, geographical breakdown
false
Market Analysis and Trends
Hospitality & Tourism
Mixed Chart
Deloitte
Add to my slides
Remove from favorites
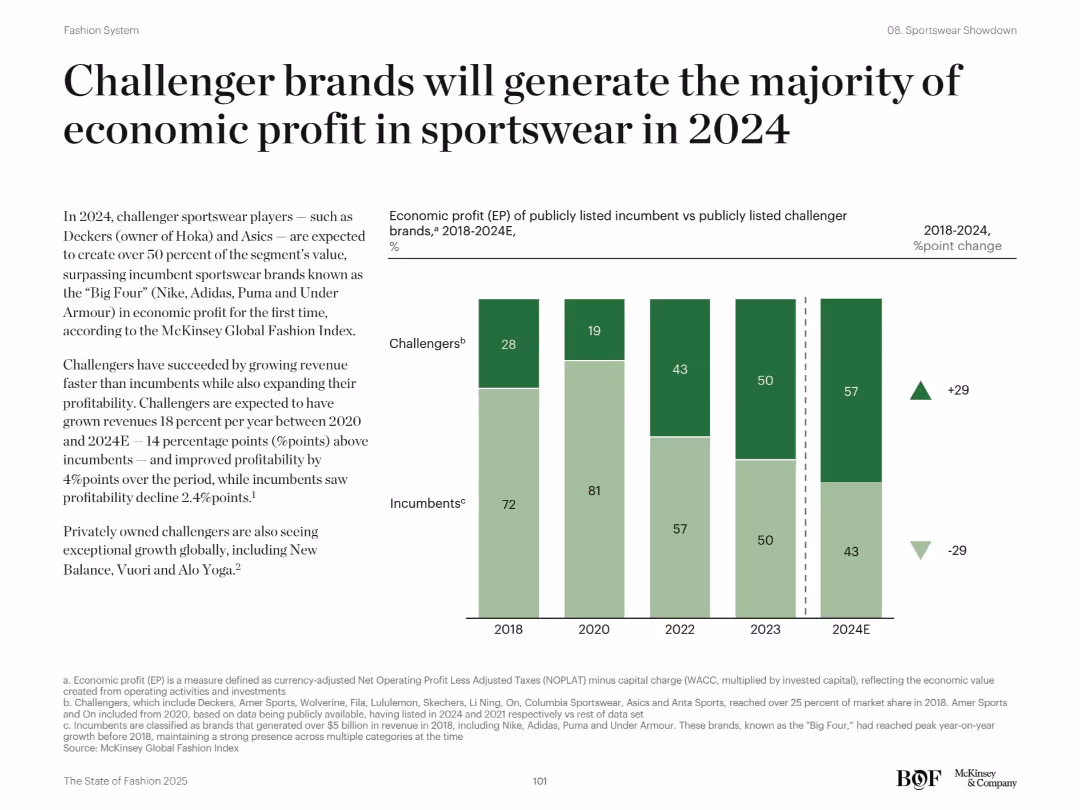
Split design with text on left and stacked bar chart on right comparing challengers vs incumbents over years
Financial Performance
Consumer Goods
This slide reveals how challenger sportswear brands like Deckers and Asics are surpassing incumbents like Nike and Adidas in economic profit. The chart compares EP share between 2018–2024E, showing a clear shift toward challengers. The analysis explains challengers’ faster revenue growth and stronger profitability, while incumbents show decline.
challenger brands, sportswear, profit, incumbents, EP, growth, 2024, Nike, Asics
false
Financial Performance
Consumer Goods
Mixed Chart
McKinsey
Add to my slides
Remove from favorites
Slide includes heatmap categorizing primary challenges and skill deficits in scaling digital projects across various business functions in the automotive sector.
Operational Efficiency
Transportation & Logistics
Outlines the major alignment and skill challenges automotive executives face when scaling digital proofs of concept, emphasizing areas needing improvement for successful implementation.
challenges, automotive, digital transformation, skills deficit, alignment issues
false
Operational Efficiency
Transportation & Logistics
Table
Accenture
Add to my slides
Remove from favorites
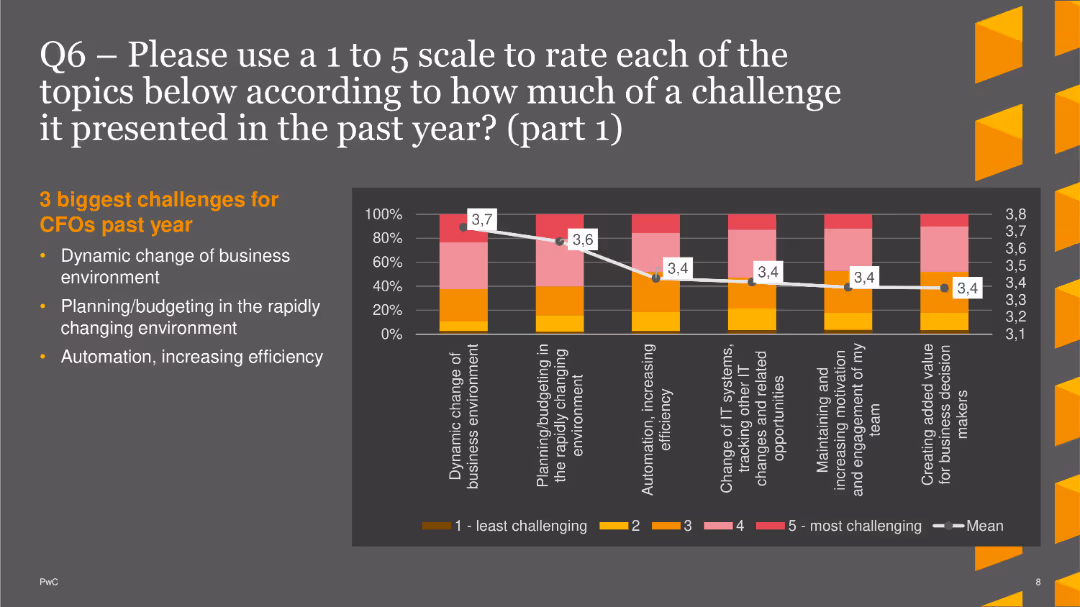
The slide displays a column chart rating the challenges faced by CFOs, including dynamic business changes and planning/budgeting.
Market Analysis and Trends
Financial Services
This slide shows the top three challenges for CFOs: dynamic business environment, planning/budgeting, and automation/efficiency, rated on a 1 to 5 scale.
Challenges, CFOs, Column Chart, PwC, Survey, 2022, Business Environment
false
Market Analysis and Trends
Financial Services
Mixed Chart
PwC/Strategy&
Add to my slides
Remove from favorites
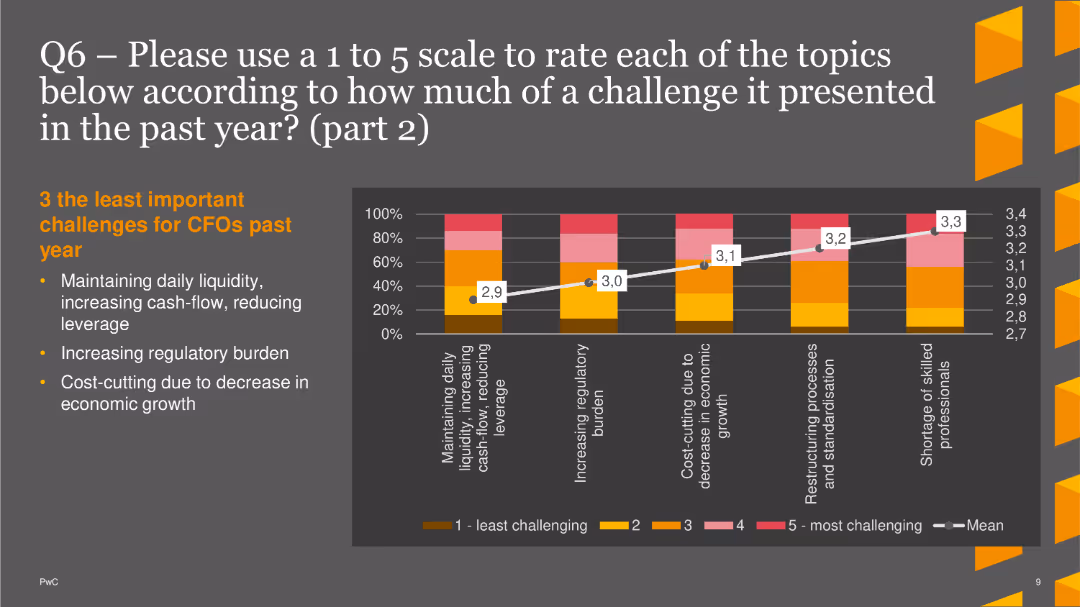
The slide features a column chart rating less significant challenges, such as maintaining liquidity and increasing regulatory burden.
Market Analysis and Trends
Financial Services
This slide highlights the least important challenges for CFOs: daily liquidity, regulatory burden, and cost-cutting, rated on a 1 to 5 scale.
Challenges, CFOs, Column Chart, PwC, Survey, 2022, Liquidity
false
Market Analysis and Trends
Financial Services
Mixed Chart
PwC/Strategy&
Add to my slides
Remove from favorites
Left side features a pyramid chart, right side has percentage bubbles and text
Technology and Digital Transformation
Technology & Software
Challenges and use cases of generative AI in software engineering, focusing on code generation
challenges, code generation, software engineering
false
Technology and Digital Transformation
Technology & Software
Multiple Chart
Gartner
Add to my slides
Remove from favorites
Showcases an oversized percentage figure emphasizing workforce planning, a pie chart on changes in business costs, and a column chart for perspectives on economic policy.
Operational Efficiency
Financial Services
Assesses ongoing business challenges like cost management and headcount planning, considering economic conditions and the corresponding fiscal policy stance from the Federal Reserve’s viewpoint.
Challenges, Costs, Workforce, Federal Reserve
false
Operational Efficiency
Financial Services
Multiple Chart
JP Morgan
Add to my slides
Remove from favorites
Column charts on this slide rank the most challenging aspects of the HCP engagement process based on a survey.
Risk Assessment and Management
Healthcare & Pharmaceuticals
Analyzes the challenges faced in the HCP engagement process, helping to identify areas needing improvement and focus.
challenges, HCP engagement, survey analysis, process improvement, risk management
false
Risk Assessment and Management
Healthcare & Pharmaceuticals
Single Chart
Deloitte
Add to my slides
Remove from favorites
Features a bar chart listing top challenges faced by underwriters, including outdated systems, lack of information, and poor organization, with percentage impacts.
Risk Assessment and Management
Financial Services
Highlights the main challenges faced by insurance underwriters, such as inefficient systems and insufficient data, critical for assessing operational and risk management issues.
challenges, insurance, underwriters, risk management, inefficient systems, data accessibility, training needs
false
Risk Assessment and Management
Financial Services
Mixed Chart
Accenture
Add to my slides
Remove from favorites
Includes multiple column charts comparing top challenges faced by underwriters in different lines of business, with focus on systems inefficiencies and training needs.
Risk Assessment and Management
Financial Services
Comparative analysis of top operational and risk management challenges across different insurance lines, emphasizing inefficiencies and the need for better training.
challenges, operational risks, insurance, comparison, systems inefficiency, training, personal lines, commercial lines, specialty lines
false
Risk Assessment and Management
Financial Services
Mixed Chart
Accenture
Add to my slides
Remove from favorites
The slide contains horizontal bar charts in a yellow background. It discusses challenges in food value chain partnerships.
Strategic Planning
Agriculture & Food Production
Highlights top challenges in establishing partnerships within the food value chain ecosystem, including network access and data sharing. Useful for strategic planning in sustainability and agriculture.
Challenges, Partnerships, Food Value Chain, Strategic Planning, Ecosystem
false
Strategic Planning
Agriculture & Food Production
Mixed Chart
Deloitte
Add to my slides
Remove from favorites
A comparative slide with a bar chart showing the percentage of respondents identifying specific challenges in service capabilities, processes, funding, and practices across different service categories.
Operational Efficiency
Professional Services
This slide highlights the pivoting challenges faced by different service categories, focusing on service capabilities, investment focus, and management practices.
challenges, service capabilities, funding, management practices, processes
false
Operational Efficiency
Professional Services
Mixed Chart
Accenture
Add to my slides
Remove from favorites
The slide shows a line chart with four different colored dotted lines labeled as Technology, Individuals, Businesses, Public Policy. Each line shows an upward trend over time from the 1970s to today.
Market Analysis and Trends
Technology & Software
This slide depicts the varying rates of change and adoption in technology, individuals, businesses, and public policy over the years, illustrating how the future is unequally distributed. It could be used to discuss technology adoption patterns.
Change, Adoption, Technology, Policy, Trends
false
Market Analysis and Trends
Technology & Software
Single Chart
Deloitte
Add to my slides
Remove from favorites
The slide contains a graph showing normal to disrupted patterns and a juxtaposed image of falling blocks.
Financial Performance
Professional Services
Discusses the challenges companies face during disruptive changes and emphasizes the negative impacts on work quality and productivity.
change, disruption, challenges, impact, quality
false
Financial Performance
Professional Services
Single Chart
Bain
Add to my slides
Remove from favorites
The slide features a circular diagram showing "Macro Forces," "Shifts," and "Signals" with arrows indicating change and response/inspiration actions.
Strategic Planning
Professional Services
The slide explains how change happens at various levels, using macro forces, shifts, and signals, and how Ipsos uses this framework to monitor trends over time.
change, macro forces, shifts, signals, Ipsos
false
Strategic Planning
Professional Services
Diagram
IPSOS
Add to my slides
Remove from favorites
Simplified flowchart with three main phases of change management: Installation, Realization, and Repeatability. Highlights key challenges at each stage with corresponding icons.
Organizational Structure and Change
Professional Services
Highlights the difficulties in achieving successful change management in organizations, focusing on the stages from strategy deployment to embedding new capabilities, and the common stalling points.
Change Management, Challenges, Organization, Strategy
false
Organizational Structure and Change
Professional Services
Linear Flow
Kearney
Add to my slides
Remove from favorites
The slide presents a bar chart with arrows indicating percentage changes, focusing on practices like dedicating time to change management. It uses purple tones to differentiate total enterprise reinventors from transformers and optimizers.
Strategic Planning
Professional Services
Discusses the significance of communication in organizational change, focusing on the allocation of time, leadership communication, and skilling for effective delivery. The slide is a tool for analyzing the human aspects of organizational transformation and change management.
Change Management, Organizational Change, Leadership Communication, Skilling, Reinvention, Human Factors, Engagement Practices, Delivery Strategies
false
Strategic Planning
Professional Services
Multiple Chart
Accenture
Add to my slides
Remove from favorites
Two-column layout; left side has large text title, right side has a vertical bar chart and six boxes with key points.
Organizational Structure and Change
Professional Services
Focuses on the importance of managing change in organizations and lists factors like engaging staff and leveraging technology.
change, management, success, factors, leverage
false
Organizational Structure and Change
Professional Services
Multiple Chart
Kearney
Add to my slides
Remove from favorites
With a split layout, the left side text emphasizes the pace of change, while the right side showcases a lighthouse graphic representing sensing capabilities.
Market Analysis and Trends
Professional Services
Emphasizes the importance of rapid demand-sensing capabilities in different sectors, attributing the necessity to fast-paced changes and consumer behavior.
change pace, consumer behavior, demand-sensing, sectors, analytics, data
false
Market Analysis and Trends
Professional Services
Header Horizontal
BCG
Add to my slides
Remove from favorites
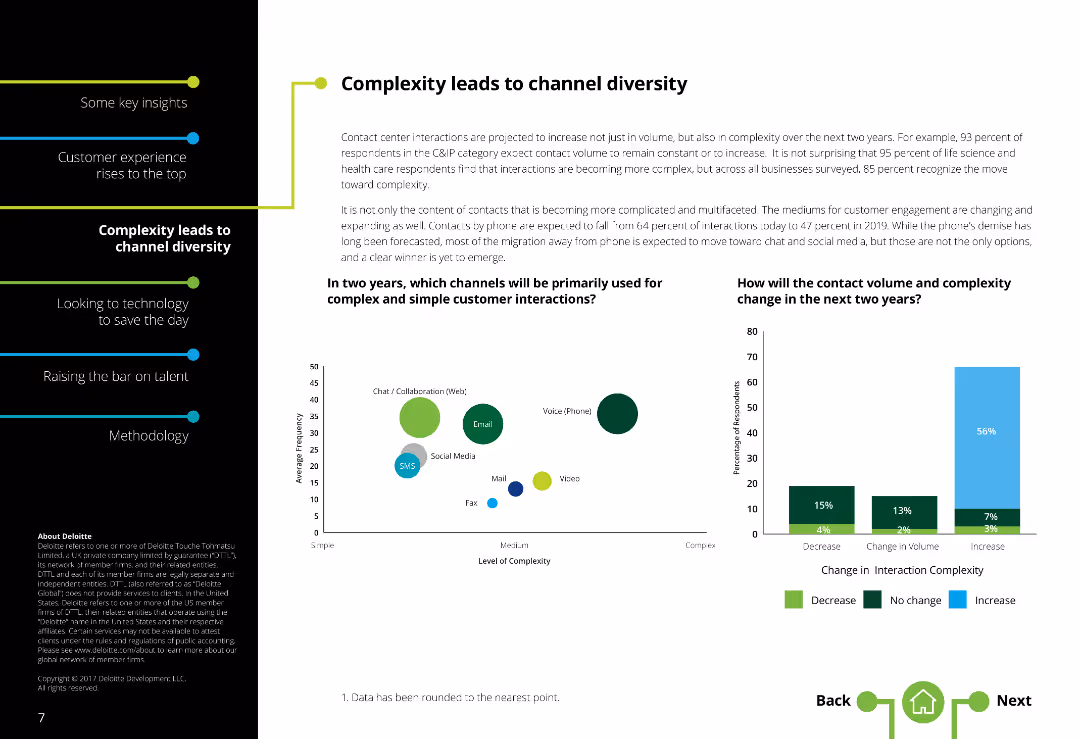
The slide features a two-column layout with text on the left and two column charts on the right. There is a moderate amount of text.
Market Analysis and Trends
Telecommunications
It addresses the increasing complexity in customer interactions and how contact channels are diversifying, with future projections for channel usage.
Channel diversity, Contact centers, Complexity, Communication channels, Customer interaction, Future projections
false
Market Analysis and Trends
Telecommunications
Multiple Chart
Deloitte
Add to my slides
Remove from favorites
Line chart showing the year-over-year growth of global personal luxury goods by channel from 2017 to 2023.
Strategic Planning
Consumer Goods
Examines the normalization of channel dynamics post-pandemic, focusing on retail, wholesale, and e-commerce.
Channel, Dynamics, Post-pandemic, Growth, Luxury
false
Strategic Planning
Consumer Goods
Mixed Chart
Kearney
Add to my slides
Remove from favorites
Various radar charts, streamlined design with clear, distinctive icons and color coding for different industries.
Customer and Market Segmentation
Telecommunications
Analyzes channel investment plans across different industries and regions, focusing on digital and automated options.
channel investment, industry analysis, region, digital
false
Customer and Market Segmentation
Telecommunications
Multiple Chart
Deloitte
Add to my slides
Remove from favorites
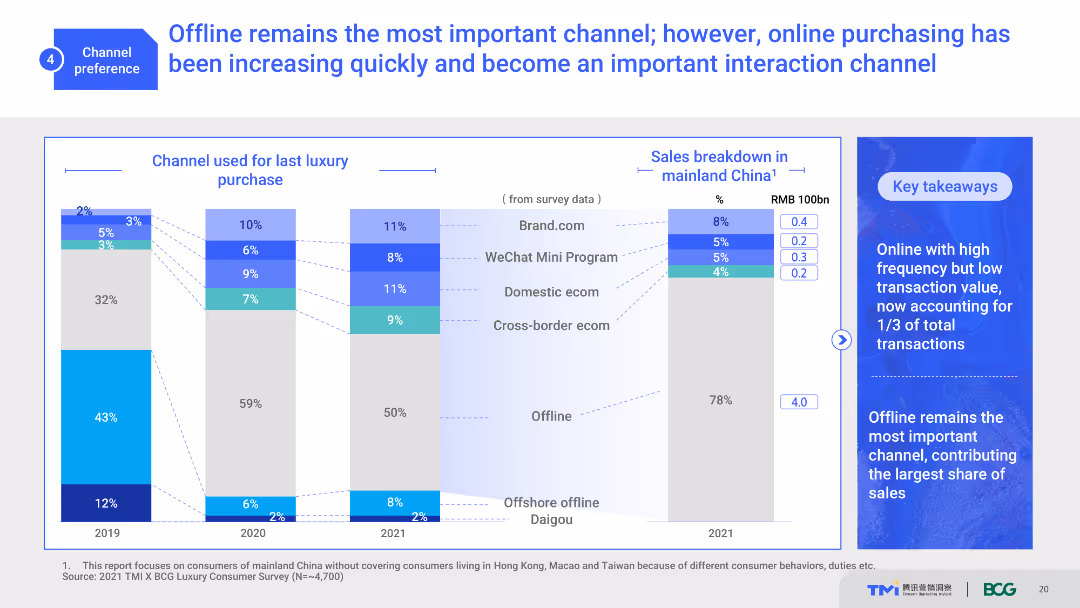
The slide uses a combination of stacked bar charts and text boxes to illustrate the importance of offline and online channels for luxury purchases. It shows channel usage trends from 2019 to 2021 and a sales breakdown in mainland China. The visual complexity is moderate with clear data presentation.
Market Analysis and Trends
Retail & E-commerce
This slide highlights the shifting consumer preferences between offline and online channels for luxury purchases. It shows historical trends and current channel usage, emphasizing the growing importance of online interactions.
channel preference, offline, online, luxury purchases, consumer behavior
false
Market Analysis and Trends
Retail & E-commerce
Multiple Chart
BCG
Add to my slides
Remove from favorites
The slide includes a line chart illustrating the relationship between the number of channels used and effectiveness. Data points show award scores for varying numbers of channels used by entrants, finalists, and winners.
Market Analysis and Trends
Media & Entertainment
This slide examines the trend that using more channels leads to more effective marketing work, supported by data from Effie awards entries over several years.
channels, effectiveness, line chart, marketing, Effie awards
false
Market Analysis and Trends
Media & Entertainment
Single Chart
IPSOS
Add to my slides
Remove from favorites
The slide features a bar chart displaying the percentage usage of various channels (OOH, Social Media, TV, Interactive/Online, VOD, etc.) by entrants and winners. Bars are vertically oriented and categorized by type of channel.
Strategic Planning
Media & Entertainment
This slide emphasizes the importance of selecting the right channels for marketing, showing the percentage usage of different channels by winners and entrants to illustrate strategic channel selection.
channel selection, marketing, bar chart, strategic planning, media usage
false
Strategic Planning
Media & Entertainment
Mixed Chart
IPSOS
Add to my slides
Remove from favorites
A mixed chart showing the short- and long-term impacts of various marketing channels. The chart uses bars and lines to depict the effectiveness of channels like TV, social media, and print in driving sales and brand awareness.
Market Analysis and Trends
Media & Entertainment
This slide analyzes the effectiveness of different marketing channels in driving both short-term sales and long-term brand awareness. It highlights the impact of channels like TV, social media, and print on overall marketing effectiveness.
Channels, Impact, Marketing, Effectiveness, Sales
false
Market Analysis and Trends
Media & Entertainment
Mixed Chart
Nielsen
Add to my slides
Remove from favorites
A mix of text and illustrative graphics depicting seamless integration of sales channels with customer-first view and adaptive strategies, including examples.
Strategic Planning
Professional Services
Urges a customer-first approach in channel strategy, focusing on integrated experiences and continual experimentation for cross-channel success.
Channel Strategy, Customer Experience, Cross-Channel Integration, Seamless Experience
true
Strategic Planning
Professional Services
Header Horizontal
BCG
Add to my slides
Remove from favorites
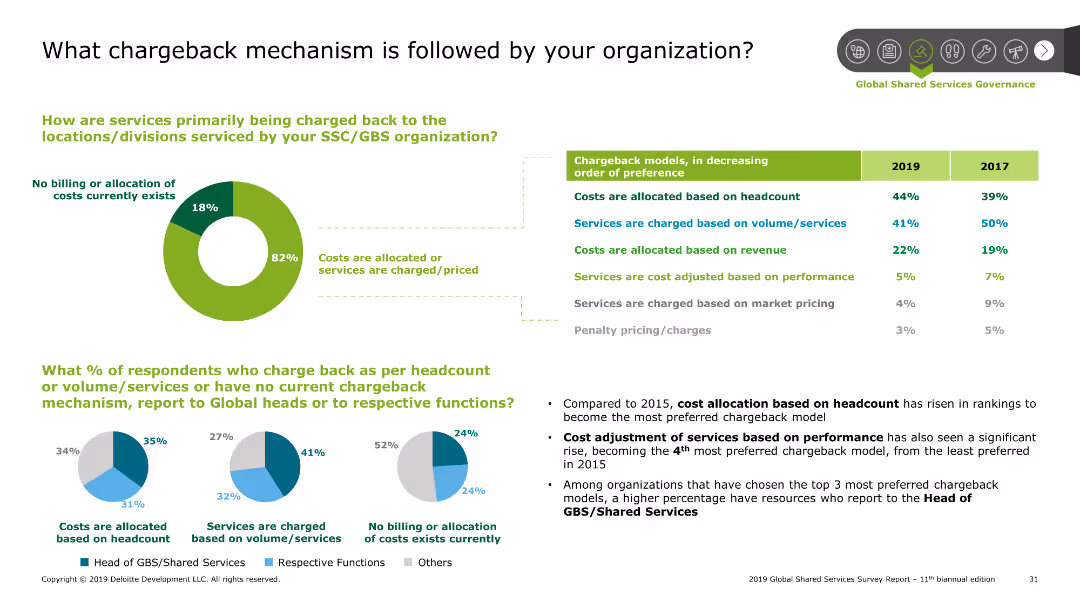
The slide includes pie charts and a table. The pie charts show chargeback methods and reporting structures. The table ranks chargeback models by preference.
Financial Performance
Professional Services
This slide analyzes the chargeback mechanisms used in organizations, with a comparison between 2017 and 2019 preferences. It also shows how costs are charged back to divisions.
Chargeback, cost allocation, financial performance, reporting
false
Financial Performance
Professional Services
Multiple Chart
Deloitte
Add to my slides
Remove from favorites
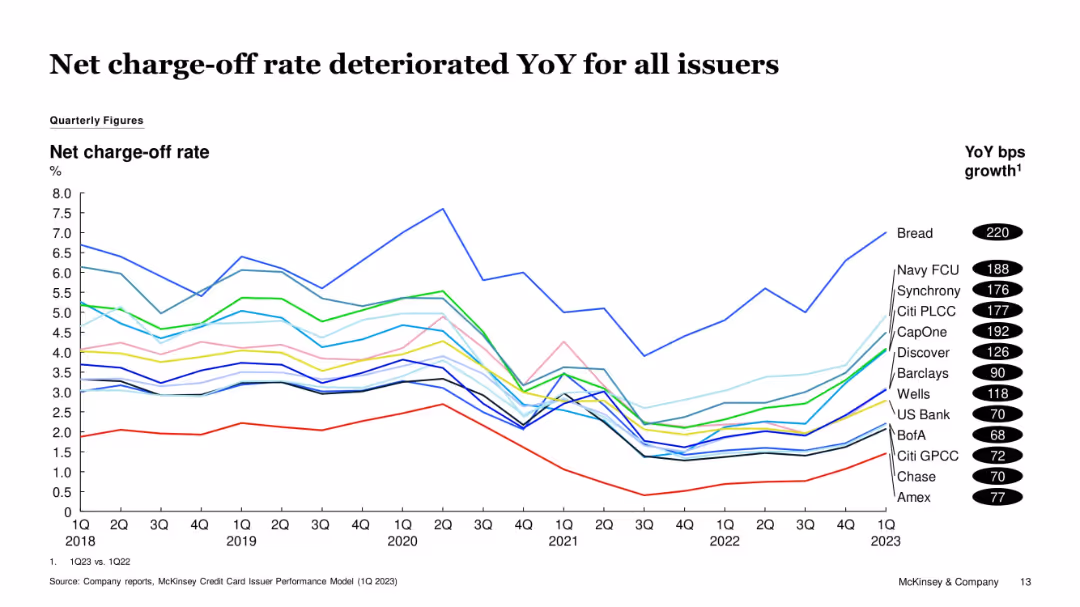
Multi-line chart displaying issuer-specific net charge-off rates from 1Q18 to 1Q23. YoY basis point growth values are shown in black ovals.
Risk Assessment and Management
Financial Services
The chart highlights a broad-based increase in credit card net charge-off rates YoY across issuers. Bread, Navy FCU, and CapOne experienced the most deterioration, suggesting growing borrower distress or looser underwriting.
Charge-offs, Credit Risk, YoY Growth, CapOne, Bread, Navy FCU, Credit Losses
false
Risk Assessment and Management
Financial Services
Single Chart
McKinsey
Add to my slides
Remove from favorites
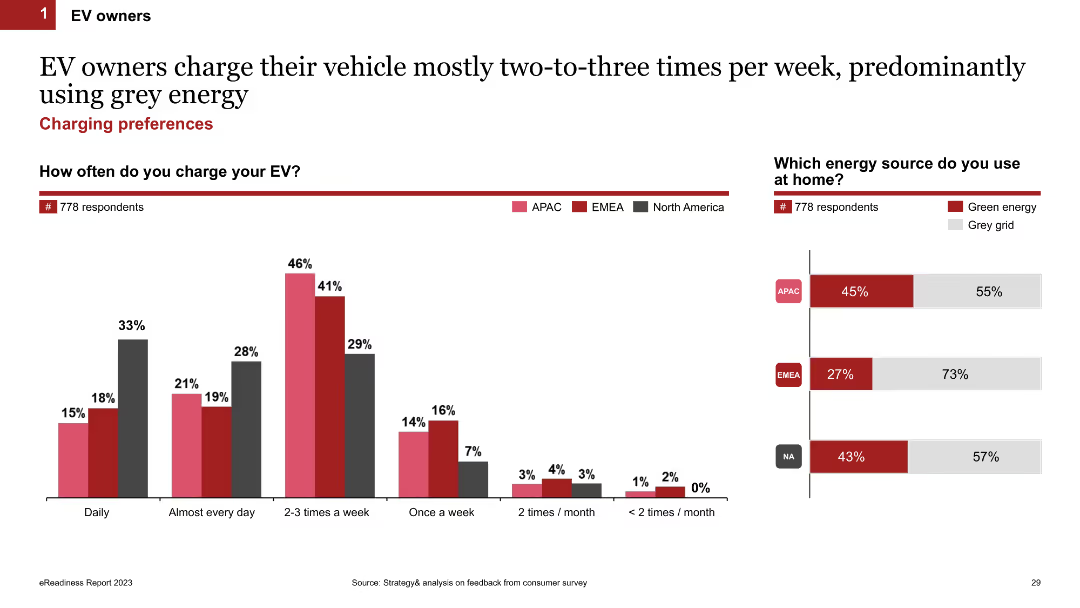
Column chart showing how often EV owners charge their vehicles (daily, weekly, etc.) and the type of energy source used at home (green energy or grey grid). The slide uses color-coded bars for different regions.
Market Analysis and Trends
Transportation & Logistics
This slide examines how frequently EV owners charge their vehicles and the types of energy sources they use at home, comparing green energy and grey grid usage across different regions.
charging frequency, energy sources, home charging, EV owners, regional comparison
false
Market Analysis and Trends
Transportation & Logistics
Multiple Chart
PwC/Strategy&
Add to my slides
Remove from favorites
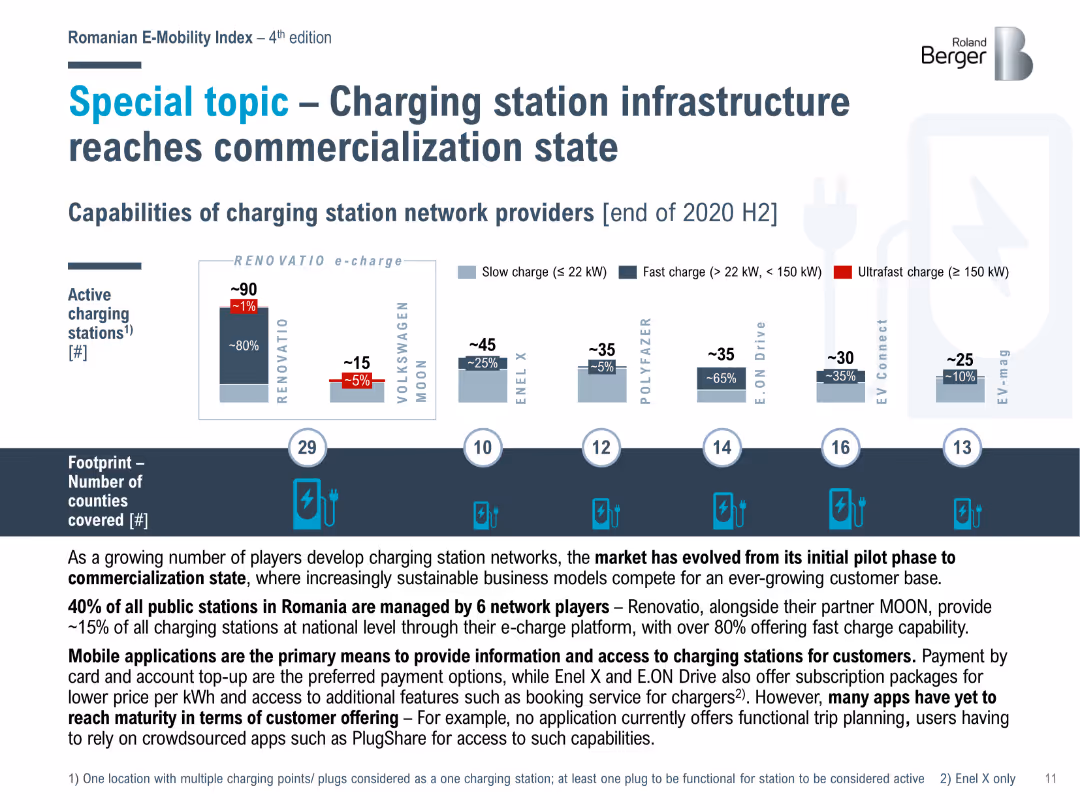
Bar chart showing the capabilities of charging station network providers in Romania at the end of 2020 H2, including the number of slow, fast, and ultrafast charging stations.
Market Analysis and Trends
Energy & Utilities
Analyzes the commercialization of charging station infrastructure in Romania, with details on the capabilities of different network providers and the spread across counties.
charging infrastructure, commercialization, Romania, network providers
false
Market Analysis and Trends
Energy & Utilities
Mixed Chart
Roland Berger
Add to my slides
Remove from favorites
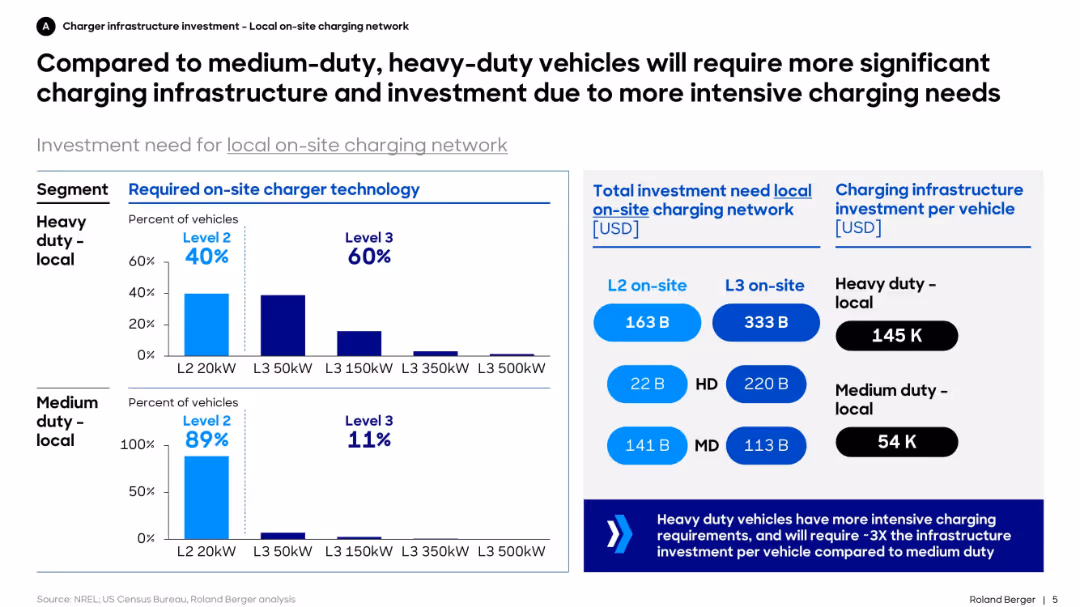
Dual bar charts for required charger levels by vehicle type, investment amount by segment, and cost per vehicle. Structured with blue-themed charts and callouts.
Technology and Digital Transformation
Transportation & Logistics
This slide contrasts the infrastructure needs of heavy-duty vs. medium-duty electric vehicles. It shows that heavy-duty fleets require higher-capacity chargers and more infrastructure investment, with significantly higher per-vehicle cost.
charging, infrastructure, EV, heavy-duty, investment, medium-duty, technology, fleet, Level 2, Level 3
false
Technology and Digital Transformation
Transportation & Logistics
Mixed Chart
Roland Berger
Add to my slides
Remove from favorites
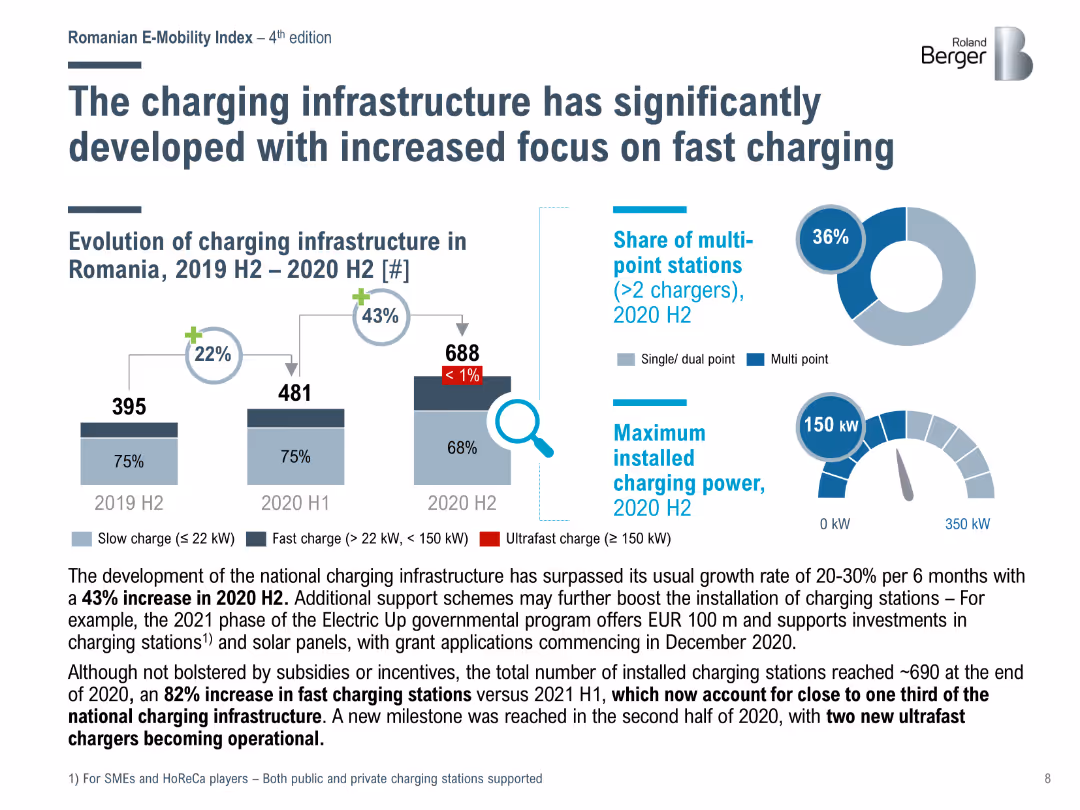
Bar chart showing the evolution of charging infrastructure in Romania from 2019 H2 to 2020 H2, highlighting the increase in fast and ultrafast charging stations.
Market Analysis and Trends
Energy & Utilities
Analyzes the significant development of charging infrastructure in Romania, with a notable increase in fast and ultrafast charging stations and support from government programs.
charging infrastructure, fast charging, Romania, development
false
Market Analysis and Trends
Energy & Utilities
Multiple Chart
Roland Berger
Add to my slides
Remove from favorites
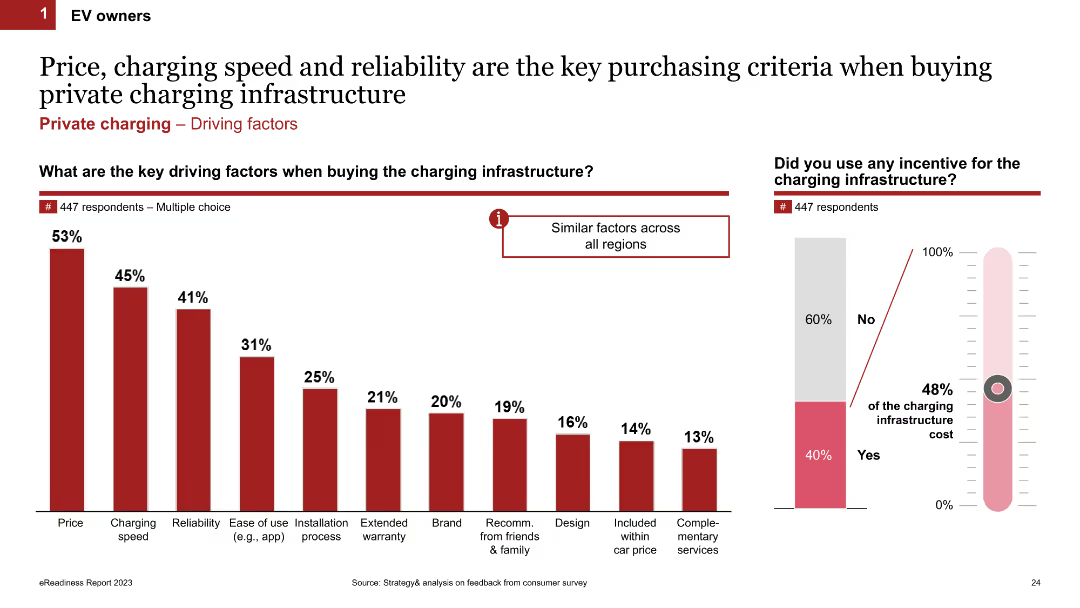
Column chart showing the key driving factors when buying charging infrastructure. It lists factors like price, charging speed, reliability, and ease of use. The slide includes multiple charts, such as a thermometer chart showing incentives used.
Market Analysis and Trends
Transportation & Logistics
This slide outlines the main factors influencing the purchase of charging infrastructure for EV owners. It highlights price, charging speed, reliability, and other factors like ease of use and installation process.
charging infrastructure, purchase criteria, key factors, incentives, EV owners
false
Market Analysis and Trends
Transportation & Logistics
Multiple Chart
PwC/Strategy&
Add to my slides
Remove from favorites
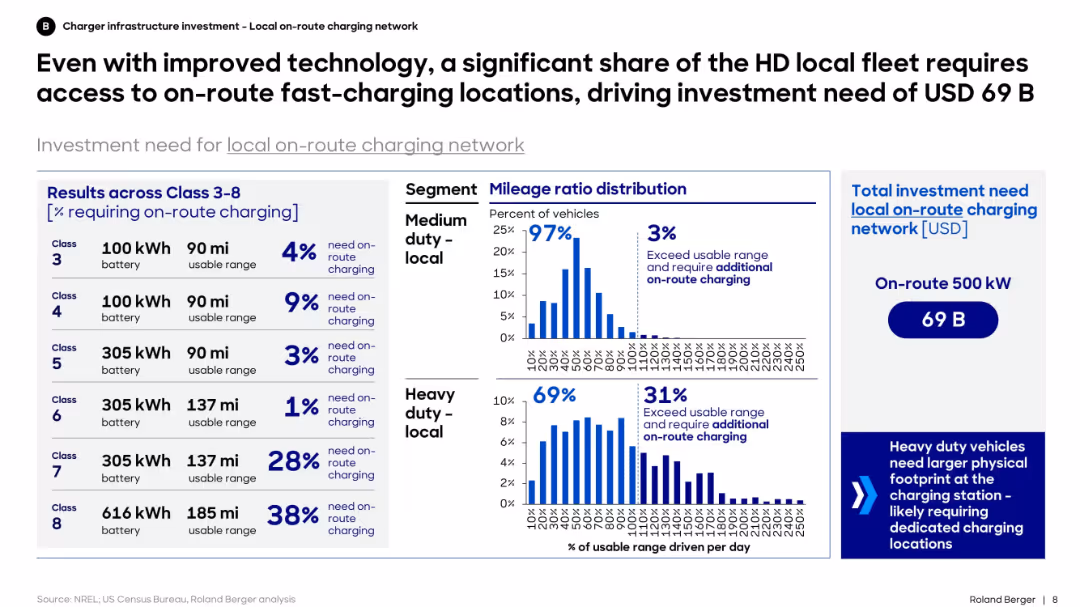
Bar and distribution charts showing on-route charging need by vehicle class. Right panel shows total investment required.
Strategic Planning
Transportation & Logistics
The slide explains that despite advancements, a large portion of heavy-duty fleets still require on-route charging. It quantifies investment needs and shows distribution of daily mileage, indicating infrastructure must serve vehicles exceeding daily range limits.
charging, on-route, heavy-duty, investment, EV, Class 3–8, distribution, infrastructure, fast-charging
false
Strategic Planning
Transportation & Logistics
Mixed Chart
Roland Berger
Add to my slides
Remove from favorites
Column chart and stacked bar charts showing where EV owners primarily charge their vehicles (at home, office, street) across APAC, EMEA, and North America. The slide uses icons and percentages to display data.
Market Analysis and Trends
Transportation & Logistics
This slide details the primary charging locations for EV owners, highlighting regional preferences for charging at home, at the office, or on the street.
charging preferences, primary location, EV owners, regional differences, home charging
false
Market Analysis and Trends
Transportation & Logistics
Multiple Chart
PwC/Strategy&
Add to my slides
Remove from favorites
Column chart and multiple bar charts showing the loyalty of EV owners to charging providers based on location convenience, price, and power. It includes tariff usage and reasons for choosing different providers.
Customer and Market Segmentation
Transportation & Logistics
This slide analyzes the loyalty of EV owners to their charging providers, emphasizing factors such as location convenience, pricing tariffs, and power speed. It also discusses reasons for switching providers and typical tariff usage.
charging provider loyalty, location convenience, tariff usage, EV owners, provider comparison
false
Customer and Market Segmentation
Transportation & Logistics
Multiple Chart
PwC/Strategy&
Add to my slides
Remove from favorites
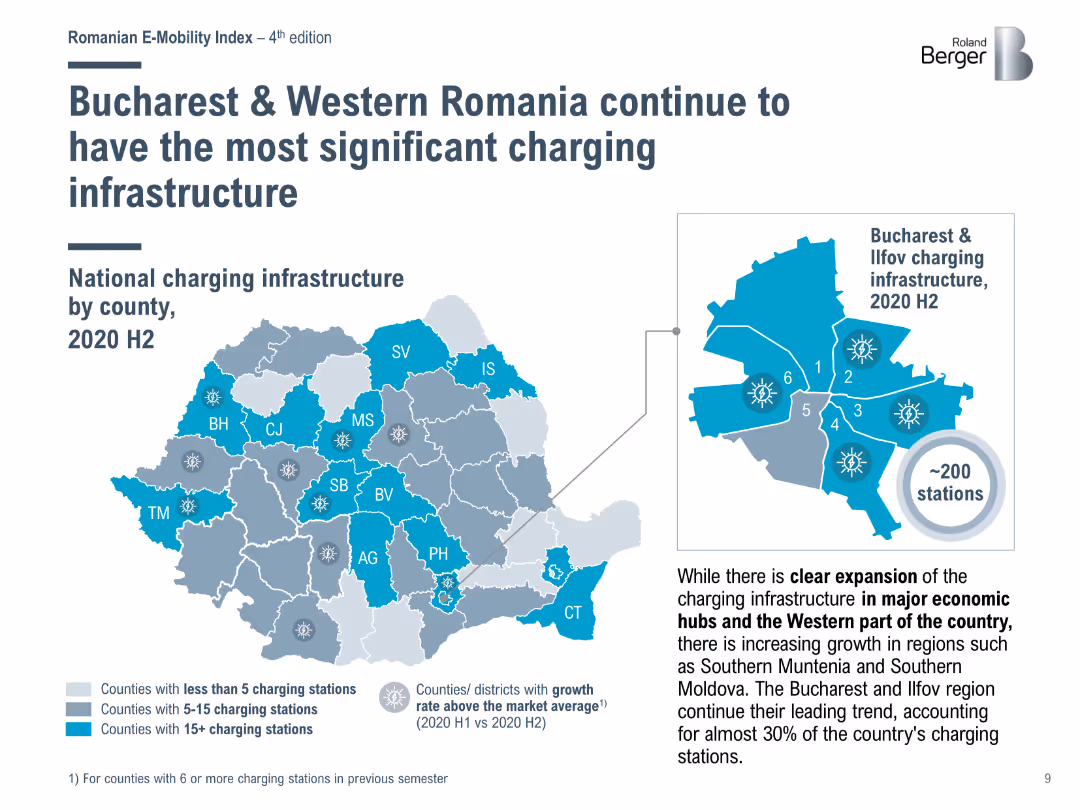
Map showing the distribution of charging stations across Romanian counties in 2020 H2, emphasizing the concentration in Bucharest and Western Romania.
Market Analysis and Trends
Energy & Utilities
Highlights the regional distribution of charging infrastructure in Romania, with Bucharest and Western Romania having the highest number of charging stations.
charging stations, Bucharest, Romania, infrastructure
false
Market Analysis and Trends
Energy & Utilities
Graphic
Roland Berger
Add to my slides
Remove from favorites
A column chart showing the percentage of respondents in various countries who see the lack of charging stations as a primary concern for not considering EVs.
Market Analysis and Trends
Transportation & Logistics
This slide demonstrates the global concern over inadequate charging infrastructure, affecting consumer decisions against purchasing electric vehicles.
Charging stations, EV adoption, infrastructure, consumer concerns, global comparison
false
Market Analysis and Trends
Transportation & Logistics
Single Chart
EY
Add to my slides
Remove from favorites
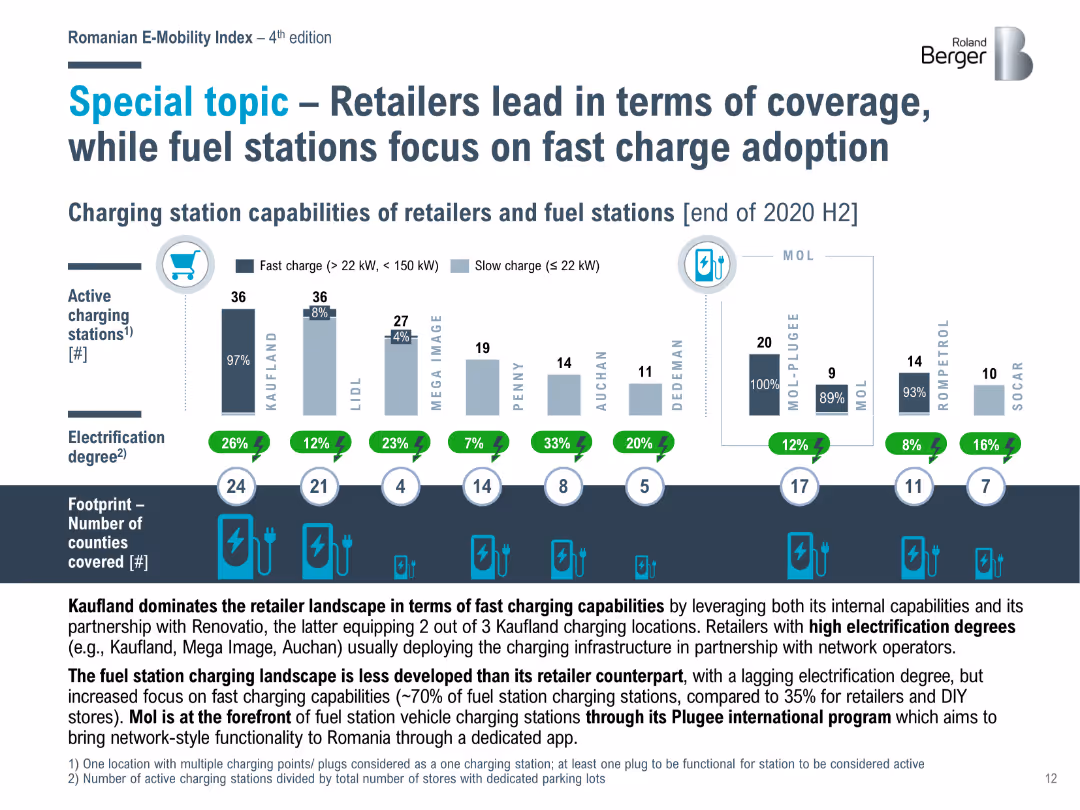
Bar chart comparing the charging station capabilities of retailers and fuel stations in Romania at the end of 2020 H2, highlighting the focus on fast charging.
Market Analysis and Trends
Energy & Utilities
Examines the leadership of retailers in charging station coverage in Romania, with fuel stations focusing on adopting fast charging technologies to meet increasing demand.
charging stations, retailers, fuel stations, Romania, fast charging
false
Market Analysis and Trends
Energy & Utilities
Mixed Chart
Roland Berger
Add to my slides
Remove from favorites
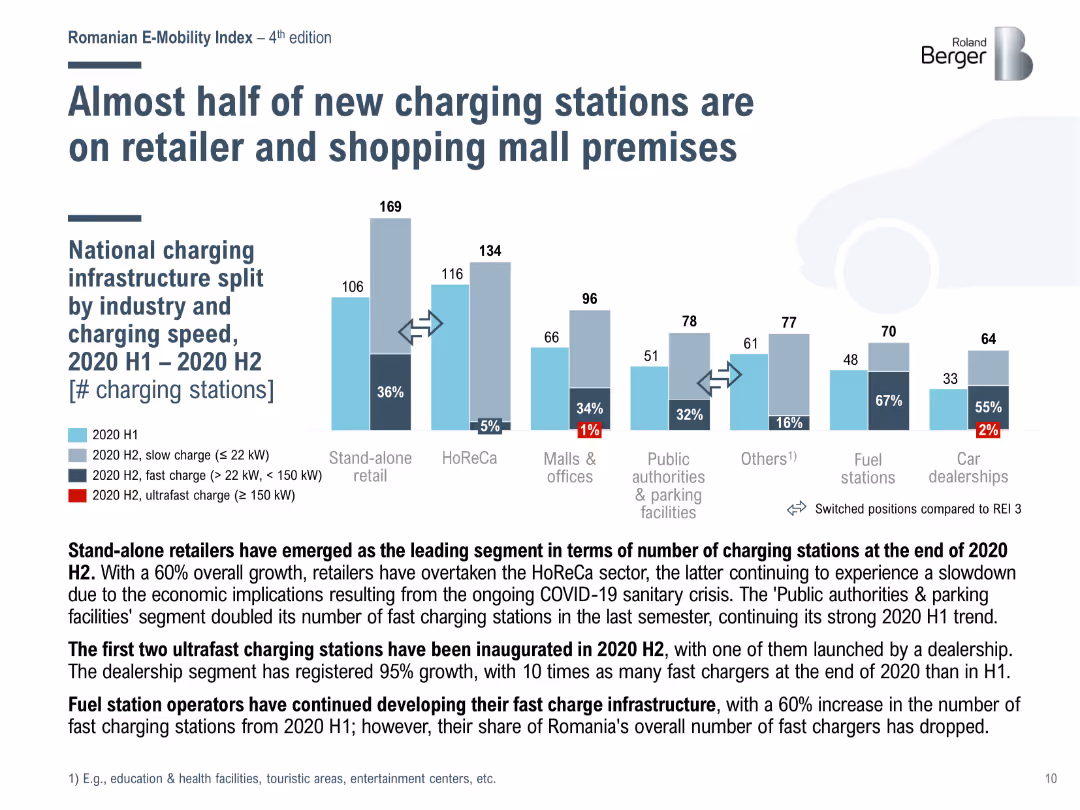
Bar chart showing the distribution of new charging stations by industry and charging speed in Romania from 2020 H1 to 2020 H2.
Market Analysis and Trends
Energy & Utilities
Discusses the increasing number of charging stations in retail and shopping mall premises, highlighting the growth in fast and ultrafast charging capabilities.
charging stations, retail, shopping malls, Romania, infrastructure
false
Market Analysis and Trends
Energy & Utilities
Mixed Chart
Roland Berger
Add to my slides
Remove from favorites
The slide features a line graph plotting the fleet-wide time charter rate against the breakeven rate prior to debt service over the last two decades, marked by quarters.
Financial Performance
Transportation & Logistics
It shows the historical financial performance of fleet-wide charter rates versus breakeven costs, highlighting financial sustainability over time.
charter rates, breakeven, financial performance, transportation, sustainability
false
Financial Performance
Transportation & Logistics
Single Chart
Deutsche Bank
Add to my slides
Remove from favorites
Shows an iPhone screen displaying the Chase Offers℠ app interface and a circular diagram explaining the engagement cycle with four numbered points. The design is simple with a focus on the app and the cycle.
Client Case Studies
Financial Services
Discusses the success of the Chase Offers℠ program in its initial months, focusing on customer and merchant engagement and the benefits realized through this strategy.
Chase Offers, customer engagement, marketing strategy, merchant benefits, early success
false
Client Case Studies
Financial Services
Linear Flow
JP Morgan
Add to my slides
Remove from favorites
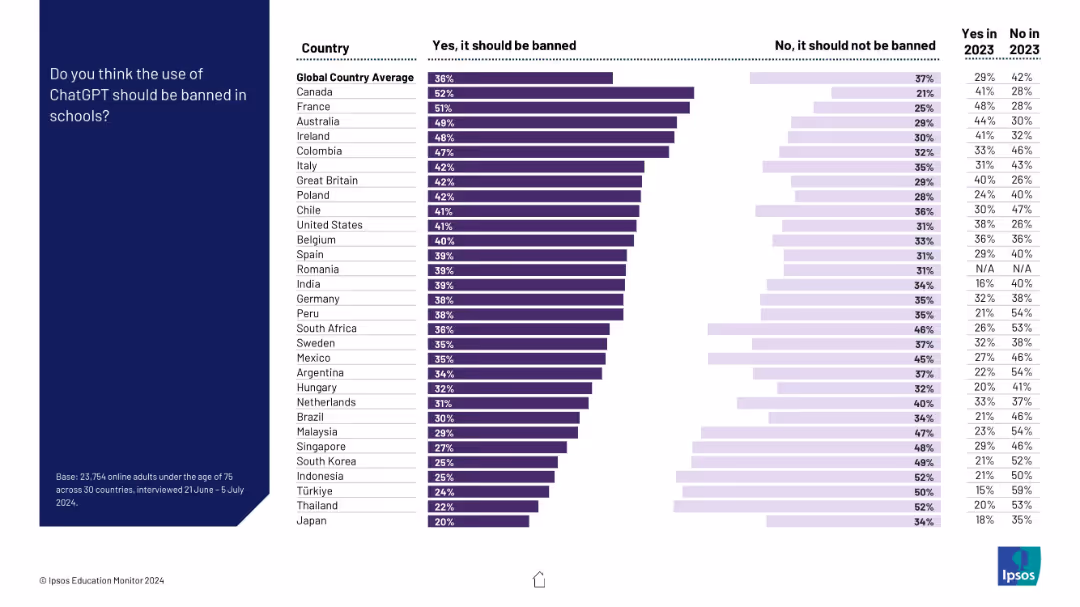
Vertical bar chart by country showing % support for banning ChatGPT in schools; ranked from most to least support
Regulatory and Compliance
Education & Training
The slide ranks countries by their support for banning ChatGPT in schools. Canada, France, and Australia top the list, while Japan and Thailand show the least support. Historical comparison with 2023 is also provided.
ChatGPT, AI in education, bans, country comparison, policy, 2024 vs 2023
false
Regulatory and Compliance
Education & Training
Mixed Chart
IPSOS
Add to my slides
Remove from favorites
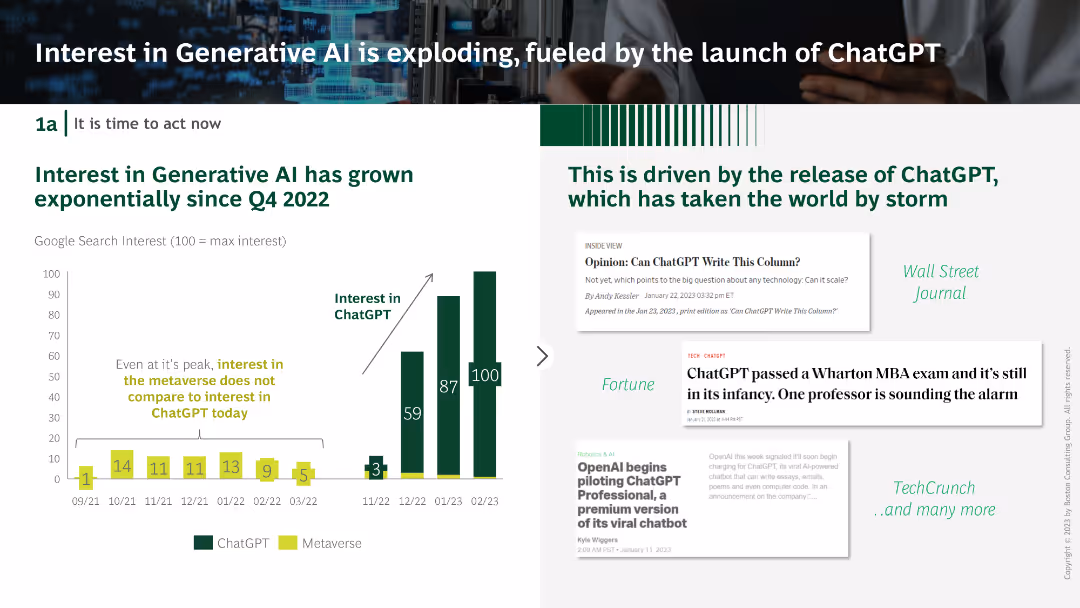
Column chart showing exponential growth in interest for ChatGPT since Q4 2022. Accompanied by quotes from various publications highlighting its impact.
Market Analysis and Trends
Technology & Software
The slide presents the rapid growth in interest for ChatGPT, driven by its launch, and includes media excerpts to emphasize its widespread influence.
ChatGPT, Generative AI, Interest growth, Market trends, Media impact
false
Market Analysis and Trends
Technology & Software
Mixed Chart
BCG
Add to my slides
Remove from favorites
The slide features text, percentage data, and column charts showing the development of ChatGPT policies and discussions on generative AI risks at the executive level.
Regulatory and Compliance
Technology & Software
This slide discusses the development of acceptable use policies for ChatGPT and the board-level discussions on generative AI risks, including percentages of organizations with policies in place.
ChatGPT, Policies, IT Leaders, Generative AI, Risk Management
false
Regulatory and Compliance
Technology & Software
Multiple Chart
Gartner
Add to my slides
Remove from favorites
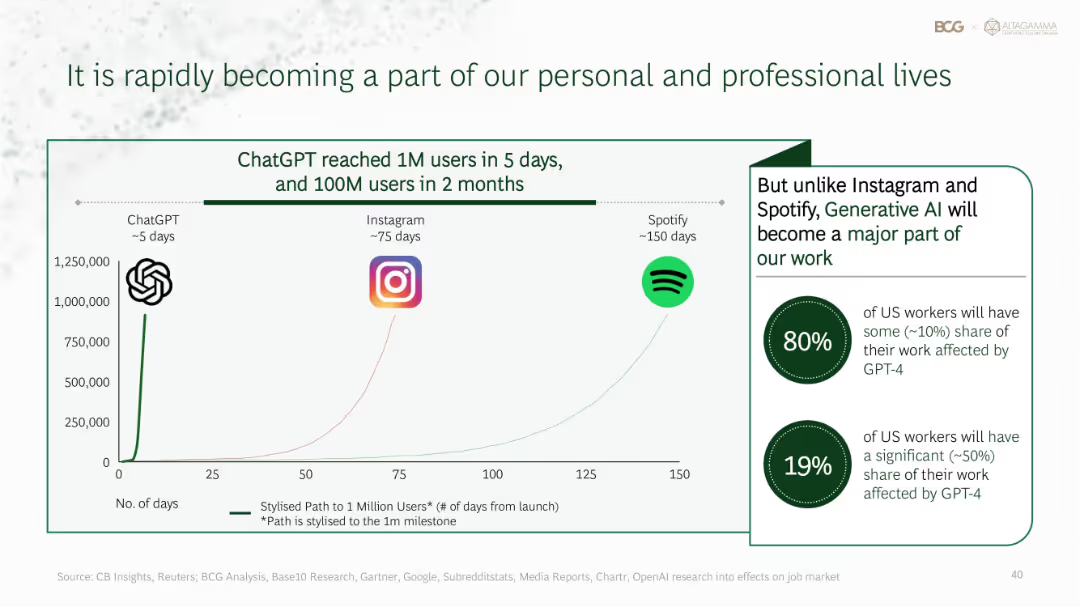
Graph comparing user growth of ChatGPT vs Instagram and Spotify; text block on generative AI's workplace impact
Technology and Digital Transformation
Artificial Intelligence
ChatGPT reached 1M users in 5 days and 100M in 2 months, outpacing Instagram and Spotify. Generative AI is expected to impact 80% of US workers, with 19% experiencing major transformation. The slide emphasizes GenAI’s integration into professional workflows.
ChatGPT, user growth, AI adoption, generative AI, workplace impact, digital transformation
false
Technology and Digital Transformation
Artificial Intelligence
Mixed Chart
BCG
Add to my slides
Remove from favorites
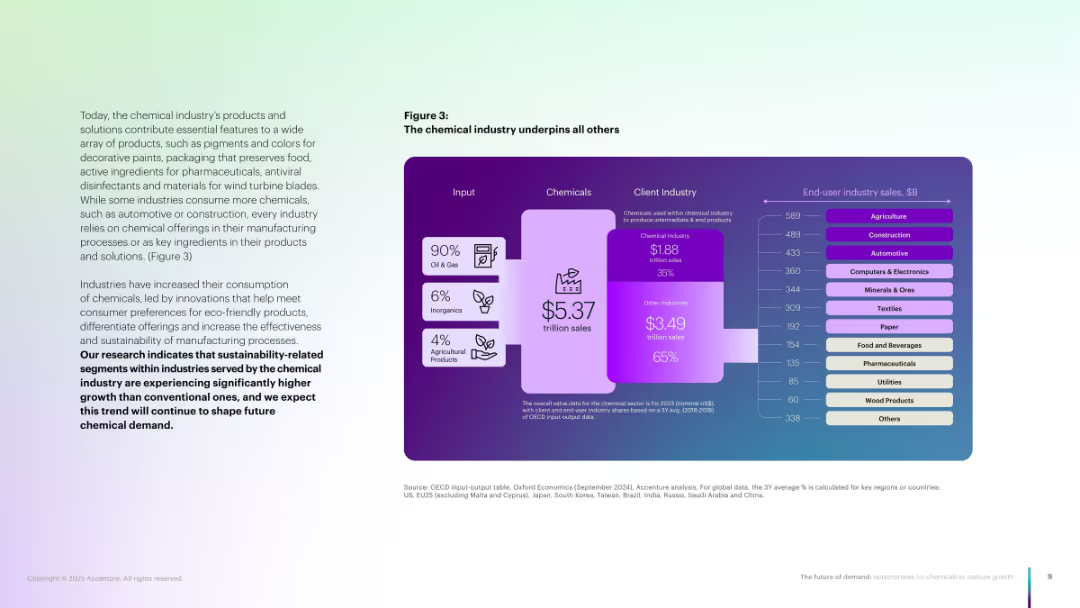
Sankey-style diagram showing input (Oil, Agri), chemical industry size, and downstream sectors.
Industry Overview
Industrial & Manufacturing
Demonstrates how the chemical industry supports multiple client sectors, highlighting its $5.37 trillion value chain. Shows inputs, economic value, and end-user industry sales, emphasizing sustainability-linked demand.
Chemical industry, value chain, sustainability, end-user industries
false
Industry Overview
Industrial & Manufacturing
Mixed Chart
Accenture
Add to my slides
Remove from favorites
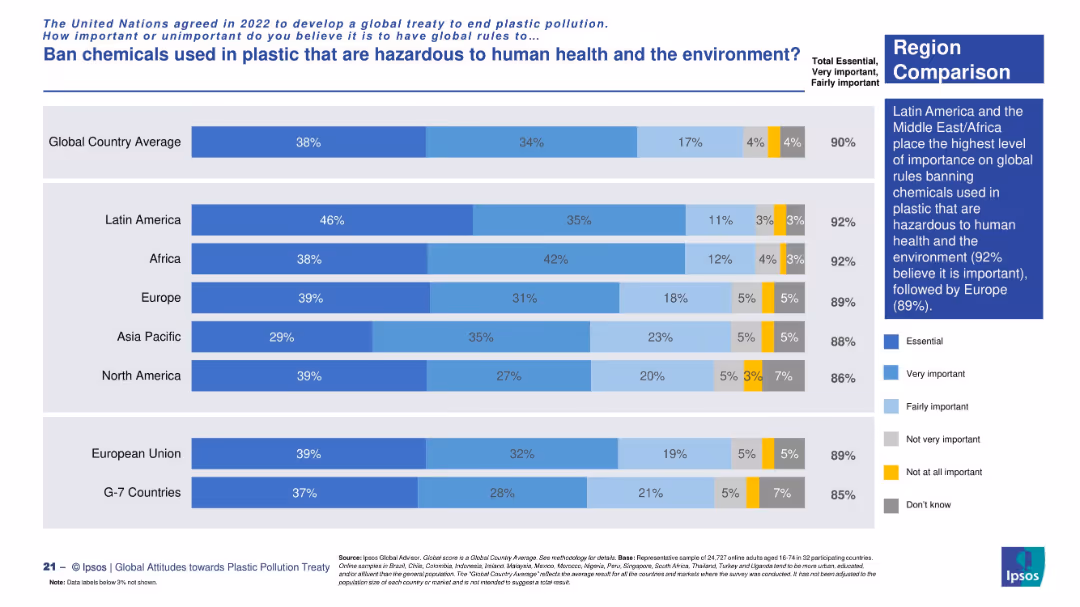
Horizontal bar chart comparing regional importance levels. Segmented bars and a summary text box on the right.
Risk Assessment and Management
Environmental Services & Sustainability
This slide demonstrates regional consensus—particularly in Latin America, Africa, and Europe—that banning harmful plastic chemicals is crucial to protecting health and the environment.
chemicals in plastic, regional support, public health, environmental safety, global regulation
false
Risk Assessment and Management
Environmental Services & Sustainability
Mixed Chart
IPSOS
Add to my slides
Remove from favorites
Title, several bar charts detailing impacts of digital initiatives in the chemistry sector, mentions of "Digital R&D" and "Digital Plant".
Technology and Digital Transformation
Industrial & Manufacturing
Discusses how digitalization could transform the chemistry and advanced materials industry, emphasizing potential societal benefits like reduced emissions and injury rates.
chemistry, digitalization, societal benefits, emissions reduction, industry transformation
false
Technology and Digital Transformation
Industrial & Manufacturing
Mixed Chart
Accenture
Add to my slides
Remove from favorites
The slide has a title at the top, text in the middle, and a column chart at the bottom showing changes made to manage child or caring responsibilities since the start of the crisis.
Operational Efficiency
Professional Services
Illustrates changes made to manage child or caring responsibilities during the crisis, with 1 in 5 making changes. Details include changing working patterns and seeking external help.
Childcare, Crisis, Survey, Responsibilities, Data
false
Operational Efficiency
Professional Services
Single Chart
IPSOS
Add to my slides
Remove from favorites
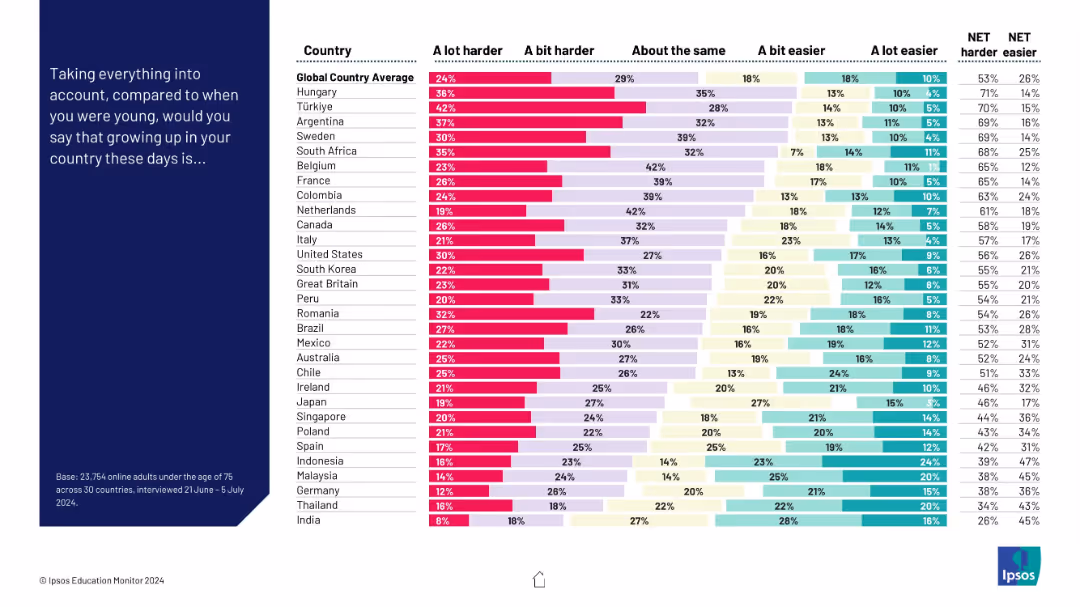
Stacked bar chart with breakdown by country on whether growing up is now harder or easier. Includes net scores and emphasizes public sentiment shifts in upbringing challenges.
Market Analysis and Trends
Education & Training
This slide explores perceptions of childhood difficulty across 30 countries. Countries like Hungary and Türkiye show high agreement that growing up is harder now, revealing societal concerns around safety, education, and technology.
childhood, perception, harder, easier, Ipsos, country comparison, social change
false
Market Analysis and Trends
Education & Training
Mixed Chart
IPSOS
Add to my slides
Remove from favorites
This slide features a bar chart showing the types of information parents sought in the past year related to children's development, such as nutrition and health.
Market Analysis and Trends
Education & Training
It shows that parents primarily sought information on nutrition, vaccination, and health for their children, indicating these areas are of most concern.
Children's development, information, parents, bar chart, public opinion, Ipsos, education, nutrition, health
false
Market Analysis and Trends
Education & Training
Single Chart
IPSOS
Add to my slides
Remove from favorites
The slide presents a bar chart listing various sources from which parents sought help for children's social and emotional development, such as the NHS website and family.
Market Analysis and Trends
Education & Training
It highlights that parents relied on a variety of sources for support in their children's social and emotional development, with the NHS website being the most common source.
Children's development, social, emotional, sources, bar chart, public opinion, Ipsos, education, support
false
Market Analysis and Trends
Education & Training
Single Chart
IPSOS
Add to my slides
Remove from favorites
Pie chart illustrating the proportion of respondents saving for children's education pre-COVID-19, during, and the continuation post-pandemic. Dense text at the top explains the context.
Market Analysis and Trends
Financial Services
The slide shows the percentage of Canadian investors saving for their children's education before and during the COVID-19 pandemic. It indicates that a significant majority continued to save for this goal even during the pandemic.
Children's Education, Savings, COVID-19, Canadian, Pandemic
false
Market Analysis and Trends
Financial Services
Multiple Chart
IPSOS
Add to my slides
Remove from favorites
The slide comprises three charts: a column chart for real GDP, and two line charts for consumption and investment, and international trade data.
Market Analysis and Trends
Financial Services
This slide reviews Chile's economic situation, focusing on real GDP changes, consumption and investment trends, and international trade as of 4Q23.
Chile, economic snapshot, GDP, consumption, investment, trade
false
Market Analysis and Trends
Financial Services
Multiple Chart
JP Morgan
Add to my slides
Remove from favorites
Slide contains three column charts analyzing generation cost, electrolyzer utilization, and transmission for optimizing green hydrogen production in Chile.
Market Analysis and Trends
Energy & Utilities
Analyzes three cost factors essential for optimizing green hydrogen production in Chile, focusing on generation location, technology, and transmission costs.
Chile, green hydrogen, cost optimization, generation, transmission, electrolyzer
false
Market Analysis and Trends
Energy & Utilities
Pillar
McKinsey
Add to my slides
Remove from favorites
Features a line graph showing the projected levelized cost of energy for green hydrogen across three macro-zones in Chile until 2025.
Market Analysis and Trends
Energy & Utilities
Projects the decreasing costs of green hydrogen production in Chile's northern and southern zones, highlighting the competitive and uncompetitive regions.
Chile, hydrogen, cost analysis, LCOE, competitive zones, 2020-2025
false
Market Analysis and Trends
Energy & Utilities
Mixed Chart
McKinsey
Add to my slides
Remove from favorites
Bar chart comparing 2030 green hydrogen production costs across six regions, emphasizing Chile's low costs relative to other global regions.
Market Analysis and Trends
Energy & Utilities
Compares the cost of producing green hydrogen in Chile with other regions by 2030, showcasing Chile's cost advantage.
Chile, hydrogen, cost comparison, 2030, global regions, production costs
false
Market Analysis and Trends
Energy & Utilities
Multiple Chart
McKinsey
Add to my slides
Remove from favorites
Bar chart detailing the forecasted reduction in green hydrogen production costs by 2035, broken down by factors like power generation and electrolyzer efficiency.
Investment Analysis
Energy & Utilities
Forecasts significant cost reductions in green hydrogen production in Chile by 2035, focusing on power generation, electrolyzer capex, and efficiency improvements.
Chile, hydrogen, cost reduction, 2035, electrolyzer, power generation
false
Investment Analysis
Energy & Utilities
Mixed Chart
McKinsey
Add to my slides
Remove from favorites
This slide features two column layout with labels "Top 5" and "Top 3" and text blocks explaining targets for 2025 and 2030 in terms of GW. A map of Chile highlights northern and southern hydrogen valleys.
Industry Overview
Energy & Utilities
The slide outlines Chile's aspirations to be among the top global producers and exporters of green hydrogen by 2025 and 2030, with specific GW capacity targets. Also indicates geographic areas of development.
Chile, hydrogen, exporters, 2025, 2030
false
Industry Overview
Energy & Utilities
Graphic
McKinsey
Add to my slides
Remove from favorites
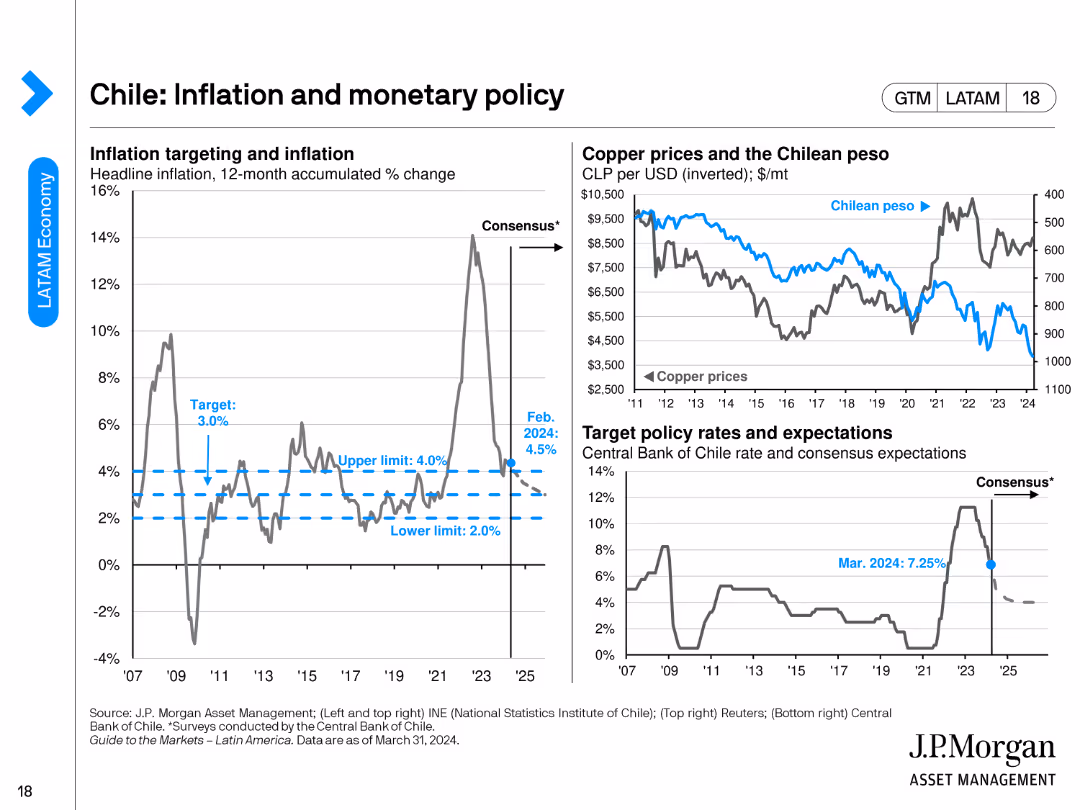
The slide includes three charts: a line chart for inflation targeting, another for copper prices vs. the Chilean peso, and a chart for target policy rates.
Regulatory and Compliance
Financial Services
This slide examines Chile's inflation and monetary policy, emphasizing inflation targeting, copper prices, and target policy rates as of February 2024.
Chile, inflation, monetary policy, copper prices, policy rates
false
Regulatory and Compliance
Financial Services
Multiple Chart
JP Morgan
Add to my slides
Remove from favorites
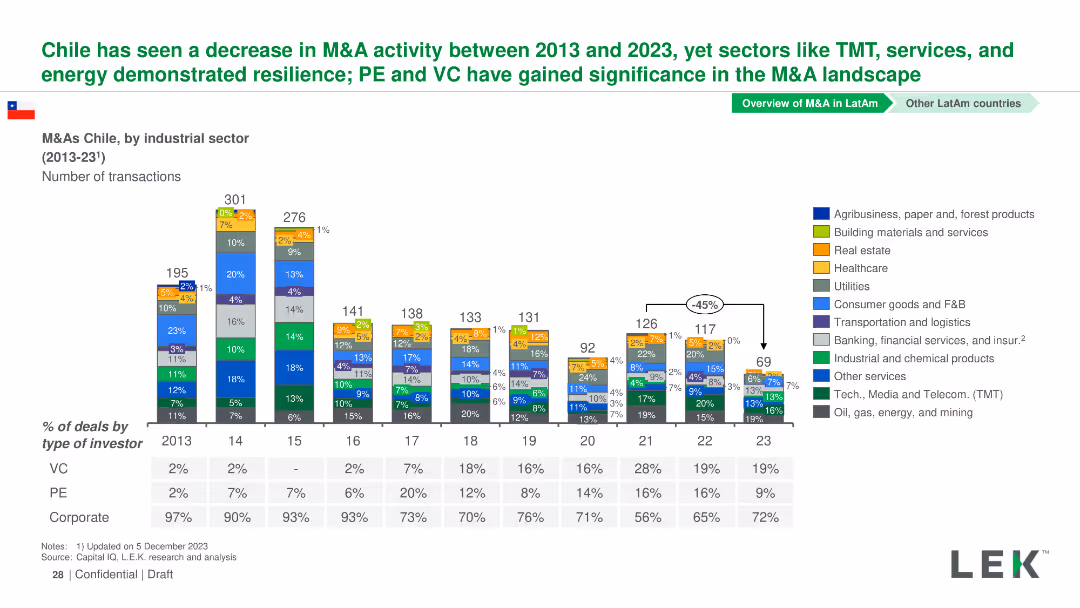
Column chart showing the number of M&A transactions by industrial sector in Chile from 2013-2023. Sectors are color-coded and detailed in a legend.
Market Analysis and Trends
Financial Services
This slide highlights M&A activity in various sectors in Chile from 2013-2023, noting significant changes and trends over the years.
Chile, M&A, Industrial Sectors, Transactions, Trends
false
Market Analysis and Trends
Financial Services
Mixed Chart
LEK
Add to my slides
Remove from favorites
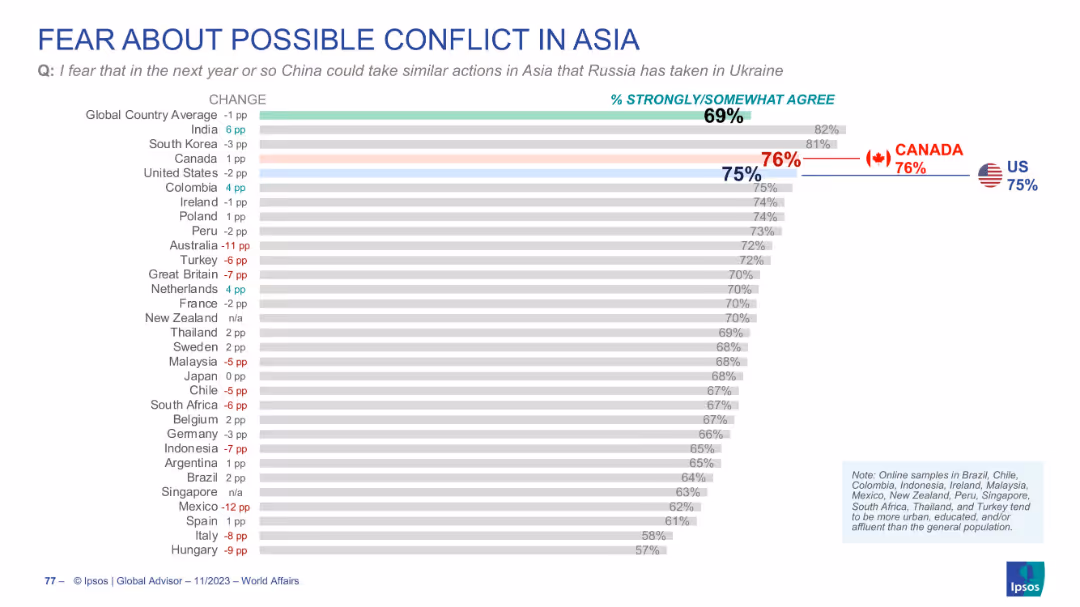
Bar chart on fear of China taking Ukraine-like actions in Asia; Canada and US highlighted; global average included.
Risk Assessment and Management
Government & Public Sector
Addresses concern over potential aggression by China in Asia. Globally, 69% agree they fear this, while US and Canada register even higher at 75% and 76%. Slide tracks geopolitical anxieties shifting toward Asia.
China, Asia conflict, geopolitical fear, public sentiment, Ipsos
false
Risk Assessment and Management
Government & Public Sector
Single Chart
IPSOS
Add to my slides
Remove from favorites
A split-slide; one side discusses China/Asia's reopening with a line graph, and the other focuses on ESG rates of change driving alpha, supported by a bar graph. Analyst credits and report links are provided.
Market Analysis and Trends
Financial Services
It outlines the economic outlook for China/Asia as they reopen and discusses the impact of ESG rate changes on investment alpha, signaling strategic considerations for investors.
China, Asia, market opening, ESG, investment alpha, economic outlook, strategic investment, market analysis, policy changes, investor interest
false
Market Analysis and Trends
Financial Services
Multiple Chart
Morgan Stanley
Add to my slides
Remove from favorites
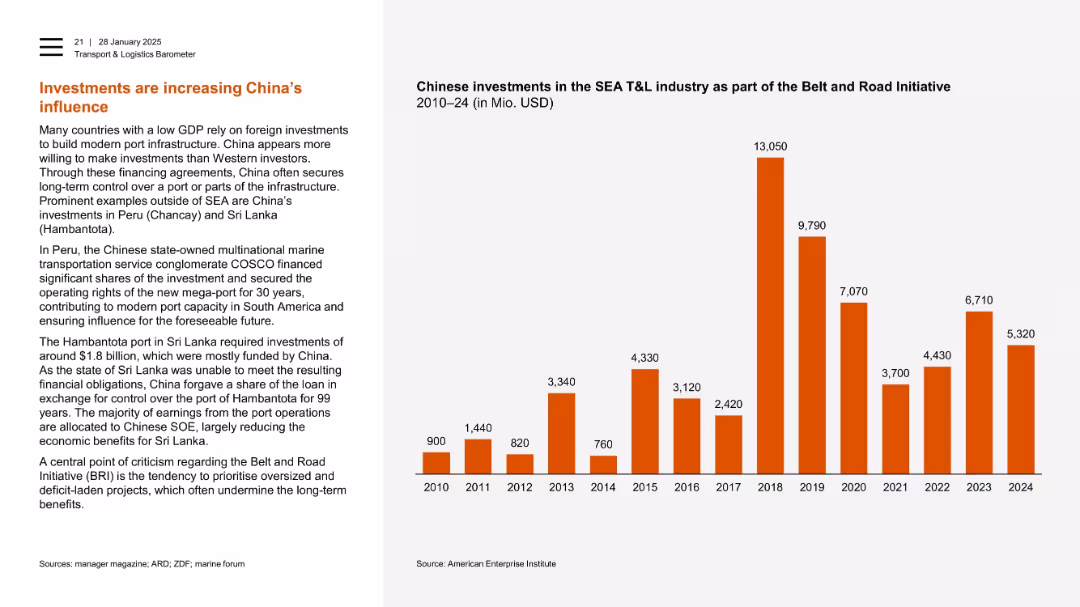
Left column with narrative, right with bar chart of Chinese investments in SEA T&L industry (2010–2024).
Investment Analysis
Transportation & Logistics
This slide emphasizes China’s Belt and Road investments in global port infrastructure. It highlights examples in Peru and Sri Lanka where Chinese funding secured long-term control. A bar chart shows sharp increases in SEA investment, peaking in 2018.
China, Belt and Road, SEA, port infrastructure, foreign investment, Hambantota, Chancay, COSCO
false
Investment Analysis
Transportation & Logistics
Mixed Chart
PwC/Strategy&
Add to my slides
Remove from favorites
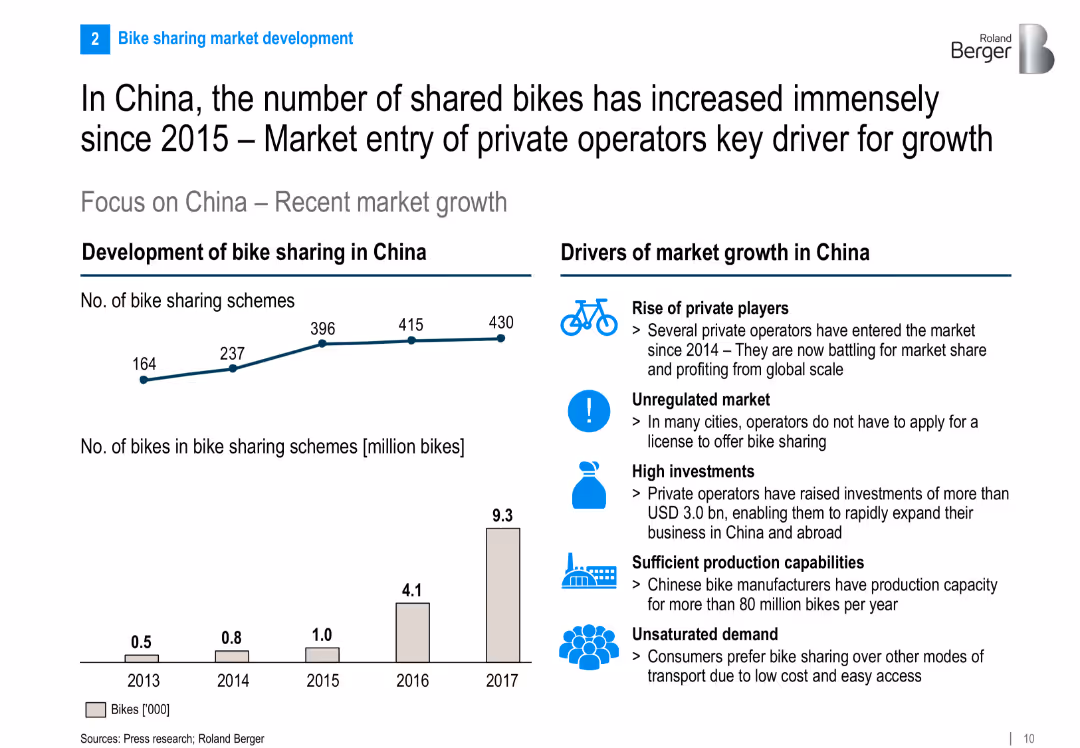
Split layout: line and bar graph for China's market development (2013–2017) and bulleted list of growth drivers on the right.
Strategic Planning
Transportation & Logistics
This slide analyzes the rapid rise of bike sharing in China, driven by private sector entry, high investments, unregulated markets, and demand. It shows quantitative growth in schemes and bikes and explains contributing factors.
China, bike sharing, market growth, private operators, investments, urban mobility, statistics
false
Strategic Planning
Transportation & Logistics
Multiple Chart
Roland Berger
Add to my slides
Remove from favorites
The slide contains sets of column charts for three years and text annotations. It also includes a line graph overlaid on the charts.
Market Analysis and Trends
Financial Services
This slide evaluates the shift in market focus by CEOs in China, specifically their reduced preference for the US market. It could be used to discuss changes in international business strategies and economic forecasts.
China, CEOs, Market Focus, US, Growth Ambitions, Trends, Economic Strategy
false
Market Analysis and Trends
Financial Services
Multiple Chart
PwC/Strategy&
Add to my slides
Remove from favorites
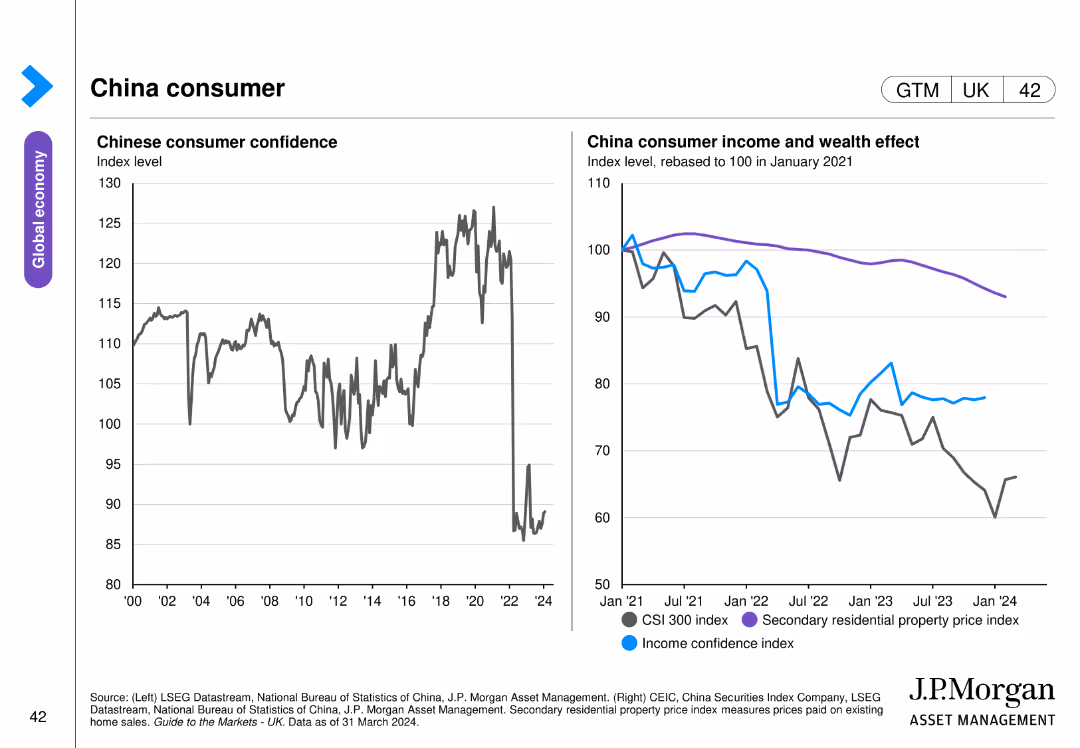
Two line charts: one shows Chinese consumer confidence index, and the other displays consumer income and wealth effect with CSI 300 index and secondary residential property price index.
Market Analysis and Trends
Financial Services
This slide focuses on consumer confidence and the income and wealth effect in China, comparing indices related to consumer behavior and property prices. Used for consumer market analysis and economic forecasting.
China, consumer, confidence, income, wealth
false
Market Analysis and Trends
Financial Services
Multiple Chart
JP Morgan
Add to my slides
Remove from favorites
This slide presents two column charts and a line chart detailing China's labor force, export percentage, and consumer spending.
Market Analysis and Trends
Consumer Goods
Discusses China's changing economic landscape with a focus on shifting labor demographics and increasing consumer expenditures.
China, consumer spending, labor force, economic trends, exports
false
Market Analysis and Trends
Consumer Goods
Multiple Chart
Deutsche Bank
Add to my slides
Remove from favorites
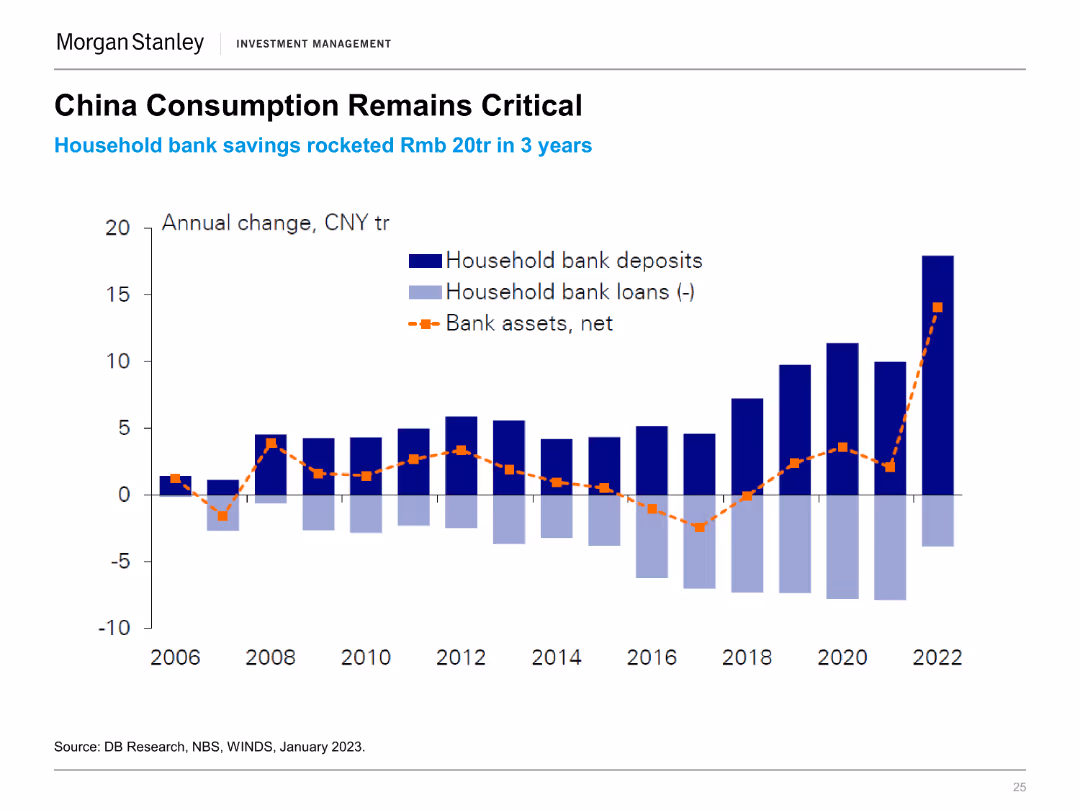
A bar chart with columns representing household bank deposits, loans, and net bank assets in CNY trillion from 2006 to 2022.
Market Analysis and Trends
Financial Services
The slide discusses the critical role of consumption in China's economy, illustrated by significant changes in household bank deposits and loans.
China, Consumption, Bank Deposits, Loans, Economic Trends
false
Market Analysis and Trends
Financial Services
Single Chart
Morgan Stanley
Add to my slides
Remove from favorites
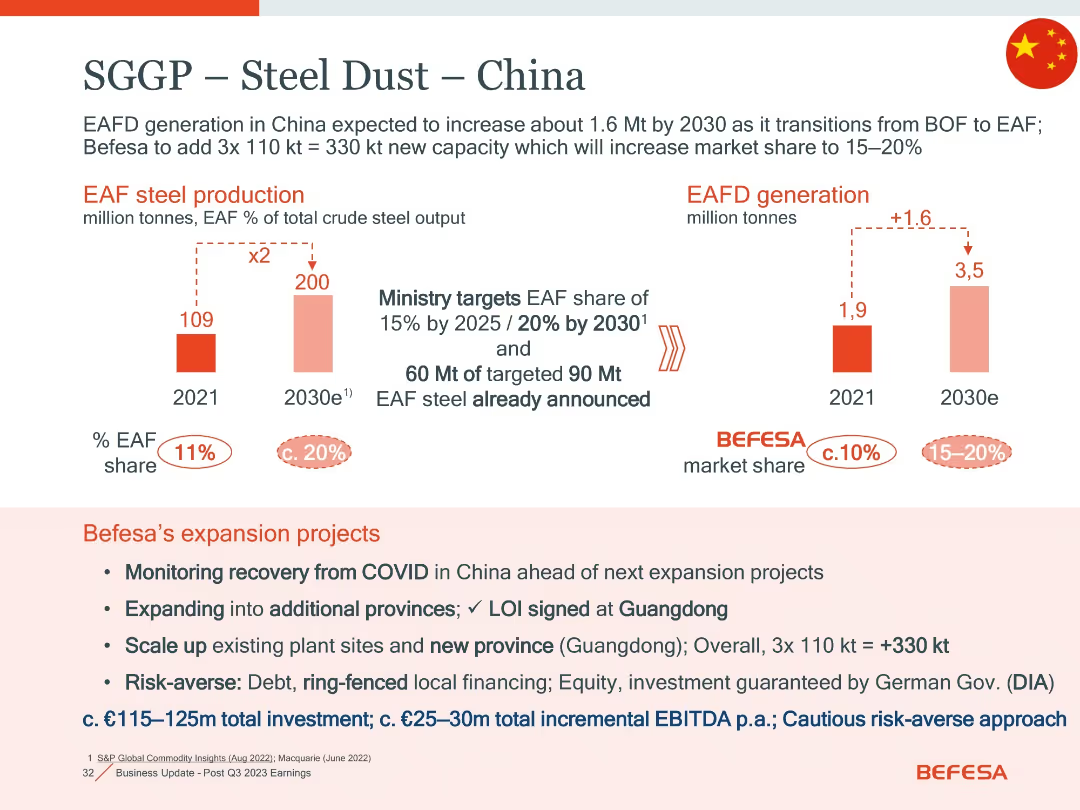
Dual bar chart format, comparing 2021 vs. 2030e EAF steel production and EAFD generation; includes market share and text on expansion strategy
Strategic Planning
Industrial & Manufacturing
Focuses on China's EAF and EAFD growth potential driven by policy and industrial transition. Highlights Befesa’s projected capacity increases and market share strategy through cautious, phased expansion and government-backed investment.
China, EAFD, steel dust, market share, expansion, capacity, investment, risk-averse, decarbonisation
false
Strategic Planning
Industrial & Manufacturing
Mixed Chart
Goldman Sachs
Add to my slides
Remove from favorites
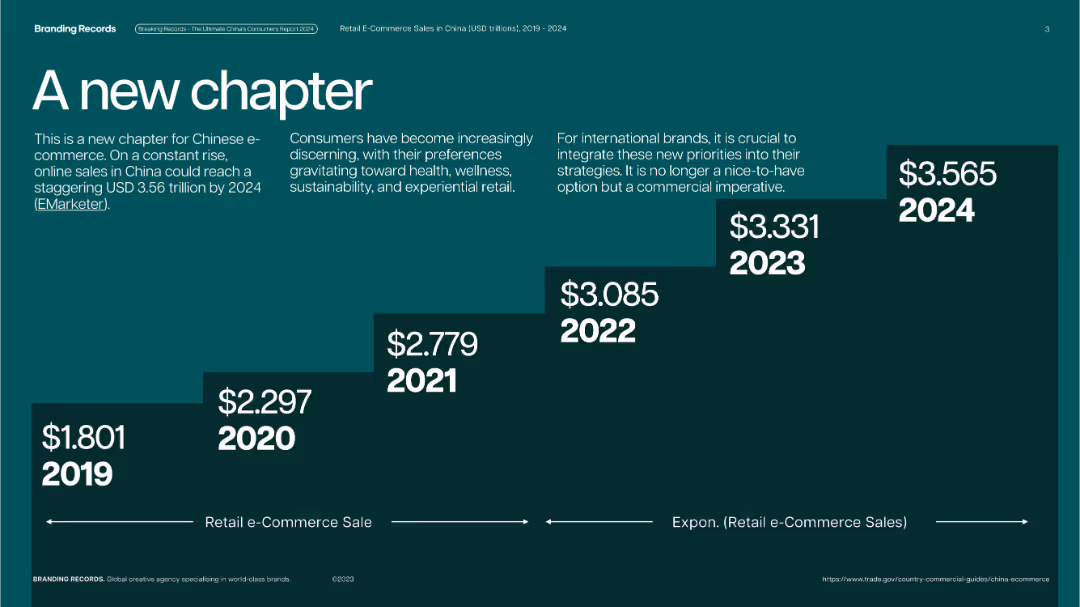
Dark green background with bold step chart design; each year shown on ascending blocks with white text.
Market Analysis and Trends
Retail & E-commerce
Highlights the continuous growth of retail e-commerce sales in China from 2019 to 2024, forecasting USD 3.565 trillion in 2024. It emphasizes evolving consumer preferences and urges brands to align with these shifts.
China, e-commerce, growth, retail, consumer trends, health, wellness, international
false
Market Analysis and Trends
Retail & E-commerce
Single Chart
McKinsey
Add to my slides
Remove from favorites
Includes a line and column chart. The line chart tracks China's Manufacturing and Non-Manufacturing PMI, and the bar graph details monthly gambling revenues in Macau, indicating economic health and consumer behavior.
Market Analysis and Trends
Financial Services
Highlights China's economic strategies and outcomes in 2021, focusing on sectors like manufacturing and consumer spending. The slide provides insights into how policy shifts and economic activities influence broader economic stability and growth forecasts.
China, economic policy, PMI, consumer spending, economic growth
false
Market Analysis and Trends
Financial Services
Multiple Chart
Deloitte
Add to my slides
Remove from favorites
The slide features two line charts. The left chart shows the share of GDP by sector (manufacturing, services, agriculture) from 1983 to 2023. The right chart shows total exports and imports as a percentage of GDP from 1983 to 2023.
Market Analysis and Trends
Financial Services
This slide examines China's economic transition, highlighting the changes in GDP composition by sector and trends in exports and imports over the last four decades. It illustrates the shift from manufacturing to services and the dynamics of trade.
China, economic transition, GDP, sector, exports, imports, manufacturing, services, agriculture, line chart
false
Market Analysis and Trends
Financial Services
Multiple Chart
JP Morgan
Add to my slides
Remove from favorites
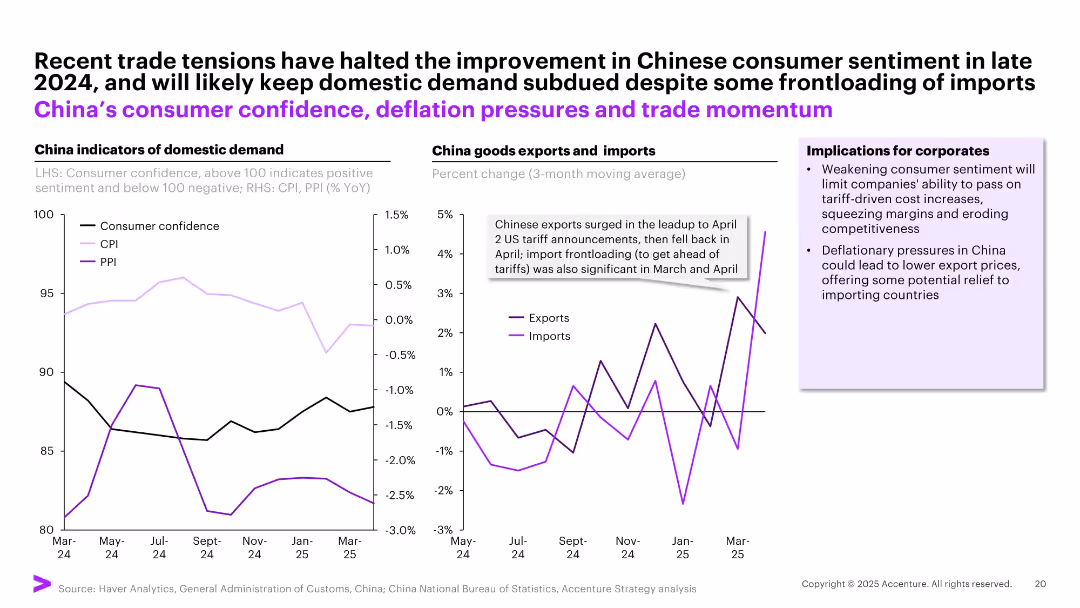
Dual line chart layout comparing domestic indicators (left) with trade flows (right); includes annotations and business implications in side box.
Market Analysis and Trends
Industrial & Manufacturing
The slide illustrates declining consumer confidence and persistent deflation in China, alongside trade fluctuations triggered by US tariffs. Corporates are advised to expect reduced pricing power in China and potential cost relief through lower export prices.
China economy, consumer sentiment, deflation, tariffs, trade, imports, exports
false
Market Analysis and Trends
Industrial & Manufacturing
Multiple Chart
Accenture
Add to my slides
Remove from favorites
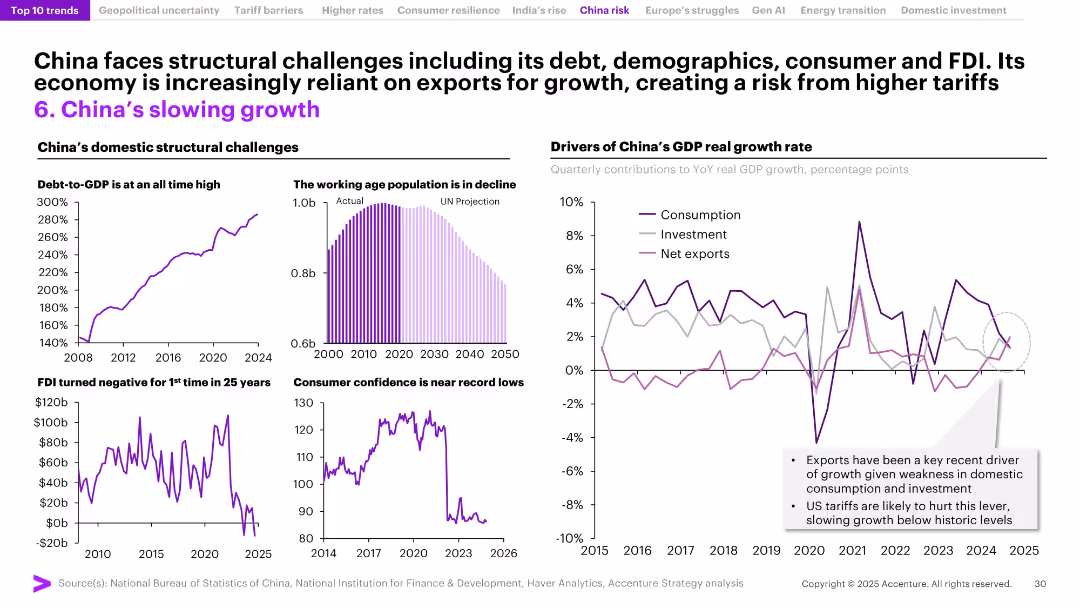
Multi-panel slide with various graphs on debt, workforce, FDI, consumer confidence, and GDP growth drivers; consistent purple highlight.
Market Analysis and Trends
Financial Services
The slide presents China's economic slowdown due to mounting debt, shrinking working-age population, declining FDI, and weakening consumer confidence. Exports have been a key growth lever, but rising tariffs and global shifts may further constrain growth. The analysis reflects deep-rooted structural vulnerabilities.
China economy, debt, demographics, FDI decline, exports, consumer confidence, GDP growth, tariffs, structural slowdown, macroeconomics
false
Market Analysis and Trends
Financial Services
Multiple Chart
Accenture
Add to my slides
Remove from favorites
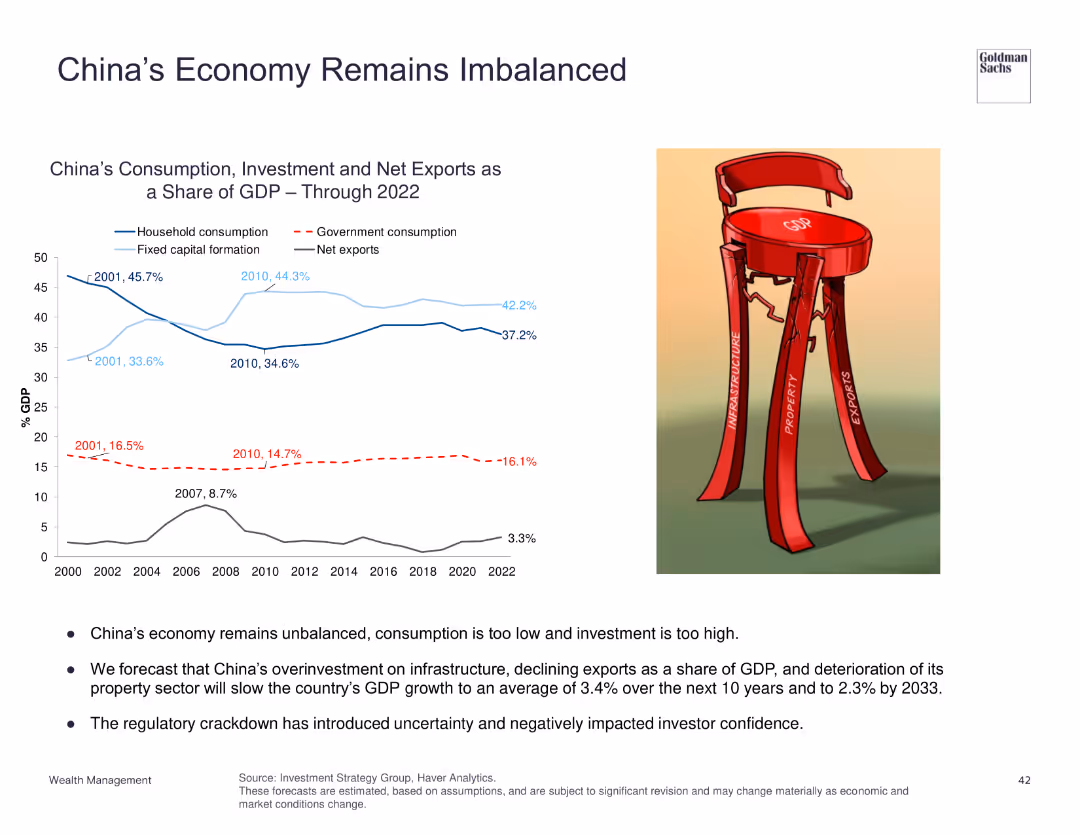
Line charts and an illustration of a broken stool to represent economic imbalance.
Market Analysis and Trends
Financial Services
Analyzes China's consumption, investment, and net exports as a share of GDP, highlighting economic imbalances and future forecasts.
China, economy, GDP, consumption, investment
false
Market Analysis and Trends
Financial Services
Mixed Chart
Goldman Sachs
Add to my slides
Remove from favorites
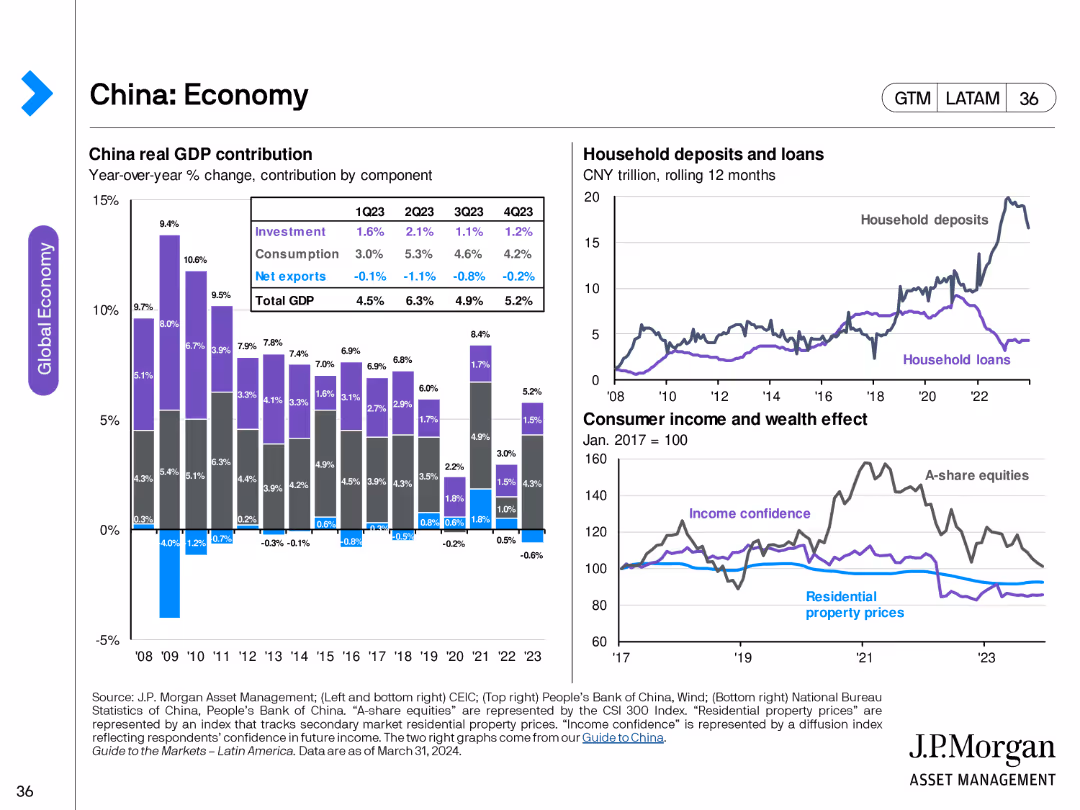
This slide includes stacked column charts showing China's real GDP contribution by component, and line charts displaying household deposits and loans, consumer income, and wealth effect.
Market Analysis and Trends
Financial Services
The slide analyzes China's economic components, including GDP contribution, household financial behavior, and consumer confidence, providing insights into economic health and trends in China.
China, economy, GDP, household deposits, household loans, consumer income, wealth effect, economic trends
false
Market Analysis and Trends
Financial Services
Multiple Chart
JP Morgan
Add to my slides
Remove from favorites
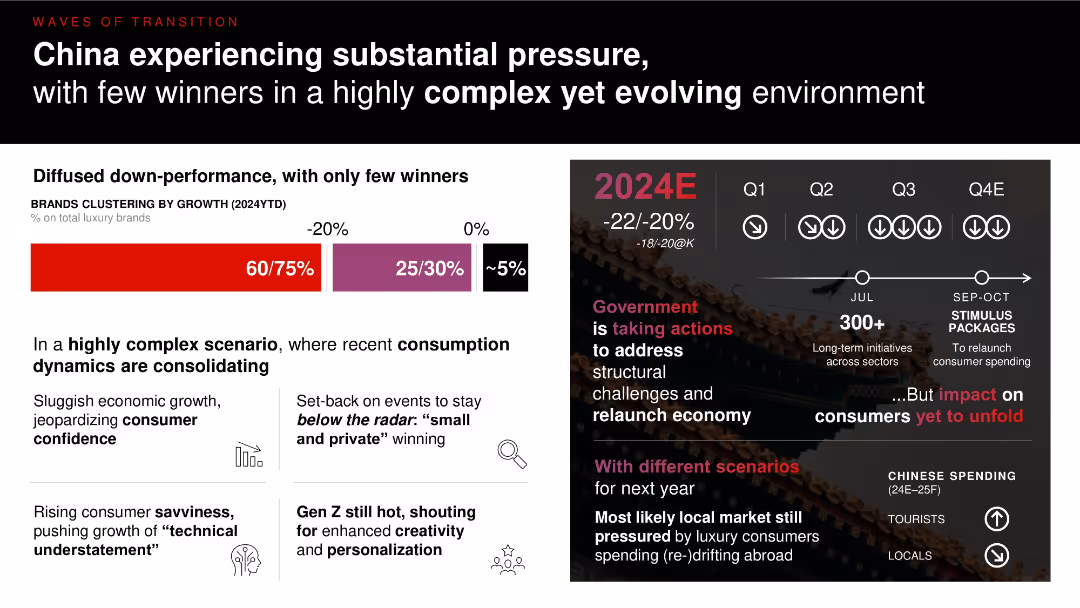
Horizontal bar chart clustering luxury brand growth rates; timeline of economic stimuli; explanatory icons and bullet points summarizing economic and consumer behavior challenges.
Market Analysis and Trends
Consumer Goods
This slide discusses the economic and consumer market pressures in China during 2024, where most luxury brands are underperforming. It highlights government interventions, consumer sentiment, and scenarios affecting the retail and luxury sectors.
China economy, luxury slowdown, consumer confidence, stimulus, brand clustering, Gen Z, savviness
false
Market Analysis and Trends
Consumer Goods
Mixed Chart
Bain
Add to my slides
Remove from favorites
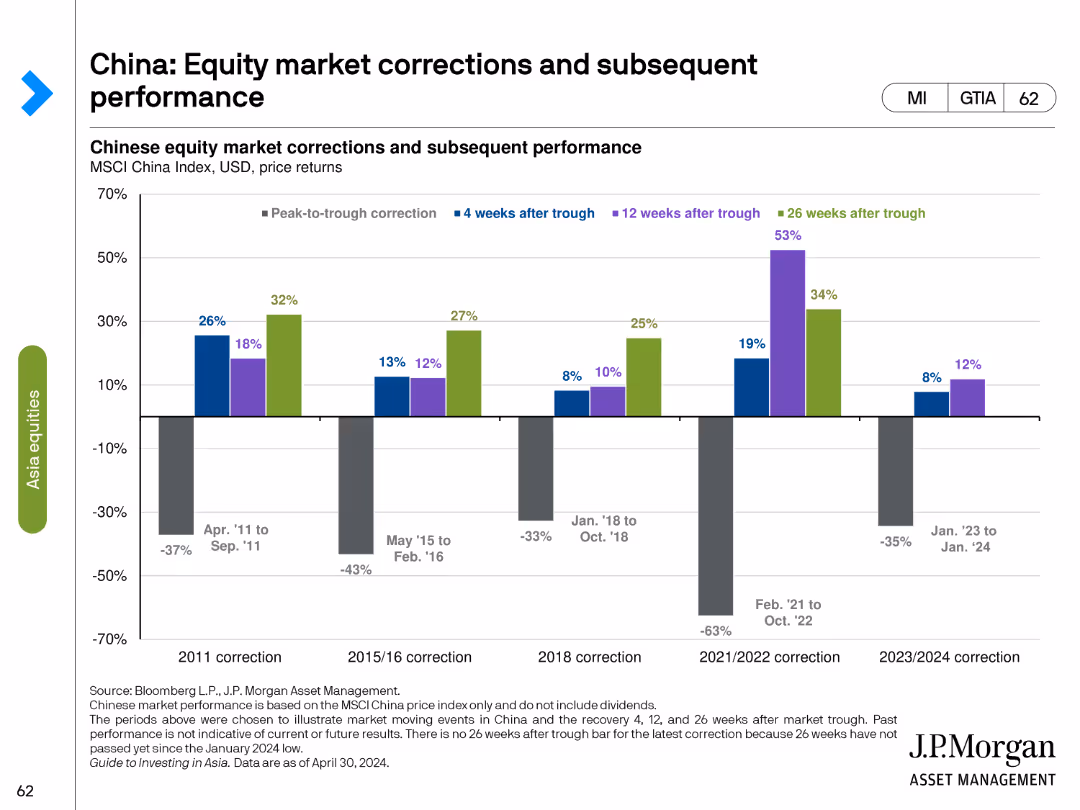
This slide includes a column chart showing peak-to-trough corrections and subsequent performance of the Chinese equity market. Different colors represent recovery periods of 4, 12, and 26 weeks after market trough.
Market Analysis and Trends
Financial Services
The slide shows the performance of Chinese equities during various correction periods, detailing the percentage drops and recovery patterns to analyze market resilience and investment opportunities post-correction.
China, equity market, corrections, performance, peak-to-trough, recovery, financial analysis, investment opportunities, market resilience, post-correction
false
Market Analysis and Trends
Financial Services
Single Chart
JP Morgan
Add to my slides
Remove from favorites
This slide features two line charts. The first chart shows the MSCI China price-to-book ratio over time. The second chart displays MSCI China historical drawdowns in percentage terms.
Market Analysis and Trends
Financial Services
The slide analyzes the MSCI China price-to-book ratio and historical drawdowns, offering insights into market fluctuations and valuation trends.
China, equity, price-to-book ratio, drawdowns, MSCI, market analysis
false
Market Analysis and Trends
Financial Services
Multiple Chart
JP Morgan
Add to my slides
Remove from favorites
The slide is divided into two main sections with a column chart and descriptive text. The upper section has a headline with a subtitle and a large column chart showing China’s market share by battery value chain segment. The lower section contains a description of China’s policies in smaller text with bullet points, illustrating policy details.
Market Analysis and Trends
Transportation & Logistics
This slide illustrates China's dominance in the electric vehicle (EV) battery value chain, supported by significant government subsidies and a certification scheme that favors local firms. It provides insights into China’s market strategy and its effects on global competition in the EV sector.
China, EV battery, market share, subsidies, certification, global competition, strategic planning, industry dominance, value chain, local firms
false
Market Analysis and Trends
Transportation & Logistics
Mixed Chart
Accenture
Add to my slides
Remove from favorites
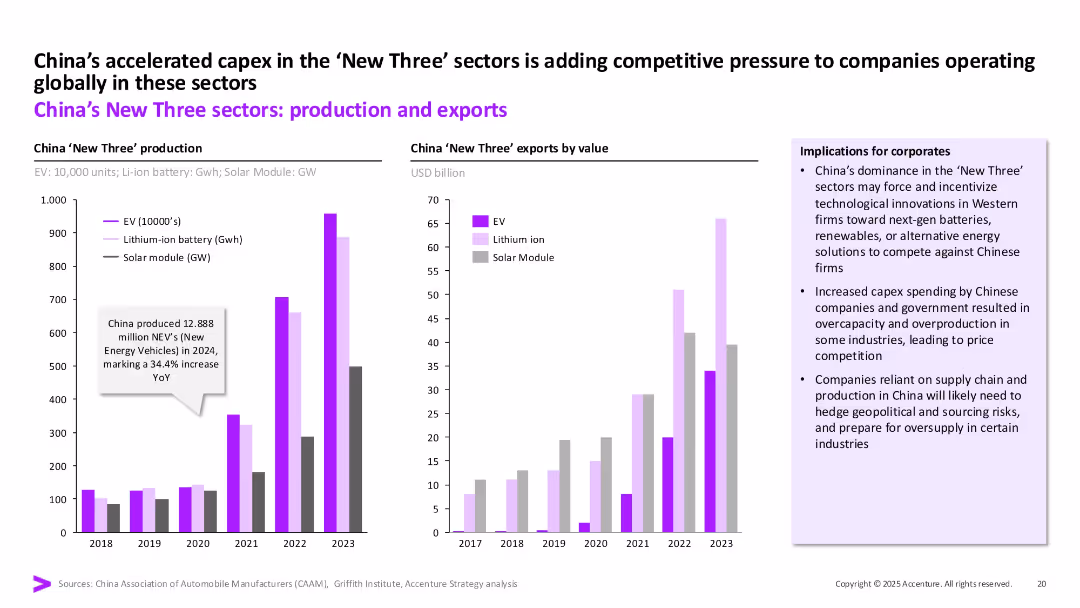
Dual bar charts showing production and exports for EVs, lithium-ion batteries, and solar modules. Color-coded legends and implications section on the right.
Competitive Landscape
Industrial & Manufacturing
China’s aggressive capex in the "New Three" sectors—EVs, lithium-ion batteries, and solar modules—is boosting global competition. The slide showcases production/export trends and warns of overcapacity, pricing pressures, and supply chain dependencies.
China, EV, lithium, solar, exports, capex, manufacturing, competition
false
Competitive Landscape
Industrial & Manufacturing
Multiple Chart
Accenture
Add to my slides
Remove from favorites
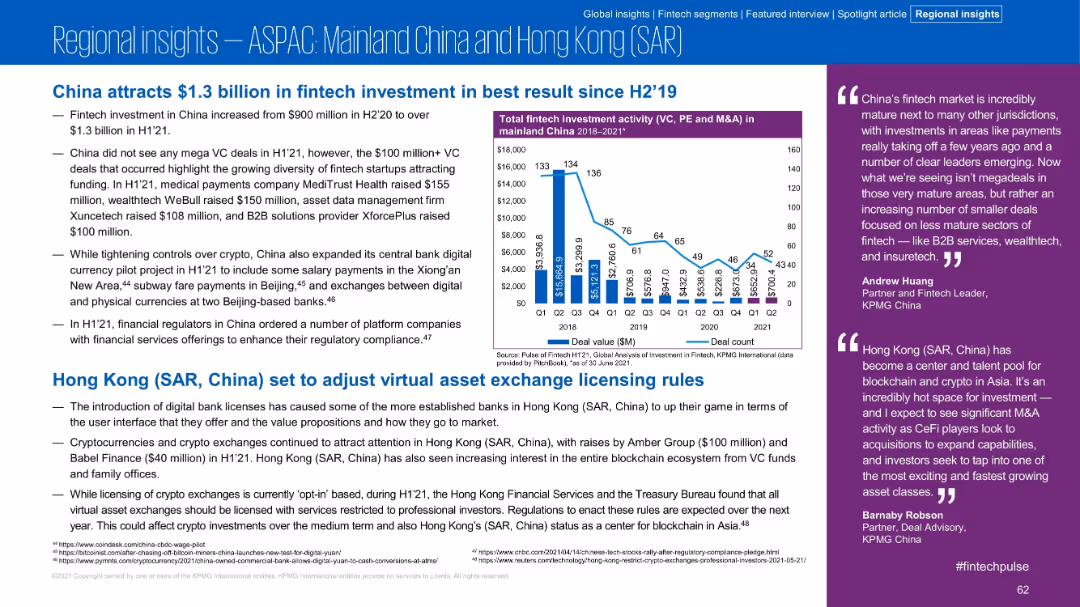
Text-based slide with one line chart, regional insights, and commentary from KPMG experts.
Market Analysis and Trends
Financial Services
Focused on Mainland China and Hong Kong, this slide outlines recent VC trends, strong fintech investment activity, and regulatory developments including crypto licensing. It emphasizes the absence of megadeals and the rise of smaller B2B plays.
China, Fintech, Investment, Licensing, Crypto, B2B, Regulations
false
Market Analysis and Trends
Financial Services
Mixed Chart
KPMG
Add to my slides
Remove from favorites
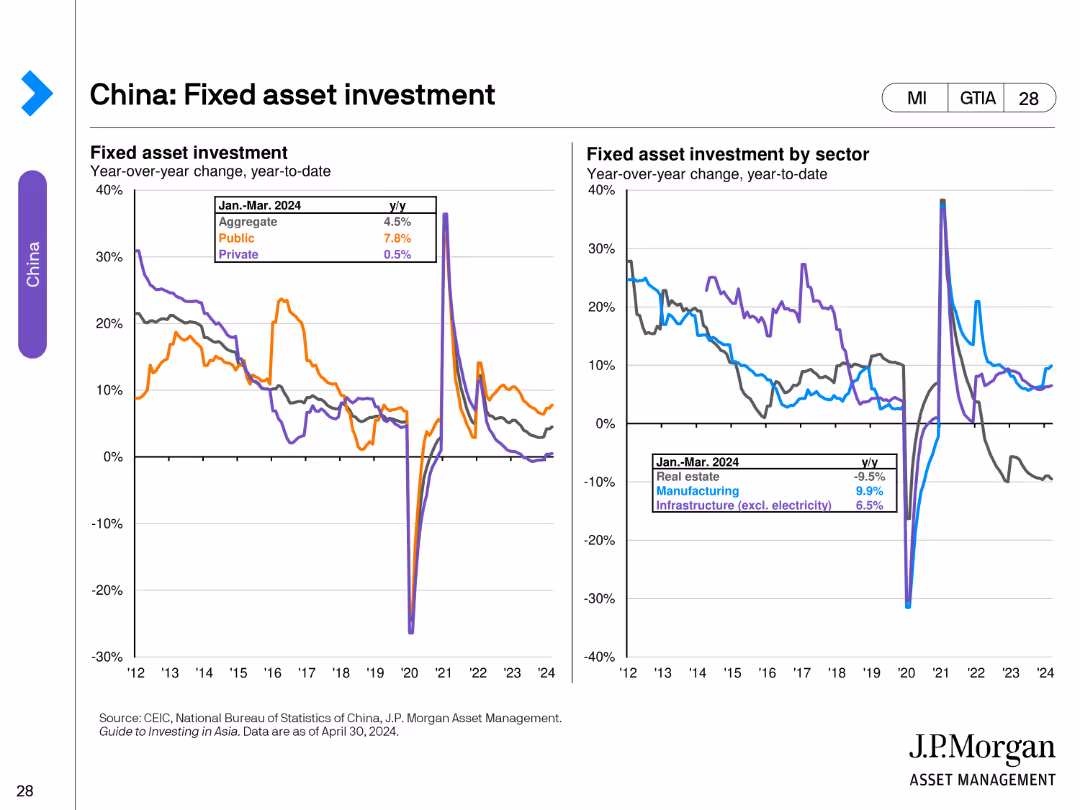
The slide features two line charts. The left chart shows year-over-year changes in fixed asset investment from January to March 2024, broken down by aggregate, public, and private investments. The right chart displays fixed asset investment by sector (real estate, manufacturing, infrastructure) from 2012 to 2024.
Market Analysis and Trends
Financial Services
This slide evaluates fixed asset investment trends in China, detailing the year-over-year changes and sector-specific investments. It compares public and private investment levels and the performance of various sectors over time.
China, fixed asset investment, public, private, sector, real estate, manufacturing, infrastructure, trends, line chart
false
Market Analysis and Trends
Financial Services
Multiple Chart
JP Morgan
Add to my slides
Remove from favorites
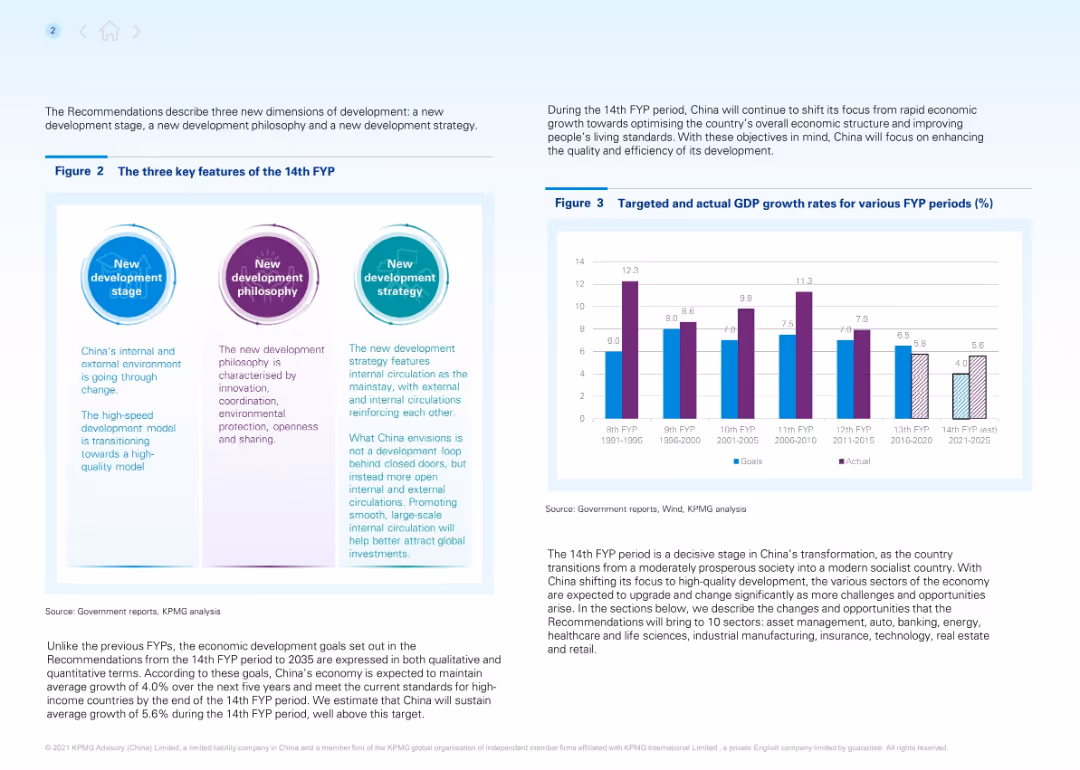
Two-panel layout with colored icons and brief descriptions summarizing China’s 14th Five-Year Plan (FYP). A GDP bar chart on the right compares targeted vs actual growth across plan periods. Soft blue gradient background.
Strategic Planning
Government & Public Sector
Outlines China's 14th Five-Year Plan, emphasizing a shift to high-quality development. Highlights include innovation, environmental protection, and internal circulation. Historical GDP growth data provides context for future projections.
China FYP, development plan, GDP growth, economic policy, innovation, internal circulation
false
Strategic Planning
Government & Public Sector
Mixed Chart
KPMG
Add to my slides
Remove from favorites
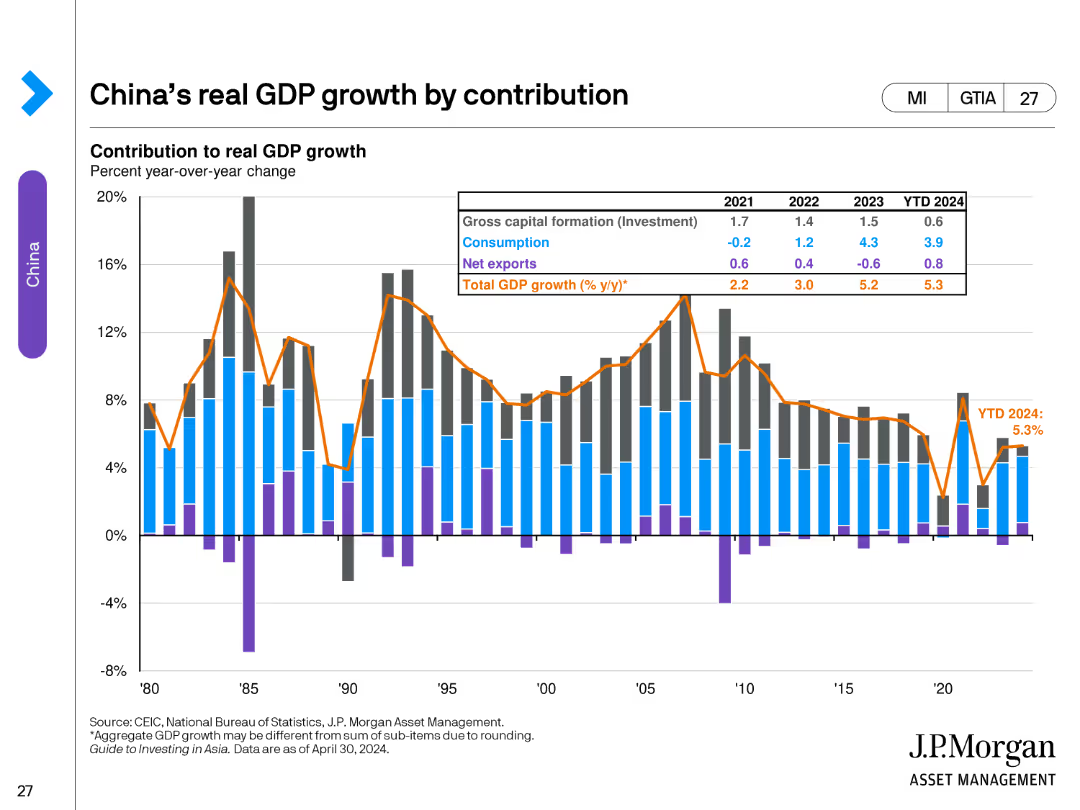
The slide contains a stacked bar chart showing the contribution to real GDP growth by gross capital formation, consumption, net exports, and total GDP growth from 1980 to 2024. A table summarizes year-over-year changes and projections for the near future.
Market Analysis and Trends
Financial Services
This slide analyzes the components of China's real GDP growth over several decades, highlighting the contributions of investment, consumption, and net exports. It provides a historical perspective and future projections of GDP growth rates.
China, GDP, growth, contribution, investment, consumption, net exports, projections, financial services, bar chart
false
Market Analysis and Trends
Financial Services
Single Chart
JP Morgan
Add to my slides
Remove from favorites
Column charts depict China’s GDP growth rates across quarters for two years, highlighting expected growth due to policy changes.
Market Analysis and Trends
Transportation & Logistics
Analyzes the impact of China's economic policies and COVID-19 policy reversals on its GDP growth, with implications for global trade.
China, GDP growth, economic policy, COVID-19, global trade
false
Market Analysis and Trends
Transportation & Logistics
Mixed Chart
Deutsche Bank
Add to my slides
Remove from favorites
Two column charts: one shows China's real GDP growth contributions by GDP growth and investment, and the other shows fixed asset investment by sector.
Market Analysis and Trends
Financial Services
This slide provides insights into the drivers of economic growth in China, highlighting contributions to GDP growth and sector-specific fixed asset investments. Used for market analysis and investment planning.
China, GDP, growth, investment, sectors
false
Market Analysis and Trends
Financial Services
Multiple Chart
JP Morgan
Add to my slides
Remove from favorites
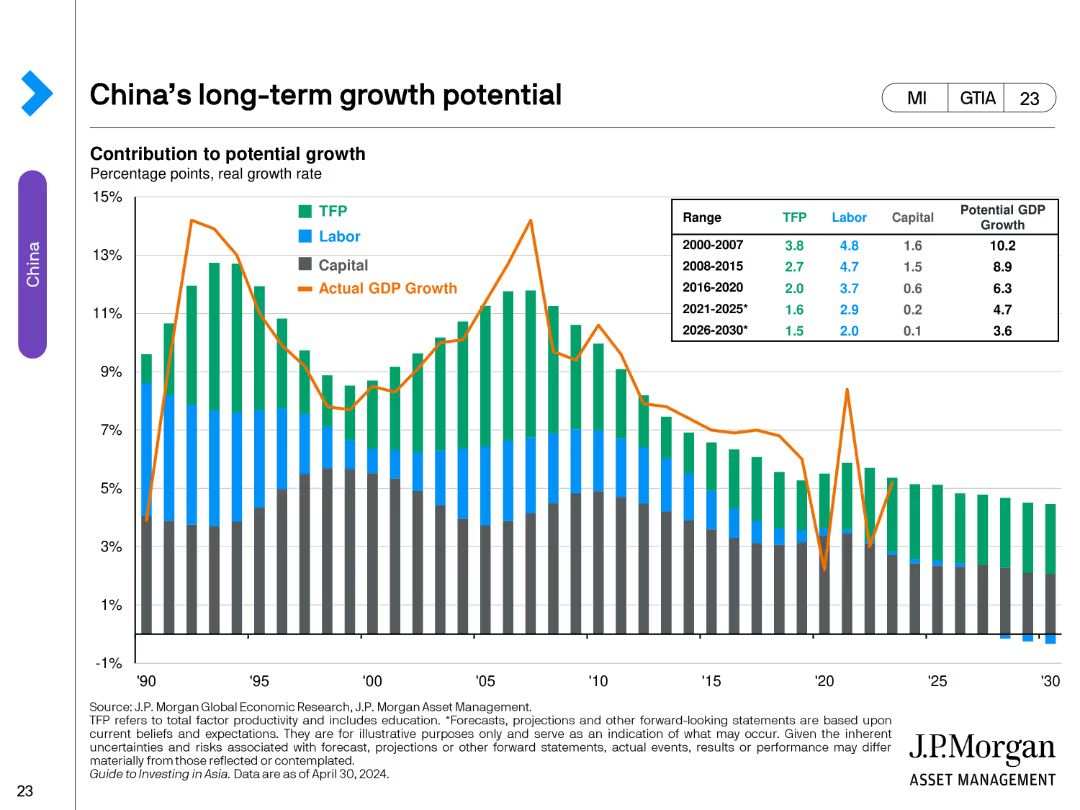
The slide contains a stacked bar chart showing the contribution to potential GDP growth in China from TFP, labor, and capital, alongside actual GDP growth from 1990 to 2030. The chart includes a table summarizing growth rates in various periods.
Market Analysis and Trends
Financial Services
This slide assesses China's long-term economic growth potential, breaking down contributions from total factor productivity (TFP), labor, and capital. It contrasts these with actual GDP growth over time, providing forecasts for future growth rates.
China, GDP, growth, potential, TFP, labor, capital, economic forecast, stacked bar chart, financial services
false
Market Analysis and Trends
Financial Services
Single Chart
JP Morgan
Add to my slides
Remove from favorites
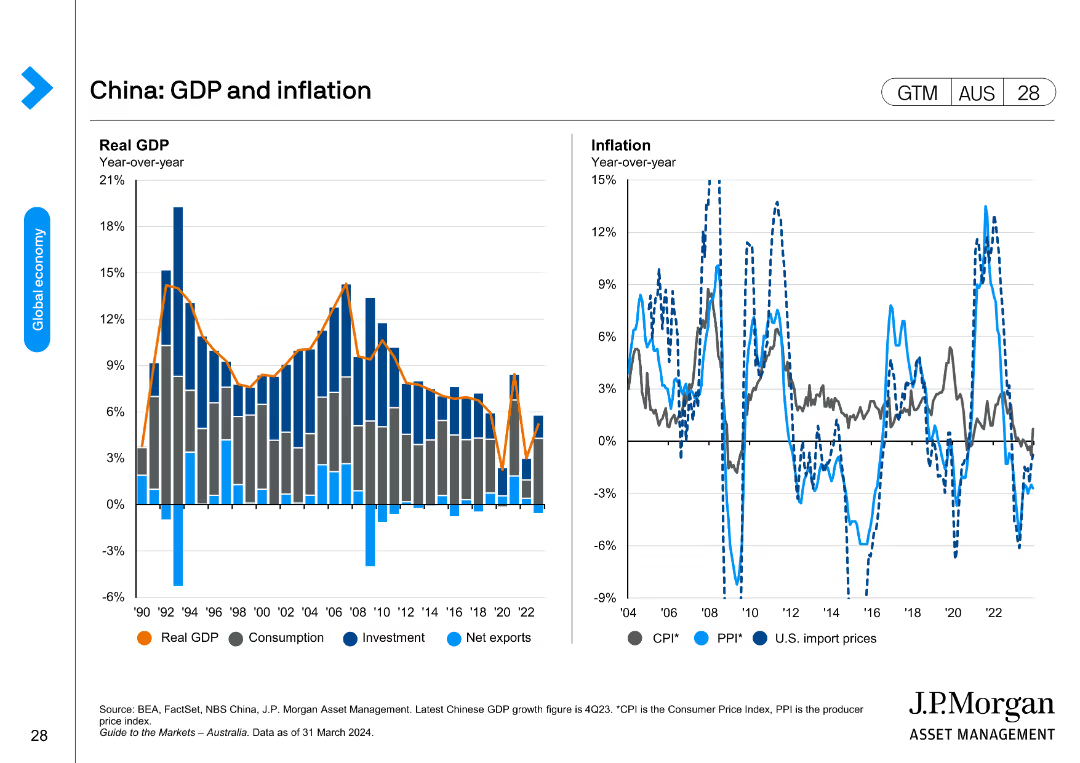
Two charts illustrating China's GDP growth by various components and inflation rates, comparing CPI, PPI, and U.S. import prices.
Market Analysis and Trends
Financial Services
The slide details China's economic performance, highlighting GDP growth and inflationary trends, with a focus on consumer and producer prices, and import dynamics.
China, GDP, inflation, CPI, PPI, import prices
false
Market Analysis and Trends
Financial Services
Multiple Chart
JP Morgan
Add to my slides
Remove from favorites
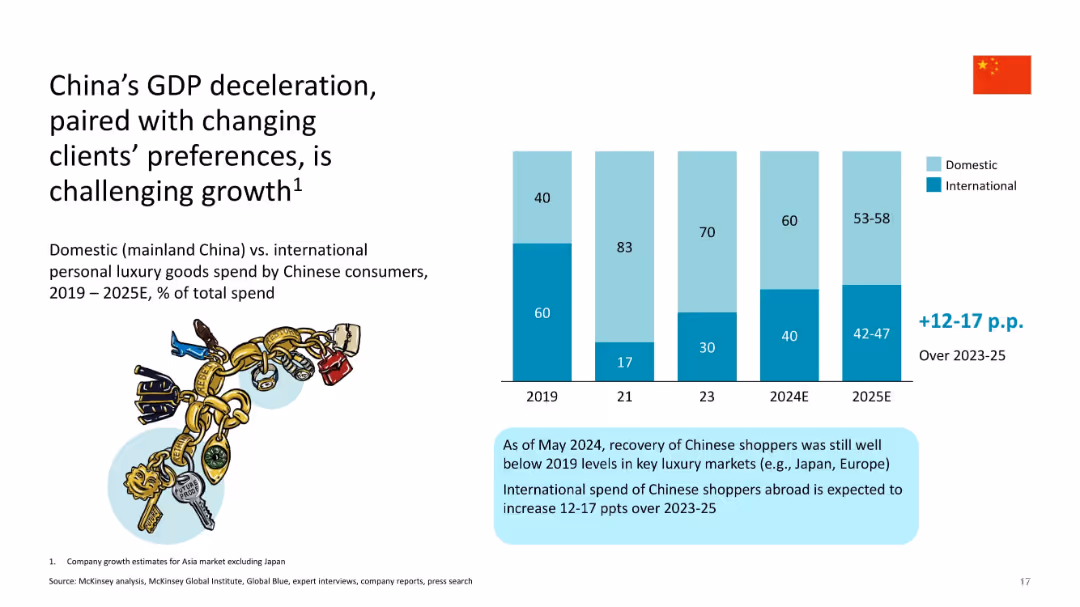
Split layout with text on left, bar chart on right; uses blue tones; Chinese flag and illustrated shopping bags
Market Analysis and Trends
Consumer Goods
Shows shift in Chinese consumer luxury spending from domestic to international markets due to GDP slowdown and evolving preferences; forecasts international spend increase of 12–17 percentage points from 2023–2025.
China, GDP, luxury spending, domestic vs international, consumer trends, 2025 forecast, preferences, growth challenge
false
Market Analysis and Trends
Consumer Goods
Mixed Chart
McKinsey
Add to my slides
Remove from favorites
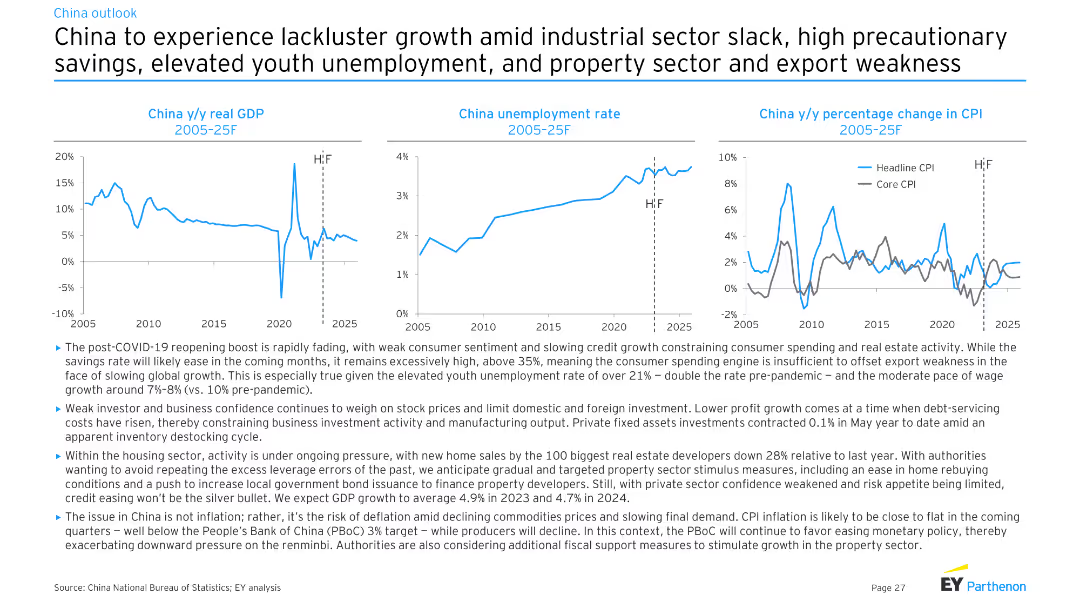
Three line charts illustrating China's y/y real GDP, unemployment rate, and y/y percentage change in CPI from 2005-25F. Moderate complexity, suitable for detailed economic analysis and forecasting.
Market Analysis and Trends
Financial Services
The slide forecasts China's economic growth, addressing challenges in the industrial sector, high savings rates, and export weakness. It discusses GDP trends, unemployment, and inflation projections, highlighting factors impacting growth.
China, GDP, unemployment, CPI, growth
false
Market Analysis and Trends
Financial Services
Multiple Chart
EY
Add to my slides
Remove from favorites
The slide includes three line charts showing China's y/y real GDP, unemployment rate, and y/y CPI from 2005 to 2025, with explanatory text.
Market Analysis and Trends
Financial Services
Analyzes China's economic challenges and prospects, including structural and cyclical factors affecting GDP, employment, and inflation.
China, GDP, Unemployment, CPI, Structural Headwinds
false
Market Analysis and Trends
Financial Services
Multiple Chart
EY
Add to my slides
Remove from favorites
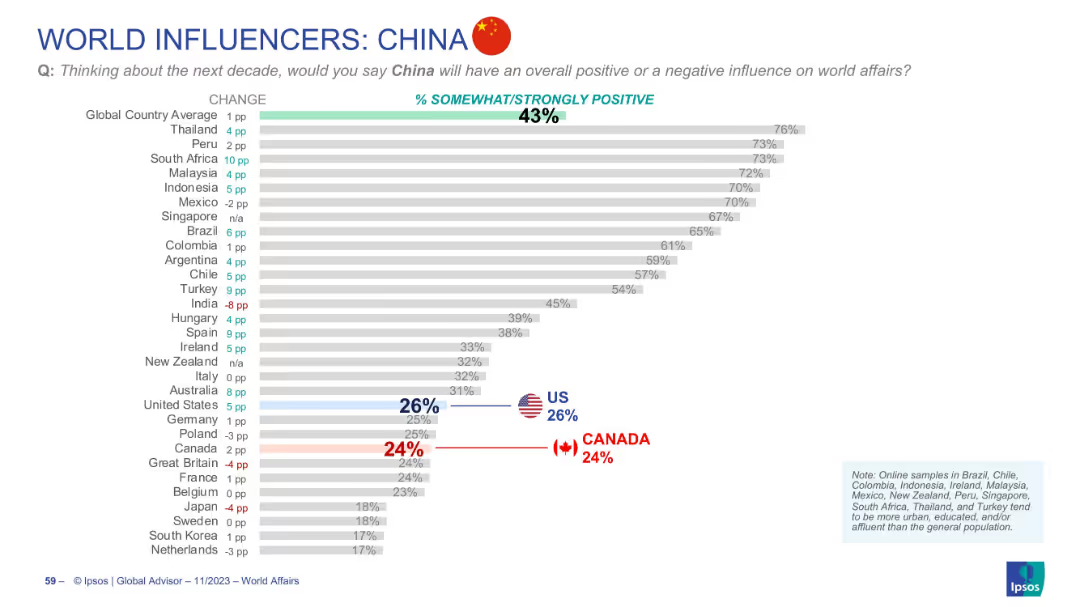
Horizontal bar graph of countries’ perceptions of China’s influence, with flags and large percentage markers for US and Canada.
Market Analysis and Trends
Government & Public Sector
This slide ranks global sentiment on China's influence over the next decade. The average positive view is 43%, with Southeast Asia showing high support. Western countries, especially Canada and the US, are much lower.
China, global influence, opinion, trends, perception, Ipsos, international relations, Asia
false
Market Analysis and Trends
Government & Public Sector
Single Chart
IPSOS
Add to my slides
Remove from favorites
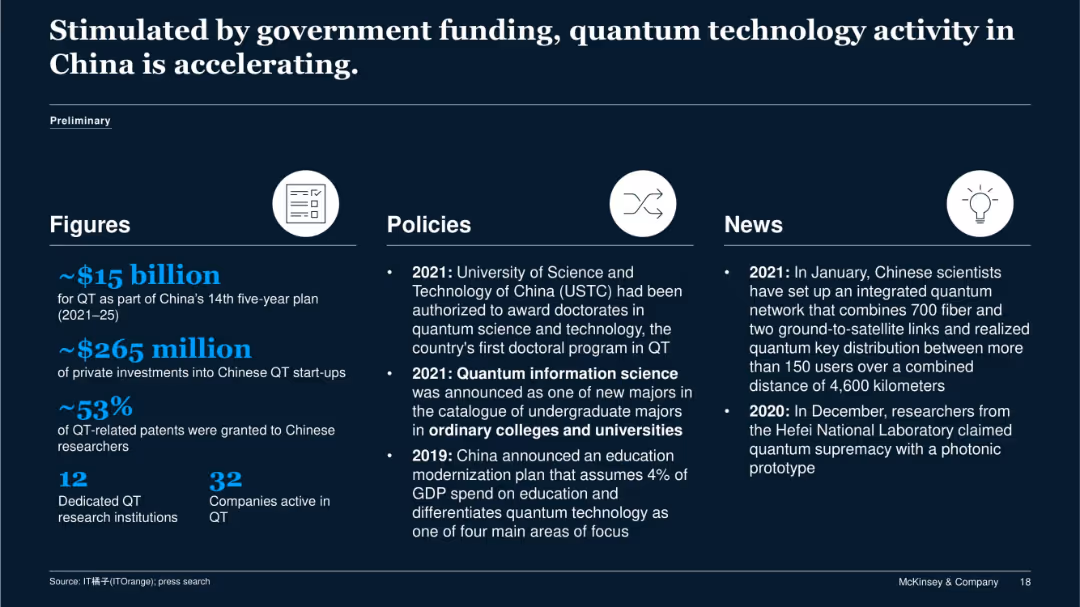
Three-column layout with icons and text for Figures, Policies, and News; dark background with bold blue and white fonts.
Strategic Planning
Government & Public Sector
The slide presents China’s major push in QT through $15B in government funding and $265M in private capital. It details policies enabling doctoral programs and education investments, and news of breakthrough achievements in quantum networks and photonic quantum supremacy.
China, government policy, QT, investment, research, education
false
Strategic Planning
Government & Public Sector
Pillar
McKinsey
Add to my slides
Remove from favorites
Previous
Next
You don't have any favorites yet.
Please wait loading your favorites slides...
Create a FREE account to continue browsing
Receive Instant Access to 1,000+ slides from companies like McKinsey, Google, and Goldman Sachs
First Name
Last Name
Email
Password
I agree to all
Terms & Privacy Policy
Thank you! Your submission has been received!
Oops! Something went wrong while submitting the form.
Have an account?
Sign in
Upgrade to PRO to Save slides
Advanced Search and Filters
Access to 15,000+ slides
Access to Category Pages
Save/Bookmark Slides
PowerPoint Template Library
Pick a Plan
MONTHLY
$12/month
Billed every month, Cancel anytime.
YEARLY
$9/year
Billed $108 annually, Cancel anytime.
Checkout for $12/month
Checkout for $108/yr
Secured by Stripe | AES-256 bit encryption