My Account
My Slides
Search by Category
Companies
Slide Type
Use Case
Industry
Pricing
Templates
View All Templates
Download Template Slides
✦ AI
AI Prompt Library
AI Search
Feedback
Login
Logout
Get Started
Browse all Slides
Browse all Slides
Create a FREE Account
Instant access to 1,000+ real slides from top companies like McKinsey, BCG, Goldman Sachs, Google and many more!
First Name
Last Name
Email
Password
I agree to all
Terms & Privacy Policy
Thank you! Your submission has been received!
Oops! Something went wrong while submitting the form.
Have an account?
Sign in
Saved Slides
Total No. of slides saved
0
↻ Refresh
✖ Clear all
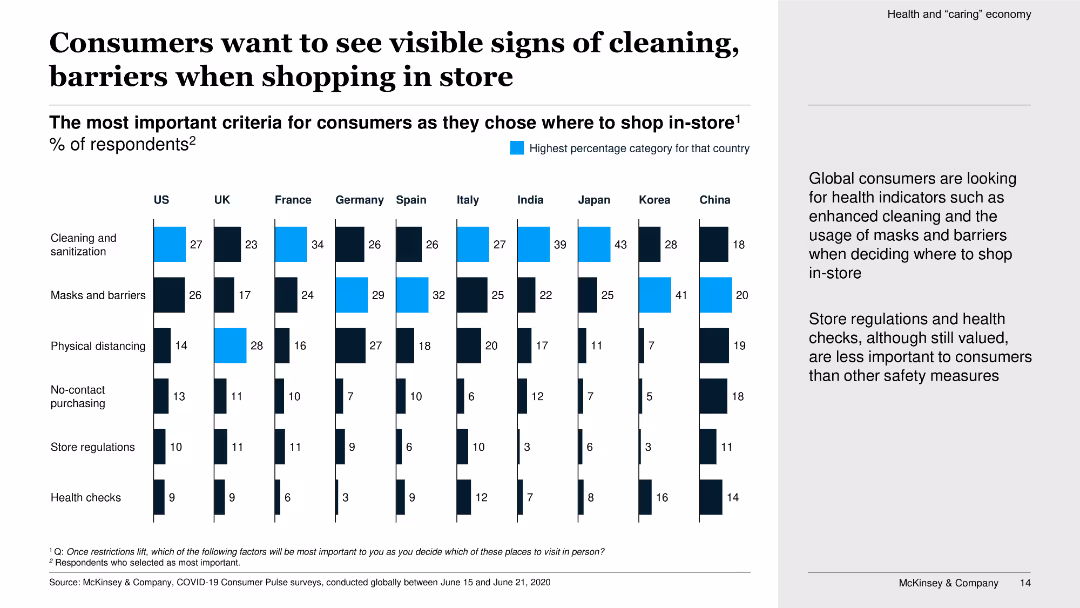
This slide contains vertical bar charts showing the most important criteria for consumers when choosing where to shop in-store.
Market Analysis and Trends
Retail & E-commerce
The slide highlights the importance of visible cleaning and barriers for consumers deciding where to shop in-store, emphasizing health and safety measures.
cleaning, barriers, in-store shopping, consumer criteria, bar charts, health and safety, survey, shopping decisions
false
Market Analysis and Trends
Retail & E-commerce
Multiple Chart
McKinsey
Add to my slides
Remove from favorites
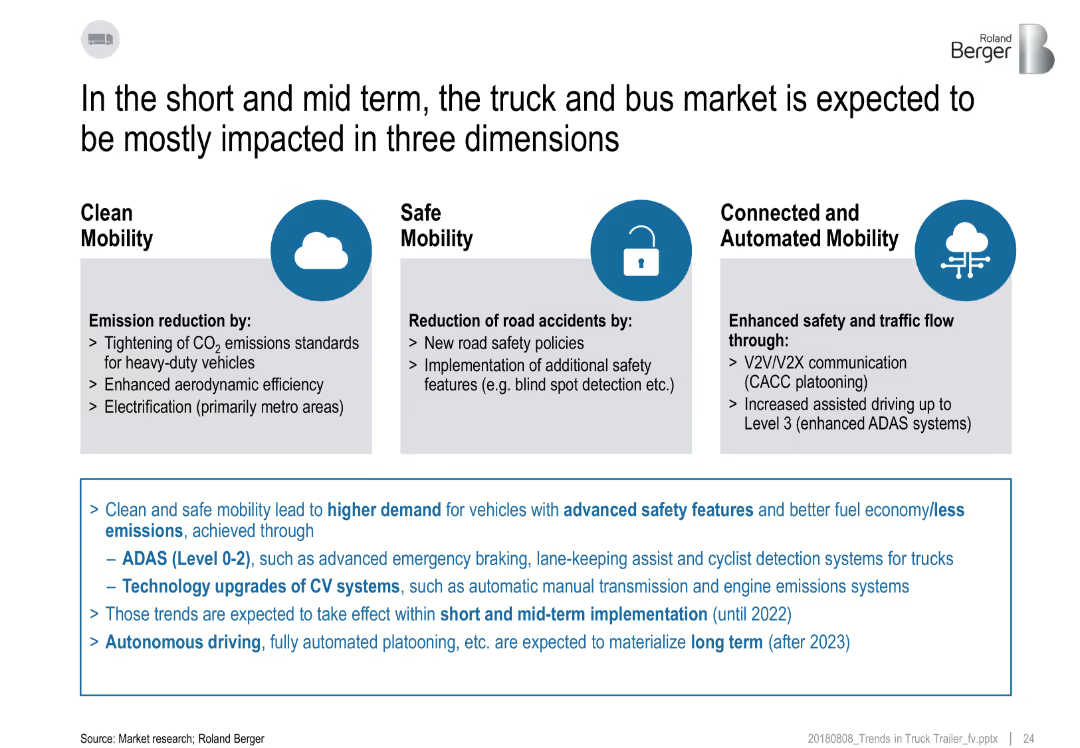
Three-column layout with icons and descriptions under each theme, text box below summarizing implications.
Technology and Digital Transformation
Transportation & Logistics
The slide outlines three key areas—Clean Mobility, Safe Mobility, and Connected/Automated Mobility—that will influence the truck and bus market. It discusses emissions, safety, and automation trends, along with implementation timelines.
clean mobility, ADAS, emissions, automation, safety, connected vehicles
false
Technology and Digital Transformation
Transportation & Logistics
Pillar
Roland Berger
Add to my slides
Remove from favorites
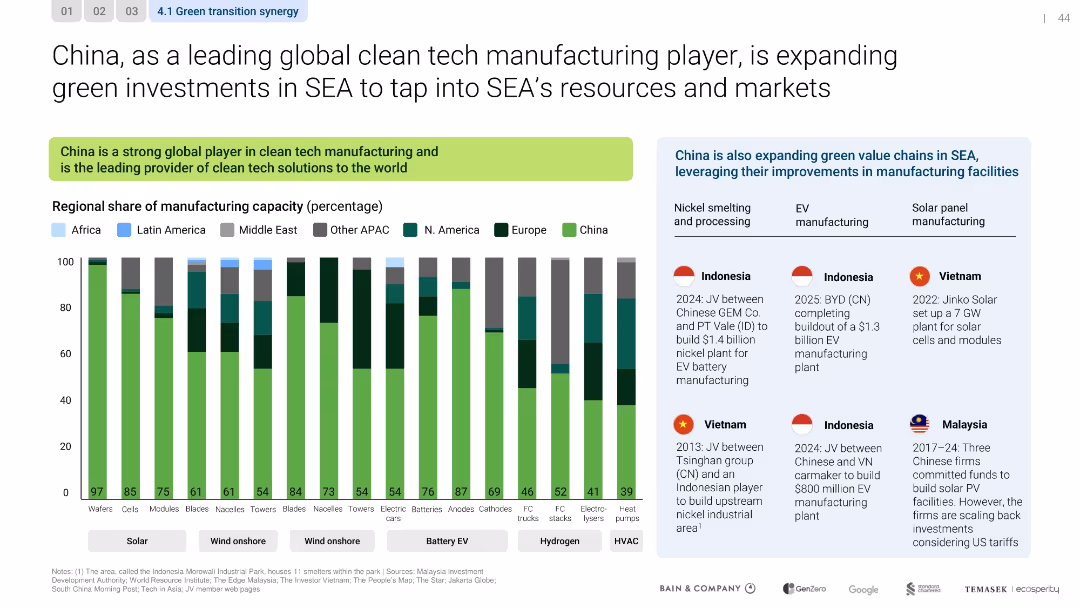
Bar chart on manufacturing share by region; icons and flags for case examples by country and sector
Technology and Digital Transformation
Industrial & Manufacturing
China is leveraging its dominant position in clean tech manufacturing to expand green investments in SEA, focusing on sectors like EVs, solar panels, and nickel processing. Joint ventures in Vietnam, Indonesia, and Malaysia are noted.
clean tech, China, EV, solar, Indonesia, Vietnam, SEA, manufacturing
false
Technology and Digital Transformation
Industrial & Manufacturing
Mixed Chart
Bain
Add to my slides
Remove from favorites
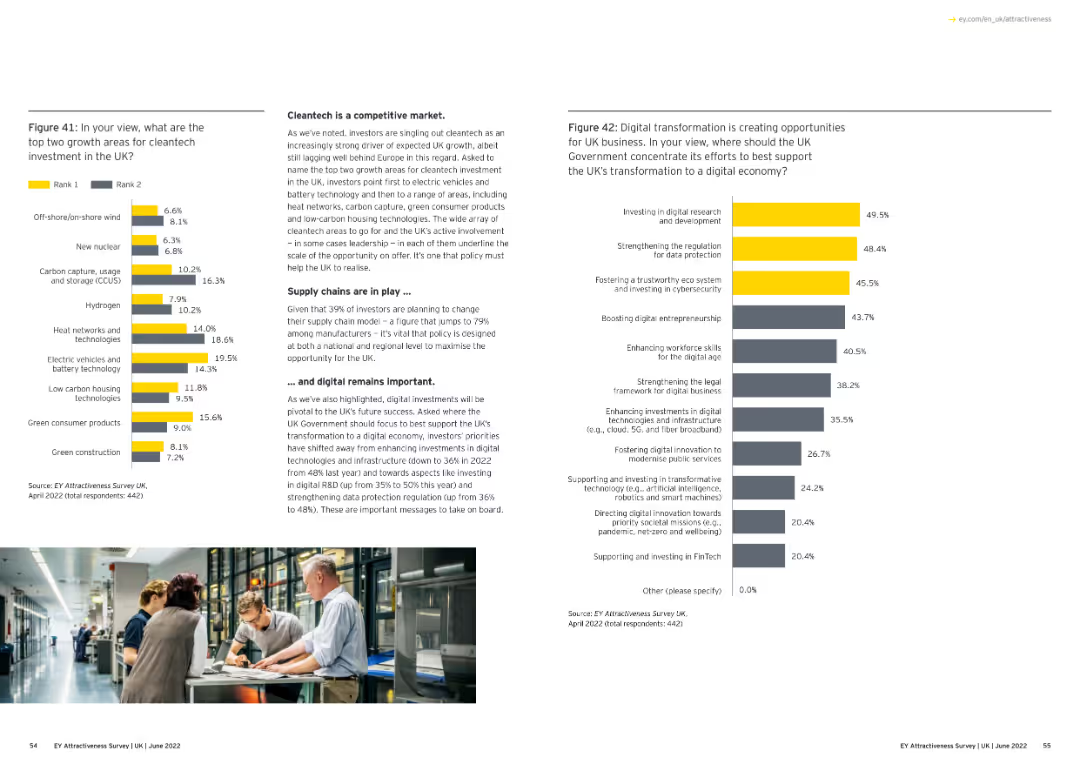
Text with a bar chart. The chart ranks top growth areas for cleantech investment in the UK.
Market Analysis and Trends
Financial Services
The slide discusses top growth areas for cleantech investment in the UK, focusing on sustainable technologies and future opportunities.
cleantech investment, growth areas, UK, sustainability, column chart
false
Market Analysis and Trends
Financial Services
Multiple Chart
EY
Add to my slides
Remove from favorites
Includes column charts showing projected volumes of hydrogen production and carbon capture, contrasting 2020 and 2030 scenarios.
Strategic Planning
Environmental Services & Sustainability
Provides a strategic outlook on the adoption of clean technologies driven by higher incentives, aiding in long-term planning and investment strategies.
clean technologies, hydrogen, carbon capture, strategic planning, 2030, incentives, investment strategies
false
Strategic Planning
Environmental Services & Sustainability
Multiple Chart
BCG
Add to my slides
Remove from favorites
Contains bar and column charts comparing incentives for various clean technologies like hydrogen and carbon capture.
Regulatory and Compliance
Energy & Utilities
Reviews governmental incentives for scaling clean technologies, crucial for policy analysis and energy sector planning.
clean technology, incentives, hydrogen, carbon capture, energy policy, regulatory, energy sector
false
Regulatory and Compliance
Energy & Utilities
Multiple Chart
BCG
Add to my slides
Remove from favorites
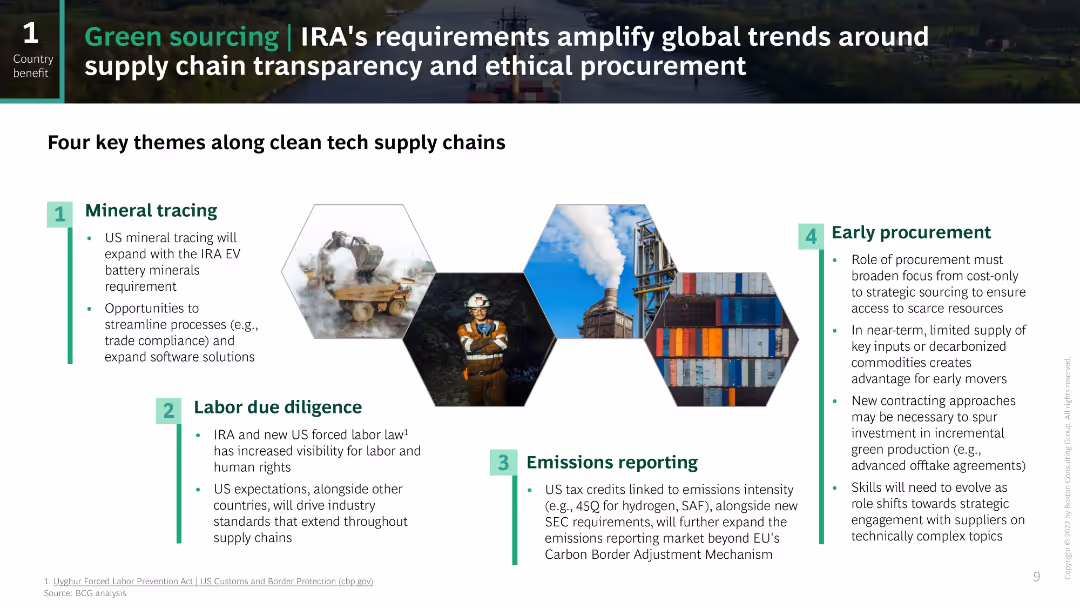
This slide uses a four-point layout with icons and descriptive text in green. The main focus is on the themes of clean tech supply chains, with images representing each theme (mineral tracing, labor due diligence, emissions reporting, and early procurement) placed in hexagons in the center.
Regulatory and Compliance
Energy & Utilities
The slide outlines the key themes of clean tech supply chains under IRA requirements, including mineral tracing, labor due diligence, emissions reporting, and early procurement, emphasizing transparency and ethical procurement practices.
clean tech, supply chain, transparency, ethical, IRA
false
Regulatory and Compliance
Energy & Utilities
Linear Flow
BCG
Add to my slides
Remove from favorites
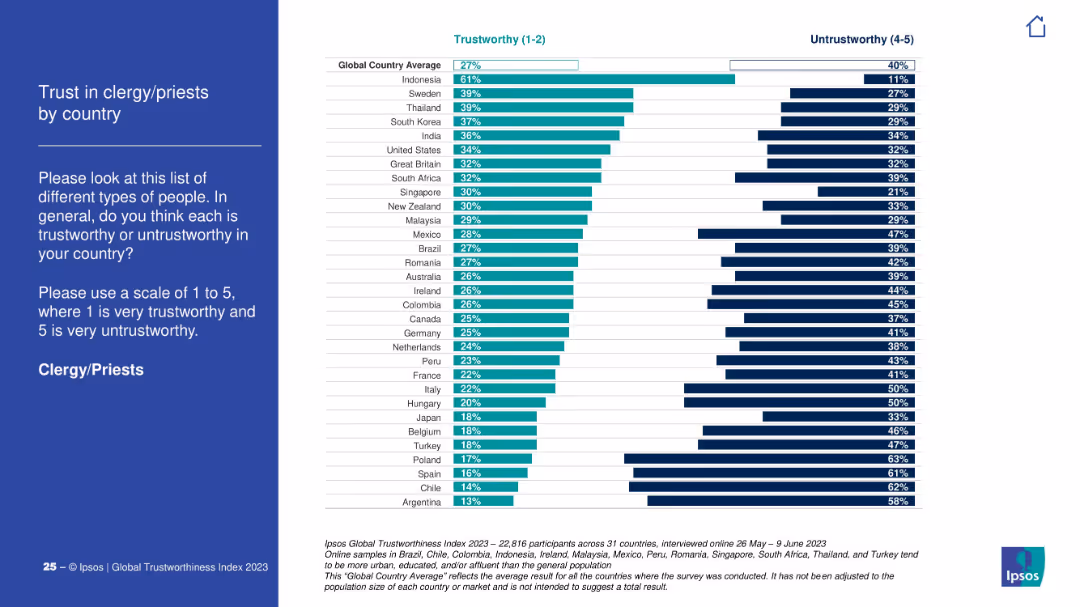
Classic Ipsos format with white-on-blue text left and bar chart right showing perceptions of clergy/priests across 31 countries.
Risk Assessment and Management
Government & Public Sector
This slide presents the trust index for clergy/priests. Indonesia leads in perceived trustworthiness; Argentina and Chile score lowest with high distrust levels.
clergy, religion, public trust, priest, faith, Ipsos, bar chart, 2023
false
Risk Assessment and Management
Government & Public Sector
Mixed Chart
IPSOS
Add to my slides
Remove from favorites
Slide has a large title at the top with a blue background. It features three sets of column charts with vertical bars, comparative financial data points for different years, and textual annotations providing insights on revenue, EPS, and ROTE.
Market Analysis and Trends
Financial Services
This slide showcases year-to-date performance with a focus on revenue, earnings per share, and return on tangible equity. Annotations provide context to the data, emphasizing increased client activity and market share growth. It's suitable for business reviews and strategic meetings.
client activity, market share, revenue, EPS, ROTE, performance analysis, financial comparison, growth strategy, year-to-date, business review
false
Market Analysis and Trends
Financial Services
Multiple Chart
Goldman Sachs
Add to my slides
Remove from favorites
Step-by-step bars showing current to future growth in client assets with a goal of $10Tn. Uses blue highlights and a dotted line to indicate the pathway.
Strategic Planning
Financial Services
Depicts Morgan Stanley's strategic goal for client asset growth, presenting a roadmap to reach a $10 trillion long-term target.
Client assets, growth strategy, long-term goals, Morgan Stanley, $10Tn, strategic roadmap, wealth management
false
Strategic Planning
Financial Services
Single Chart
Goldman Sachs
Add to my slides
Remove from favorites
This slide presents a pie chart illustrating client asset distribution and column chart depicting lending penetration in the U.S. and internationally. Visual elements are neatly segmented for clarity.
Investment Analysis
Financial Services
This slide discusses leveraging existing client relationships to deepen lending penetration and manage a greater share of client assets, with data supporting the potential in UHNW and HNW asset categories.
client assets, lending penetration, UHNW, HNW, strategy
false
Investment Analysis
Financial Services
Multiple Chart
Goldman Sachs
Add to my slides
Remove from favorites
Three pie charts depict the composition of IBKR’s client base, commissions, and client equity.
Client Case Studies
Financial Services
Exhibits the diversity of IBKR’s client base and revenue sources, using pie charts to show the distribution of accounts, commissions, and equity.
Client Base, Interactive Brokers, Commissions, Client Equity, Pie Charts, Diversification, Revenue Sources, Market Segments
false
Client Case Studies
Financial Services
Multiple Chart
Goldman Sachs
Add to my slides
Remove from favorites
Two sections feature a ranking table and a line graph, showing the firm's market positioning and share growth with blue and grey shades.
Market Analysis and Trends
Financial Services
The slide compares the firm's current market position with growth potential, indicating areas for client base expansion and ranking improvements.
client base, market position, equities, FICC, market share, growth potential, competitive ranking, Goldman Sachs
false
Market Analysis and Trends
Financial Services
Multiple Chart
Goldman Sachs
Add to my slides
Remove from favorites
The slide showcases multiple column charts representing various financial metrics over time, with a clear labeling system and visual cues for easy interpretation.
Financial Performance
Financial Services
This slide offers insight into the robustness of the client business, with operating income and client numbers trends. The depiction of regulatory capital also illustrates the financial health and compliance of the division, serving as a basis for analyzing market stability and growth potential.
client business, operating income, regulatory capital, market analysis, financial health, trends
false
Financial Performance
Financial Services
Multiple Chart
Morgan Stanley
Add to my slides
Remove from favorites
Multiple column charts with detailed legends and explanatory text.
Operational Efficiency
Financial Services
This slide delves into the operating income sources and client numbers, emphasizing the strength of client business and regulatory capital. It is crafted for operational reviews and efficiency assessments, aiming to provide insights into business health and regulatory compliance.
client business, operational, income, regulatory
false
Operational Efficiency
Financial Services
Multiple Chart
Morgan Stanley
Add to my slides
Remove from favorites
The slide features three vertical column charts comparing net new money, deposits in wealth management, and deposits in Swiss businesses.
Financial Performance
Financial Services
This slide presents data on client confidence, showcasing net new money and deposits across various sectors in Q3 2023.
client confidence, net new money, wealth management, Swiss businesses, deposits
false
Financial Performance
Financial Services
Multiple Chart
UBS
Add to my slides
Remove from favorites
Contains a circular flow diagram illustrating various aspects of client coverage, such as market insights and workflow optimization, accompanied by icons and a key indicating outcomes like client satisfaction.
Strategic Planning
Financial Services
Depicts the strategy and analytics used in client coverage teams for performance improvement.
Client, coverage, analytics, market, training, insights, performance, banking, strategy
false
Strategic Planning
Financial Services
Diagram
JP Morgan
Add to my slides
Remove from favorites
Features a central hub-and-spoke diagram linking various strategies and tools aimed at enhancing client coverage, surrounded by relevant data points.
Operational Efficiency
Financial Services
Discusses the development and enhancement of JPMorgan’s client coverage team, emphasizing training, tools, and insights that lead to increased productivity and market understanding.
Client Coverage, Training, Productivity, Banking, Tools, Insights, Market Understanding
false
Operational Efficiency
Financial Services
Framework
JP Morgan
Add to my slides
Remove from favorites
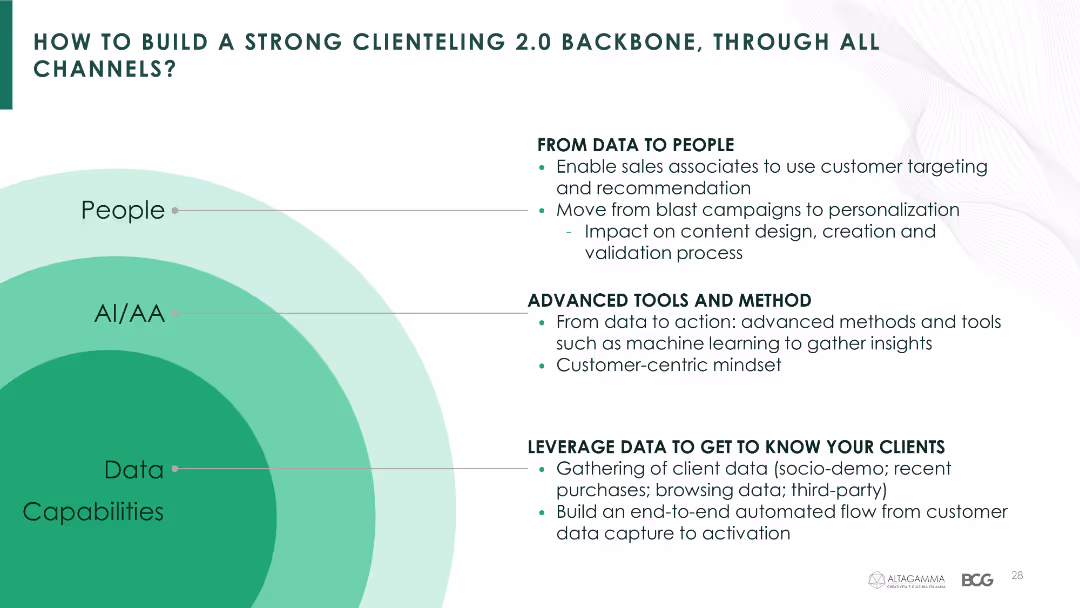
This slide uses a layered diagram with sections labeled 'People', 'AI/AA', and 'Data Capabilities' to illustrate the components of clienteling.
Strategic Planning
Retail & E-commerce
The slide explains how to build a clienteling backbone using data, advanced tools, and personalized recommendations, aimed at improving customer relationships across channels.
Clienteling, data, AI, recommendations, tools, customer-centric, insights, personalization, engagement
false
Strategic Planning
Retail & E-commerce
Diagram
BCG
Add to my slides
Remove from favorites
This slide features a doughnut chart and a pie chart, with a significant amount of textual information in bullet points. The color scheme is blue and white, and the design is sleek and corporate.
Customer and Market Segmentation
Financial Services
The slide focuses on the engagement levels of Chase's primary business banking clients, illustrating satisfaction rates and product adoption. It’s meant to emphasize the bank's success in maintaining client relationships and fostering loyalty.
Client engagement, Business banking, Chase, Satisfaction rate, Loyalty, Product adoption, Relationship management, Market segmentation
false
Customer and Market Segmentation
Financial Services
Mixed Chart
JP Morgan
Add to my slides
Remove from favorites
The slide is segmented into two vertical sections, each with blue-toned headers and a list of bullet points with subtext. It features no charts or graphs but uses bold text and strategic use of whitespace for emphasis.
Client Case Studies
Financial Services
This slide provides insights into client engagement and execution metrics, highlighting increased digital engagement and robust trading volumes. It might be used in stakeholder meetings to discuss client relationship management.
client engagement, digital engagement, trading volumes, risk intermediation, asset inflows, customer service, disruption management, Goldman Sachs, performance metrics
false
Client Case Studies
Financial Services
Table
Goldman Sachs
Add to my slides
Remove from favorites
This slide features a series of bar charts evaluating energy and power portfolios based on CTF scores, alongside a comprehensive text breakdown of Barclays' client engagement strategies in transitioning to lower-emission operations.
Client Case Studies
Financial Services
Describes how Barclays assesses and engages with clients on their ESG performance using the Client Transition Framework, offering insights into sector-specific transition plans and executive engagement.
client engagement, ESG performance, transition planning, sector analysis, sustainability, client assessment
false
Client Case Studies
Financial Services
Multiple Chart
Barclays
Add to my slides
Remove from favorites
Includes a column chart with a 1.0 and 1.4 ratio, surrounded by a circular arrow diagram, and includes key performance ranks.
Performance Metrics and KPIs
Financial Services
Emphasizes the franchise collaboration model's success and its impact on generating additional revenue from clients.
Client Experience, Collaboration, Revenue Growth, IB Corporate Clients, Multiplier Effect
false
Performance Metrics and KPIs
Financial Services
Single Chart
JP Morgan
Add to my slides
Remove from favorites
Contains a circular diagram with icons representing the firm's strengths, supplemented by text descriptions around the diagram's perimeter.
Strategic Planning
Financial Services
Articulates the unique position of the firm to support clients with their strengths, emphasizing on client experience.
Client Experience, Differentiation, Talent, Balance Sheet, Innovation, Strategic Integration
false
Strategic Planning
Financial Services
Linear Flow
JP Morgan
Add to my slides
Remove from favorites
A flow diagram compares the client experience before and after optimization, alongside future digital interface plans.
Operational Efficiency
Financial Services
Illustrates the evolution of client experience from multiple contacts to a streamlined, digital, client-aligned global markets process.
client experience, digital transformation, global markets, trade lifecycle, operational efficiency, process optimization
false
Operational Efficiency
Financial Services
Linear Flow
Goldman Sachs
Add to my slides
Remove from favorites
The slide contains a considerable amount of text in two columns, accented by two images in the top corners. The design utilizes bullet points and bolding to emphasize key messages.
Customer and Market Segmentation
Financial Services
Describing the bank's client-focused strategies, the slide elaborates on the methods used to enhance client experiences, including feedback mechanisms and human-centered design principles. It aims to demonstrate the bank's commitment to improving customer service and resolving issues.
client experience, feedback, human-centered design, customer service, improvement, strategy
false
Customer and Market Segmentation
Financial Services
Header Vertical
Morgan Stanley
Add to my slides
Remove from favorites
A horizontal process diagram illustrates the client experience from solutioning through onboarding, lending, servicing, to content delivery, complemented by performance and efficiency icons.
Operational Efficiency
Financial Services
Focuses on operational excellence and client experience through various banking services.
Client, experience, KYC, lending, servicing, operational, excellence, onboarding, banking
false
Operational Efficiency
Financial Services
Linear Flow
JP Morgan
Add to my slides
Remove from favorites
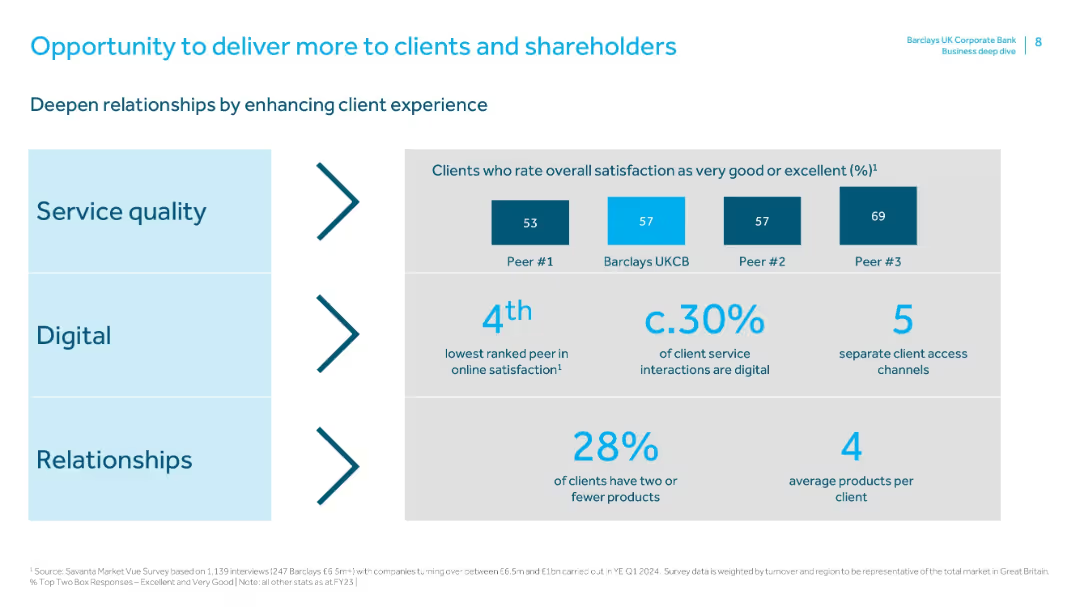
A three-row layout split into “Service quality,” “Digital,” and “Relationships,” each with related statistics. Includes peer comparisons and digital channel metrics.
Customer and Market Segmentation
Financial Services
This slide emphasizes enhancing client experience to strengthen relationships. It compares Barclays’ service quality with peers, highlights digital adoption (30%), and product engagement levels. Insights support upselling and loyalty efforts.
client experience, service quality, digital adoption, customer segmentation, product usage, peer comparison, satisfaction metrics
false
Customer and Market Segmentation
Financial Services
Mixed Chart
Barclays
Add to my slides
Remove from favorites
This slide features two bar charts: one shows primary motivators for implementing GenAI technologies, and the other shows expected changes in firms' ways of working. Text explanations are provided for survey responses.
Technology and Digital Transformation
Financial Services
The slide presents survey data on why firms are motivated to implement Generative AI. It focuses on enhancing client experience, task automation, cost reduction, and improving decision-making.
client experience, task automation, cost reduction, decision-making, GenAI, motivators, survey, implementation
false
Technology and Digital Transformation
Financial Services
Multiple Chart
EY
Add to my slides
Remove from favorites
Bar chart comparing top client-facing use cases for retail and commercial banks.
Customer and Market Segmentation
Financial Services
Highlights top client-facing use cases, emphasizing cross-selling and personalized advertising for both retail and commercial banks.
client-facing, retail, commercial, banks, use cases
false
Customer and Market Segmentation
Financial Services
Multiple Chart
EY
Add to my slides
Remove from favorites
Central diamond-shaped diagram with four quadrants, each labeling a business division, paired with a side panel listing client types.
Financial Performance
Financial Services
Highlights the company's comprehensive approach to client services across different business divisions, aligning with strategic client management.
Client Focus, Goldman Sachs, Business Divisions, Client Services, Strategy, Diagram
false
Financial Performance
Financial Services
Framework
Goldman Sachs
Add to my slides
Remove from favorites
The slide presents a simple two-column comparison of actions and future directions with respect to the client franchise in FICC and Equities. A dark theme with white and blue text highlights the top 100 clients' attributes and planned actions.
Sales and Business Development
Financial Services
It discusses strategies for strengthening client relationships in FICC and Equities, appropriate for discussions on client management and business development.
Client franchise, FICC, Equities, growth plan
false
Sales and Business Development
Financial Services
Table
Goldman Sachs
Add to my slides
Remove from favorites
Features a central circular graphic, with color coding to differentiate segments. The design is clear and emphasizes market share growth and key metrics, with distinct sections for clarity.
Strategic Planning
Financial Services
The slide illustrates Goldman Sachs’ market share growth and key growth initiatives within their client franchise. It is useful for strategic presentations or investor relations, showcasing performance and outlining strategic goals.
client franchise, market share, growth, Goldman Sachs, investment banking, global markets
false
Strategic Planning
Financial Services
Framework
Goldman Sachs
Add to my slides
Remove from favorites
Slide features a four-section comparison with icons, lists, and a color-coded column chart showing revenue.
Market Analysis and Trends
Financial Services
Highlights the strengths of different client franchises and their market leadership positions.
Client franchises, community banking, investment bank, asset management, revenue
false
Market Analysis and Trends
Financial Services
Mixed Chart
JP Morgan
Add to my slides
Remove from favorites
Displays a dual-axis column chart tracking client numbers and a bar chart reflecting a finance portfolio. The slide uses contrasting colors to distinguish different segments and time periods. Annotations and titles are neatly organized for legibility.
Market Analysis and Trends
Financial Services
This slide depicts the growth in client base for Commodities and Global Markets and details the Specialised and Asset Finance portfolio, useful for trend analysis and customer base evaluation in financial services.
client growth, commodities, finance, portfolio, trend analysis, financial services, asset finance, market analysis
false
Market Analysis and Trends
Financial Services
Multiple Chart
Goldman Sachs
Add to my slides
Remove from favorites
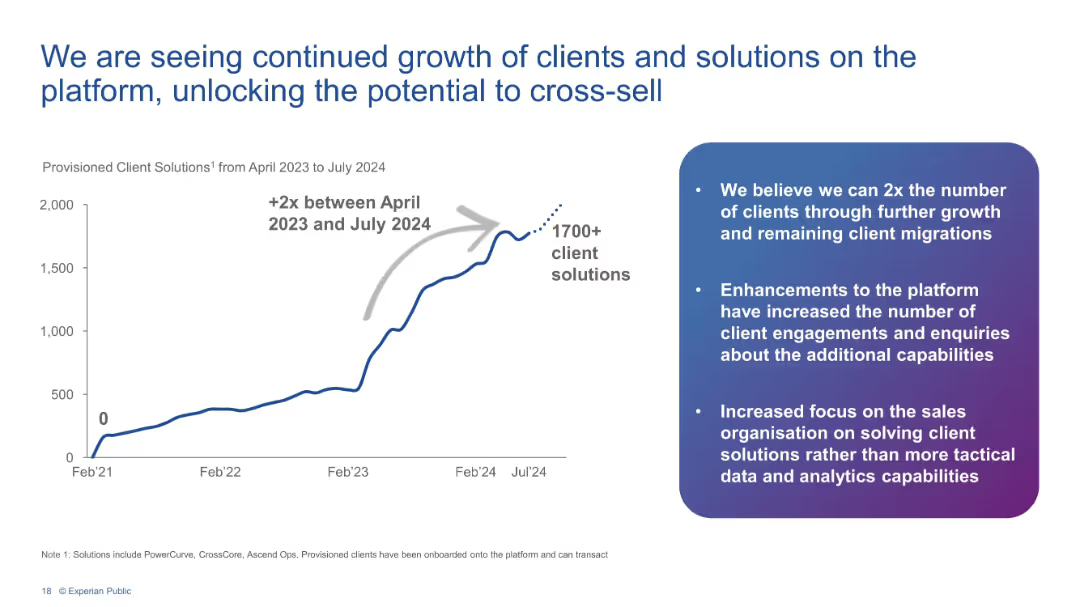
Line chart showing 2x growth in client solutions from Apr 2023 to Jul 2024 with bulleted insights.
Performance Metrics and KPIs
Financial Services
Depicts a sharp increase in provisioned client solutions to over 1700, doubling since April 2023. Accompanying text explains platform enhancements, client engagement growth, and cross-sell opportunities.
client growth, platform, Experian, KPIs, cross-sell, analytics, solutions, engagement
false
Performance Metrics and KPIs
Financial Services
Mixed Chart
Barclays
Add to my slides
Remove from favorites
The slide includes pie charts showing revenue mix by region and business for 2022 and 2026. Text outlines medium-term priorities for clients, integration, and productivity, with ambitions for maintaining a 15% RoAE.
Client Case Studies
Financial Services
The slide discusses enhancements in client offerings while maintaining capital discipline. It highlights revenue distribution, strategic priorities in client services, integration, and productivity. This slide can be used to present strategies for improving client services and maintaining financial discipline in investment banking.
client offering, capital discipline, revenue mix, strategic priorities, RoAE
false
Client Case Studies
Financial Services
Multiple Chart
UBS
Add to my slides
Remove from favorites
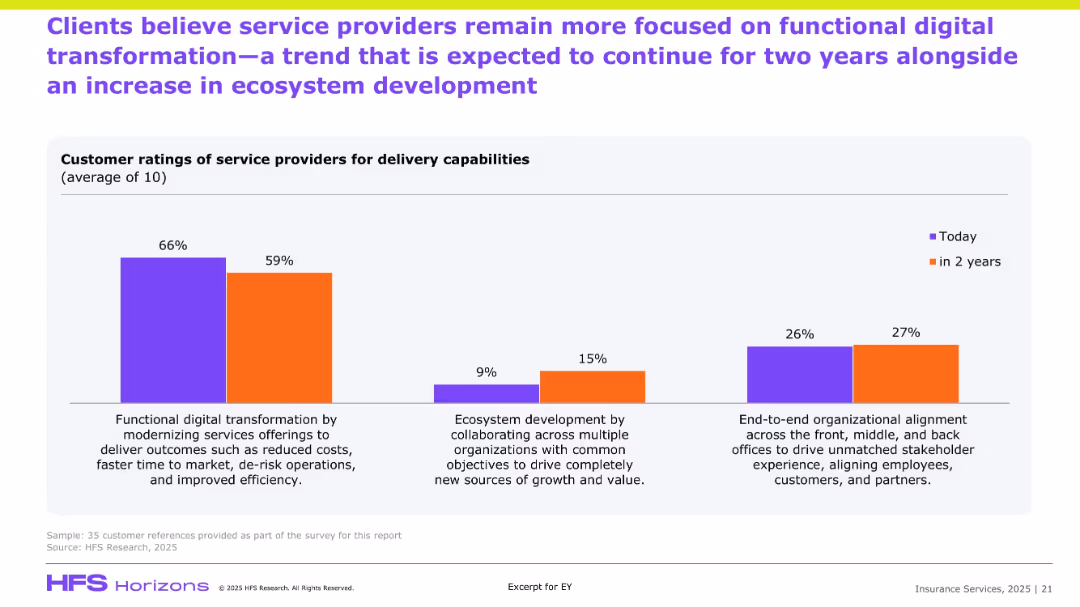
Bar graph comparing “Today” vs “In 2 Years” sentiment; three focus areas; explanatory text at bottom.
Customer and Market Segmentation
Financial Services
The slide presents survey data on clients’ current and expected focus areas for service providers. The data shows a shift from heavy focus on functional digital transformation to increased attention on ecosystem development and organizational alignment. It captures client sentiment on the delivery capabilities expected over the next two years.
Client ratings, delivery, transformation, ecosystem, efficiency, stakeholder alignment
false
Customer and Market Segmentation
Financial Services
Single Chart
EY
Add to my slides
Remove from favorites
This introductory slide features a circular diagram with four segments around a central label 'Clients', designed with shades of blue and black. Brief texts accompany icons symbolizing trust, client-centricity, and global reach.
Organizational Structure and Change
Financial Services
Introduces the company's focus on client relationships and outlines the core areas of service. It sets the stage for discussions on company values, structure, or strategic direction.
Client Relations, Core Services, Company Values
false
Organizational Structure and Change
Financial Services
Framework
Goldman Sachs
Add to my slides
Remove from favorites
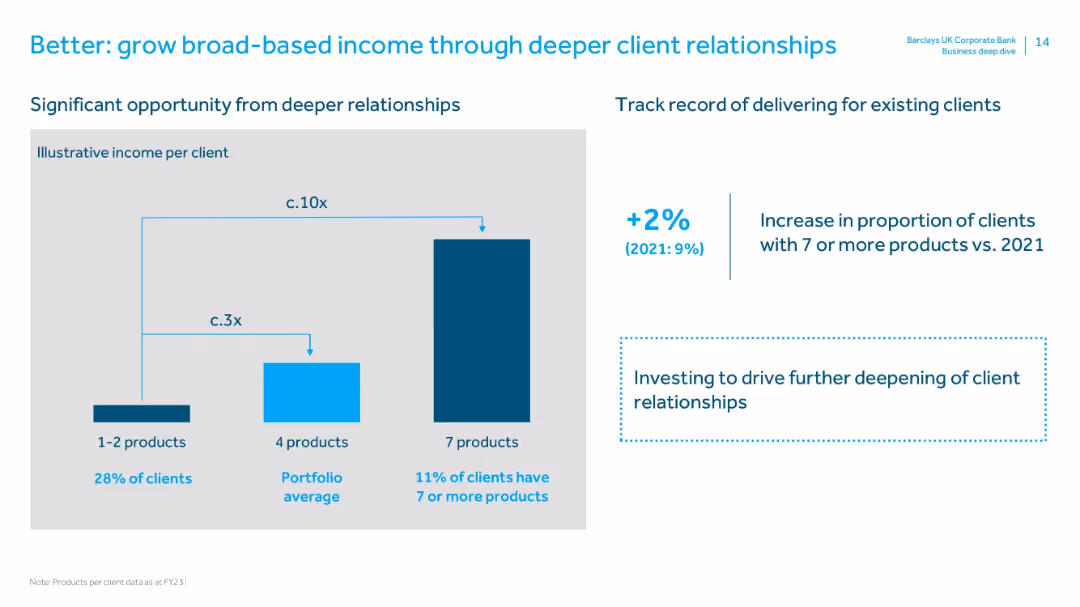
Bar chart showing income potential by number of products per client. Text on right quantifies change in clients with 7+ products.
Strategic Planning
Financial Services
Demonstrates income growth potential by increasing client product holdings. Clients with 7+ products yield 10x income versus those with 1–2. Barclays aims to deepen relationships and shows a 2% rise in multi-product clients since 2021.
client relationships, cross-selling, income growth, product holding, strategic planning, client engagement, portfolio analysis
false
Strategic Planning
Financial Services
Mixed Chart
Barclays
Add to my slides
Remove from favorites
Features a combination of textual content and simple graphics to illustrate Barclays' strategies for deepening client relationships and expanding services.
Client Case Studies
Financial Services
Focuses on Barclays' strategies for revenue growth through enhanced client relations, detailing initiatives like hiring in key regions, expanding digital and sustainable offerings, and investing in data capabilities.
client relationships, growth, digital, sustainability
false
Client Case Studies
Financial Services
Linear Flow
Barclays
Add to my slides
Remove from favorites
Column charts, detailing client relationship data.
Strategic Planning
Financial Services
Discusses improvement in client share and ranking in global financial markets.
Client Relationships, Market Ranking, Financial Markets, Improvement, Analysis
false
Strategic Planning
Financial Services
Multiple Chart
Barclays
Add to my slides
Remove from favorites
Combines textual content with icons that highlight different aspects of asset management. The visual elements are arranged for easy reading, focusing on client outcomes and strategic growth areas.
Client Case Studies
Financial Services
Explains the asset management wing's strategies for ensuring strong client outcomes and sustainable growth, supported by high retention and investment rates.
client retention, asset management, investment performance, client centric, digital growth, global expansion
false
Client Case Studies
Financial Services
Pillar
JP Morgan
Add to my slides
Remove from favorites
The slide has a bar chart showing client retention rate, and two pie charts displaying revenue distribution by clients and by country and region.
Client Case Studies
Professional Services
This slide highlights the high client retention rate (>99%) and the distribution of revenue by client and geography for the year 2022.
Client retention, revenue, pie chart, bar chart, geography
false
Client Case Studies
Professional Services
Multiple Chart
IPSOS
Add to my slides
Remove from favorites
The slide has a column chart displaying US client satisfaction scores from 2019 to 2021, with a testimonial quote from a top US tech player.
Client Case Studies
Professional Services
It highlights client satisfaction scores over three years, emphasizing the positive impact of Ipsos's work on client relationships and growth.
client satisfaction, growth, Ipsos, impact, scores
false
Client Case Studies
Professional Services
Mixed Chart
IPSOS
Add to my slides
Remove from favorites
The slide presents text boxes with services offered, such as managing investments and navigating financial markets, paired with simple icons.
Client Case Studies
Professional Services
It showcases the range of client services provided, likely for marketing or sales presentations.
Client Services, Investments, Financial Markets, Mortgage, Insurance, Super Funds, Advice
false
Client Case Studies
Professional Services
Boxed
Goldman Sachs
Add to my slides
Remove from favorites
Slide with title, with an arrow, and three sections of text outlining the initial phase, client feedback, and the forward plan for expanding client relationships.
Strategic Planning
Financial Services
Showcases the strategic plan to enhance client service by identifying complex needs, gathering feedback, and planning for client expansion, supported by dedicated professionals.
Client Service, Strategic Plan, Feedback, Expansion, Professional Support
false
Strategic Planning
Financial Services
Linear Flow
Goldman Sachs
Add to my slides
Remove from favorites
This slide presents lists and bullet points describing the company's clients and industry partners, with a straightforward text-based layout.
Competitive Landscape
Financial Services
Showcases the company's client base and industry partners, highlighting collaborative relationships and support for top mining companies. This slide is useful for building credibility and showcasing the company's market position.
clients, industry partners, mining, collaboration, top companies, drilling contractors
false
Competitive Landscape
Financial Services
Header Vertical
Morgan Stanley
Add to my slides
Remove from favorites
Uses a vertical flow diagram to depict the integration and enhancements in client solutions, with emphasis on digital transformation and payment solutions.
Technology and Digital Transformation
Financial Services
Describes JPMorgan’s initiatives to adapt and expand its client solutions, focusing on digital platforms like InstaMed and payment optimization, aimed at enhancing client engagement and satisfaction.
Client Solutions, Digital Transformation, Payments, Innovation, Engagement, Satisfaction
false
Technology and Digital Transformation
Financial Services
Header Horizontal
JP Morgan
Add to my slides
Remove from favorites
The slide shows a scatter plot of service lines and markets for top 20 clients.
Client Case Studies
Professional Services
The slide demonstrates how large clients rely on Ipsos' cross-country and cross-sector expertise.
clients, service lines, markets, expertise, Ipsos, top 20
false
Client Case Studies
Professional Services
Single Chart
IPSOS
Add to my slides
Remove from favorites
This slide contains a growth path diagram with icons representing different services, accompanied by descriptive bullet points. The blue and white color scheme is consistent and professional.
Operational Efficiency
Financial Services
Illustrates a range of financial services that support client growth, perfect for presentations emphasizing comprehensive support and operational efficiency in banking services.
client support, growth, financial services, operational efficiency, banking
false
Operational Efficiency
Financial Services
Linear Flow
JP Morgan
Add to my slides
Remove from favorites
Featuring pie charts and a column chart, this slide focuses on client transaction frequencies and wallet composition across fee sizes.
Client Case Studies
Financial Services
The slide assesses the frequency of large episodic transactions for clients and the annual wallet composition by transaction size.
Client Transactions, Frequency, Pie Chart, Wallet Composition, Episodic Transactions, Fee Size, Financial Services
false
Client Case Studies
Financial Services
Multiple Chart
JP Morgan
Add to my slides
Remove from favorites
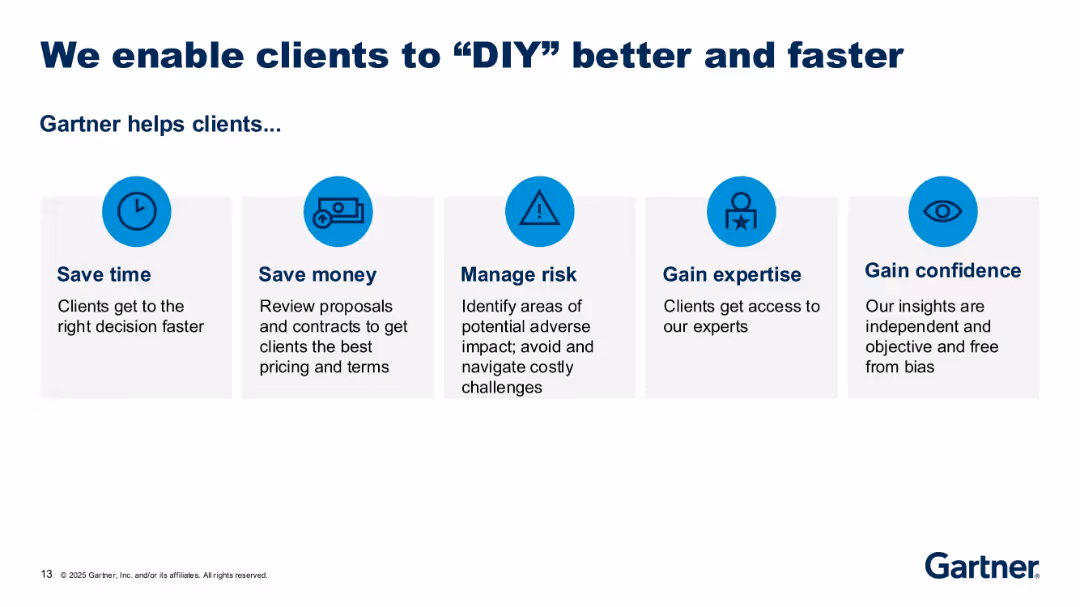
Row of five icon-based value propositions with brief descriptions underneath; consistent blue-themed layout.
Product and Service Analysis
Technology & Software
This slide outlines the key benefits Gartner delivers to clients, such as saving time and money, managing risk, and gaining confidence and expertise. Each benefit is visually represented by an icon and short explanatory text.
client value, Gartner, benefits, expertise, savings, decision-making
false
Product and Service Analysis
Technology & Software
Pillar
Gartner
Add to my slides
Remove from favorites
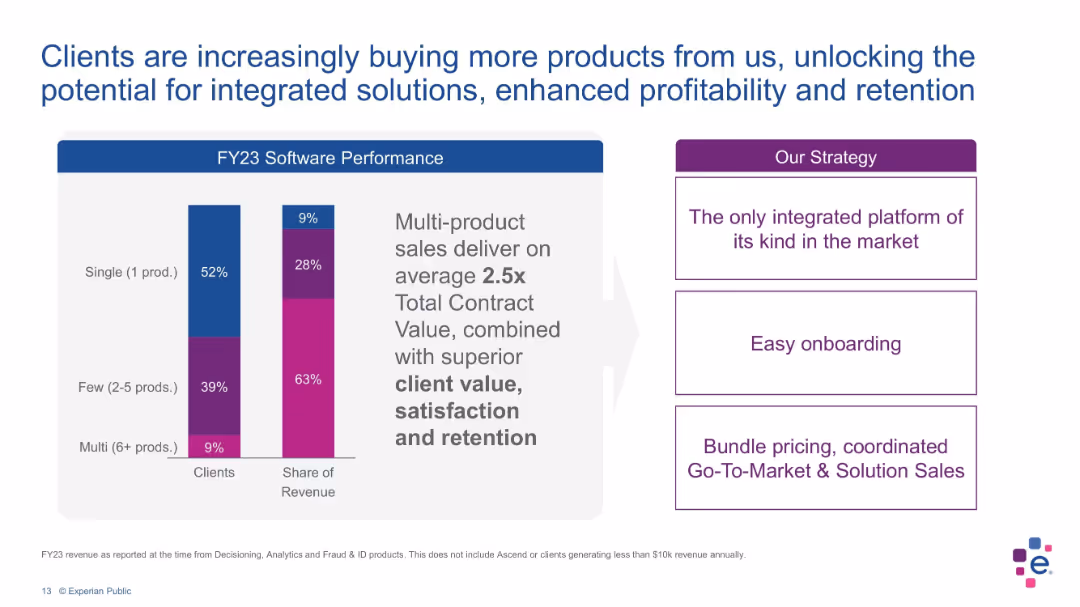
Split layout with bar chart and strategy boxes, using blue and purple tones
Sales and Business Development
Technology & Software
The slide shows how clients purchasing multiple products lead to higher revenue shares and better retention. It highlights FY23 software performance metrics, average contract value, and strategic pillars like bundling and easy onboarding.
client value, revenue, software, retention, bundling, FY23, strategy
false
Sales and Business Development
Technology & Software
Mixed Chart
Barclays
Add to my slides
Remove from favorites
Vertical bar chart comparing countries by agreement/disagreement on climate action by businesses. Text block on left; chart dominates right.
Strategic Planning
Environmental Services & Sustainability
This slide visualizes international public opinion on whether businesses should take immediate climate action or risk failing employees and customers. The chart ranks agreement by country, showing variation in expectations and urgency.
climate action, businesses, employees, customers, international comparison, Ipsos, public opinion, sustainability, responsibility, Earth Day
false
Strategic Planning
Environmental Services & Sustainability
Mixed Chart
IPSOS
Add to my slides
Remove from favorites
Includes icons, a bar chart, and comprehensive text to explain the data. Color scheme includes shades of green and blue.
Regulatory and Compliance
Environmental Services & Sustainability
Surveys CXO attitudes towards climate change and action, showing both personal impact and corporate responses.
Climate action, CXO views, corporate response, personal impact
false
Regulatory and Compliance
Environmental Services & Sustainability
Multiple Chart
Deloitte
Add to my slides
Remove from favorites
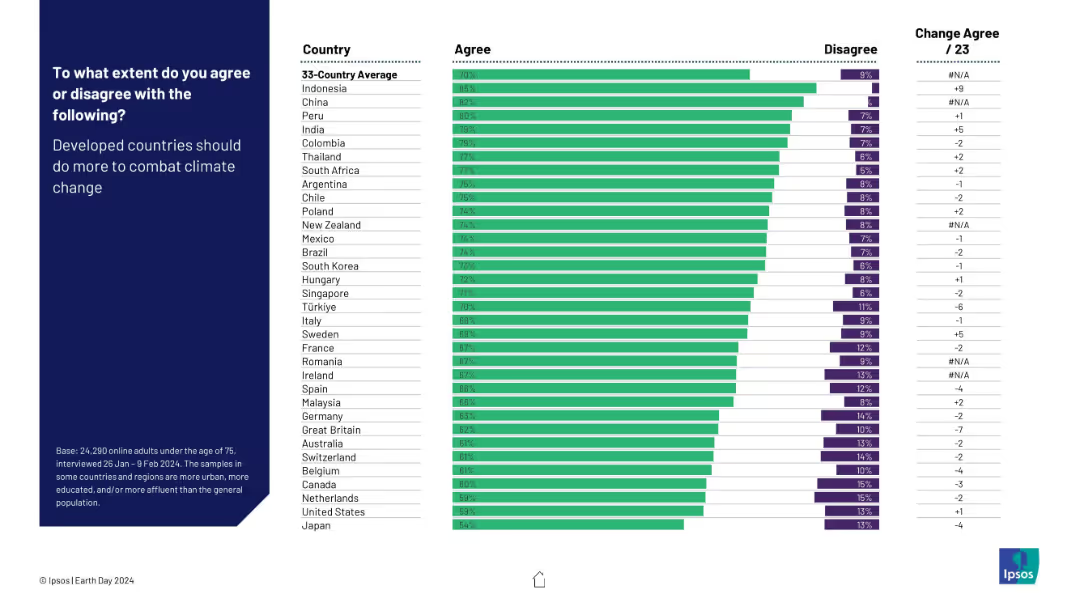
Horizontal bar chart of countries’ agreement that developed countries should do more to combat climate change. Shows agreement levels and year-over-year change.
Strategic Planning
Environmental Services & Sustainability
This slide highlights global demand for developed nations to increase their efforts in fighting climate change. Agreement is especially high in China, Peru, and Colombia, indicating a sense of unmet responsibility by wealthier countries.
climate action, developed nations, global responsibility, public sentiment, environmental urgency, international pressure, Ipsos, Earth Day
false
Strategic Planning
Environmental Services & Sustainability
Mixed Chart
IPSOS
Add to my slides
Remove from favorites
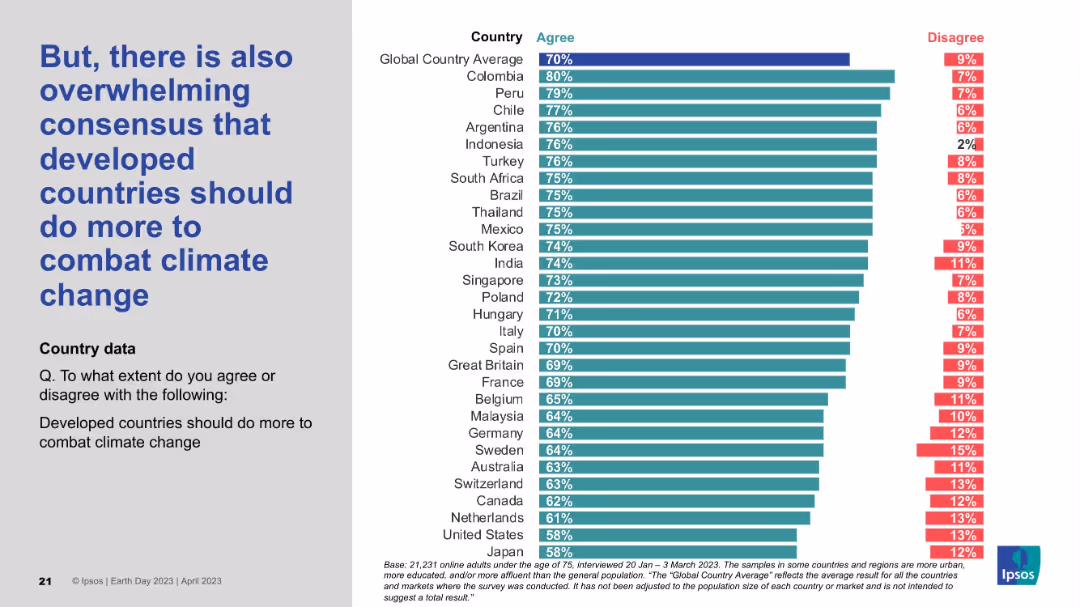
Left-side statement in bold blue; right side is a ranked horizontal bar chart by country with percentage agreement and disagreement.
Strategic Planning
Environmental Services & Sustainability
This slide highlights a strong international consensus that developed countries should take more proactive steps to address climate change. Most countries reflect agreement levels well above the global average, underscoring expectations for greater developed-world leadership.
climate action, developed nations, responsibility, global consensus, policy pressure, survey data, Earth Day 2023
false
Strategic Planning
Environmental Services & Sustainability
Mixed Chart
IPSOS
Add to my slides
Remove from favorites
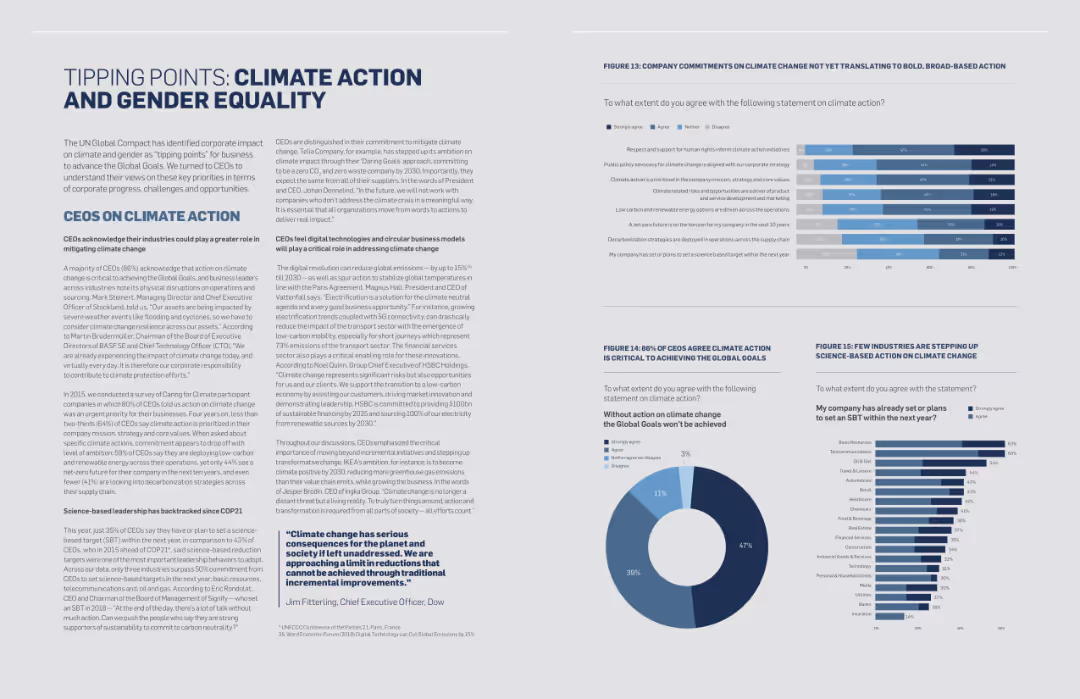
The slide contains text and several column charts depicting survey data on climate action and gender equality. Quotes from CEOs are also included.
Regulatory and Compliance
Environmental Services & Sustainability
The slide addresses the critical points of climate action and gender equality, presenting survey data and CEO quotes to highlight the importance of these issues for sustainable development.
Climate Action, Gender Equality, Sustainability, Survey Data, CEO Quotes, Regulatory Compliance
false
Regulatory and Compliance
Environmental Services & Sustainability
Multiple Chart
Accenture
Add to my slides
Remove from favorites
Horizontal bar chart ranking countries by agreement with government accountability. Green for agree, purple for disagree. Right column shows change since previous years.
Regulatory and Compliance
Environmental Services & Sustainability
This slide ranks countries by agreement that government inaction on climate change would fail its people. Indonesia, Peru, and South Africa top the chart. It underscores strong public demand for urgent governmental action on climate.
climate action, government accountability, global views, public opinion, Ipsos, sustainability, regulation, Earth Day trends
false
Regulatory and Compliance
Environmental Services & Sustainability
Mixed Chart
IPSOS
Add to my slides
Remove from favorites
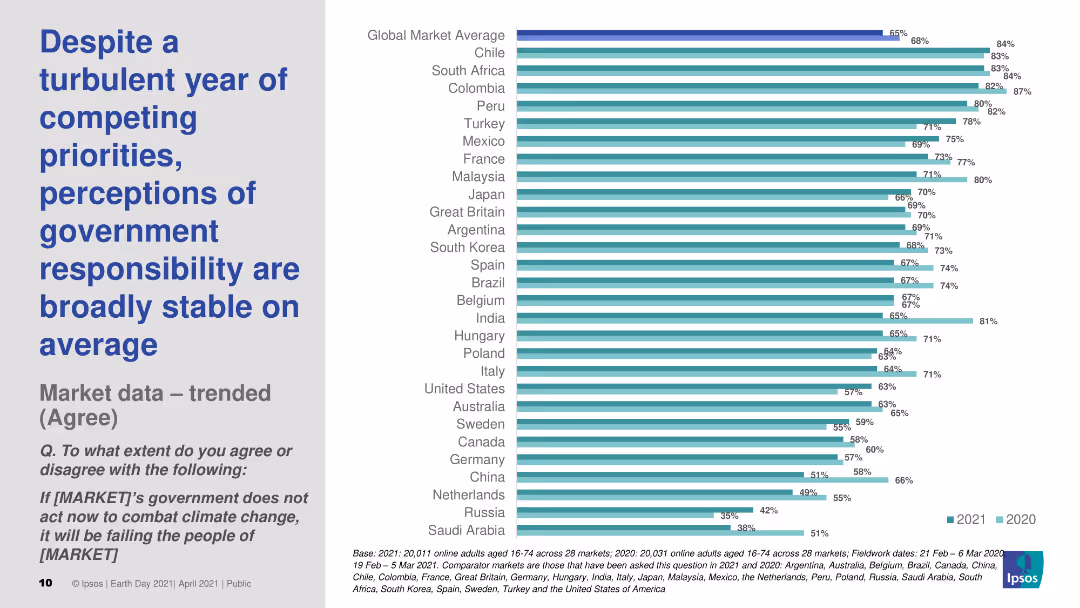
Contains a horizontal bar chart displaying the stability of public perceptions of government responsibility for climate action across multiple markets in 2020 and 2021.
Market Analysis and Trends
Government & Public Sector
Analyzes the stability of public perceptions of government responsibility for climate action despite competing priorities and a turbulent year.
climate action, government, public perception, stability, trends
false
Market Analysis and Trends
Government & Public Sector
Mixed Chart
IPSOS
Add to my slides
Remove from favorites
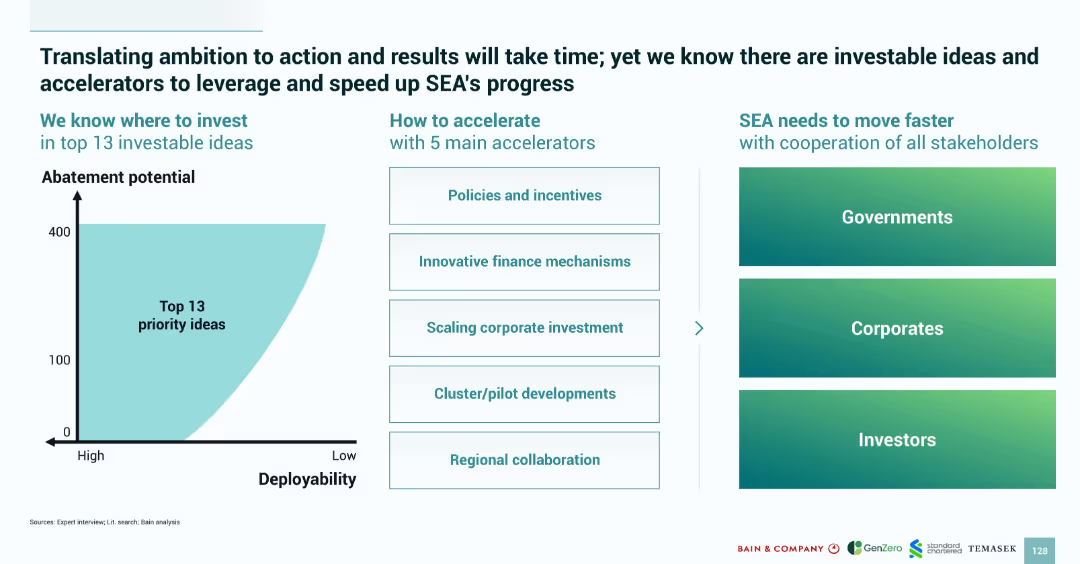
Dual chart layout with a deployability vs abatement potential curve and list of 5 accelerators; includes stakeholder roles
Strategic Planning
Environmental Services & Sustainability
Introduces 13 high-impact climate investment ideas and 5 acceleration levers (e.g., finance, policy, regional action), calling for coordinated effort from governments, corporates, and investors
climate action, investment ideas, policy, finance, collaboration, deployability, abatement, accelerators
false
Strategic Planning
Environmental Services & Sustainability
Mixed Chart
Bain
Add to my slides
Remove from favorites
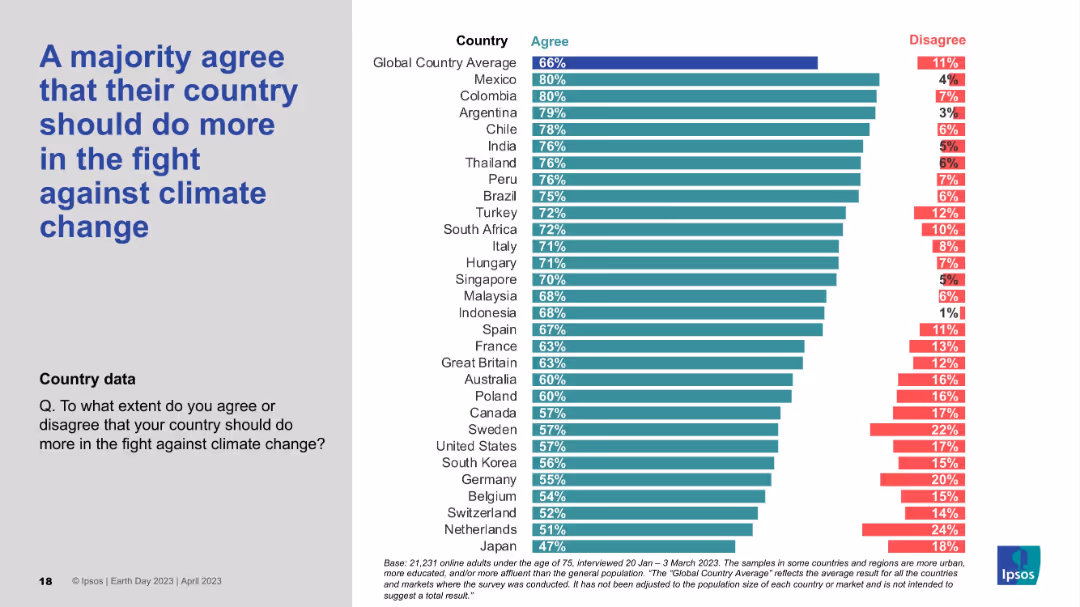
Agreement-disagreement bar chart by country; title on left and list of countries with response percentages on right.
Strategic Planning
Government & Public Sector
This slide captures a strong global consensus that countries should do more in the fight against climate change. Over 66% globally agree, with LATAM countries like Mexico, Colombia, and Argentina showing the highest urgency. Japan and several EU nations show lower agreement.
Climate action, National responsibility, Public opinion, Ipsos, Global urgency
false
Strategic Planning
Government & Public Sector
Mixed Chart
IPSOS
Add to my slides
Remove from favorites
Contains multiple pie charts showing the extent of pressure from various stakeholders on companies to address climate change.
Strategic Planning
Environmental Services & Sustainability
Assesses the pressure levels from stakeholders like regulators, board members, and clients on companies to take action against climate change.
climate action, stakeholders, pressure, strategic planning, regulators, board members, clients, environmental sustainability
false
Strategic Planning
Environmental Services & Sustainability
Multiple Chart
Deloitte
Add to my slides
Remove from favorites
Utilizes split content areas to compare current states and needed actions with visual elements like icons to illustrate points clearly.
Strategic Planning
Environmental Services & Sustainability
Analyzes the gap between current climate actions and the targets set, emphasizing the need for specific plans, governance, and financing to achieve these goals in SEA.
Climate action, strategic planning, SEA, governance, financing
false
Strategic Planning
Environmental Services & Sustainability
Agenda
Bain
Add to my slides
Remove from favorites
Slide is text-heavy with bullet-point recommendations for organizations on climate action. Features three circular green icons, representing different strategies like frameworks, plans, and education.
Strategic Planning
Environmental Services & Sustainability
Provides strategic recommendations for organizations aiming to enhance their environmental sustainability efforts, including planning, education, and framework adoption.
Climate Action, Strategic Recommendations, Sustainability, Organizational Planning, Education, Frameworks
false
Strategic Planning
Environmental Services & Sustainability
Header Vertical
Deloitte
Add to my slides
Remove from favorites
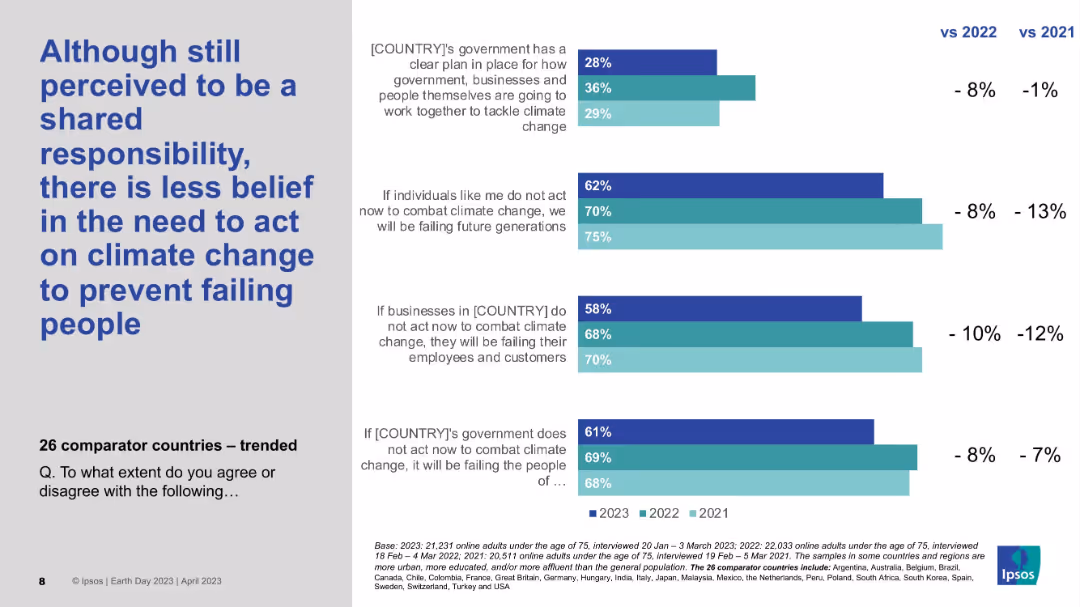
Clustered bar chart with trend lines for 2021–2023; left-aligned bold title; text clarifies survey statements.
Market Analysis and Trends
Environmental Services & Sustainability
Despite remaining a shared responsibility, public belief in urgent action against climate change is declining across years. The chart tracks falling agreement percentages from 2021 to 2023 across individuals, businesses, and governments.
Climate action, Survey trends, Ipsos, Time comparison, Shared responsibility
false
Market Analysis and Trends
Environmental Services & Sustainability
Mixed Chart
IPSOS
Add to my slides
Remove from favorites
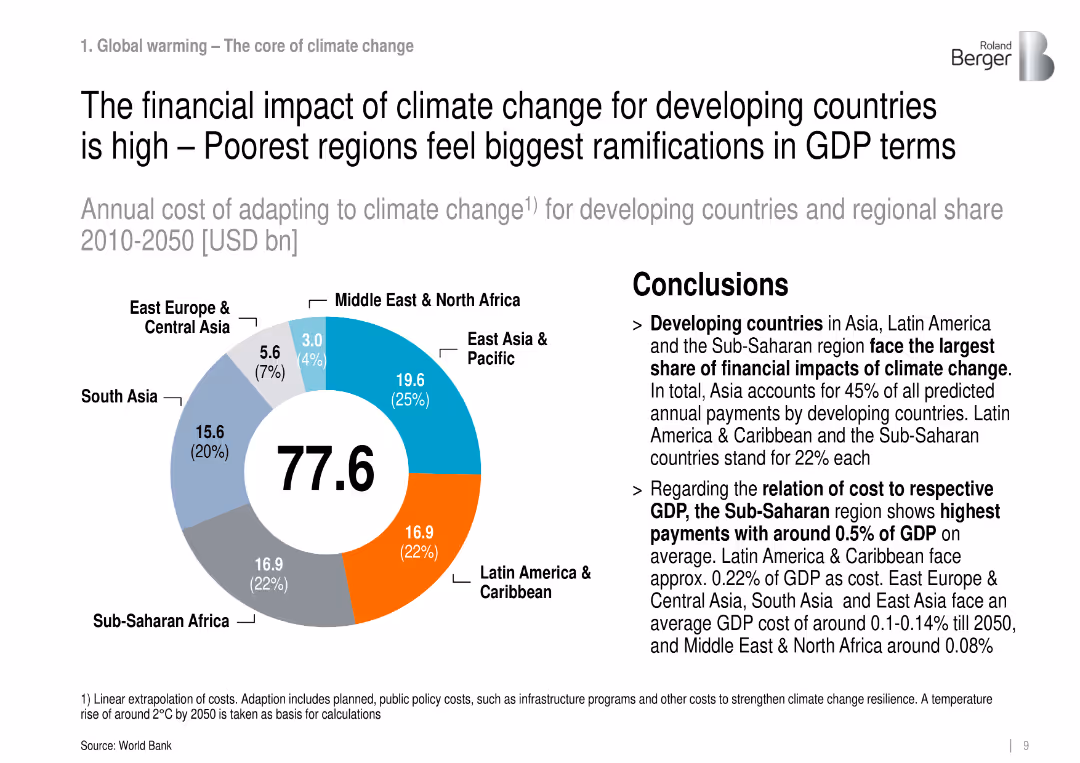
Donut chart showing regional cost distribution of climate change adaptation; key points on GDP impact.
Risk Assessment and Management
Environmental Services & Sustainability
Analyzes the disproportionate GDP cost burden of climate change adaptation on developing countries, especially Sub-Saharan Africa and Asia.
climate adaptation, GDP impact, developing countries, cost distribution
false
Risk Assessment and Management
Environmental Services & Sustainability
Mixed Chart
Roland Berger
Add to my slides
Remove from favorites
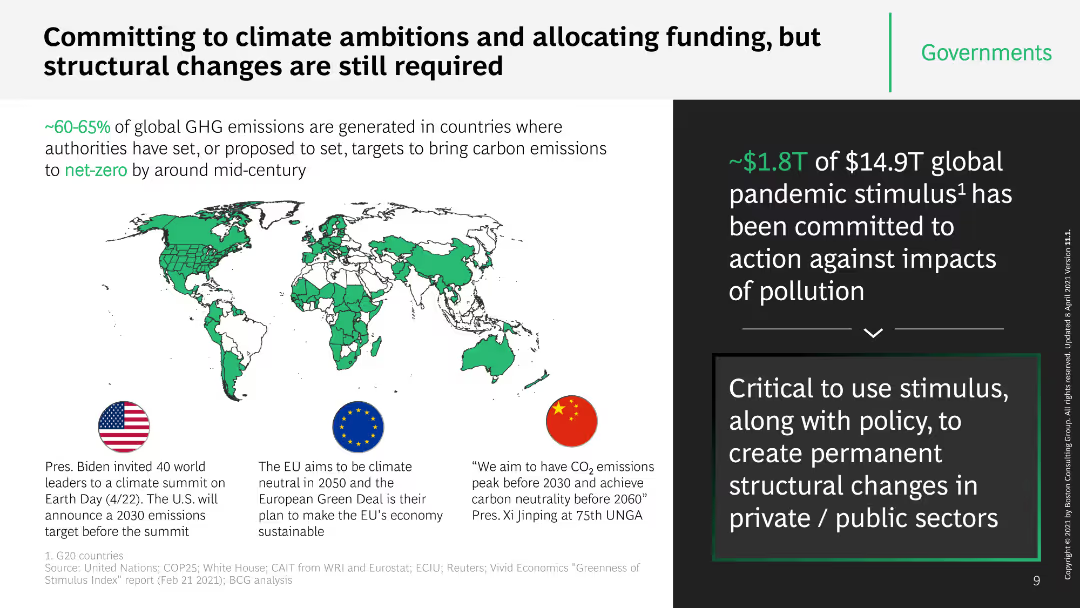
This slide features a world map highlighting countries with climate ambitions, alongside key statistics and text boxes with information on funding commitments. It uses icons and a structured layout to separate different pieces of information.
Strategic Planning
Government & Public Sector
The slide discusses global efforts and commitments to climate ambitions, emphasizing the importance of structural changes and funding allocations. It includes specific examples from the US, EU, and China, and mentions the $1.8T pandemic stimulus.
climate ambitions, funding, global efforts, structural changes, stimulus
false
Strategic Planning
Government & Public Sector
Boxed
BCG
Add to my slides
Remove from favorites
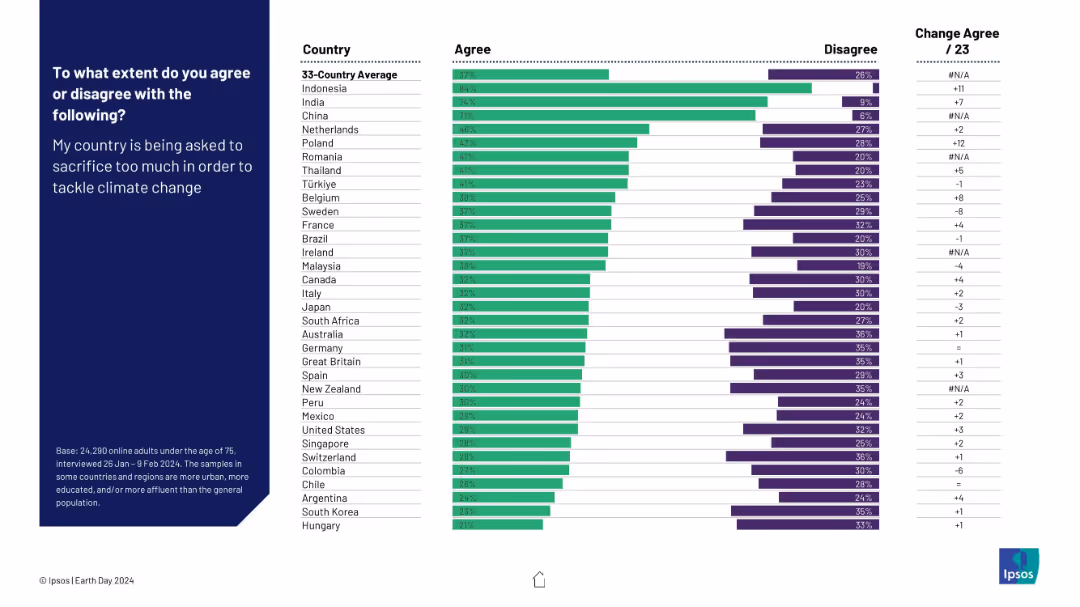
Bar chart comparing country-level agreement and disagreement with the sentiment that their own country is being asked to sacrifice too much for climate action.
Risk Assessment and Management
Environmental Services & Sustainability
This slide reveals the degree to which populations feel their own countries are unfairly burdened in climate action efforts. India and China report the highest levels of agreement, signaling potential resistance or fatigue in contributing more to global climate goals.
climate burden, national sacrifice, public resistance, climate fatigue, equity concerns, international cooperation, Ipsos, Earth Day
false
Risk Assessment and Management
Environmental Services & Sustainability
Mixed Chart
IPSOS
Add to my slides
Remove from favorites
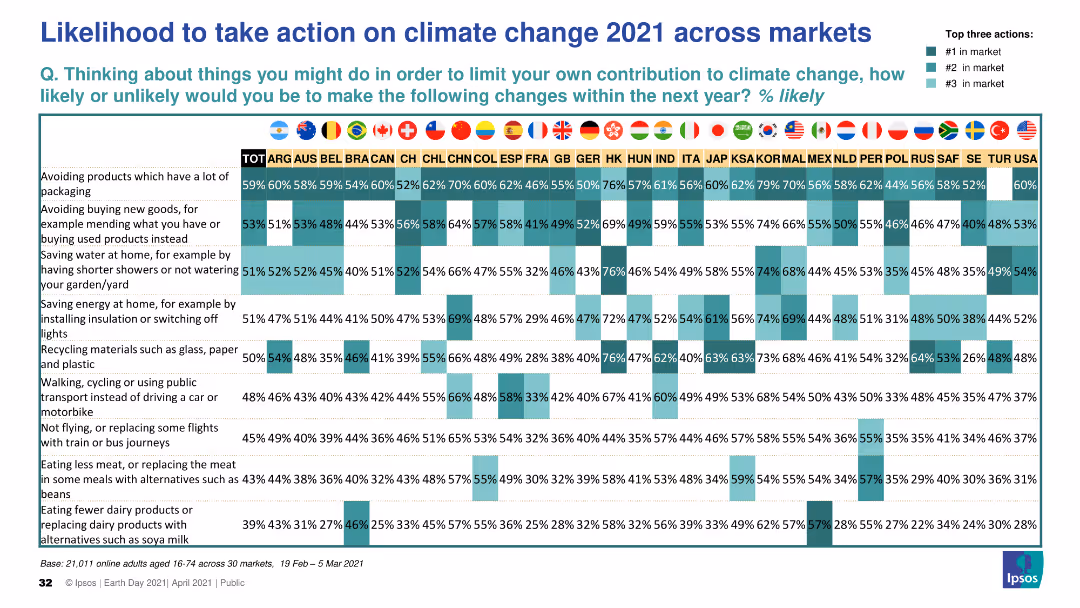
This slide presents a matrix chart displaying the likelihood of taking various climate change actions across multiple global markets in 2021. The chart uses color coding to indicate the likelihood and highlights top three actions per market.
Market Analysis and Trends
Environmental Services & Sustainability
The slide shows a comprehensive comparison of the likelihood of individuals taking specific climate change actions in 2021 across different global markets, with top actions highlighted for each market.
climate change, actions, likelihood, global markets, 2021
false
Market Analysis and Trends
Environmental Services & Sustainability
Table
IPSOS
Add to my slides
Remove from favorites
The slide contains text, an image of a person in nature, and column charts depicting actions taken to reduce environmental impact.
Market Analysis and Trends
Environmental Services & Sustainability
This slide explores how climate change anxiety influences various lifestyle decisions, including family planning, diet, fashion, and job choices.
climate change, anxiety, lifestyle choices, environmental impact, Gen Z, millennials
false
Market Analysis and Trends
Environmental Services & Sustainability
Multiple Chart
Deloitte
Add to my slides
Remove from favorites
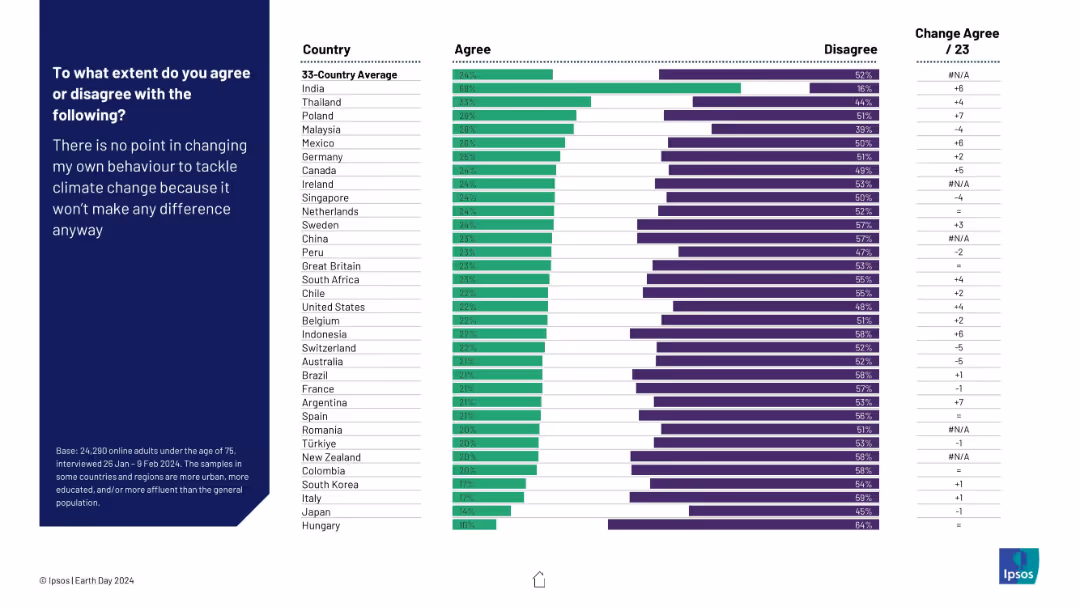
Bar chart displaying percentage agreement and disagreement across 33 countries. Green bars indicate agreement and purple bars indicate disagreement, aligned horizontally with change from previous year noted on the right.
Market Analysis and Trends
Environmental Services & Sustainability
This slide presents global public opinion on the statement: "There is no point in changing my own behaviour to tackle climate change because it won’t make any difference anyway." It shows a 33-country comparison, with India having the highest agreement. The data highlights public skepticism levels toward individual climate action.
climate change, behavior change, public opinion, global comparison, sustainability, environmental awareness, individual action, survey, Ipsos, Earth Day
false
Market Analysis and Trends
Environmental Services & Sustainability
Mixed Chart
IPSOS
Add to my slides
Remove from favorites
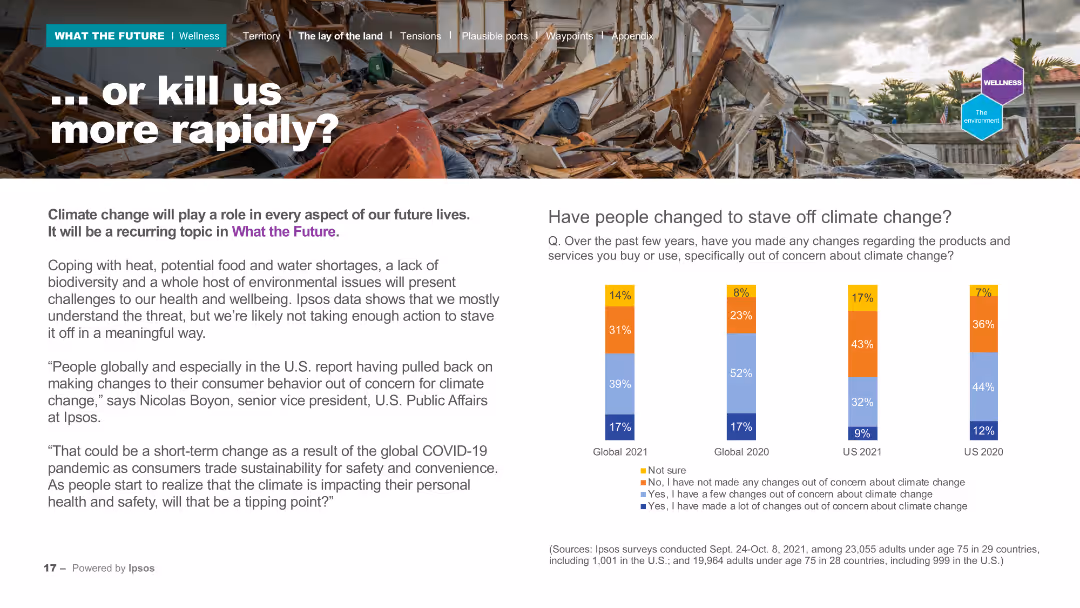
The slide contains a header, a background image of a destroyed house, and two main sections: a text block on the left and a column chart on the right. The column chart presents data on people's changes in behavior to address climate change across different years, using multiple colors for comparison.
Risk Assessment and Management
Environmental Services & Sustainability
Examines the role of climate change in future lives and the lack of significant action despite understanding the threat. The column chart compares behavioral changes regarding climate change between 2020 and 2021, showing the trends in public actions to mitigate environmental impact.
Climate change, behavior, future, survey, environment
false
Risk Assessment and Management
Environmental Services & Sustainability
Mixed Chart
IPSOS
Add to my slides
Remove from favorites
Features a pie chart, a bar chart, and substantial explanatory text. Layout is clear with visual emphasis on key stats.
Regulatory and Compliance
Environmental Services & Sustainability
Examines the expected impact of climate change on business strategies and operations, detailing top climate issues affecting companies.
Climate change, business impact, operations, strategy
false
Regulatory and Compliance
Environmental Services & Sustainability
Multiple Chart
Deloitte
Add to my slides
Remove from favorites
Features a pie chart and a bar chart analyzing the expected impact of climate change on business strategies and operations.
Risk Assessment and Management
Environmental Services & Sustainability
Explores how businesses anticipate climate change will affect their strategy and operations, noting significant concerns about operational disruptions.
climate change, business impact, risk management, strategy, operations, disruption, environmental sustainability
false
Risk Assessment and Management
Environmental Services & Sustainability
Multiple Chart
Deloitte
Add to my slides
Remove from favorites
Vertical bar chart comparing agreement/disagreement across countries; left-aligned title text on blue background; data columns for 4 previous years.
Market Analysis and Trends
Environmental Services & Sustainability
Compares public opinion across 32 countries on whether businesses will be failing employees/customers if they don’t act on climate change. Shows percentage agreeing/disagreeing, with trend data from 2021–2024.
climate change, business responsibility, global opinion, Ipsos, environment, sustainability, country comparison, public perception, trends
false
Market Analysis and Trends
Environmental Services & Sustainability
Mixed Chart
IPSOS
Add to my slides
Remove from favorites
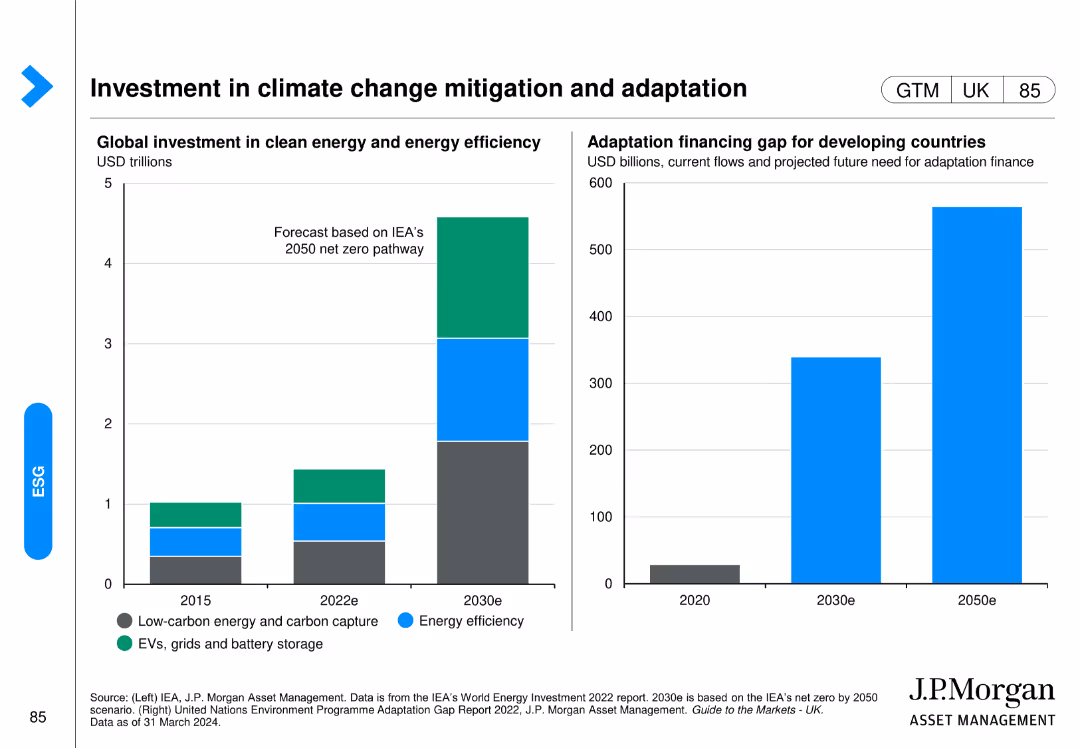
This slide includes a column chart showing global investment in clean energy and energy efficiency and a bar chart illustrating the adaptation financing gap for developing countries.
Investment Analysis
Financial Services
The slide details financial investments required for mitigating climate change impacts and the financing gaps that need to be addressed for developing countries' adaptation efforts.
climate change, clean energy, investment, energy efficiency, adaptation financing, developing countries, J.P. Morgan, sustainability, financial analysis, climate mitigation
false
Investment Analysis
Financial Services
Multiple Chart
JP Morgan
Add to my slides
Remove from favorites
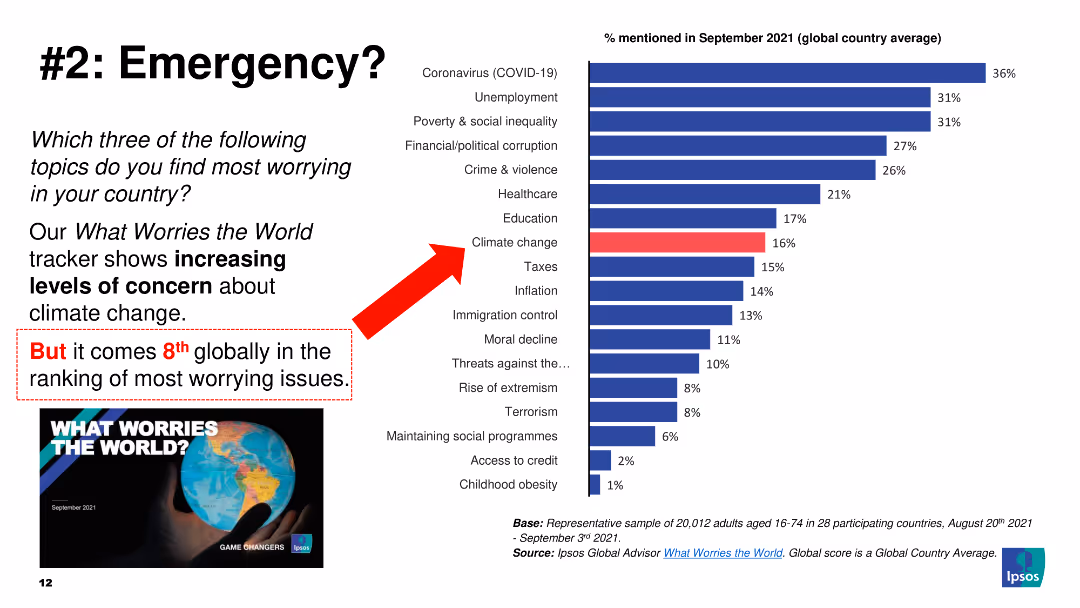
Column chart showing percentages of mentioned issues. Highlight on climate change with a red bar.
Market Analysis and Trends
Environmental Services & Sustainability
The slide shows global concerns with climate change ranked 8th. It emphasizes increasing concern.
climate change, concerns, global, ranking, issues
false
Market Analysis and Trends
Environmental Services & Sustainability
Mixed Chart
IPSOS
Add to my slides
Remove from favorites
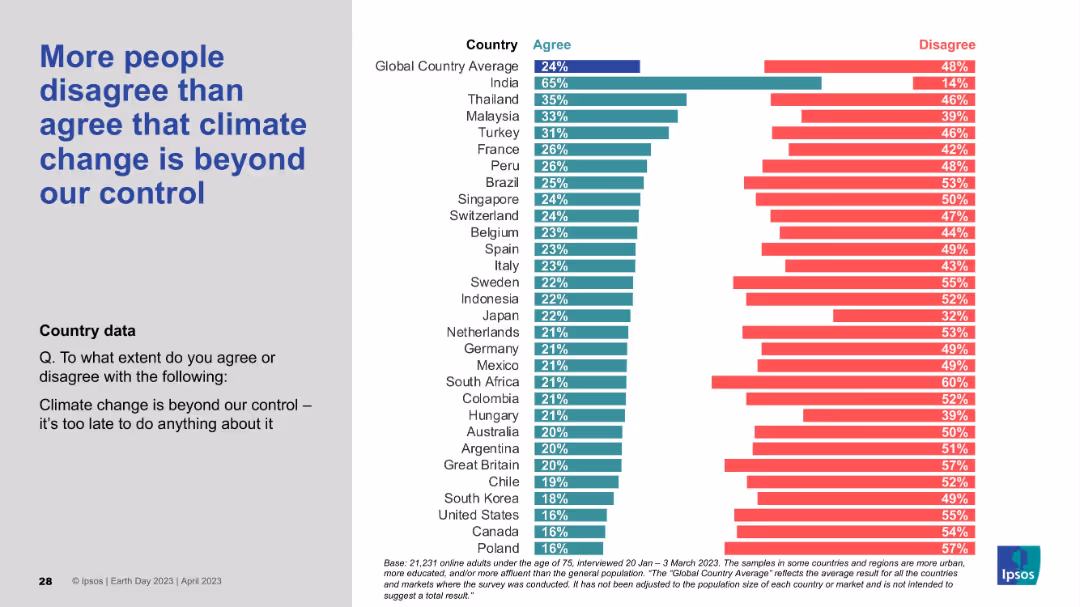
Standard format: bold blue statement on left and country agreement/disagreement distribution on right using horizontal bars.
Risk Assessment and Management
Environmental Services & Sustainability
The slide examines the belief that climate change is irreversible. While a minority agree it’s too late to act, the majority disagree, affirming a strong belief that mitigation efforts are still worthwhile and that the situation is not hopeless.
climate change, control, irreversibility, optimism, environmental responsibility, public perception, Ipsos
false
Risk Assessment and Management
Environmental Services & Sustainability
Mixed Chart
IPSOS
Add to my slides
Remove from favorites
Horizontal bar chart comparing public agreement and disagreement on corporate versus government action on climate change across different markets.
Market Analysis and Trends
Government & Public Sector
Shows that the public believes both corporate and government actions are crucial in combating climate change, with high levels of agreement across many countries.
climate change, corporate action, government action, public mandate, survey
false
Market Analysis and Trends
Government & Public Sector
Multiple Chart
IPSOS
Add to my slides
Remove from favorites
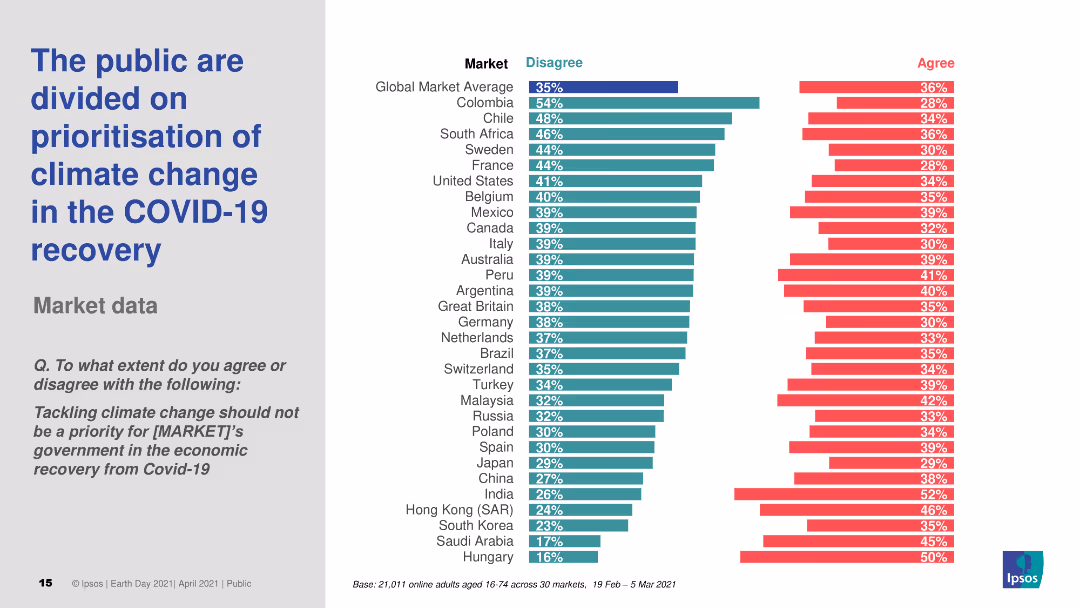
Horizontal bar chart comparing agreement and disagreement levels on prioritizing climate change in COVID-19 recovery across global markets.
Market Analysis and Trends
Government & Public Sector
Highlights divided public opinion on whether climate change should be prioritized during economic recovery from COVID-19, with varying levels of agreement by country.
climate change, COVID-19, economic recovery, public opinion, survey
false
Market Analysis and Trends
Government & Public Sector
Multiple Chart
IPSOS
Add to my slides
Remove from favorites
Slide presents a column chart showing marketers' ratings on how climate-related changes influence customer experience, divided by business sectors.
Product and Service Analysis
Environmental Services & Sustainability
Evaluates marketers' beliefs regarding the impact of climate-related changes on customer experience, providing insights across different sectors.
climate change, customer experience, product changes, marketer opinions, sustainability
false
Product and Service Analysis
Environmental Services & Sustainability
Mixed Chart
Deloitte
Add to my slides
Remove from favorites
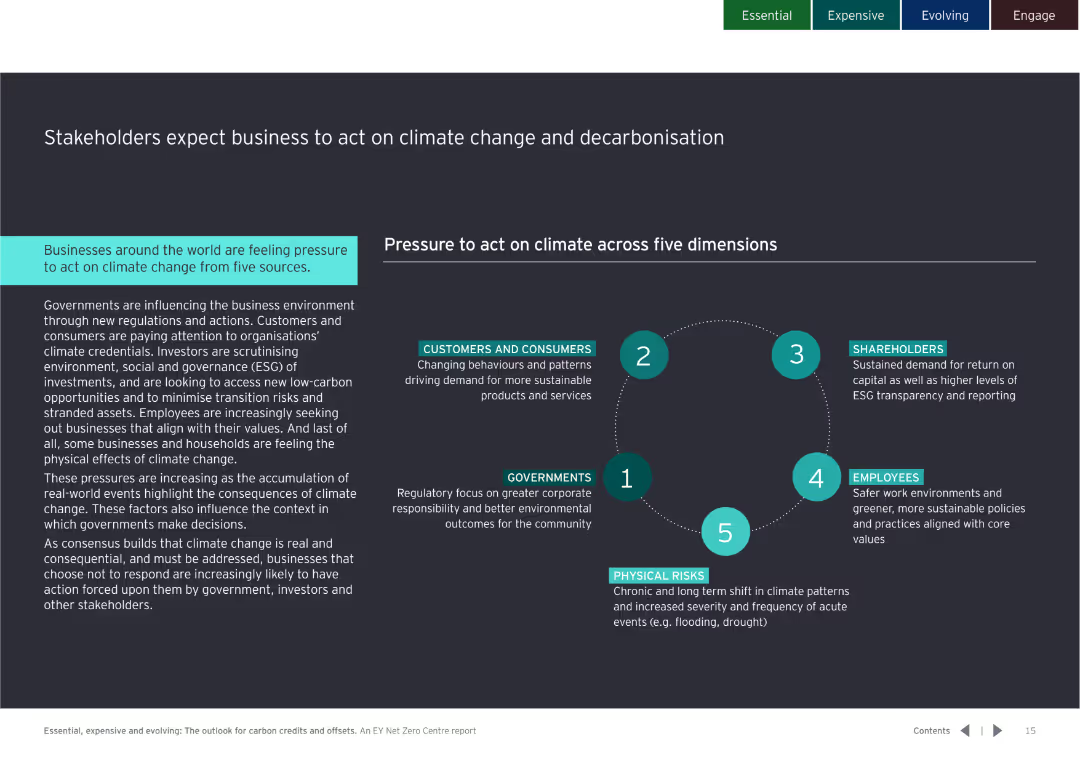
Includes text with a circular infographic detailing the five sources of pressure for businesses to act on climate change.
Risk Assessment and Management
Environmental Services & Sustainability
Outlines the pressures from governments, customers, investors, employees, and physical risks, pushing businesses to adopt decarbonization strategies.
Climate change, decarbonisation, stakeholders, pressure, business, risk, management, sustainability
false
Risk Assessment and Management
Environmental Services & Sustainability
Diagram
EY
Add to my slides
Remove from favorites
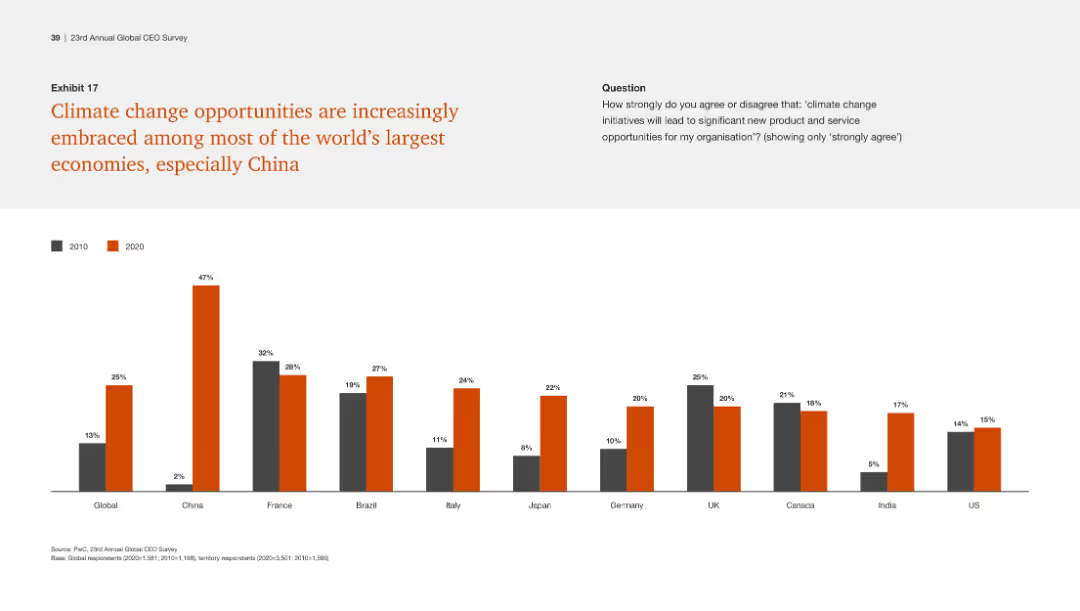
This slide presents a dense layout with a multi-bar chart comparing global and country-specific data from 2010 and 2020. It has a clear title and captions, with significant use of orange and black to distinguish data points.
Market Analysis and Trends
Environmental Services & Sustainability
This slide provides an analysis of how climate change opportunities are perceived in different economies, with an emphasis on the growing acceptance in China. It offers insights into international views on environmental initiatives and is likely used in global sustainability strategy meetings or environmental impact assessments.
Climate Change, Economies, Global, China, Opportunities, Environment, Strategy, Acceptance, Assessment
false
Market Analysis and Trends
Environmental Services & Sustainability
Single Chart
PwC/Strategy&
Add to my slides
Remove from favorites
Column chart comparing agreement with climate change opportunities among major economies between 2010 and 2020, including bars for China, France, Brazil, and others.
Market Analysis and Trends
Environmental Services & Sustainability
The slide shows how agreement on climate change opportunities has increased in major economies, highlighting significant growth in China, France, and Brazil.
Climate change, economies, opportunities, growth, 2020
false
Market Analysis and Trends
Environmental Services & Sustainability
Single Chart
PwC/Strategy&
Add to my slides
Remove from favorites
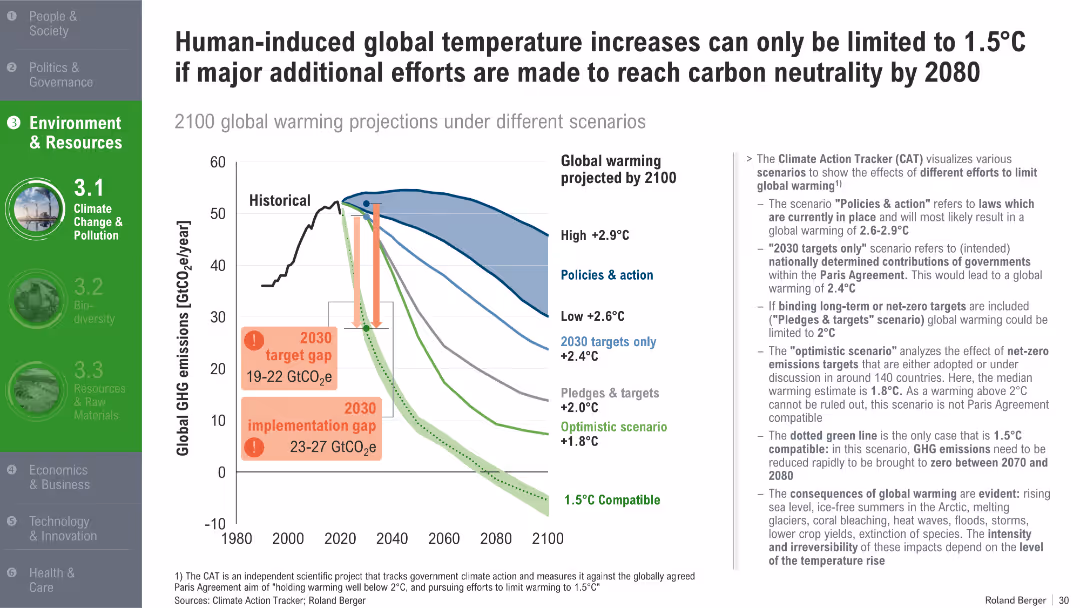
Line graph with multiple emissions pathways over time, annotations highlighting gaps, color-coded temperature scenarios, sidebar with definitions
Market Analysis and Trends
Environmental Services & Sustainability
This slide illustrates projected global warming scenarios under various emissions pathways, showing the discrepancy between current implementation and required targets for 1.5°C alignment. It emphasizes the need for drastic emissions reductions by 2080 and categorizes future warming outcomes based on current and pledged actions.
climate change, emissions gap, global warming, temperature targets, carbon neutrality, CAT, scenarios, projections
false
Market Analysis and Trends
Environmental Services & Sustainability
Mixed Chart
Roland Berger
Add to my slides
Remove from favorites
Includes multiple types of visual data representation like world maps and bar charts, along with descriptive texts and annotations.
Regulatory and Compliance
Environmental Services & Sustainability
Educates about the impact of climate change on different regions and industries, showing temperature increases, sea level rise, and water stress projections. It urges actions to mitigate these effects and adapt to changes.
climate change, environmental impact, global warming, adaptation, maps, bar charts, column charts
false
Regulatory and Compliance
Environmental Services & Sustainability
Mixed Chart
PwC/Strategy&
Add to my slides
Remove from favorites
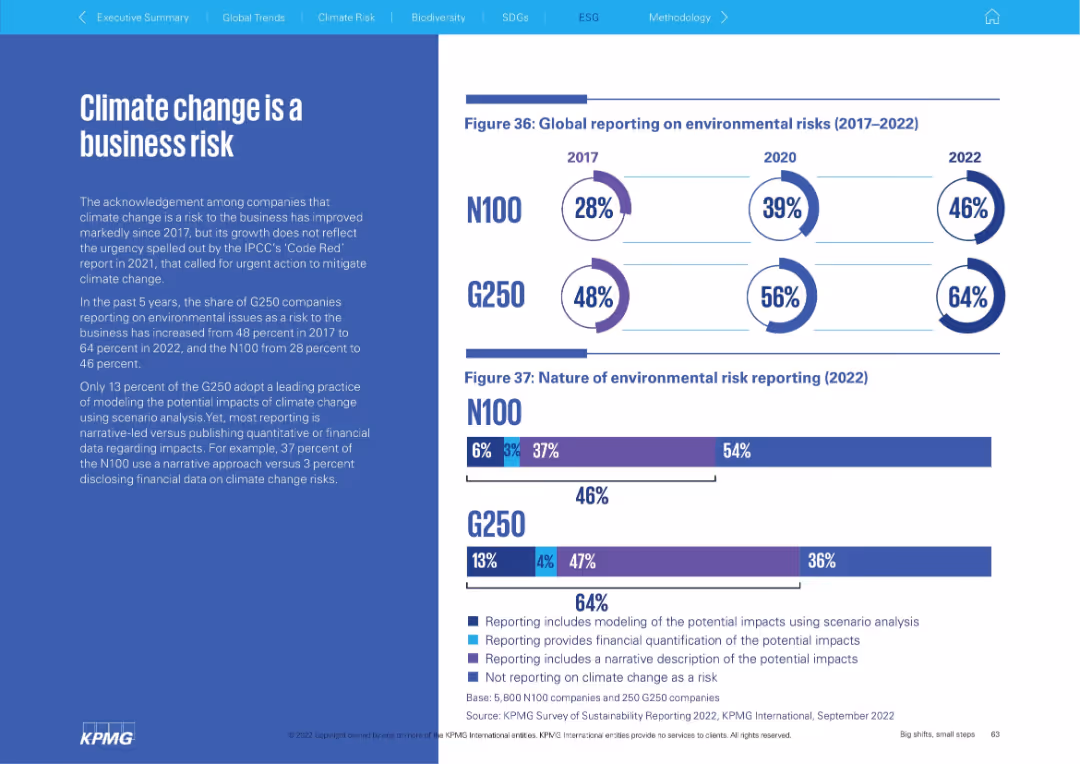
Left-aligned explanatory text paired with dual bar graphs on the right showing trends in environmental risk reporting and its nature (narrative vs. quantitative vs. scenario).
Risk Assessment and Management
Professional Services
This slide addresses how companies perceive climate change as a business risk. It tracks the rise in climate risk reporting from 2017 to 2022 and classifies the nature of such reporting—mostly narrative rather than scenario-based or financial.
climate change, environmental risk, scenario analysis, sustainability reporting, G250, N100, corporate risk, ESG
false
Risk Assessment and Management
Professional Services
Multiple Chart
KPMG
Add to my slides
Remove from favorites
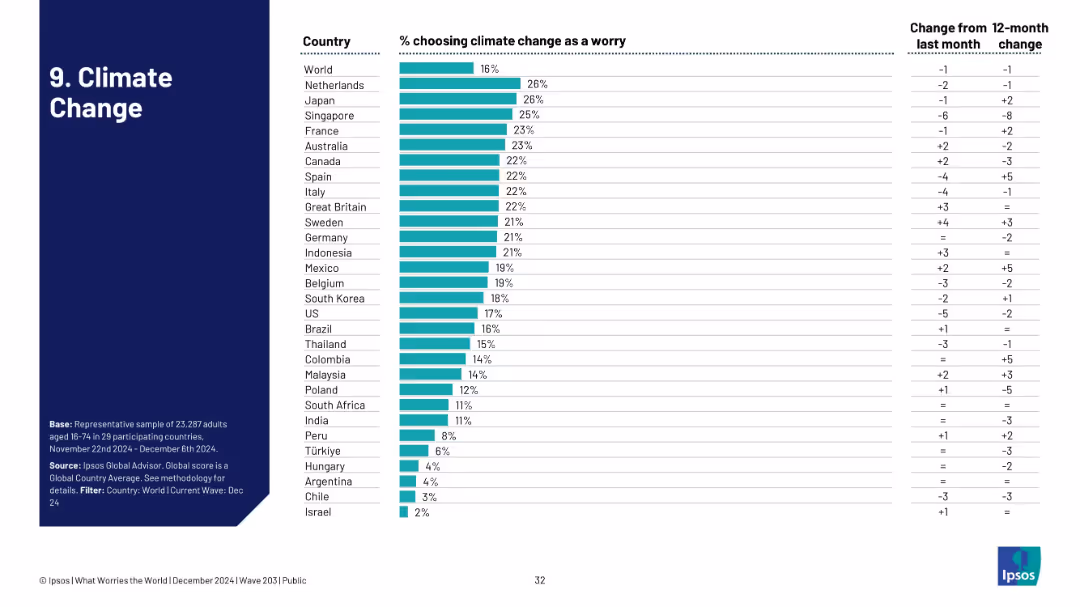
Vertical bar chart of country-level concern over climate change, with global average and monthly/yearly trends.
Market Analysis and Trends
Environmental Services & Sustainability
Climate change is a concern for 16% globally, with Netherlands and Japan showing highest concern. The chart reflects growing or declining worry levels by country.
climate change, environment, sustainability, Ipsos, global warming, perception shift
false
Market Analysis and Trends
Environmental Services & Sustainability
Single Chart
IPSOS
Add to my slides
Remove from favorites
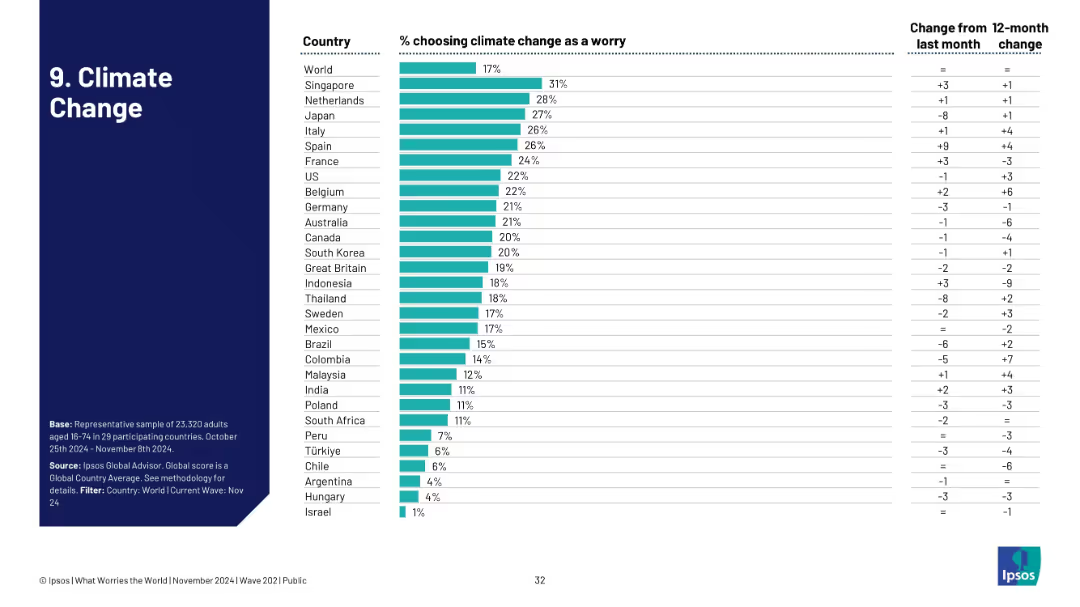
Bar chart listing countries by % concerned with climate change; includes change over time.
Market Analysis and Trends
Environmental Services & Sustainability
Displays public concern about climate change by country, with Singapore (31%) and Netherlands (28%) leading. The slide tracks shifts in environmental concern, highlighting how the topic fluctuates based on national context and awareness.
climate change, environment, sustainability, Ipsos, survey, ecological concern, trends, public opinion, perception
false
Market Analysis and Trends
Environmental Services & Sustainability
Single Chart
IPSOS
Add to my slides
Remove from favorites
Slide features multiple pie charts and icons, highlighting executives' views on climate change and its urgency. Colors are green and black.
Regulatory and Compliance
Environmental Services & Sustainability
Details executives' perceptions of climate change's severity and the optimism for effective response, highlighting increased awareness and urgency.
climate change, executives, perceptions, urgency, optimism, regulatory, compliance, environmental sustainability
false
Regulatory and Compliance
Environmental Services & Sustainability
Multiple Chart
Deloitte
Add to my slides
Remove from favorites
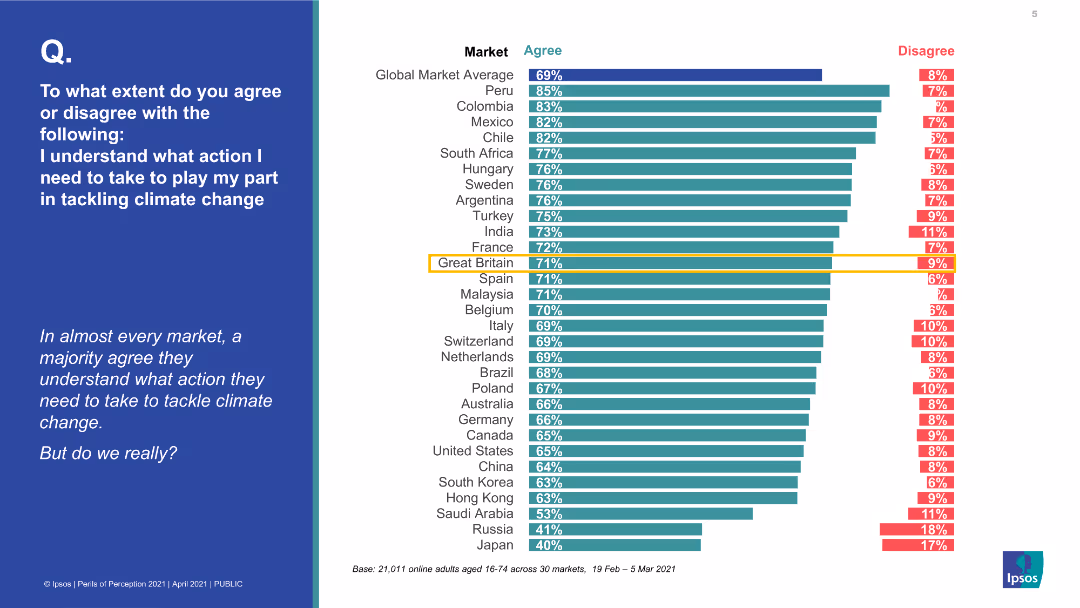
A bar chart with horizontal bars indicating the percentage of agreement and disagreement on understanding actions to tackle climate change across various countries. The left side features a blue background with a question.
Market Analysis and Trends
Environmental Services & Sustainability
The slide presents a global survey on the perception of understanding actions to tackle climate change, showing high agreement in most markets, but questioning if this understanding is real.
climate change, global survey, perception, actions, agreement, disagreement, countries, environmental understanding
false
Market Analysis and Trends
Environmental Services & Sustainability
Multiple Chart
IPSOS
Add to my slides
Remove from favorites
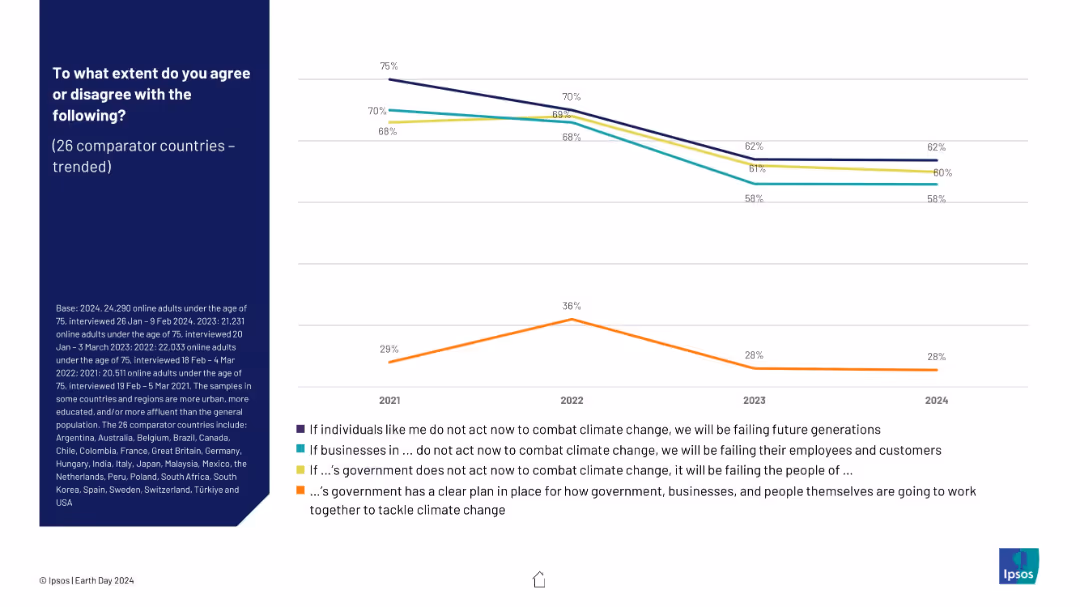
Line chart showing multi-year trend data (2021–2024) on agreement with climate change statements. Color-coded lines for each statement. Left panel explains survey context.
Market Analysis and Trends
Environmental Services & Sustainability
This slide shows four-year trends in global attitudes toward climate action by individuals, businesses, and governments. Notably, agreement has declined for most statements, especially the belief that individuals must act to protect future generations.
climate change, global trends, public opinion, individual responsibility, businesses, government plans, Ipsos survey, Earth Day
false
Market Analysis and Trends
Environmental Services & Sustainability
Mixed Chart
IPSOS
Add to my slides
Remove from favorites
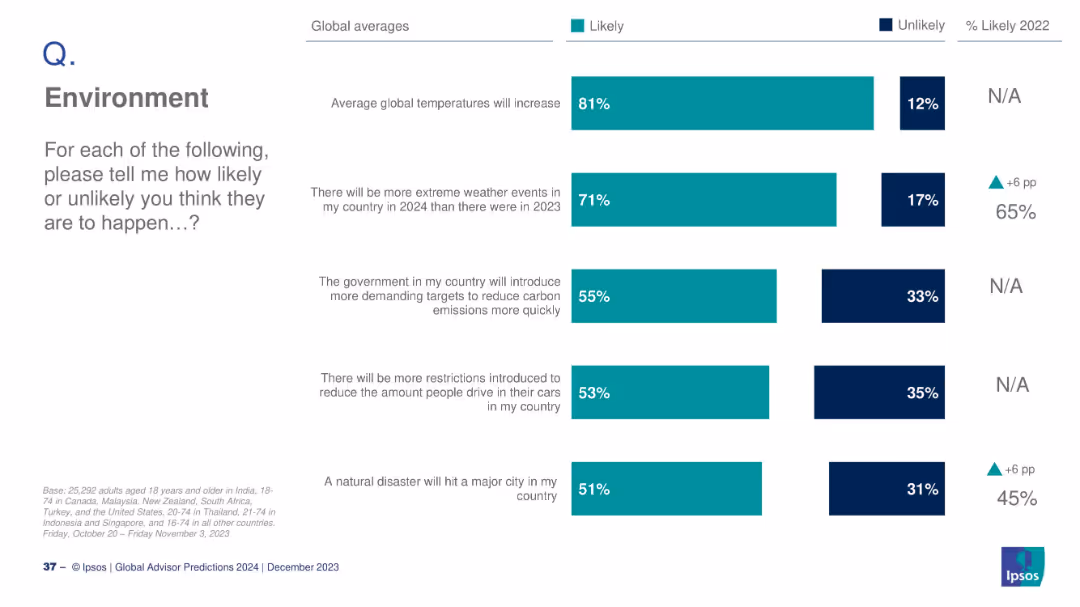
Vertical bar chart with five rows showing global likelihood of environmental events; clean layout.
Strategic Planning
Environmental Services & Sustainability
This slide presents global perceptions of various environmental events in 2024, including temperature rise, extreme weather, policy shifts, and natural disasters. High levels of concern (e.g., 81% for rising temps) reflect growing public awareness.
climate change, global warming, extreme weather, policy, carbon targets, Ipsos, 2024
false
Strategic Planning
Environmental Services & Sustainability
Mixed Chart
IPSOS
Add to my slides
Remove from favorites
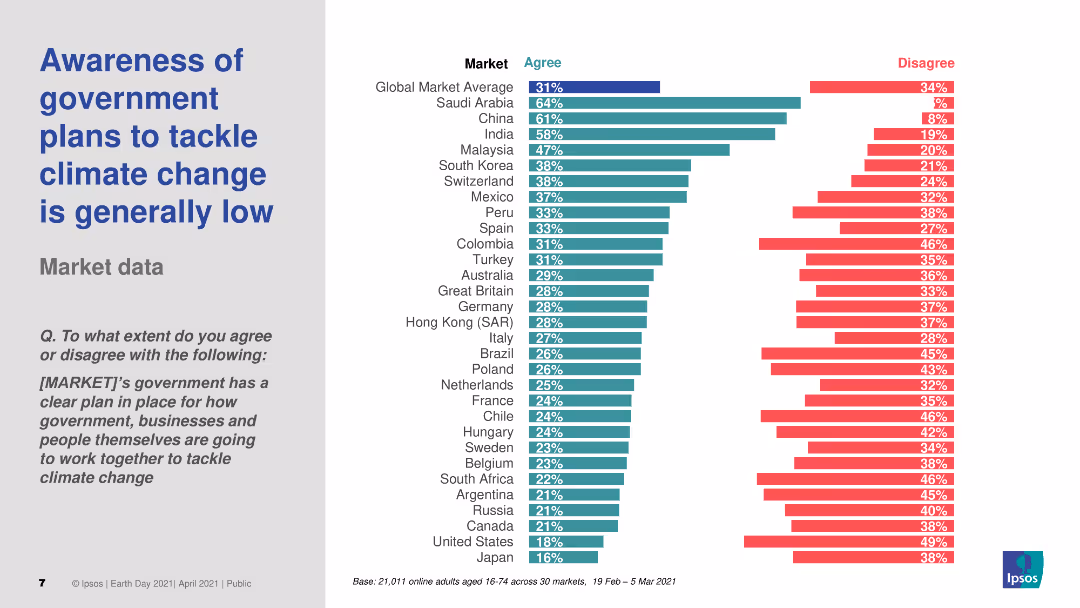
The slide includes a header, a text block, and a column chart. The column chart shows survey data on public awareness of government plans to tackle climate change across various markets, with different colors representing levels of agreement and disagreement.
Market Analysis and Trends
Environmental Services & Sustainability
Discusses the low awareness of government plans to tackle climate change across different countries. The column chart presents survey data on public agreement with the statement that their government's plans are clear, comparing awareness levels across multiple markets.
Climate change, government plans, awareness, survey, markets
false
Market Analysis and Trends
Environmental Services & Sustainability
Multiple Chart
IPSOS
Add to my slides
Remove from favorites
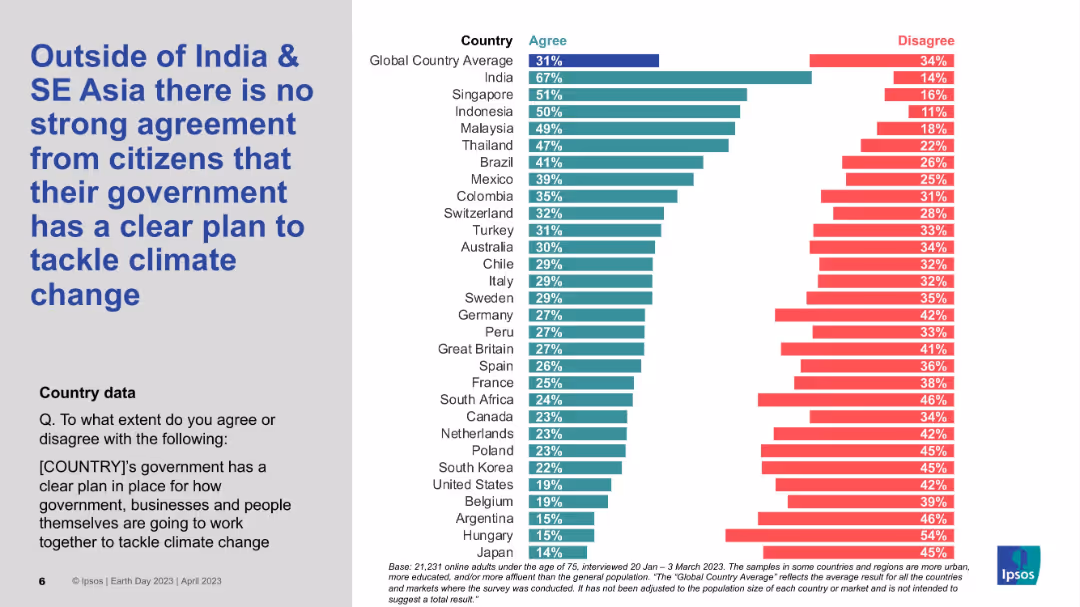
Bar chart on right showing country-level agreement/disagreement; large bold title on left; grey and white background split.
Market Analysis and Trends
Environmental Services & Sustainability
This slide highlights global perceptions regarding whether governments have a clear plan to address climate change. India and several SE Asian countries show stronger agreement, while many Western nations fall below the global average of 31%. The chart visually contrasts country sentiments.
Climate change, Government policy, Regional comparison, Ipsos, Global sentiment, SE Asia
false
Market Analysis and Trends
Environmental Services & Sustainability
Mixed Chart
IPSOS
Add to my slides
Remove from favorites
This slide features a horizontal bar chart comparing agreement and disagreement levels on government action against climate change across global markets.
Market Analysis and Trends
Government & Public Sector
Highlights public opinion on government action regarding climate change, showing a high level of agreement that inaction is failing citizens.
climate change, government, public opinion, global, action
false
Market Analysis and Trends
Government & Public Sector
Multiple Chart
IPSOS
Add to my slides
Remove from favorites
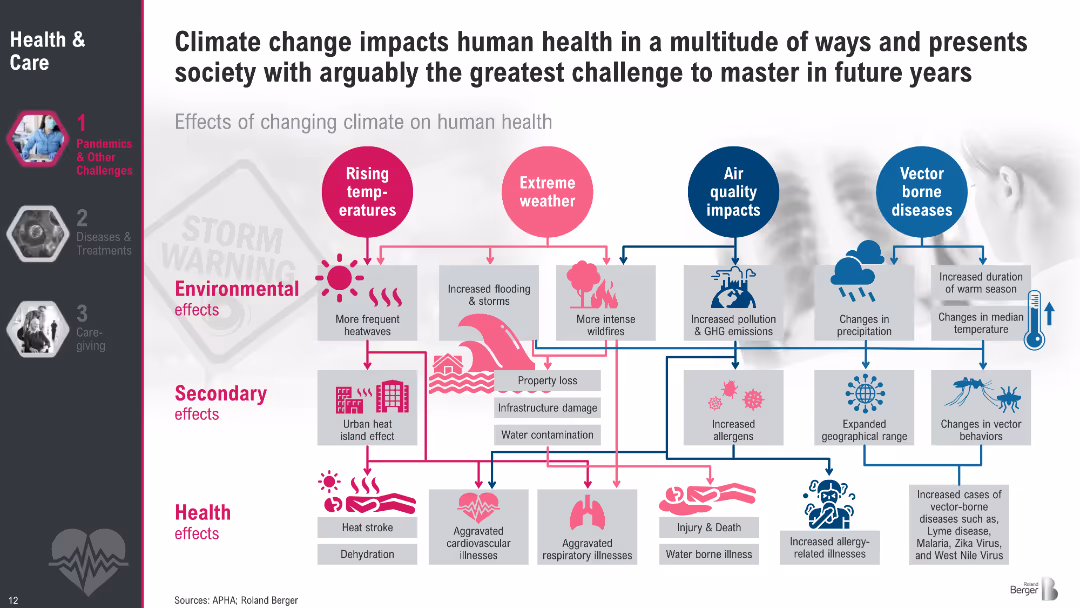
Visual flow diagram with icons, color-coded pathways and categorized effects (environmental, secondary, health). Uses pink and blue color themes to map rising temperatures, extreme weather, air quality, and vector-borne diseases.
Risk Assessment and Management
Healthcare & Pharmaceuticals
This slide explains how climate change influences human health via rising temperatures, extreme weather, air quality degradation, and changes in vector-borne diseases. It outlines environmental, secondary, and health effects, from heatwaves and floods to cardiovascular issues, allergies, and infectious diseases. The diagram emphasizes cascading impacts across multiple domains.
Climate change, health effects, temperature, pollution, vector diseases, flooding, allergies, infrastructure, dehydration, cardiovascular
false
Risk Assessment and Management
Healthcare & Pharmaceuticals
Diagram
Roland Berger
Add to my slides
Remove from favorites
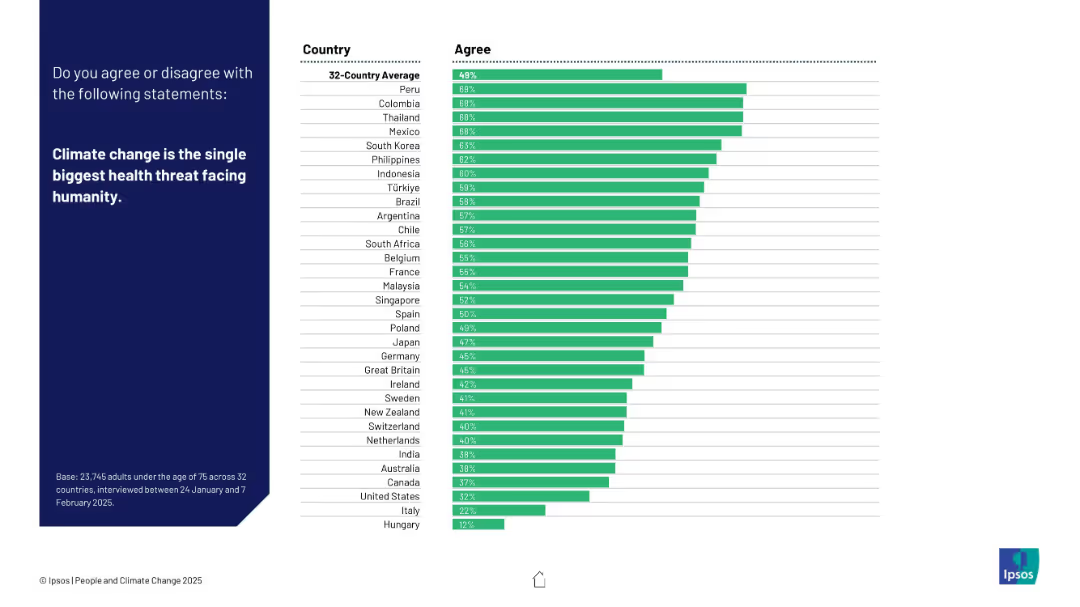
Left panel with statement and survey context in white text on dark blue background. Right side has horizontal bar chart by country.
Market Analysis and Trends
Environmental Services & Sustainability
This slide shows the percentage of people in 32 countries who agree that climate change is the biggest health threat facing humanity. Results vary widely by country.
climate change, health threat, global opinion, Ipsos, 2025 survey, environmental risk, public perception, country comparison, awareness, sustainability
false
Market Analysis and Trends
Environmental Services & Sustainability
Mixed Chart
IPSOS
Add to my slides
Remove from favorites
Previous
Next
You don't have any favorites yet.
Please wait loading your favorites slides...
Create a FREE account to continue browsing
Receive Instant Access to 1,000+ slides from companies like McKinsey, Google, and Goldman Sachs
First Name
Last Name
Email
Password
I agree to all
Terms & Privacy Policy
Thank you! Your submission has been received!
Oops! Something went wrong while submitting the form.
Have an account?
Sign in
Upgrade to PRO to Save slides
Advanced Search and Filters
Access to 15,000+ slides
Access to Category Pages
Save/Bookmark Slides
PowerPoint Template Library
Pick a Plan
MONTHLY
$12/month
Billed every month, Cancel anytime.
YEARLY
$9/year
Billed $108 annually, Cancel anytime.
Checkout for $12/month
Checkout for $108/yr
Secured by Stripe | AES-256 bit encryption


![If businesses in [COUNTRY] do not act now…](https://cdn.prod.website-files.com/654e70fb59937215cac87b19/6899c5d0c55e7f59a3dd62ed_DaEYf9O11SEaHqTZvCcD4hy1W5NGXof3c0J8463Z5sU.avif)

![To what extent do you agree or disagree with the following? If [COUNTRY]’s government does not act now to combat climate change...](https://cdn.prod.website-files.com/654e70fb59937215cac87b19/6899c5cd9bda841747877c19_sYFqXyPlN33y2z40MDyoRYdH39lE4fNPnjHPcKnH--k.avif)


![If businesses in [COUNTRY] do not act now to combat climate change...](https://cdn.prod.website-files.com/654e70fb59937215cac87b19/6899c2275db20efc834e0e5a_hy9AGsHlAPCkA8ZHao9vmTq8qXkLy4GltNv95mfQ4-Y.avif)