My Account
My Slides
Search by Category
Companies
Slide Type
Use Case
Industry
Pricing
Templates
View All Templates
Download Template Slides
✦ AI
AI Prompt Library
AI Search
Feedback
Login
Logout
Get Started
Browse all Slides
Browse all Slides
Create a FREE Account
Instant access to 1,000+ real slides from top companies like McKinsey, BCG, Goldman Sachs, Google and many more!
First Name
Last Name
Email
Password
I agree to all
Terms & Privacy Policy
Thank you! Your submission has been received!
Oops! Something went wrong while submitting the form.
Have an account?
Sign in
Saved Slides
Total No. of slides saved
0
↻ Refresh
✖ Clear all
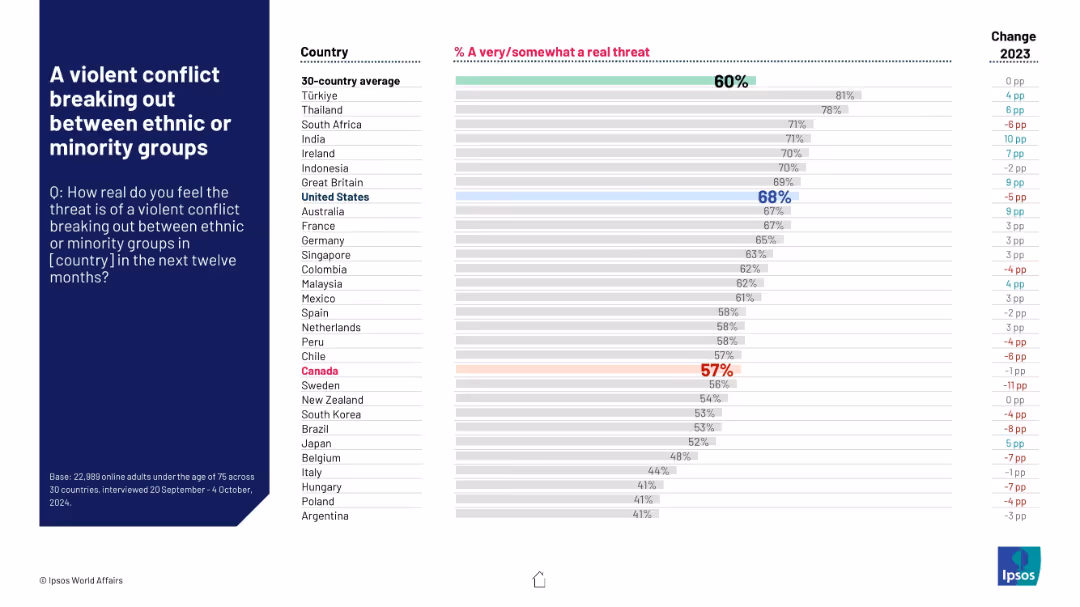
Country comparison via bar chart; U.S. and Canada emphasized with color-coded bars.
Risk Assessment and Management
Government & Public Sector
Survey responses from 30 countries on the likelihood of ethnic or minority group conflict. The U.S. ranks high at 68%, while Canada is notably lower at 57%, slightly below the global average of 60%.
conflict, ethnic tensions, social risk, global ranking, Canada, U.S., Ipsos, perception, bar chart, 2024
false
Risk Assessment and Management
Government & Public Sector
Mixed Chart
IPSOS
Add to my slides
Remove from favorites
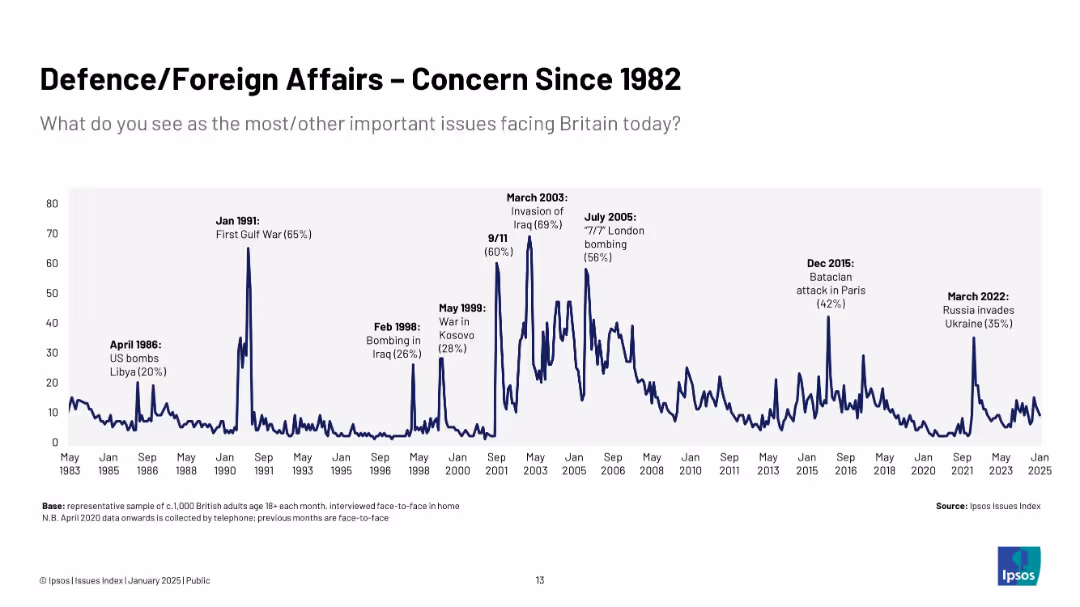
Extended timeline (1983–2025) showing peaks at major geopolitical events; annotations for each surge, consistent line style, large data span.
Risk Assessment and Management
Government & Public Sector
Demonstrates long-term trends in public concern over foreign affairs, with peaks linked to Gulf War, Iraq invasion, 9/11, and Ukraine conflict.
conflict, public opinion, UK, war, terrorism, global events, Ipsos, long-term trends
false
Risk Assessment and Management
Government & Public Sector
Single Chart
IPSOS
Add to my slides
Remove from favorites
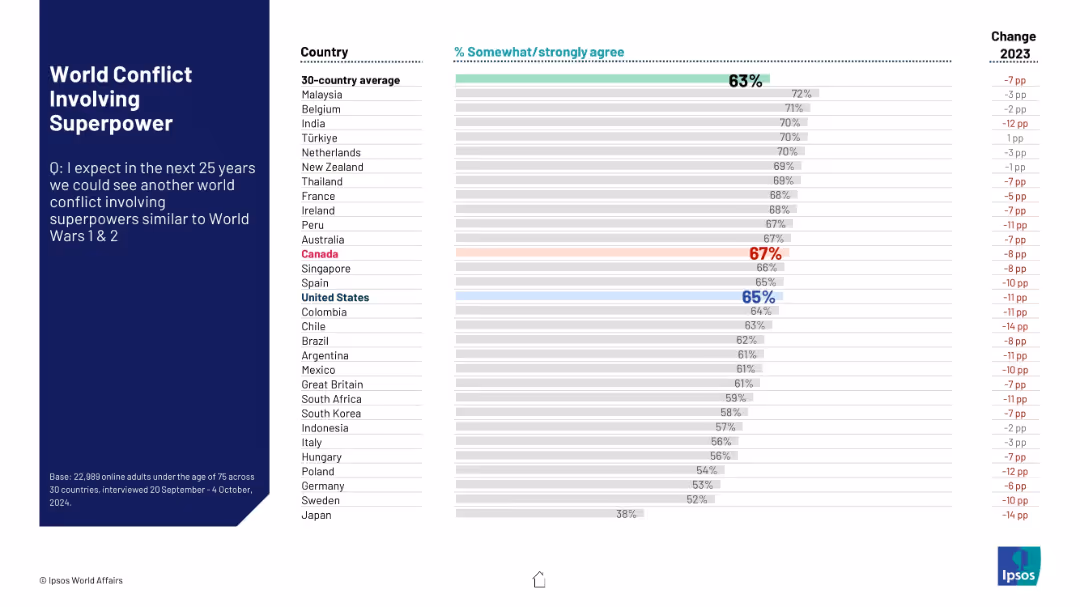
Blue sidebar with question, right-aligned stacked horizontal bars ranking agreement across countries. Includes percent change from 2023.
Risk Assessment and Management
Government & Public Sector
This slide explores global perceptions of the likelihood of a future world conflict involving major superpowers, akin to the World Wars. Results show a high level of concern, with year-over-year decline in agreement.
conflict risk, superpowers, global conflict, public opinion, Ipsos, geopolitical risk, war forecast, international sentiment, World War
false
Risk Assessment and Management
Government & Public Sector
Mixed Chart
IPSOS
Add to my slides
Remove from favorites
Contains a bar chart displaying the relative importance of different preferences in a conjoint study. Key findings are listed in bullet points.
Market Analysis and Trends
Professional Services
Presents results of a conjoint study highlighting trade-offs in preferences such as work location, stipends, and onsite amenities, and their relative importance.
Conjoint study, Preferences, Work location, Stipend, Onsite amenities
false
Market Analysis and Trends
Professional Services
Mixed Chart
EY
Add to my slides
Remove from favorites
This slide presents two horizontal bar charts comparing trust levels in various entities for accessing personal data, between respondents interested in connected car features and potential new car buyers.
Market Analysis and Trends
Transportation & Logistics
It explores consumer trust in various entities to handle personal data, comparing perspectives of those interested in connected car features with those of potential new car buyers.
connected car features, personal data, trust, car buyers, entities
false
Market Analysis and Trends
Transportation & Logistics
Multiple Chart
EY
Add to my slides
Remove from favorites
The slide presents a large circular progress chart indicating a 67% reduction, accompanied by icons and text detailing the benefits of connected reporting systems.
Operational Efficiency
Professional Services
Highlights the success of a connected reporting system in reducing reporting times and improving data integrity and visibility over financial performance, with an emphasis on standardization and remote capabilities.
Connected reporting, data integrity, financial visibility, reduction in time, standardization, remote reporting, process improvement
false
Operational Efficiency
Professional Services
Mixed Chart
Deloitte
Add to my slides
Remove from favorites
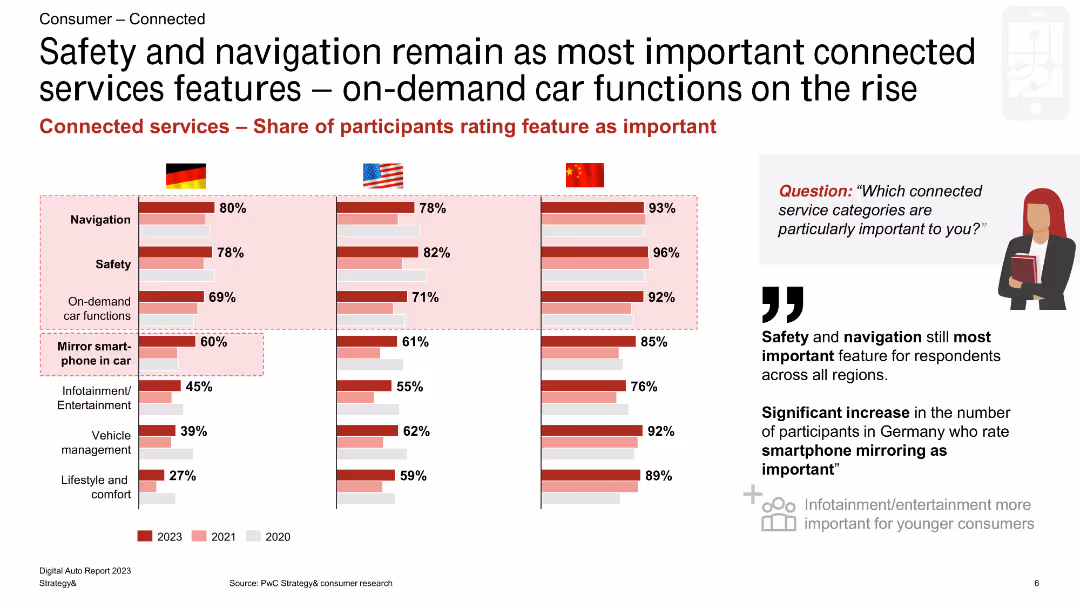
The slide features three vertical bar charts comparing the importance of various connected car service features among consumers in Germany, the US, and China.
Product and Service Analysis
Consumer Goods
This slide analyzes which connected car service features are considered important by consumers in Germany, the US, and China, with a focus on safety, navigation, and on-demand functions.
connected services, car features, consumer analysis, Germany, US, China, safety, navigation, bar charts
false
Product and Service Analysis
Consumer Goods
Multiple Chart
PwC/Strategy&
Add to my slides
Remove from favorites
A bar chart and a pie chart showing consumer interest in various connected vehicle services and their willingness to pay for these services. The layout is clean and informative.
Technology and Digital Transformation
Transportation & Logistics
This slide discusses consumer interest in connected vehicle services related to traffic updates, safety, and maintenance, and their willingness to invest in these technologies. It highlights a low willingness to pay extra.
Connected services, consumer behavior, digital transformation, vehicle technology
false
Technology and Digital Transformation
Transportation & Logistics
Multiple Chart
Deloitte
Add to my slides
Remove from favorites
The slide has three vertical bar charts comparing experts' and consumers' ratings of connected car service features in Germany, the US, and China, focusing on differences in preferences.
Product and Service Analysis
Consumer Goods
This slide compares the perspectives of experts and consumers on the importance of various connected car services, highlighting differences in ratings for features like infotainment and on-demand functions across countries.
connected services, expert analysis, consumer preferences, Germany, US, China, infotainment, on-demand functions, bar charts
false
Product and Service Analysis
Consumer Goods
Multiple Chart
PwC/Strategy&
Add to my slides
Remove from favorites
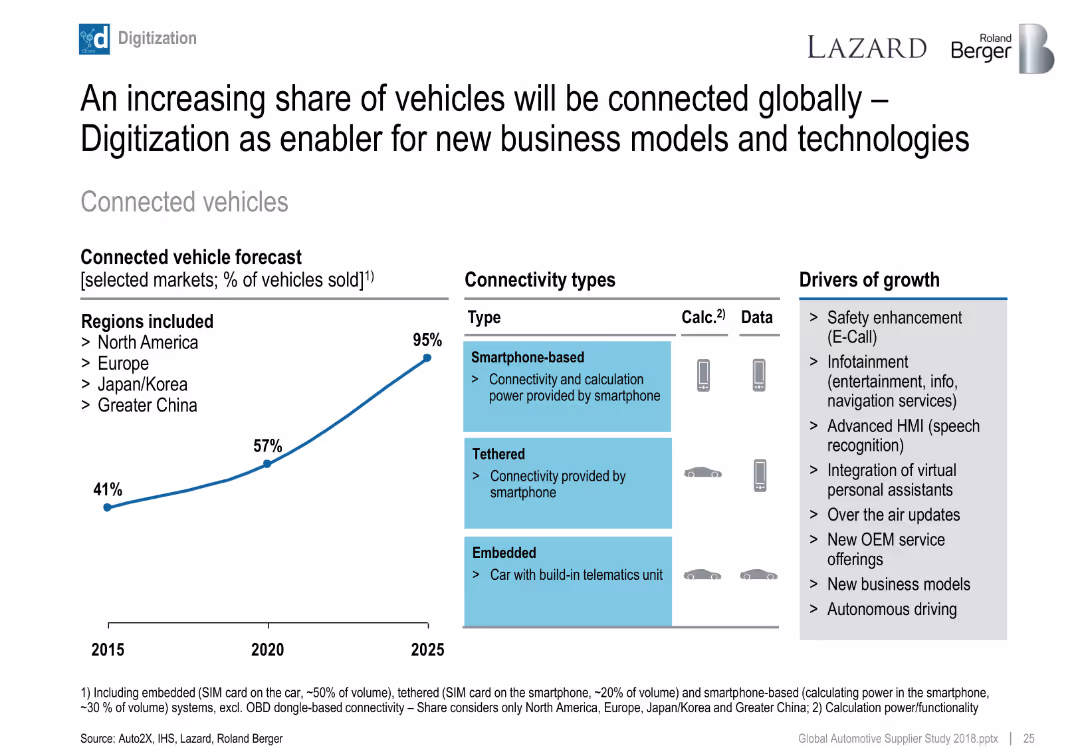
Forecast line chart of connected vehicle penetration; table of connectivity types; list of tech-driven growth enablers.
Technology and Digital Transformation
Industrial & Manufacturing
Predicts massive growth in connected vehicles from 2015–2025. Connectivity types include embedded, tethered, and smartphone-based. Highlights drivers such as infotainment, speech recognition, OTA updates, and new digital services.
connected vehicles, digital transformation, infotainment, telematics, OEM services
false
Technology and Digital Transformation
Industrial & Manufacturing
Mixed Chart
Roland Berger
Add to my slides
Remove from favorites
Continues the list of industries with circular icons, exploring further impacts of connectivity trends.
Technology and Digital Transformation
Telecommunications
Extends the discussion of disruptive potential across various industries due to connectivity technologies.
Connectivity, Industry Impact, Telecommunications, Aviation, Construction, IT
false
Technology and Digital Transformation
Telecommunications
Header Vertical
McKinsey
Add to my slides
Remove from favorites
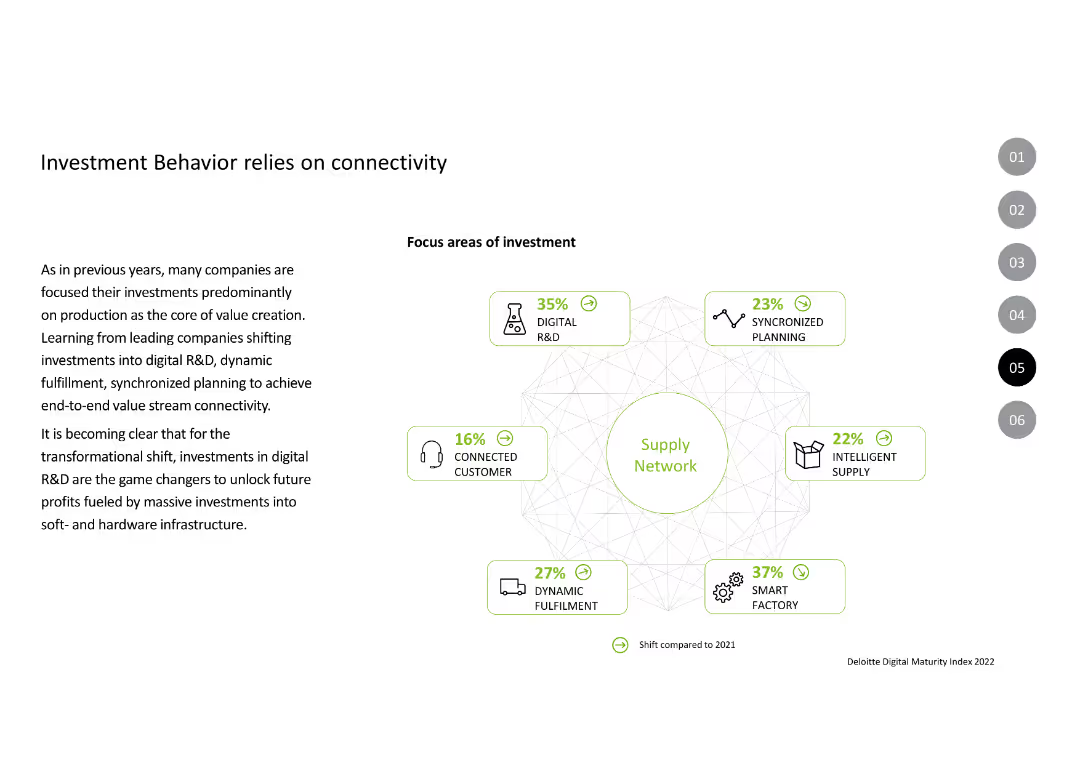
This slide includes an infographic depicting various focus areas of investment around a central "Supply Network" theme. Each area is color-coded, with icons and percentage figures showing investment shifts compared to the previous year. Text is aligned on the left, explaining investment focus changes.
Strategic Planning
Technology & Software
Emphasizes the importance of connectivity in investment strategies, detailing areas like digital R&D, synchronized planning, and intelligent supply. Describes how these areas contribute to a transformational shift in value creation and future profitability.
Connectivity, Investment, R&D, Supply, Planning
false
Strategic Planning
Technology & Software
Diagram
Deloitte
Add to my slides
Remove from favorites
A structured layout with icons and bullet points, highlighting key financial opportunities and industry capabilities enabled by connectivity.
Investment Analysis
Telecommunications
Discusses the monetization opportunities and new capabilities for industries created by advanced connectivity.
Connectivity, Monetization, Industry, Telecom, B2B, Devices, IoT
false
Investment Analysis
Telecommunications
Header Horizontal
McKinsey
Add to my slides
Remove from favorites
A three-column comparison of optical fiber, LPWAN, Wi-Fi 6, and 5G/6G cellular, contrasting current and previous generations.
Technology and Digital Transformation
Technology & Software
This slide compares current advanced connectivity technologies with previous generations, highlighting the advancements.
Connectivity, Optical Fiber, LPWAN, Wi-Fi 6, 5G, 6G, Technology Comparison
false
Technology and Digital Transformation
Technology & Software
Header Vertical
McKinsey
Add to my slides
Remove from favorites
Features a balance of text and images, illustrating various funding models and their applicability in Indonesian school connectivity projects, using a complex text layout.
Strategic Planning
Telecommunications
Explores different funding models for improving school connectivity in Indonesia, discussing their theoretical benefits and practical challenges, and assessing the potential for scalable solutions.
connectivity, schools, Indonesia, funding, models
false
Strategic Planning
Telecommunications
Mixed Chart
BCG
Add to my slides
Remove from favorites
Comparative layout with graphics representing different types of connectivity technology across a spectrum.
Product and Service Analysis
Technology & Software
Detailed explanation of various connectivity technologies and their implications for digital solutions.
Connectivity, Technology, 5G, 6G, Wi-Fi, Satellites, Digital Solutions
false
Product and Service Analysis
Technology & Software
Header Horizontal
McKinsey
Add to my slides
Remove from favorites
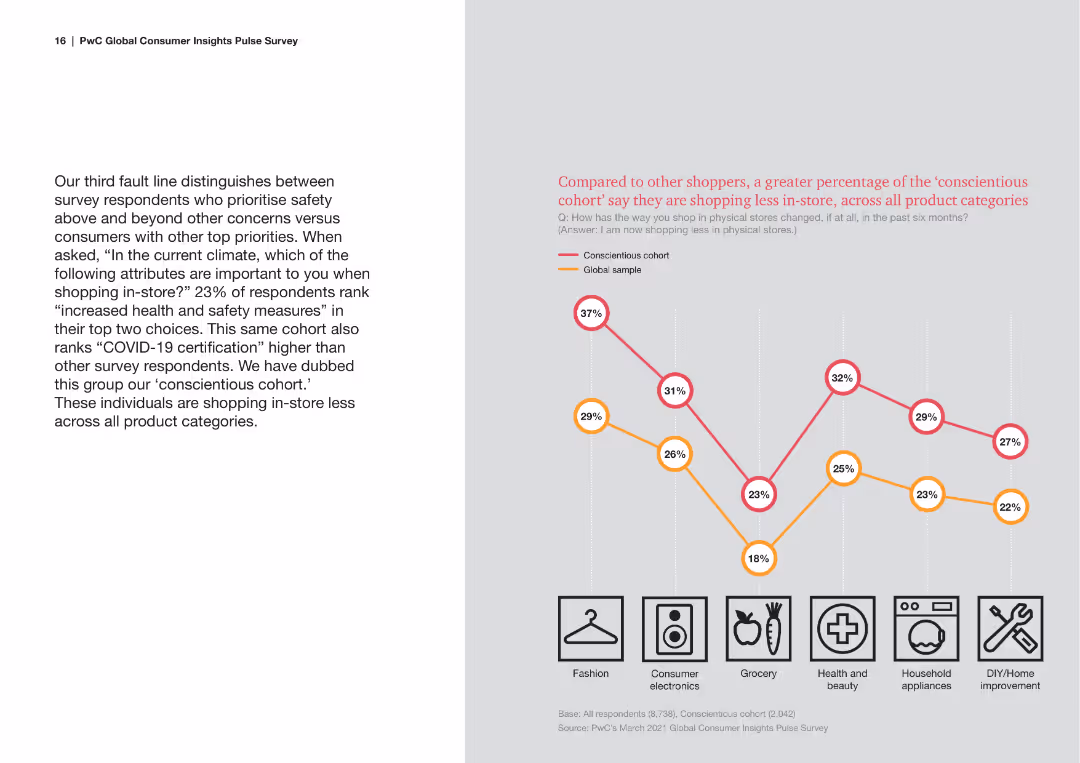
Features a line chart comparing the shopping frequency of different cohorts, with text blocks providing context. The design is clean with a focus on the chart data.
Market Analysis and Trends
Consumer Goods
This slide discusses the conscientious cohort, focusing on their shopping habits during the pandemic, especially their preference for health and safety measures.
Conscientious Consumers, Pandemic Impact, Shopping Frequency, Health and Safety, Consumer Behavior
false
Market Analysis and Trends
Consumer Goods
Mixed Chart
PwC/Strategy&
Add to my slides
Remove from favorites
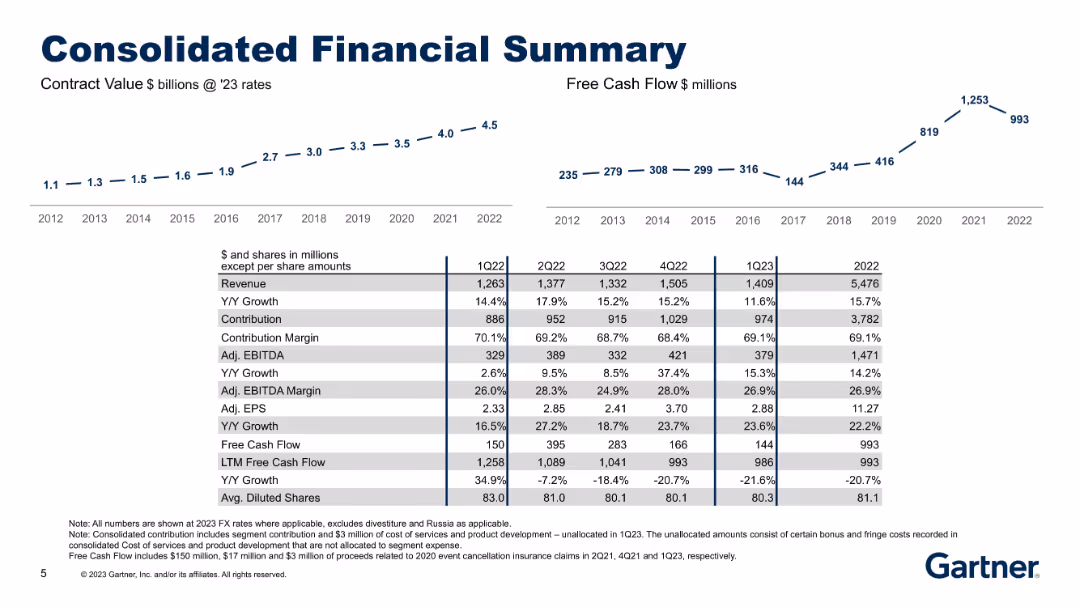
Dual time-series line charts (Contract Value, Free Cash Flow) with a comprehensive table summarizing revenue, EBITDA, EPS, and margins over several years.
Financial Performance
Technology & Software
Provides a historical view of the company’s consolidated financials from 2012–2022, including revenue, contribution, EBITDA, EPS, margins, and free cash flow. Useful for tracking long-term growth and financial health.
consolidated financials, historical trends, contract value, EBITDA, EPS
false
Financial Performance
Technology & Software
Multiple Chart
Gartner
Add to my slides
Remove from favorites
Features column charts that analyze revenue in crop protection and number of farms vs. size, alongside descriptive texts.
Investment Analysis
Agriculture & Food Production
Analyzes the consolidation in crop input providers, and growth of average farm size, signaling investment trends in the agriculture sector.
consolidation, agriculture, crop protection, farm size, revenue, investment trends
false
Investment Analysis
Agriculture & Food Production
Multiple Chart
EY
Add to my slides
Remove from favorites
Two-column layout with text on structural cost opportunities in 2023 and medium-term plans, including centralization, automation, and platform-driven scalability, with bullet points.
Operational Efficiency
Financial Services
The slide outlines structural cost opportunities through consolidation, focusing on centralization, automation, renegotiation, and long-term strategic plans for platform-driven scalability.
consolidation, cost, opportunities, centralization, automation
false
Operational Efficiency
Financial Services
Boxed
Credit Suisse
Add to my slides
Remove from favorites
Displays two line graphs for EU construction. Spending for construction starts in China. The slide is well-organized, using color effectively to differentiate data and highlight trends.
Market Analysis and Trends
Real Estate & Construction
Analyzes construction spending trends in the EU and starts in China, offering a comparative look at the growth in these regions. This slide is crucial for stakeholders in the construction and real estate sectors, providing insights into market dynamics and potential investment areas.
Construction, EU, China, Market Trends, Investment Opportunities
false
Market Analysis and Trends
Real Estate & Construction
Multiple Chart
Deutsche Bank
Add to my slides
Remove from favorites
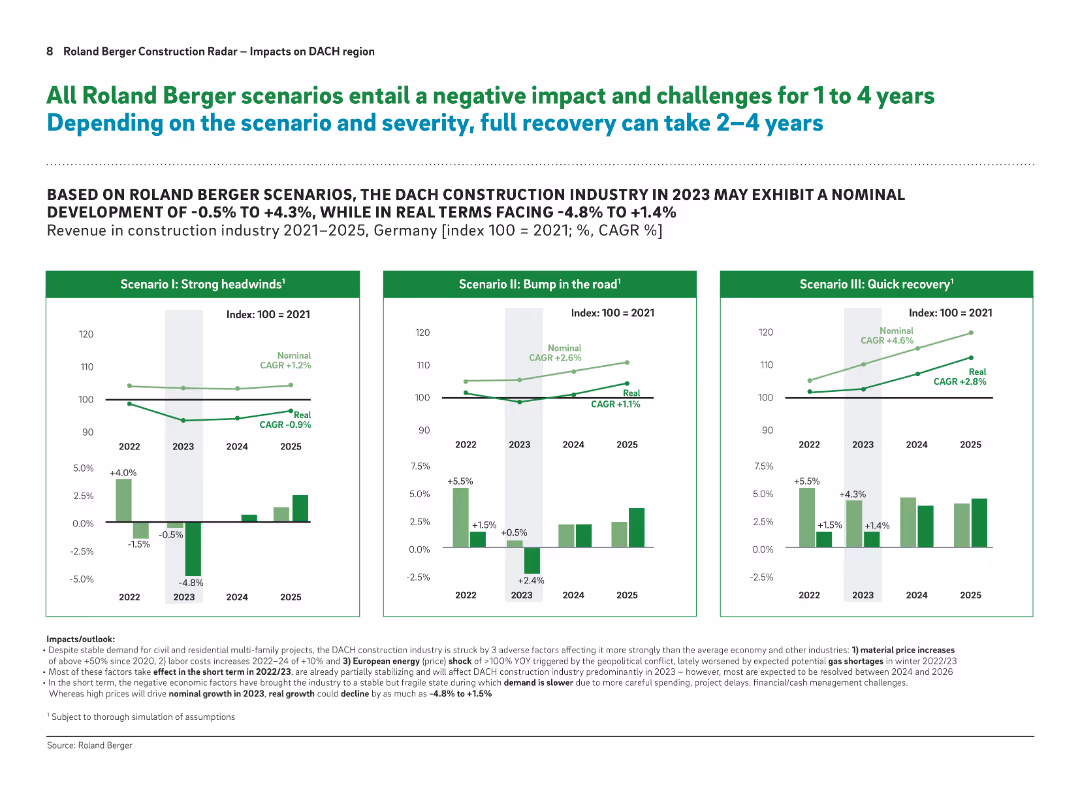
Three scenario panels with CAGR comparisons (nominal vs. real) for 2021–2025; descriptive bullet text below
Strategic Planning
Real Estate & Construction
This slide presents three potential future scenarios for Germany’s construction industry: strong headwinds, bump in the road, and quick recovery. Each scenario shows impacts on nominal and real growth, emphasizing a 1–4 year recovery period.
construction forecast, DACH, scenarios, growth rate, strategic planning, recovery time, risk outlook
false
Strategic Planning
Real Estate & Construction
Multiple Chart
Roland Berger
Add to my slides
Remove from favorites
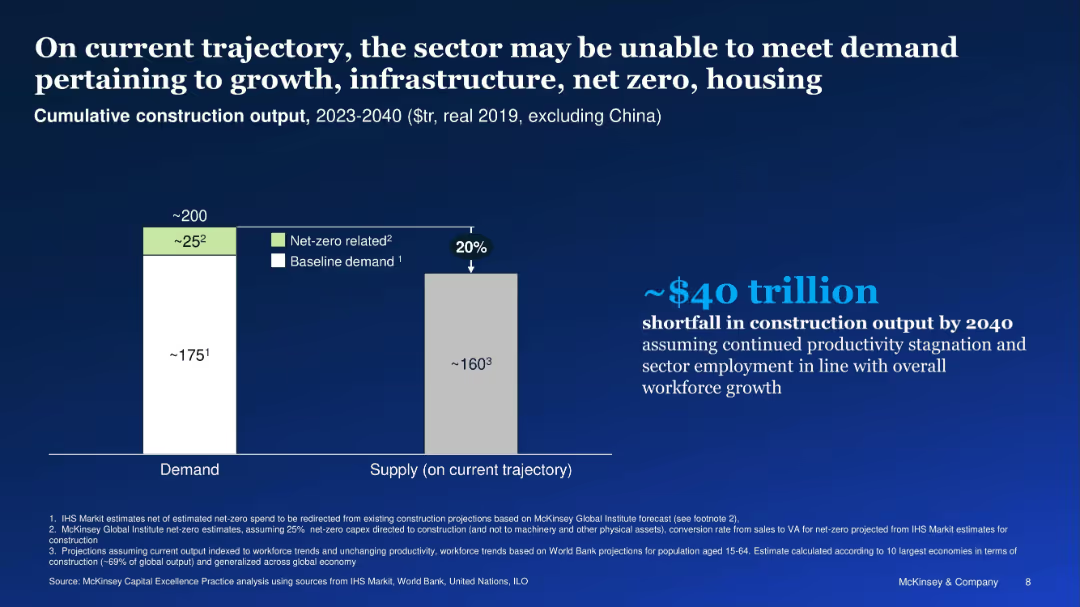
Bar chart comparing projected demand and supply; $40T gap highlighted
Strategic Planning
Real Estate & Construction
The slide forecasts a $40 trillion construction shortfall by 2040 if productivity and workforce trends do not improve. Demand for net-zero and infrastructure exceeds supply by ~20%, creating major output gaps.
construction gap, net-zero, demand vs. supply, productivity, output gap
false
Strategic Planning
Real Estate & Construction
Mixed Chart
McKinsey
Add to my slides
Remove from favorites
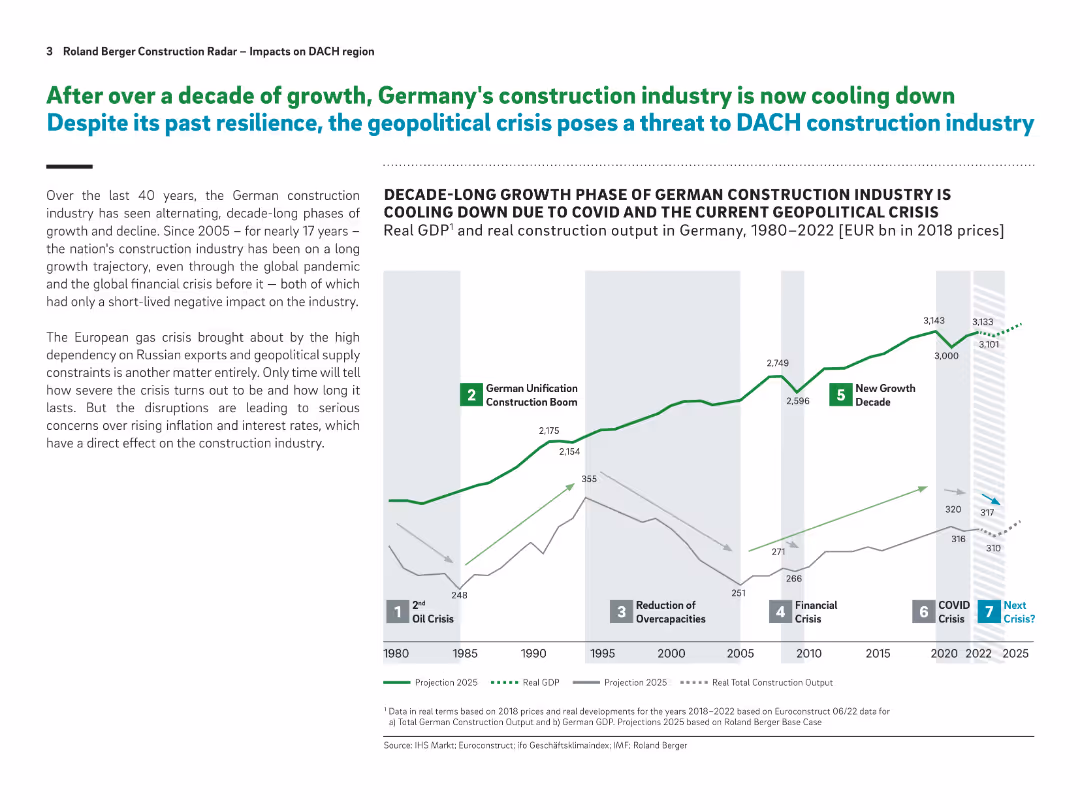
Timeline chart showing real GDP and construction output from 1980 to 2022 with projections; milestone annotations; text on the left
Market Analysis and Trends
Real Estate & Construction
This slide outlines historical and projected trends in Germany's construction industry, highlighting decade-long cycles and the impact of geopolitical crises. It shows how recent shocks like COVID-19 and the energy crisis are threatening growth.
construction, Germany, GDP, crisis, real estate, economic cycles, projections, DACH region
false
Market Analysis and Trends
Real Estate & Construction
Mixed Chart
Roland Berger
Add to my slides
Remove from favorites
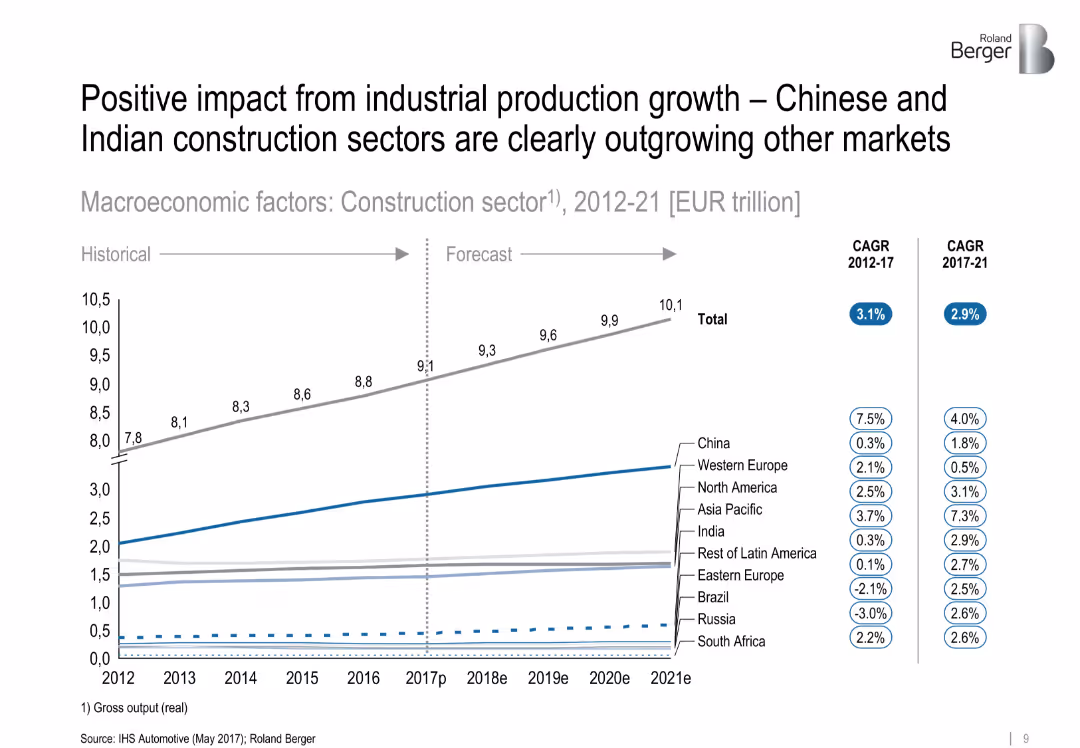
Line chart showing historical and forecasted construction sector output by region (2012–2021), with CAGR figures in side legends. Clean layout with subtle color coding and segmentation by region.
Market Analysis and Trends
Industrial & Manufacturing
The slide presents growth projections for the global construction sector, highlighting that China and India are significantly outpacing other regions. It includes CAGR data from 2012–2017 and forecasts for 2017–2021, showing clear segmentation by geographic region.
['construction', 'industrial production', 'growth forecast', 'China', 'India', 'CAGR', 'regional comparison', 'market trend']
false
Market Analysis and Trends
Industrial & Manufacturing
Single Chart
Roland Berger
Add to my slides
Remove from favorites
Four-part recommendation layout to the right, stress bar chart on left, supporting context and quote below
Market Analysis and Trends
Real Estate & Construction
Discusses Infrastructure and Construction, identifying extreme stress levels. Notes challenges such as low productivity, cost inflation, and regulatory delays. Recommends strategies like better project planning, commercial decision-making, delivery oversight, and capacity partnerships.
construction, infrastructure, regulation, project delivery, stress forecast, productivity, cost inflation, project planning
false
Market Analysis and Trends
Real Estate & Construction
Mixed Chart
Alvarez & Marsal
Add to my slides
Remove from favorites
This slide presents a column chart with estimated completions of consumer apartment projects under construction, divided by quarters and marked with 'ACT' for actual and 'EST' for estimate. A sidebar contains additional notes on revenue from apartments under construction.
Market Analysis and Trends
Real Estate & Construction
The slide shows trends in housing completions, indicating declines and a forecasted peak, likely used for analyzing market dynamics or for investment planning.
Construction, Market Trends, Forecast, Housing, Revenue, Apartments, Peak, Decline, Q4, Estimations
false
Market Analysis and Trends
Real Estate & Construction
Multiple Chart
Goldman Sachs
Add to my slides
Remove from favorites
Title-heavy layout with dual-column structure and horizontal bar chart on optimism levels in construction market
Industry Overview
Real Estate & Construction
Discusses the outlook of the global engineering and construction industry post-COVID. Most respondents optimistic, especially infrastructure owners. Chart shows varying levels of optimism by organization type.
construction outlook, optimism, ESG, growth sentiment, infrastructure, bar chart, KPMG survey, post-COVID
false
Industry Overview
Real Estate & Construction
Mixed Chart
KPMG
Add to my slides
Remove from favorites
Bar graph comparing 2000, 2023, 2040 output levels; trend lines show growth rates
Strategic Planning
Real Estate & Construction
This slide illustrates that annual construction output must double its growth rate (from 1.3% to 2.7% p.a.) to meet projected needs by 2040. Net-zero related construction is expected to drive a large portion of this increase.
construction output, growth rate, net-zero, global forecast, trends
false
Strategic Planning
Real Estate & Construction
Single Chart
McKinsey
Add to my slides
Remove from favorites
Visualizes NYC construction permit changes with a column chart and future recovery projections with a dotted line chart, showing both immediate impacts and recovery outlook.
Market Analysis and Trends
Real Estate & Construction
Evaluates the impact of the pandemic on the construction industry, showing immediate declines in activity and projections for recovery, emphasizing the slower than average rebound.
construction, pandemic, NYC, permits, recovery projections, bar chart, line chart
false
Market Analysis and Trends
Real Estate & Construction
Multiple Chart
BCG
Add to my slides
Remove from favorites
Dual chart showing building permits (value vs. volume) and growth rate differences; explanatory text on the left
Performance Metrics and KPIs
Real Estate & Construction
This slide focuses on the divergence between building permit volume and value in Germany. It shows permit numbers declining while values increase, indicating rising costs and reduced construction activity, with concern about future order flow.
construction permits, Germany, building index, value vs volume, KPIs, inflation impact, housing
false
Performance Metrics and KPIs
Real Estate & Construction
Multiple Chart
Roland Berger
Add to my slides
Remove from favorites
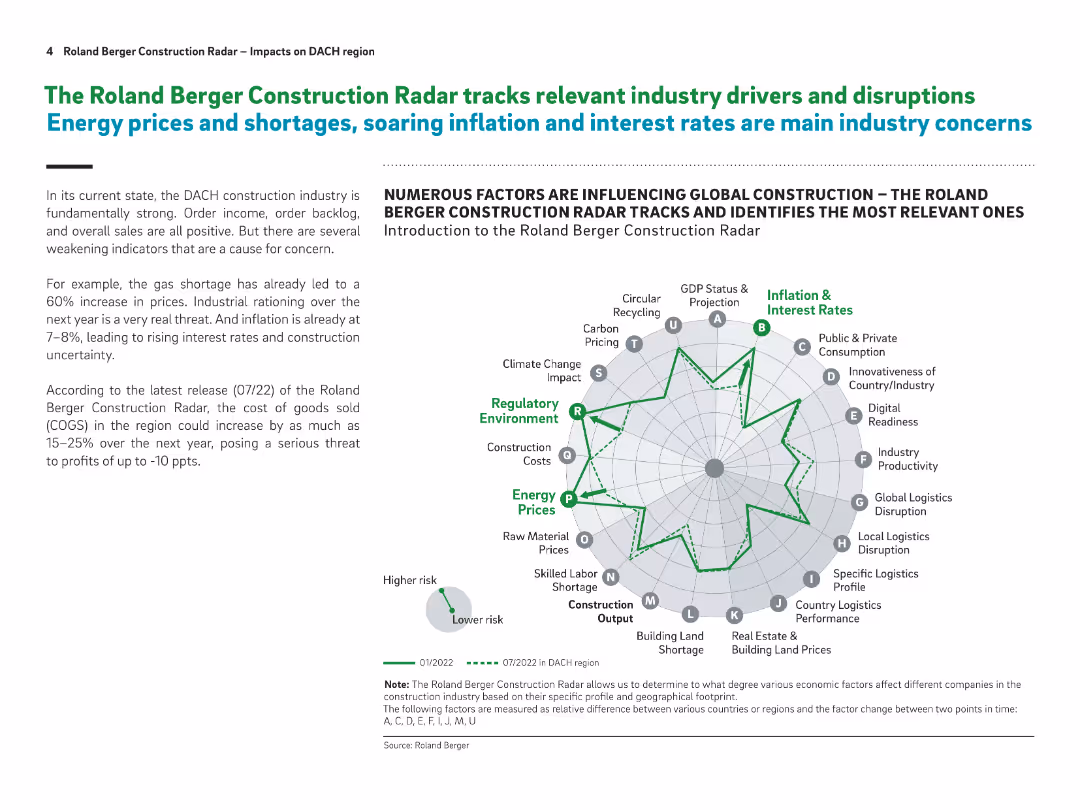
Radar chart of 20 industry risk drivers; explanatory text on the left and bottom; key risks like energy prices, inflation, and interest rates highlighted
Risk Assessment and Management
Real Estate & Construction
This slide introduces Roland Berger's Construction Radar and its 20 tracked indicators, showing rising risks in inflation, energy prices, and regulatory conditions. It provides insights into industry volatility and changing macroeconomic pressures.
construction radar, inflation, interest rates, risk assessment, DACH region, energy crisis, macro trends
false
Risk Assessment and Management
Real Estate & Construction
Mixed Chart
Roland Berger
Add to my slides
Remove from favorites
Features a line graph comparing trends in residential and nonresidential construction spending in the U.S. The slide is detailed with continuous data lines in different colors for distinction.
Market Analysis and Trends
Real Estate & Construction
Reviews trends in U.S. construction spending, highlighting the growth in residential and nonresidential sectors. This slide is useful for market analysis in real estate and construction sectors, offering insights into economic health and development opportunities.
Construction, Real Estate, US, Spending Trends, Growth Analysis
false
Market Analysis and Trends
Real Estate & Construction
Single Chart
Deutsche Bank
Add to my slides
Remove from favorites
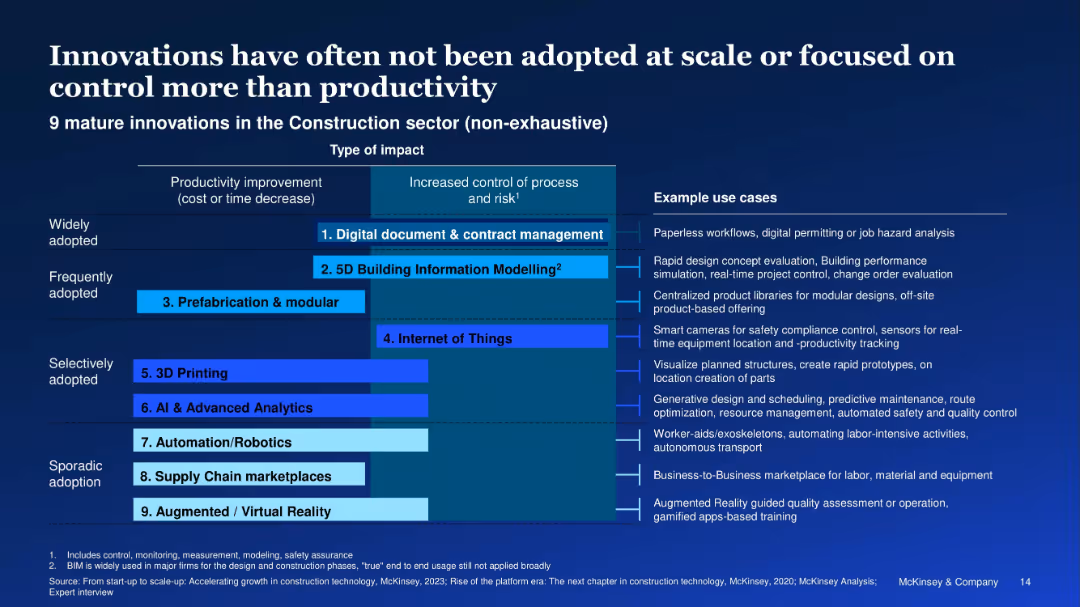
Matrix categorizing 9 innovations by adoption level and impact; use case examples on right
Technology and Digital Transformation
Real Estate & Construction
A framework ranking 9 construction innovations by adoption and type of impact. Highlights that widely adopted tools favor control over productivity, with sporadic adoption of high-impact technologies like AI and robotics.
construction tech, innovation, adoption, AI, IoT, productivity control
false
Technology and Digital Transformation
Real Estate & Construction
Mixed Chart
McKinsey
Add to my slides
Remove from favorites
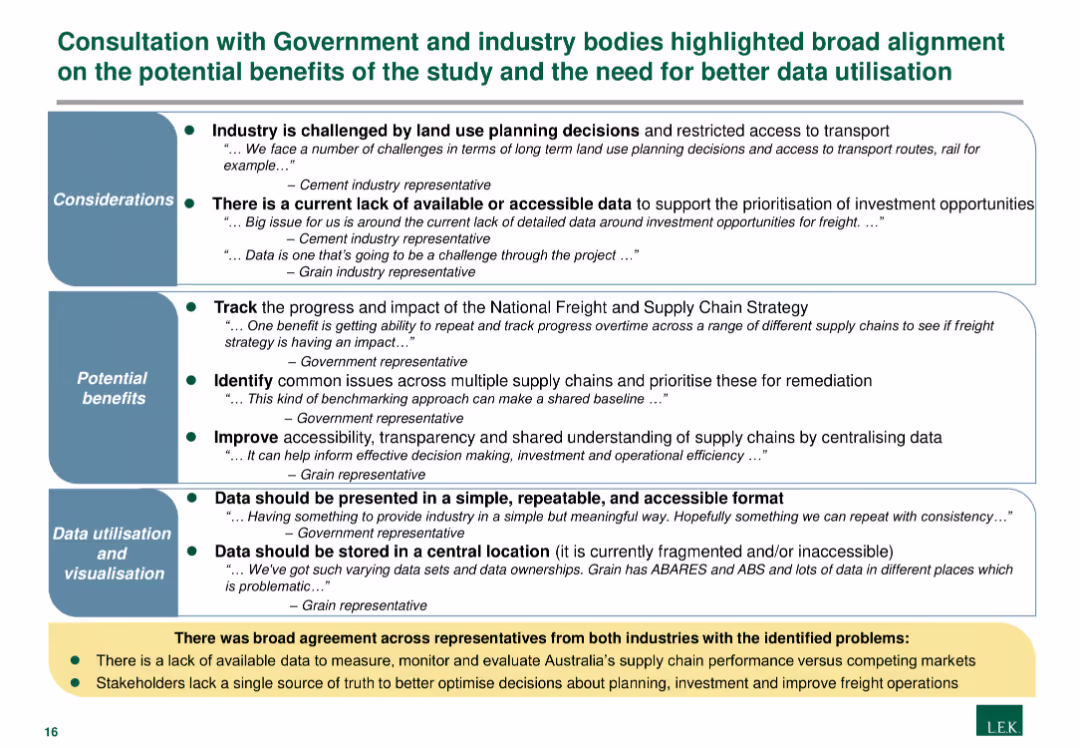
This slide has text sections with bullet points detailing considerations, potential benefits, and data utilisation related to freight and supply chain strategy.
Regulatory and Compliance
Government & Public Sector
The slide summarizes consultations with government and industry on the benefits of the study, emphasizing the need for better data utilization for strategic planning.
Consultation, Government, Data, Utilization, Benefits
false
Regulatory and Compliance
Government & Public Sector
Header Vertical
LEK
Add to my slides
Remove from favorites
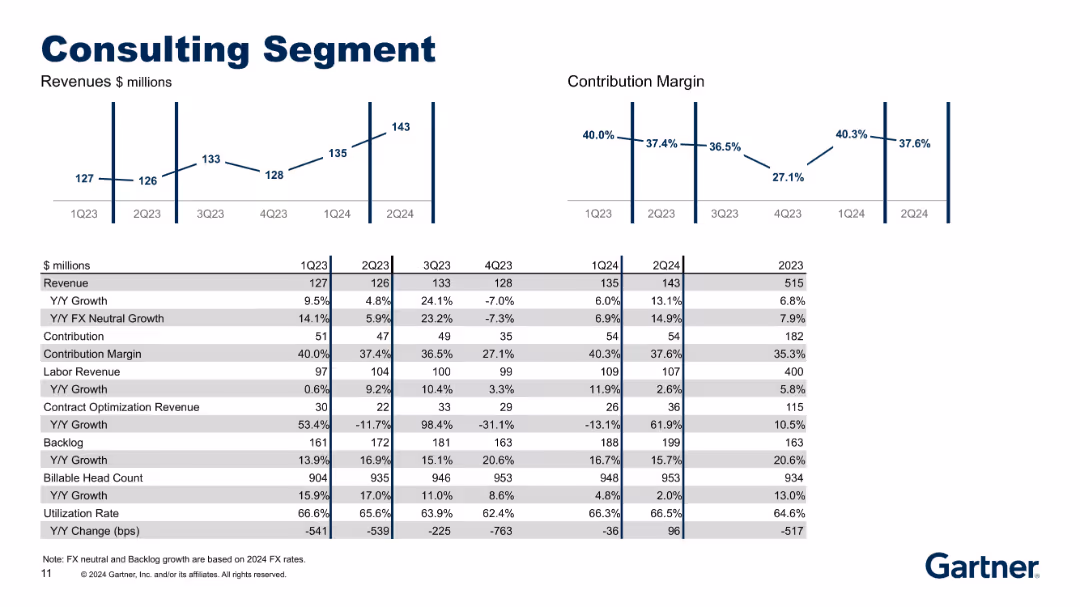
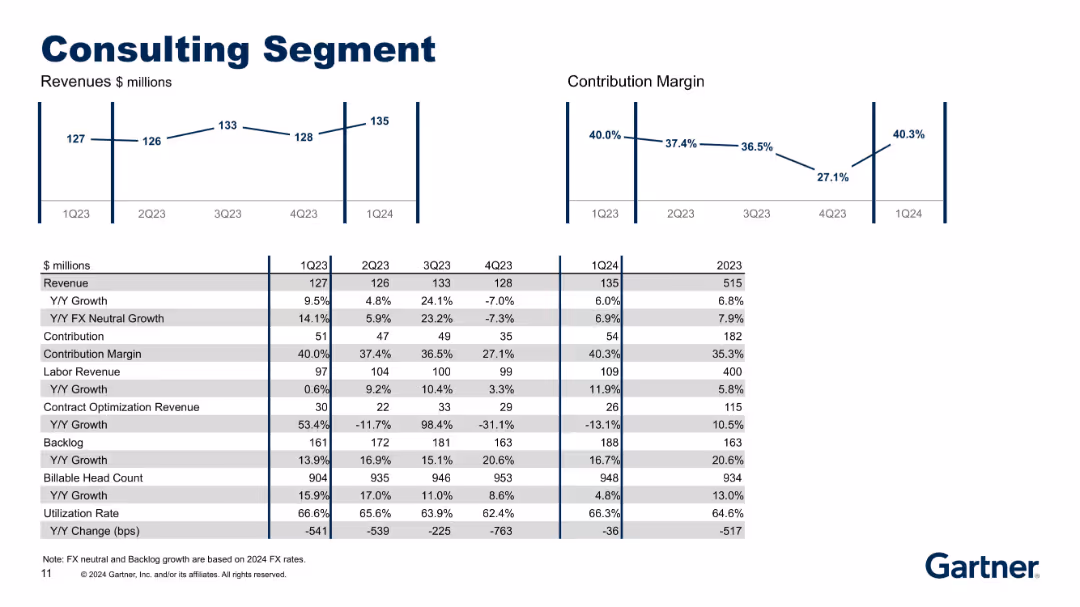
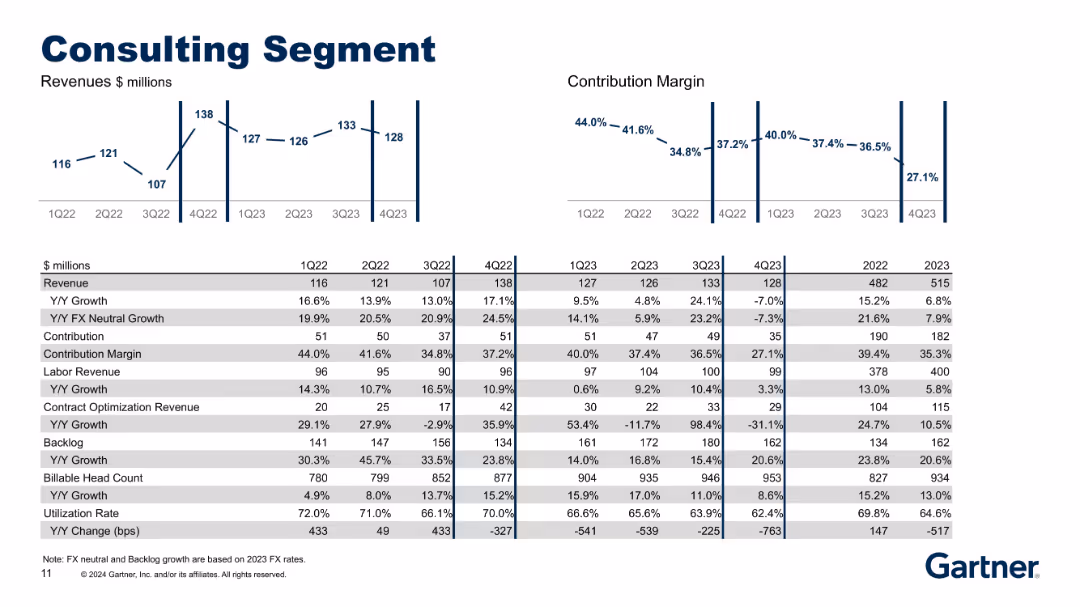
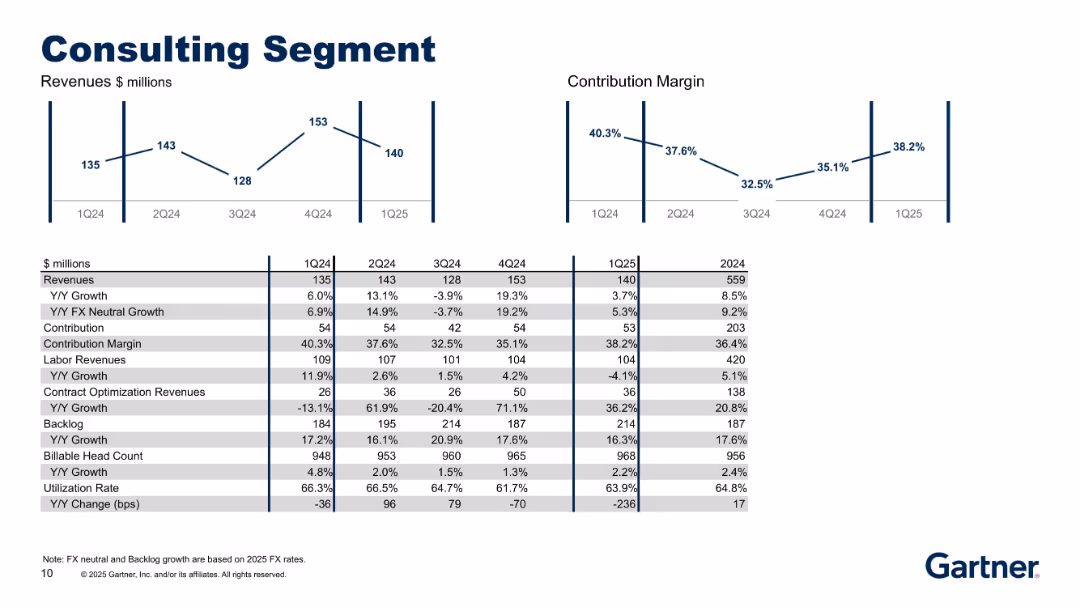
Mirrors structure of prior Consulting slide: visual trends at top, detailed tabular data on KPIs and metrics at bottom.
Performance Metrics and KPIs
Professional Services
Updated through 2Q24, the slide shows Consulting segment's revenue and margin progression. Includes breakdowns for labor and contract optimization revenue, backlog trends, billable headcount, and utilization, enabling evaluation of capacity and profitability.
Consulting, Backlog, Revenue, Utilization, Labor, KPIs
false
Performance Metrics and KPIs
Professional Services
Multiple Chart
Gartner
Add to my slides
Remove from favorites
Includes revenue and margin charts above a detailed financial and operational table (e.g., backlog, utilization, headcount). Simple layout with emphasis on growth rates.
Product and Service Analysis
Professional Services
Summarizes the Consulting segment’s revenue, margin, and key drivers like backlog, billable headcount, and utilization rate. Shows how consulting performance has evolved and how labor vs. optimization revenue contribute to segment success.
consulting, backlog, utilization, labor revenue, growth, margins
false
Product and Service Analysis
Professional Services
Multiple Chart
Gartner
Add to my slides
Remove from favorites
Slide detailing the benefits of Gartner consulting services, with charts showing quarterly revenue and contribution margin trends.
Strategic Planning
Professional Services
This slide explains how Gartner's consulting services assist clients with strategic initiatives, supported by revenue and contribution margin data.
Consulting, Gartner, strategic initiatives, revenue, contribution margin
false
Strategic Planning
Professional Services
Multiple Chart
Gartner
Add to my slides
Remove from favorites
Map and text slide providing an overview of A.T. Kearney’s global presence, client base, and team structure.
Industry Overview
Professional Services
Provides an overview of A.T. Kearney's global scale in consulting across various industries, functions, and geographies, with significant client and team details.
consulting, global, industries, clients, team
false
Industry Overview
Professional Services
Graphic
Kearney
Add to my slides
Remove from favorites
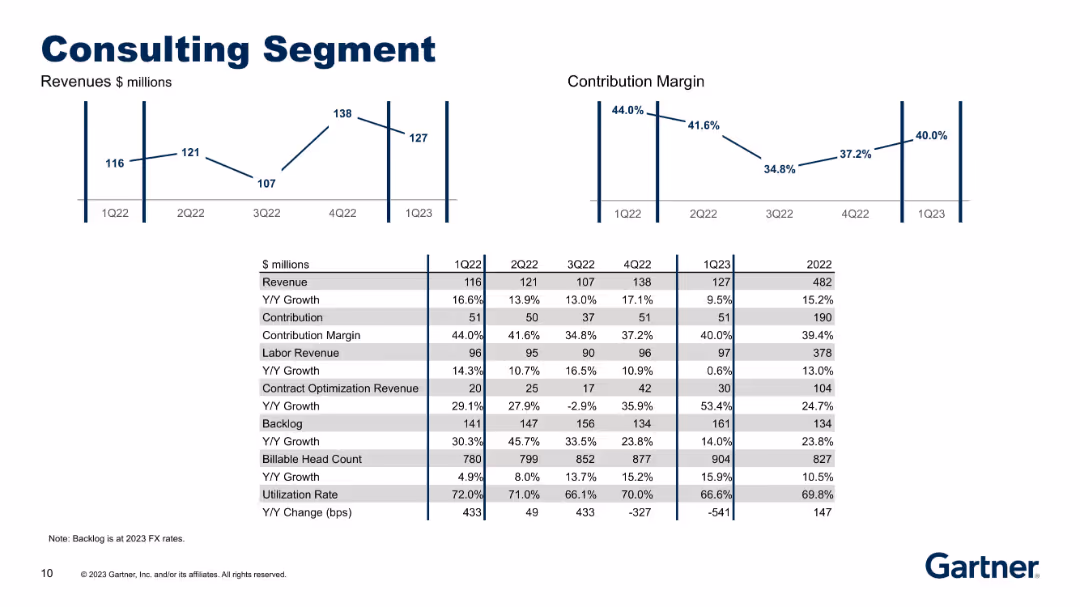
Two line charts on top (Revenue and Contribution Margin) with a detailed multi-row table below; simple, clean layout with alternating gray/white rows.
Performance Metrics and KPIs
Professional Services
Highlights financial performance of the Consulting segment, including revenue breakdowns, Y/Y growth, contribution, backlog, labor vs. contract revenue, headcount, and utilization rates. It shows variability across quarters and operational indicators.
consulting, margin, headcount, backlog, utilization, revenue, growth
false
Performance Metrics and KPIs
Professional Services
Multiple Chart
Gartner
Add to my slides
Remove from favorites
World map with red dots indicating company locations, larger red circles marking specific cities (Helsinki, Oslo, etc.) with numbers, large bold title text at the top.
Industry Overview
Professional Services
This slide highlights Bain & Company's position as a leading consulting firm in the Nordics, showcasing their staff and collaboration with QVARTZ. Ideal for corporate presentations and company overviews.
consulting, Nordics, Bain & Company, QVARTZ, global, local knowledge, powerhouse
false
Industry Overview
Professional Services
Graphic
Bain
Add to my slides
Remove from favorites
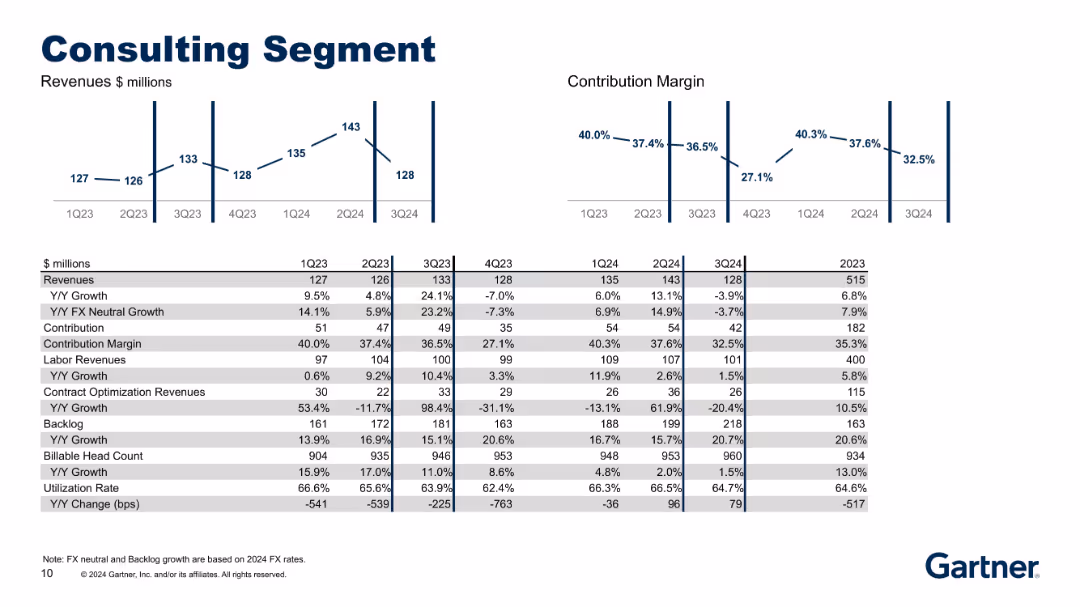
Similar format to 18651: charts for Revenue and Contribution Margin followed by a detailed data table.
Performance Metrics and KPIs
Professional Services
The slide provides a detailed performance breakdown for the Consulting Segment, including revenue, margin, headcount, utilization, and backlog data across quarters. It differentiates labor vs. contract optimization revenue, and highlights YoY growth and utilization shifts.
consulting, revenue, backlog, utilization, contribution, growth
false
Performance Metrics and KPIs
Professional Services
Multiple Chart
Gartner
Add to my slides
Remove from favorites
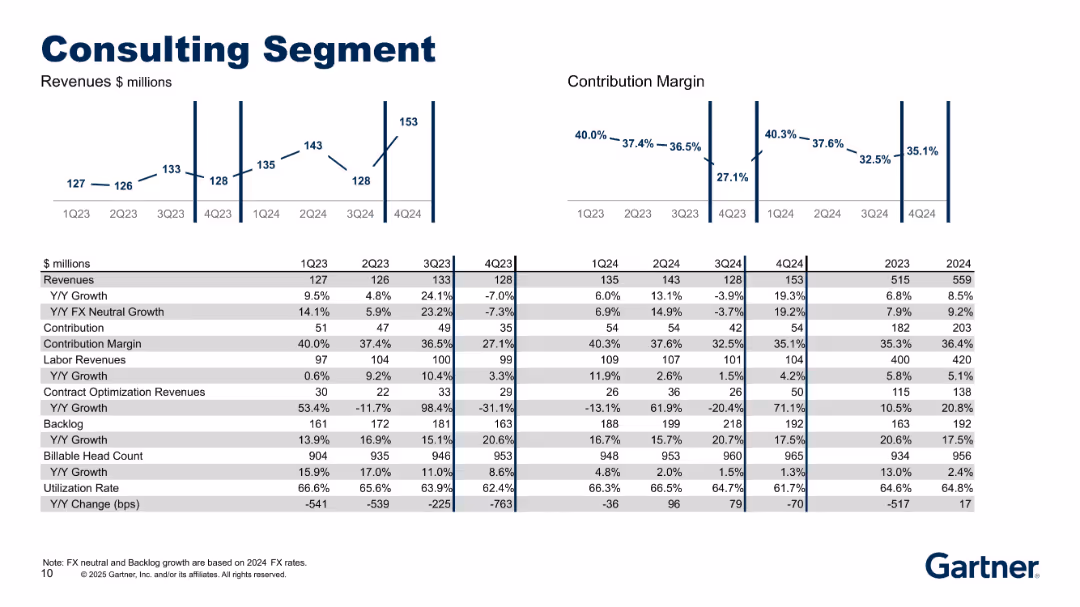
Updated from 18624, includes 1Q24–3Q24. Same layout with revenue/margin charts and operational data such as backlog and utilization.
Product and Service Analysis
Professional Services
Most recent financial and operational overview of the Consulting segment. Allows tracking of momentum and efficiency, with insights into headcount, backlog strength, and revenue distribution between labor and optimization services.
consulting, revenue, backlog, utilization, labor, FX-neutral growth
false
Product and Service Analysis
Professional Services
Multiple Chart
Gartner
Add to my slides
Remove from favorites
Symmetrical layout with bar/line visuals on top and detailed financial metrics in tabular format below.
Performance Metrics and KPIs
Professional Services
Focused on the Consulting segment, this slide tracks revenue, growth, and contribution margins alongside metrics like labor revenue, contract optimization revenue, backlog, and utilization rate. It reflects operational and staffing efficiency over time.
Consulting, Revenue, Backlog, Utilization, Labor, Growth
false
Performance Metrics and KPIs
Professional Services
Multiple Chart
Gartner
Add to my slides
Remove from favorites
This slide features a table and two line charts showing financial performance, including revenue and contribution margin trends for the consulting segment.
Market Analysis and Trends
Professional Services
It details the consulting segment's financial metrics, including revenue growth, contribution margins, labor revenue, and headcount utilization rates.
Consulting, Revenue, Growth, Contribution Margin, Labor Revenue, Headcount Utilization
false
Market Analysis and Trends
Professional Services
Multiple Chart
Gartner
Add to my slides
Remove from favorites
Charts and data table displaying consulting revenues, contribution margin, labor revenues, backlog, etc.
Performance Metrics and KPIs
Professional Services
Provides a breakdown of the Consulting segment’s performance with revenue streams (labor and contract optimization), headcount, backlog, utilization, and YoY trends. Shows growth and fluctuating contribution margins.
consulting, revenue, labor, contract optimization, utilization, backlog, growth, segment analysis, Gartner
false
Performance Metrics and KPIs
Professional Services
Multiple Chart
Gartner
Add to my slides
Remove from favorites
A combination of a column chart and pie chart showing the global consulting revenue in 2021. The column chart compares revenue changes from 2020, while the pie chart highlights the top 7 vendors' share.
Financial Performance
Professional Services
This slide presents data on the significant increase in consulting spending in 2021, with detailed revenue figures and market shares of the leading consulting firms.
Consulting Spending, Revenue, Top Vendors, Market Share, Financial Data
false
Financial Performance
Professional Services
Multiple Chart
Gartner
Add to my slides
Remove from favorites
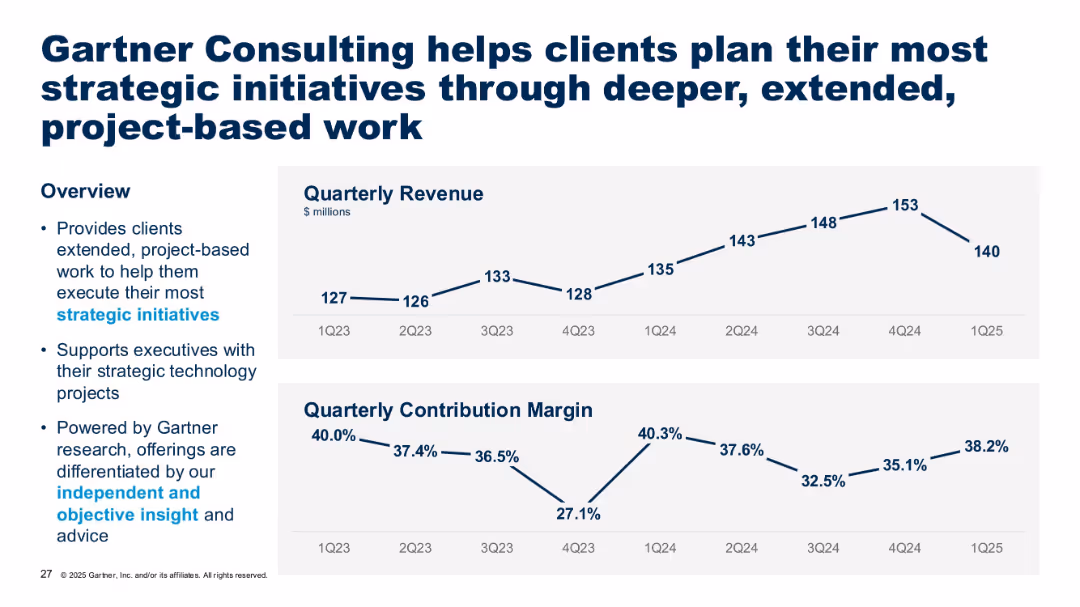
Line graphs showing quarterly revenue and contribution margin; text section explains consulting’s strategic role.
Sales and Business Development
Technology & Software
Gartner Consulting supports client strategic initiatives with extended, project-based services. The slide shows consistent revenue growth and discusses how the consulting segment leverages Gartner research for objective guidance.
consulting, strategy, Gartner, project-based work, revenue, contribution
false
Sales and Business Development
Technology & Software
Multiple Chart
Gartner
Add to my slides
Remove from favorites
The slide has several bar charts comparing consumer attitudes in Germany, the US, and China on various aspects such as safety, willingness to pay for connected services, and opinions on BEV cars.
Market Analysis and Trends
Consumer Goods
This slide summarizes the latest consumer attitudes in CASE (Connected, Autonomous, Shared, and Electric) across Germany, the US, and China, focusing on safety, navigation, and preferences for connected car services.
consumer attitudes, CASE, market trends, Germany, US, China, safety, connected services, bar charts
false
Market Analysis and Trends
Consumer Goods
Multiple Chart
PwC/Strategy&
Add to my slides
Remove from favorites
The slide features a column chart showing consumer balance sheet details, a line chart on household debt service ratio, and a line chart on early delinquencies. Visual elements include multiple charts, color-coded sections, and various data points.
Market Analysis and Trends
Financial Services
The slide discusses the state of consumer balance sheets, household debt service ratios, and flows into early delinquencies, providing an overview of financial health in Q3 2023.
consumer balance sheet, household debt, delinquencies, financial health, Q3 2023
false
Market Analysis and Trends
Financial Services
Multiple Chart
JP Morgan
Add to my slides
Remove from favorites
This slide is filled with textual content and data-centric elements, including a column chart with red annotations and a table with numeric values. The use of blue color coding organizes the information into three sections, highlighting key business metrics from 2014 to 2019.
Financial Performance
Financial Services
It demonstrates the momentum across key business drivers, with comparisons of year-over-year and compound annual growth rates in consumer and business banking. The included data elements and textual descriptions suggest that the slide is used to convey the financial strength and growth within the banking sector, specifically focusing on JPMorgan Chase & Co.'s performance.
Consumer Banking, Business Banking, Growth, Deposits, Investments, CAGR, Financial Strength, JPMorgan Chase & Co.
false
Financial Performance
Financial Services
Table
JP Morgan
Add to my slides
Remove from favorites
Features a circular diagram centered around "Consumer Banking" with associated sectors and icons, as well as a bar chart for statistical representation.
Industry Overview
Financial Services
Outlines the cross-product engagement of consumer banking customers, showcasing the interconnectivity of different banking services and their contribution to the firm's value.
consumer banking, cross-product, engagement, financial services, business banking, wealth management, home lending, credit card, customer relationships
false
Industry Overview
Financial Services
Diagram
JP Morgan
Add to my slides
Remove from favorites
Title at the top, three columns with text and checkmarks. The left shows financial targets, the middle details product attributes, and the right column provides a progress and plan overview with blue text boxes.
Strategic Planning
Financial Services
Presents a plan to scale digital consumer banking with a focus on product simplicity, transparency, and security, alongside a progress report on launched products and growth strategies.
Consumer Banking, Digital, Transparency, Security, Product Launch
false
Strategic Planning
Financial Services
Table
Goldman Sachs
Add to my slides
Remove from favorites
Text describing the consumer deposit strategy, accompanied by graphs and location rank tables. Image of a digital banking award and associated graphics.
Market Analysis and Trends
Financial Services
Analysis of strategic investments in the consumer deposit area, with market share gains and product details. Used for presenting consumer banking strategies and achievements.
consumer banking, market share, deposit strategy, digital banking, financial growth
false
Market Analysis and Trends
Financial Services
Header Horizontal
Morgan Stanley
Add to my slides
Remove from favorites
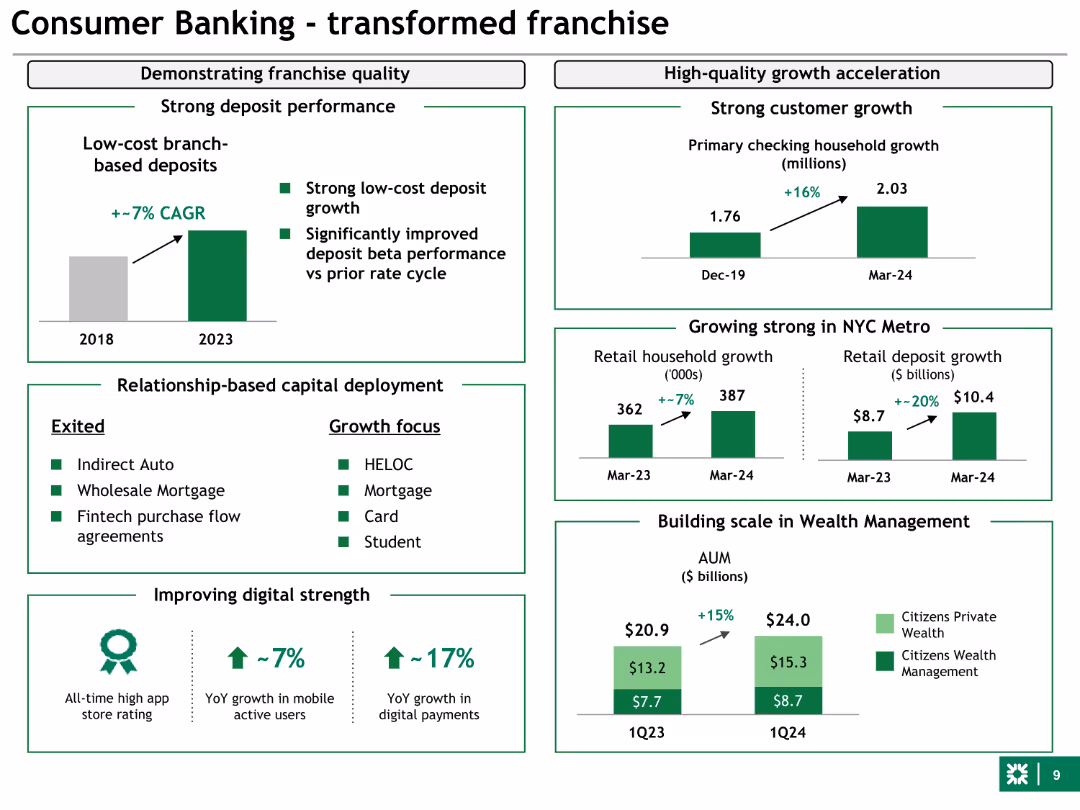
Combination of bar charts, bullet points, and icons. Highlights strong deposit performance, customer growth, and digital strength with green for emphasis.
Strategic Planning
Financial Services
This slide outlines the transformation in consumer banking, showing growth in deposits, customer numbers, and digital engagement. It details exited and growth focus areas.
consumer banking, transformation, growth, digital, deposits
false
Strategic Planning
Financial Services
Multiple Chart
Barclays
Add to my slides
Remove from favorites
Features two graphs showing trends in consumer behavior changes towards online shopping and brand loyalty.
Customer and Market Segmentation
Retail & E-commerce
Discusses significant shifts in consumer and business purchasing behaviors, emphasizing increased online engagement and brand switching post-COVID-19.
Consumer Behavior, B2B, B2C, Online Shopping, Brand Loyalty
false
Customer and Market Segmentation
Retail & E-commerce
Multiple Chart
McKinsey
Add to my slides
Remove from favorites
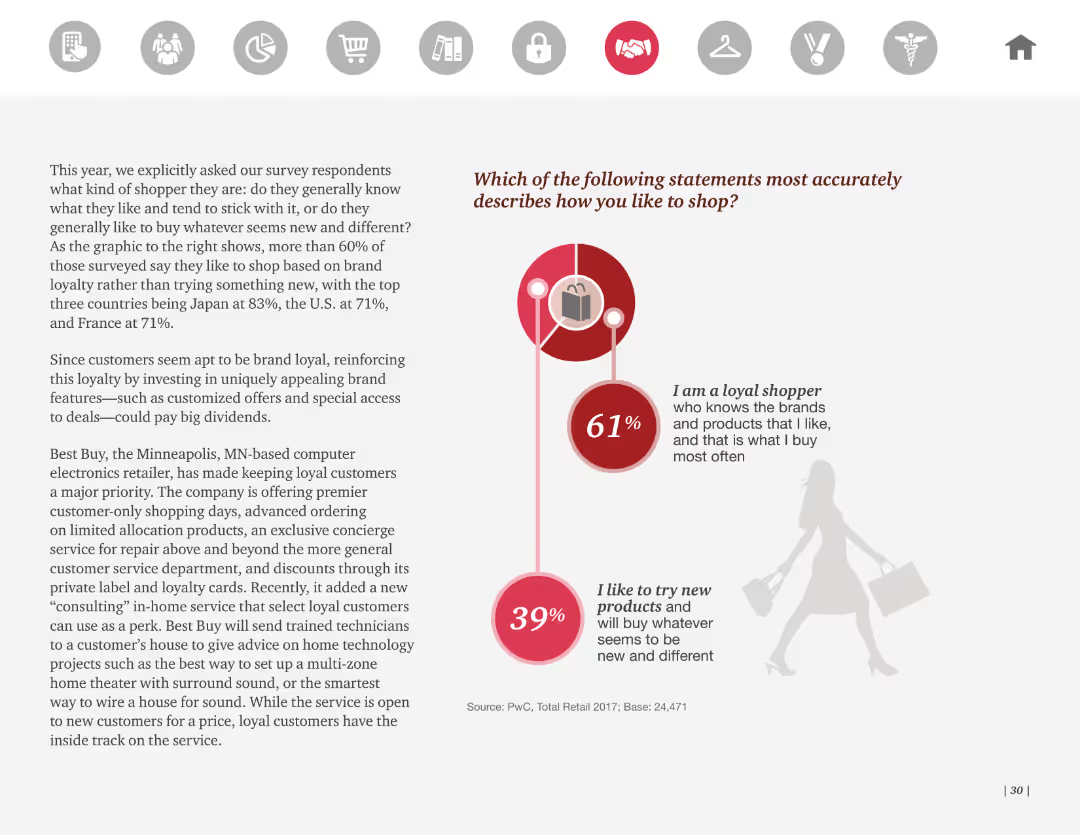
This slide shows a circular graph illustrating consumer preferences with two main categories. It includes supporting text and an illustration of a shopping figure. The design is straightforward, emphasizing brand loyalty among shoppers.
Market Analysis and Trends
Consumer Goods
The slide explores consumer shopping behavior, showing that 61% identify as loyal shoppers who stick to known brands, while 39% prefer to try new products. It discusses implications for retailers in enhancing customer loyalty through targeted offers.
Consumer behavior, brand loyalty, shopping, survey, trends
false
Market Analysis and Trends
Consumer Goods
Mixed Chart
PwC/Strategy&
Add to my slides
Remove from favorites
Contains multiple pie charts showing consumer behavior by city tier, icons depicting shopping behaviors, and text annotations.
Market Analysis and Trends
Retail & E-commerce
Analyzes consumer purchase behaviors in different city tiers, focusing on online and offline preferences, useful for understanding market dynamics and tailoring regional marketing strategies.
consumer behavior, city tiers, online shopping, retail strategies, market analysis, digital conversion, ROPO, tiered marketing, consumer journey
false
Market Analysis and Trends
Retail & E-commerce
Multiple Chart
BCG
Add to my slides
Remove from favorites
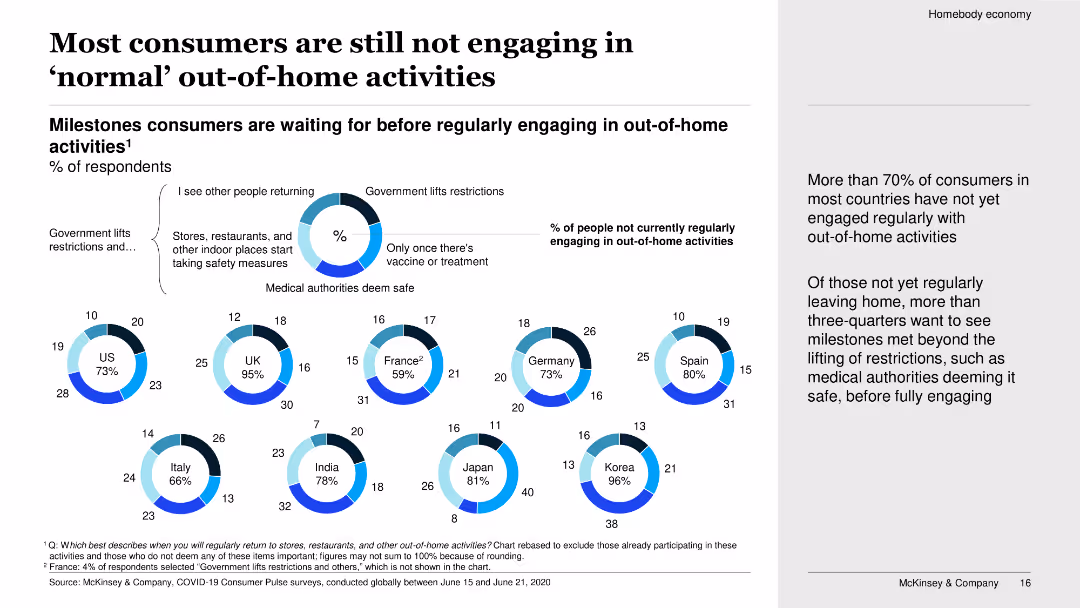
The slide uses a combination of donut charts and bullet points to show various milestones that consumers are waiting for before regularly engaging in out-of-home activities. The layout is clean with a focus on data visualization.
Market Analysis and Trends
Consumer Goods
The slide discusses the percentage of consumers in various countries who have not yet engaged in regular out-of-home activities. It highlights the milestones consumers are waiting to see before they resume such activities, such as government lifting restrictions and stores taking safety measures.
Consumer behavior, COVID-19 impact, out-of-home activities, survey data, milestones, engagement, safety measures, international, analysis, trends
false
Market Analysis and Trends
Consumer Goods
Multiple Chart
McKinsey
Add to my slides
Remove from favorites
Features graphics on changes in consumer spending and a column chart depicting industry impacts during COVID-19.
Strategic Planning
Consumer Goods
Highlights consumer behavior shifts due to the pandemic and how companies can adapt by using agile and digital strategies for volatility.
consumer behavior, COVID-19, industry impact, digital transformation, agile strategies, spending shifts
false
Strategic Planning
Consumer Goods
Table
BCG
Add to my slides
Remove from favorites
This slide features text and a column chart illustrating consumer behavior changes during the COVID-19 pandemic. The design is detailed yet organized.
Market Analysis and Trends
Consumer Goods
The slide discusses the impact of COVID-19 on consumer behavior, highlighting key trends such as increased online shopping and changes in purchasing habits.
consumer behavior, COVID-19, online shopping, purchasing habits, survey results, 2021 trends
false
Market Analysis and Trends
Consumer Goods
Multiple Chart
PwC/Strategy&
Add to my slides
Remove from favorites
Features comparative column charts and statistics on consumer activity changes, with clear visual elements to distinguish between the data points, emphasizing shifts in behavior and concerns.
Customer and Market Segmentation
Consumer Goods
Analyzes the evolving consumer behaviors in response to the COVID-19 pandemic, focusing on the increase in activities despite concerns, and the role of vaccination in enabling safer gatherings.
Consumer Behavior, COVID-19, Vaccination, Activities
false
Customer and Market Segmentation
Consumer Goods
Mixed Chart
BCG
Add to my slides
Remove from favorites
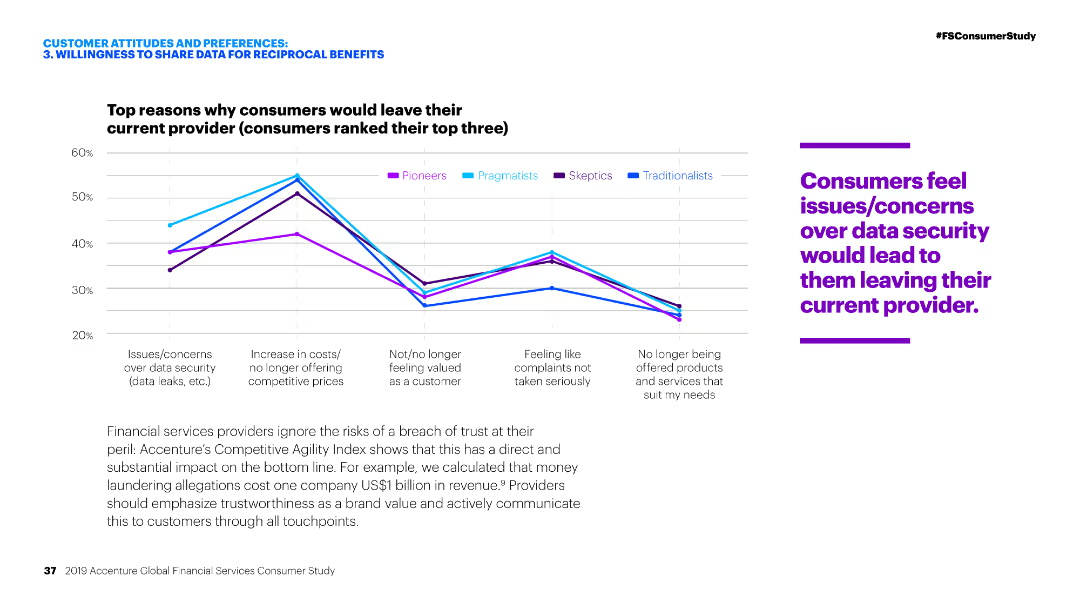
Line chart comparing reasons for leaving a provider among different customer segments.
Risk Assessment and Management
Financial Services
The slide outlines the top reasons consumers would leave their current financial service provider, with data security concerns being the most significant across all segments.
Consumer behavior, Data security, Financial services, Reasons for leaving, Customer retention
false
Risk Assessment and Management
Financial Services
Mixed Chart
Accenture
Add to my slides
Remove from favorites
The slide features multiple bar charts illustrating the motivation for visiting a dealer during various stages of a vehicle purchase. Each column represents a percentage with corresponding reasons listed vertically on the left. The visual is dense with text labels and percentage values.
Market Analysis and Trends
Transportation & Logistics
This slide analyzes consumer motivations for in-person interactions at car dealerships throughout different stages of the vehicle purchase process, highlighting areas such as researching, configuring, and scheduling services.
consumer behavior, dealership interaction, vehicle purchase, in-person preference, stage analysis
false
Market Analysis and Trends
Transportation & Logistics
Multiple Chart
McKinsey
Add to my slides
Remove from favorites
A slide that blends images and bulleted text highlighting key statistics and trends in consumer behavior, e-commerce growth, and emerging channels like the metaverse.
Market Analysis and Trends
Retail & E-commerce
Highlights shifts in consumer expectations and the growth of new sales and marketing channels, essential for strategic business adaptation and planning.
Consumer Behavior, E-commerce, Sales Trends, Marketing Strategy, Personalization, Virtual Assistants, Metaverse, Market Growth, Business Strategy, Technological Advancements
false
Market Analysis and Trends
Retail & E-commerce
Header Horizontal
BCG
Add to my slides
Remove from favorites
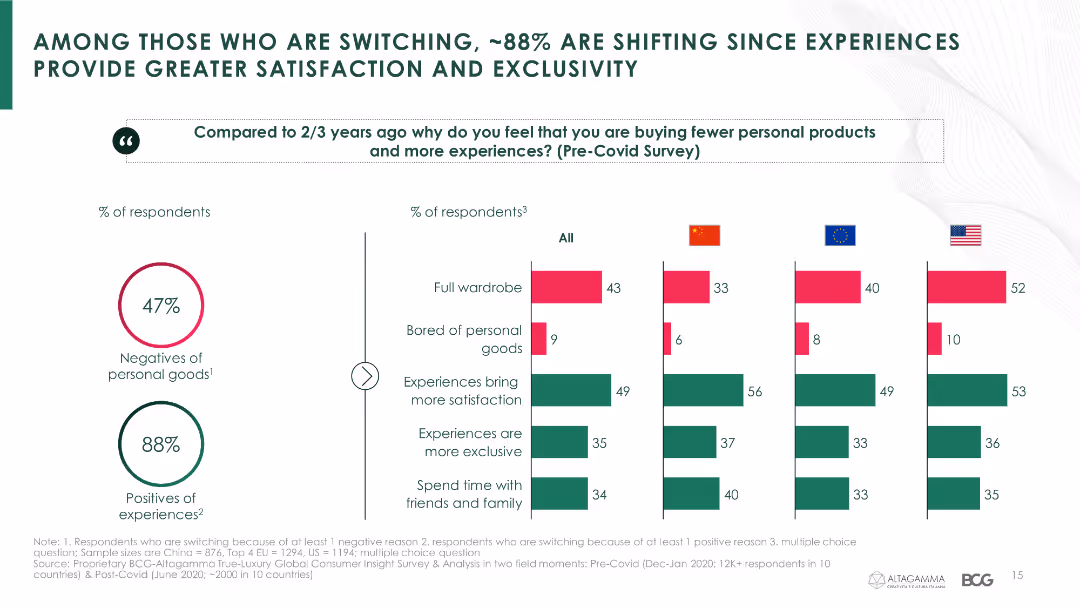
The slide contains a combination of column charts showing reasons why consumers are shifting from personal goods to experiences, segmented by country.
Market Analysis and Trends
Consumer Goods
It discusses the reasons behind consumers' shift from buying personal goods to investing in experiences, emphasizing satisfaction and exclusivity.
consumer behavior, experiential luxury, satisfaction, exclusivity, country comparison, COVID-19
false
Market Analysis and Trends
Consumer Goods
Multiple Chart
BCG
Add to my slides
Remove from favorites
The slide features multiple pie charts representing various consumer behaviors related to food consumption over 12 months.
Market Analysis and Trends
Agriculture & Food Production
Highlights the recent changes in consumer behavior regarding food consumption, emphasizing sustainable and health-conscious choices.
consumer behavior, food consumption, pie charts, sustainability, health
false
Market Analysis and Trends
Agriculture & Food Production
Multiple Chart
Deloitte
Add to my slides
Remove from favorites
Features icons and pie charts detailing consumer priorities when buying food, focusing on affordability and sustainability. The slide uses a simple, effective color scheme.
Customer and Market Segmentation
Agriculture & Food Production
Offers insights into consumer buying behaviors, focusing on the importance they place on affordability and sustainability when purchasing food. It also touches on broader health concerns affecting food safety and consumption habits.
consumer behavior, food safety, affordability, sustainability
false
Customer and Market Segmentation
Agriculture & Food Production
Multiple Chart
Deloitte
Add to my slides
Remove from favorites
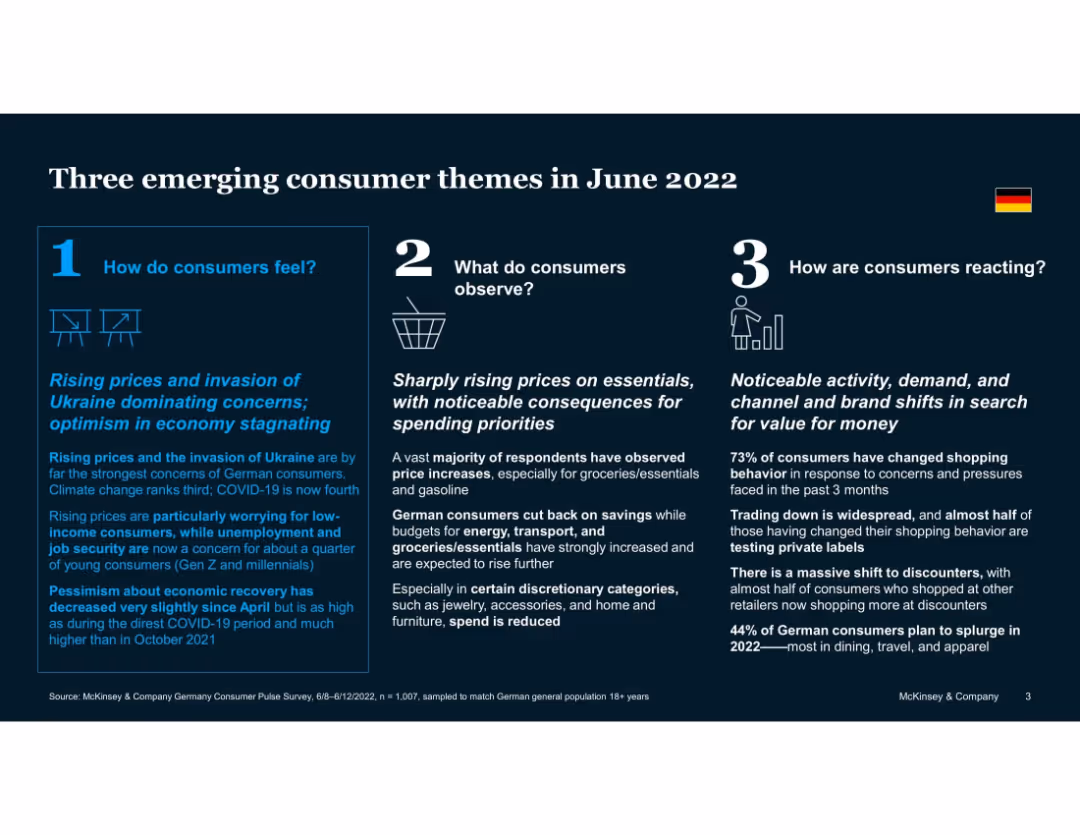
Three-column layout with icons, numbers, and colored text boxes. Each column represents a theme with associated text and insights.
Market Analysis and Trends
Consumer Goods
The slide outlines three key consumer behavior trends in Germany as of June 2022, driven by rising prices and geopolitical tensions. It explores consumer sentiment, observations, and reactions such as spending reductions and increased value-seeking behavior.
consumer behavior, inflation, Ukraine invasion, value-seeking, shopping patterns, private labels, discounting, Germany, market trends
false
Market Analysis and Trends
Consumer Goods
Pillar
McKinsey
Add to my slides
Remove from favorites
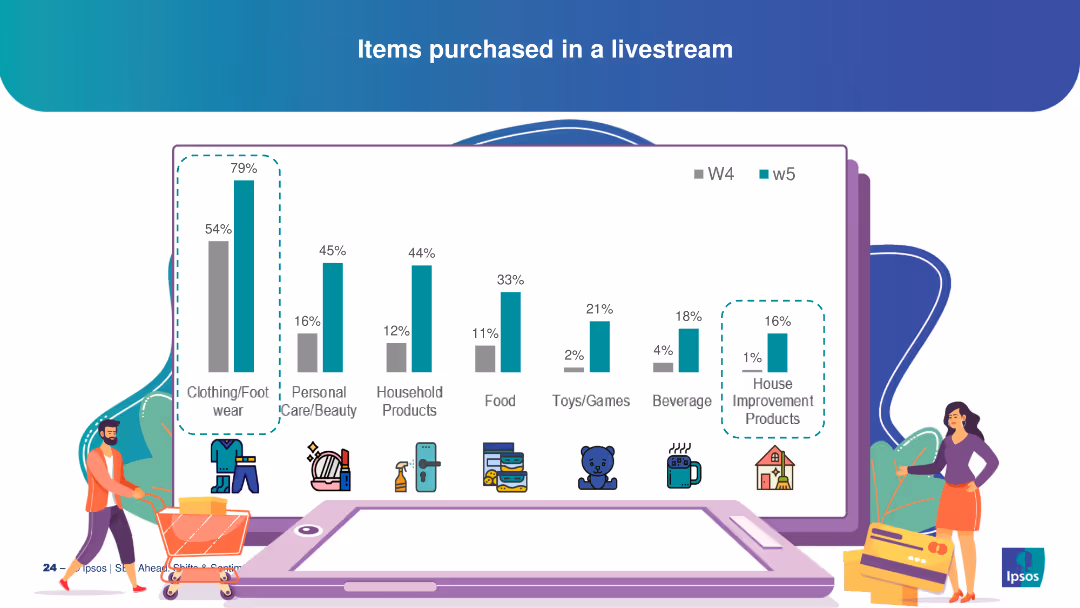
This slide features multiple vertical bar charts showing different categories of items purchased through livestreams. Each category is represented with icons and distinct colors, providing a clear visual comparison.
Market Analysis and Trends
Retail & E-commerce
The slide details various items purchased via livestreams, with clothing/footwear being the most popular at 79%, followed by personal care/beauty, household products, and others. It provides insight into consumer preferences and behavior in the livestream shopping context.
consumer behavior, livestream shopping, purchase categories, retail trends, e-commerce
false
Market Analysis and Trends
Retail & E-commerce
Single Chart
IPSOS
Add to my slides
Remove from favorites
Features a bar chart comparing preferences for different vehicle engines between two study years. The chart is color-coded and provides percentages for each engine type, including gasoline, hybrid, and electric.
Market Analysis and Trends
Transportation & Logistics
Analyzes consumer preference shifts from traditional gasoline vehicles to electric and hybrid models, reflecting changing market dynamics and environmental concerns in the automotive industry.
consumer behavior, market shift, electric vehicles, hybrid vehicles, gasoline, automotive industry, environmental impact, technology adoption
false
Market Analysis and Trends
Transportation & Logistics
Single Chart
Deloitte
Add to my slides
Remove from favorites
This slide compares growth in spending across different categories for Gen Z and Millennials, using bubble charts to represent the data visually. The layout is dynamic and clearly segregates data by demographic and category.
Market Analysis and Trends
Retail & E-commerce
Examines the fastest-growing spending categories for Gen Z and Millennials, providing insight into consumer behavior and market opportunities. Useful for retailers and marketers targeting these demographics.
Consumer Behavior, Millennials, Gen Z, Retail
false
Market Analysis and Trends
Retail & E-commerce
Multiple Chart
Accenture
Add to my slides
Remove from favorites
Contains a bar chart illustrating the increased adoption of online shopping in various Southeast Asian countries between 2019 and 2020, with a key to interpret the data.
Market Analysis and Trends
Retail & E-commerce
Indicates a leap in consumer preference for online shopping channels across Southeast Asia, highlighting the trend towards digital marketplaces.
Consumer behavior, online channels, market trend, Southeast Asia, bar chart
false
Market Analysis and Trends
Retail & E-commerce
Single Chart
Bain
Add to my slides
Remove from favorites
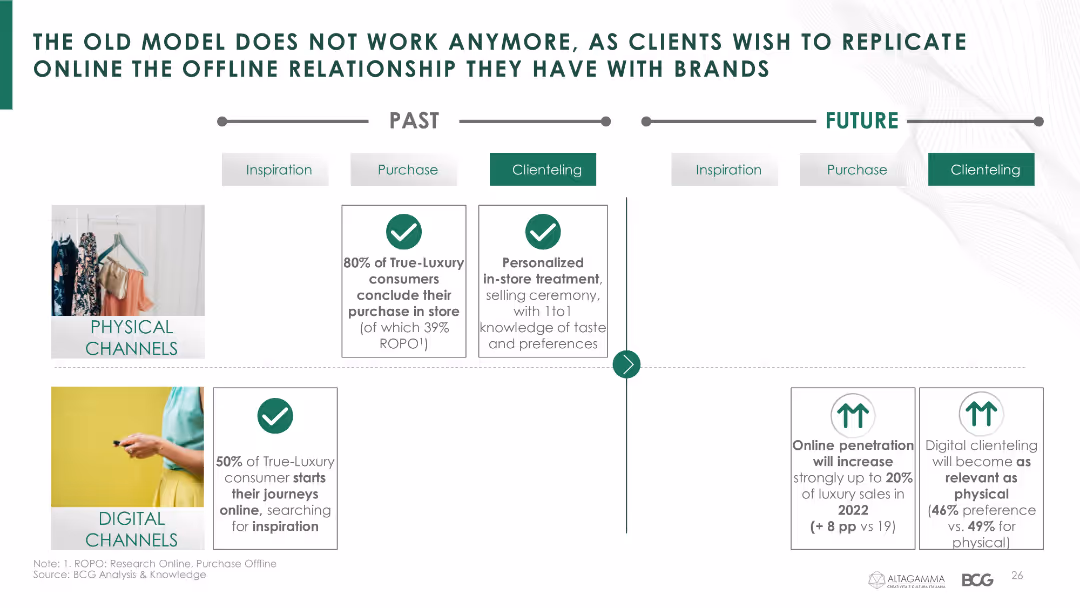
This slide has a comparative layout showing past and future models for physical and digital channels. It includes icons, images, and text boxes to differentiate key points.
Market Analysis and Trends
Retail & E-commerce
The slide highlights the shift in consumer behavior from physical to digital channels, emphasizing the need for brands to replicate offline relationships online.
Consumer behavior, physical channels, digital channels, luxury market, online penetration, digital clienteling, purchasing journey, clienteling, trends
false
Market Analysis and Trends
Retail & E-commerce
Table
BCG
Add to my slides
Remove from favorites
This slide features a dual bar chart comparing consumer priorities over the last twelve months, focusing on product quality, service, and price, among others. The layout is well-organized with labels, percentage values, and a color differentiation for easier comparison. The side panel includes additional insights that contextualize the data presented.
Product and Service Analysis
Professional Services
Analyzing consumer priorities, this slide shows a shift towards product quality over other aspects like service or price. It highlights the changing consumer behavior post-pandemic, with data segmented from a recent survey. Useful for marketing teams to strategize product development and customer service improvements, adapting to consumer trends.
consumer behavior, product quality, service, price, priorities
false
Product and Service Analysis
Professional Services
Mixed Chart
Deloitte
Add to my slides
Remove from favorites
Features four column charts comparing customer priorities over four periods. The charts highlight preferences for product quality, service, and price, with 'Superior Product Quality' being the most consistent top priority across the periods.
Market Analysis and Trends
Professional Services
This slide analyzes consumer priorities, particularly how they have shifted towards valuing product quality over cost and service. This trend suggests that businesses may need to focus more on product enhancements and quality assurance to meet consumer expectations.
Consumer Behavior, Product Quality, Service, Pricing, Market Trends
false
Market Analysis and Trends
Professional Services
Mixed Chart
Deloitte
Add to my slides
Remove from favorites
The slide includes text and pie charts showing demographic segmentation of UK consumers' returns behavior, categorized by age and gender.
Market Analysis and Trends
Retail & E-commerce
Provides analysis of consumer behavior regarding returns in the UK fashion market, segmented by age groups and gender, based on survey data.
Consumer behavior, Returns, UK, Demographics, Survey data
false
Market Analysis and Trends
Retail & E-commerce
Multiple Chart
Roland Berger
Add to my slides
Remove from favorites
Slide presents a large column chart in shades of green, depicting the reasons for selling luxury items on second-hand platforms.
Market Analysis and Trends
Retail & E-commerce
Discusses motivations behind selling luxury items on second-hand platforms, such as to empty wardrobe or finance new purchases.
consumer behavior, second-hand market, luxury goods, selling motivations, market insights
false
Market Analysis and Trends
Retail & E-commerce
Multiple Chart
BCG
Add to my slides
Remove from favorites
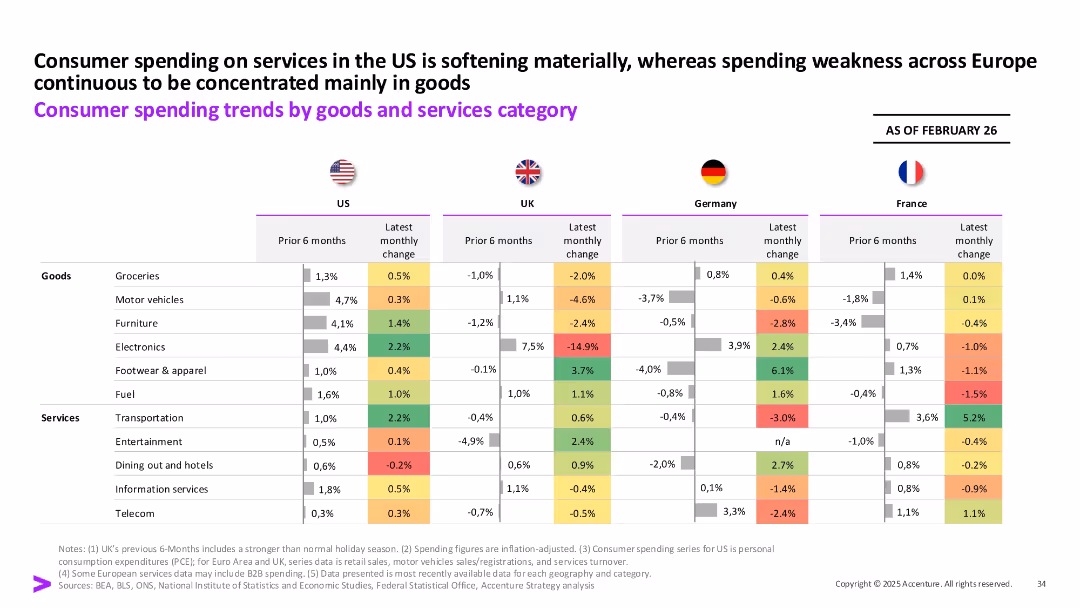
Comparative heatmap tables by country (US, UK, Germany, France) showing prior 6-month and latest monthly change in spending for various categories.
Financial Performance
Consumer Goods
This slide compares recent changes in consumer spending on goods and services across major economies. US shows a shift away from services, while Europe remains goods-focused with uneven category trends.
Consumer Behavior, Services vs Goods, Monthly Spending, Europe, US, Category Analysis, Inflation-Adjusted
false
Financial Performance
Consumer Goods
Single Chart
Accenture
Add to my slides
Remove from favorites
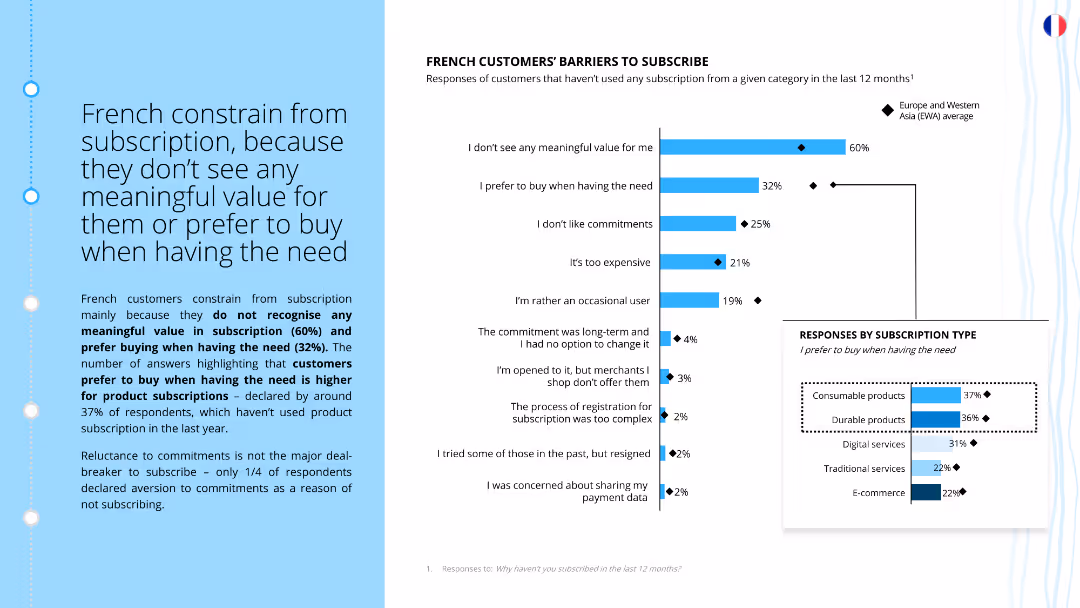
The slide features a left-aligned vertical column of text and a right-aligned column chart. The column chart presents responses from French customers on their barriers to subscription, with percentage values indicated for each response category.
Market Analysis and Trends
Consumer Goods
The slide explains that French customers are constrained from subscriptions due to perceived lack of value and preference for buying as needed. It presents a detailed analysis of barriers to subscription, including factors like commitments and registration complexity.
Consumer behavior, subscription, barriers, value, preferences, customer insights, French market, product subscription, buying behavior, registration complexity
false
Market Analysis and Trends
Consumer Goods
Multiple Chart
Deloitte
Add to my slides
Remove from favorites
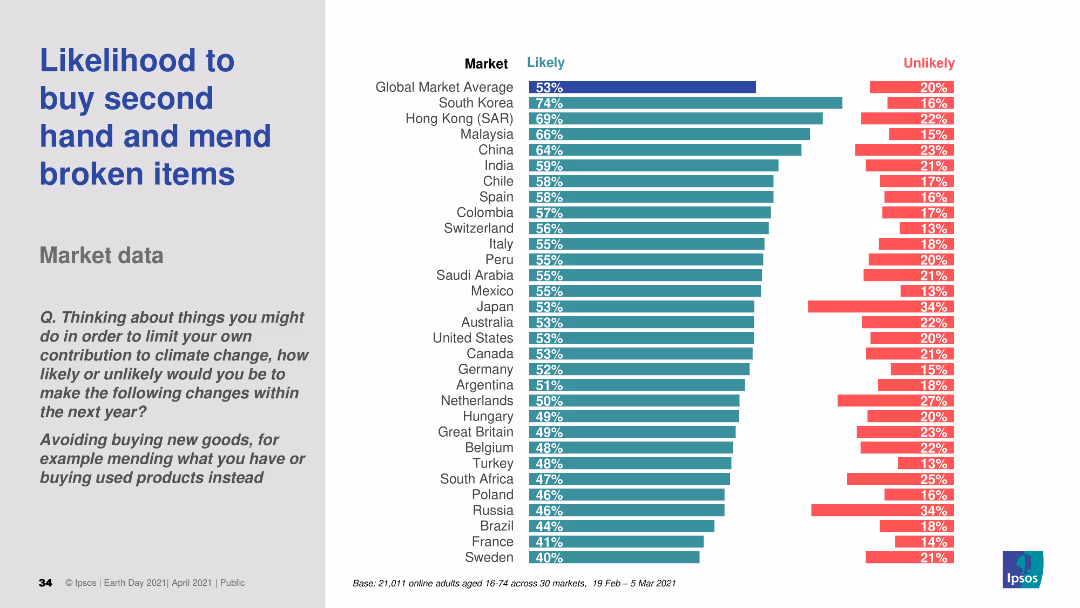
A bar chart (horizontal) comparing the likelihood to buy second hand and mend broken items across various countries. The chart uses different colors to distinguish likely and unlikely percentages.
Market Analysis and Trends
Consumer Goods
This slide presents market data on the likelihood of consumers in various countries to buy second-hand items and repair broken ones. It is aimed at understanding consumer behavior and trends related to sustainability practices.
consumer behavior, sustainability, market data, second-hand, repair
false
Market Analysis and Trends
Consumer Goods
Multiple Chart
IPSOS
Add to my slides
Remove from favorites
Slide depicts a path from Non Buyer to Frequent Shopper with branching factors listed as triggers and barriers across categories of Products, Services, and Content & Media.
Customer and Market Segmentation
Retail & E-commerce
The slide illustrates what influences consumers to progress from non-buyers to frequent shoppers, identifying specific product features, service offerings, and content that act as motivators or deterrents.
Consumer behavior, triggers, barriers, e-commerce
false
Customer and Market Segmentation
Retail & E-commerce
Header Horizontal
BCG
Add to my slides
Remove from favorites
Two pie charts comparing the next vehicle type preferences among current new and used vehicle owners. Charts are in teal and gray with labeled percentages. Simple, clear layout.
Market Analysis and Trends
Transportation & Logistics
This slide illustrates consumer preferences for vehicle type in future purchases based on their current vehicle's status (new or used). It highlights a stronger preference for new vehicles among current new vehicle owners.
Consumer behavior, vehicle preferences, new vs used, market analysis, purchasing intentions
false
Market Analysis and Trends
Transportation & Logistics
Multiple Chart
Deloitte
Add to my slides
Remove from favorites
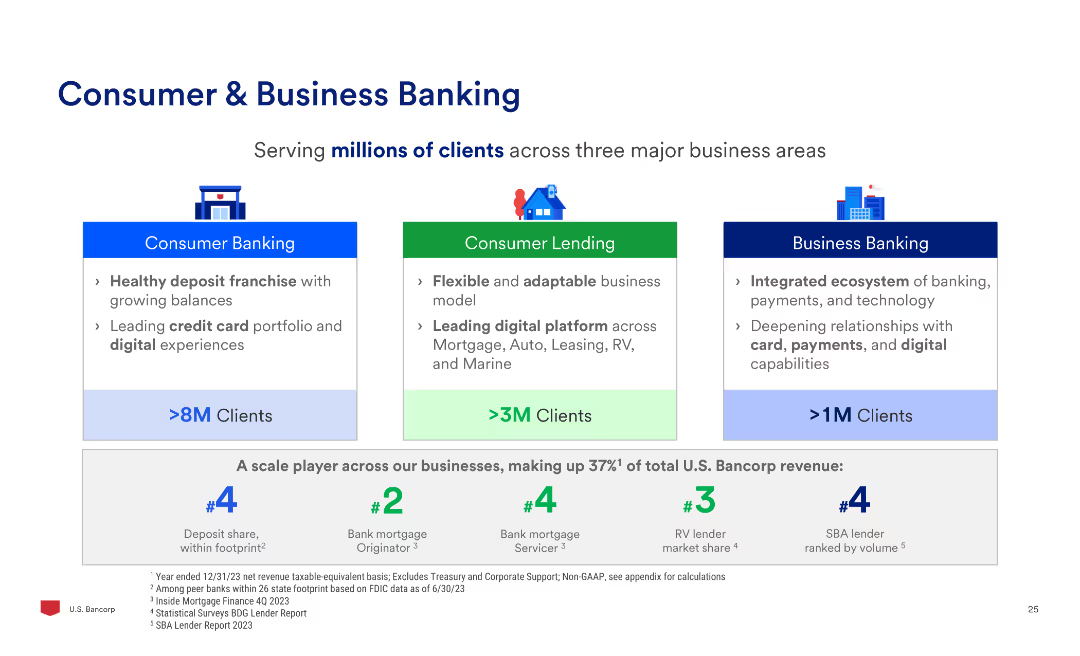
The slide features three sections comparing consumer banking, consumer lending, and business banking, with icons and key metrics for each segment, along with client base sizes.
Market Analysis and Trends
Financial Services
The slide outlines the three major business areas of consumer banking, consumer lending, and business banking, highlighting the client base, key services, and market positioning.
Consumer, Business, Banking, Lending, Clients, Services
false
Market Analysis and Trends
Financial Services
Pillar
Barclays
Add to my slides
Remove from favorites
Includes a diagram illustrating the relationship between four key business drivers and a chart tracking progress along these dimensions.
Market Analysis and Trends
Financial Services
This slide focuses on the strategic drivers of the direct-to-consumer business model, emphasizing audience growth, data utilization, monetization of services, and customer engagement, with aims to leverage these areas for substantial business growth.
consumer business, growth drivers, data, monetization, engagement
false
Market Analysis and Trends
Financial Services
Mixed Chart
Barclays
Add to my slides
Remove from favorites
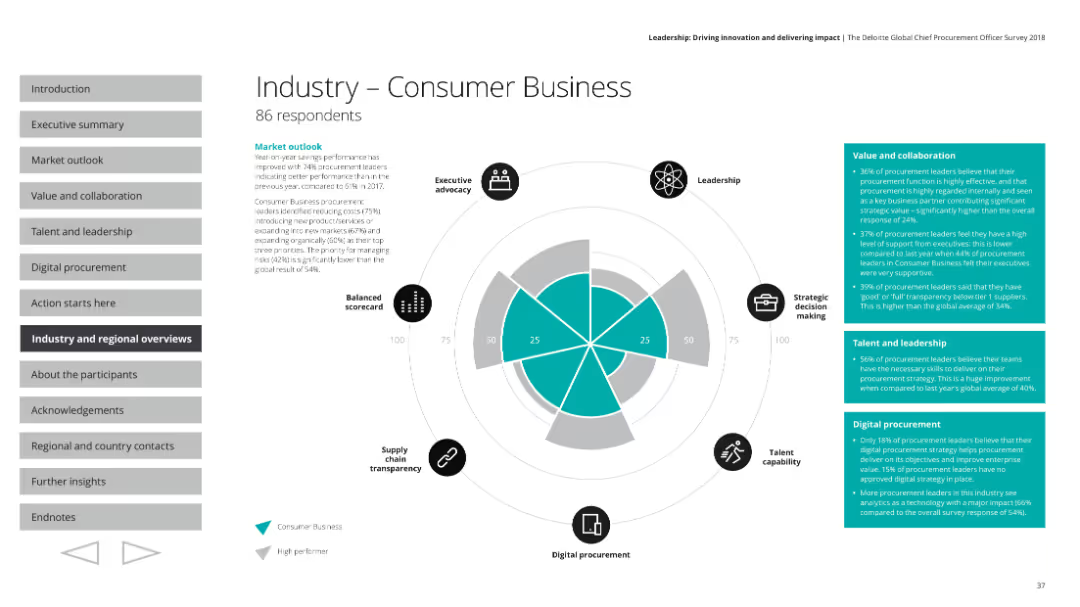
Similar to the previous slide, featuring a radar chart and text summarizing market outlook, value and collaboration, and leadership in consumer business.
Industry Overview
Professional Services
Discusses the consumer business industry's market performance, strategic priorities, and areas for improvement in procurement and leadership.
Consumer business, market outlook, strategy, performance
false
Industry Overview
Professional Services
Mixed Chart
Deloitte
Add to my slides
Remove from favorites
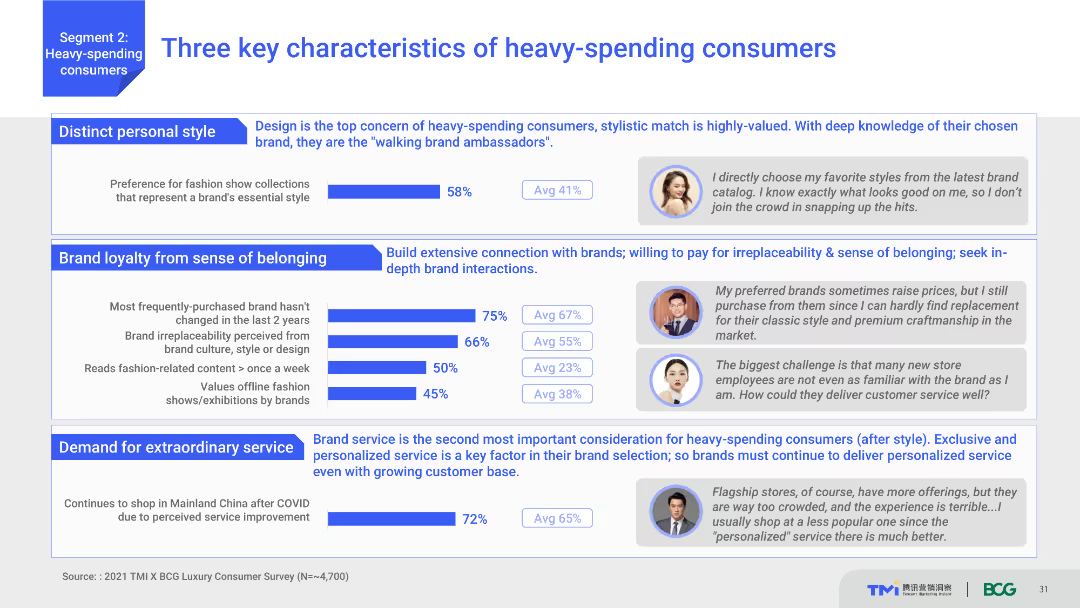
Combination of bar graphs and text explaining the key characteristics of heavy-spending consumers, including personal style, brand loyalty, and demand for service. Includes quotes and statistical data.
Market Analysis and Trends
Consumer Goods
Identifies and explains three main traits of heavy-spending consumers: distinct personal style, strong brand loyalty, and high demand for extraordinary service. Data supports each characteristic with relevant statistics.
Consumer characteristics, brand loyalty, personal style, service demand, heavy spenders
false
Market Analysis and Trends
Consumer Goods
Multiple Chart
BCG
Add to my slides
Remove from favorites
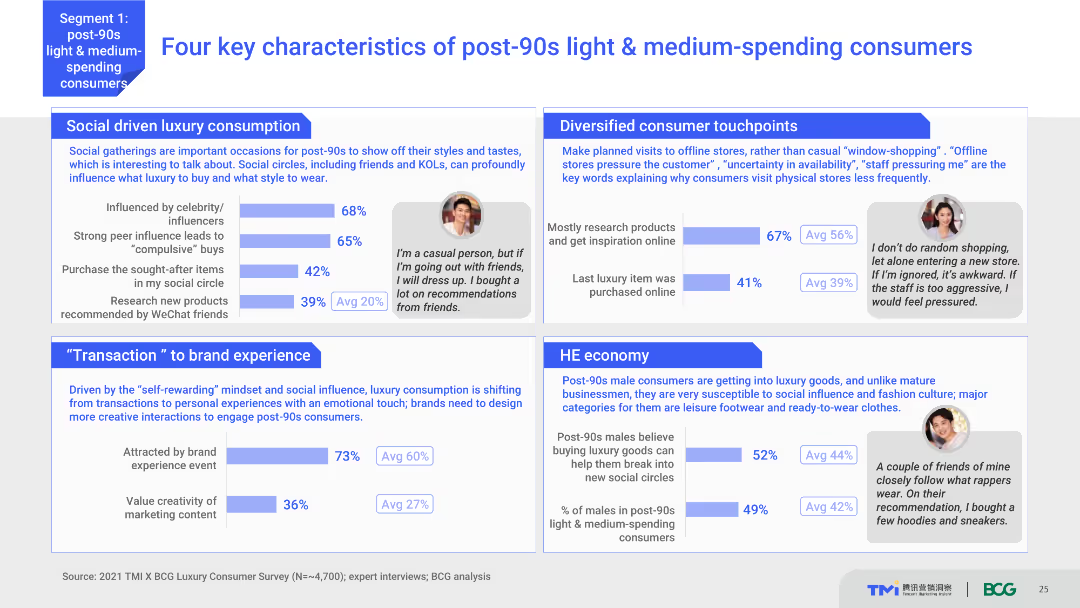
The slide uses a content layout with text, charts, and testimonials. It highlights four key characteristics of post-90s light & medium-spending consumers, supported by survey data and personal quotes. The visual complexity is moderate with clear segmentation and relevant visuals.
Customer and Market Segmentation
Consumer Goods
This slide outlines the main characteristics of post-90s light and medium-spending consumers, focusing on their social-driven luxury consumption, diversified touchpoints, and specific economic behaviors. It includes testimonials for context.
consumer characteristics, post-90s, luxury consumption, social influence, economic behavior
false
Customer and Market Segmentation
Consumer Goods
Multiple Chart
BCG
Add to my slides
Remove from favorites
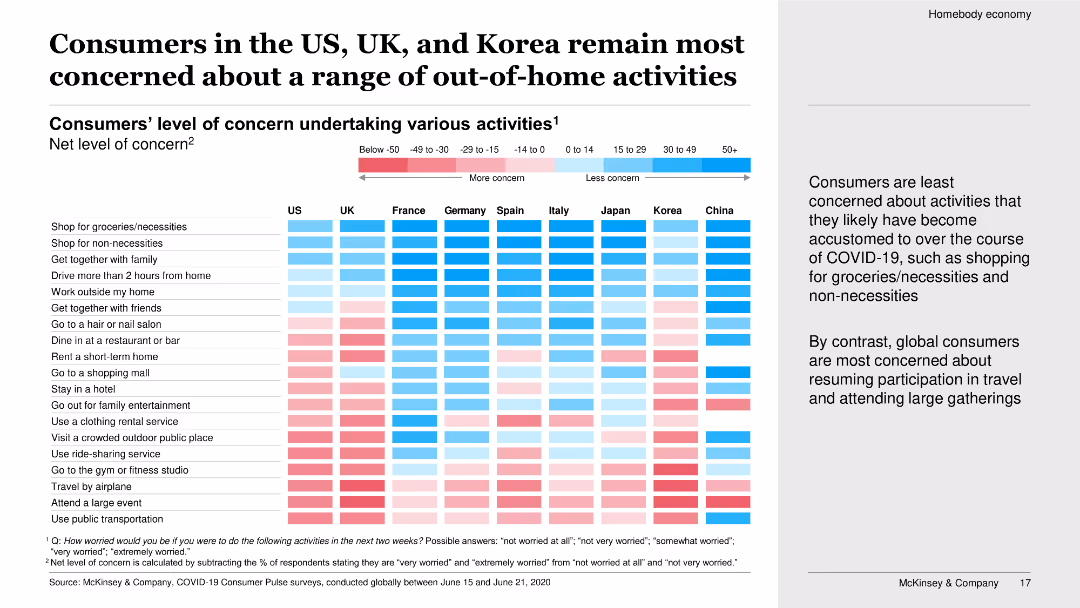
This slide uses a heat map to illustrate consumers' levels of concern regarding various out-of-home activities. The visual representation is clear, using different shades of color to depict the range of concern from less to more concerned.
Market Analysis and Trends
Consumer Goods
The slide presents data on consumers' concerns about undertaking various out-of-home activities. It shows a comparative analysis across different countries, with the US, UK, and Korea being the most concerned about a range of activities like shopping, dining out, and traveling.
Consumer concern, out-of-home activities, heat map, comparative analysis, country comparison, COVID-19, consumer behavior, safety concerns
false
Market Analysis and Trends
Consumer Goods
Boxed
McKinsey
Add to my slides
Remove from favorites
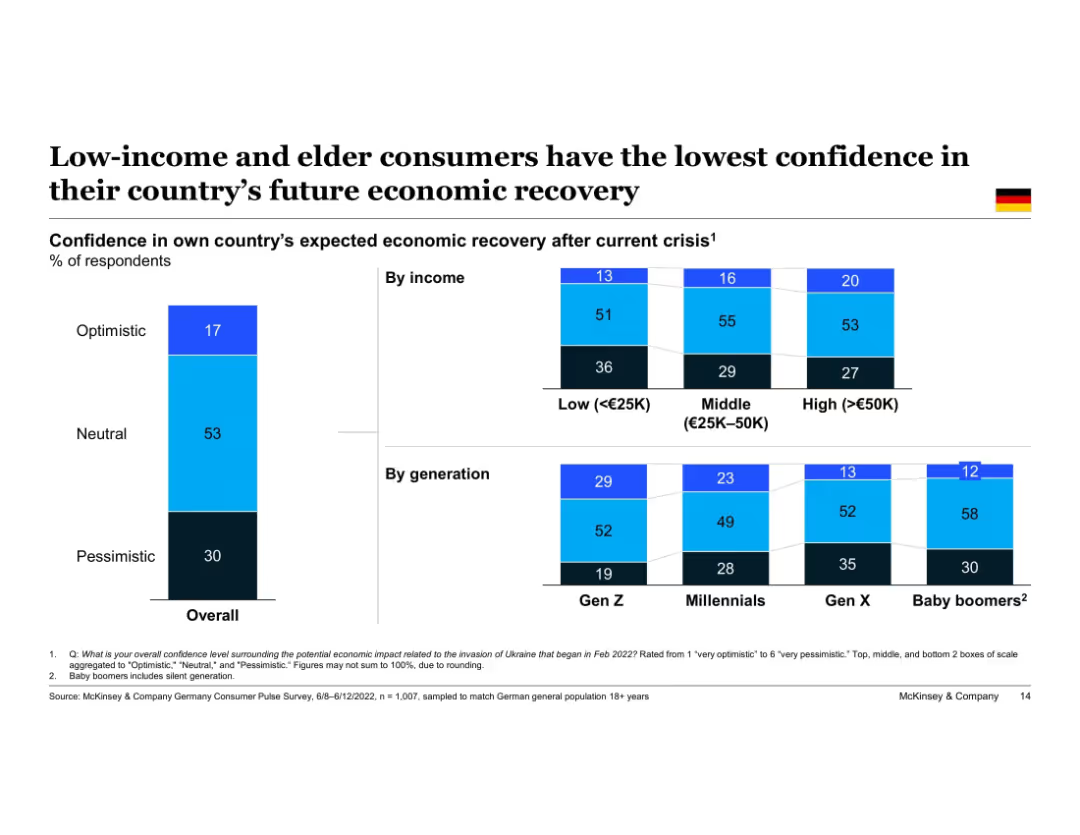
Vertical stacked bar chart showing Germany’s overall optimism by income and generation. Three confidence levels visualized for each group. Left column shows national average, followed by columns split by income level and age cohort.
Customer and Market Segmentation
Financial Services
This slide highlights disparities in economic recovery confidence among different German demographic groups. Low-income and Baby Boomer respondents are most pessimistic, whereas higher-income and younger generations express relatively greater optimism about future recovery.
consumer confidence, demographics, Germany, income groups, generations, Gen Z, Baby Boomers, pessimism, optimism
false
Customer and Market Segmentation
Financial Services
Single Chart
McKinsey
Add to my slides
Remove from favorites
Features dual graphs showing consumer confidence indices. The design is minimalistic, emphasizing the data through contrast against the white background.
Risk Assessment and Management
Financial Services
Discusses consumer sentiment as a significant economic indicator, pertinent for risk assessment in financial services. The slide's dual graphs provide a comparative look at consumer confidence in the US and EU, valuable for market sentiment analysis.
Consumer, Confidence, Index, Economy
false
Risk Assessment and Management
Financial Services
Multiple Chart
Morgan Stanley
Add to my slides
Remove from favorites
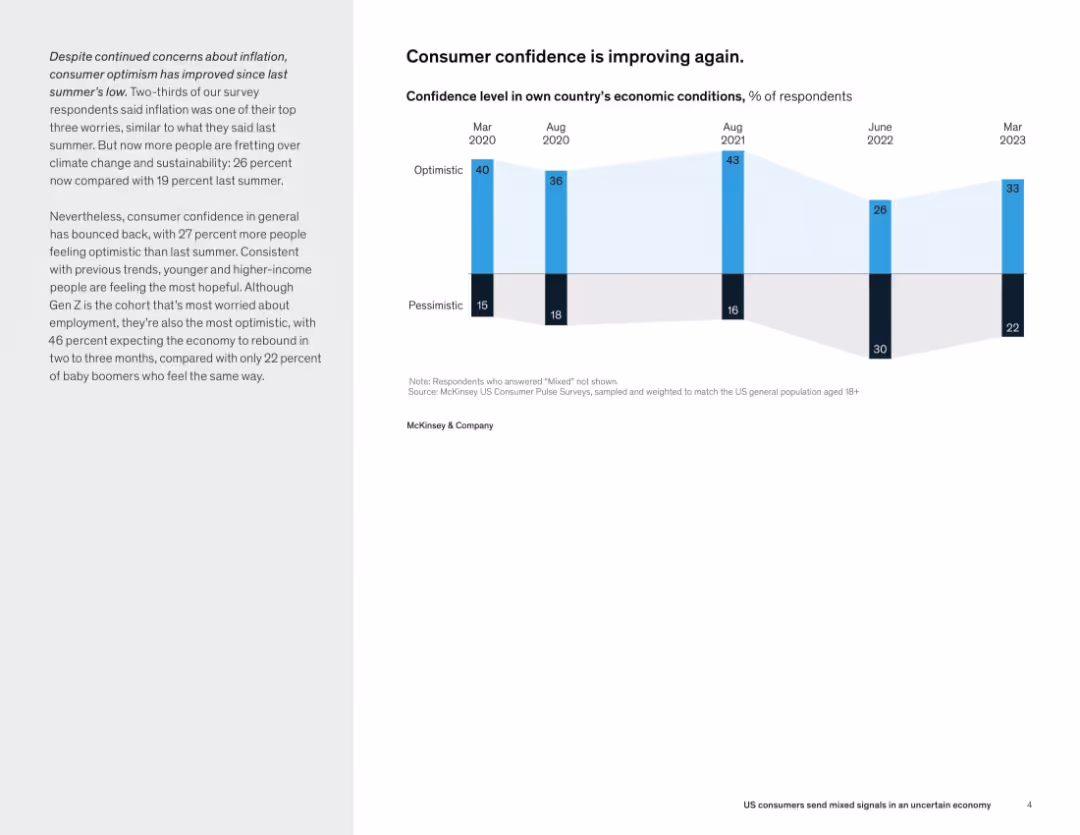
Text on left provides context, right side features a line chart showing optimism vs. pessimism in economic conditions over time from 2020–2023.
Market Analysis and Trends
Professional Services
Consumer confidence has rebounded from previous lows, with optimism rising since June 2022. Gen Z is both the most concerned about employment and the most optimistic about economic recovery, reflecting complex sentiment dynamics.
consumer confidence, optimism, economic recovery, Gen Z, economic sentiment, McKinsey survey
false
Market Analysis and Trends
Professional Services
Mixed Chart
McKinsey
Add to my slides
Remove from favorites
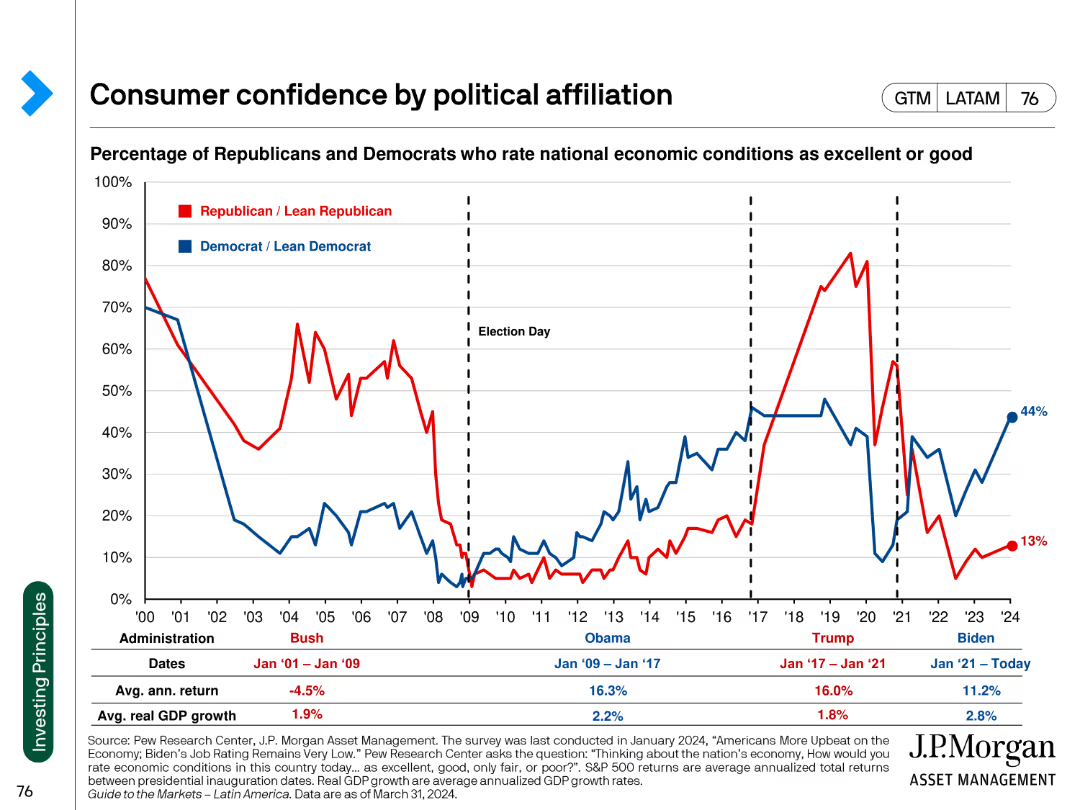
Line chart comparing the percentage of Republicans and Democrats rating national economic conditions as excellent or good. The chart spans multiple administrations.
Market Analysis and Trends
Financial Services
This slide shows the fluctuation in consumer confidence among political affiliations across different U.S. presidential administrations. It uses data to indicate partisan perspectives.
consumer confidence, political affiliation, economic conditions, administration, trend analysis
false
Market Analysis and Trends
Financial Services
Single Chart
JP Morgan
Add to my slides
Remove from favorites
Dominated by a series of bar charts contrasting comfort levels with visiting various public places in the near future. Colors vary from gray to purple.
Market Analysis and Trends
Retail & E-commerce
Illustrates the level of consumer comfort in visiting different types of public places, reflecting on the impact of current events on consumer confidence and predicting a slight future increase.
Consumer confidence, Public spaces, Comfort levels, Predictive analysis, Bar chart, Near future, Hospitality, Retail, Market research
false
Market Analysis and Trends
Retail & E-commerce
Mixed Chart
Accenture
Add to my slides
Remove from favorites
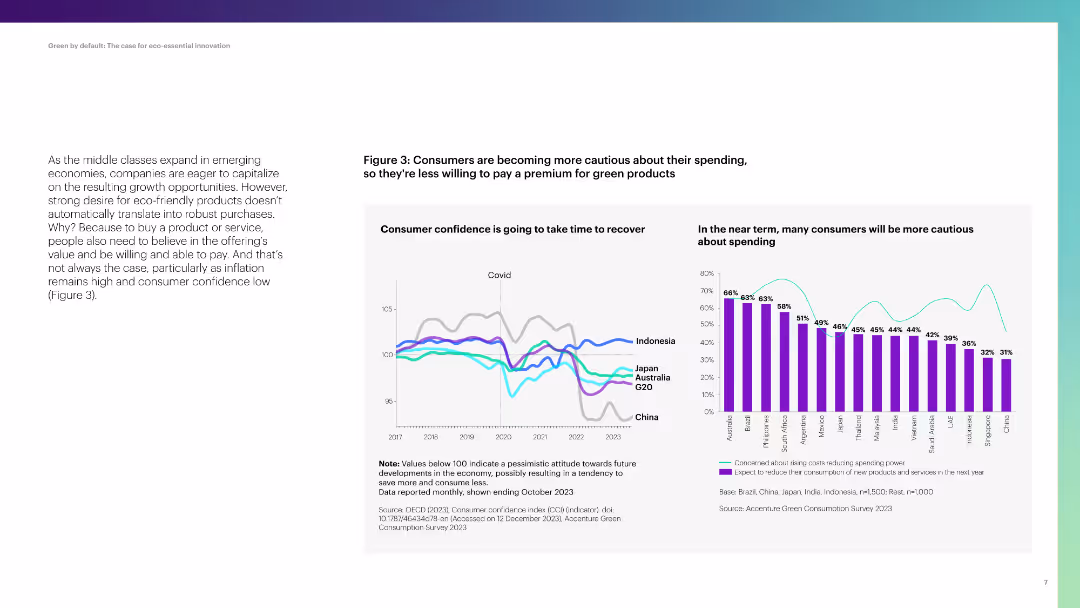
Two charts: a line chart showing consumer confidence over time and a column chart showing spending caution in various countries.
Market Analysis and Trends
Consumer Goods
The slide discusses consumer caution in spending, with data on confidence levels and reduced spending intentions across several countries.
consumer confidence, spending, caution, Brazil, China, Japan, Indonesia, Australia
false
Market Analysis and Trends
Consumer Goods
Multiple Chart
Accenture
Add to my slides
Remove from favorites
This slide displays line graphs comparing consumer confidence indexes in the U.S. and EU. The design is straightforward with clear, easy-to-read graphs and a consistent color scheme.
Market Analysis and Trends
Financial Services
Examines consumer confidence trends in the U.S. and EU, providing insights into consumer sentiment and potential economic implications. Useful for market analysis and predicting consumer spending behaviors.
Consumer Confidence, US, EU, Economic Analysis, Sentiment
false
Market Analysis and Trends
Financial Services
Multiple Chart
Deutsche Bank
Add to my slides
Remove from favorites
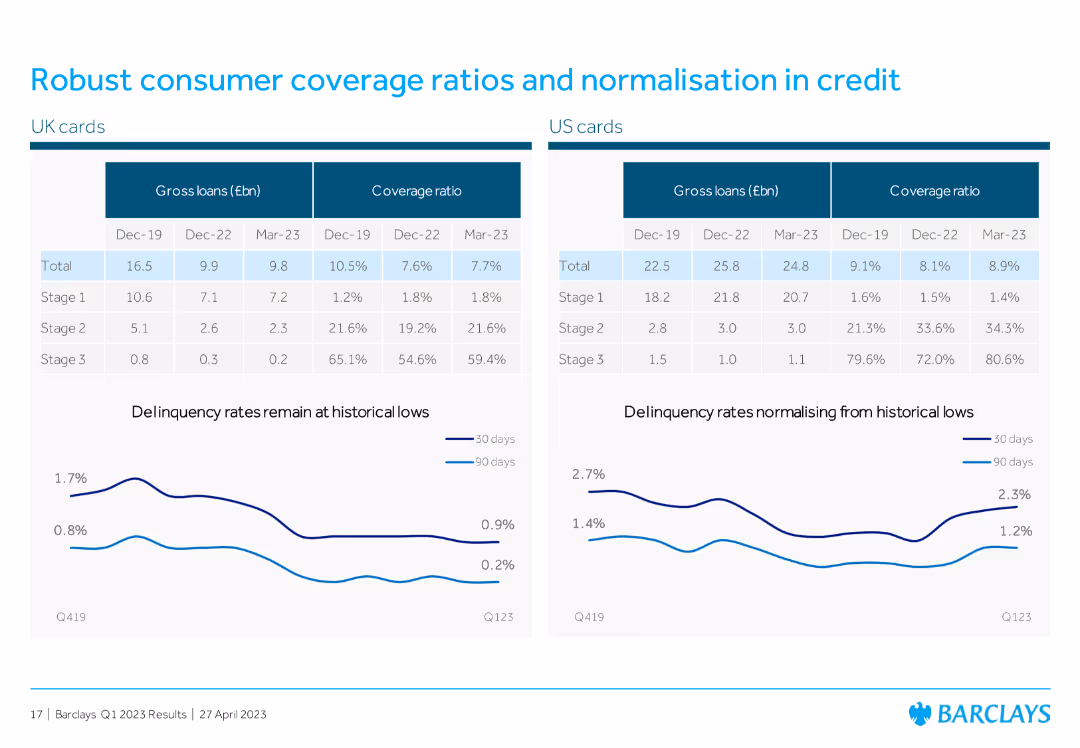
Two line graphs comparing delinquency rates in UK and US cards, accompanied by tables showing gross loans and coverage ratios for different stages.
Risk Assessment and Management
Financial Services
The slide focuses on consumer coverage ratios, comparing UK and US cards' delinquency rates, indicating normalization in credit with detailed coverage ratio data.
consumer coverage, delinquency rates, UK cards, US cards, credit normalization
false
Risk Assessment and Management
Financial Services
Multiple Chart
Barclays
Add to my slides
Remove from favorites
Features circular icons and brief text descriptions, highlighting major areas of focus for consumer credit access through advanced analytics.
Industry Overview
Financial Services
Focuses on expanding consumer access to credit by using advanced analytics and differentiated data, aiming to engage underserved populations.
consumer credit, analytics, data differentiation, financial inclusion, market expansion
false
Industry Overview
Financial Services
Pillar
Barclays
Add to my slides
Remove from favorites
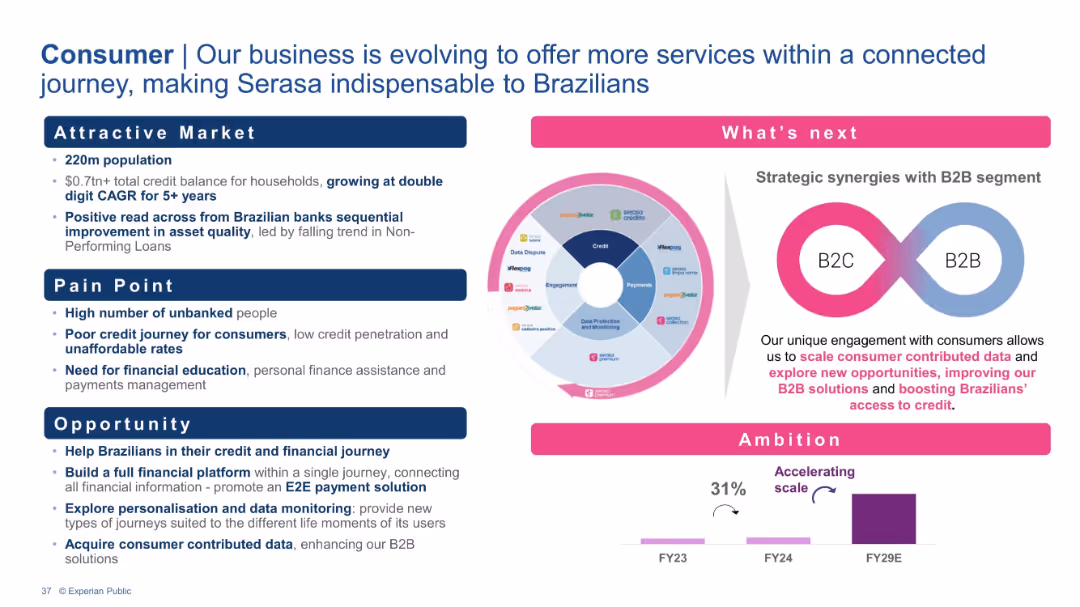
Similar structure to previous slides with attractive market, pain points, and opportunities. Right side includes a service wheel and B2C–B2B synergy graphic.
Product and Service Analysis
Financial Services
This slide outlines Experian’s consumer market strategy in Brazil. With a large population and high credit growth, Experian aims to build an end-to-end financial platform that supports engagement, personalization, and data collection. Emphasis is on improving B2B outcomes through B2C synergies.
Consumer credit, B2C platform, Personal finance, Financial education, Data strategy, Brazil market
false
Product and Service Analysis
Financial Services
Mixed Chart
Barclays
Add to my slides
Remove from favorites
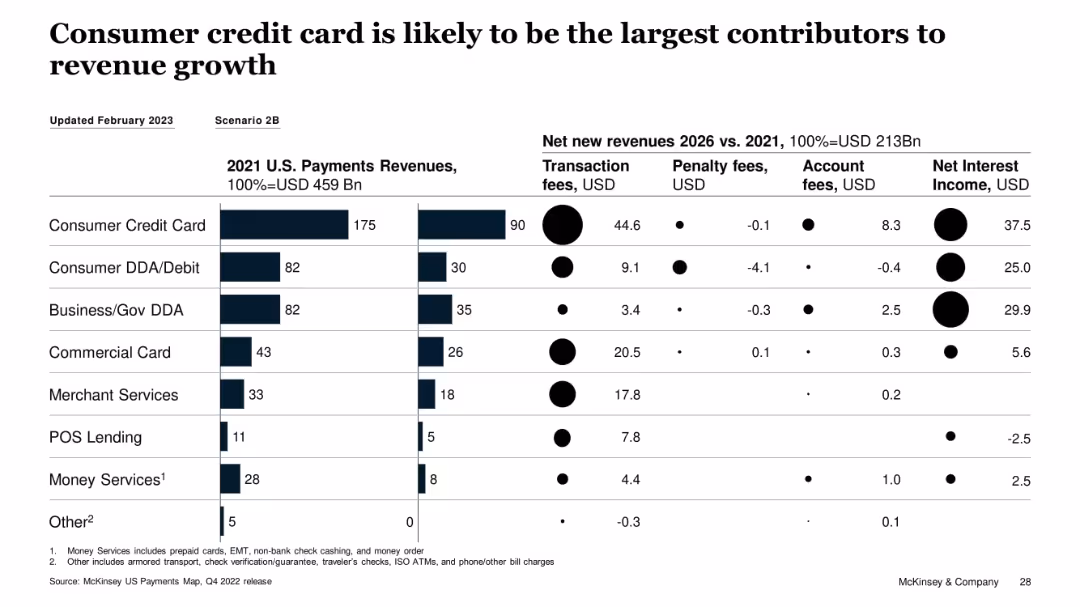
Horizontal bar chart and dot matrix showing revenue sources and growth breakdown
Financial Performance
Financial Services
Consumer credit cards are expected to be the main revenue growth driver from 2021–2026, contributing $90B in transaction fees and $37.5B in net interest income. The slide breaks down new revenue by fee type across major payment segments, highlighting consumer credit cards as the strongest contributor.
consumer credit card, transaction fees, net interest, McKinsey, revenue growth, penalty fees, account fees
false
Financial Performance
Financial Services
Multiple Chart
McKinsey
Add to my slides
Remove from favorites
Previous
Next
You don't have any favorites yet.
Please wait loading your favorites slides...
Create a FREE account to continue browsing
Receive Instant Access to 1,000+ slides from companies like McKinsey, Google, and Goldman Sachs
First Name
Last Name
Email
Password
I agree to all
Terms & Privacy Policy
Thank you! Your submission has been received!
Oops! Something went wrong while submitting the form.
Have an account?
Sign in
Upgrade to PRO to Save slides
Advanced Search and Filters
Access to 15,000+ slides
Access to Category Pages
Save/Bookmark Slides
PowerPoint Template Library
Pick a Plan
MONTHLY
$12/month
Billed every month, Cancel anytime.
YEARLY
$9/year
Billed $108 annually, Cancel anytime.
Checkout for $12/month
Checkout for $108/yr
Secured by Stripe | AES-256 bit encryption