My Account
My Slides
Search by Category
Companies
Slide Type
Use Case
Industry
Pricing
Templates
View All Templates
Download Template Slides
✦ AI
AI Prompt Library
AI Search
Feedback
Login
Logout
Get Started
Browse all Slides
Browse all Slides
Create a FREE Account
Instant access to 1,000+ real slides from top companies like McKinsey, BCG, Goldman Sachs, Google and many more!
First Name
Last Name
Email
Password
I agree to all
Terms & Privacy Policy
Thank you! Your submission has been received!
Oops! Something went wrong while submitting the form.
Have an account?
Sign in
Saved Slides
Total No. of slides saved
0
↻ Refresh
✖ Clear all
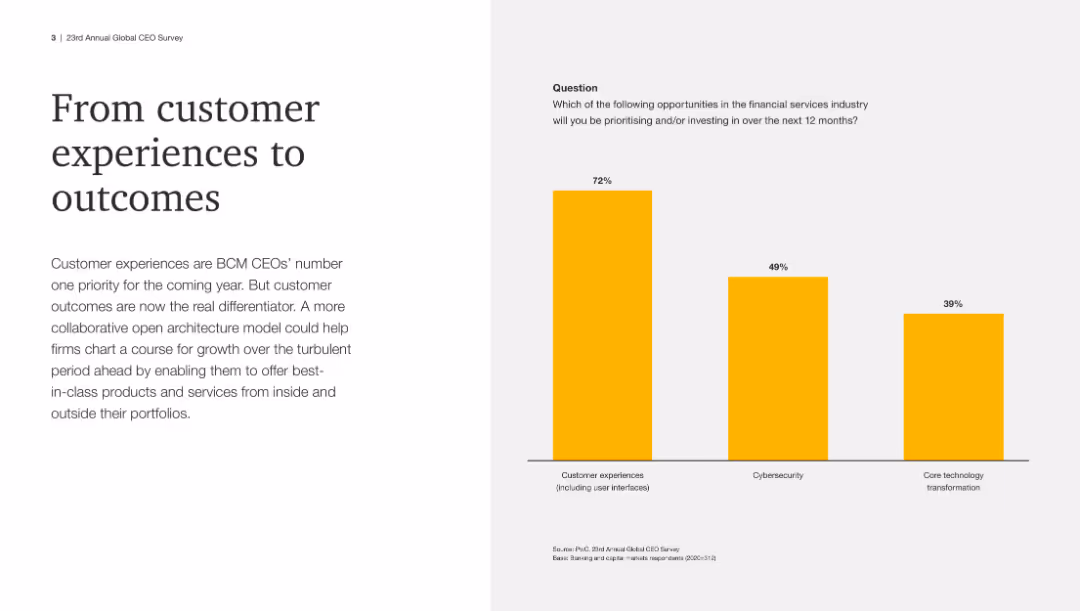
Displays multiple bar charts assessing investor attitudes towards company debt, focusing on aspects like 'Interest coverage ratios' and 'Rollover risk', using shades of green to represent responses.
Risk Assessment and Management
Financial Services
Analyzes how investors perceive company debt, emphasizing the importance of risk factors such as interest coverage and rollover risks in investment decisions, particularly in a volatile market.
company debt, investor attitudes, interest coverage, rollover risk
false
Risk Assessment and Management
Financial Services
Single Chart
BCG
Add to my slides
Remove from favorites
Bar charts detail investor attitudes towards company debt, focusing on leverage and interest coverage, including annotations for recent changes in investor focus.
Risk Assessment and Management
Financial Services
Provides insights into investor strategies regarding company debt, emphasizing the increasing importance of rollover risk and interest coverage, applicable in risk management strategies.
company debt, risk management, interest coverage, investor attitudes, leverage
false
Risk Assessment and Management
Financial Services
Single Chart
BCG
Add to my slides
Remove from favorites
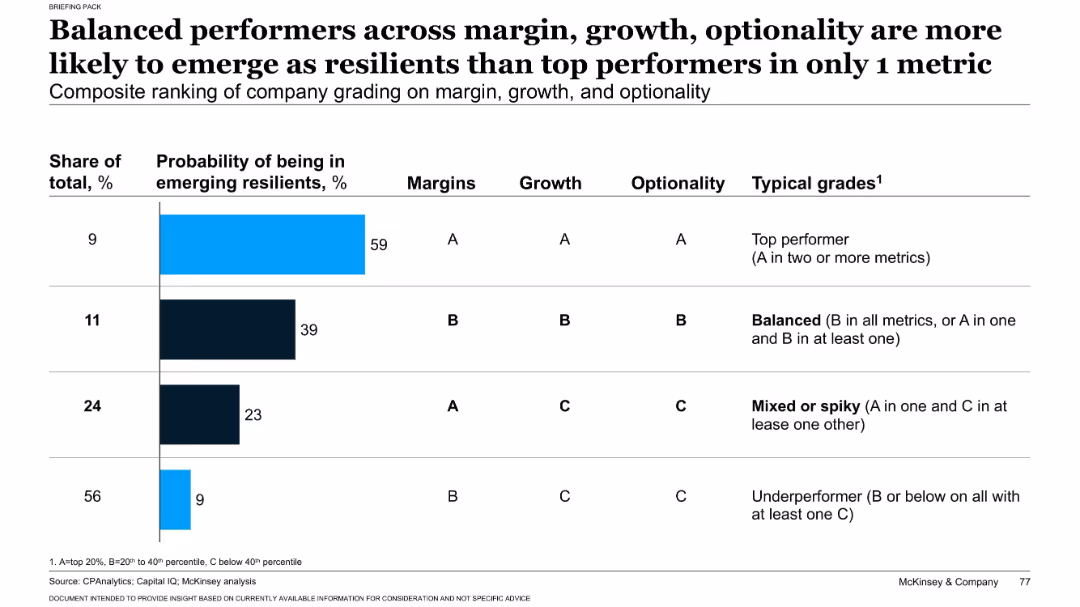
Table comparing probability of resilience vs. company grade balance across three key metrics
Strategic Planning
Professional Services
This slide ranks companies based on balanced performance across margins, growth, and optionality. It shows that firms with consistently good scores in all three dimensions have a much higher probability of emerging as resilient in post-crisis environments.
company grading, resilience, metrics, strategy, post-crisis success
false
Strategic Planning
Professional Services
Single Chart
McKinsey
Add to my slides
Remove from favorites
The slide contains a horizontal timeline highlighting significant events in Booz Allen's history from its founding in 1914 to recent achievements in 2023. Each milestone is marked by a bubble with text descriptions below.
Industry Overview
Professional Services
This slide provides a historical overview of Booz Allen, showcasing key milestones and developments over the years. It illustrates the company's growth, strategic acquisitions, and significant contracts, emphasizing its long-standing industry leadership.
company history, timeline, milestones, growth, achievements
false
Industry Overview
Professional Services
Linear Flow
Booz Allen Hamilton
Add to my slides
Remove from favorites
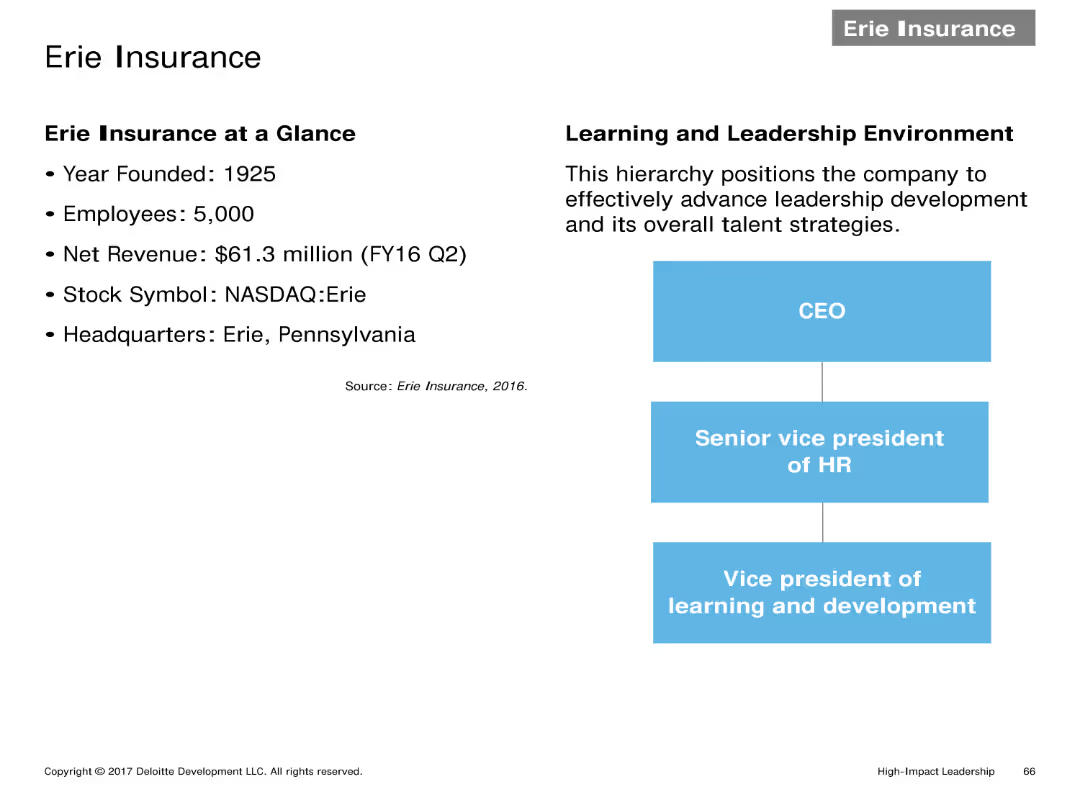
Two-column layout with company details on the left and a hierarchy chart on the right. Text details key information and organizational structure of Erie Insurance.
Client Case Studies
Financial Services
Provides an overview of Erie Insurance, including year founded, number of employees, net revenue, stock symbol, headquarters, and their learning and leadership environment.
Company overview, hierarchy, financial details, Erie Insurance, leadership environment
false
Client Case Studies
Financial Services
Header Horizontal
Deloitte
Add to my slides
Remove from favorites
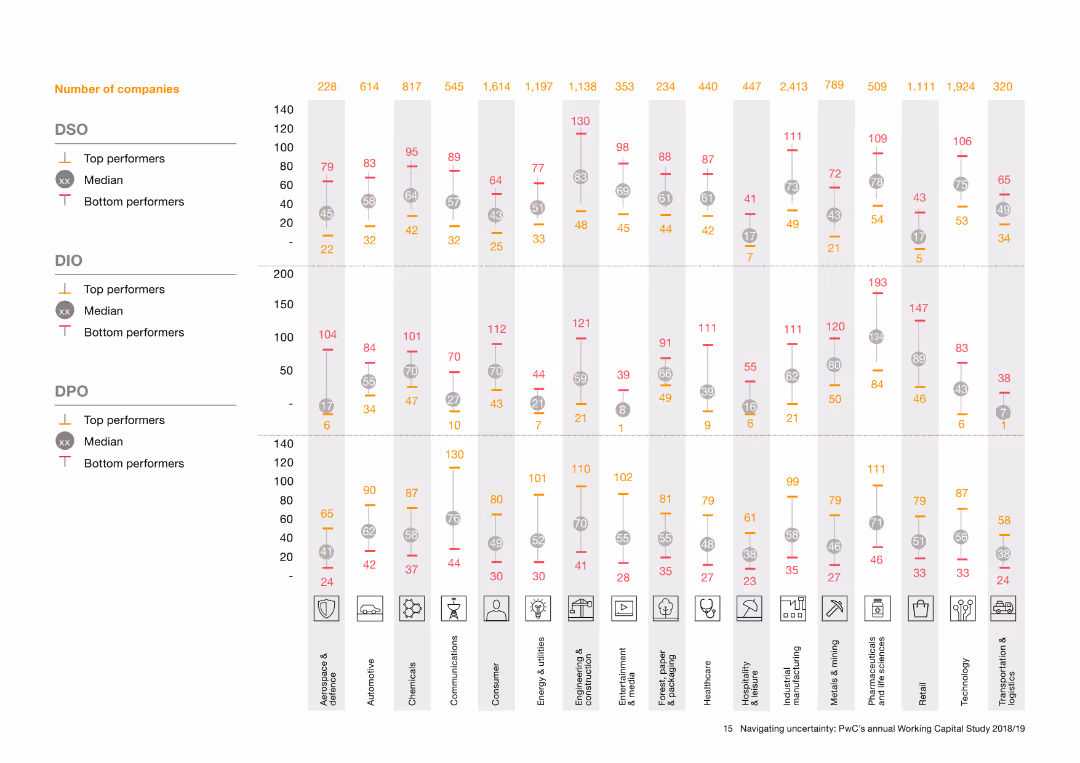
The slide displays a detailed table with the number of companies across various industries, divided into three performance categories: top performers, median, and bottom performers. Icons representing industries are shown at the bottom of the table, with performance metrics displayed above.
Market Analysis and Trends
Industrial & Manufacturing
This slide provides a comprehensive overview of the number of companies in different industries and their performance metrics. The table categorizes companies into top performers, median, and bottom performers, offering a detailed analysis of market trends and industry standings.
Company performance, industry analysis, top performers, median, bottom performers, market trends, data table
false
Market Analysis and Trends
Industrial & Manufacturing
Multiple Chart
PwC/Strategy&
Add to my slides
Remove from favorites
Bar chart showing company priorities for 2019, focusing on areas such as product portfolio, production, controlling & finance, sales & marketing, and procurement.
Strategic Planning
Financial Services
The slide outlines the top priorities for companies in 2019, with a significant focus on the product portfolio. It highlights the growing importance of controlling and finance activities, alongside other strategic areas like production, sales, and marketing, reflecting the key areas where businesses plan to concentrate their efforts.
Company Priorities, Product Portfolio, Strategic Planning
false
Strategic Planning
Financial Services
Multiple Chart
Roland Berger
Add to my slides
Remove from favorites
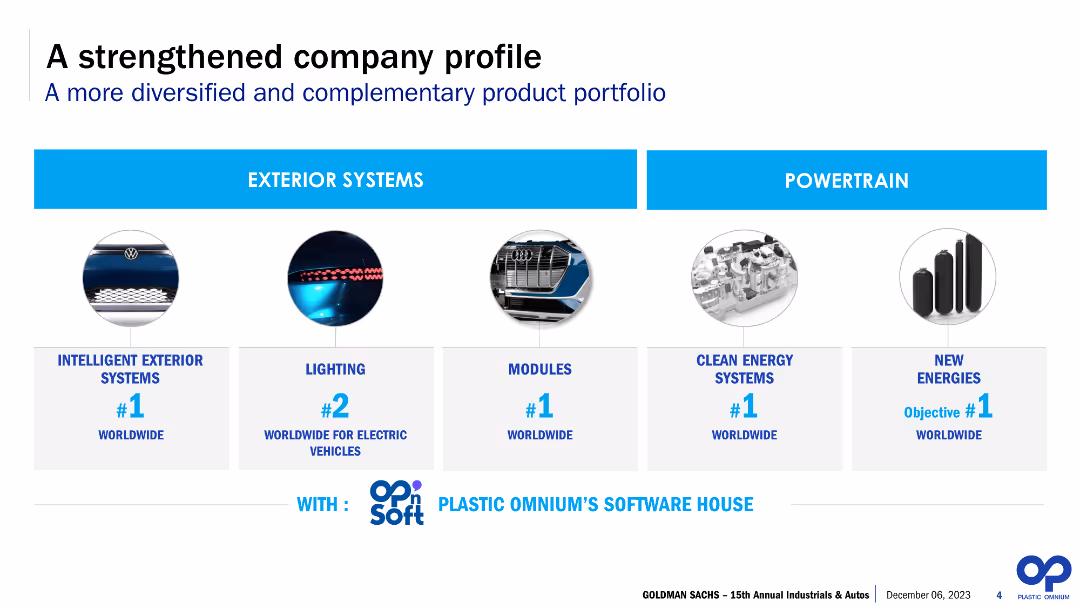
A slide divided into two sections: Exterior Systems and Powertrain. Each section lists key product categories and their market positions, accompanied by relevant images.
Industry Overview
Industrial & Manufacturing
The slide presents an overview of the company's diversified product portfolio in exterior systems and powertrain, emphasizing their market-leading positions in various categories.
company profile, products, market position, systems
false
Industry Overview
Industrial & Manufacturing
Pillar
Goldman Sachs
Add to my slides
Remove from favorites
The slide presents circular diagrams and column charts comparing company sizes and the structure of customer service across different regions and industries. It uses a mix of green, blue, and gray colors for easy differentiation.
Organizational Structure and Change
Professional Services
Analyzes company demographics and customer service structures across various industries, highlighting differences in organization size and service placement. Useful for businesses evaluating their customer service frameworks and considering organizational adjustments for improved performance.
company profiles, organizational structure, customer service, industries, demographics
false
Organizational Structure and Change
Professional Services
Multiple Chart
Deloitte
Add to my slides
Remove from favorites
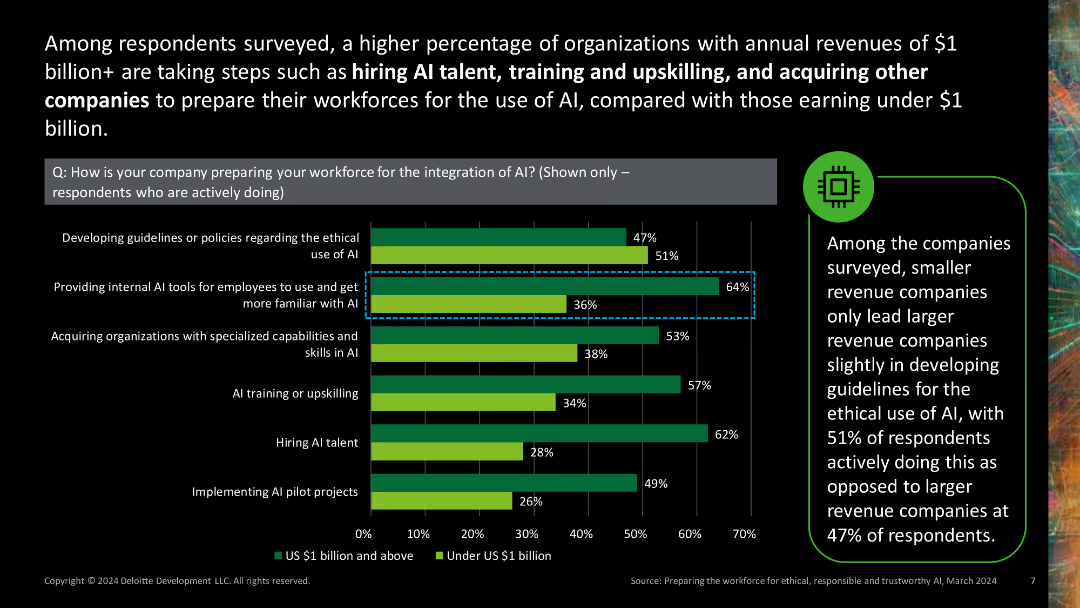
Column chart comparing AI preparation strategies by company size.
Human Resources and Talent Management
Technology & Software
Compares the approaches of large and small companies in integrating AI into their workforce, highlighting differences in hiring and training strategies.
company size, AI integration, workforce strategies, hiring, training
false
Human Resources and Talent Management
Technology & Software
Mixed Chart
Deloitte
Add to my slides
Remove from favorites
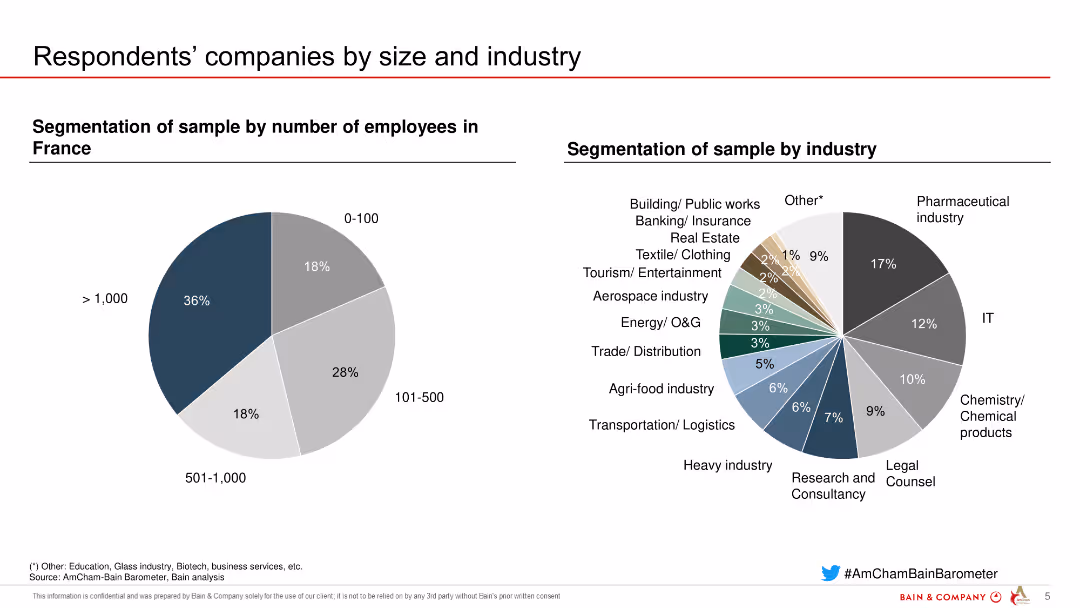
Slide displays two pie charts: one for company size distribution and another for industry distribution within a sample from France.
Industry Overview
Professional Services
Provides a demographic breakdown of respondents' companies by size and industry, useful for understanding the sample structure in market research.
company size, industry distribution, market research, demographics, France
false
Industry Overview
Professional Services
Multiple Chart
Bain
Add to my slides
Remove from favorites
The slide has two pie charts. The left chart shows the segmentation of companies by number of employees, while the right chart depicts the segmentation by industry. Different colors are used for each segment.
Market Analysis and Trends
Professional Services
The slide provides a breakdown of respondents' companies by size and industry, highlighting the diversity of the sample and the representation across various sectors.
company size, industry, segmentation, pie charts, survey, sample diversity
false
Market Analysis and Trends
Professional Services
Multiple Chart
Bain
Add to my slides
Remove from favorites
Bar chart showing EBIT margin and revenue CAGR by supplier size (based on revenue tiers), with commentary on performance by tier.
Financial Performance
Industrial & Manufacturing
Analyzes profitability across different company sizes. Midsize and large suppliers outperform very small ones. The insights emphasize benefits of scale, innovation, and focused portfolios in driving profitability.
company size, profitability, growth, EBIT margin, revenue tier, automotive suppliers
false
Financial Performance
Industrial & Manufacturing
Mixed Chart
Roland Berger
Add to my slides
Remove from favorites
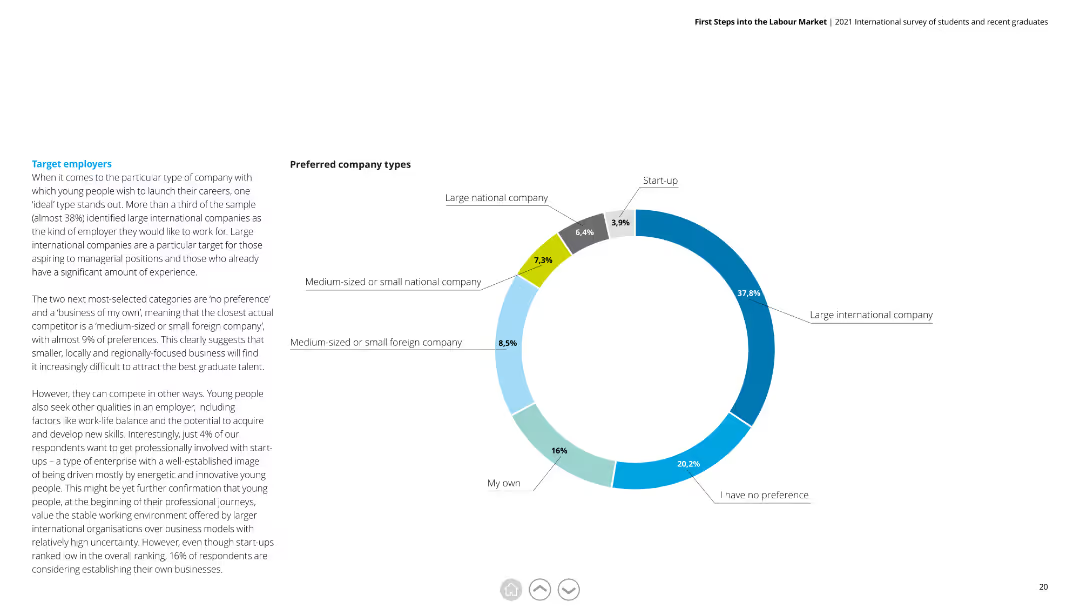
A pie chart showing preferred company types among respondents, with segments labeled for clarity.
Market Analysis and Trends
Professional Services
Displays respondent preferences for company types, including large international companies and medium-sized national companies.
Company Types, Preferences, Large International, Medium-Sized, National, Respondents
false
Market Analysis and Trends
Professional Services
Mixed Chart
Deloitte
Add to my slides
Remove from favorites
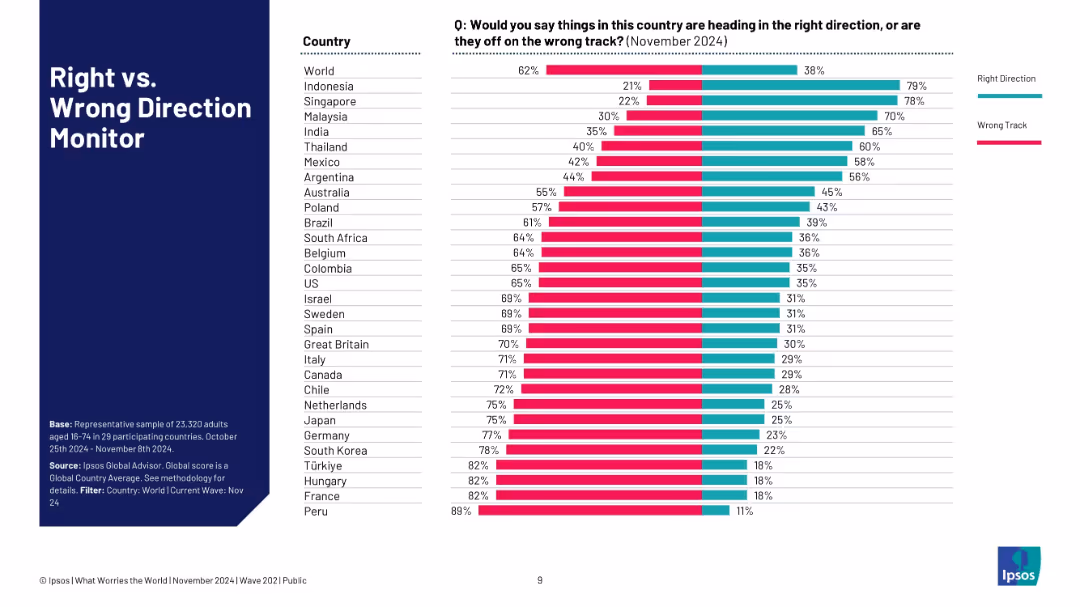
Bar chart comparing multiple countries; color-coded bars for "Right Direction" and "Wrong Track".
Market Analysis and Trends
Professional Services
The slide benchmarks 29 countries on public opinion regarding national direction. It shows wide variation across countries, with nations like Indonesia and Singapore having the most positive outlooks, while France and Peru show highest levels of dissatisfaction.
comparative analysis, public sentiment, global perception, wrong track, country benchmarking, Ipsos
false
Market Analysis and Trends
Professional Services
Single Chart
IPSOS
Add to my slides
Remove from favorites
Two column charts side-by-side: the left chart shows the share of minutes viewed by category (Cable, Broadcast, Streaming, Other), and the right chart shows the streaming share of minutes viewed by specific services (Netflix, YouTube, Hulu, etc.).
Market Analysis and Trends
Media & Entertainment
This slide provides a comparison of the share of minutes viewed by category and the streaming share of minutes viewed by specific services from May 2021 to January 2022, illustrating the dominance and trends of each service over time.
comparative analysis, viewership share, streaming services, cable, broadcast
false
Market Analysis and Trends
Media & Entertainment
Multiple Chart
Nielsen
Add to my slides
Remove from favorites
The slide presents a comparative table of various players in the market research industry, showing turnover and focus areas.
Competitive Landscape
Professional Services
The slide compares Ipsos with other market research companies, highlighting turnover figures and areas of specialization.
Comparative, Market Research, Turnover, Specialization, Ipsos
false
Competitive Landscape
Professional Services
Multiple Chart
IPSOS
Add to my slides
Remove from favorites
Contains text boxes with bullet points comparing the US and France with Australia in terms of cement industry characteristics.
Strategic Planning
Industrial & Manufacturing
Compares the cement supply chain and import-export dynamics of the US Northeast and France with Australia. Identifies key factors for selection of comparators, such as economic development and shipping methods.
Comparators, cement industry, US, France, Australia
false
Strategic Planning
Industrial & Manufacturing
Header Vertical
LEK
Add to my slides
Remove from favorites
P&L comparison for connectivity funding models
Strategic Planning
Telecommunications
Shows bar graphs comparing costs and gaps across various funding models, including government subsidies and community contributions. The layout is straightforward, focusing on the financial aspects with clear labels and color differentiation.
Compares profitability and losses across different funding models for school connectivity in Java, Bali, and Sumatra, discussing the efficacy and limitations of each.
false
Strategic Planning
Telecommunications
Multiple Chart
BCG
Add to my slides
Remove from favorites
Pie chart and data points, featuring a concise and clean layout.
Investment Analysis
Energy & Utilities
Provides an overview of Compass's Oil & Gas portfolio, key figures, and risk assessments for BBVA USA.
Compass, portfolio, BBVA, risk
false
Investment Analysis
Energy & Utilities
Mixed Chart
Morgan Stanley
Add to my slides
Remove from favorites
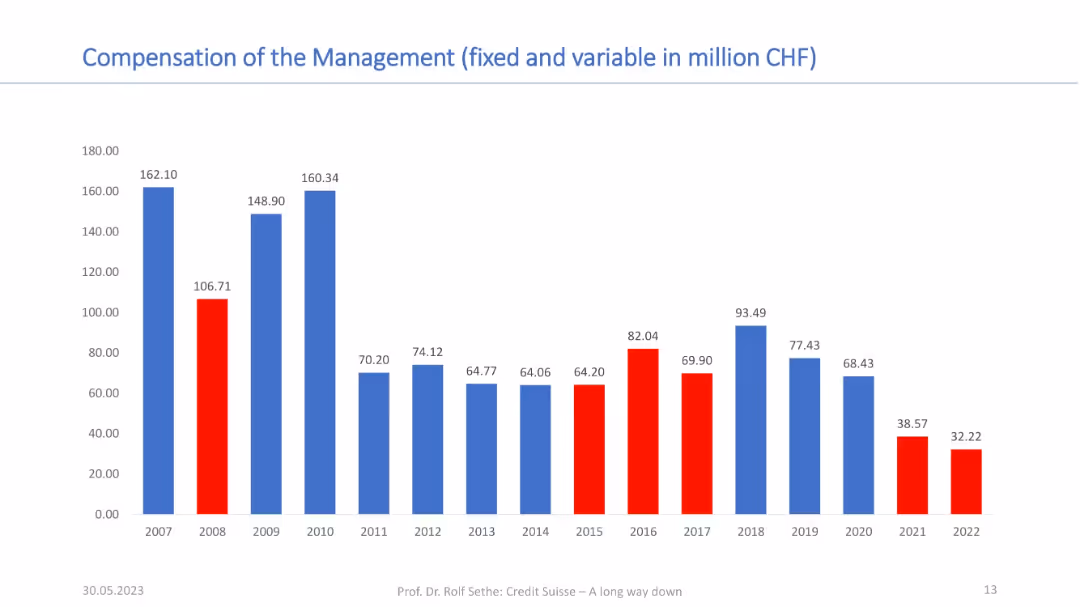
Bar chart showing annual compensation in CHF from 2007–2022; red for low/declining years, blue for higher periods.
Human Resources and Talent Management
Financial Services
This slide visualizes executive compensation trends at Credit Suisse, indicating inconsistent pay relative to performance. Years with high payouts often preceded financial losses, suggesting misalignment of incentives and shareholder value.
compensation, Credit Suisse, management, executive pay, financial alignment, HR, remuneration, performance gap
false
Human Resources and Talent Management
Financial Services
Single Chart
Credit Suisse
Add to my slides
Remove from favorites
This slide features a puzzle-shaped triangle diagram segmented into three parts, each labeled with a key component of an attractive rewards and compensation structure.
Human Resources and Talent Management
Professional Services
The slide is designed to discuss the three core components that constitute an attractive rewards and compensation system in an organization, likely used as part of a detailed HR presentation on employee remuneration and benefits.
Compensation, Employee Benefits, Rewards Structure, HR Strategy
false
Human Resources and Talent Management
Professional Services
Framework
Kearney
Add to my slides
Remove from favorites
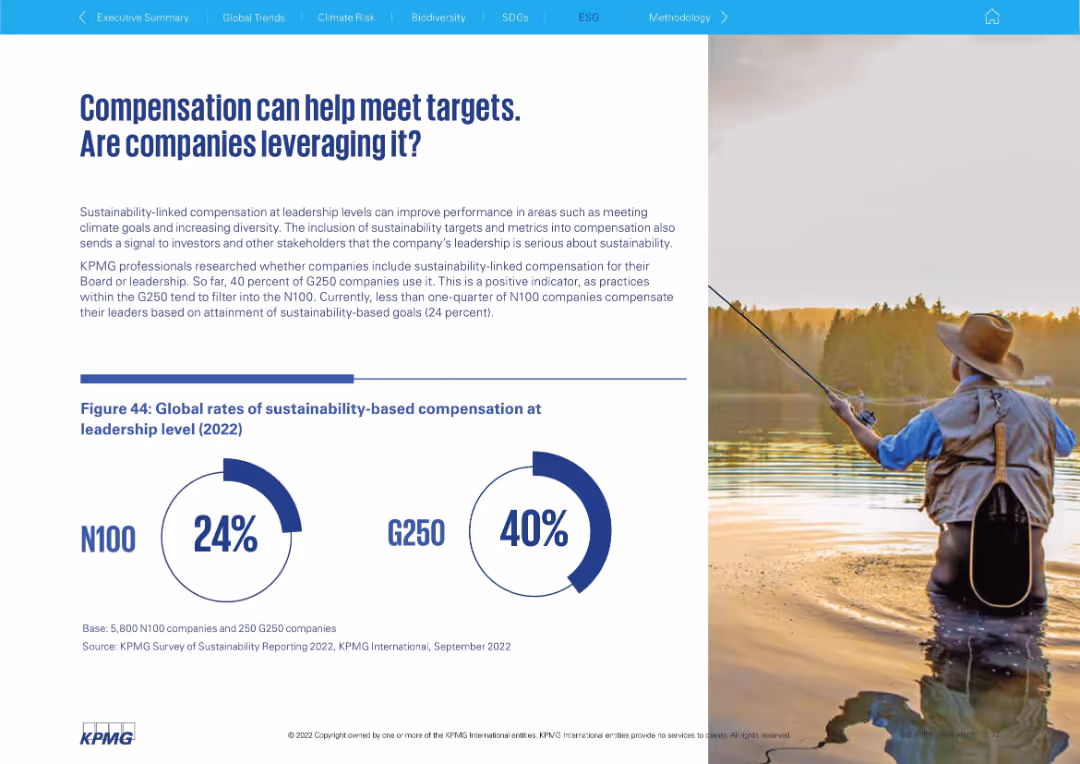
Split design with fishing scene and a large infographic showing rates of sustainability-based compensation.
Human Resources and Talent Management
Professional Services
This slide highlights how sustainability-linked compensation is used to align leadership performance with ESG goals. It reveals only 24% of N100 and 40% of G250 companies use such incentives.
compensation, ESG goals, performance metrics, executive pay, sustainability, leadership incentives, G250, N100
false
Human Resources and Talent Management
Professional Services
Mixed Chart
KPMG
Add to my slides
Remove from favorites
This slide uses a combination of tables and a chart to present compensation structures. There are text boxes with bullet points, and a flow diagram depicts the performance share plans linkage to ESG criteria.
Financial Performance
Industrial & Manufacturing
Showcases the integration of ESG criteria into Michelin’s managerial compensation, aligning financial incentives with environmental and social governance. It can be used to discuss performance-based compensation strategies.
Compensation, ESG, Performance, Incentives, Management
false
Financial Performance
Industrial & Manufacturing
Header Horizontal
Morgan Stanley
Add to my slides
Remove from favorites
Two charts: a bar chart on the left comparing fixed and variable compensation across countries, and a scatter plot on the right showing the relationship between total compensation and fixed compensation percentage.
Market Analysis and Trends
Financial Services
This slide shows how fixed and variable compensation differs for senior executives in various countries, emphasizing that North America tends to have higher variable compensation while other regions favor fixed elements.
Compensation, Fixed, Variable, Markets, Executives
false
Market Analysis and Trends
Financial Services
Multiple Chart
Deloitte
Add to my slides
Remove from favorites
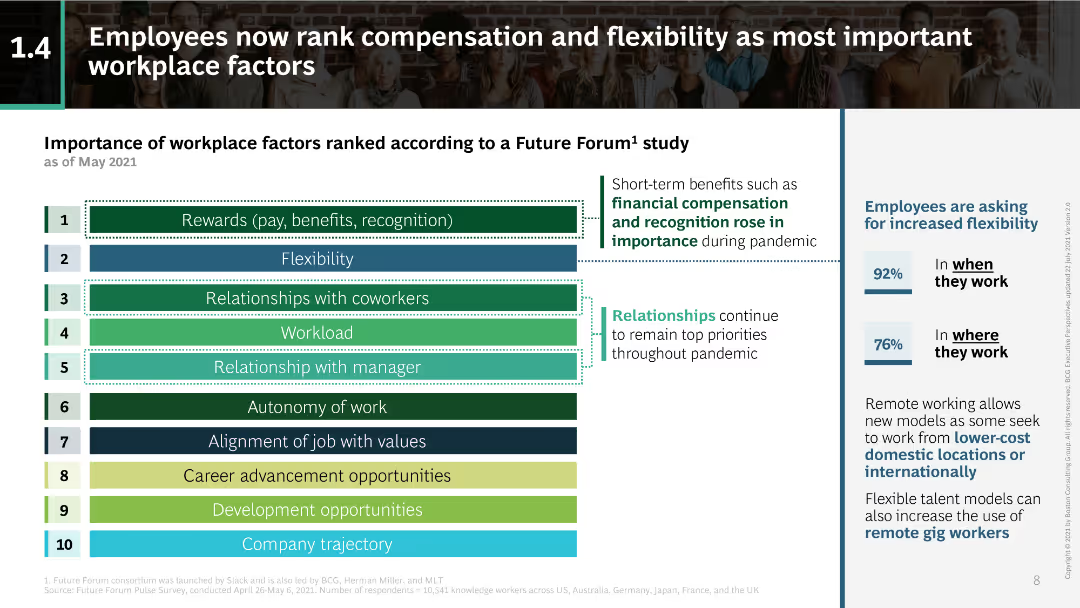
Ranked list of workplace factors with compensation and flexibility at the top; text discussing the importance of these factors.
Human Resources and Talent Management
Professional Services
Identifies the shift in workplace priorities towards compensation and flexibility, influenced by the pandemic, and their importance in employee satisfaction and retention.
compensation, flexibility, workplace factors, employee satisfaction, retention, workplace priorities, pandemic impact
false
Human Resources and Talent Management
Professional Services
Diagram
BCG
Add to my slides
Remove from favorites
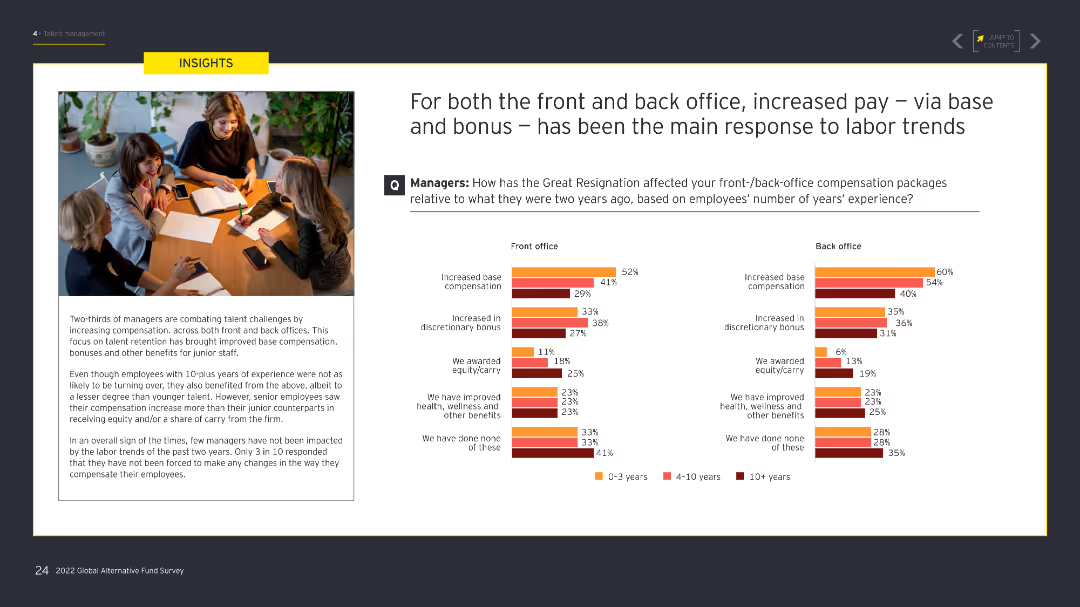
The slide features two column charts comparing the impact of the Great Resignation on front and back office compensation packages. An image on the left shows professionals in a casual meeting. The charts use different shades of orange and red to display data.
Human Resources and Talent Management
Financial Services
The slide outlines how managers have increased base compensation and discretionary bonuses to address labor challenges for both front and back offices, focusing on improving compensation to retain staff.
Compensation, labor trends, Great Resignation, front office, back office
false
Human Resources and Talent Management
Financial Services
Multiple Chart
EY
Add to my slides
Remove from favorites
This slide has a two-column comparative layout with icons and bullet points. The left side is turquoise, the right blue, both featuring text and symbols representing different compensation stages.
Human Resources and Talent Management
Technology & Software
Compares early and late-stage compensation principles, appealing to varying levels of risk and immediacy of benefits, relevant to HR professionals.
compensation, structure, early-stage, late-stage, equity, benchmarks, performance, seniority, trends
false
Human Resources and Talent Management
Technology & Software
Linear Flow
Kearney
Add to my slides
Remove from favorites
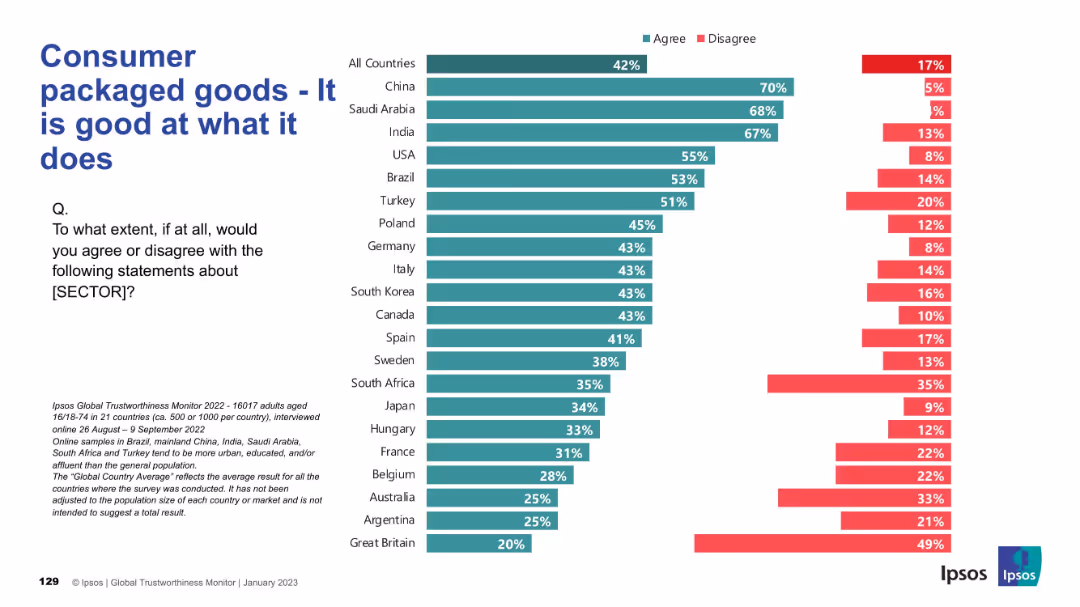
Horizontal bar chart format with country-by-country agreement/disagreement on competence of consumer packaged goods sector; new sector compared to earlier slides.
Product and Service Analysis
Consumer Goods
This slide evaluates the perceived competency of the consumer packaged goods sector. China, Saudi Arabia, and India report the highest agreement levels, while European countries display more moderate or skeptical views, suggesting varied confidence in product performance.
competence, product quality, consumer goods, global perception, Ipsos
false
Product and Service Analysis
Consumer Goods
Mixed Chart
IPSOS
Add to my slides
Remove from favorites
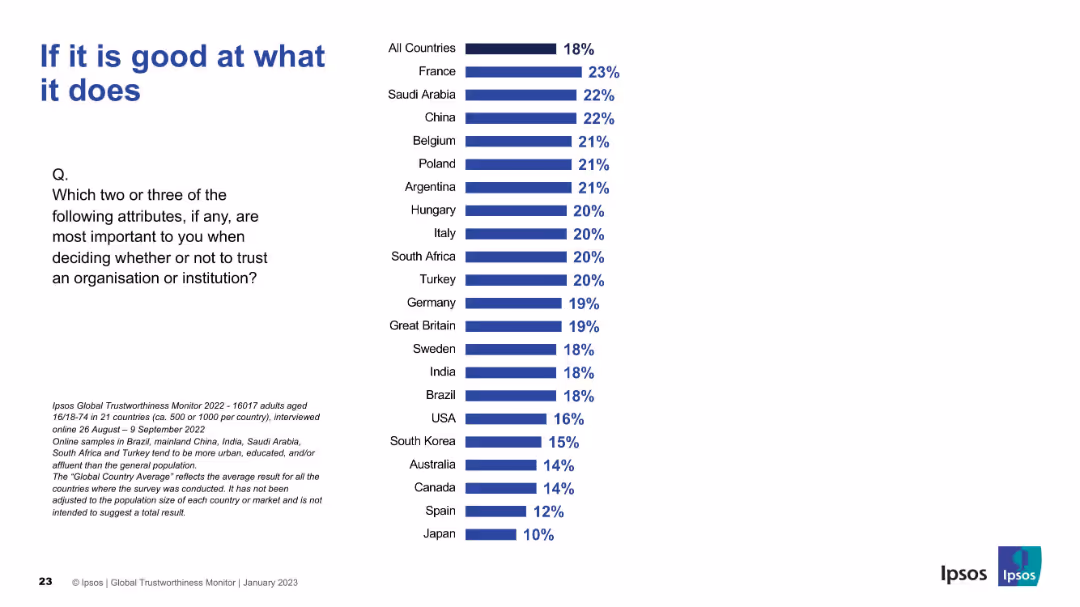
Title in large font, bar chart ranks countries by importance placed on competence. All countries average at top, followed by individual country values.
Market Analysis and Trends
Professional Services
Highlights country-level perspectives on the importance of organizational competence in trust decisions. France and Saudi Arabia rank highest; Japan ranks lowest.
competence, trust factors, country comparison, Ipsos, capability, trustworthiness
false
Market Analysis and Trends
Professional Services
Mixed Chart
IPSOS
Add to my slides
Remove from favorites
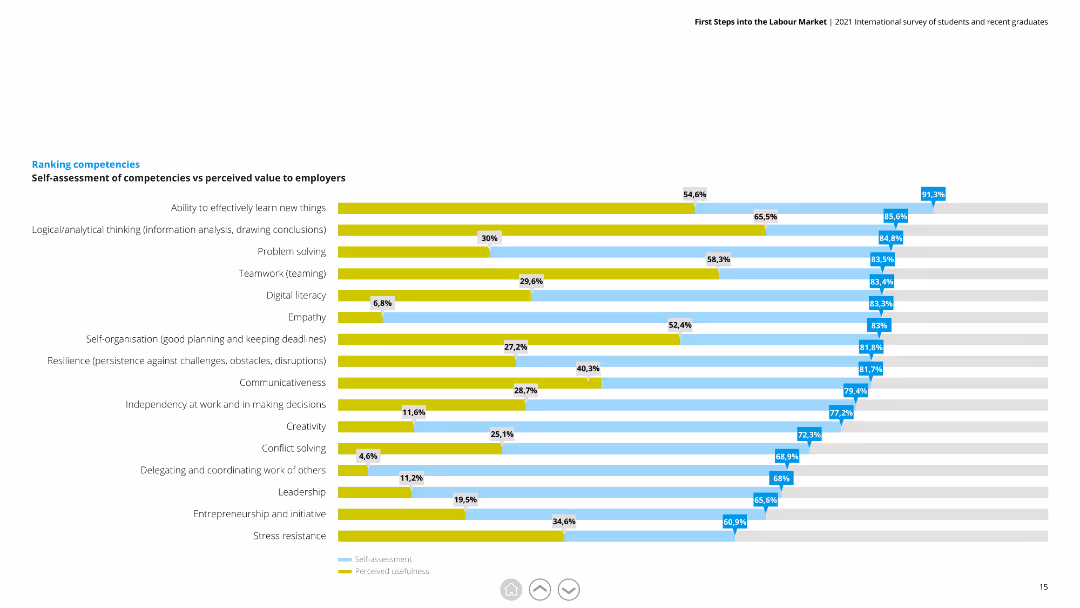
A horizontal bar chart (bar chart) comparing self-assessment of competencies vs perceived value to employers. Bars are color-coded for easy distinction.
Performance Metrics and KPIs
Professional Services
Visual representation of how respondents rate their competencies and how they think employers value these skills, highlighting gaps between perception and reality.
Competencies, Employers, Self-Assessment, Value, Perception, Skills, Comparison
false
Performance Metrics and KPIs
Professional Services
Single Chart
Deloitte
Add to my slides
Remove from favorites
Lists key competencies in bullet points with contrasting headers for core competences and rapidly accelerating competences. Clear layout and text hierarchy.
Organizational Structure and Change
Technology & Software
Details Faurecia's core and emerging competencies aimed at enhancing its technological footprint in automotive cockpit innovations, with a focus on AI and data analytics enhancements.
competencies, innovation, automotive, AI, data analytics, technology
false
Organizational Structure and Change
Technology & Software
Boxed
Deutsche Bank
Add to my slides
Remove from favorites
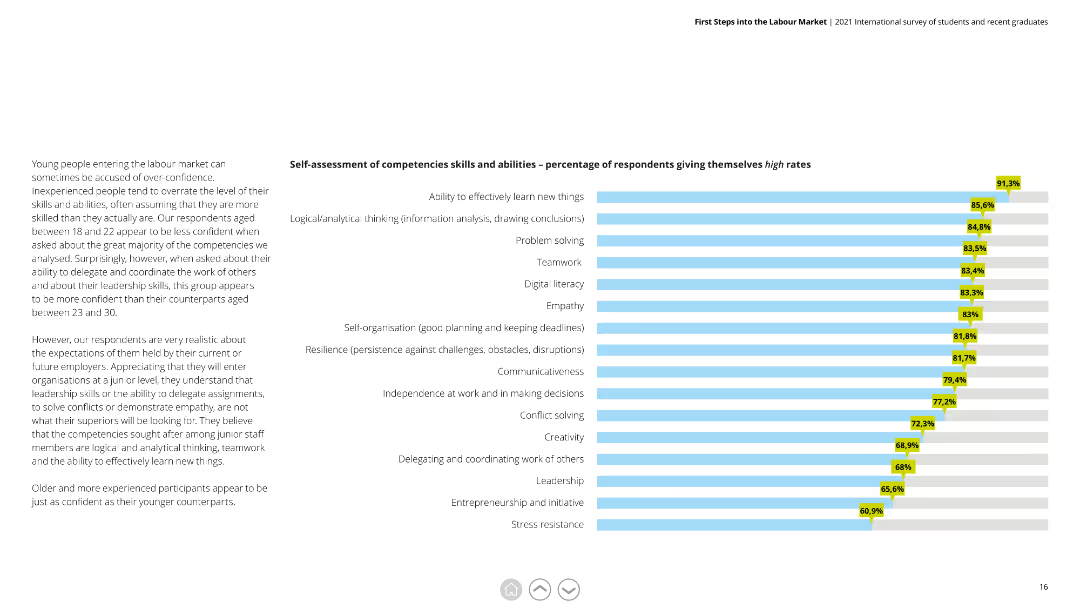
Another horizontal bar chart (bar chart) showing the percentage of respondents giving themselves high ratings in various skills and abilities.
Performance Metrics and KPIs
Professional Services
Analyzes how respondents rate their own competencies, providing insights into areas of overconfidence or underestimation among different age groups.
Competencies, Self-Assessment, Skills, Abilities, Ratings, Age Groups, Analysis
false
Performance Metrics and KPIs
Professional Services
Mixed Chart
Deloitte
Add to my slides
Remove from favorites
The slide features a structured diagram illustrating the competencies required for a Data Scientist, with a mix of foundational non-tech skills and next-level tech-skills, clearly divided and labeled in distinct boxes.
Strategic Planning
Technology & Software
The slide is used for outlining the essential competencies for a Data Scientist role, delineating both foundational non-technical skills and advanced technical skills necessary for the profession.
Competency, Data Scientist, Skills, Framework, Role-Specific
false
Strategic Planning
Technology & Software
Diagram
Kearney
Add to my slides
Remove from favorites
Slide with images and lists highlighting key players in FinTechs, Financial Institutions, and Telcos.
Competitive Landscape
Financial Services
Describes the competitive environment across FinTechs, financial institutions, and telecommunications.
competition, FinTech, financial institutions, telcos
false
Competitive Landscape
Financial Services
Table
BCG
Add to my slides
Remove from favorites
The slide features a circular diagram categorizing competition by sectors and specialties, with Ipsos at the center.
Competitive Landscape
Professional Services
The slide provides an overview of the competitive landscape, illustrating how Ipsos competes across various sectors and specialties.
Competition, Sectors, Specialties, Ipsos, Market Research
false
Competitive Landscape
Professional Services
Diagram
IPSOS
Add to my slides
Remove from favorites
Comprises a central circular diagram surrounded by color-coded segments that detail various business units and their contributions. Bullet points next to the diagram summarize competitive advantages and firmwide partnerships.
Competitive Landscape
Financial Services
Outlines how JPMC's diverse platform across different banking and financial services sectors generates competitive advantage and client value, backed by a global brand and robust technology infrastructure.
competitive advantage, firmwide partnerships, JPMC, strategic planning, financial services, global footprint, technology infrastructure
false
Competitive Landscape
Financial Services
Diagram
JP Morgan
Add to my slides
Remove from favorites
World map with highlighted countries and text boxes detailing Ipsos' strengths and global presence.
Competitive Landscape
Professional Services
Showcases Ipsos' competitive advantages, including global market leadership, extensive public sector research, and multidisciplinary teams. Highlights geographic and institutional reach.
Competitive Advantage, Global Presence, Research, Ipsos
false
Competitive Landscape
Professional Services
Graphic
IPSOS
Add to my slides
Remove from favorites
The slide has two distinct sections: on the left, a vertical list of competitive advantages with dark blue horizontal bars; on the right, future goals with numeric rankings and bullet points.
Strategic Planning
Financial Services
The slide presents key advantages that position the company for future growth and outlines specific forward goals with rankings in various financial sectors.
competitive, advantages, growth, financial, banking, market share, execution, global reach, trusted advisor
false
Strategic Planning
Financial Services
Table
Goldman Sachs
Add to my slides
Remove from favorites
The slide features comparative column charts detailing the fleet size and average age of Seadrill and its competitors. It uses a dual-axis format to display numbers of rigs and fleet age, making direct comparisons straightforward. The color palette is consistent with Seadrill's branding, and each graph is clearly labeled to ensure viewer understanding. The overall design is sleek and professional, emphasizing key data points through effective visual contrast.
Competitive Landscape
Energy & Utilities
The slide compares Seadrill's fleet size and age with those of its competitors, highlighting its position in the market. It serves as a competitive analysis tool in investor briefings or strategic meetings, arguing Seadrill's advantages in terms of a newer, more technologically advanced fleet. The presentation of this data aims to convey Seadrill's industry standing and readiness for future market demands, supporting arguments for investment or strategic shifts based on fleet composition and age.
competitive analysis, fleet size, age, Seadrill, bar graphs, market position, strategic meetings, technology, investment, industry standing
false
Competitive Landscape
Energy & Utilities
Multiple Chart
Barclays
Add to my slides
Remove from favorites
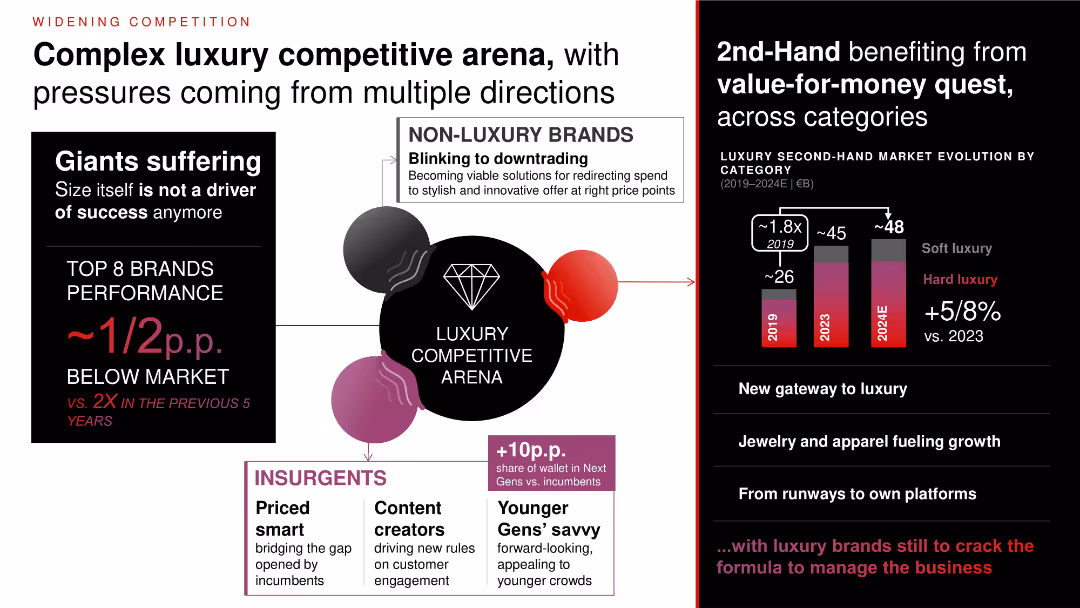
Central diagram of competitive forces; sidebar showing second-hand market growth; bar chart of resale growth from 2019–2024E.
Competitive Landscape
Consumer Goods
Luxury brands are facing intensified competition from both insurgents and non-luxury brands, alongside rapid second-hand market growth. Younger, price-savvy consumers and content creators are reshaping competition and share of wallet dynamics.
competitive dynamics, second-hand, luxury market, insurgents, content creators, value-for-money
false
Competitive Landscape
Consumer Goods
Mixed Chart
Bain
Add to my slides
Remove from favorites
A circular diagram categorizes companies into four sectors: pure-play fintechs, established financial services players, consumer tech platforms, and established consumer players, with examples for each. The slide layout is complex, featuring a network of interactions between different categories of players.
Competitive Landscape
Financial Services
This slide outlines the competitive landscape in the financial services industry in 2019, showing various market players from established banks to new tech entrants and their interrelations, emphasizing the diverse ecosystem within the digital financial services space.
competitive, landscape, financial services, fintechs, tech platforms, market players, 2019
false
Competitive Landscape
Financial Services
Diagram
Bain
Add to my slides
Remove from favorites
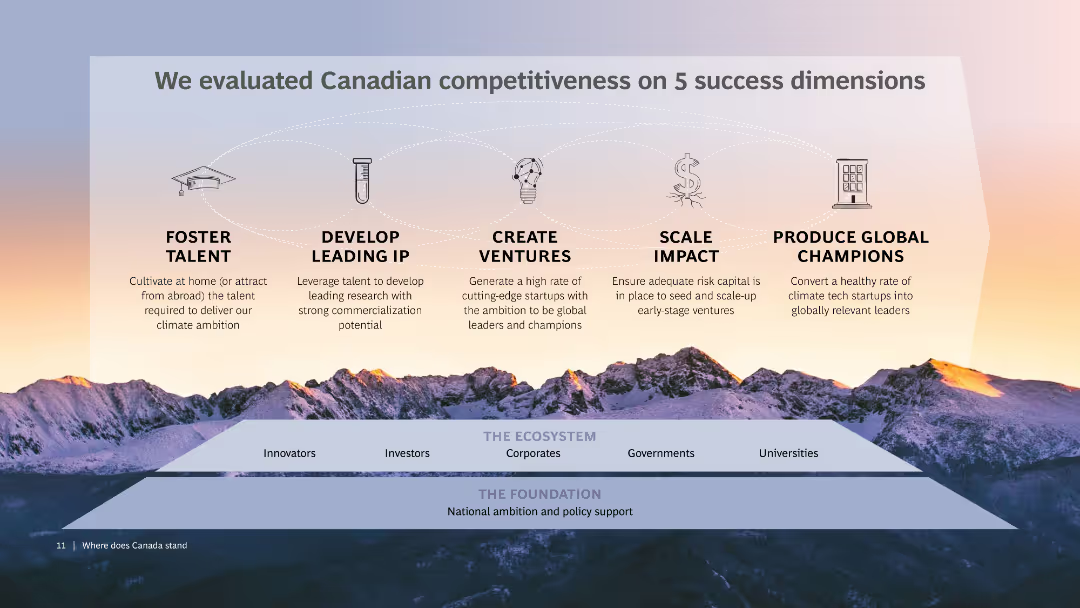
The slide shows five icons representing key success dimensions: talent, IP, ventures, impact, and champions, over a backdrop of a mountain range at sunset. Below the icons, there is a diagram linking "The Ecosystem" and "The Foundation" with various stakeholders like innovators and government.
Strategic Planning
Professional Services
Evaluates Canadian competitiveness based on talent, leading IP, venture creation, scaling impact, and producing global champions. Provides a framework connecting various stakeholders within the ecosystem and foundation.
Competitiveness, Canada, Success dimensions, Talent, IP
false
Strategic Planning
Professional Services
Pillar
BCG
Add to my slides
Remove from favorites
This slide features a multi-colored stacked heatmap detailing Hong Kong's competitiveness in various ESG-related areas. The chart uses different shades to represent degrees of competitiveness.
Market Analysis and Trends
Financial Services
The data visualizes Hong Kong's position in the financial market maturity, presence in international markets, and local enthusiasm for ESG, among others. Each area is assessed for competitiveness, showcasing Hong Kong's strengths and areas for improvement in the context of ESG finance.
Competitiveness, Financial markets, Hong Kong, ESG, Sustainability
false
Market Analysis and Trends
Financial Services
Table
PwC/Strategy&
Add to my slides
Remove from favorites
The slide features two large comparative column charts detailing France's strengths and weaknesses against other European countries in various categories such as cultural environment and redundancy costs.
Market Analysis and Trends
Financial Services
Analyzes France's competitive position in Europe by detailing areas where it excels or falls short, such as cultural advantages and business flexibility compared to other European nations.
competitiveness, France, Europe, culture, business environment
false
Market Analysis and Trends
Financial Services
Single Chart
Bain
Add to my slides
Remove from favorites
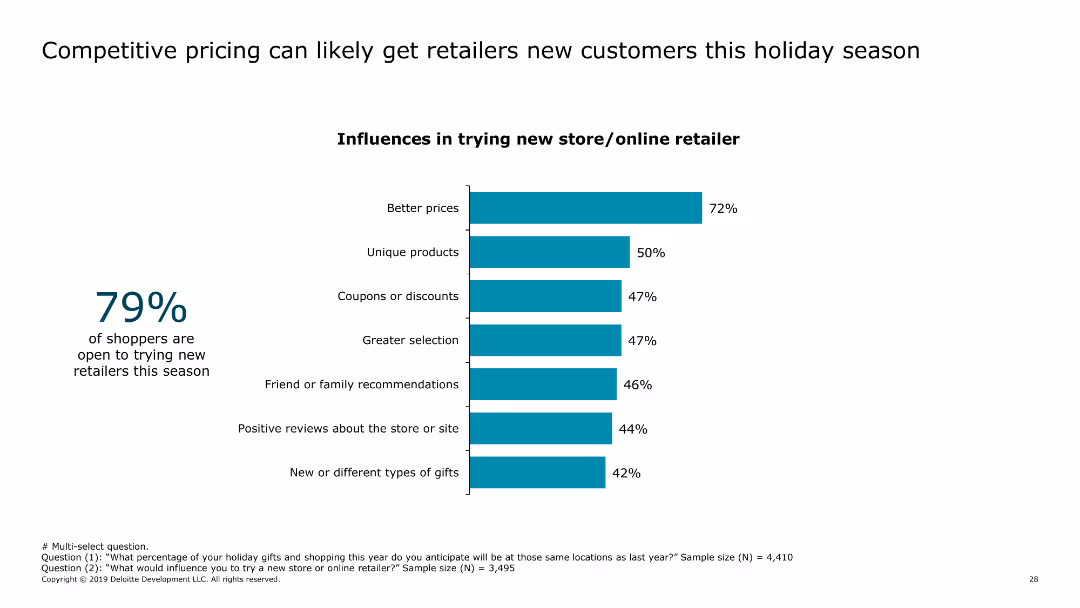
The slide contains a column chart showing factors that influence consumers to try new stores or online retailers, such as better prices, unique products, coupons or discounts, and greater selection.
Market Analysis and Trends
Retail & E-commerce
The slide emphasizes the impact of competitive pricing and unique product offerings on attracting new customers, particularly during the holiday season.
competitive pricing, consumer attraction, new customers, holiday shopping, retail strategy
false
Market Analysis and Trends
Retail & E-commerce
Mixed Chart
Deloitte
Add to my slides
Remove from favorites
The slide is organized around a circular diagram that links various operational initiatives under the umbrella of "Seadrill Solutions." Accompanying this are images of drilling equipment and operational diagrams, providing a visual representation of the services mentioned. Text blocks list key strategies like Managed Pressure Drilling and Integrated Performance Management. The layout is dynamic yet clear, with a color scheme that supports readability and draws attention to key areas.
Operational Efficiency
Energy & Utilities
The slide outlines Seadrill's strategies for improving its competitive edge through various integrated services and innovations in drilling. Each strategy is briefly explained, and its significance to Seadrill's operations is highlighted. This slide is likely used in strategic meetings or operational reviews to discuss ways to enhance efficiency, reduce costs, and improve safety in operations. It serves to inform and potentially persuade stakeholders of the merits of ongoing and future initiatives aimed at operational excellence.
competitive, Seadrill, strategies, operations, drilling, efficiency, innovation, services, diagram, performance management
false
Operational Efficiency
Energy & Utilities
Vertical Flow
Barclays
Add to my slides
Remove from favorites
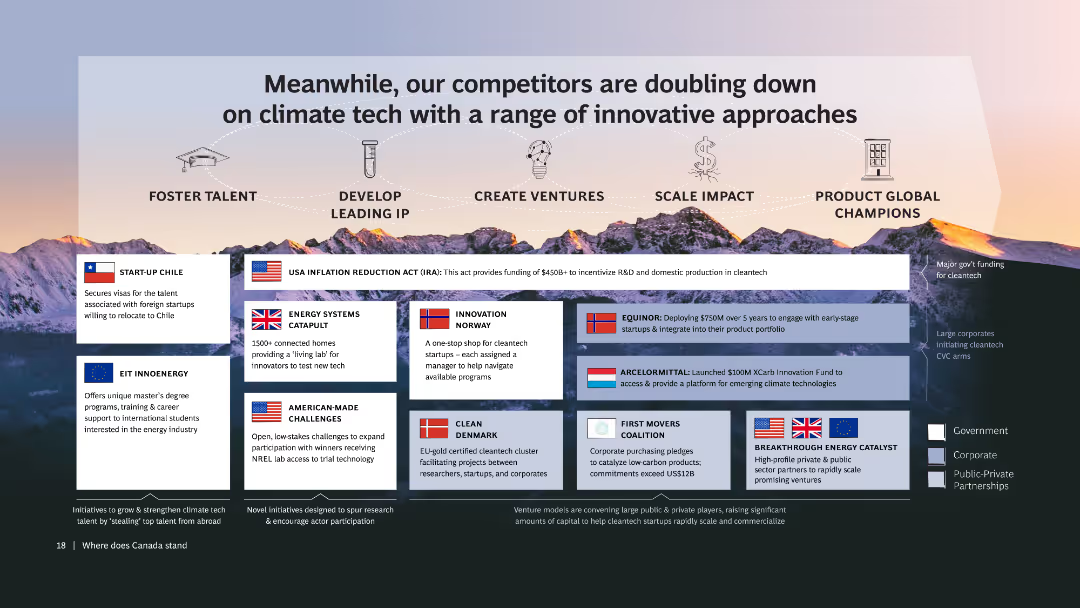
The slide shows various competitor initiatives in climate tech, each with a flag, title, and brief description, over a mountain range background. Includes icons representing key success dimensions: talent, IP, ventures, impact, and champions.
Competitive Landscape
Technology & Software
Compares different approaches by global competitors in climate tech, showcasing various initiatives and innovations. Highlights the need for Canada to adopt similar strategies to stay competitive.
Competitors, Climate tech, Innovation, Strategies, Comparison
false
Competitive Landscape
Technology & Software
Table
BCG
Add to my slides
Remove from favorites
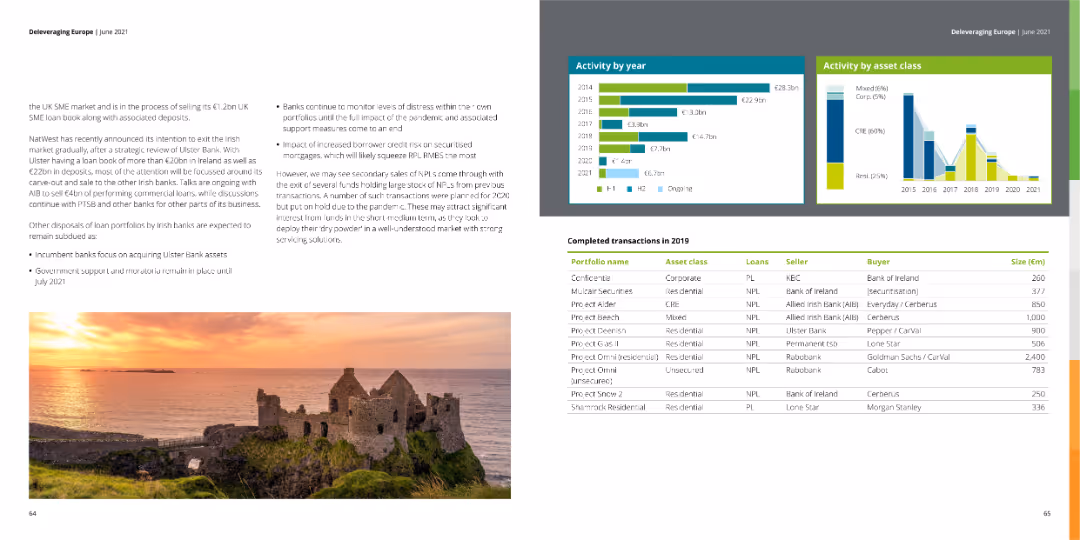
The slide shows column charts of activity by year and asset class, along with a table of completed transactions in 2019. An image of a scenic landscape is featured.
Market Analysis and Trends
Financial Services
This slide details the completed transactions in 2019 within the financial services industry, focusing on activity by year and asset class.
completed transactions, 2019, financial services
false
Market Analysis and Trends
Financial Services
Multiple Chart
Deloitte
Add to my slides
Remove from favorites
Layout includes distinct sections for types of services with relevant icons.
Regulatory and Compliance
Professional Services
Highlights the services and approaches for ensuring compliance and handling anti-corruption measures across global operations, focusing on regulatory demands, risk assessment, and ensuring ethical business practices.
compliance, anti-corruption, regulatory, global operations, ethics
false
Regulatory and Compliance
Professional Services
Table
Alvarez & Marsal
Add to my slides
Remove from favorites
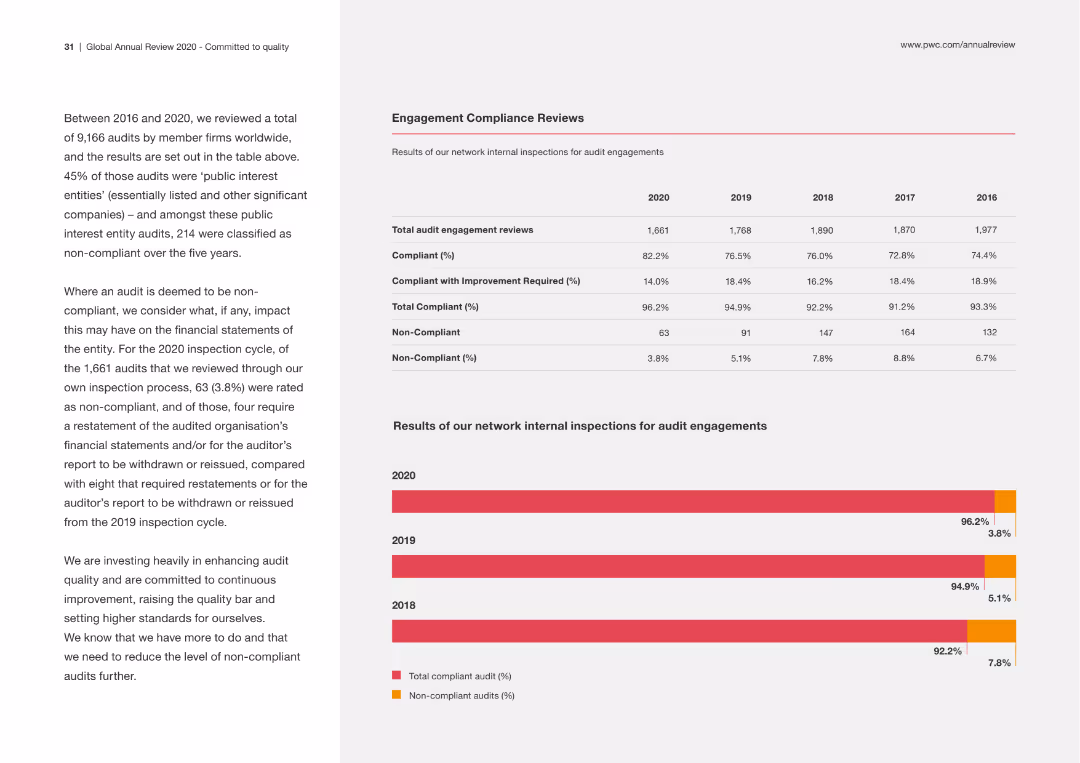
This slide features a table displaying compliance review results over several years. It includes percentages for compliant, non-compliant, and those requiring improvement, accompanied by a brief description of the audit process and results.
Regulatory and Compliance
Professional Services
The slide reviews the compliance status of audit engagements, showing improvement trends and emphasizing PwC's commitment to audit quality and adherence to regulatory standards.
Compliance, audit, regulatory standards, engagement reviews, audit quality
false
Regulatory and Compliance
Professional Services
Mixed Chart
PwC/Strategy&
Add to my slides
Remove from favorites
This slide includes a table displaying compliance review results over several years. It includes percentages for compliant, non-compliant, and those requiring improvement, accompanied by a brief description of the audit process and results.
Client Case Studies
Professional Services
The slide reviews the compliance status of audit engagements, showing improvement trends and emphasizing PwC's commitment to audit quality and adherence to regulatory standards.
Compliance, audit, regulatory standards, engagement reviews, audit quality
false
Client Case Studies
Professional Services
Mixed Chart
PwC/Strategy&
Add to my slides
Remove from favorites
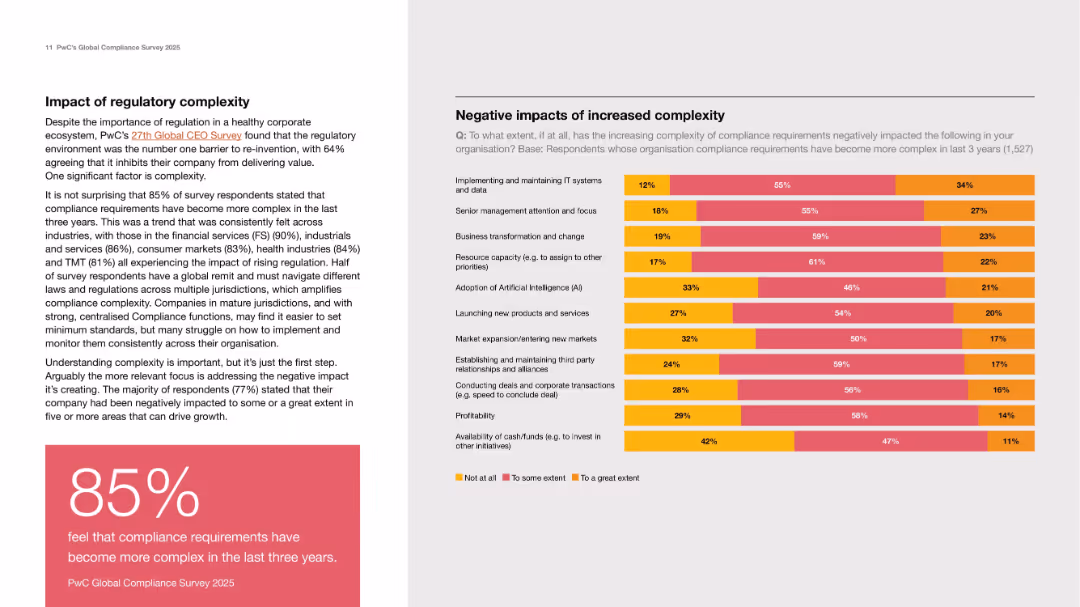
Left text block with statistics and insights; right side shows a stacked bar chart on complexity impact.
Regulatory and Compliance
Professional Services
Highlights how increased compliance complexity negatively affects IT systems, AI adoption, product launches, and profitability. Includes an 85% statistic noting that compliance requirements became more complex in recent years.
compliance complexity, IT systems, AI, profitability, regulation
false
Regulatory and Compliance
Professional Services
Mixed Chart
PwC/Strategy&
Add to my slides
Remove from favorites
Two column charts comparing industry compliance costs and Credit Suisse compliance costs, with other performance metrics.
Regulatory and Compliance
Financial Services
The slide presents advanced technical capabilities to manage risk and compliance costs, showing industry and Credit Suisse comparisons.
Compliance costs, technical capabilities, risk management, industry comparison, performance metrics
false
Regulatory and Compliance
Financial Services
Multiple Chart
Credit Suisse
Add to my slides
Remove from favorites
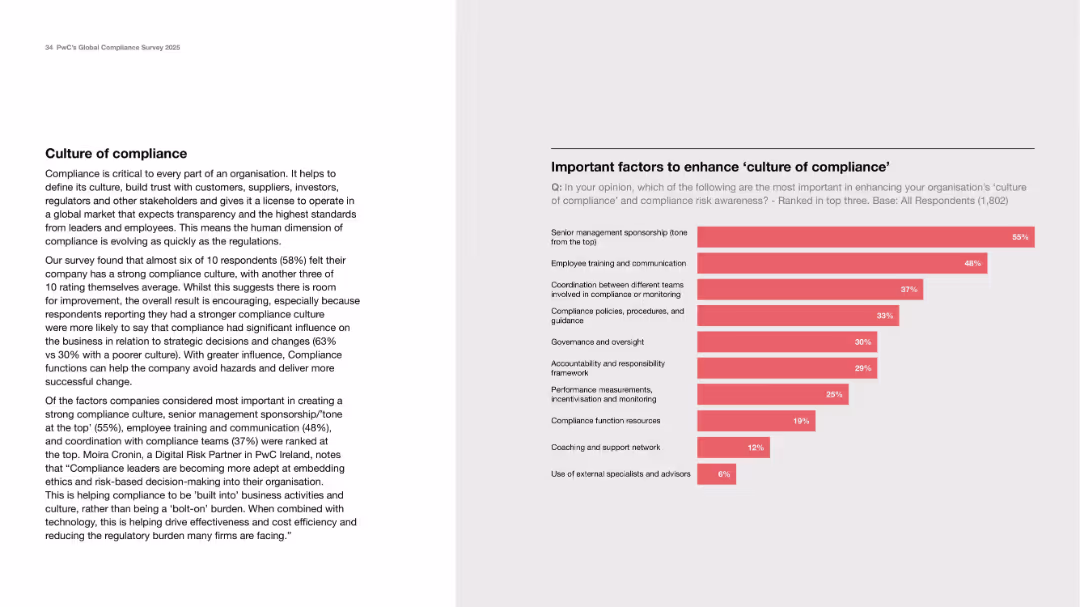
Two-column layout with narrative on the left and bar chart highlighting top drivers of compliance culture on the right.
Organizational Structure and Change
Professional Services
Emphasizes the importance of a strong compliance culture and what factors contribute to building it—like leadership tone, employee training, and team coordination. A chart shows what respondents ranked as most important, with senior leadership sponsorship being the top factor.
compliance culture, leadership, training, communication, governance
false
Organizational Structure and Change
Professional Services
Mixed Chart
PwC/Strategy&
Add to my slides
Remove from favorites
Donut chart displaying 78% registration with the Office of the Information and Data Protection Commissioner.
Regulatory and Compliance
Professional Services
Assists in understanding compliance levels with data protection standards, crucial for regulatory and compliance discussions.
compliance, data protection, registration, standards, evaluation
false
Regulatory and Compliance
Professional Services
Single Chart
PwC/Strategy&
Add to my slides
Remove from favorites
The slide features a semi-circular gauge chart in gradient colors from red to green, indicating scores from "DETRACTOR" to "PROMOTER". A black pointer indicates a score of 8.7, labeled "Promoter".
Regulatory and Compliance
Professional Services
This slide presents a visual metric for assessing compliance with employment legislation, likely used for internal review or external audits. The score of 8.7 suggests a high level of compliance.
compliance, employment, legislation, gauge chart, promoter, detractor, score, regulatory, audit, review
false
Regulatory and Compliance
Professional Services
Single Chart
PwC/Strategy&
Add to my slides
Remove from favorites
Diagram explaining a holistic approach to managing financial crime, using four icons linked by arrows to represent different areas of focus: anti-bribery, anti-money laundering, anti-tax evasion, and sanctions.
Regulatory and Compliance
Financial Services
The slide describes Barclays' integrated strategy for financial crime prevention, emphasizing the synergy between different compliance areas and highlighting the supporting global finance function.
compliance, financial crime, anti-bribery, AML
false
Regulatory and Compliance
Financial Services
Diagram
Barclays
Add to my slides
Remove from favorites
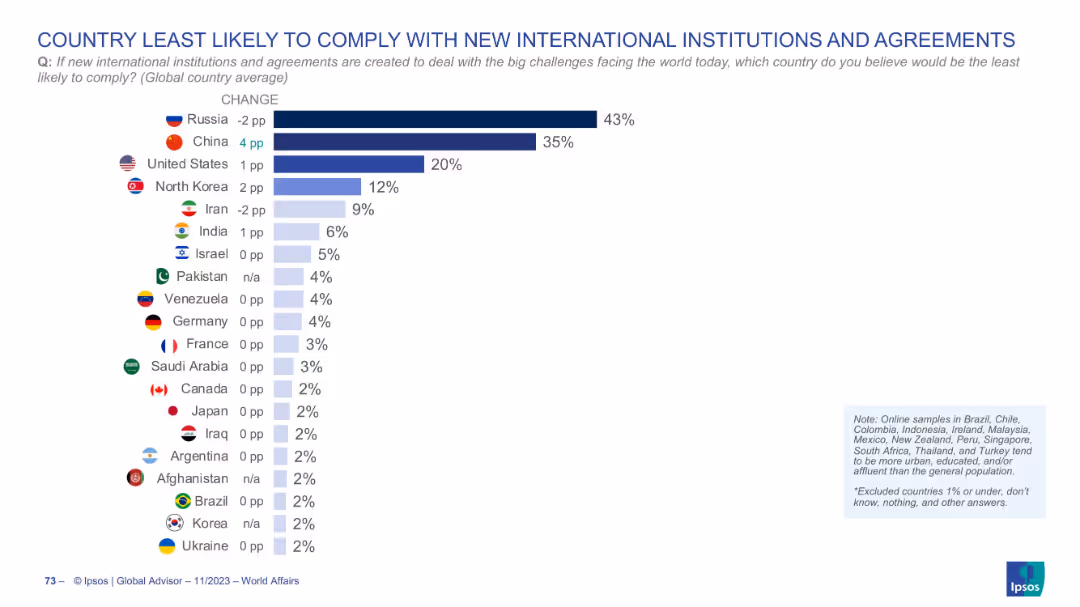
Horizontal bar chart showing which countries are perceived least likely to comply with new global agreements; dark color emphasis for top-ranked nations.
Risk Assessment and Management
Government & Public Sector
Shows that Russia (43%) and China (35%) are considered least likely to comply with new international agreements. The US follows at 20%. Chart highlights geopolitical distrust, especially toward authoritarian regimes.
compliance, international law, geopolitics, perception, global risk
false
Risk Assessment and Management
Government & Public Sector
Single Chart
IPSOS
Add to my slides
Remove from favorites
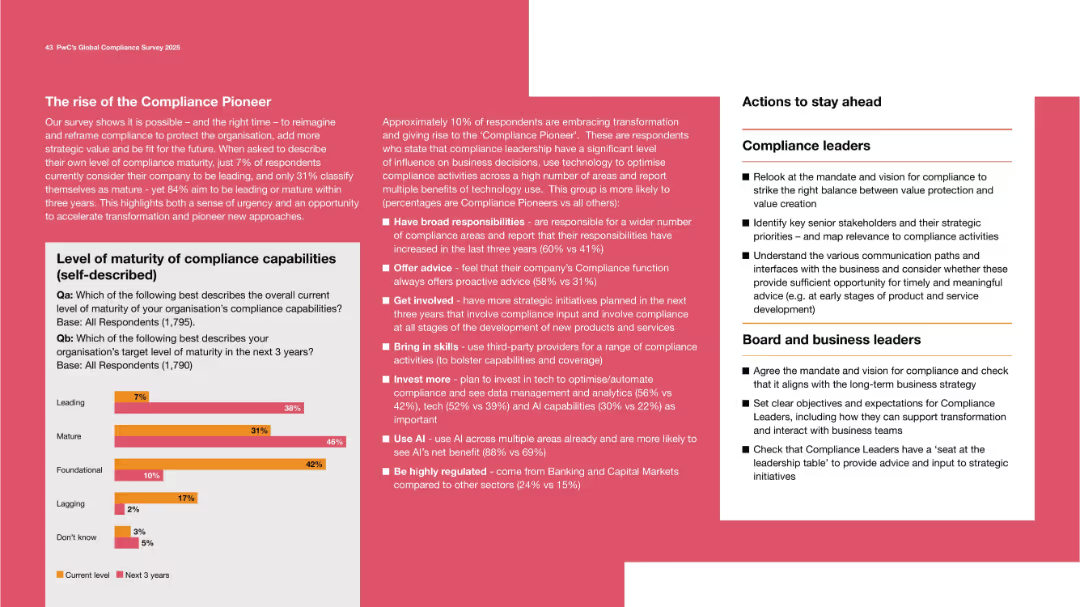
Bold color scheme, with chart on maturity level of compliance and bullet points describing pioneer traits.
Organizational Structure and Change
Professional Services
Encourages redefining compliance roles to become strategic. Few consider their company “leading,” but many aspire to be within three years. Lists traits of “Compliance Pioneers” who lead transformation through broad responsibilities, early involvement, and technology integration.
compliance maturity, transformation, pioneer, leadership, vision
false
Organizational Structure and Change
Professional Services
Mixed Chart
PwC/Strategy&
Add to my slides
Remove from favorites
Left text on evolving approaches; large central statistic; right bar chart on compliance structure types.
Organizational Structure and Change
Professional Services
Discusses trends in centralizing compliance functions and improving decision-making through coordination. Highlights a 59% improvement in decision-making and shows organizational structure statistics.
compliance model, centralization, coordination, decision-making, structure
false
Organizational Structure and Change
Professional Services
Mixed Chart
PwC/Strategy&
Add to my slides
Remove from favorites
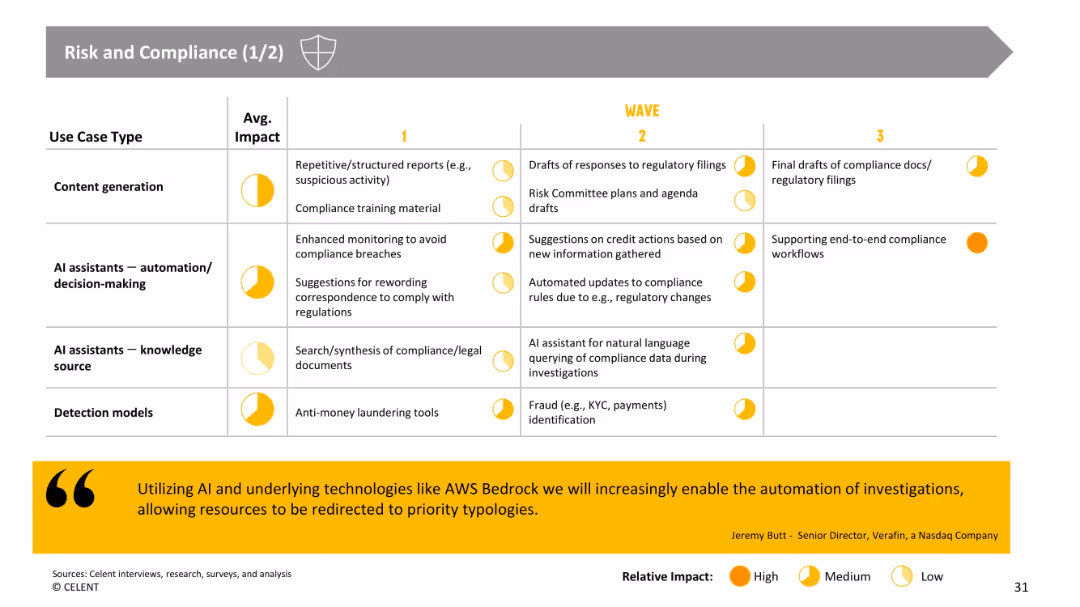
Table continues wave-based layout. Focuses on compliance and regulatory use cases, including content drafting, AI monitoring, and fraud detection. Yellow quote box at bottom highlights impact of AI automation.
Regulatory and Compliance
Financial Services
Describes AI-enabled improvements in compliance tasks—document preparation, breach detection, and regulatory response. Highlights future wave applications in full workflow automation. Reinforces the growing potential of GenAI in high-risk, rules-based domains.
compliance, regulation, automation, fraud detection, GenAI, document drafting, monitoring
false
Regulatory and Compliance
Financial Services
Single Chart
Oliver Wyman
Add to my slides
Remove from favorites
The slide contains column chart, tables, and a bullet-pointed textual analysis. It uses shades of green for the bars and a mix of bold and standard text for emphasis.
Regulatory and Compliance
Financial Services
Displaying the escalating costs of compliance, the slide breaks down expenditures into regulatory project and routine compliance costs, alongside an analysis of historical spending trends.
Compliance, Regulatory, Cost, Analysis, Trend
false
Regulatory and Compliance
Financial Services
Mixed Chart
Morgan Stanley
Add to my slides
Remove from favorites
The slide features a mix of a large image on the left and column charts on the right. The charts show percentages of compliance budget allocations and anticipated changes over the next two years.
Regulatory and Compliance
Financial Services
The slide discusses the increased compliance budgets for hedge funds due to regulatory requirements, with detailed statistics on current budget allocations and future expectations.
compliance, regulatory, hedge funds, budget, chart
false
Regulatory and Compliance
Financial Services
Multiple Chart
EY
Add to my slides
Remove from favorites
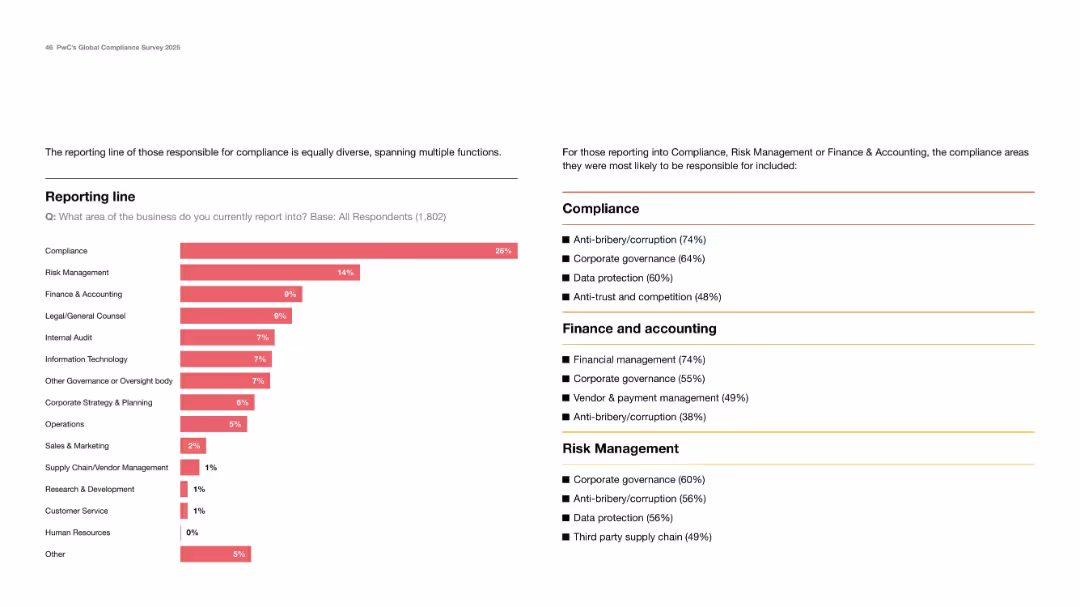
Left side has a horizontal bar chart with red bars and labeled percentages; right side has three text blocks under "Compliance", "Finance and Accounting", and "Risk Management" with bullet points.
Organizational Structure and Change
Professional Services
Highlights the diversity in compliance reporting lines across organizations. The bar chart displays departments respondents report to, while the text on the right shows compliance responsibilities based on department. It shows that Compliance, Risk Management, and Finance & Accounting handle various compliance-related functions.
compliance, reporting line, risk management, finance, responsibilities, departments, survey, corporate governance
false
Organizational Structure and Change
Professional Services
Mixed Chart
PwC/Strategy&
Add to my slides
Remove from favorites
A slide with four horizontal blocks labeled 'Reputational Risk', 'Insider Threat', 'Surveillance', and 'Conduct', each with an arrow pointing to a list of specific strategies or tools related to the block's topic.
Regulatory and Compliance
Financial Services
Outlines key focus areas in compliance, such as reputational risk frameworks, insider threat committees, surveillance tools, and conduct guidelines, emphasizing continuous improvement. Ideal for compliance training sessions.
Compliance, Reputational Risk, Insider Threat, Surveillance, Conduct
false
Regulatory and Compliance
Financial Services
Header Vertical
Goldman Sachs
Add to my slides
Remove from favorites
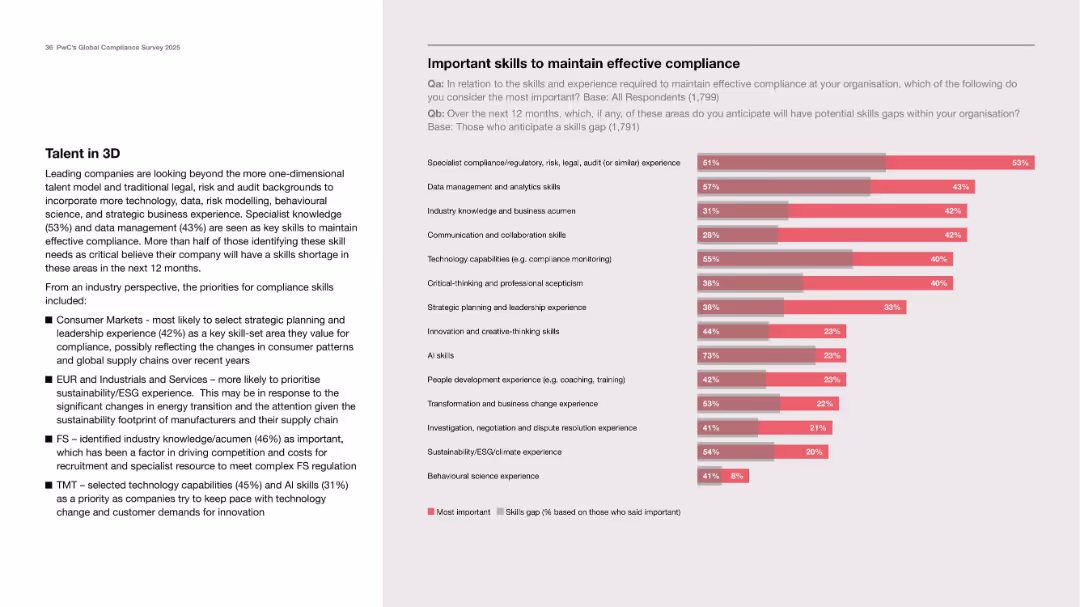
Two-column layout with text on left and double-bar chart comparing importance and skills gap on right.
Human Resources and Talent Management
Professional Services
Identifies key skills needed to maintain effective compliance, like tech, AI, and strategic thinking. Also highlights anticipated skill gaps in these areas, with visuals comparing importance versus availability. Emphasizes increasing demand for multidimensional compliance talent beyond legal or regulatory roles.
compliance skills, gap analysis, AI, technology, leadership
false
Human Resources and Talent Management
Professional Services
Mixed Chart
PwC/Strategy&
Add to my slides
Remove from favorites
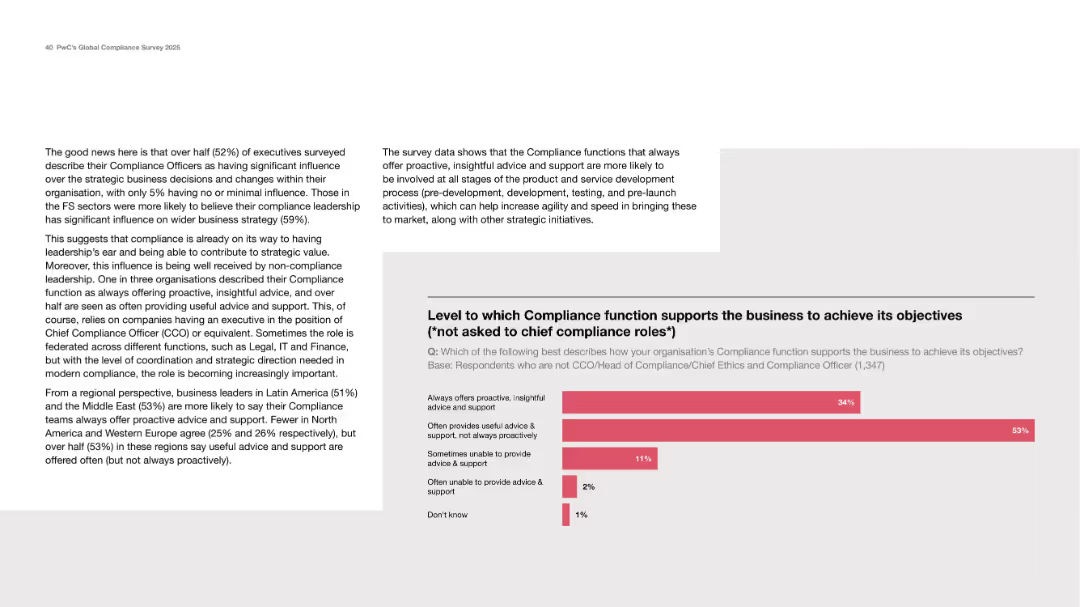
Left column with contextual analysis and right column featuring a simple horizontal bar chart on function support.
Strategic Planning
Professional Services
Illustrates how compliance functions contribute to business goals. Most respondents say compliance provides proactive or useful support. The slide emphasizes the increasing strategic influence of compliance in business planning, particularly when compliance officers have direct leadership involvement.
compliance support, strategic planning, leadership, business value
false
Strategic Planning
Professional Services
Mixed Chart
PwC/Strategy&
Add to my slides
Remove from favorites
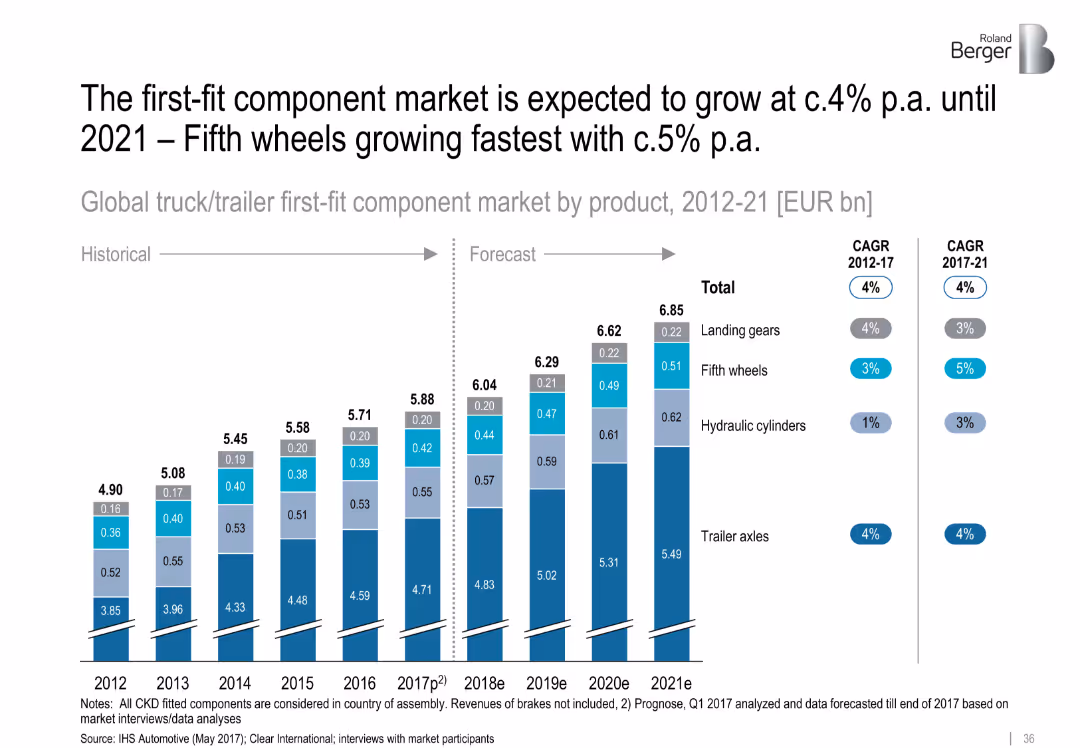
Vertical stacked bar chart showing market size split by component (2012–2021e); trend line and CAGR callouts
Market Analysis and Trends
Transportation & Logistics
Highlights growth trends in trailer component market segments. Fifth wheels are projected to grow fastest (~5% CAGR), while overall market grows ~4% annually. Trailer axles remain the largest segment by value.
component growth, fifth wheels, hydraulic cylinders, trailer axles, CAGR, forecast, trailer market
false
Market Analysis and Trends
Transportation & Logistics
Single Chart
Roland Berger
Add to my slides
Remove from favorites
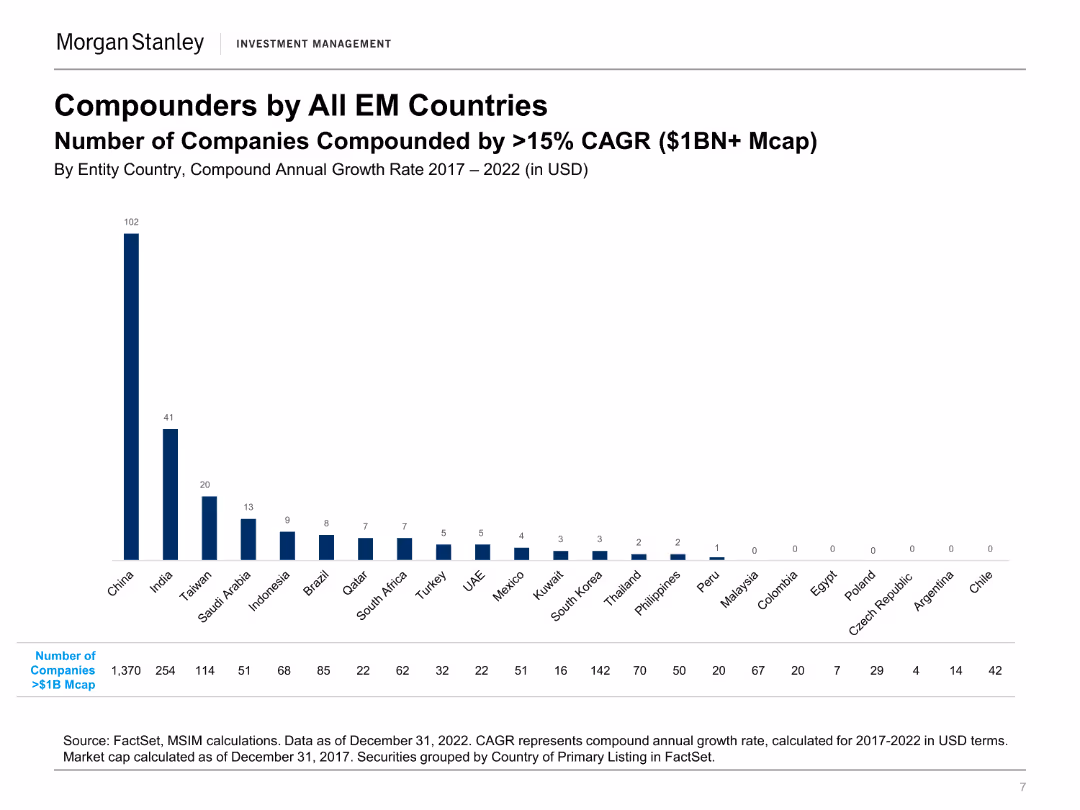
A column chart showing the number of companies with >15% CAGR from emerging markets. The design is straightforward and data-focused.
Market Analysis and Trends
Financial Services
This slide highlights the number of companies in emerging markets with significant growth rates, helping investors identify high-growth regions within emerging markets.
compounders, emerging markets, CAGR, high-growth, investment
false
Market Analysis and Trends
Financial Services
Single Chart
Morgan Stanley
Add to my slides
Remove from favorites
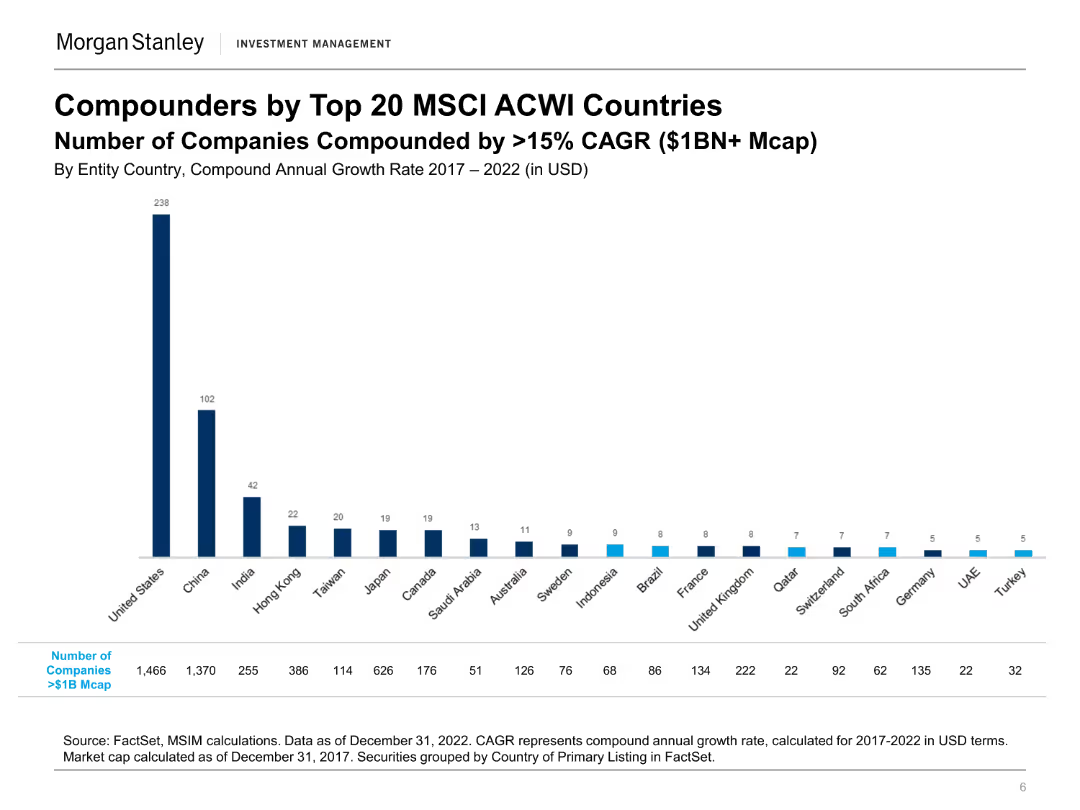
A column chart showing the number of companies with >15% CAGR from top 20 MSCI ACWI countries. The layout is simple and focuses on data presentation.
Market Analysis and Trends
Financial Services
This slide showcases the number of companies achieving significant annual growth rates across top global markets, useful for identifying leading investment regions.
compounders, MSCI ACWI, CAGR, global markets, investment
false
Market Analysis and Trends
Financial Services
Single Chart
Morgan Stanley
Add to my slides
Remove from favorites
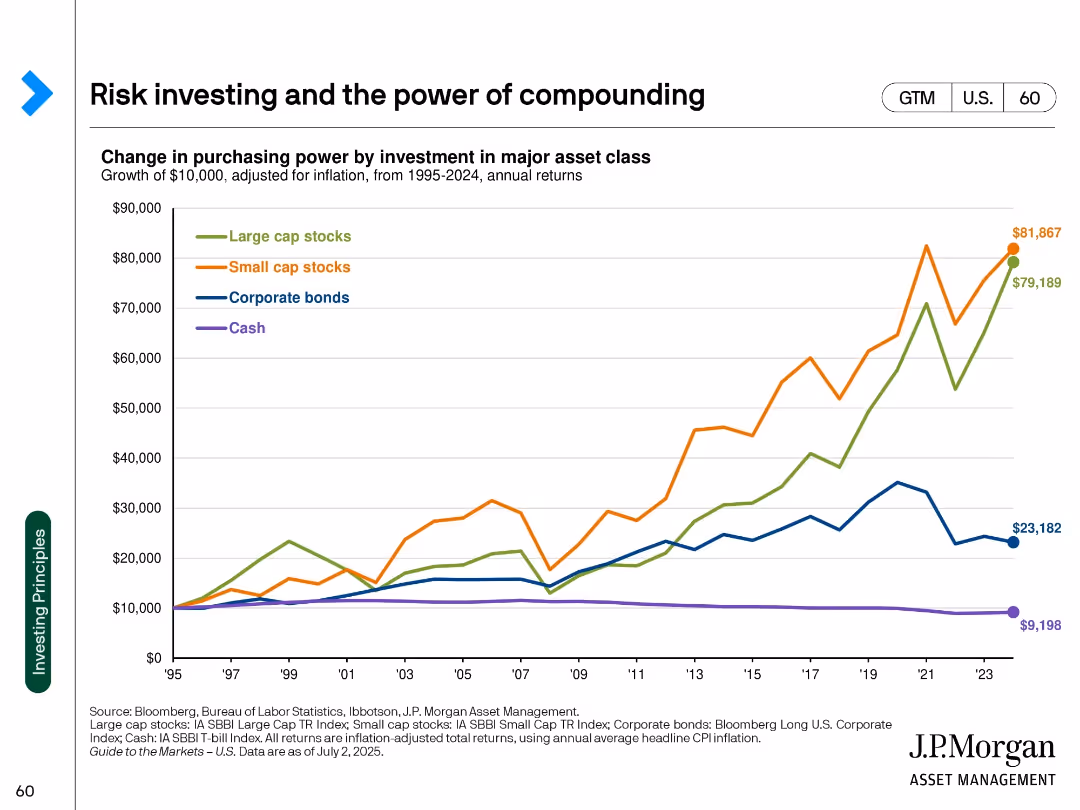
Line chart with multiple colored lines; long-term trend of asset classes' value growth
Strategic Planning
Financial Services
Compares inflation-adjusted growth of $10,000 in various asset classes (large cap stocks, small caps, bonds, cash) from 1995–2024. Highlights compounding benefits over time.
compounding, inflation, purchasing power, long-term investing, asset classes, small cap, large cap, bonds, cash, total return
false
Strategic Planning
Financial Services
Single Chart
JP Morgan
Add to my slides
Remove from favorites
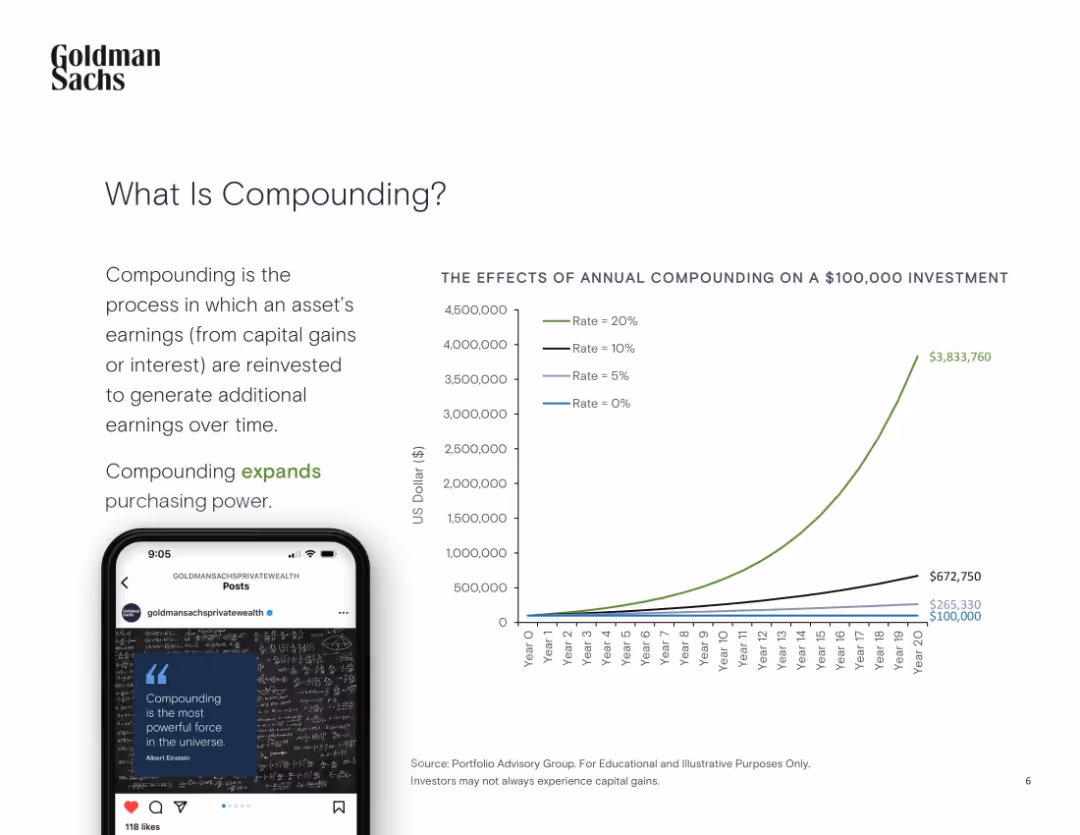
Left-aligned explanation with graph and a smartphone illustration
Organizational Structure and Change
Financial Services
The slide defines compounding and illustrates its exponential effect on investment growth through different annual return scenarios on a $100,000 investment.
Compounding, Investment, Growth, Earnings, Interest, Power
false
Organizational Structure and Change
Financial Services
Mixed Chart
Goldman Sachs
Add to my slides
Remove from favorites
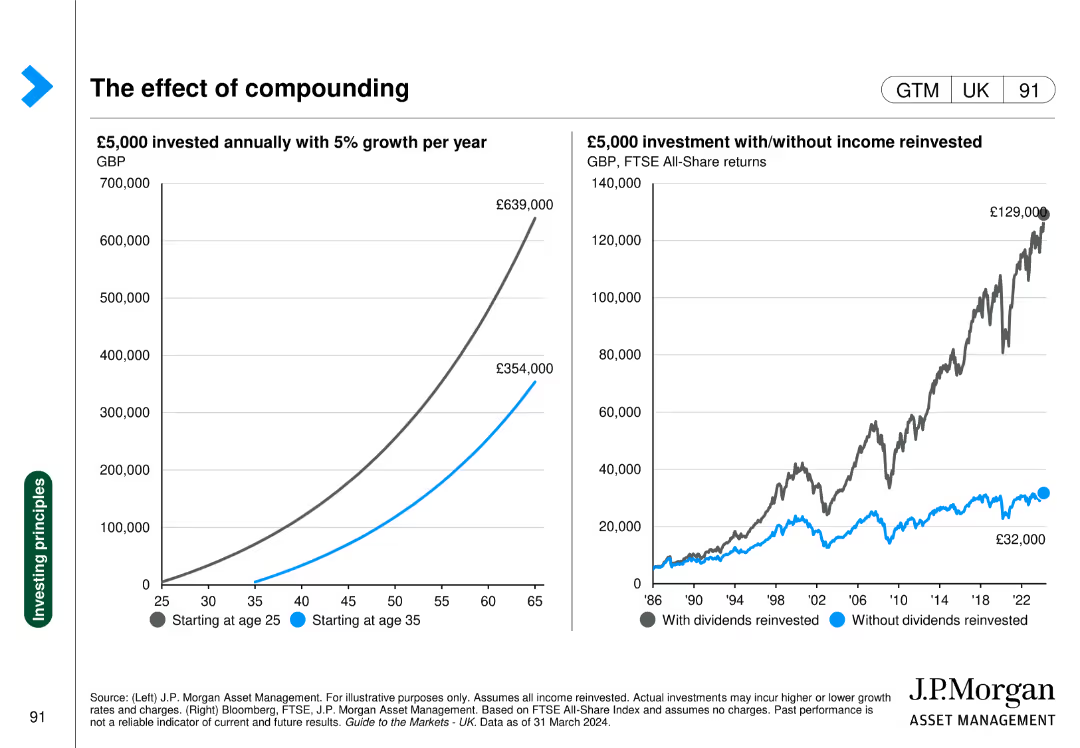
Two charts: a line chart showing investment growth over time and a bar chart comparing returns with/without reinvestment.
Investment Analysis
Financial Services
Illustrates the impact of starting investments early and the benefit of reinvesting income on total returns.
Compounding, investment, growth, reinvestment, returns
false
Investment Analysis
Financial Services
Multiple Chart
JP Morgan
Add to my slides
Remove from favorites
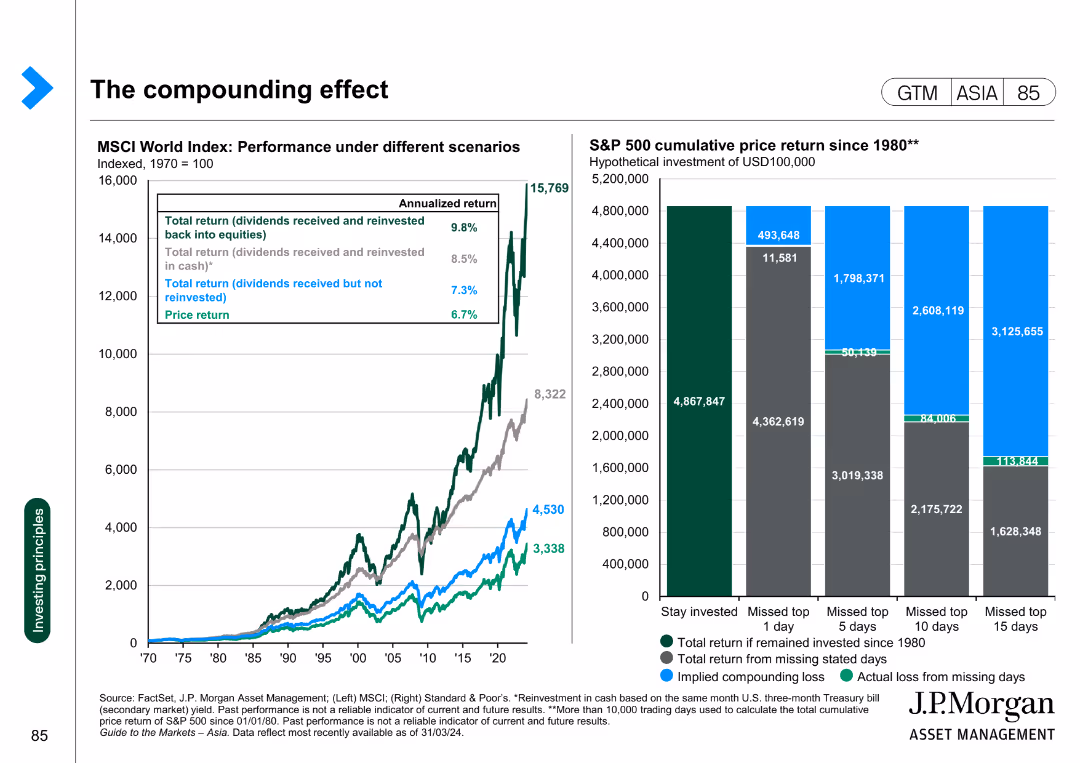
Line chart of MSCI World Index performance under different scenarios and a column chart of S&P 500 cumulative price returns since 1980.
Investment Analysis
Financial Services
This slide demonstrates the impact of compounding on investments, comparing MSCI World Index performance and S&P 500 cumulative returns under different scenarios and missed days.
compounding, MSCI, S&P 500, returns, scenarios
false
Investment Analysis
Financial Services
Multiple Chart
JP Morgan
Add to my slides
Remove from favorites
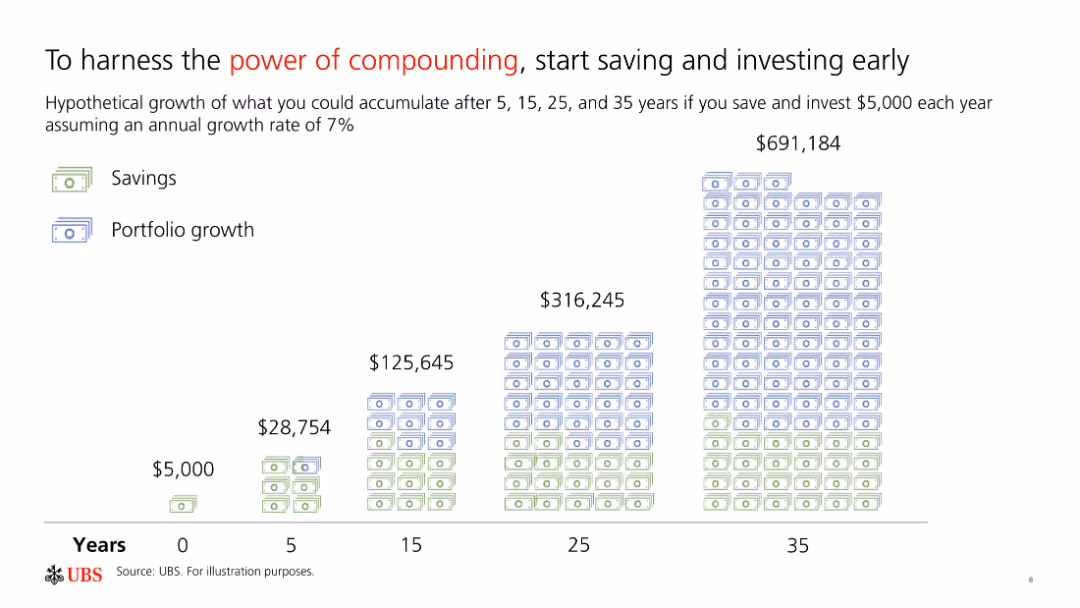
The slide features a column chart showing the hypothetical growth of savings and portfolio over 5, 15, 25, and 35 years with a 7% annual growth rate.
Investment Analysis
Financial Services
The slide explains the benefits of compounding interest over time, illustrating the significant growth potential of early and consistent investment.
Compounding, Savings, Investment, Growth, Interest
false
Investment Analysis
Financial Services
Single Chart
UBS
Add to my slides
Remove from favorites
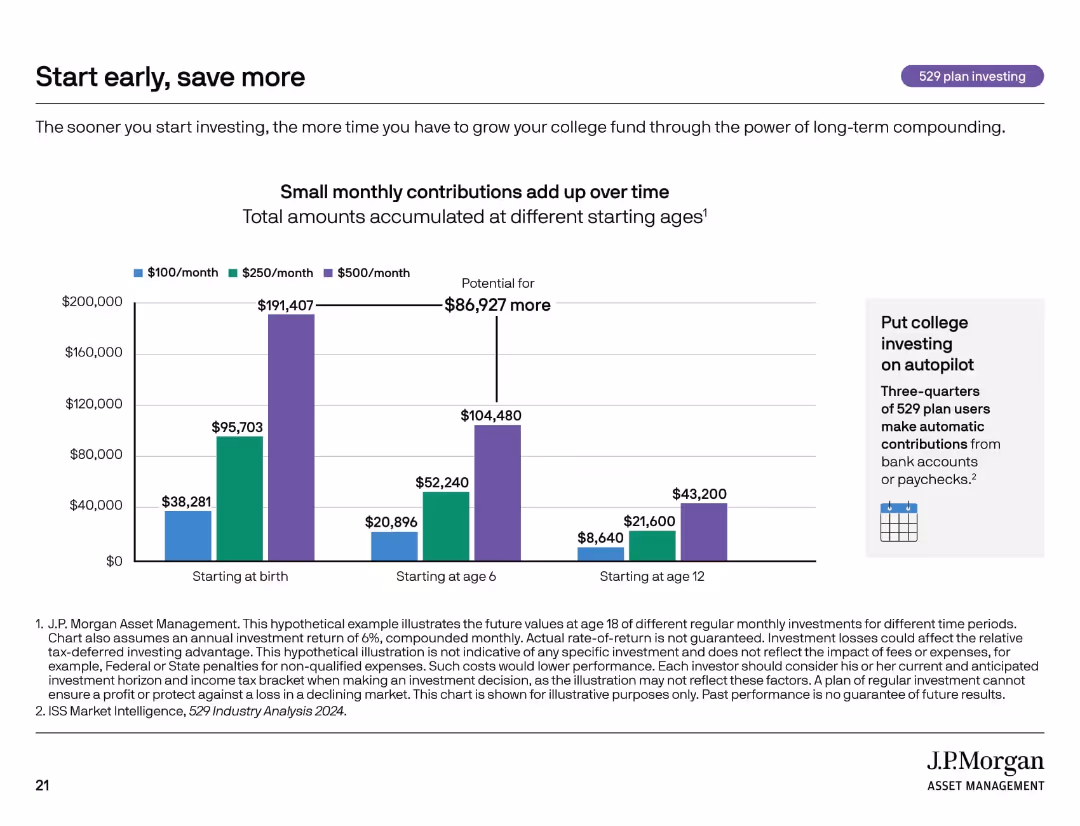
Bar chart grouped by monthly contribution and starting age; note and tip on compounding power at right.
Strategic Planning
Financial Services
The slide illustrates the impact of early and consistent investing for college savings. It shows how starting at birth versus later ages significantly increases total accumulated value, even with modest monthly contributions, due to compounding. Encourages automated contributions to 529 plans.
compound interest, early saving, 529 plans, college fund, long-term
false
Strategic Planning
Financial Services
Mixed Chart
JP Morgan
Add to my slides
Remove from favorites
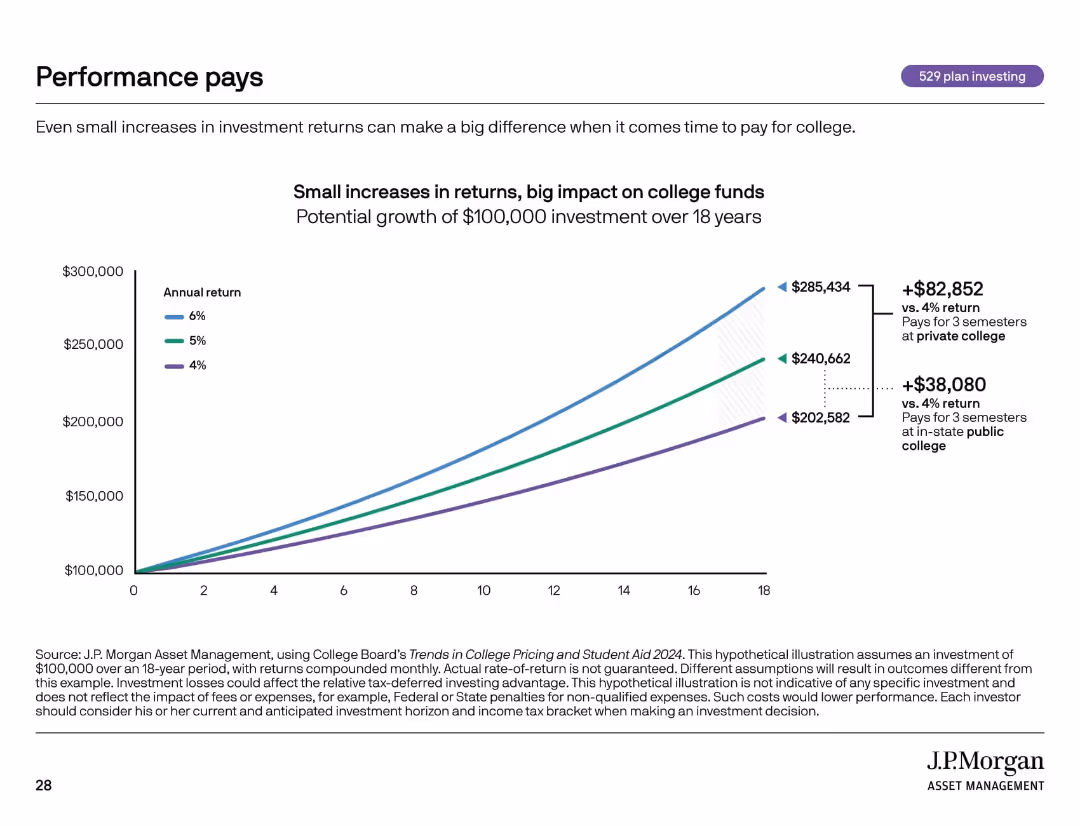
Line graph visual with growth projections for different return rates over time. Clean, minimal design.
Investment Analysis
Financial Services
Shows how small differences in annual return rates (4%, 5%, 6%) significantly affect the total value of a $100,000 college fund over 18 years. Demonstrates the power of compounding and return performance in long-term investing.
compound interest, investment returns, college savings, 529 plan, ROI
false
Investment Analysis
Financial Services
Single Chart
JP Morgan
Add to my slides
Remove from favorites
Highlights types of computing hardware optimized for different ML tasks, like GPUs and TPUs.
Technology and Digital Transformation
Technology & Software
Focuses on hardware solutions for software interconnection and workload optimization in the ML process.
Computing hardware, GPUs, TPUs, NPUs, ML optimization
false
Technology and Digital Transformation
Technology & Software
Header Horizontal
McKinsey
Add to my slides
Remove from favorites
The slide contains a column chart illustrating concentration levels across different access modes. Bars are vertically oriented and labeled as Direct, Search, Apple News, Google News, Facebook, Twitter, and All.
Market Analysis and Trends
Media & Entertainment
This slide analyzes concentration levels across various access modes excluding subsequent visits. It helps understand how different sources contribute to concentration levels.
concentration, access modes, column chart, media, analysis
false
Market Analysis and Trends
Media & Entertainment
Single Chart
IPSOS
Add to my slides
Remove from favorites
The slide includes a column chart illustrating concentration levels across different access modes, similar to slide 8201 but under a different approach. Bars are vertically oriented and labeled accordingly.
Market Analysis and Trends
Media & Entertainment
This slide presents an alternative analysis of concentration levels across various access modes, treating all subsequent visits as direct.
concentration, direct visits, column chart, media, alternative analysis
false
Market Analysis and Trends
Media & Entertainment
Single Chart
IPSOS
Add to my slides
Remove from favorites
Scatter plot showing correlation between perceived need for action and climate concern; diagonal trend line included; title on left.
Market Analysis and Trends
Environmental Services & Sustainability
Illustrates a strong correlation between levels of concern about climate change and belief that governments should act more. Countries are plotted by % agreement on both axes, showing regional clustering and sentiment trends.
concern correlation, government action, public sentiment, Ipsos, scatter plot, cross-country analysis, perception alignment
false
Market Analysis and Trends
Environmental Services & Sustainability
Mixed Chart
IPSOS
Add to my slides
Remove from favorites
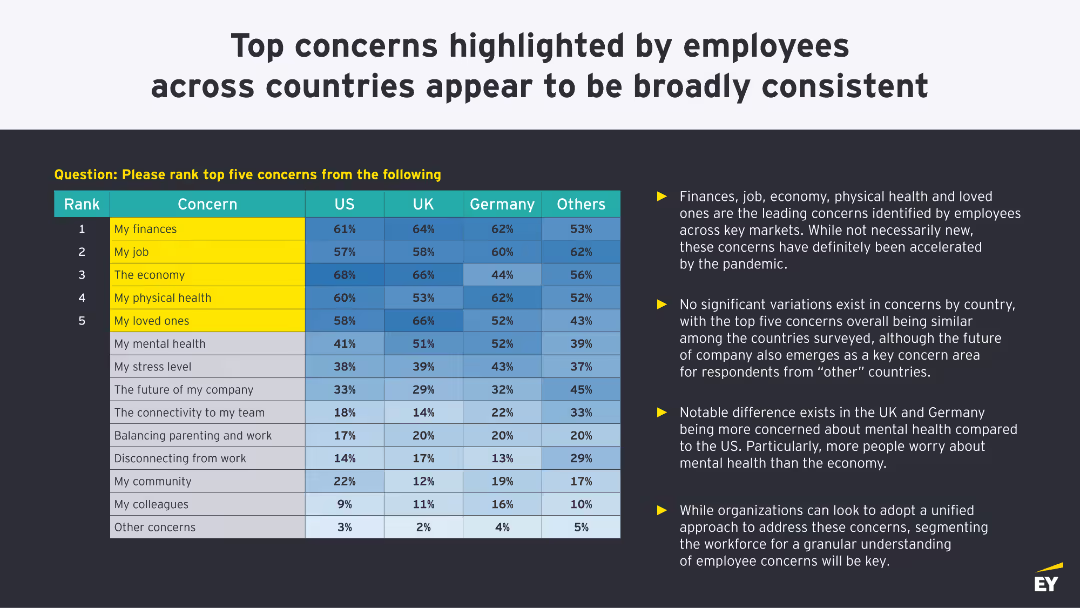
This slide displays a table with a ranking of employee concerns across different countries, accompanied by bullet points summarizing key findings.
Risk Assessment and Management
Professional Services
The slide outlines the top concerns of employees across various countries, emphasizing how these concerns have been influenced by the pandemic, and noting similarities and differences by country.
concerns, employees, countries, pandemic, key findings
false
Risk Assessment and Management
Professional Services
Table
EY
Add to my slides
Remove from favorites
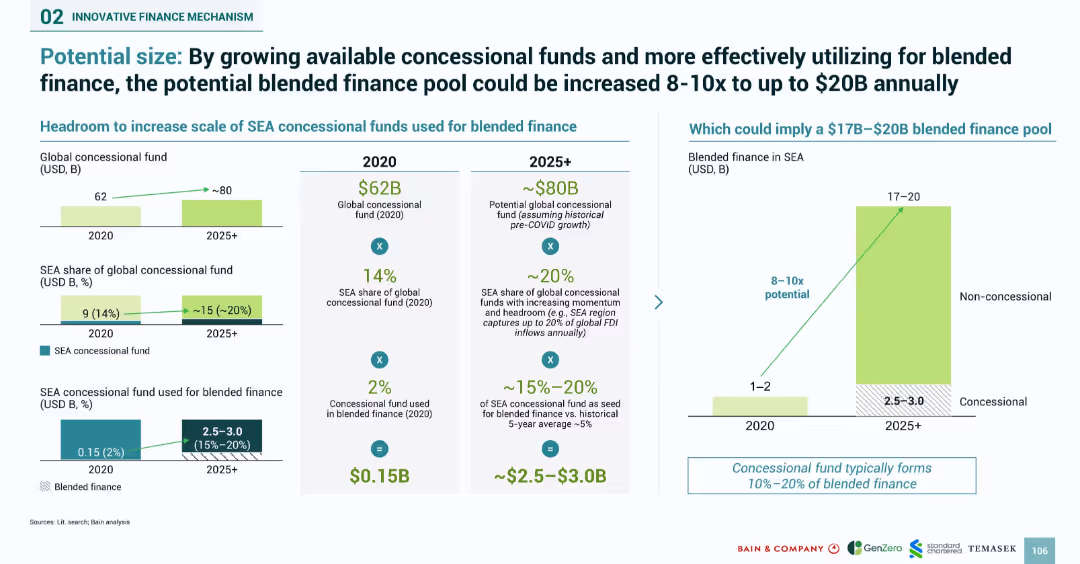
Infographic with bar charts and equations showing potential scale-up of concessional funds in SEA. Highlights 8–10x increase opportunity for blended finance.
Investment Analysis
Financial Services
Illustrates the opportunity to scale SEA concessional funds for blended finance from $0.15B in 2020 to potentially $2.5–$3B post-2025, implying a $17B–$20B blended finance pool. Uses projections based on increased SEA share of global concessional funds. Shows visual relationships between concessional and non-concessional finance pools.
concessional funds, blended finance, SEA, investment scale, projections, financial mechanisms, global fund share
false
Investment Analysis
Financial Services
Multiple Chart
Bain
Add to my slides
Remove from favorites
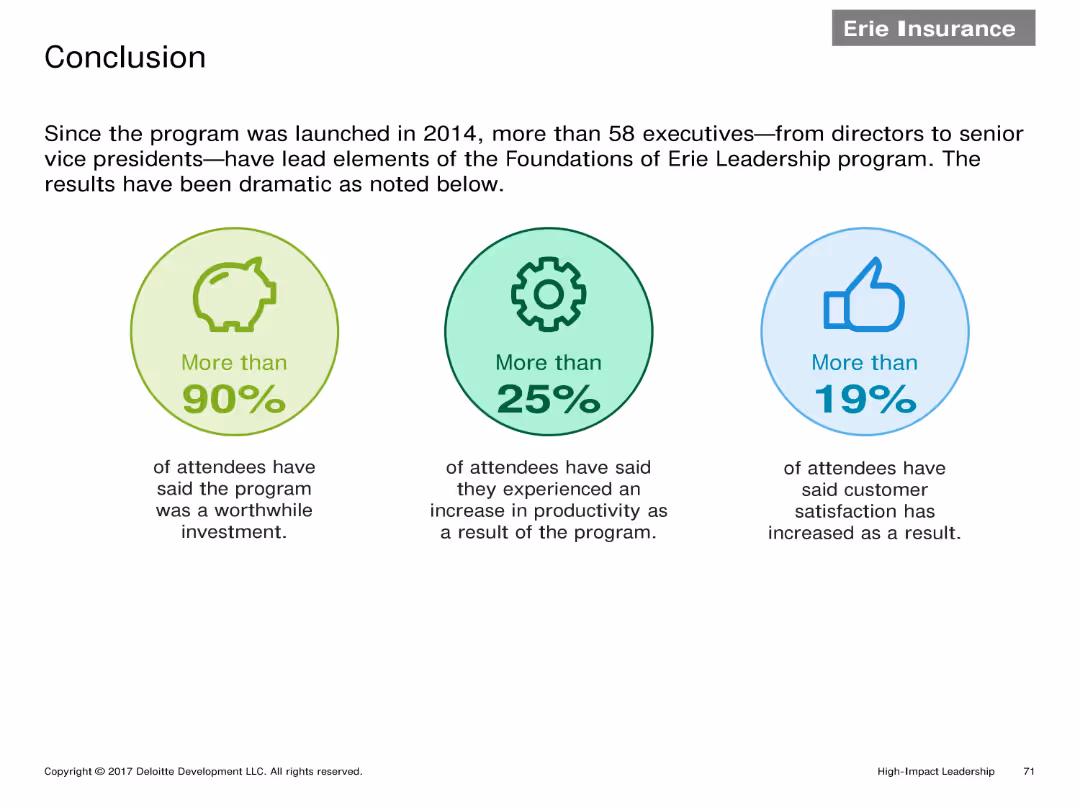
Three infographic elements highlighting key statistics: More than 90% found the program worthwhile, More than 25% saw productivity increase, More than 19% saw customer satisfaction improvement.
Client Case Studies
Financial Services
Summarizes the impact of the Erie Leadership program with key statistics showing high satisfaction rates, increased productivity, and improved customer satisfaction among participants.
Conclusion, statistics, leadership program, satisfaction, productivity
false
Client Case Studies
Financial Services
Pillar
Deloitte
Add to my slides
Remove from favorites
The slide features a table summarizing various conditioning and pretreatment technologies and their compatibility with different types of feedstocks. Each technology is listed with symbols indicating detailed, applicable, or optimal conditions.
Technology and Digital Transformation
Energy & Utilities
This slide provides a detailed comparison of conditioning and pretreatment technologies, illustrating their compatibility with various biomass feedstocks, aimed at enhancing conversion efficiency.
conditioning, pretreatment, feedstock compatibility, technologies, biomass, conversion efficiency, detailed comparison
false
Technology and Digital Transformation
Energy & Utilities
Table
Kearney
Add to my slides
Remove from favorites
The slide features a column chart comparing condo rental transactions by quarter for the years 2019 and 2020.
Market Analysis and Trends
Real Estate & Construction
This slide shows the quarterly condo rental transactions for 2019 and 2020, highlighting changes in the rental market.
condo rentals, transactions, quarterly comparison, rental market, column chart
false
Market Analysis and Trends
Real Estate & Construction
Single Chart
IPSOS
Add to my slides
Remove from favorites
The slide features a line chart showing the average rents for one-bedroom and two-bedroom condos from 2015 to 2020.
Market Analysis and Trends
Real Estate & Construction
This slide presents data on the average rent prices for one-bedroom and two-bedroom condos over six years, showing a dip in 2020.
condo rents, market trends, average rent, historical data, line chart, rental prices
false
Market Analysis and Trends
Real Estate & Construction
Single Chart
IPSOS
Add to my slides
Remove from favorites
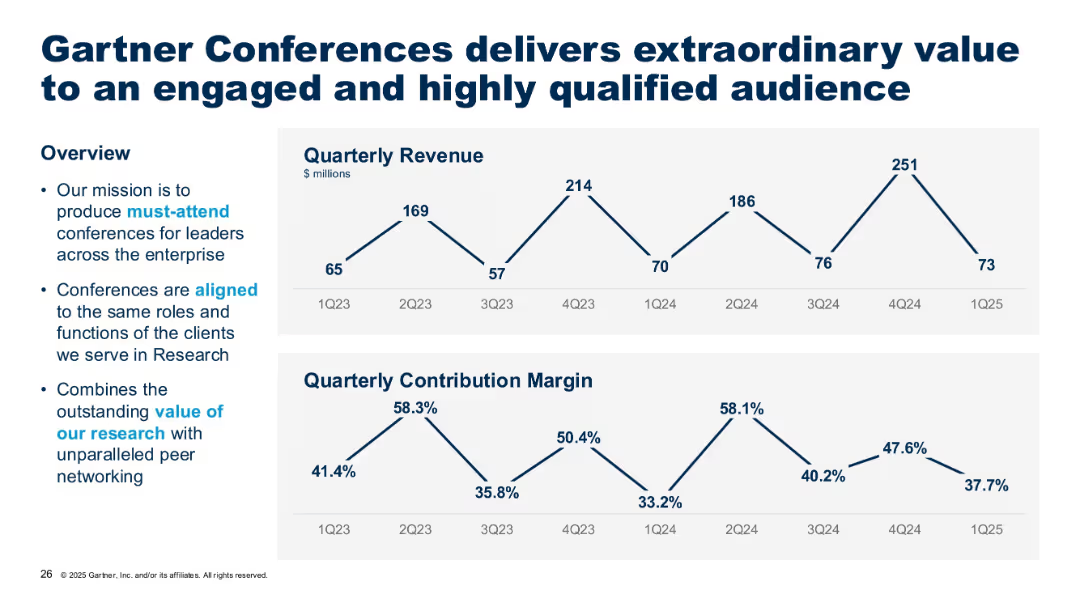
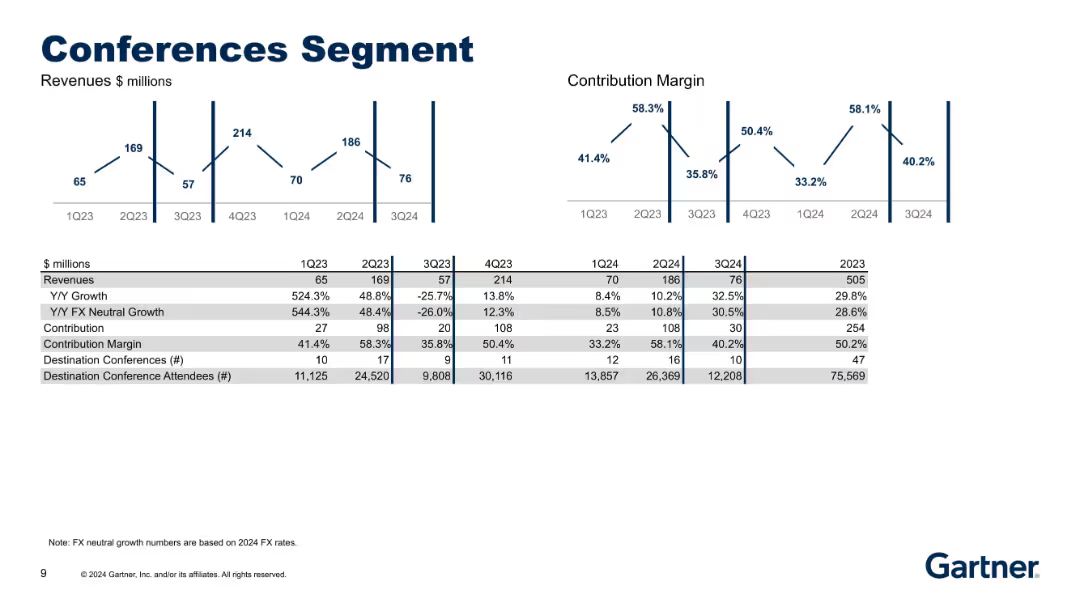
Line graphs of quarterly revenue and contribution margin; left section contains descriptive bullet points.
Product and Service Analysis
Technology & Software
This slide focuses on Gartner's conference business, showing fluctuating quarterly revenue and margins. It emphasizes how conferences align with client roles and add value through peer networking and research-based content.
conferences, Gartner, audience, networking, revenue, quarterly metrics
false
Product and Service Analysis
Technology & Software
Multiple Chart
Gartner
Add to my slides
Remove from favorites
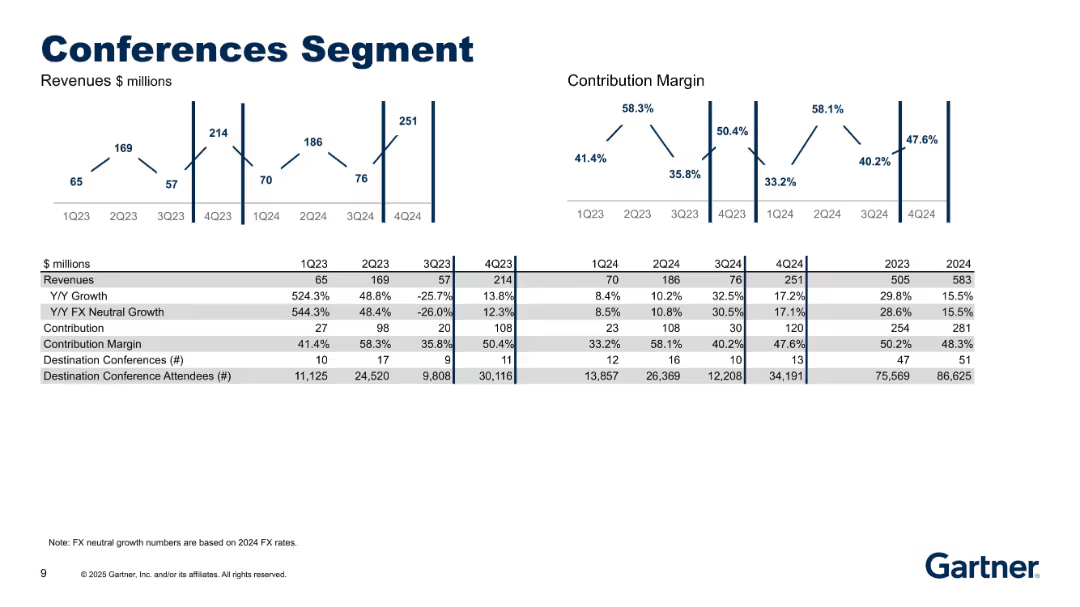
Updated version of 18623, includes 1Q24–3Q24 with revenue and margin charts and revised attendee and event data.
Product and Service Analysis
Technology & Software
Offers latest updates on the Conferences segment including revenue, margin, and key operating statistics. Illustrates growth in destination events and attendees, tracking effectiveness of the event strategy.
conferences, growth, margin, events, attendees, revenue update
false
Product and Service Analysis
Technology & Software
Multiple Chart
Gartner
Add to my slides
Remove from favorites
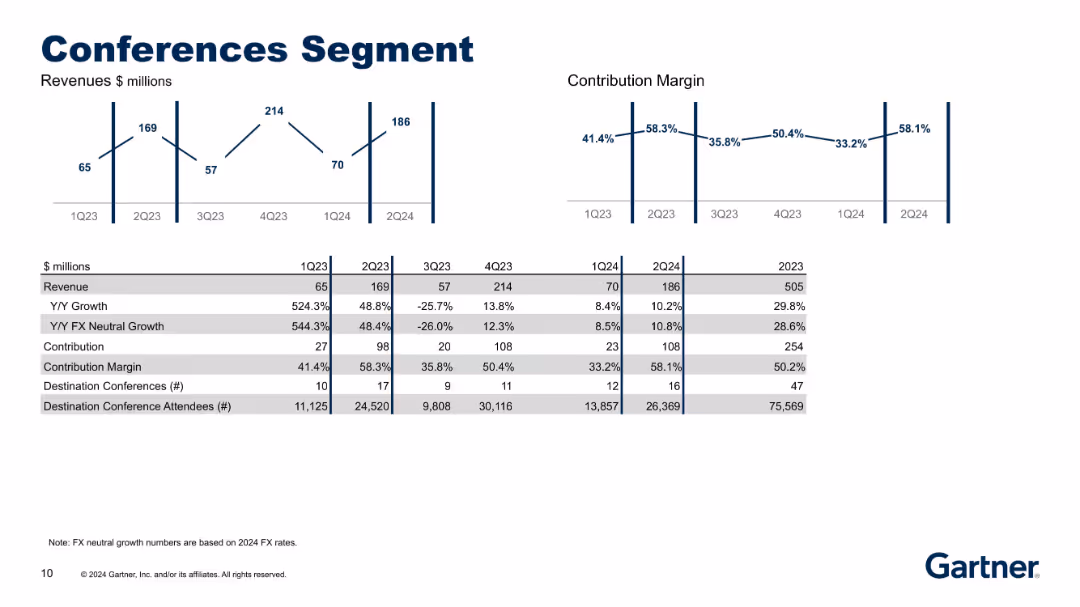
Visuals and data tables focused on revenues, growth, and margins, with data on the number of events and attendees for each quarter.
Performance Metrics and KPIs
Professional Services
Offers 1Q23–2Q24 view of the Conferences segment. Reflects improving margins, fluctuating revenues, and consistent attendee participation. Demonstrates performance sensitivity to scheduling and seasonality in conference delivery.
Conferences, Revenue, Attendees, Contribution Margin, Growth
false
Performance Metrics and KPIs
Professional Services
Multiple Chart
Gartner
Add to my slides
Remove from favorites
Similar format as previous slide; charts for revenues and margins; data table includes attendees and events.
Performance Metrics and KPIs
Technology & Software
This slide presents detailed performance metrics for Gartner’s Conferences segment, highlighting revenue trends, growth in events and attendance, and contribution margins. It reflects recovery and growth from past volatility.
conferences, revenue, attendees, events, contribution margin, growth, FX neutral, KPIs, Gartner
false
Performance Metrics and KPIs
Technology & Software
Multiple Chart
Gartner
Add to my slides
Remove from favorites
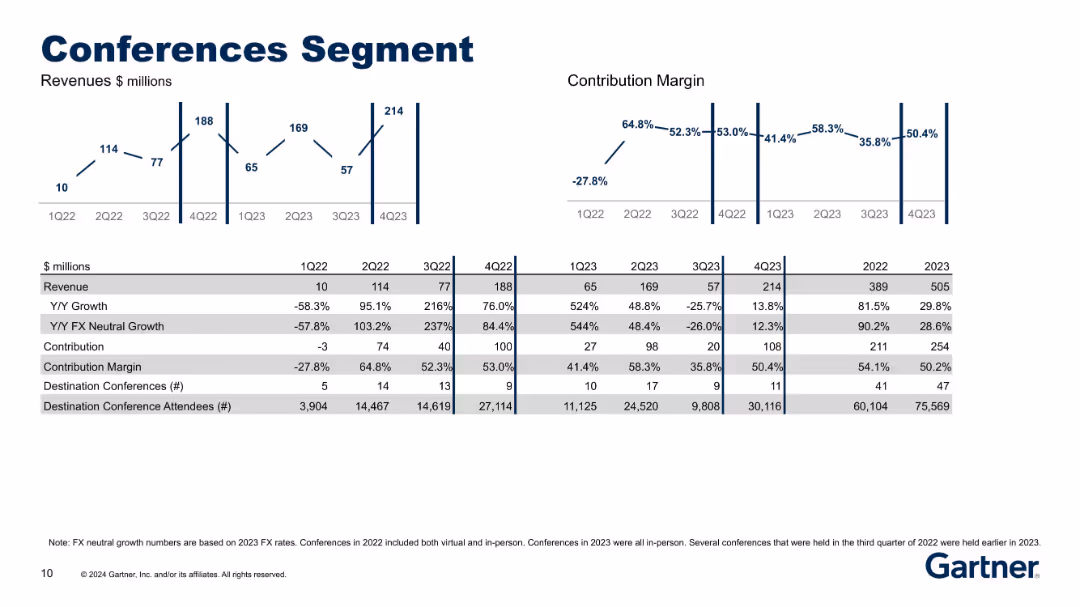
Dual-column format with bar and line graphs above and detailed tables below. Charts show revenues and margins over time.
Performance Metrics and KPIs
Professional Services
This slide outlines the performance of the Conferences segment, emphasizing revenue, growth rates, and contribution margins. It includes conference count and attendee statistics, showing volatile but seasonally driven performance across 2022 and 2023.
Conferences, Revenue, Attendees, Growth, Contribution Margin
false
Performance Metrics and KPIs
Professional Services
Multiple Chart
Gartner
Add to my slides
Remove from favorites
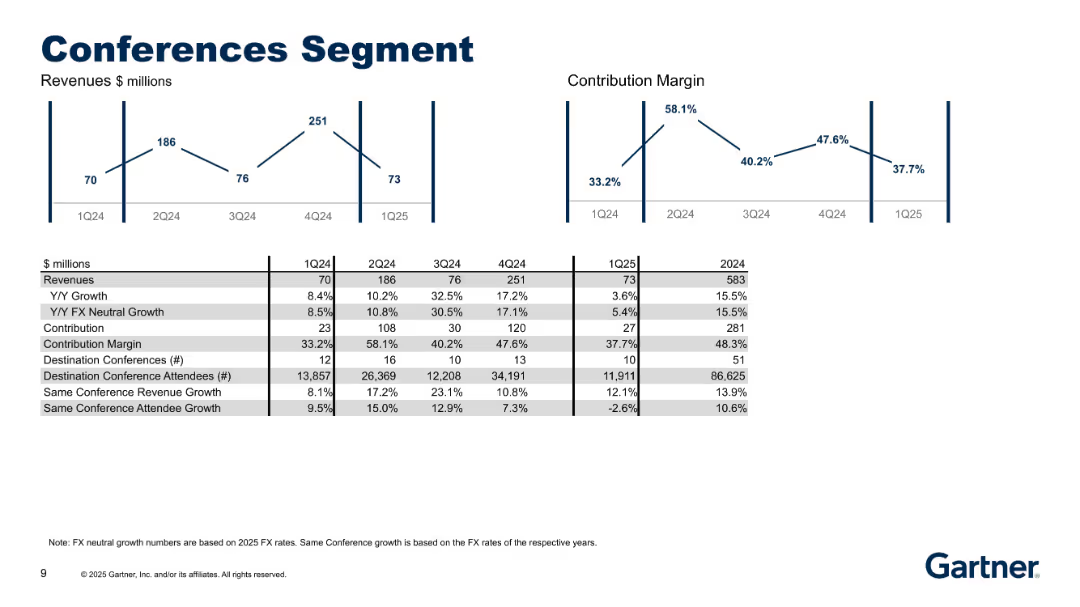
Dual charts above a data table: one for revenues and one for contribution margin. Includes conference counts and attendance. Structured layout with strong verticals.
Product and Service Analysis
Technology & Software
Highlights revenue and margin fluctuations in Gartner’s Conferences segment. Includes key metrics such as number of events, attendees, and their contribution to financial performance. Focuses on seasonality and operational efficiency.
conferences, revenue, contribution margin, attendees, event growth
false
Product and Service Analysis
Technology & Software
Multiple Chart
Gartner
Add to my slides
Remove from favorites
The slide includes a table with financial data and two line charts showing revenue and contribution margin trends for the conferences segment.
Market Analysis and Trends
Professional Services
It covers the financial performance of the conferences segment, including revenue growth, contribution margins, and the number of conferences and attendees.
Conferences, Revenue, Growth, Contribution Margin, Attendees, Segment Performance
false
Market Analysis and Trends
Professional Services
Multiple Chart
Gartner
Add to my slides
Remove from favorites
The slide features a column chart showing quarterly revenue and contribution margin along with text summarizing the mission and value of conferences.
Performance Metrics and KPIs
Professional Services
It highlights the value and engagement of conferences, showing revenue and margin trends, and aligns the content to the roles and functions served.
Conferences, value, audience, revenue, margin, engagement, mission, professional, performance, trends
false
Performance Metrics and KPIs
Professional Services
Multiple Chart
Gartner
Add to my slides
Remove from favorites
This slide utilizes a combination of horizontal bar charts to show confidence levels in the ability to buy and sell various assets, including crypto assets, in the future, with detailed percentages.
Market Analysis and Trends
Financial Services
It explores the confidence of Canadians in their ability to buy and sell different types of assets, such as the US dollar, Canadian dollar, mutual funds, and crypto assets, with detailed confidence levels.
confidence, buy/sell, future, assets, percentages
false
Market Analysis and Trends
Financial Services
Mixed Chart
IPSOS
Add to my slides
Remove from favorites
The slide features a pie chart and column charts, presenting confidence levels in industry utility models by overall, industry, and geography.
Strategic Planning
Professional Services
It examines confidence levels in community and utility models for external assistance, comparing current confidence with past survey results and across different segments.
confidence levels, utility models, community models, pie chart, column charts, professional services
false
Strategic Planning
Professional Services
Multiple Chart
Deloitte
Add to my slides
Remove from favorites
The slide contains a bar chart showing the percentage of respondents confident in their company's revenue growth prospects across various regions, with notable increases in North America and Latin America.
Market Analysis and Trends
Financial Services
This slide presents data on the short-term confidence of CEOs in different regions, showing significant increases in confidence in North America and Latin America regarding their company's revenue growth prospects over the next 12 months.
Confidence, revenue growth, North America, Latin America, financial services, market analysis
false
Market Analysis and Trends
Financial Services
Multiple Chart
PwC/Strategy&
Add to my slides
Remove from favorites
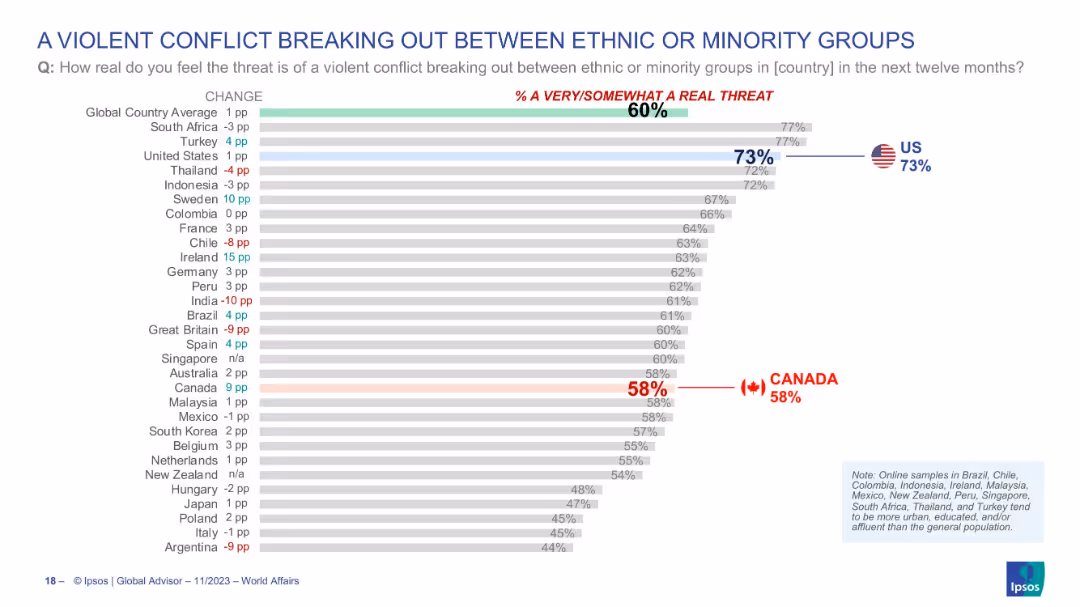
Bar graph with horizontal bars ranked by country; change in percentage shown on the left, and threat perception on the right; Canada and the US highlighted with flag icons and bold figures; note in bottom-right corner.
Risk Assessment and Management
Government & Public Sector
This slide shows global perceptions of the likelihood of a violent conflict breaking out between ethnic or minority groups within the next twelve months. It ranks countries by the percentage of respondents who perceive the threat as real (very/somewhat), with the US at 73% and Canada at 58%, compared to a 60% global average.
conflict, ethnic tension, public opinion, threat perception, Canada, USA, Ipsos, survey, risk, violence
false
Risk Assessment and Management
Government & Public Sector
Single Chart
IPSOS
Add to my slides
Remove from favorites
Previous
Next
You don't have any favorites yet.
Please wait loading your favorites slides...
Create a FREE account to continue browsing
Receive Instant Access to 1,000+ slides from companies like McKinsey, Google, and Goldman Sachs
First Name
Last Name
Email
Password
I agree to all
Terms & Privacy Policy
Thank you! Your submission has been received!
Oops! Something went wrong while submitting the form.
Have an account?
Sign in
Upgrade to PRO to Save slides
Advanced Search and Filters
Access to 15,000+ slides
Access to Category Pages
Save/Bookmark Slides
PowerPoint Template Library
Pick a Plan
MONTHLY
$12/month
Billed every month, Cancel anytime.
YEARLY
$9/year
Billed $108 annually, Cancel anytime.
Checkout for $12/month
Checkout for $108/yr
Secured by Stripe | AES-256 bit encryption


![[COUNTRY] should do more... vs concern for climate change](https://cdn.prod.website-files.com/654e70fb59937215cac87b19/6899c23ad1da0f1e90aaf6ec_aa4TlbmZLk98NVvvY12RBKCvemwLbWCLgzKxmVFazTw.avif)