My Account
My Slides
Search by Category
Companies
Slide Type
Use Case
Industry
Pricing
Templates
View All Templates
Download Template Slides
✦ AI
AI Prompt Library
AI Search
Feedback
Login
Logout
Get Started
Browse all Slides
Browse all Slides
Create a FREE Account
Instant access to 1,000+ real slides from top companies like McKinsey, BCG, Goldman Sachs, Google and many more!
First Name
Last Name
Email
Password
I agree to all
Terms & Privacy Policy
Thank you! Your submission has been received!
Oops! Something went wrong while submitting the form.
Have an account?
Sign in
Saved Slides
Total No. of slides saved
0
↻ Refresh
✖ Clear all
Line graph showing real consumer spending trends for different major economies
Market Analysis and Trends
Financial Services
The slide presents trends in real consumer spending, comparing major economies, with a focus on the impact of reopening in China.
consumer spending, trends, major economies, China, reopening
false
Market Analysis and Trends
Financial Services
Single Chart
Accenture
Add to my slides
Remove from favorites
The slide features a table comparing consumer spending trends in goods and services across the US, UK, Germany, and France. Categories include groceries, motor vehicles, and fuel among others. Color-coded cells indicate changes.
Market Analysis and Trends
Consumer Goods
This slide shows consumer spending trends by goods and services in the US and Europe, emphasizing a shift towards services with notable rebounds in car sales. The table format helps compare changes across countries over the last six months and the latest monthly changes.
consumer spending, US, Europe, trends, goods, services
false
Market Analysis and Trends
Consumer Goods
Multiple Chart
Accenture
Add to my slides
Remove from favorites
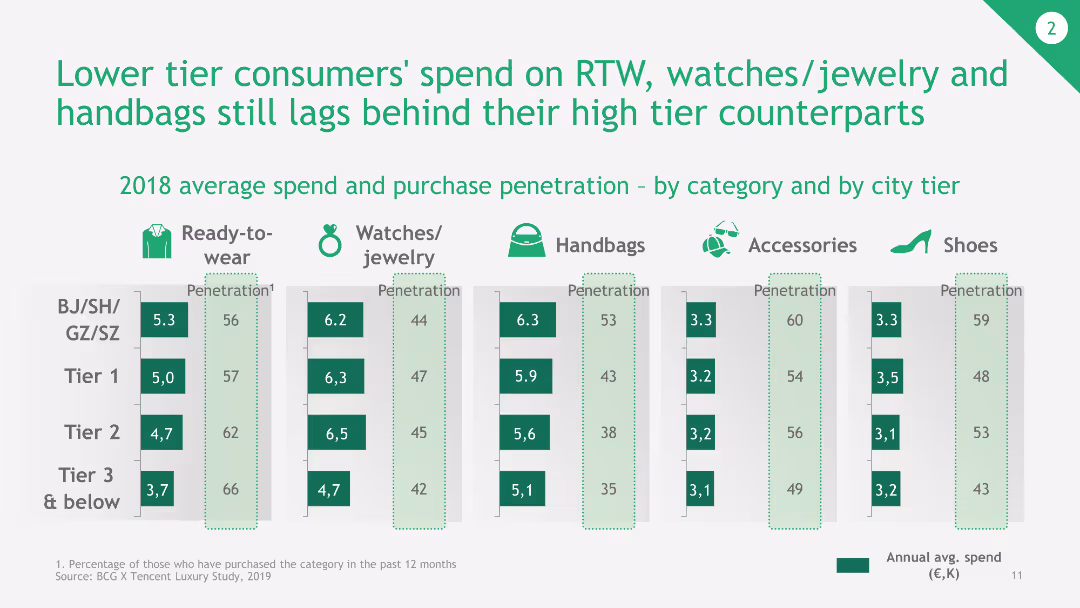
The slide features a column chart comparing the average spend and purchase penetration of various product categories by city tier. The bars are color-coded and labeled for clarity.
Market Analysis and Trends
Consumer Goods
This slide presents data from a 2018 study, showing the average spend and purchase penetration of ready-to-wear, watches/jewelry, handbags, accessories, and shoes by city tier.
consumer spend, purchase penetration, city tier, average spend, luxury market
false
Market Analysis and Trends
Consumer Goods
Multiple Chart
BCG
Add to my slides
Remove from favorites
Column chart showing the percentage of consumers who research content online before watching, across OTT, movie studios, and LTV.
Customer and Market Segmentation
Media & Entertainment
This slide presents data on consumer behavior, indicating that over 60% of consumers research content online before deciding to watch, with digital touchpoints.
consumers, research, content, digital, touchpoints
false
Customer and Market Segmentation
Media & Entertainment
Mixed Chart
BCG
Add to my slides
Remove from favorites
The slide contains a series of donut charts illustrating consumer uptake of technology, specifically EV adoption and heat pump adoption (% of sales) from 2025 to 2050 across different regions (Global, Europe, US, China). Each chart shows adoption rates at different time intervals.
Market Analysis and Trends
Energy & Utilities
This slide highlights the projected consumer adoption rates of electric vehicles (EVs) and heat pumps across different regions by 2050. It shows significant growth trends, driven by technological advancements and government mandates to reduce emissions and increase energy efficiency.
Consumers, Technology, Adoption, EV, Heat Pump, 2050, Growth
false
Market Analysis and Trends
Energy & Utilities
Multiple Chart
EY
Add to my slides
Remove from favorites
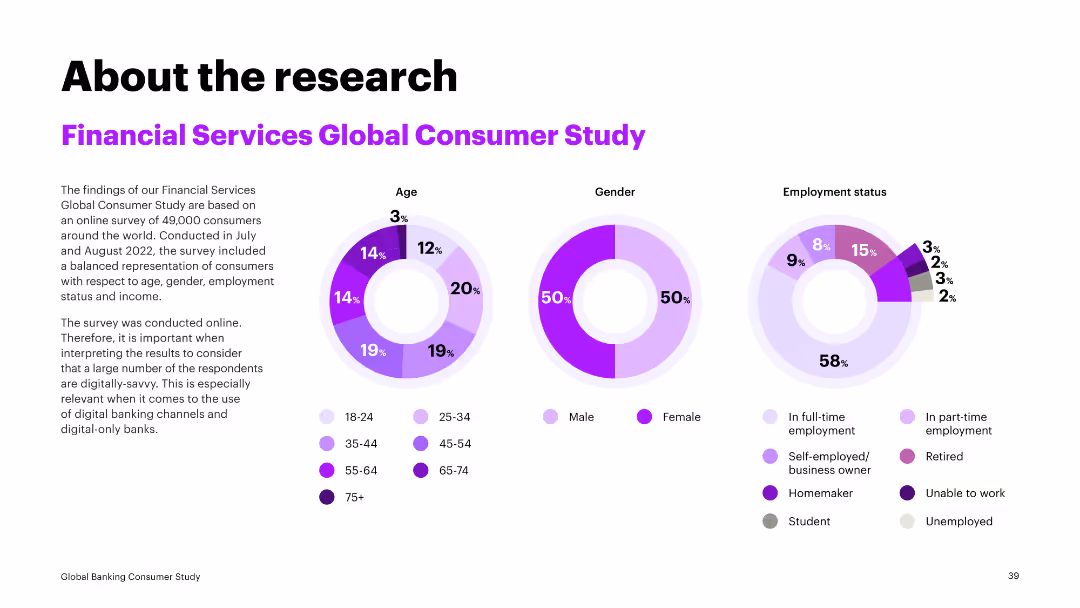
The slide contains three circular charts depicting age, gender, and employment status distributions from a global consumer study. Text explains the study's methodology and demographic representation.
Market Analysis and Trends
Financial Services
This slide summarizes key demographics from a global consumer study, highlighting age, gender, and employment status. It provides context for understanding consumer behavior in financial services.
consumer study, demographics, financial services, market analysis, global survey
false
Market Analysis and Trends
Financial Services
Multiple Chart
Accenture
Add to my slides
Remove from favorites
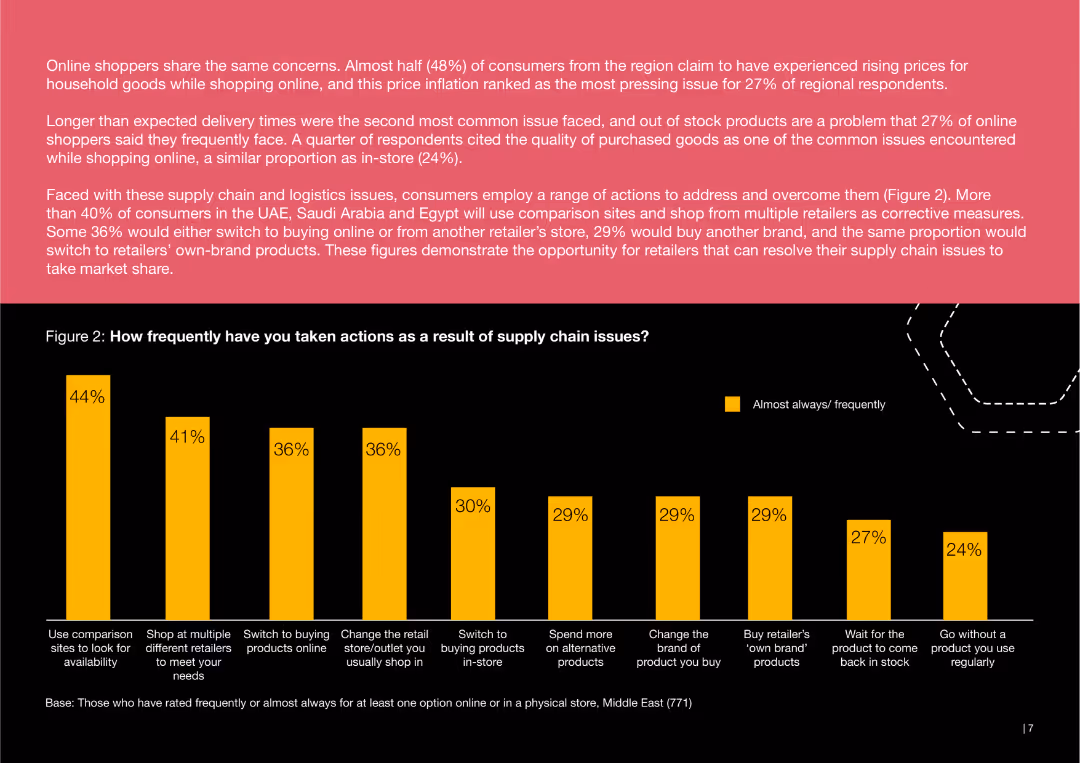
This slide includes a bar chart showing the frequency of various consumer actions taken in response to supply chain issues. Actions like using comparison sites, shopping at multiple retailers, and switching to online purchases are depicted.
Risk Assessment and Management
Consumer Goods
The slide analyzes how consumers have responded to supply chain challenges, highlighting actions such as using comparison sites, shopping at different retailers, and switching to online shopping.
consumer, supply chain, actions, comparison, retailers, online, response, shopping
false
Risk Assessment and Management
Consumer Goods
Mixed Chart
PwC/Strategy&
Add to my slides
Remove from favorites
The slide compares demographic and behavioral profiles of three consumer clusters (EV owners, EV prospects, EV sceptics) using icons and text boxes. It includes data on income, age, gender, urbanization, and parking access.
Customer and Market Segmentation
Consumer Goods
The slide provides a detailed profile comparison of EV owners, prospects, and sceptics, focusing on demographics such as income, age, gender, and living area. It shows differences in private parking access and highlights characteristics useful for market segmentation and targeting.
Consumer Survey, Cluster Profiles, Demographics, EV Owners, EV Prospects, EV Sceptics, Income, Age, Gender
false
Customer and Market Segmentation
Consumer Goods
Multiple Chart
PwC/Strategy&
Add to my slides
Remove from favorites
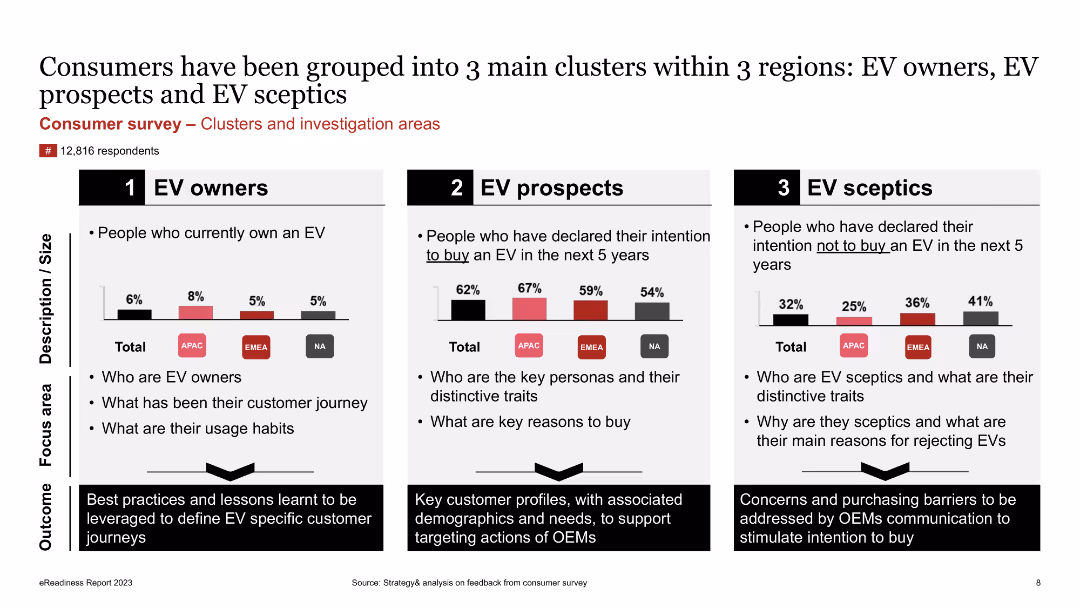
The slide presents a comparative analysis of three consumer clusters (EV owners, EV prospects, EV sceptics) using column charts and text boxes. It highlights key traits and focus areas for each group.
Customer and Market Segmentation
Consumer Goods
The slide categorizes consumers into three clusters based on their EV ownership and intentions: EV owners, EV prospects, and EV sceptics. It identifies the key traits, usage habits, and reasons for or against buying EVs, providing insights for targeted marketing strategies.
Consumer Survey, Clusters, EV Owners, EV Prospects, EV Sceptics, Market Segmentation, Traits, Focus Areas
false
Customer and Market Segmentation
Consumer Goods
Multiple Chart
PwC/Strategy&
Add to my slides
Remove from favorites
The slide presents commuting habits of three consumer clusters (EV owners, EV prospects, EV sceptics) using column charts and text boxes. It includes data on commuting days, distance, car tenure, and multimodal transport usage.
Customer and Market Segmentation
Consumer Goods
The slide analyzes commuting habits among EV owners, prospects, and sceptics, detailing the frequency of car usage, combination with other transport means, daily commuting distance, and typical car tenure. It provides insights into transportation preferences and behaviors of each cluster.
Consumer Survey, Commuting Habits, EV Owners, EV Prospects, EV Sceptics, Transportation, Multimodal Transport, Distance
false
Customer and Market Segmentation
Consumer Goods
Multiple Chart
PwC/Strategy&
Add to my slides
Remove from favorites
Dark green background with white text, flags of Germany, France, and the UK with corresponding sample sizes in green bars on the right.
Market Analysis and Trends
Consumer Goods
The slide provides details about the sample sizes and countries involved in a consumer survey conducted in May 2023, specifically focusing on Germany, France, and the UK.
Consumer survey, sample size, Germany, France, UK
false
Market Analysis and Trends
Consumer Goods
Mixed Chart
Gartner
Add to my slides
Remove from favorites
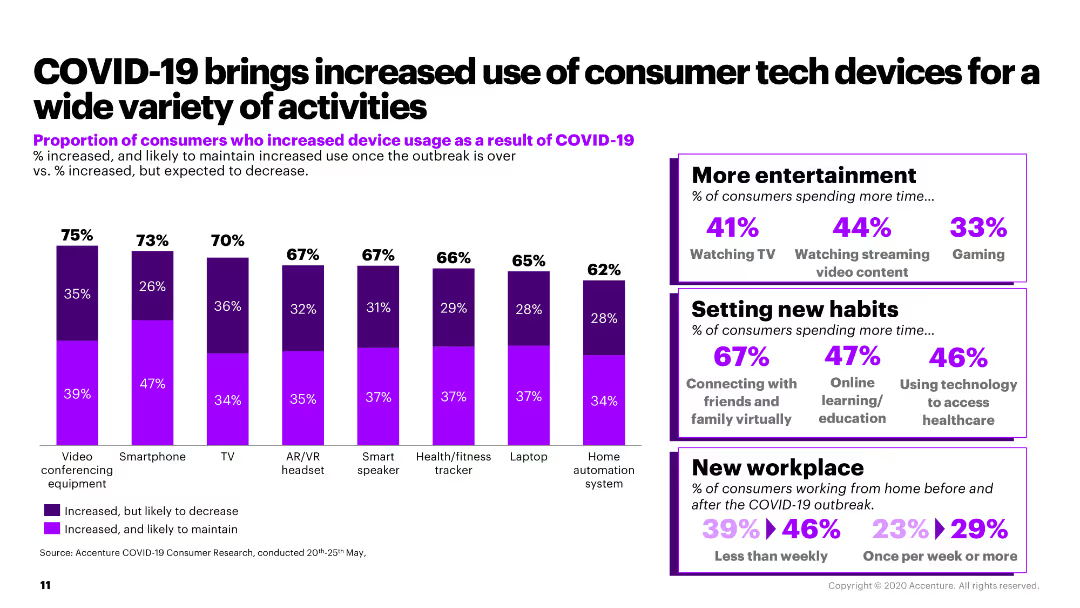
The slide includes a column chart illustrating the increase in usage of various consumer tech devices and a sidebar with additional statistics on consumer habits.
Market Analysis and Trends
Retail & E-commerce
The slide discusses the increased use of consumer tech devices for activities like video conferencing and gaming due to COVID-19, with supporting statistics.
consumer tech, COVID-19, device usage, video conferencing, consumer habits
false
Market Analysis and Trends
Retail & E-commerce
Mixed Chart
Accenture
Add to my slides
Remove from favorites
Features two circular data visualizations contrasting the number of $1B+ consumer technology companies in SEA between 2020 and 2021. The layout is clean with a side panel for descriptive text.
Market Analysis and Trends
Financial Services
Slide illustrates the doubling of $1B+ consumer technology companies in SEA from 2020 to 2021, highlighting the market's robust expansion and its impact on the e-commerce and financial sectors.
Consumer Technology, Growth, SEA, Valuation
false
Market Analysis and Trends
Financial Services
Mixed Chart
Bain
Add to my slides
Remove from favorites
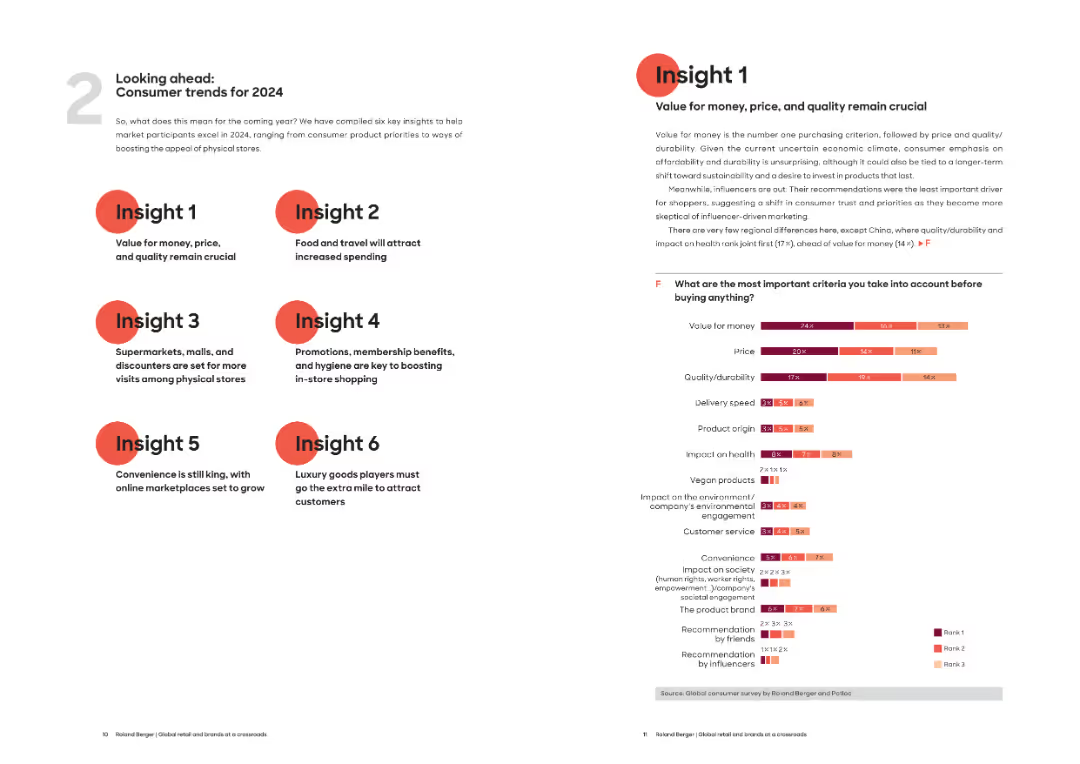
Split layout with key "Insights" listed on left and detailed explanation with bar chart on the right. Clean, minimalist design.
Customer and Market Segmentation
Consumer Goods
This slide lists six key consumer trends for 2024, emphasizing value, convenience, physical store visits, and spending in food and travel. A bar chart ranks consumer priorities like value for money, price, and durability. Influencer impact is noted to be low.
consumer trends, 2024, value for money, price sensitivity, quality, shopping behavior, physical retail, online marketplaces, influencers
false
Customer and Market Segmentation
Consumer Goods
Mixed Chart
Roland Berger
Add to my slides
Remove from favorites
Header with key message, two bar graphs displaying category switch from online to offline purchase.
Customer and Market Segmentation
Retail & E-commerce
Analysis of consumer trends shifting between online and offline shopping channels post-pandemic.
consumer trends, channel preference, online shopping, offline shopping, post-pandemic
false
Customer and Market Segmentation
Retail & E-commerce
Mixed Chart
Bain
Add to my slides
Remove from favorites
Slide includes percentages and icons representing changes in various consumer activities and preferences during the pandemic, using a clear layout and engaging visual representations.
Market Analysis and Trends
Consumer Goods
Details the shift in consumer habits and preferences during the pandemic, including increases in remote work, relocation, and online shopping. Provides insights into how these changes may influence future consumer behavior and market opportunities.
Consumer Trends, COVID-19, Remote Work, Online Shopping
false
Market Analysis and Trends
Consumer Goods
Header Horizontal
BCG
Add to my slides
Remove from favorites
Features a line graph showing consumer device adoption trends over time, supplemented by a photograph of a woman using a tablet.
Market Analysis and Trends
Telecommunications
Analyzes trends in consumer adoption of various devices like smartphones and smart TVs, noting changes in adoption rates over the years.
consumer trends, device adoption, smart devices, technology usage, market analysis
false
Market Analysis and Trends
Telecommunications
Mixed Chart
Deloitte
Add to my slides
Remove from favorites
This slide includes a diagram illustrating eight forces influencing consumer behavior, supported by text explanations. The layout is visually complex.
Market Analysis and Trends
Telecommunications
The slide identifies eight key factors shaping the future of consumer behavior in the telecom sector, highlighting driving and restraining forces.
consumer trends, future consumer, telecom, influencing factors, COVID-19, digital adoption, connectivity, technology integration, behavior
false
Market Analysis and Trends
Telecommunications
Mixed Chart
EY
Add to my slides
Remove from favorites
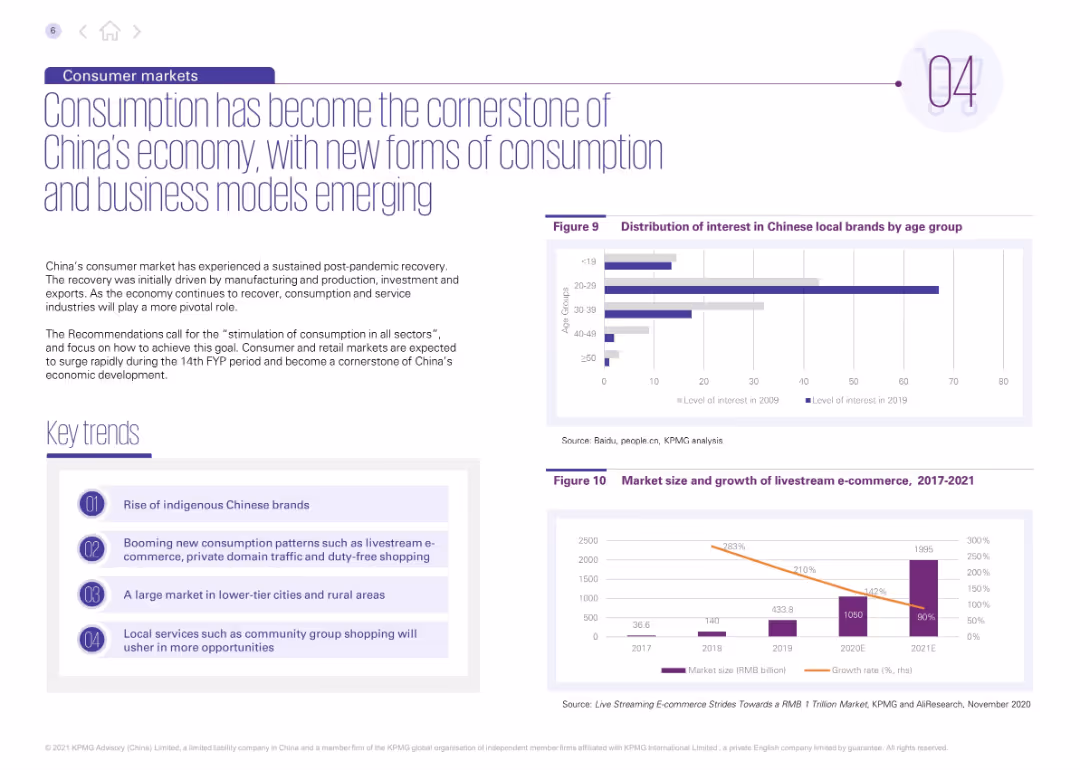
Two-column layout; left contains main text and key trends in highlighted boxes; right shows two bar and column charts (Figures 9 and 10) with age interest levels and livestream e-commerce growth.
Market Analysis and Trends
Consumer Goods
This slide discusses the rise of consumerism in China post-pandemic, emphasizing indigenous brands, livestream e-commerce, and rural market expansion. Key data visualizations highlight increasing interest among younger age groups and the explosive growth of livestream commerce from 2017 to 2021.
consumer trends, livestream e-commerce, rural markets, indigenous brands, China, retail growth, age segmentation, digital commerce, consumption, post-pandemic recovery
false
Market Analysis and Trends
Consumer Goods
Multiple Chart
KPMG
Add to my slides
Remove from favorites
Features a title at the top, two bar graphs in the center comparing consumer habits, and a quote on the right side.
Market Analysis and Trends
Retail & E-commerce
Highlights increasing consumer preference for local products and brands during the pandemic, backed by quantitative data and a personal quote.
consumer trends, local brands, shopping habits, data analysis, pandemic impact, testimonial
false
Market Analysis and Trends
Retail & E-commerce
Multiple Chart
Accenture
Add to my slides
Remove from favorites
This slide features six column charts, one for each country (US, UK, Germany, France, Italy, China, Japan). Each chart displays respondents' intent to increase or decrease online ordering and home delivery, using blue and red colors respectively for increase and decrease. Data points are labeled with percentages and survey dates. Legends and annotations are used for clarity.
Market Analysis and Trends
Industrial & Manufacturing
The slide presents data from a consumer survey about expected changes in online ordering habits for automotive parts and services post-COVID-19 resolution.
consumer trends, online ordering, home delivery, automotive industry, market survey, COVID-19, international comparison, data visualization
false
Market Analysis and Trends
Industrial & Manufacturing
Multiple Chart
McKinsey
Add to my slides
Remove from favorites
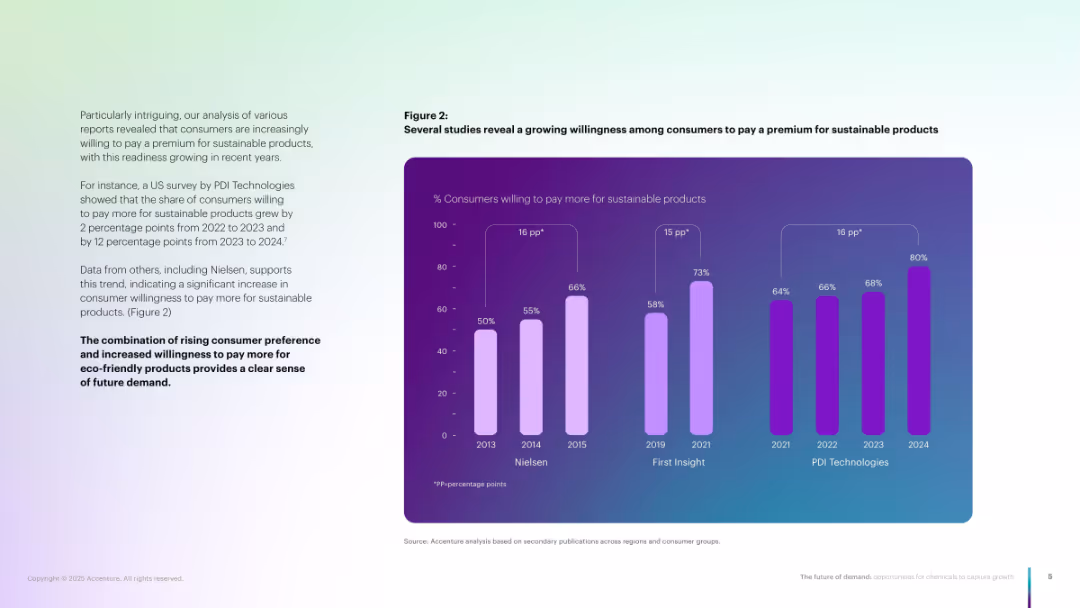
Bar graph on right, text on left. Purple and pink bars showing survey trends from 2013–2024.
Market Analysis and Trends
Consumer Goods
Shows growing consumer willingness to pay more for sustainable products, using data from Nielsen, First Insight, and PDI Technologies. Highlights steady upward trend in preference across multiple years.
Consumer trends, sustainability, premium pricing, surveys, demand growth
false
Market Analysis and Trends
Consumer Goods
Mixed Chart
Accenture
Add to my slides
Remove from favorites
Contains multiple bullet points aligned with numbers on a circular, futuristic city graphic. Text sections are clearly numbered from 1 to 4, detailing consumer trends and preferences in vehicle technology.
Market Analysis and Trends
Transportation & Logistics
Outlines consumer readiness and trends regarding vehicle technology adoption, highlighting challenges in EV adoption and consumer willingness to switch vehicle brands. Useful for strategic insights in automotive and technology sectors.
consumer trends, vehicle technology, EV adoption, market analysis, future insights, connectivity, subscription models, economic concerns
false
Market Analysis and Trends
Transportation & Logistics
Header Vertical
Deloitte
Add to my slides
Remove from favorites
This slide features a horizontal bar chart showing the level of consumer trust in various marketing channels. On the right, there is a text box explaining the importance of marketing channels.
Customer and Market Segmentation
Consumer Goods
The slide illustrates consumer trust in different marketing channels such as recommendations, branded websites, and TV ads. It highlights the need for brands to focus on trusted channels to improve engagement.
Consumer trust, marketing channels, recommendations, branded websites, TV ads, consumer behavior, trust levels, Nielsen study
false
Customer and Market Segmentation
Consumer Goods
Mixed Chart
Nielsen
Add to my slides
Remove from favorites
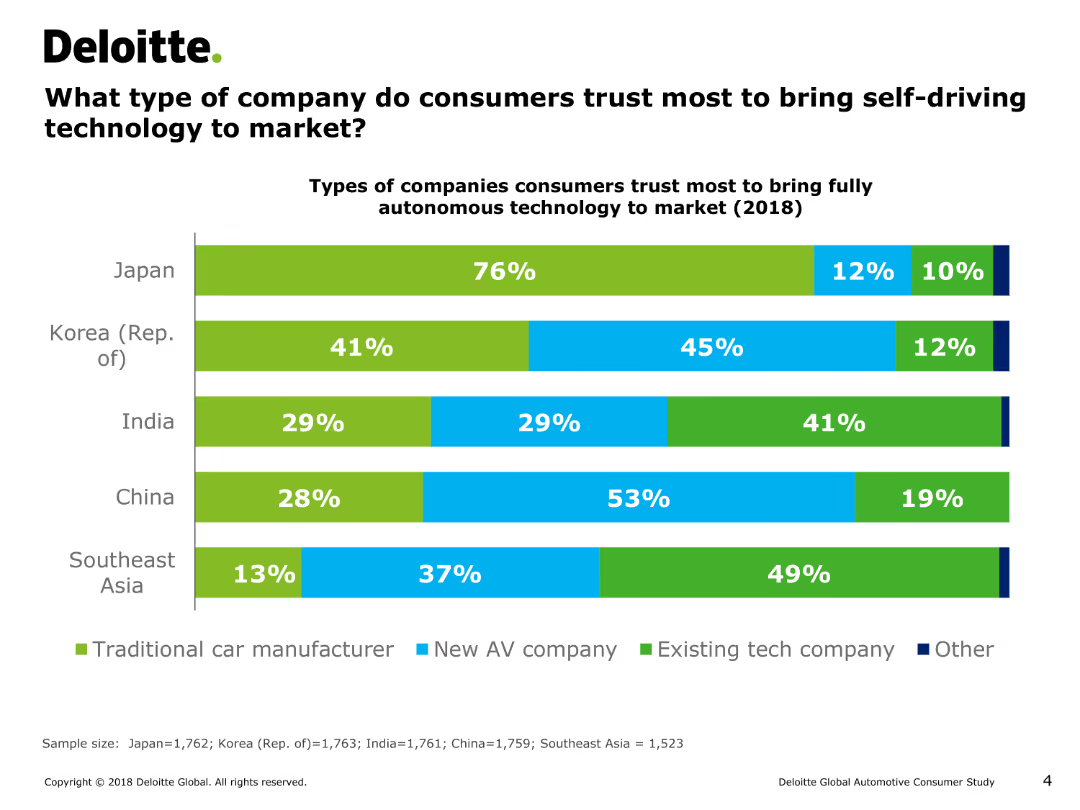
The slide features a horizontal bar chart (bar chart) depicting consumer trust in different types of companies for bringing self-driving technology to market across various countries.
Market Analysis and Trends
Transportation & Logistics
This slide presents data on the types of companies (traditional car manufacturers, new AV companies, existing tech companies, others) that consumers in Japan, Korea, India, China, and Southeast Asia trust to bring self-driving technology to market.
consumer trust, self-driving technology, market analysis, bar chart, autonomous technology, transportation, automotive industry, consumer preferences
false
Market Analysis and Trends
Transportation & Logistics
Single Chart
Deloitte
Add to my slides
Remove from favorites
Three consumer profiles are laid out side by side, with icons and a gradient scale indicating technology adoption levels, in a visually balanced manner.
Customer and Market Segmentation
Technology & Software
Segments Indonesian consumers into three categories based on digital habits, useful for tailoring digital marketing strategies.
consumer types, digital habits, Indonesia, technology adoption
false
Customer and Market Segmentation
Technology & Software
Pillar
Kearney
Add to my slides
Remove from favorites
Features a three-part Venn diagram linking brand equity, product experience, and pricing to consumer value. The slide is simple with minimal text, focusing on the diagram for impact.
Product and Service Analysis
Consumer Goods
Highlights the relationship between brand equity, product differentiation, and pricing strategy in creating consumer value. Useful for marketing strategy discussions and product development meetings.
consumer value, brand equity, pricing, marketing strategy, Clorox
false
Product and Service Analysis
Consumer Goods
Framework
Barclays
Add to my slides
Remove from favorites
This slide features a column chart showing the percentage of Clorox's portfolio with superior consumer value over time, with data points for FY14 and FY18. The graph uses blue and yellow to highlight changes.
Market Analysis and Trends
Consumer Goods
Evaluates the consumer value of Clorox's portfolio, showing an increase in products with superior value from FY14 to FY18. Useful for market analysis and product value assessment.
consumer value, market analysis, Clorox, product assessment
false
Market Analysis and Trends
Consumer Goods
Single Chart
Barclays
Add to my slides
Remove from favorites
The slide has a dark background with a yellow-highlighted quote on the left and a comparative bar chart on the right, displaying top consumer preferences with percentages.
Customer and Market Segmentation
Healthcare & Pharmaceuticals
The slide highlights what Canadian consumers value most in the healthcare system, such as access to care, relief from pain and anxiety, and achieving better health.
Consumer values, healthcare, access to care, pain relief, Canada
false
Customer and Market Segmentation
Healthcare & Pharmaceuticals
Mixed Chart
EY
Add to my slides
Remove from favorites
The slide has a dark background with a yellow-highlighted quote on the left and a comparative bar chart on the right, displaying top consumer preferences with percentages.
Customer and Market Segmentation
Healthcare & Pharmaceuticals
The slide highlights what English consumers value most in the healthcare system, such as access to care, relief from pain and anxiety, and a healthier society.
Consumer values, healthcare, access to care, pain relief, England
false
Customer and Market Segmentation
Healthcare & Pharmaceuticals
Mixed Chart
EY
Add to my slides
Remove from favorites
This slide shows a dark background with column charts highlighting consumer values in healthcare, with white and yellow text.
Market Analysis and Trends
Healthcare & Pharmaceuticals
It emphasizes the importance of access to care, relief from negative symptoms, and cost-effective healthcare for consumers.
consumer values, healthcare, survey, Germany
false
Market Analysis and Trends
Healthcare & Pharmaceuticals
Mixed Chart
EY
Add to my slides
Remove from favorites
Combination of table, column charts, and substantial textual information.
Financial Performance
Financial Services
Details net revenues, management fees, and banking data, providing insights into consumer and wealth management sectors.
Consumer, Wealth, Management, Banking, Bar Charts, Revenue, Net Earnings, Management Fees, Sector, Performance
false
Financial Performance
Financial Services
Mixed Chart
Goldman Sachs
Add to my slides
Remove from favorites
Slide contains column charts, text, and bullet points with a clear visual hierarchy in blue, gray, and white colors. It's data-rich and detailed.
Operational Efficiency
Financial Services
This slide covers financial results and net revenue in consumer and wealth management, useful for operational reviews and financial analysis.
Consumer, Wealth, Management, Financial, Results, Net Revenue, Operational, Review, Analysis, Efficiency
false
Operational Efficiency
Financial Services
Mixed Chart
Goldman Sachs
Add to my slides
Remove from favorites
Consists of financial result tables and column chart displaying net revenues. The slide is text-heavy, providing a dense array of figures and statistics. The graphs use shades of blue for different revenue categories, set against a white background.
Financial Performance
Financial Services
Provides detailed financial metrics and analysis for consumer and wealth management, suitable for financial reporting or discussing strategic business decisions.
Consumer, Wealth Management, Net Revenues, Banking
false
Financial Performance
Financial Services
Mixed Chart
Goldman Sachs
Add to my slides
Remove from favorites
The slide contains multiple column charts and a pie chart, presenting data on hourly, monthly, and daily consumption. It uses different colors to differentiate between various consumption metrics and customer types.
Operational Efficiency
Energy & Utilities
The slide provides a comprehensive dashboard for energy consumption data, including hourly, monthly, and daily consumption metrics, segmented by customer type, aiding in operational monitoring and efficiency.
Consumption, Dashboard, Energy, Metrics, Customer Types
false
Operational Efficiency
Energy & Utilities
Multiple Chart
EY
Add to my slides
Remove from favorites
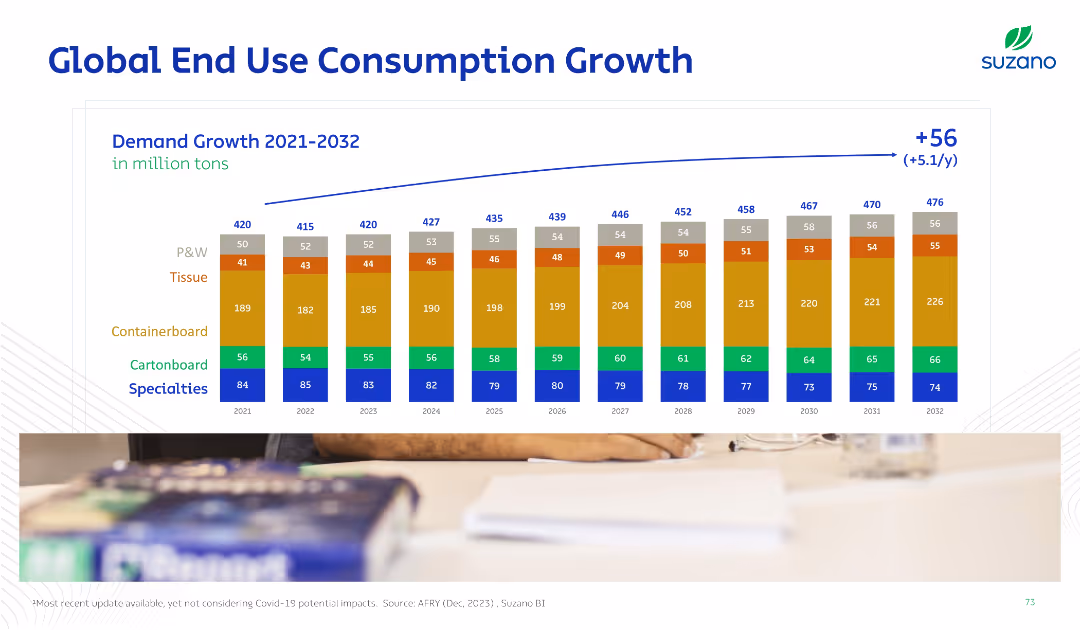
Horizontal bar chart over years with stacked categories (e.g., tissue, specialties). Blue arrow shows net increase. Color-coded for product types.
Strategic Planning
Industrial & Manufacturing
Forecasts global consumption growth across end-use pulp categories from 2021 to 2032. Categories like tissue and containerboard are emphasized, showing a +56 million ton increase with breakdowns by type.
consumption, end-use, tissue, containerboard, demand, forecast, growth, P&W, specialties
false
Strategic Planning
Industrial & Manufacturing
Single Chart
Goldman Sachs
Add to my slides
Remove from favorites
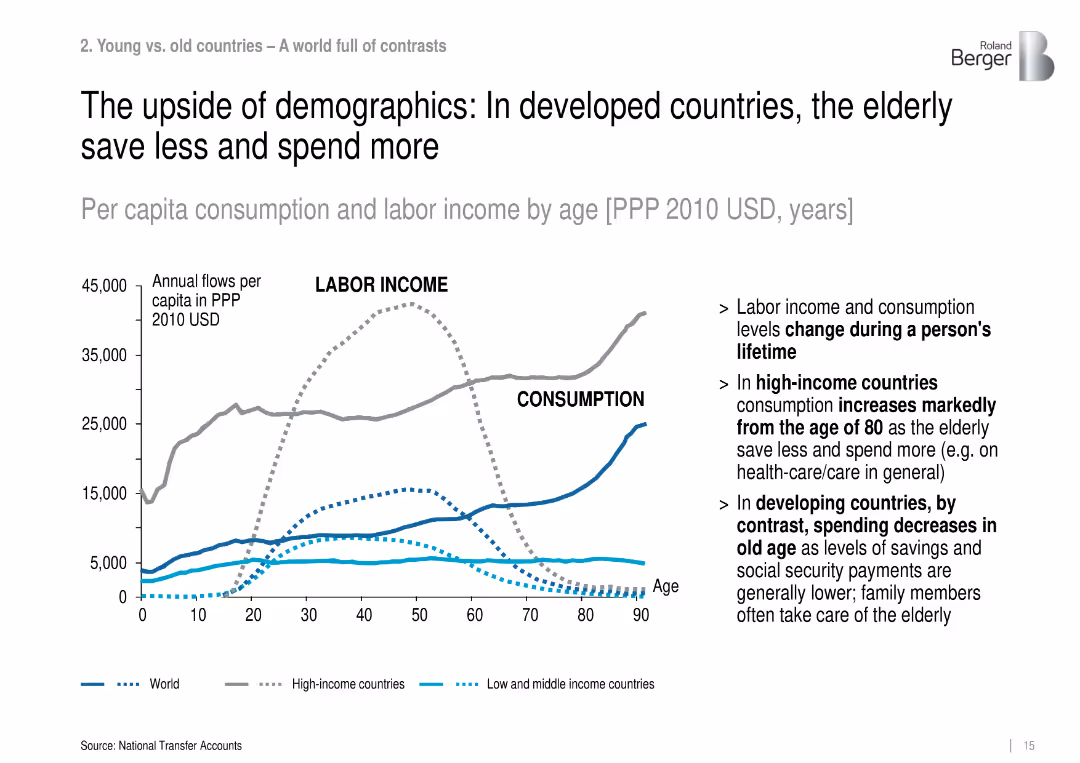
Line graph showing labor income vs. consumption by age across different country income levels (World, High, Low-Mid).
Market Analysis and Trends
Government & Public Sector
The slide presents per capita labor income and consumption over age, revealing that elderly populations in high-income countries consume more and save less, especially after age 80, contrasting with developing regions.
consumption, labor income, aging, high-income, developing countries, elderly spending, economic behavior
false
Market Analysis and Trends
Government & Public Sector
Mixed Chart
Roland Berger
Add to my slides
Remove from favorites
This slide uses a linear graph and segmented bars to represent the recovery of different economic sectors post-lockdown. Each sector is symbolized by a different pattern (stripes for goods, dots for services), showing their recovery status in relation to pre-COVID levels.
Strategic Planning
Consumer Goods
Evaluates the recovery of consumer sectors post-COVID, highlighting which areas have returned to normal, are recovering, or still require significant time to bounce back. It provides insights into consumption trends and sector-specific recoveries.
consumption, recovery, COVID-19, economic sectors, trends, analysis
false
Strategic Planning
Consumer Goods
Single Chart
BCG
Add to my slides
Remove from favorites
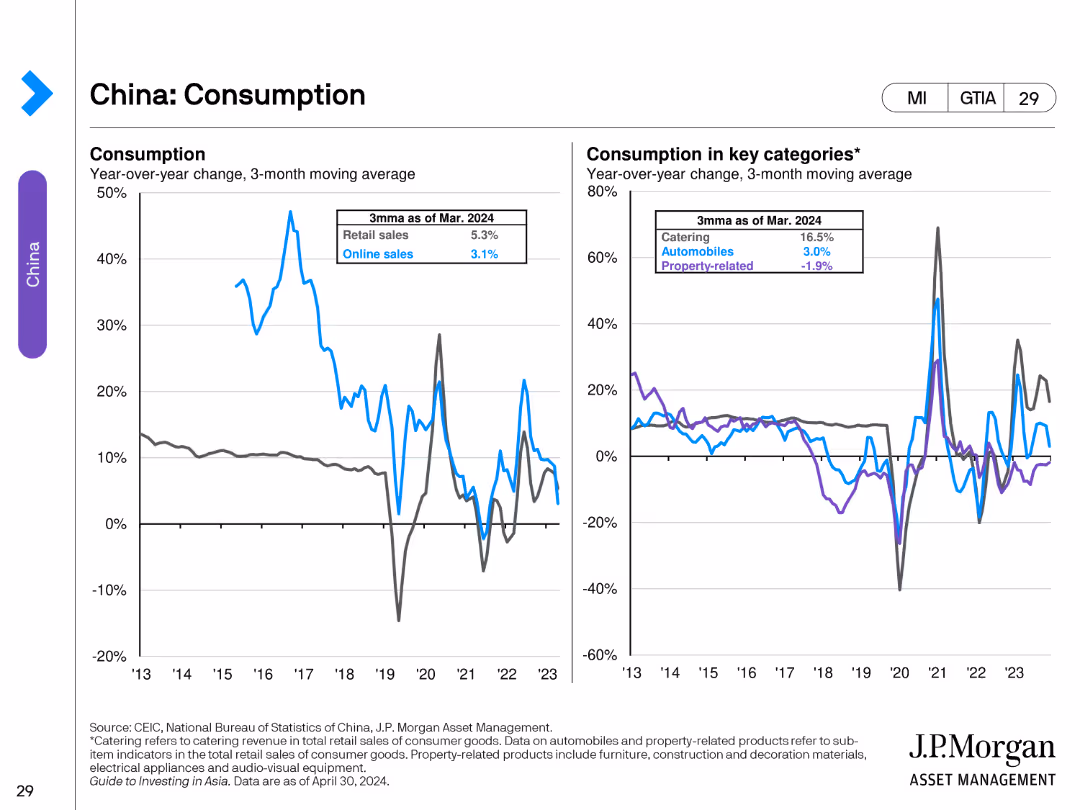
The slide contains two line charts. The left chart shows year-over-year change in retail and online sales. The right chart shows year-over-year change in catering, automobiles, and property-related sales.
Market Analysis and Trends
Consumer Goods
This slide analyzes consumption trends in China, highlighting changes in retail and online sales, as well as key categories like catering, automobiles, and property-related sales.
Consumption, Retail, Online Sales, China, Trends
false
Market Analysis and Trends
Consumer Goods
Multiple Chart
JP Morgan
Add to my slides
Remove from favorites
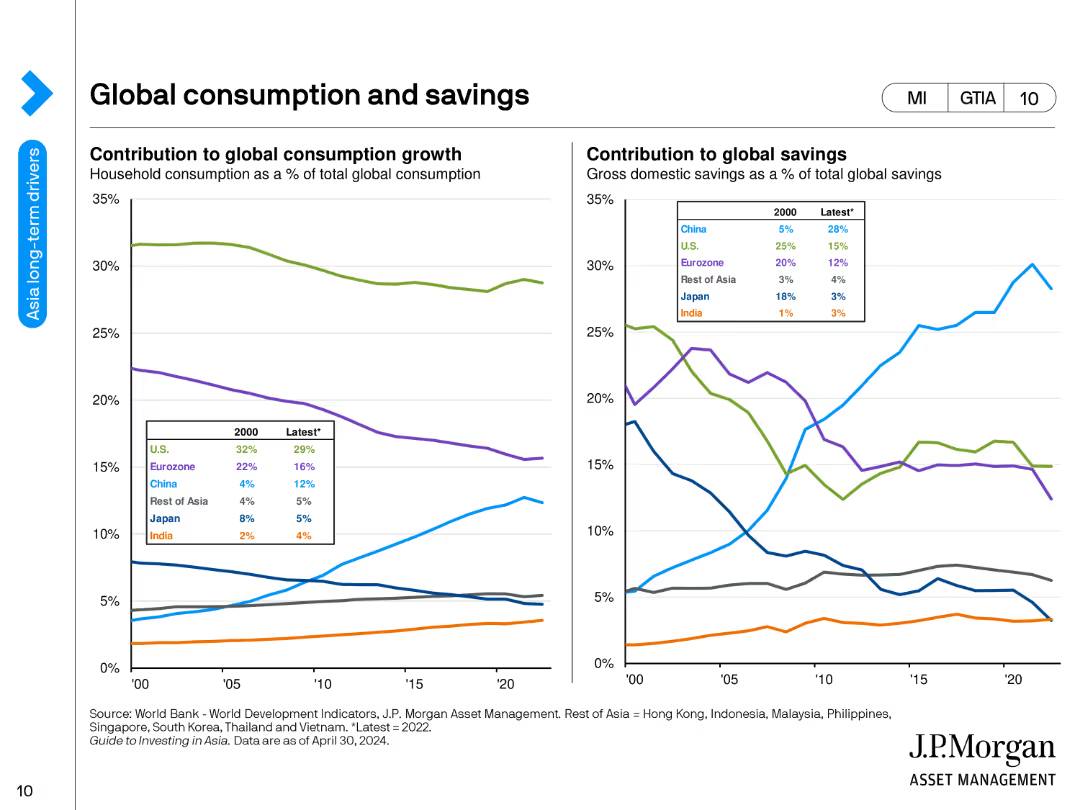
Two line charts. The left chart shows the contribution to global consumption growth by region, and the right chart shows the contribution to global savings.
Market Analysis and Trends
Financial Services
The slide presents the global consumption growth contributions by region and the changes in global savings percentages over time.
consumption, savings, global, trends, regions, financial analysis, economic behavior, growth, forecast, development
false
Market Analysis and Trends
Financial Services
Multiple Chart
JP Morgan
Add to my slides
Remove from favorites
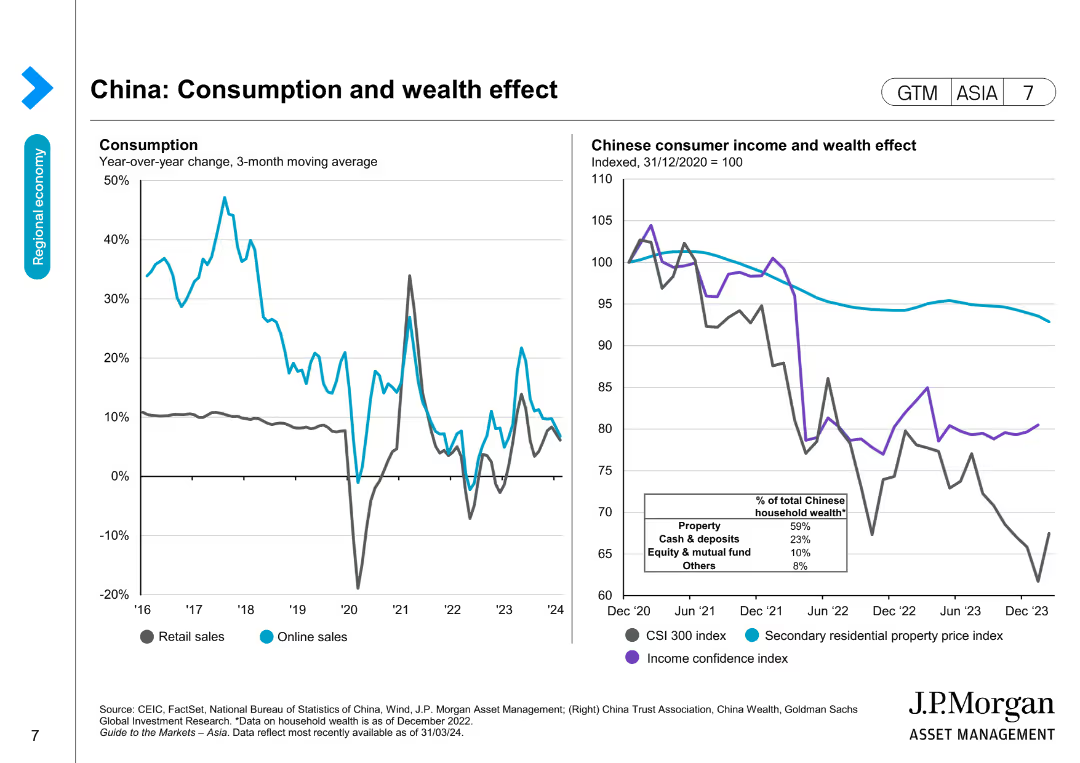
Two line charts illustrating year-over-year change in consumption and indices tracking Chinese consumer income and wealth effect, with data trends over several years.
Market Analysis and Trends
Financial Services
Analyzes the consumption patterns and wealth effects on Chinese consumers, showing trends in retail and online sales, income confidence, and property prices.
Consumption, Wealth effect, China, Retail sales, Online sales, Income, Consumer data, Economic trends, Financial services
false
Market Analysis and Trends
Financial Services
Multiple Chart
JP Morgan
Add to my slides
Remove from favorites
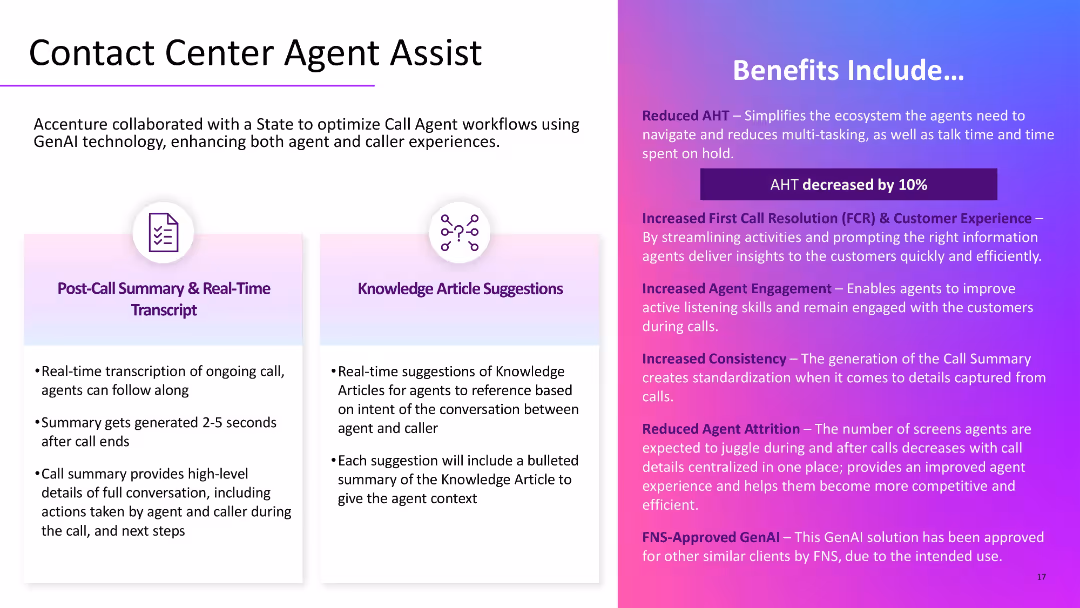
Split three-column layout with features (left/mid) and benefits (right); uses icons and bolded callouts for clarity; purple background gradient on the right side.
Operational Efficiency
Government & Public Sector
Describes how GenAI helps optimize call center workflows by enabling real-time transcripts, automated summaries, and article suggestions. Benefits include reduced average handling time, better customer experience, agent consistency, and reduced attrition.
contact center, AI assist, call summaries, GenAI, customer service
false
Operational Efficiency
Government & Public Sector
Boxed
Accenture
Add to my slides
Remove from favorites
Features complex stacked column chart setup with bar and pie charts explaining current and future states of channel mix in contact centers, using shades of green.
Operational Efficiency
Professional Services
Analyzes current and projected future states of communication channel mixes in contact centers, highlighting shifts towards digital and asynchronous methods.
Contact Centers, Channel Mix, Digital Transformation, Future Trends, Current State, Projected Changes
false
Operational Efficiency
Professional Services
Multiple Chart
Deloitte
Add to my slides
Remove from favorites
Slide contains three sections with lists and icons, detailing themes of customer experience, talent initiatives, and technology in contact centers. Colorful icons help differentiate the topics.
Operational Efficiency
Professional Services
Discusses three major themes identified in a global survey about contact centers: channel orchestration, talent initiatives, and cognitive technology, providing insights into current and future trends.
Contact Centers, Customer Experience, Talent Management, Technology, Survey Insights, Future Trends
false
Operational Efficiency
Professional Services
Pillar
Deloitte
Add to my slides
Remove from favorites
Features column charts and icons representing various contact channels used in customer service, with emphasis on digital and traditional methods. The slide is well-organized with a modern design, employing light blue and green colors.
Technology and Digital Transformation
Telecommunications
Highlights the current usage and investment trends in different customer service channels, particularly in digital transformation. Offers valuable insights for telecommunications and service-oriented companies looking to enhance customer interaction through technological advancements.
contact channels, customer service, digital transformation, investment trends, telecommunications
false
Technology and Digital Transformation
Telecommunications
Multiple Chart
Deloitte
Add to my slides
Remove from favorites
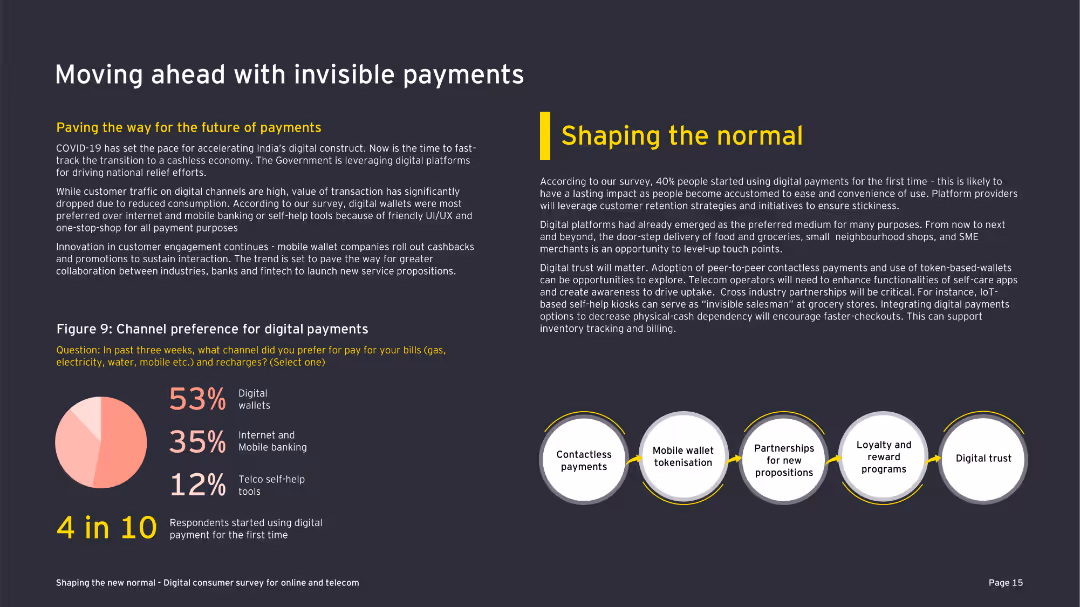
This slide contains a title, subtitle, a picture of a hand holding a contactless card over a payment terminal, and a column chart comparing digital wallet adoption to tap to pay, with tap to pay being 2.4 times higher. Minimal text.
Market Analysis and Trends
Financial Services
The slide demonstrates the adoption of tap to pay technology using Chase contactless cards and compares it to digital wallet adoption. It could be used to illustrate the changing consumer payment behaviors and the potential market for contactless payment technologies.
Contactless Payment, Adoption, Market Trends, Digital Wallet, Consumer Behavior, Technology, Financial Services, Tap to Pay, Comparison, Growth
false
Market Analysis and Trends
Financial Services
Mixed Chart
JP Morgan
Add to my slides
Remove from favorites
The slide is divided into two sections titled "Start here" and "Get there". Each section contains a list with icons, detailing steps and goals for adopting new payment solutions.
Operational Efficiency
Technology & Software
Discusses steps for adopting contactless payments and tailoring technology to business needs, which could be useful for strategic planning or operational efficiency discussions.
contactless payments, business strategy, technology adoption, operational efficiency, strategic planning
false
Operational Efficiency
Technology & Software
Boxed
JP Morgan
Add to my slides
Remove from favorites
This slide includes a sectioned layout with one side presenting a list of contactless payment advantages, and the other featuring a column chart with statistics on consumer behavior changes during and after the pandemic. Additionally, there's a background image of a person making a payment.
Client Case Studies
Technology & Software
Highlights the shift to contactless payments and consumer adoption rates, offering insights on post-pandemic behavior. The slide could serve as a case study for payment technology impact.
contactless payments, consumer behavior, pandemic impact, payment technology, case study
false
Client Case Studies
Technology & Software
Mixed Chart
JP Morgan
Add to my slides
Remove from favorites
This slide contrasts two sets of data visualizations: a bar graph showcasing the shift in payment method preferences on the right, and detailed explanatory text on the left. The design is clean and the visualizations are easy to interpret.
Customer and Market Segmentation
Financial Services
Analyzes the growing preference for contactless payment methods, particularly e-wallets, over traditional cash transactions among Southeast Asian consumers, highlighting the influence of societal shifts on payment behaviors.
contactless payments, e-wallets, consumer trends, cash transactions, Southeast Asia, payment methods, digital payments, societal shifts
false
Customer and Market Segmentation
Financial Services
Multiple Chart
Bain
Add to my slides
Remove from favorites
The slide includes a column chart comparing container packing costs per tonne between Australia, Ukraine, and Canada, along with contextual notes.
Market Analysis and Trends
Transportation & Logistics
The slide compares container packing rates in Australia, Ukraine, and Canada, explaining the reasons behind the higher costs in Australia and their implications for the logistics industry.
Container packing, Australia, Ukraine, Canada, cost comparison, transportation, logistics, market analysis
false
Market Analysis and Trends
Transportation & Logistics
Mixed Chart
LEK
Add to my slides
Remove from favorites
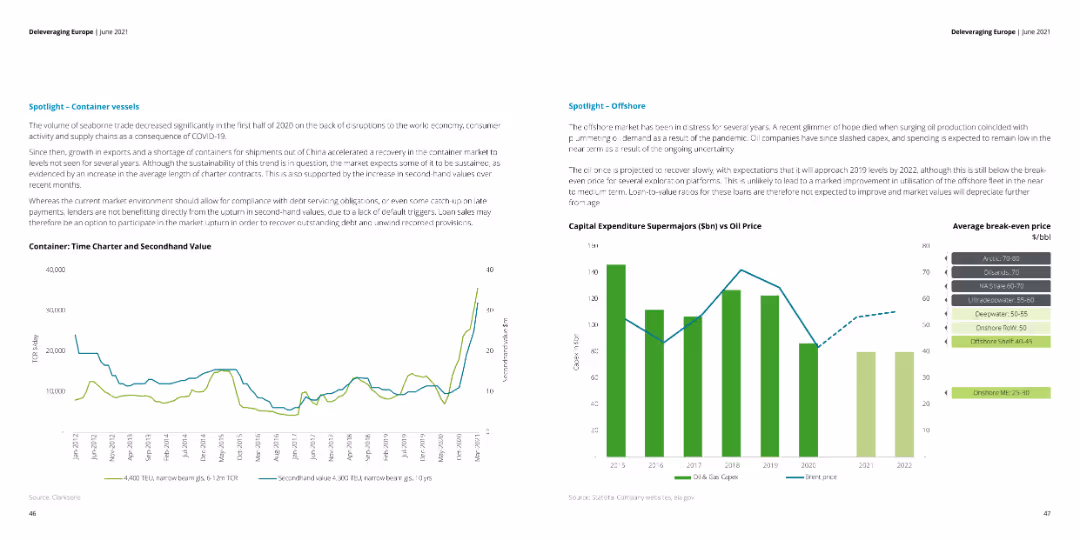
The slide contains two line charts: one for container vessel time charter and secondhand value, and another comparing capital expenditure for supermajors with oil prices.
Market Analysis and Trends
Transportation & Logistics
This slide examines the container vessel market and offshore industry trends, highlighting the recovery in container shipping and the impact of oil price fluctuations on capital expenditures for supermajors.
container vessels, offshore, oil prices, trends
false
Market Analysis and Trends
Transportation & Logistics
Multiple Chart
Deloitte
Add to my slides
Remove from favorites
The slide offers a comparative analysis using bar charts and color-coded text to differentiate between countries' responses to COVID-19. The "Early China model" and "South Korea model" are contrasted, with testing rates and actions taken highlighted.
Strategic Planning
Healthcare & Pharmaceuticals
It compares strategies of various countries in responding to COVID-19, focusing on movement restriction and testing rates. It's meant to guide strategic planning in immediate containment and scaling up testing.
Containment, Testing, COVID-19, Countries, Strategy
false
Strategic Planning
Healthcare & Pharmaceuticals
Header Horizontal
McKinsey
Add to my slides
Remove from favorites
Column chart slide showing weekly and monthly reach percentages across various platforms like TV, radio, and internet. Uses distinct colors for clarity.
Market Analysis and Trends
Media & Entertainment
Analyzes content consumption across different platforms, showing high reach percentages and frequent use of TV and radio by adults.
content consumption, reach, platforms, TV, radio, internet, analysis
false
Market Analysis and Trends
Media & Entertainment
Single Chart
Nielsen
Add to my slides
Remove from favorites
Presents a column chart illustrating the podcast ad revenue percentage share by content genre between 2021 and 2022. Each genre is represented by a pair of bars for each year, with detailed annotations. The slide background and bar colors enhance readability.
Market Analysis and Trends
Media & Entertainment
Examines shifts in revenue generation across different podcast genres, noting a decrease in news content and increase in entertainment genres. Useful for content creators and advertisers to strategize genre-focused marketing efforts.
Content Genres, Revenue Share, Podcasting, Market Trends, Advertising
false
Market Analysis and Trends
Media & Entertainment
Mixed Chart
PwC/Strategy&
Add to my slides
Remove from favorites
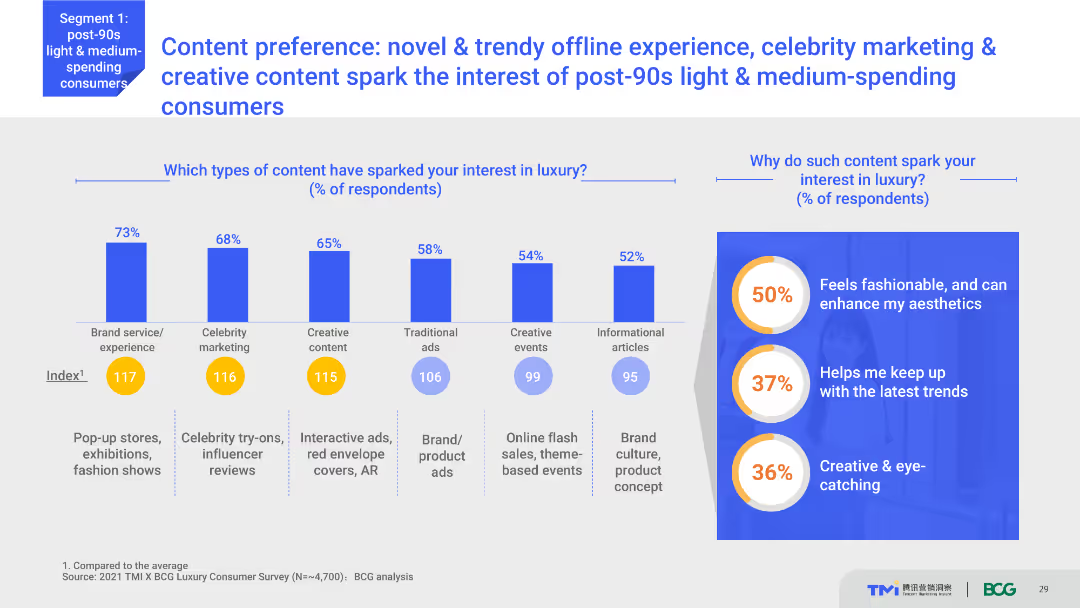
Column charts showing percentages of content types that spark interest in luxury, including brand service, celebrity marketing, and creative content. Explanatory text boxes are included on the right side.
Market Analysis and Trends
Media & Entertainment
Highlights content preferences that attract post-90s light and medium-spending consumers to luxury. Various content types like brand services, celebrity marketing, and creative content are analyzed for their impact on consumer interest.
Content marketing, luxury interest, consumer preferences, offline experiences, celebrity marketing
false
Market Analysis and Trends
Media & Entertainment
Multiple Chart
BCG
Add to my slides
Remove from favorites
The slide uses a horizontal bar chart to display data on content preferences across LTV, OTT, and Movie Studios. It includes icons for each category and percentage values highlighting the top information areas for each vertical. The layout is clean with green and white colors.
Market Analysis and Trends
Media & Entertainment
This slide presents survey data showing the top information areas that consumers seek across LTV, OTT, and Movie Studios. It highlights the popularity of trailers/teasers, reviews/ratings, and ad promos, providing insights into content development priorities.
content preferences, LTV, OTT, Movie Studios, consumer survey, trailers, reviews, ad promos
false
Market Analysis and Trends
Media & Entertainment
Multiple Chart
BCG
Add to my slides
Remove from favorites
The slide showcases a contents list against a vibrant purple wavy background, indicating sections of the report on educational transformation and skills acquisition.
Technology and Digital Transformation
Education & Training
An agenda slide listing the report's contents, providing an overview of the topics covered, such as the impact of technology on skills and learning in the workplace.
Contents, Agenda, Education, Skills Acquisition, Learning, Technology Impact, Workforce, Intelligent Technologies, Training, Transformation
false
Technology and Digital Transformation
Education & Training
Agenda
Accenture
Add to my slides
Remove from favorites
Colorful, labeled sections for 'FIXED INCOME', 'EQUITIES', 'ALTERNATIVES', etc., indicating the presentation's structure and main points.
Industry Overview
Financial Services
This slide provides an organized overview of the presentation's structure, guiding viewers through the various sections and topics covered in the Monthly Market Monitor. It serves as a navigational aid for the presentation.
Contents, Agenda, Fixed Income, Equities, Alternatives, Asset Allocation, Navigation
false
Industry Overview
Financial Services
Agenda
Morgan Stanley
Add to my slides
Remove from favorites
The slide features a dark background with a colorful, vertically stacked list. Four sections are represented by labeled, color-coded capsules that indicate the start page number. The design is straightforward and prioritizes clarity.
Industry Overview
Professional Services
This slide presents the contents of the Growth & Scale Talent Playbook, outlining the sections about ASEAN's digital talent landscape. It serves as a navigational guide for the presentation, giving viewers an overview of the topics that will be discussed, like digital talent requirements, challenges for companies, and proposed interventions by ASEAN governments.
contents, ASEAN, digital talent, navigation, sections
false
Industry Overview
Professional Services
Agenda
Kearney
Add to my slides
Remove from favorites
This slide presents a structured list with the table of contents for the ESG report, detailing different sections such as leadership, business, and approaches to ESG.
Regulatory and Compliance
Professional Services
The table of contents for the 2022 ESG report, outlining key sections and page numbers, functioning as a navigational guide for readers.
Contents, ESG, Sections, Structure, Professional
false
Regulatory and Compliance
Professional Services
Agenda
Booz Allen Hamilton
Add to my slides
Remove from favorites
Purple and white themed contents slide with clear listing of the report's main sections, using a simple and clean design.
Industry Overview
Professional Services
Outlines the structure of the nbn™ report, detailing the sections such as executive summary, network value, and methodology.
Contents, Executive Summary, Methodology, nbn, Agenda
false
Industry Overview
Professional Services
Agenda
Accenture
Add to my slides
Remove from favorites
A visually striking contents page with hexagonal yellow icons labeled 1–6 corresponding to sections, over a blue-toned futuristic background with a hand touching digital blocks.
Strategic Planning
Technology & Software
This slide serves as a table of contents, outlining the report's sections: Key Insights, Overview, IT Services, Engineering R&D, BPM, and Outlook. Each section is paired with a page number, providing a clear roadmap for the presentation. The modern, tech-oriented design implies a focus on digital and innovation-heavy topics.
contents, roadmap, IT, business, structure, BPM, ER&D, digital
false
Strategic Planning
Technology & Software
Agenda
EY
Add to my slides
Remove from favorites
The slide features a colorful table of contents with sections like "Fixed Income," "Equities," and "Alternatives," each with a page number.
Strategic Planning
Financial Services
This slide outlines the sections and their order in the market monitor report, functioning as a navigational tool for the viewer.
contents, sections, navigation, financial, colorful
false
Strategic Planning
Financial Services
Agenda
Morgan Stanley
Add to my slides
Remove from favorites
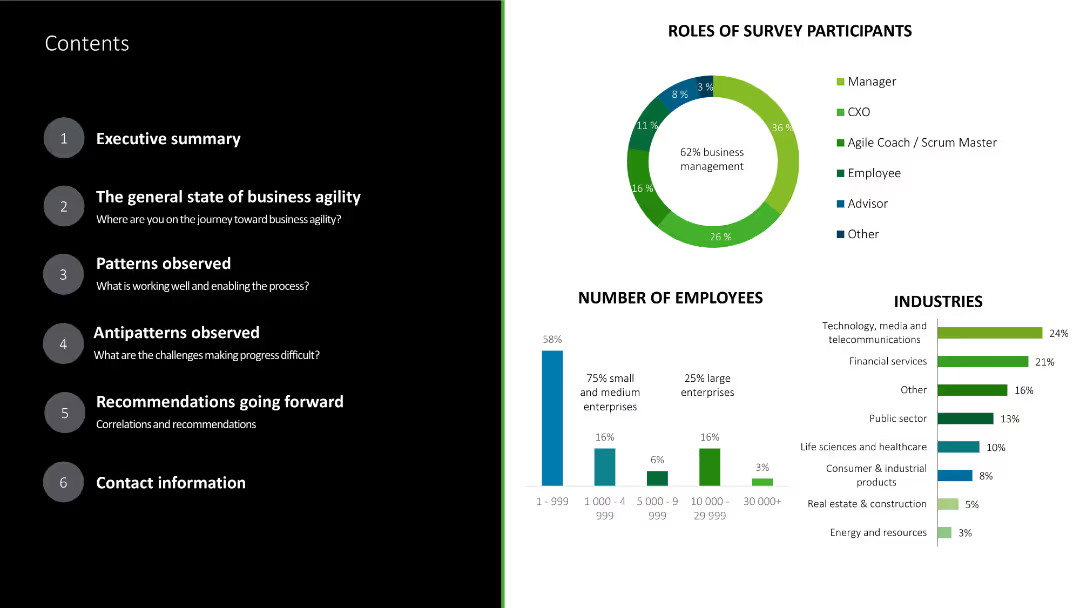
The slide includes a table of contents on the left, listing key sections, and a pie chart showing roles of survey participants. It also has a bar chart displaying the number of employees in surveyed companies.
Risk Assessment and Management
Professional Services
The slide provides an agenda for the presentation, outlining the key sections and displaying survey results, including the roles of participants and the size of companies involved in the survey.
contents, survey, roles, employees, sections
false
Risk Assessment and Management
Professional Services
Multiple Chart
Deloitte
Add to my slides
Remove from favorites
The slide displays a table of contents in a clear, structured layout with bold blue headers. It is designed to direct the viewer to different sections of the presentation, which are clickable for ease of navigation.
Market Analysis and Trends
Financial Services
This slide organizes the main topics covered in the credit market report, facilitating easy access to specific analyses and data. This is typically used to orient the audience at the beginning of a detailed financial presentation.
Contents, Topics, Navigation, Report
false
Market Analysis and Trends
Financial Services
Agenda
Morgan Stanley
Add to my slides
Remove from favorites
The slide features a bar chart comparing different data signals for delivering ROI, showing that contextual data is less effective than purchase-based data.
Market Analysis and Trends
Professional Services
This slide argues that contextual data alone is insufficient for delivering high ROI. It suggests combining contextual and behavioral data for better marketing performance.
contextual data, ROI, marketing performance, data signals, purchase-based data
false
Market Analysis and Trends
Professional Services
Mixed Chart
Nielsen
Add to my slides
Remove from favorites
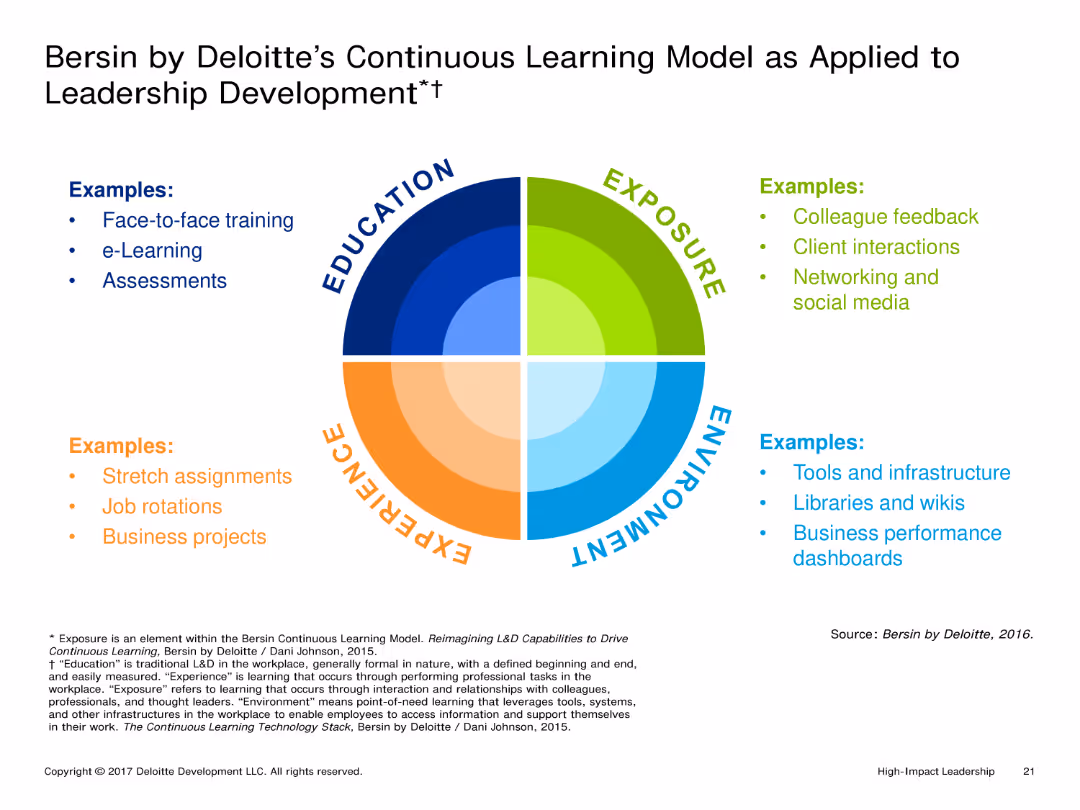
A circular diagram divided into four quadrants representing Education, Experience, Exposure, and Environment. Each quadrant lists examples and methods associated with that aspect of learning.
Market Analysis and Trends
Education & Training
The slide explains Deloitte's Continuous Learning Model, focusing on how education, experience, exposure, and environment contribute to leadership development. Each quadrant provides examples of activities and tools used in these areas.
Continuous Learning, Leadership Development, Education, Experience, Environment
false
Market Analysis and Trends
Education & Training
Framework
Deloitte
Add to my slides
Remove from favorites
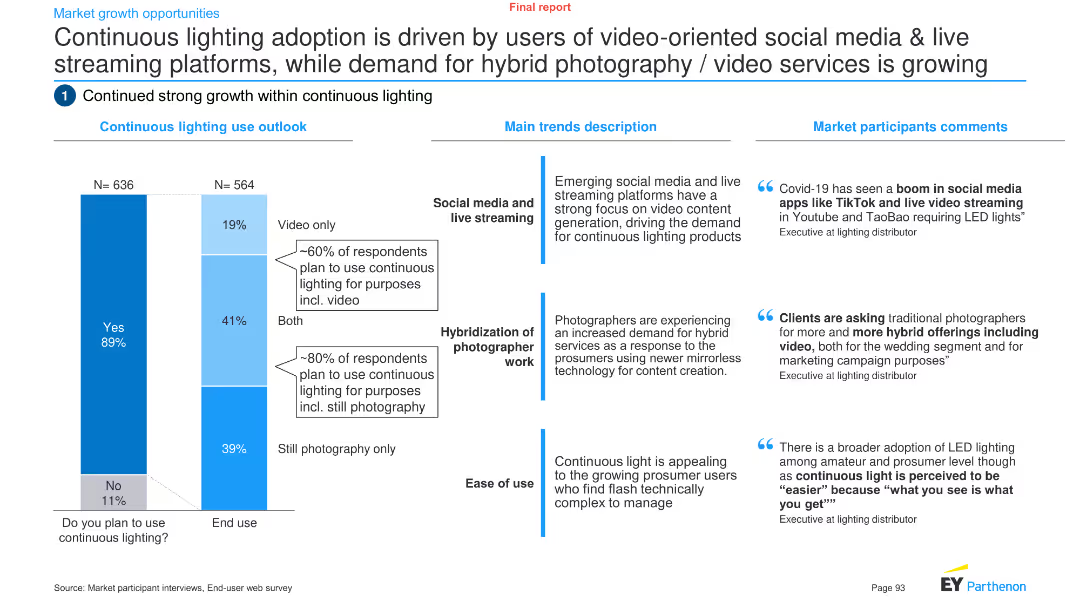
The slide features a column chart and text boxes analyzing the adoption and trends of continuous lighting in video-oriented social media and hybrid photography/video services.
Market Analysis and Trends
Media & Entertainment
It explores the growth opportunities for continuous lighting, driven by social media, live streaming platforms, and hybrid photography/video services demand.
Continuous lighting, adoption, social media, live streaming, hybrid photography, video services, trends, media, analysis, growth
false
Market Analysis and Trends
Media & Entertainment
Mixed Chart
EY
Add to my slides
Remove from favorites
This slide features a paragraph of text on the left and a graph on the right. The graph shows percentages corresponding to practices supporting continuous reinvention, using a blue to purple gradient. The imagery suggests a dynamic and ongoing transformation process.
Strategic Planning
Professional Services
It discusses the need for companies to continuously reinvent by reprioritizing initiatives and driving impactful actions. This slide could be instrumental in implementing strategic planning sessions focused on innovation and adaptability.
Continuous Reinvention, Strategic Priorities, Business Impact, Innovation, Reprioritizing, Initiative Management, Transformation Process, Impactful Actions
false
Strategic Planning
Professional Services
Single Chart
Accenture
Add to my slides
Remove from favorites
The slide features a series of scatter plots representing contracting activity for different types of drilling units in various environments. Each plot is labeled and uses differently sized bubbles to indicate contract duration, with trend lines showing rate changes over time. The design is minimalistic but effective, with clear labels and a legend explaining the symbols used. The visual hierarchy is well managed to guide the viewer through the data.
Market Analysis and Trends
Energy & Utilities
This slide analyzes contracting activity within the oil drilling sector, specifically looking at day rates and contract durations for harsh and benign environment floaters, as well as premium jack-ups. It's designed to help stakeholders understand market conditions and the profitability of deploying specific drilling units under current economic conditions. This data is crucial for strategic decisions regarding fleet deployment and investment in new technologies or markets.
contracting activity, drilling units, scatter plots, market analysis, day rates, trend analysis, oil drilling, environment, profitability, strategic decisions
false
Market Analysis and Trends
Energy & Utilities
Multiple Chart
Barclays
Add to my slides
Remove from favorites
A scatter plot chart illustrates the overlap of Procure-to-Pay, eSourcing, and Supplier Governance, highlighting tools like Ariba and Coupa. Key areas such as contract management, financial management, and risk management are detailed.
Operational Efficiency
Technology & Software
Describes the integration of contract management, supplier governance, and P2P systems, detailing functions and technologies used to streamline and enhance supplier interactions and compliance.
Contract, Management, Supplier, Governance, Integration
false
Operational Efficiency
Technology & Software
Diagram
Kearney
Add to my slides
Remove from favorites
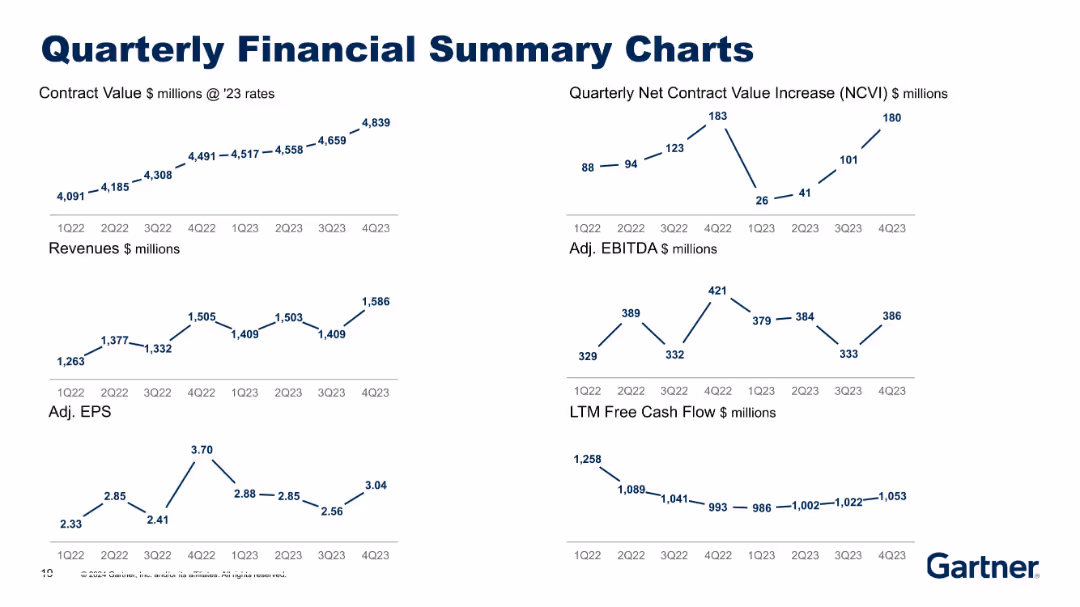
Six compact financial trend graphs (line charts) over two rows, focused on 2022–2023 period. Clear minimal text and blue line visuals on gray.
Financial Performance
Financial Services
Similar to Slide 18631 but covers an earlier timeframe (2022–2023). Displays trends in contract value, revenues, EBITDA, EPS, and cash flow. Offers historical baseline for comparison with newer data in other slides.
Contract Value, EPS, EBITDA, Historical Performance, Revenue
false
Financial Performance
Financial Services
Multiple Chart
Gartner
Add to my slides
Remove from favorites
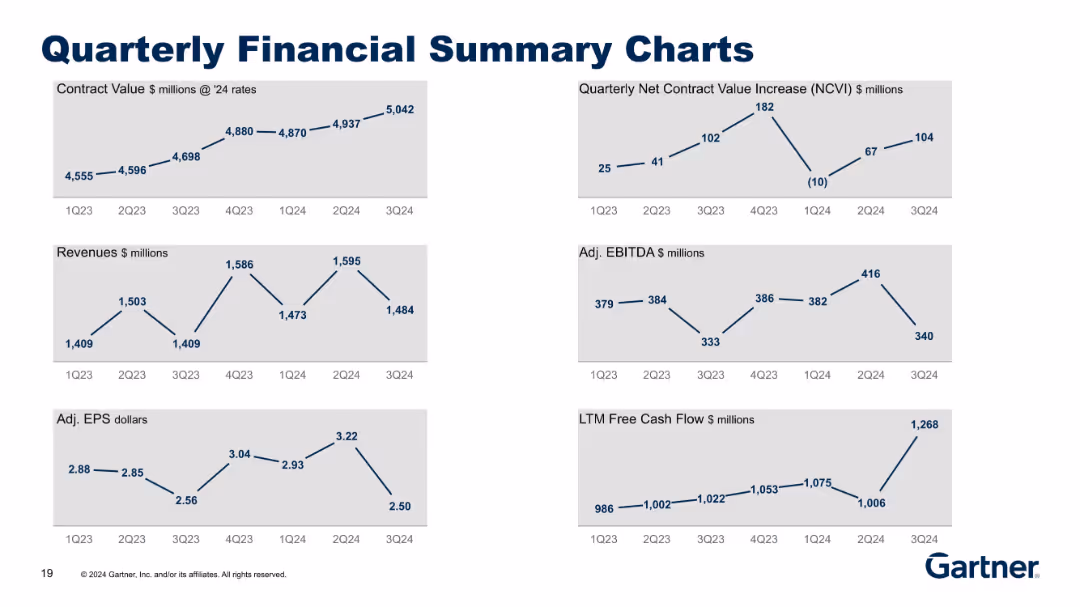
Six compact line graphs with blue data lines on a light gray background, organized in two rows and three columns.
Financial Performance
Financial Services
The slide provides a quarterly view of key financial metrics including Contract Value, Net Contract Value Increase, Revenues, Adjusted EBITDA, Adjusted EPS, and LTM Free Cash Flow. It highlights overall financial performance trends from 1Q23 to 3Q24.
Contract Value, Revenue, EBITDA, EPS, Cash Flow, Financial Metrics
false
Financial Performance
Financial Services
Multiple Chart
Gartner
Add to my slides
Remove from favorites
The slide features bar charts detailing different levers in controlling and finance, with a focus on activity levels and trends.
Financial Performance
Financial Services
Discusses key levers in controlling and finance, emphasizing efficiency improvements in back-office services and cost optimizations.
Controlling, Finance, Efficiency, Back-office, Trends
false
Financial Performance
Financial Services
Single Chart
Roland Berger
Add to my slides
Remove from favorites
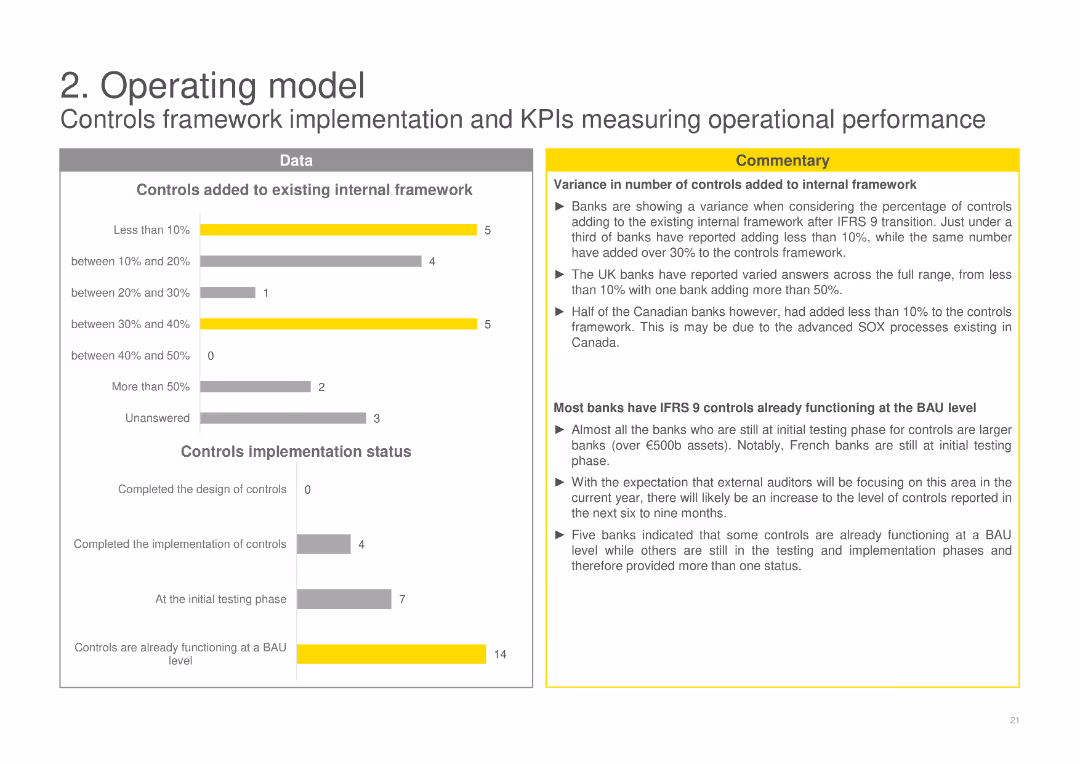
Features column charts on the number of controls added to the internal framework and their implementation status, with a commentary box analyzing the variances in control additions and implementation stages among banks.
Operational Efficiency
Financial Services
Reviews the addition of controls to internal frameworks and their implementation status post-IFRS 9, examining the variances in control enhancements and the stages of implementation across different banks.
controls framework, implementation status, IFRS 9, internal controls, financial services
false
Operational Efficiency
Financial Services
Multiple Chart
EY
Add to my slides
Remove from favorites
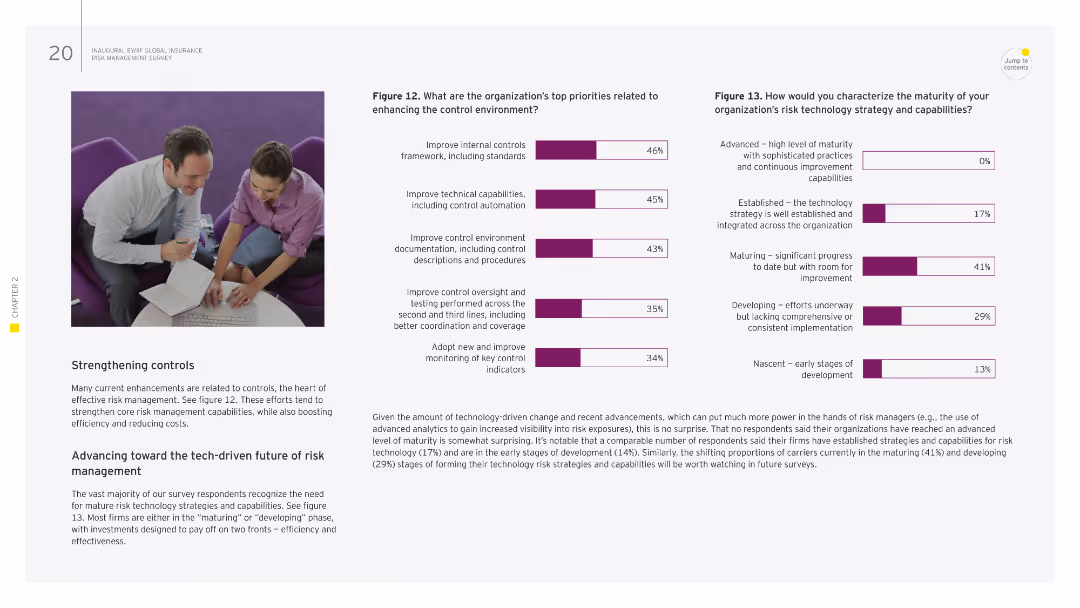
Image of two people reviewing documents. Column chart displaying the organization's top priorities related to enhancing the control environment on the right.
Risk Assessment and Management
Financial Services
This slide discusses priorities for enhancing control environments in organizations, including internal control frameworks, technical capabilities, and control environment documentation. It highlights the importance of strengthening controls and advancing towards tech-driven risk management.
controls, risk management, internal controls, technology, documentation
false
Risk Assessment and Management
Financial Services
Multiple Chart
EY
Add to my slides
Remove from favorites
A detailed slide with a numbered list of controversial topics regarding Web3. It has a blue and white color scheme and uses icons and large numbers to delineate sections.
Strategic Planning
Technology & Software
Outlines the controversial topics surrounding Web3, such as its reliability, patterns of adoption, enterprise integration, regulatory trust, and the impact of new models and the metaverse on existing systems.
Controversies, Web3, Enterprise Integration, Regulation
false
Strategic Planning
Technology & Software
Header Vertical
McKinsey
Add to my slides
Remove from favorites
A column chart showing conversion rates that increase from 2x to 15x across four steps labeled 1 to 4. Arrows between bars suggest progression and growth over time.
Investment Analysis
Financial Services
The slide depicts the growth in pilot conversion rates when investing based on initial learnings, demonstrating a significant increase through digital warming, corporate events, and relationship manager referrals.
Conversion rates, Investment, Growth, Corporate events, Digital warming
false
Investment Analysis
Financial Services
Single Chart
Goldman Sachs
Add to my slides
Remove from favorites
Includes column charts showing the adoption rates of different air conditioning technologies, alongside a column chart projecting future energy demands for cooling in Southeast Asia.
Market Analysis and Trends
Energy & Utilities
Discusses the potential for significant carbon abatement in Southeast Asia through the adoption of more efficient cooling technologies in residential AC systems, detailing the current low penetration rates and the high potential for improvement.
cooling, energy efficiency, SEA, carbon abatement
false
Market Analysis and Trends
Energy & Utilities
Multiple Chart
Bain
Add to my slides
Remove from favorites
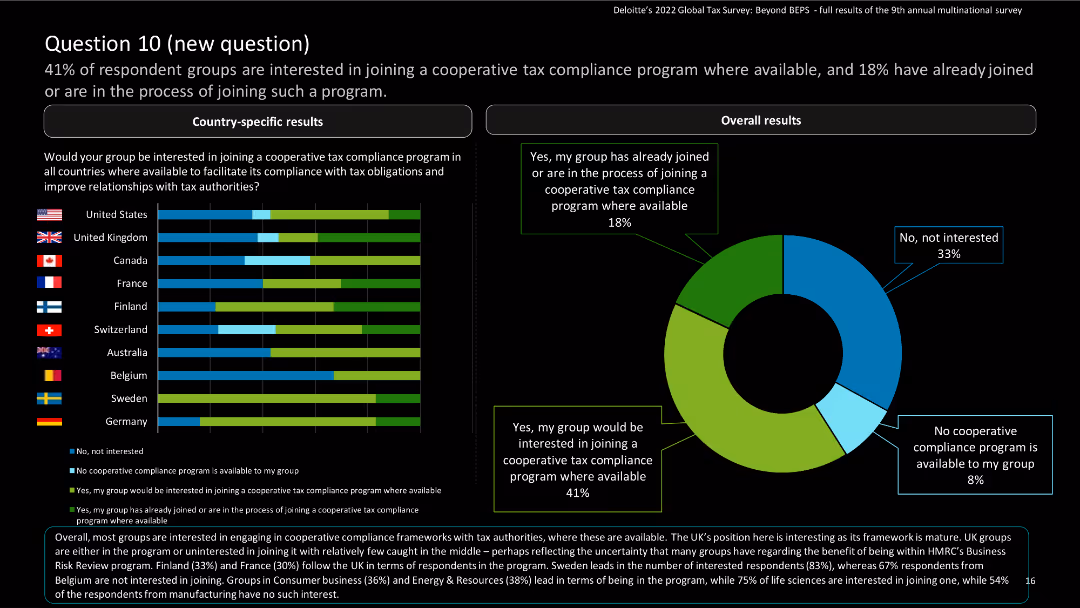
The slide features country-specific results and a pie chart showing overall results and response trend results over the years.
Regulatory and Compliance
Financial Services
The slide discusses interest in joining cooperative tax compliance programs to facilitate compliance and improve relationships with tax authorities.
Cooperative tax compliance, tax authorities, compliance, global tax, Deloitte, agree, strongly agree, survey, multinational
false
Regulatory and Compliance
Financial Services
Multiple Chart
Deloitte
Add to my slides
Remove from favorites
Features a structured checklist format outlining various governmental actions needed to meet COP26 ambitions, including strategies for decarbonization, energy transition costs, and green financing.
Regulatory and Compliance
Energy & Utilities
Details a comprehensive framework for government actions within SEA to build visibility and implement actionable plans that align with COP26 ambitions, focusing on regulatory, financial, and collaborative measures to facilitate the green transition.
COP26, Government Strategies, Decarbonization, SEA, Green Financing
false
Regulatory and Compliance
Energy & Utilities
Header Horizontal
Bain
Add to my slides
Remove from favorites
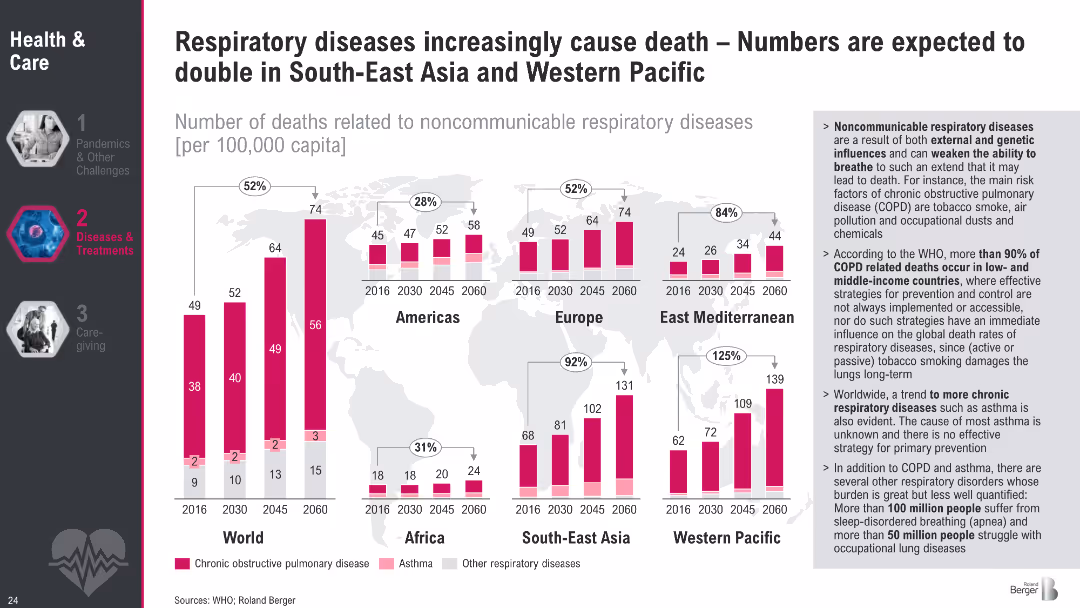
World map with bar charts per region showing death rates from respiratory diseases (2016–2060); sidebar with detailed insights; color-coded bars for disease types
Market Analysis and Trends
Healthcare & Pharmaceuticals
This slide presents global and regional projections of deaths from noncommunicable respiratory diseases, highlighting a sharp increase in South-East Asia and Western Pacific. It attributes the rise to environmental and behavioral risk factors and emphasizes disparities between high- and low-income countries.
COPD, respiratory diseases, regional projections, healthcare inequality, asthma, pollution, mortality, WHO, tobacco, healthcare trends
false
Market Analysis and Trends
Healthcare & Pharmaceuticals
Multiple Chart
Roland Berger
Add to my slides
Remove from favorites
Features a column chart detailing Copernicus contributions to air quality monitoring and its economic impacts.
Market Analysis and Trends
Environmental Services & Sustainability
Discusses the benefits and economic impacts of using Copernicus for air quality monitoring across different regions and its significance for health and environment.
Copernicus, air quality, health, economic impact, environmental monitoring, data accuracy, public health
false
Market Analysis and Trends
Environmental Services & Sustainability
Mixed Chart
PwC/Strategy&
Add to my slides
Remove from favorites
Slide features two column charts showing Copernicus economic impact with gradients of blue, and a list of key Copernicus products highlighted with icons.
Market Analysis and Trends
Environmental Services & Sustainability
Highlights economic impacts and key products of Copernicus for urban monitoring, focusing on data usage for city models and satellite imagery applications.
Copernicus, economic, urban, satellite, data monitoring, city modeling, environmental impact
false
Market Analysis and Trends
Environmental Services & Sustainability
Mixed Chart
PwC/Strategy&
Add to my slides
Remove from favorites
Features multiple data visualizations including a bar chart, a resource flow diagram, and detailed bullet points summarizing the economic benefits of Copernicus for the forestry sector. Visuals are complemented by text explaining each point.
Investment Analysis
Environmental Services & Sustainability
This slide details the economic impact of Copernicus data on forestry management, quantifying revenue enhancements and cost savings achieved through improved resource management and monitoring. It targets stakeholders considering investments in geospatial and EO data technologies.
Copernicus, forestry, economic benefits, EO data, resource management
false
Investment Analysis
Environmental Services & Sustainability
Mixed Chart
PwC/Strategy&
Add to my slides
Remove from favorites
Includes a column chart and detailed annotations discussing investments into Copernicus infrastructure and services. The layout is information-rich with clear visual breakdowns.
Investment Analysis
Environmental Services & Sustainability
Analyzes the investment into Copernicus by the European Commission and ESA, detailing the financial impacts and transactional impact on GDP. Valuable for financial analysis and understanding investment flows in space services.
Copernicus, investment, European Commission, ESA, GDP impact
false
Investment Analysis
Environmental Services & Sustainability
Mixed Chart
PwC/Strategy&
Add to my slides
Remove from favorites
Features a large column chart detailing 'Economic benefits of Copernicus through its contribution to oil and gas sector', complemented by a flow diagram and additional visual icons illustrating various sector impacts.
Investment Analysis
Energy & Utilities
Describes the significant economic benefits derived from Copernicus data for the oil and gas industry, emphasizing improved exploration capabilities and monitoring for environmental impacts.
Copernicus, Oil and Gas, Economic Benefits
false
Investment Analysis
Energy & Utilities
Mixed Chart
PwC/Strategy&
Add to my slides
Remove from favorites
This slide features timelines and a pie chart depicting the interest in Copernicus services by sector. It’s organized clearly with separated sections for textual and visual information.
Market Analysis and Trends
Environmental Services & Sustainability
Highlights the operational phases of Copernicus services and the growing interest across various sectors. Useful for discussions on space data applications and service adoption across different industries.
Copernicus, service adoption, space data, industry sectors, operational phases
false
Market Analysis and Trends
Environmental Services & Sustainability
Mixed Chart
PwC/Strategy&
Add to my slides
Remove from favorites
Slide presents diagrams and statistics in a visually segregated format, enhancing readability and focus on specific data points. The layout is effectively utilized to present complex data.
Strategic Planning
Environmental Services & Sustainability
Explores the potential expansion of Copernicus user base beyond traditional commercial markets, specifically targeting public authorities and academics. Useful for strategic planning in expanding market reach and user engagement.
Copernicus, user base, market expansion, public authorities, academics
false
Strategic Planning
Environmental Services & Sustainability
Multiple Chart
PwC/Strategy&
Add to my slides
Remove from favorites
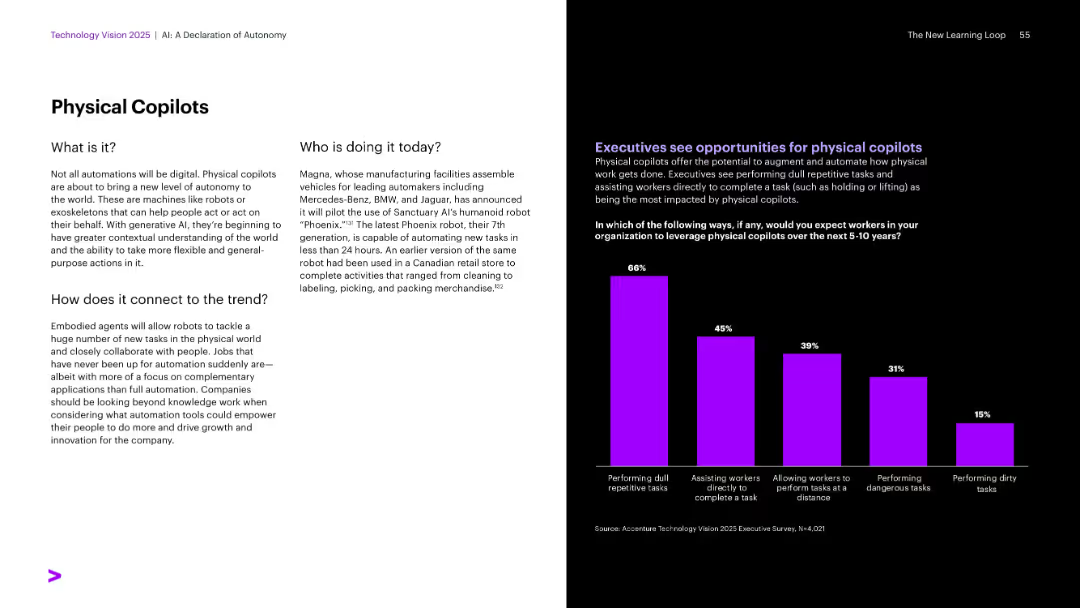
Standard split: text left, chart with purple bars right showing survey responses.
Operational Efficiency
Industrial & Manufacturing
Defines physical copilots (robots, exoskeletons) that collaborate with humans. It features Sanctuary AI’s Phoenix robot as an example and shows how executives expect to leverage these robots, especially for dull or repetitive tasks.
Copilots, physical automation, Sanctuary AI, Phoenix robot, collaboration
false
Operational Efficiency
Industrial & Manufacturing
Mixed Chart
Accenture
Add to my slides
Remove from favorites
This slide includes a line and column chart illustrating the cumulative copper demand from electric vehicles and wind turbines up to 2035, with predictions for various scenarios.
Market Analysis and Trends
Industrial & Manufacturing
The slide explores the impact of emerging technologies on the demand for copper, focusing on the requirements from electric vehicles and wind turbines through to 2035.
copper, demand, technology, electric vehicles, wind turbines, 2035, line chart
false
Market Analysis and Trends
Industrial & Manufacturing
Multiple Chart
McKinsey
Add to my slides
Remove from favorites
The slide contains a column chart showing the global refined copper market trends, with lines representing supply and demand, and column charts showing the annual supply-demand balance.
Industry Overview
Industrial & Manufacturing
The slide provides an analysis of the copper market's balance between supply and demand from 2011 to 2021, projecting trends and identifying minor discrepancies in supply versus demand.
copper market, supply, demand, balance, projections, line chart, column chart
false
Industry Overview
Industrial & Manufacturing
Mixed Chart
McKinsey
Add to my slides
Remove from favorites
This slide features a mixed chart with bars representing the industry wallet in advisory, equity, and debt, and a line indicating Goldman Sachs Fee Share. Annotations explain the growth strategy.
Market Analysis and Trends
Financial Services
Discussing the company's core business areas, the slide details the growth in market share across advisory, equity, and debt segments. It quantifies the financial implications of increasing market share, outlining strategic priorities for sector and regional expansion, and capturing acquisition financing opportunities.
Core Business, Market Share, Advisory, Equity, Debt, Growth Strategy
false
Market Analysis and Trends
Financial Services
Mixed Chart
Goldman Sachs
Add to my slides
Remove from favorites
It features a line chart with multiple data series showing core inflation rates over two decades for the US, Eurozone, and UK. The slide has a white background with minimal design elements.
Market Analysis and Trends
Financial Services
Presenting a longitudinal view of core inflation trends, this slide is instrumental in understanding persistent inflation across various economies. It's valuable for financial analysts and economists for long-term planning and policy development, especially considering recent spikes in the inflation data.
Core Inflation, Trend, US, Eurozone, UK, Long-Term, Finance, Policy, 2023
false
Market Analysis and Trends
Financial Services
Single Chart
JP Morgan
Add to my slides
Remove from favorites
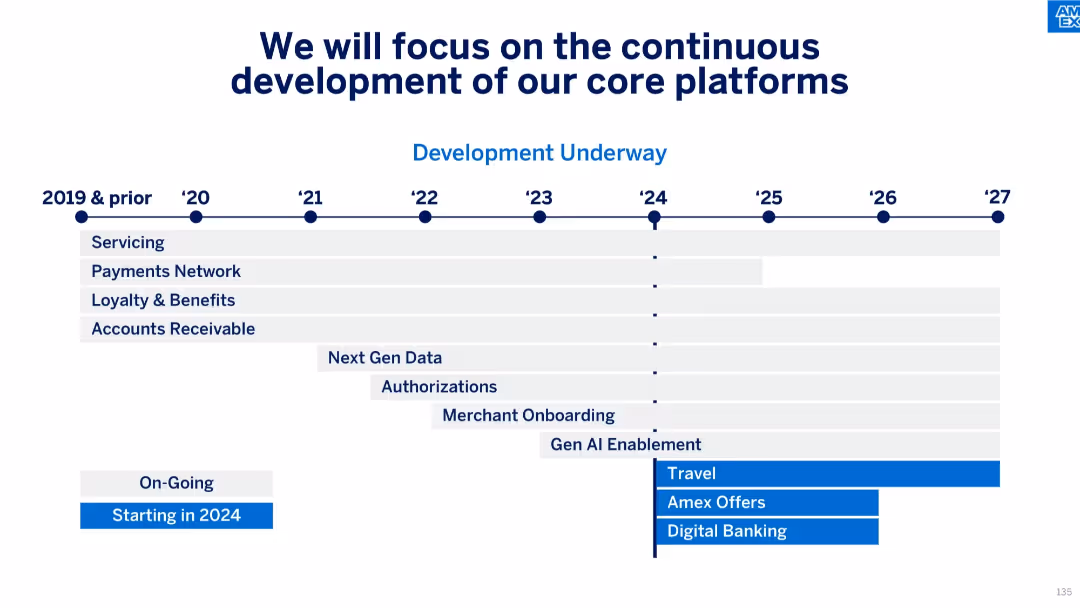
Timeline diagram mapping multi-year platform development initiatives from 2019 to 2027, categorized by function (e.g., Servicing, Payments Network, Gen AI Enablement), with new initiatives starting in 2024.
Technology and Digital Transformation
Technology & Software
This roadmap slide outlines key platform developments over time, highlighting areas such as payments, servicing, AI enablement, and onboarding. Several strategic initiatives begin in 2024, including digital banking and Amex Offers, showing a continued commitment to tech evolution.
core platforms, roadmap, platform development, AI enablement, digital banking, tech investment, transformation, timeline
false
Technology and Digital Transformation
Technology & Software
Table
McKinsey
Add to my slides
Remove from favorites
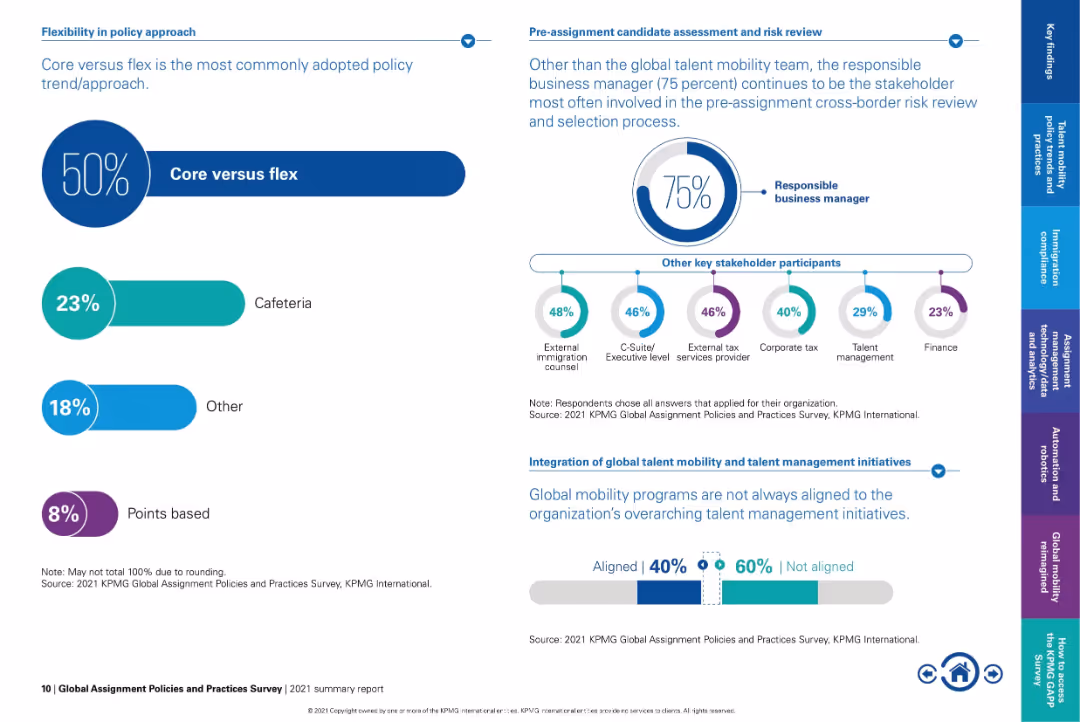
Dual-panel layout: left side uses percentage bars, right side uses circular infographic and icon chart.
Organizational Structure and Change
Professional Services
Highlights the growing preference for the "core versus flex" approach in mobility policy, with 50% of organizations adopting it. Also shows stakeholder involvement in risk review and notes the lack of integration between mobility and talent management initiatives.
core vs flex, stakeholder roles, mobility policy, risk review, talent alignment, global mobility strategy, executive involvement
false
Organizational Structure and Change
Professional Services
Multiple Chart
KPMG
Add to my slides
Remove from favorites
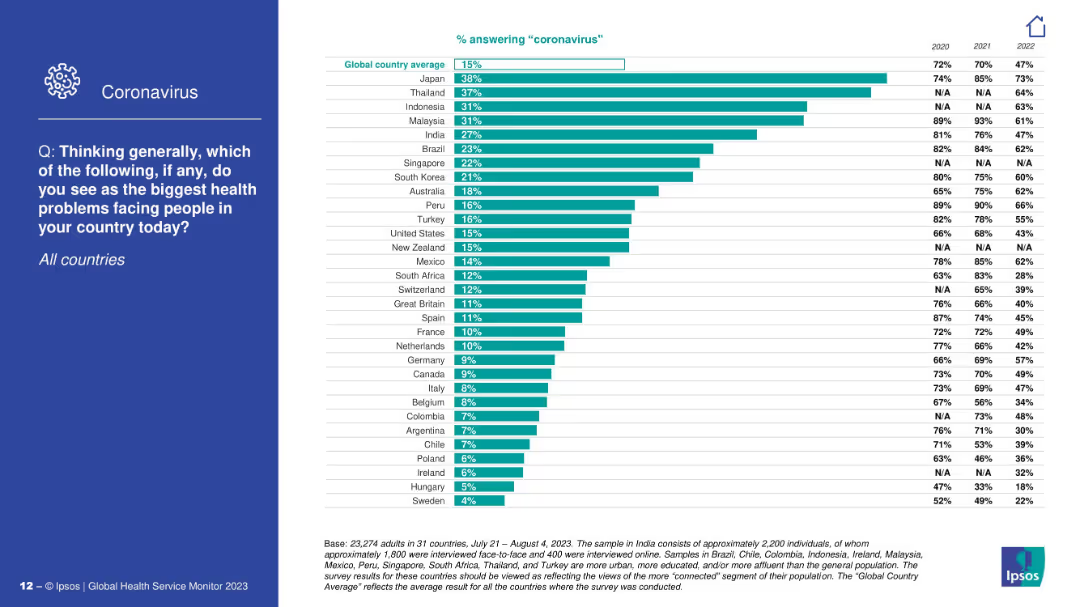
Similar format to 19141: left panel with a question and icon; right side shows a horizontal bar chart by country.
Market Analysis and Trends
Healthcare & Pharmaceuticals
This slide shows the percentage of respondents per country who consider coronavirus to be a leading health concern. Japan and Thailand top the list. The global average has decreased significantly since the peak of the pandemic.
coronavirus, COVID-19, public concern, health issues, survey, trends, pandemic perception, global comparison
false
Market Analysis and Trends
Healthcare & Pharmaceuticals
Mixed Chart
IPSOS
Add to my slides
Remove from favorites
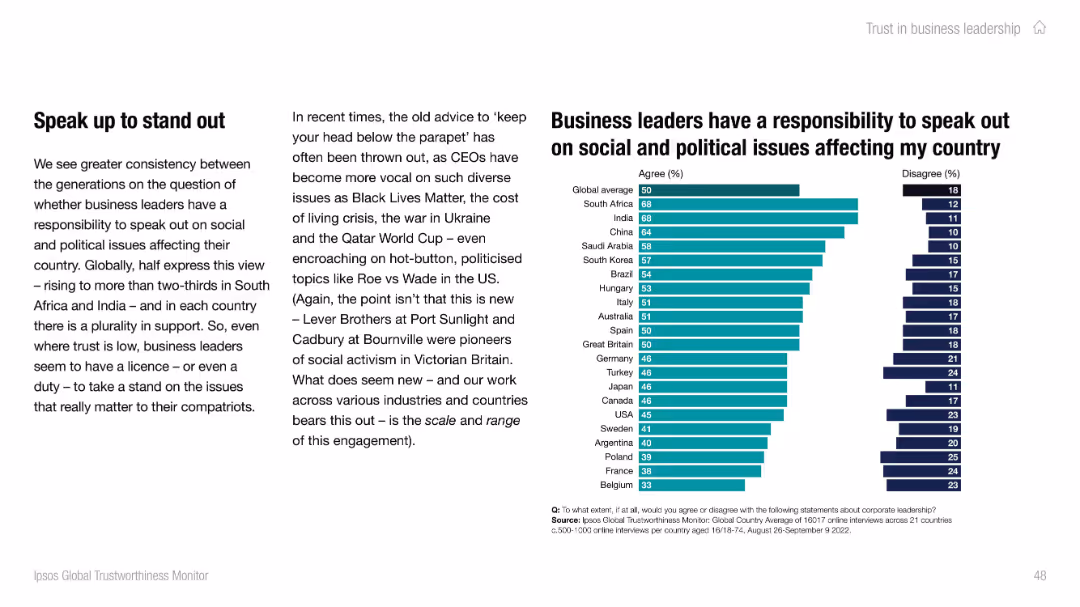
Left text explains trend toward corporate activism; right-side bar chart shows agreement levels across countries. Uses teal and navy for agree/disagree.
Strategic Planning
Professional Services
Illustrates global attitudes about business leaders’ responsibility to address social and political issues. Over two-thirds in South Africa and India agree with this role. Slide notes the growing visibility and expectation of activism among CEOs across regions.
corporate activism, leadership, Ipsos, social issues, responsibility, global sentiment
false
Strategic Planning
Professional Services
Mixed Chart
IPSOS
Add to my slides
Remove from favorites
The slide includes a title and a column chart listing the top attributes deemed essential for corporate affairs functions. It features text explaining the importance of trust, good judgment, and resilience, using a professional layout with white and yellow colors.
Organizational Structure and Change
Professional Services
This slide details the critical attributes identified by corporate affairs directors as essential for their functions, including trust, good judgment, and resilience. It explains the significance of these attributes in managing corporate affairs effectively.
corporate affairs, critical attributes, trust, good judgment, resilience, organizational success, leadership
false
Organizational Structure and Change
Professional Services
Mixed Chart
Deloitte
Add to my slides
Remove from favorites
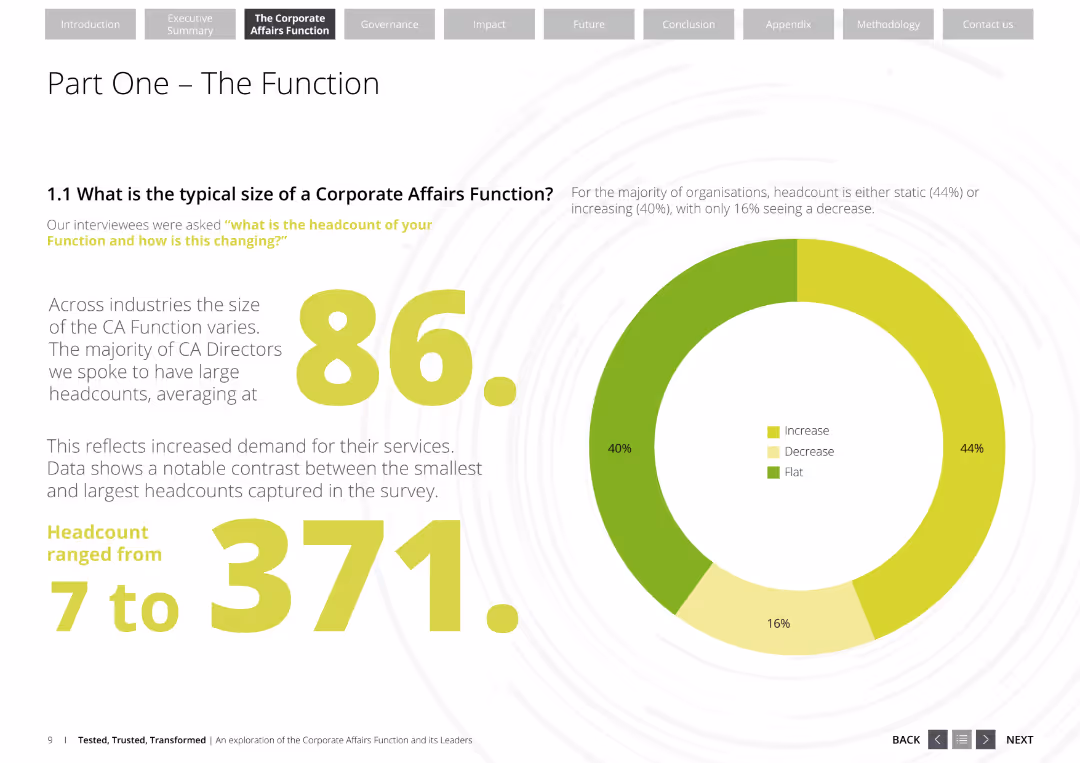
The slide has a title and a column chart showing headcount ranges for corporate affairs functions across different organizations. It includes a pie chart illustrating headcount trends (increase, decrease, flat) and uses a professional layout with white and yellow colors.
Organizational Structure and Change
Professional Services
This slide provides an overview of the typical size of corporate affairs functions across industries, showing headcount ranges and trends. It highlights the demand for corporate affairs services and differences in headcount size among organizations.
corporate affairs, headcount, organizational structure, industry trends, corporate services, survey data
false
Organizational Structure and Change
Professional Services
Mixed Chart
Deloitte
Add to my slides
Remove from favorites
Previous
Next
You don't have any favorites yet.
Please wait loading your favorites slides...
Create a FREE account to continue browsing
Receive Instant Access to 1,000+ slides from companies like McKinsey, Google, and Goldman Sachs
First Name
Last Name
Email
Password
I agree to all
Terms & Privacy Policy
Thank you! Your submission has been received!
Oops! Something went wrong while submitting the form.
Have an account?
Sign in
Upgrade to PRO to Save slides
Advanced Search and Filters
Access to 15,000+ slides
Access to Category Pages
Save/Bookmark Slides
PowerPoint Template Library
Pick a Plan
MONTHLY
$12/month
Billed every month, Cancel anytime.
YEARLY
$9/year
Billed $108 annually, Cancel anytime.
Checkout for $12/month
Checkout for $108/yr
Secured by Stripe | AES-256 bit encryption