My Account
My Slides
Search by Category
Companies
Slide Type
Use Case
Industry
Pricing
Templates
View All Templates
Download Template Slides
✦ AI
AI Prompt Library
AI Search
Feedback
Login
Logout
Get Started
Browse all Slides
Browse all Slides
Create a FREE Account
Instant access to 1,000+ real slides from top companies like McKinsey, BCG, Goldman Sachs, Google and many more!
First Name
Last Name
Email
Password
I agree to all
Terms & Privacy Policy
Thank you! Your submission has been received!
Oops! Something went wrong while submitting the form.
Have an account?
Sign in
Saved Slides
Total No. of slides saved
0
↻ Refresh
✖ Clear all
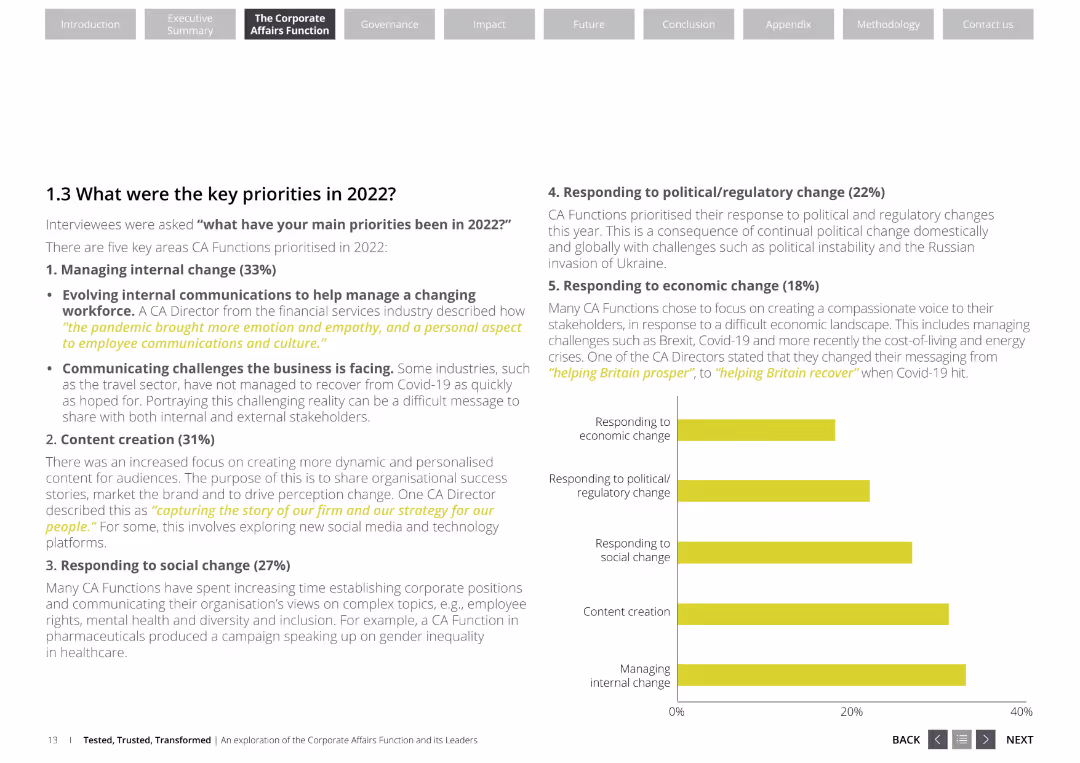
The slide features a list of key priorities for corporate affairs functions, including managing internal change, content creation, responding to social change, political/regulatory change, and economic change. It uses a professional layout with white and yellow colors.
Strategic Planning
Professional Services
This slide outlines the key priorities for corporate affairs functions in 2022, emphasizing areas like internal change management, content creation, and responses to social, political, and economic changes. It highlights the focus areas for corporate affairs directors.
corporate affairs, key priorities, internal change, content creation, social change, political change, economic change
false
Strategic Planning
Professional Services
Mixed Chart
Deloitte
Add to my slides
Remove from favorites
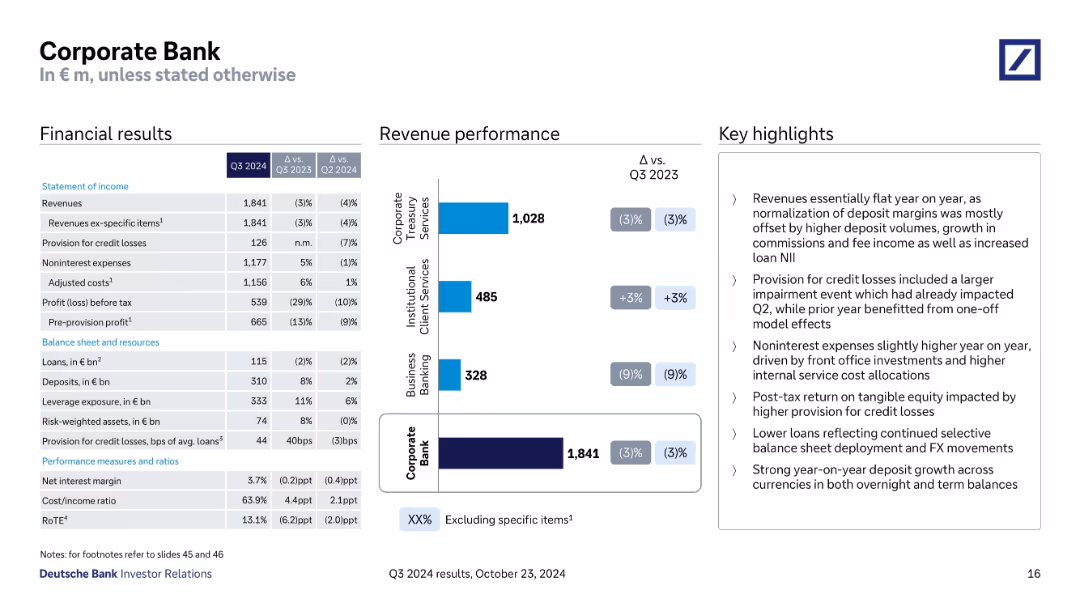
Split into financial results table, revenue chart, and highlights; detailed KPI breakdown.
Financial Performance
Financial Services
Covers Q3 2024 performance of the Corporate Bank, including revenue declines, cost management, credit loss provisions, and segment revenue breakdown. Discusses deposit growth, margin normalization, and internal service cost increases.
Corporate Bank, deposit growth, credit losses, revenue mix, RoTE
false
Financial Performance
Financial Services
Mixed Chart
Deutsche Bank
Add to my slides
Remove from favorites
Consists of bar graphs and a summary table detailing financial results and key performance indicators.
Financial Performance
Financial Services
Focuses on the financial outcomes of Q4 2023, showing changes in revenue and expenses, suitable for evaluating operational efficiency and financial health.
corporate bank, financial results, Q4, revenue, expenses
false
Financial Performance
Financial Services
Mixed Chart
Deutsche Bank
Add to my slides
Remove from favorites
The slide features a pie chart and a column chart depicting the portfolio growth and composition of the corporate bank.
Strategic Planning
Financial Services
The slide details how the corporate bank supports IBCM and GM clients through loan origination and portfolio management, showing growth data.
corporate bank, IBCM, GM, loans, portfolio, relationships, revenue, strategic planning, growth
false
Strategic Planning
Financial Services
Multiple Chart
Credit Suisse
Add to my slides
Remove from favorites
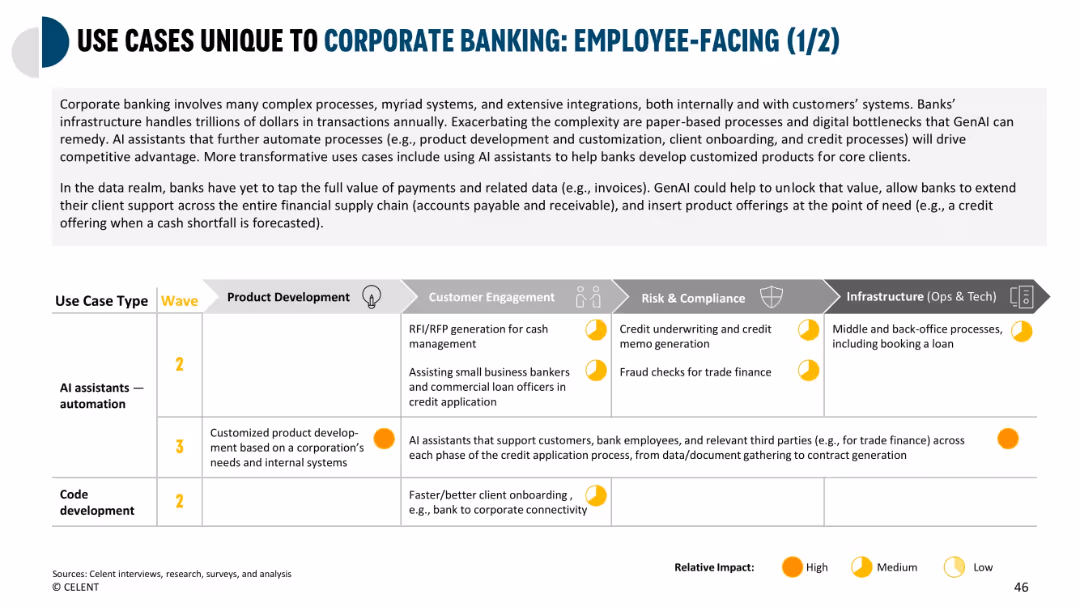
Large grid format categorizing corporate use cases by department, wave, and impact level.
Product and Service Analysis
Financial Services
Explores how GenAI can be used in corporate banking for product development, onboarding, and credit underwriting. Emphasizes the value in automating RFP responses and customizing offerings based on business needs.
corporate banking, GenAI, product development, onboarding, underwriting, credit processing
false
Product and Service Analysis
Financial Services
Mixed Chart
Oliver Wyman
Add to my slides
Remove from favorites
The slide features stacked column charts comparing the proportion of clients in different global regions and their engagement with Barclays’ corporate banking services.
Strategic Planning
Financial Services
Discusses the strategic integration of corporate banking services globally, highlighting client engagement and the potential for capital efficient growth.
corporate banking, global strategy, client engagement, growth, integration
false
Strategic Planning
Financial Services
Mixed Chart
Barclays
Add to my slides
Remove from favorites
This slide displays multiple tables and a bar chart detailing financial statistics such as revenues, deposits, and loans, categorized by business sector.
Financial Performance
Financial Services
Reviews the performance of Deutsche Bank's Corporate Banking sector, detailing earnings, expense management, and resource allocation for Q3 2023.
corporate banking, revenue analysis, financial performance, deposits, loans
false
Financial Performance
Financial Services
Mixed Chart
Deutsche Bank
Add to my slides
Remove from favorites
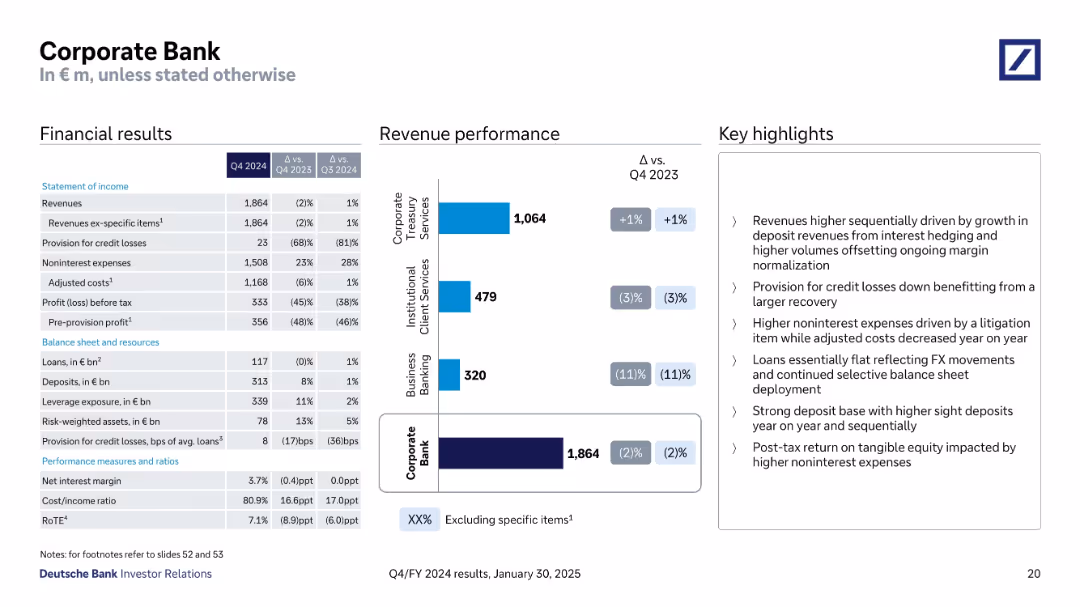
Three-panel format: financial results (left table), revenue performance (center bar chart), and key highlights (right).
Product and Service Analysis
Financial Services
Provides Q4 2024 financial and operational data for the Corporate Bank segment. Breaks down revenue by sub-segments and highlights margin trends, credit loss provisions, and cost movement. Notes deposit growth and impact from litigation on expenses.
corporate banking, revenue, deposit growth, litigation, segment analysis
false
Product and Service Analysis
Financial Services
Mixed Chart
Deutsche Bank
Add to my slides
Remove from favorites
Split layout: income table, bar chart of revenues by segment, and bullet highlights
Financial Performance
Financial Services
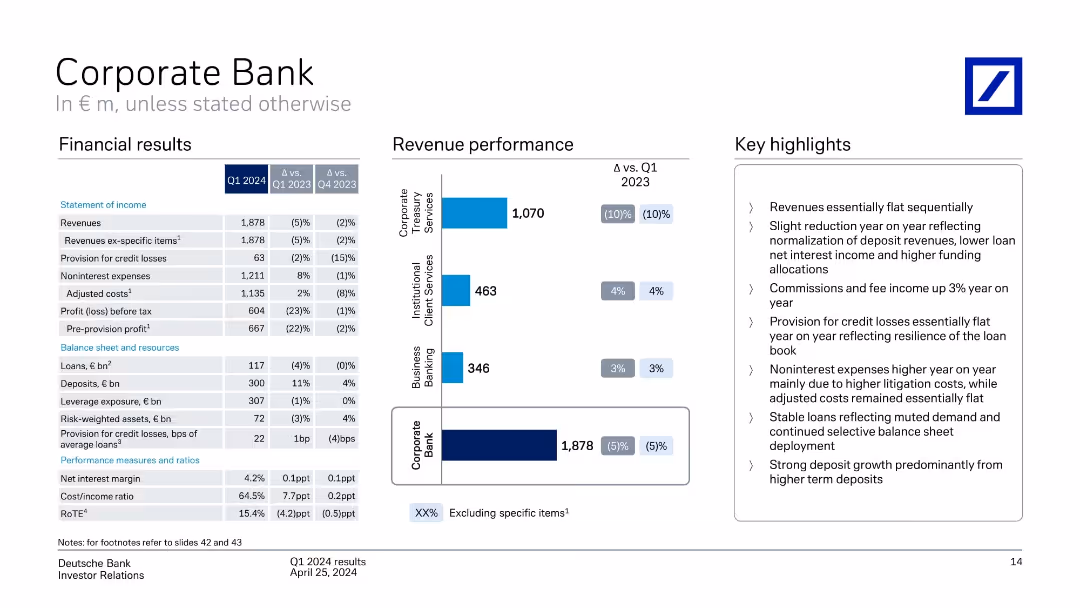
Q1 2024 financial results for the Corporate Bank, with YoY and QoQ comparisons. Shows revenue sources, expenses, and profit before tax. Highlights include flat revenues, resilient loan book, and strong term deposit growth.
corporate banking, revenue, expenses, deposits, loans, credit losses
false
Financial Performance
Financial Services
Mixed Chart
Deutsche Bank
Add to my slides
Remove from favorites
Includes several tables and bar chart outlining financial results and revenue performance for Deutsche Bank's Corporate Bank. Dense textual annotations and percentage changes are detailed beside each graphical representation.
Financial Performance
Financial Services
This slide details the Q2 2023 financial and revenue performance of Deutsche Bank's Corporate Bank, highlighting significant figures such as revenue growth, profit before tax, and changes in loans and deposits.
Corporate banking, revenue growth, financial performance, Q2 2023, profit analysis, Deutsche Bank
false
Financial Performance
Financial Services
Mixed Chart
Deutsche Bank
Add to my slides
Remove from favorites
The slide includes a pie chart and column chart showing the portfolio industry concentration, loan maturity profile, and exposure by security type.
Operational Efficiency
Financial Services
The slide provides an overview of the corporate bank's portfolio, highlighting its diversification, maturity profile, and security exposure.
corporate bank, portfolio, overview, industry concentration, loan maturity, security type, diversification, exposure
false
Operational Efficiency
Financial Services
Multiple Chart
Credit Suisse
Add to my slides
Remove from favorites
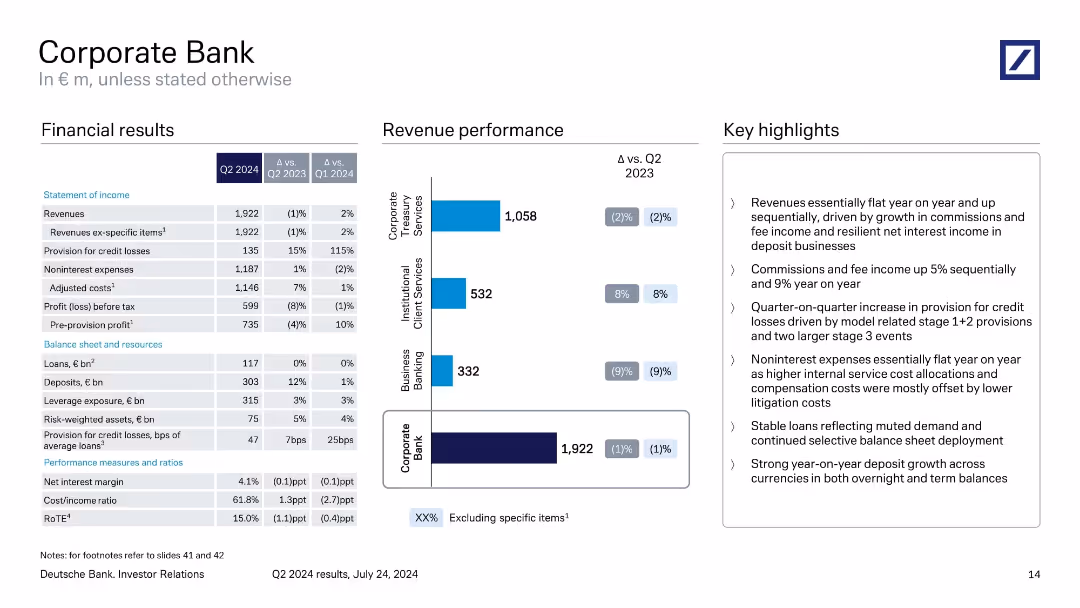
Three-column layout with financial table, revenue bar chart, and key highlights.
Product and Service Analysis
Financial Services
Reviews Q2 2024 performance of the Corporate Bank division. Highlights include flat revenue, rising provisions for credit losses, steady expenses, and growth in deposits. Segment-level revenue performance for treasury, institutional, and business banking is visualized.
Corporate Bank, Q2 2024, revenue, credit losses, business banking, Deutsche Bank
false
Product and Service Analysis
Financial Services
Mixed Chart
Deutsche Bank
Add to my slides
Remove from favorites
Includes bar and tables detailing revenue performance and financial metrics for the Corporate Bank segment, alongside key financial highlights.
Financial Performance
Financial Services
Highlights the financial performance of the Corporate Bank division, noting significant areas of revenue growth and cost management.
Corporate Bank, revenue, costs, performance
false
Financial Performance
Financial Services
Mixed Chart
Deutsche Bank
Add to my slides
Remove from favorites
A column chart comparing revenue performance across segments, a table of financial results, and key highlights. The slide is moderately dense with a balanced mix of text and visual elements.
Financial Performance
Financial Services
This slide provides an overview of the Corporate Bank's Q1 2024 financial results, including revenue, profit, and other key metrics, comparing them across different business segments.
Corporate Bank, revenue performance, financial results, Q1 2024, business segments
false
Financial Performance
Financial Services
Mixed Chart
Deutsche Bank
Add to my slides
Remove from favorites
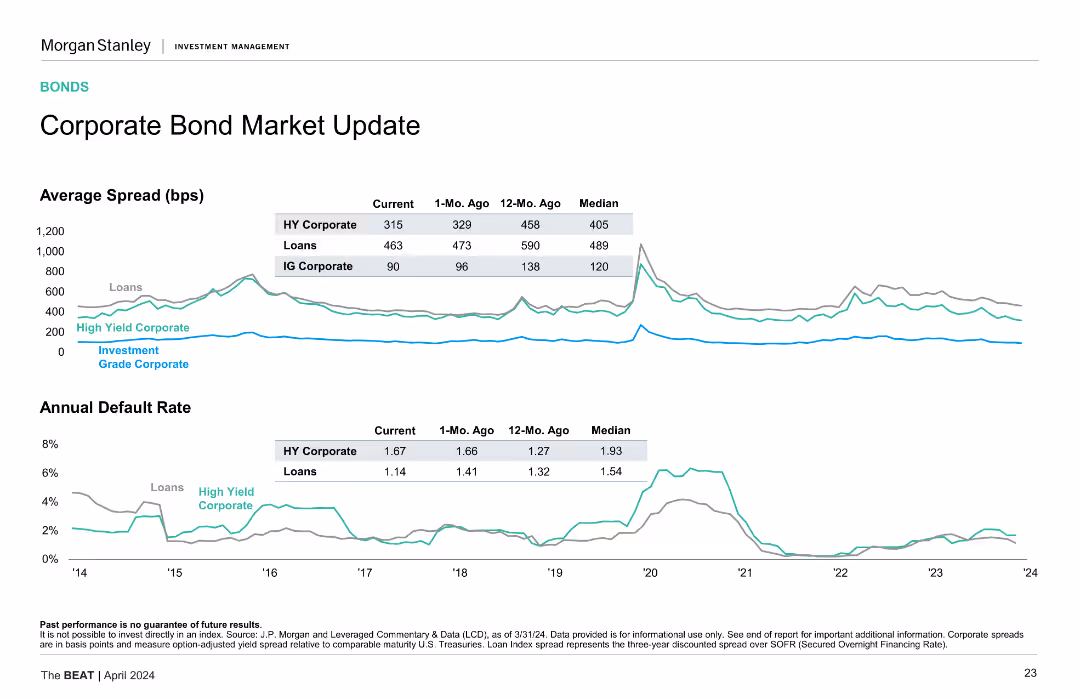
The slide features two line charts. The first chart shows the average spread (bps) of HY Corporate, Loans, and IG Corporate bonds. The second chart displays the annual default rate of HY Corporate and Loans. Both charts have legends and data points for Current, 1-Mo. Ago, 12-Mo. Ago, and Median values.
Market Analysis and Trends
Financial Services
The slide provides an update on the corporate bond market, showcasing the average spread and annual default rate for different bond categories over time.
Corporate bonds, average spread, default rate, HY Corporate, IG Corporate, Loans
false
Market Analysis and Trends
Financial Services
Multiple Chart
Morgan Stanley
Add to my slides
Remove from favorites
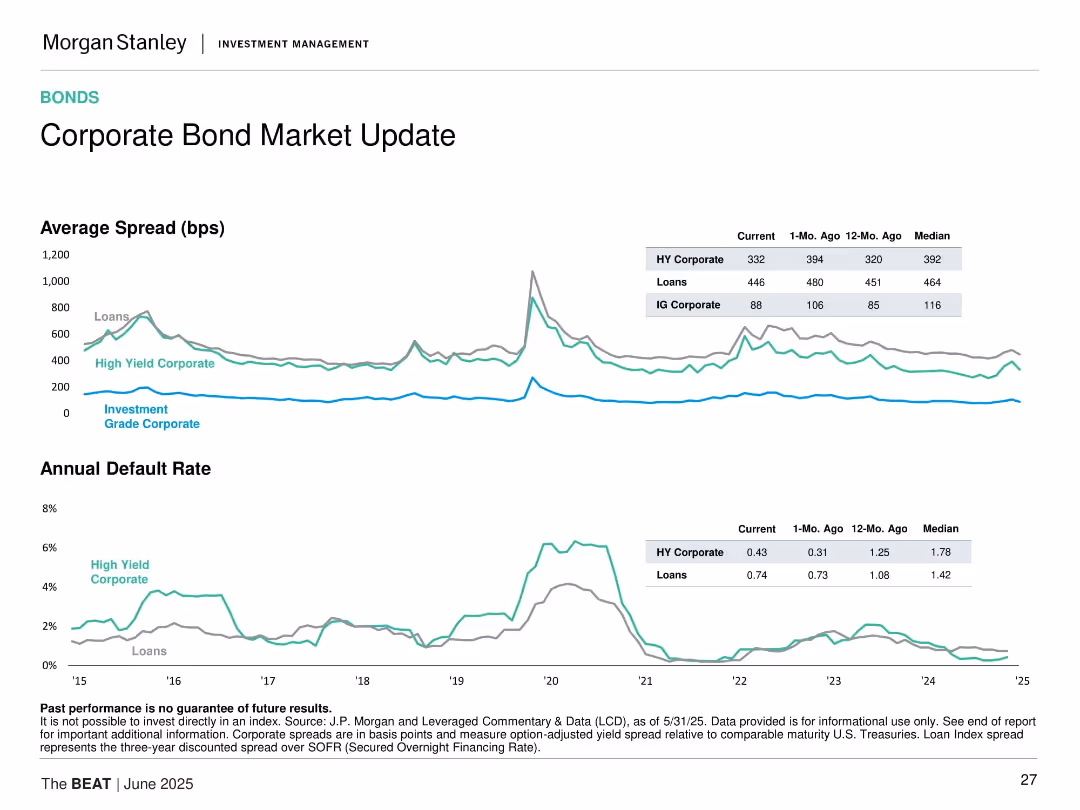
Line charts displaying average spread and annual default rate for high yield, investment grade corporate bonds, and loans over time.
Market Analysis and Trends
Financial Services
Updates on corporate bond markets showing average spread and default rates, comparing current data with past months and years.
Corporate Bonds, Default Rates, Market Update, Financial Metrics, High Yield Bonds
false
Market Analysis and Trends
Financial Services
Multiple Chart
Morgan Stanley
Add to my slides
Remove from favorites
Line charts showing average spread and annual default rate for high yield and investment grade corporate bonds.
Market Analysis and Trends
Financial Services
Provides update on corporate bond markets with focus on high yield and investment grade bonds, showing spreads and default rates, aiding investment decisions.
Corporate bonds, default rates, spreads
false
Market Analysis and Trends
Financial Services
Multiple Chart
Morgan Stanley
Add to my slides
Remove from favorites
The slide includes two line charts showing average spreads and annual default rates for different types of corporate bonds and loans.
Market Analysis and Trends
Financial Services
This slide gives an update on the corporate bond market, showing the average spreads and default rates, helping investors understand market conditions.
Corporate Bonds, Market Update, Spreads, Default Rates, Investments
false
Market Analysis and Trends
Financial Services
Multiple Chart
Morgan Stanley
Add to my slides
Remove from favorites
Includes two line graphs tracking the average spread and annual default rate over time, with color coding to distinguish between loans and high yield corporate data.
Risk Assessment and Management
Financial Services
Analyzes the risk in the corporate bond market by displaying historical trends in credit spreads and default rates, useful for assessing the volatility and stability of the bond market.
corporate bonds, risk assessment, default rate, line graphs, credit spreads, market analysis
false
Risk Assessment and Management
Financial Services
Multiple Chart
Morgan Stanley
Add to my slides
Remove from favorites
The slide features two line charts showing average spread and annual default rate for high yield corporate, loans, and investment-grade corporate bonds.
Market Analysis and Trends
Financial Services
The slide provides a market update on corporate bonds, detailing spread trends and default rates. Useful for bond market analysis.
corporate bonds, spread, default rate, market update, financial analysis
false
Market Analysis and Trends
Financial Services
Multiple Chart
Morgan Stanley
Add to my slides
Remove from favorites
Two line charts showing spread and default rate trends for HY and IG corporates and loans; includes supporting table.
Performance Metrics and KPIs
Financial Services
Presents spread trends and annual default rates for high yield, investment grade corporates, and loans. Highlights changes in spreads and default risks.
corporate bonds, spreads, default rate, loans, high yield, investment grade, performance, market trends
false
Performance Metrics and KPIs
Financial Services
Multiple Chart
Morgan Stanley
Add to my slides
Remove from favorites
Contains structured text with icons highlighting services for corporate clients and efficiency measures.
Sales and Business Development
Financial Services
Discusses extending offerings and improving sales processes to drive growth among corporate and institutional clients.
corporate clients, digital business, sales growth, efficiency, analytics
false
Sales and Business Development
Financial Services
Diagram
UBS
Add to my slides
Remove from favorites
The slide includes text discussing the inevitability of crises, a circular graph showing the percentage of respondents who have experienced crises in the past five years, and key statistics about crisis frequency.
Risk Assessment and Management
Professional Services
This slide emphasizes the prevalence and inevitability of corporate crises, supported by survey data indicating that nearly 70% of leaders have faced multiple crises recently.
Corporate crisis, inevitability, survey data, crisis frequency, risk management
false
Risk Assessment and Management
Professional Services
Mixed Chart
PwC/Strategy&
Add to my slides
Remove from favorites
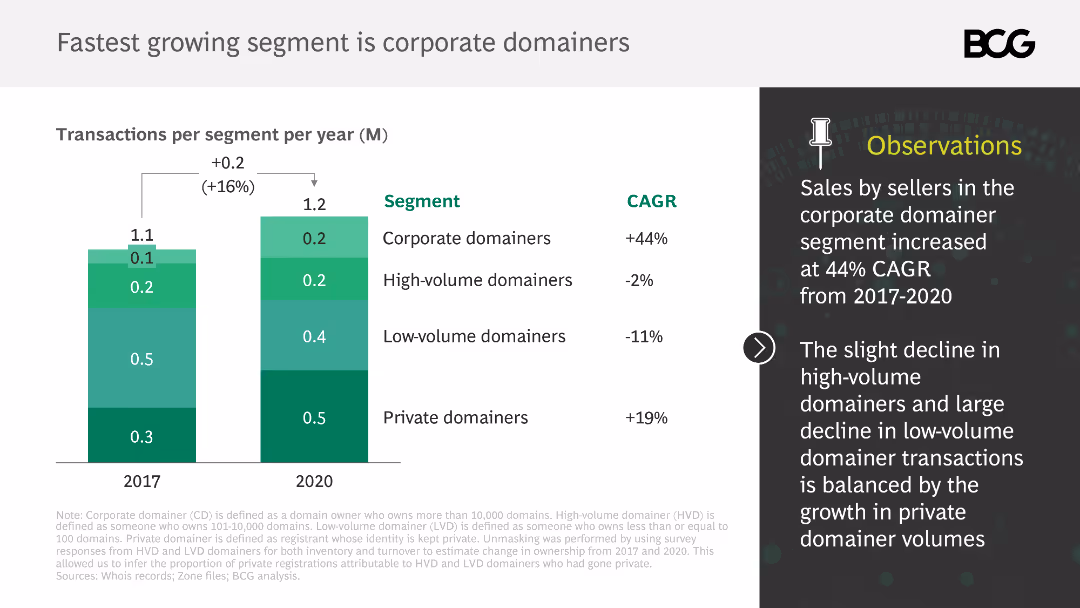
This slide presents a column chart comparing transactions per segment (corporate, high-volume, low-volume, private domainers) from 2017 to 2020. Observations are listed.
Market Analysis and Trends
Retail & E-commerce
It identifies the corporate domainer segment as the fastest-growing, with significant increases in transactions, while highlighting changes in other segments.
corporate domainers, transactions, growth, segments, market analysis
false
Market Analysis and Trends
Retail & E-commerce
Mixed Chart
BCG
Add to my slides
Remove from favorites
The slide contains column charts comparing expected EPS growth for regions/styles and S&P 500 sectors, highlighting significant differences.
Financial Performance
Financial Services
This slide analyzes expected corporate earnings growth, comparing different regions and S&P 500 sectors, providing insights into potential financial performance.
Corporate Earnings, EPS Growth, Regions, S&P 500 Sectors, Financial Performance
false
Financial Performance
Financial Services
Multiple Chart
Morgan Stanley
Add to my slides
Remove from favorites
Pie charts displaying the percentages of companies engaging in public and private actions in response to a Supreme Court decision. Each chart shows a small minority engaging actively.
Customer and Market Segmentation
Professional Services
This slide presents data on corporate responses to a controversial Supreme Court decision, highlighting a general reluctance to take public stands, with slightly more openness towards private actions.
Corporate Ethics, Supreme Court, Roe vs Wade, Public Actions, Private Actions, Pie Chart, Survey Data
false
Customer and Market Segmentation
Professional Services
Multiple Chart
Deloitte
Add to my slides
Remove from favorites
The slide includes a line chart depicting the All Share Index (ASI) percentage changes over time. Below the chart are key insights and outlooks, emphasizing the impact of corporate exits and financial results on market performance.
Financial Performance
Financial Services
The slide analyzes market performance in 2023, focusing on factors like corporate exits, financial results, and the FTSE Russell downgrade. It provides insights into how these elements influenced the All Share Index and overall market trends.
corporate exits, financial results, FX revaluation, FTSE Russell, market performance
false
Financial Performance
Financial Services
Mixed Chart
PwC/Strategy&
Add to my slides
Remove from favorites
Contains bar charts and financial summaries that detail profit and loss figures, enriched with notes explaining factors impacting the results, such as shareholder expenses and valuation adjustments.
Financial Performance
Financial Services
This slide covers the Q2 2023 financial results for Deutsche Bank's Corporate & Other segment, focusing on losses and specific financial impacts including shareholder expenses and provisions.
Corporate finance, financial losses, shareholder expenses, profit and loss analysis, Deutsche Bank, Q2 2023
false
Financial Performance
Financial Services
Mixed Chart
Deutsche Bank
Add to my slides
Remove from favorites
Contains a mix of bar charts and tables depicting financial metrics like revenues and costs, alongside textual annotations and a simple, professional color scheme.
Financial Performance
Financial Services
This slide covers the financial outcomes for the Corporate & Other segment, detailing losses and expenses with key highlights noted.
corporate finance, losses, expenses, financial results, Q4 2023
false
Financial Performance
Financial Services
Mixed Chart
Deutsche Bank
Add to my slides
Remove from favorites
The slide uses bullet points and column charts to present financial results and losses. The layout is information-dense.
Financial Performance
Financial Services
Focused on the "Corporate & Other" segment of a financial institution, this slide shows detailed financial results including profits and losses, adjustments, and expenses. It is intended for financial analysts and management to evaluate the impact of non-core activities on the overall financial health of the institution, with specific attention to shareholder expenses, legacy portfolios, and valuation adjustments.
Corporate Finance, Losses, Profits, Financial Reporting, Analysis
false
Financial Performance
Financial Services
Mixed Chart
Deutsche Bank
Add to my slides
Remove from favorites
This slide is a visual summary with three sets of paired bar graphs showing the current coverage of financial services against the total eligible employees in executive, personal, and wellness financial management. The graphs use shades of blue with white text.
Operational Efficiency
Financial Services
Displays the extent of financial management services provided by Goldman Sachs to corporate employees, relative to the total eligible. It is useful for discussions on market penetration and service expansion strategies within corporate financial management sectors.
Corporate, Financial Management, Employees, Coverage
false
Operational Efficiency
Financial Services
Mixed Chart
Goldman Sachs
Add to my slides
Remove from favorites
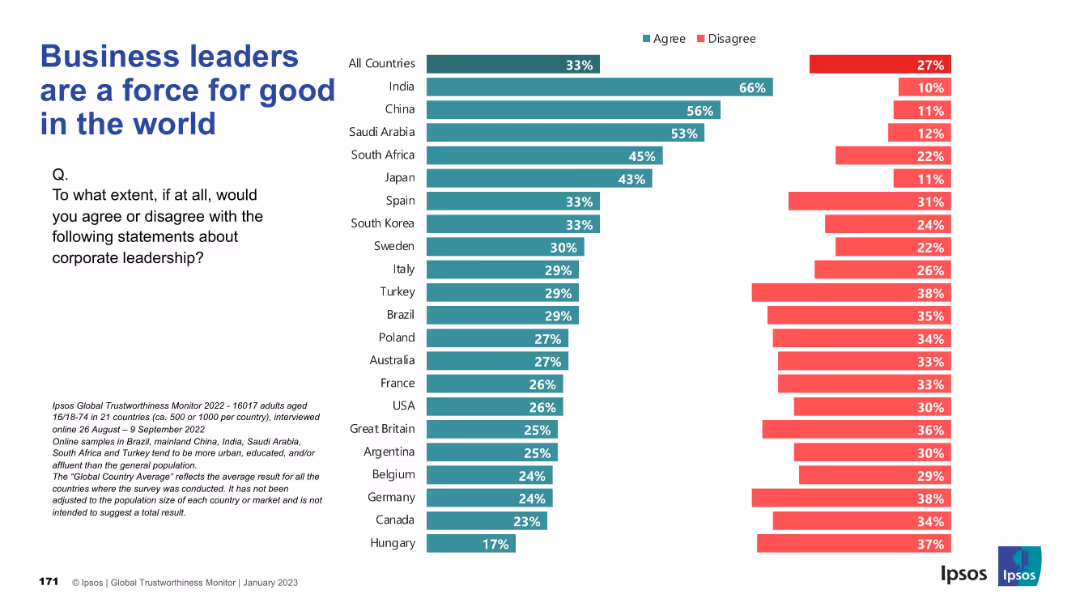
Continuation of the bar chart survey series; country-specific agreement/disagreement shown; typical color coding and consistent visual style maintained.
Strategic Planning
Professional Services
Respondents were asked whether they view business leaders as a positive force globally. India leads with strongest support, while Western countries express mixed or low sentiment.
corporate goodwill, leadership impact, public trust, Ipsos, global role, responsibility, positive change
false
Strategic Planning
Professional Services
Mixed Chart
IPSOS
Add to my slides
Remove from favorites
The slide features a bar chart on the left depicting the ratio of companies with net cash by region, and a line chart on the right showing return on equity over time for different regions. The charts use color coding to differentiate between regions.
Regulatory and Compliance
Financial Services
This slide discusses corporate governance by illustrating the ratio of companies with net cash and their return on equity across different regions. It is useful for understanding financial health and governance standards in various markets.
Corporate governance, net cash, return on equity, financial health, Europe, U.S., Korea, Japan
false
Regulatory and Compliance
Financial Services
Multiple Chart
JP Morgan
Add to my slides
Remove from favorites
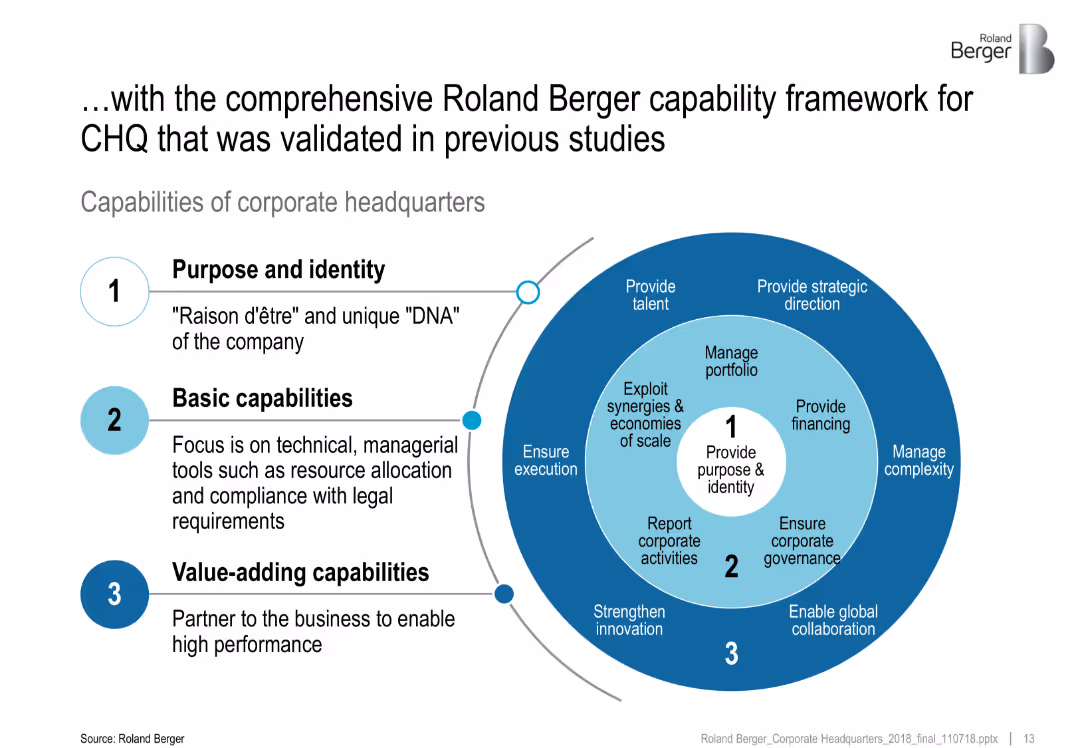
Concentric circular diagram with three nested levels; left-aligned text explains each layer’s function
Organizational Structure and Change
Professional Services
This slide presents Roland Berger's validated capability framework for corporate headquarters (CHQ), categorized into three levels: Purpose and Identity, Basic Capabilities, and Value-Adding Capabilities. Each level is defined by its role and examples of core functions.
corporate headquarters, framework, value-adding, capabilities, execution, structure
false
Organizational Structure and Change
Professional Services
Framework
Roland Berger
Add to my slides
Remove from favorites
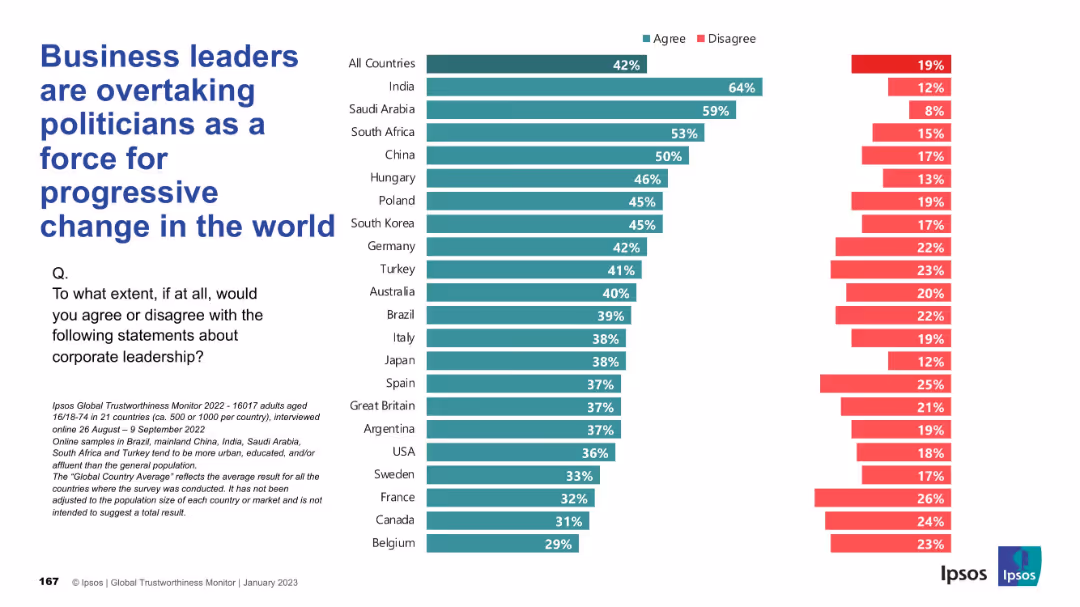
Same design as previous slides with vertical country list and agree/disagree bar chart; teal for "Agree", red for "Disagree".
Market Analysis and Trends
Government & Public Sector
This slide explores the perception that corporate leaders are becoming more progressive change agents than politicians. Agreement is highest in India and Saudi Arabia, showing a trend of growing corporate influence.
corporate influence, progressive change, politics, public perception, Ipsos, leadership, governance, reform
false
Market Analysis and Trends
Government & Public Sector
Mixed Chart
IPSOS
Add to my slides
Remove from favorites
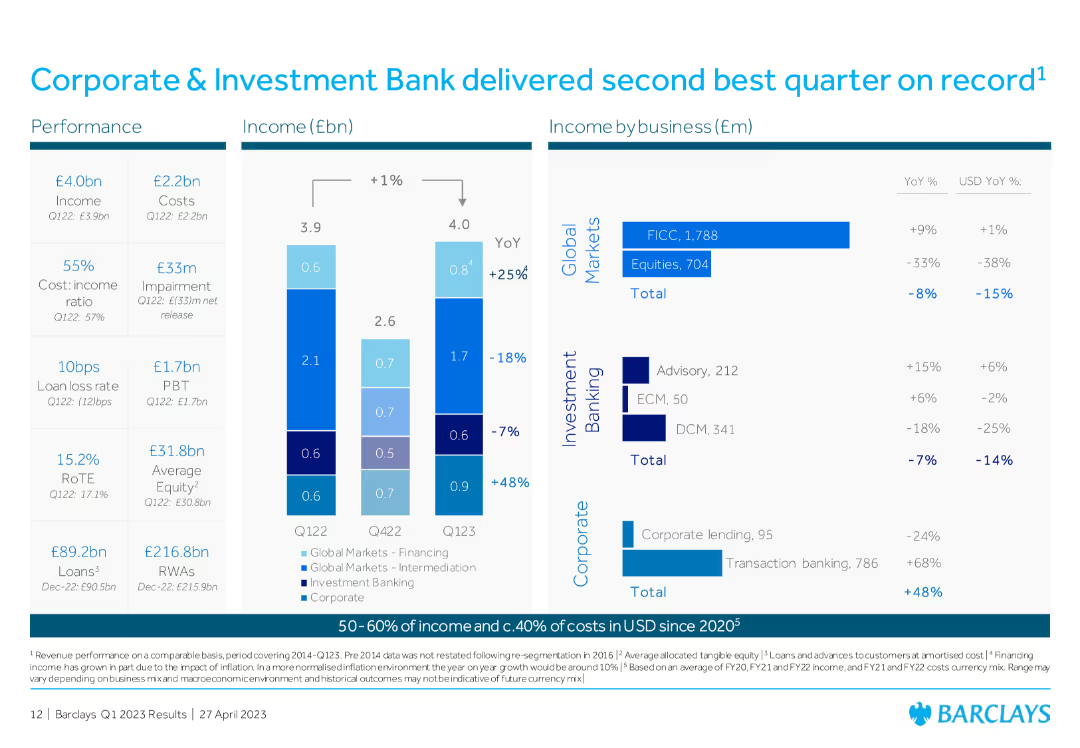
Column chart showing income and costs, with detailed breakdowns by business (Global Markets, Investment Banking, Corporate), including YoY percentage changes.
Financial Performance
Financial Services
The slide showcases the Corporate & Investment Bank's performance, highlighting the second-best quarter on record with detailed financial breakdowns by business sector.
Corporate Investment Bank, financial performance, Global Markets, Investment Banking, quarterly results
false
Financial Performance
Financial Services
Multiple Chart
Barclays
Add to my slides
Remove from favorites
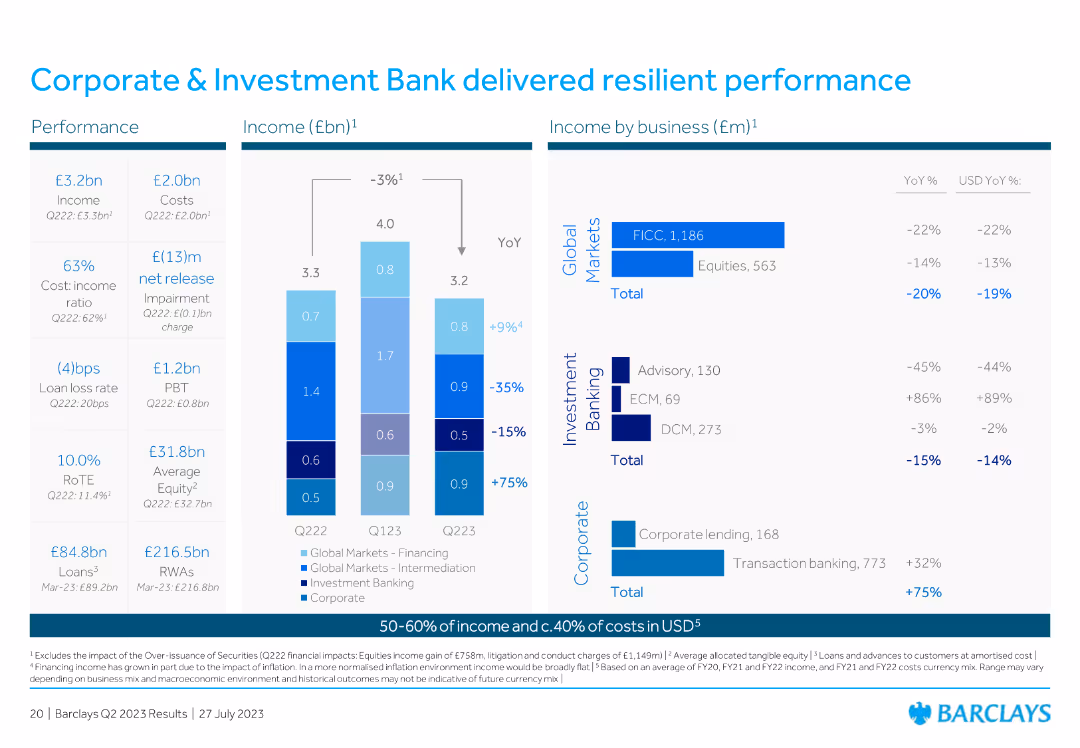
Contains column charts displaying income by business and YoY comparisons, highlighting performance metrics.
Financial Performance
Financial Services
Details the resilient performance of the Corporate & Investment Bank, including income and business segment breakdowns.
corporate, investment, performance, income, resilient
false
Financial Performance
Financial Services
Multiple Chart
Barclays
Add to my slides
Remove from favorites
A pie chart illustrates corporate lending total credit exposure by sector, accompanied by a list of benefits on the left side, highlighting the strategic approach to lending.
Operational Efficiency
Financial Services
The slide offers an insight into the corporate lending credit exposure, distributed across various sectors, showing a strategic, relationship-focused approach to lending. It stresses on the franchise benefits from lending practices underpinned by diligent risk management, aiming for risk-adjusted returns.
Corporate Lending, Credit Exposure, Strategy, Risk Management, Sectors
false
Operational Efficiency
Financial Services
Multiple Chart
Goldman Sachs
Add to my slides
Remove from favorites
The slide has column charts and text elements. It shows the utilization of corporate lending and credit lines, including incremental risk-weighted assets (RWA).
Financial Performance
Financial Services
This slide provides information on corporate lending and credit line utilization, detailing incremental RWA if fully drawn, useful for assessing corporate credit exposure and utilization rates.
Corporate, Lending, Credit, Utilization, RWA
false
Financial Performance
Financial Services
Multiple Chart
UBS
Add to my slides
Remove from favorites
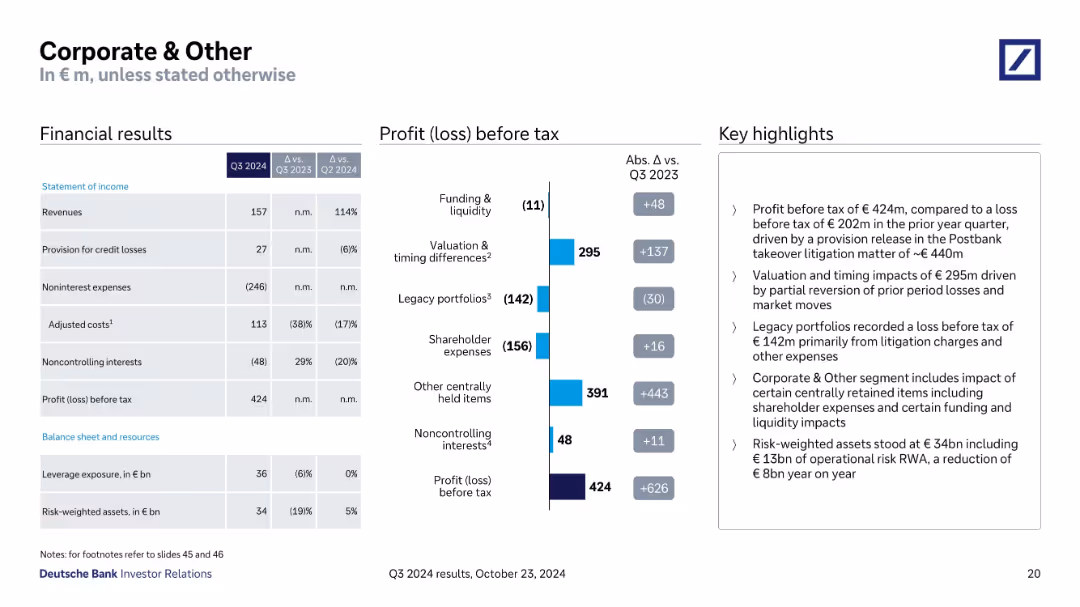
Split layout with income statement and balance sheet on the left, a bar chart showing sources of profit/loss in the middle, and key highlights in a text box on the right.
Financial Performance
Financial Services
The slide presents the financial results of the Corporate & Other segment for Q3 2024. It emphasizes a profit turnaround due to litigation provision releases and improved valuation/timing differences, despite continued losses from legacy portfolios and shareholder expenses.
corporate, litigation, valuation, profit, loss, Q3, expenses, Deutsche
false
Financial Performance
Financial Services
Mixed Chart
Deutsche Bank
Add to my slides
Remove from favorites
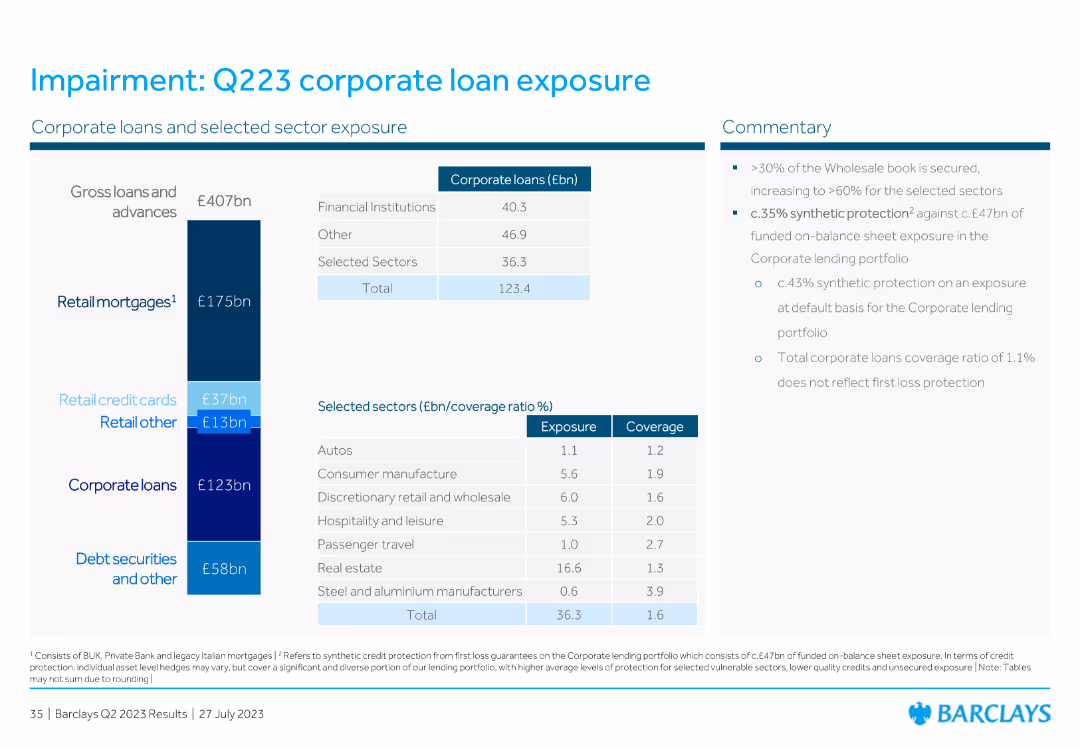
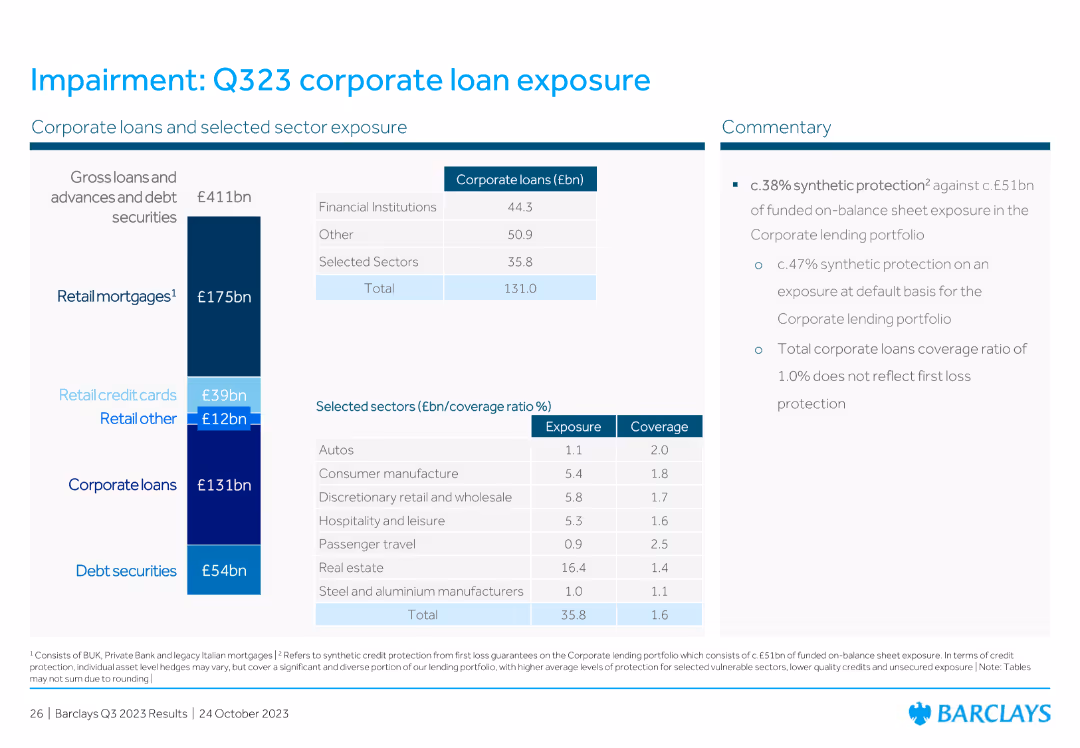
The slide contains a detailed table listing corporate loans and selected sector exposure with specific values for financial institutions, retail mortgages, credit cards, and other sectors. Includes commentary on the right-hand side.
Financial Performance
Financial Services
The slide presents corporate loan exposure and sector-specific coverage ratios. Commentary includes insights on wholesale book security and synthetic protection, highlighting overall corporate loan exposure and risk management.
corporate loans, sector exposure, retail mortgages, commentary, financial institutions
false
Financial Performance
Financial Services
Mixed Chart
Barclays
Add to my slides
Remove from favorites
Includes a vertical bar chart detailing corporate loans and sector exposure, accompanied by a commentary section. The slide is neatly organized with clear data presentation.
Risk Assessment and Management
Financial Services
This slide highlights corporate loan exposure as of Q323, with specific sector breakdowns and synthetic protection measures. It offers a detailed view of financial stability and risk management.
corporate loans, sector exposure, synthetic protection, financial stability, risk management, Q323, commentary
false
Risk Assessment and Management
Financial Services
Mixed Chart
Barclays
Add to my slides
Remove from favorites
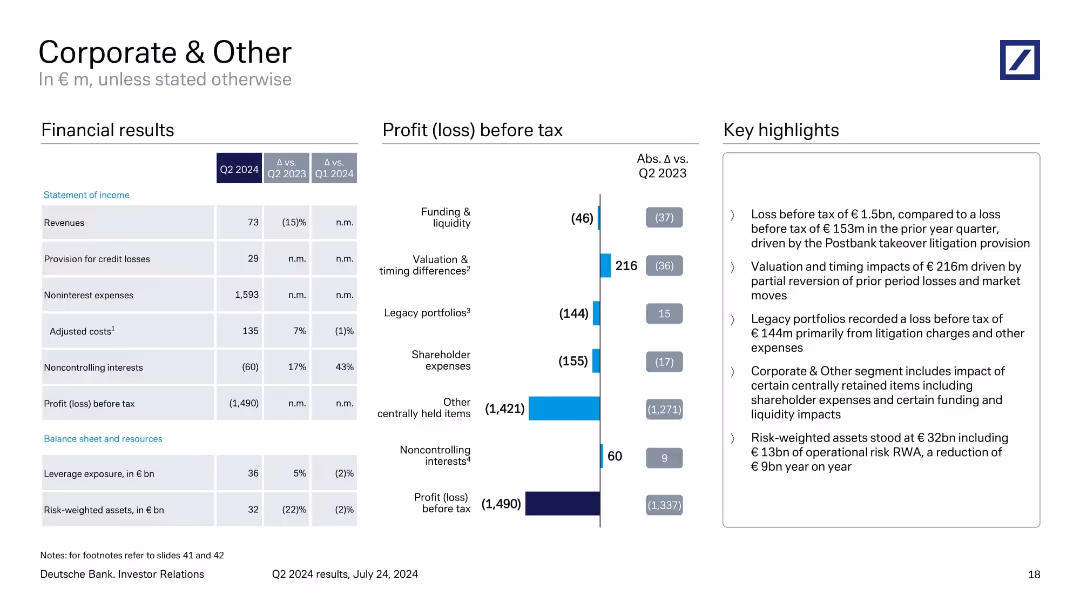
Two-column format with financials on the left and profit breakdown via bar chart on the right. Uses segmented bars to explain losses and impacts by area.
Financial Performance
Financial Services
Reports a Q2 2024 loss of €1.49bn mainly due to Postbank litigation and centrally retained items. Segmented bar chart breaks down contributions by area. Highlights valuation reversals and operational risk RWA reduction.
corporate, loss, Postbank, litigation, noninterest expenses, Q2 2024
false
Financial Performance
Financial Services
Mixed Chart
Deutsche Bank
Add to my slides
Remove from favorites
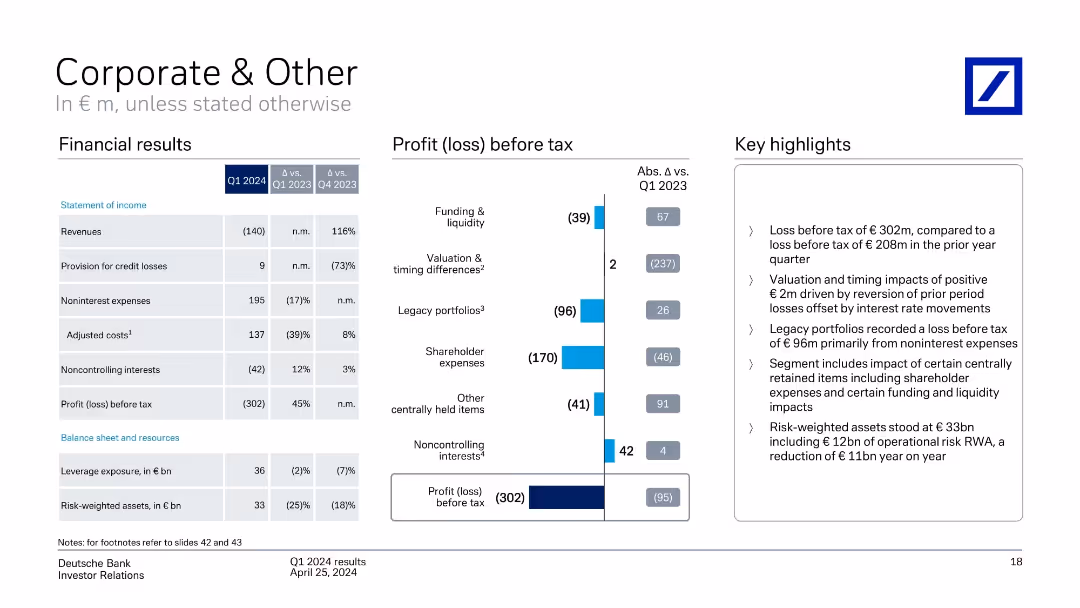
Financial data table, bar chart showing loss breakdown, and highlights
Financial Performance
Financial Services
Reports a Q1 2024 loss of €302m for Corporate & Other. Major contributors include shareholder expenses and legacy portfolios. The slide highlights interest rate effects and reduced operational risk RWAs.
corporate, other, noninterest expense, legacy portfolio, tax loss
false
Financial Performance
Financial Services
Mixed Chart
Deutsche Bank
Add to my slides
Remove from favorites
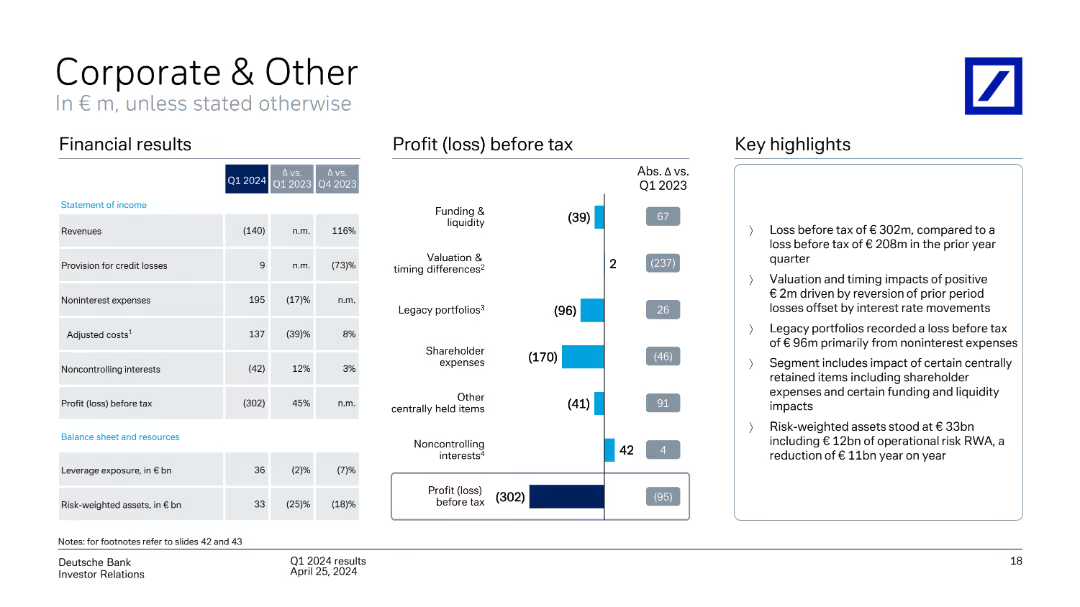
A column chart showing profit (loss) before tax by segment, with a table of financial results and key highlights. The slide is moderately dense with a mix of textual and visual elements.
Financial Performance
Financial Services
The slide details Q1 2024 financial results for the Corporate & Other segment, highlighting revenue, profit (loss) before tax, and key insights into various financial metrics and performance.
Corporate & Other, profit before tax, financial results, Q1 2024, performance
false
Financial Performance
Financial Services
Mixed Chart
Deutsche Bank
Add to my slides
Remove from favorites
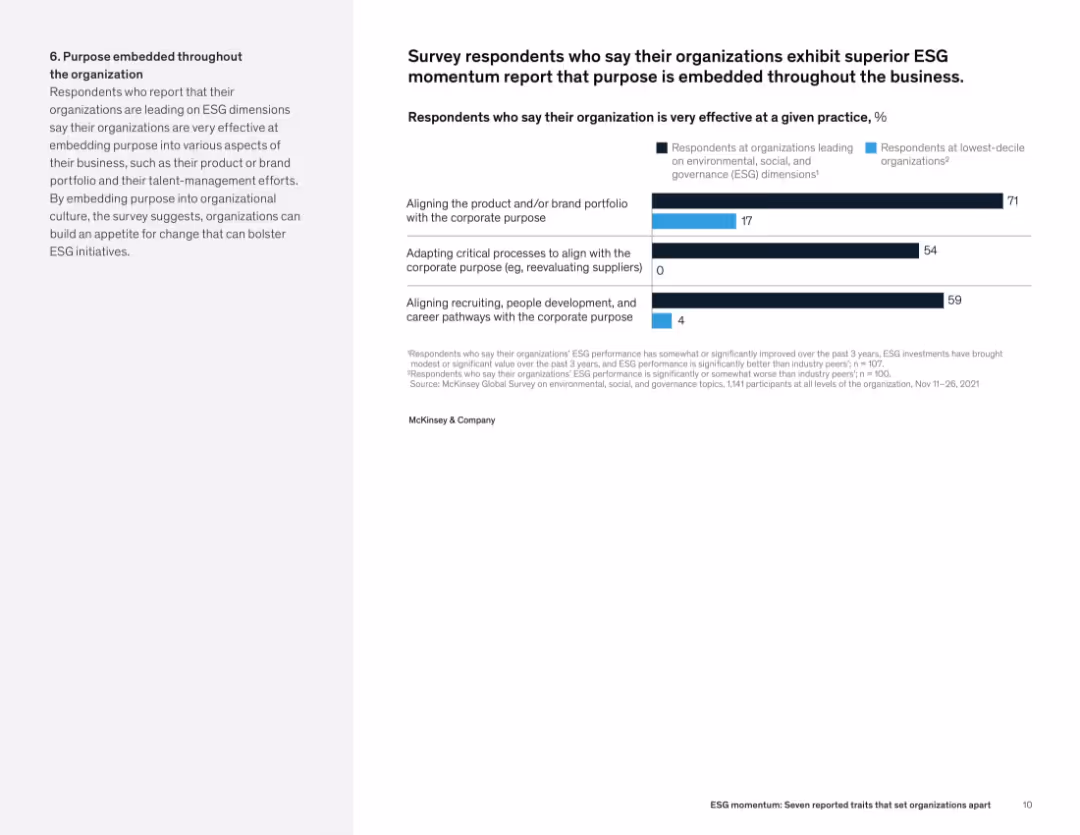
Text on the left and bar chart on the right showing effectiveness in aligning purpose with corporate structure across top vs. bottom ESG performers.
Organizational Structure and Change
Professional Services
Organizations with strong ESG performance embed purpose into operations—aligning product portfolios, critical processes, and talent systems with ESG principles. The chart shows a stark difference in implementation effectiveness between leading and lagging firms.
corporate purpose, ESG integration, business alignment, sustainability strategy, organizational behavior, talent pathways
false
Organizational Structure and Change
Professional Services
Mixed Chart
McKinsey
Add to my slides
Remove from favorites
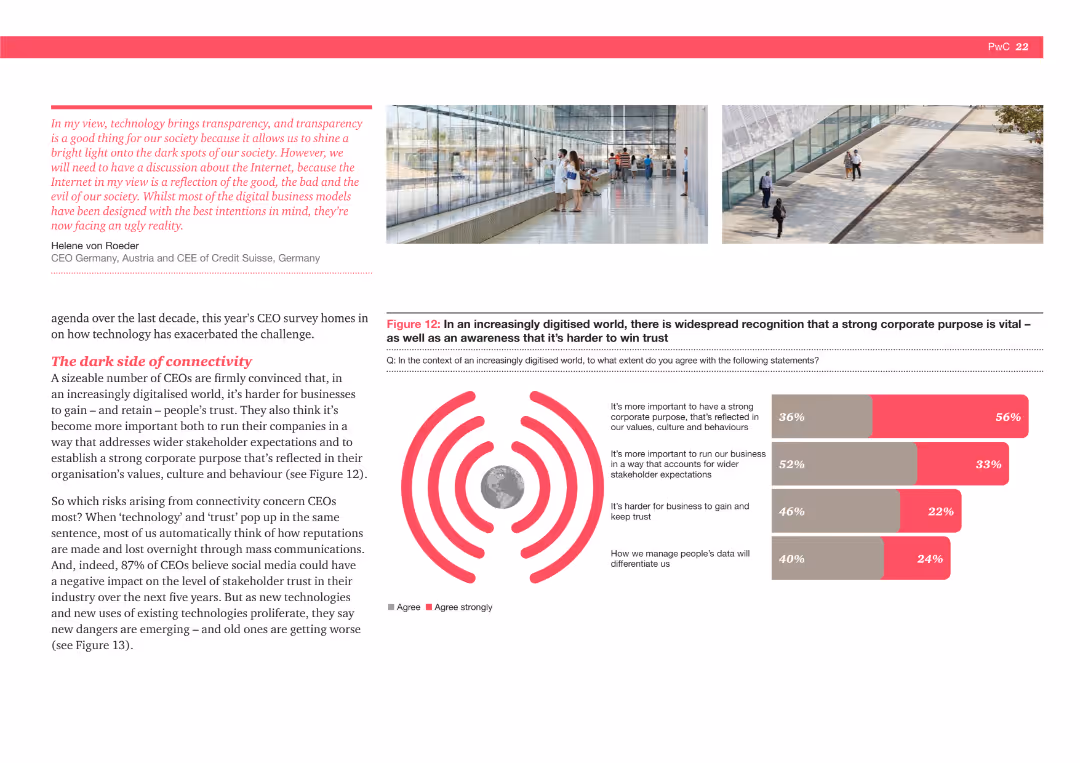
The slide shows a bar chart indicating the percentage of CEOs agreeing with statements about the importance of a strong corporate purpose and trust in a digitized world, highlighting various concerns and priorities.
Strategic Planning
Technology & Software
This slide highlights the importance of corporate purpose and trust in a digitized world. It shows that CEOs believe maintaining a strong corporate purpose and managing data privacy and stakeholder expectations are crucial in the digital age.
Corporate purpose, trust, digital age, data privacy, stakeholder expectations, CEOs
false
Strategic Planning
Technology & Software
Multiple Chart
PwC/Strategy&
Add to my slides
Remove from favorites
A structured layout with block elements and a sidebar detailing client wins. The slide utilizes blue shading to differentiate between the types of management and coaching services, with numerical data and percentages provided.
Organizational Structure and Change
Financial Services
Showcasing the expansion of wealth management through corporate relationships, this slide illustrates client growth and service coverage. It may serve to discuss the impact of corporate partnerships on personal financial management services and client engagement strategies.
Corporate relationships, Wealth management, Client engagement, Financial management, Growth
false
Organizational Structure and Change
Financial Services
Table
Goldman Sachs
Add to my slides
Remove from favorites
Features a timeline with overlapping circles and a balanced mix of colors to denote different phases from submission to decision, accompanied by minimal textual content.
Operational Efficiency
Professional Services
Details the annual review process for corporate reporting awards, highlighting critical timelines, staff involvement, and decision phases, ideal for understanding organizational workflows.
corporate reporting, review process, timelines, awards, decision making
false
Operational Efficiency
Professional Services
Linear Flow
PwC/Strategy&
Add to my slides
Remove from favorites
Multiple area charts tracking corporate resilience across various sectors with a focus on different types of disruptions from 2017 to 2022.
Strategic Planning
Professional Services
Analyzes how companies adapt and thrive amidst various disruptions including economic and technological changes, emphasizing resilience and strategic adaptation.
corporate resilience, disruptions, strategic adaptation, economic change, technological change, 2017-2022, sectors, adaptability
false
Strategic Planning
Professional Services
Multiple Chart
Accenture
Add to my slides
Remove from favorites
Includes a percentage bar chart with a purple theme. Each bar represents consumer agreement levels with statements about business responsibility.
Strategic Planning
Professional Services
Discusses expectations for businesses to act responsibly post-event, emphasizing the high consumer agreement on sustainable and fair solutions.
Corporate responsibility, Business ethics, Consumer expectations, Agreement levels, Sustainable solutions, Fair practices, Bar chart
false
Strategic Planning
Professional Services
Single Chart
Accenture
Add to my slides
Remove from favorites
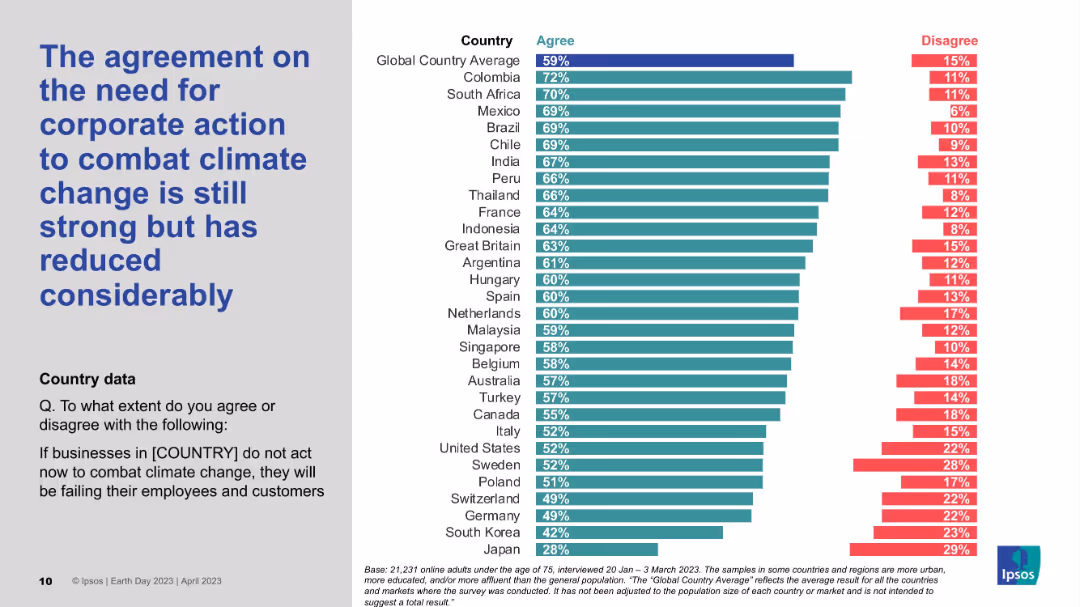
Similar layout as Slide 19444; ranked bar chart; countries arranged by agreement levels; corporate action focus.
Risk Assessment and Management
Environmental Services & Sustainability
This slide focuses on how strongly citizens believe businesses must take action on climate change. While agreement is still significant, it has dropped notably from previous years. Colombia, South Africa, and Mexico show the highest concern.
Corporate responsibility, Climate action, Public opinion, Ipsos, Survey decline
false
Risk Assessment and Management
Environmental Services & Sustainability
Mixed Chart
IPSOS
Add to my slides
Remove from favorites
This slide features horizontal bar charts comparing the importance of companies paying the correct amount of tax versus reducing environmental harm. The bars are color-coded for clarity, accompanied by text highlighting the key findings.
Market Analysis and Trends
Environmental Services & Sustainability
The slide shows that a higher percentage of respondents prioritize companies reducing environmental harm over paying the correct amount of tax. This can be used to discuss corporate social responsibility, public expectations from companies, and the prioritization of environmental issues over traditional financial concerns.
corporate responsibility, environmental harm, tax compliance, public opinion, sustainability
false
Market Analysis and Trends
Environmental Services & Sustainability
Multiple Chart
IPSOS
Add to my slides
Remove from favorites
Contains multiple column charts showing operational metrics like lost-time incident rates and clean operations, alongside textual information on global operations.
Regulatory and Compliance
Environmental Services & Sustainability
Emphasizes the company’s commitment to safety, ethical standards, and environmental responsibility, including specific targets for reducing operational incidents.
corporate responsibility, safety, ethical standards, environmental, targets
false
Regulatory and Compliance
Environmental Services & Sustainability
Multiple Chart
Barclays
Add to my slides
Remove from favorites
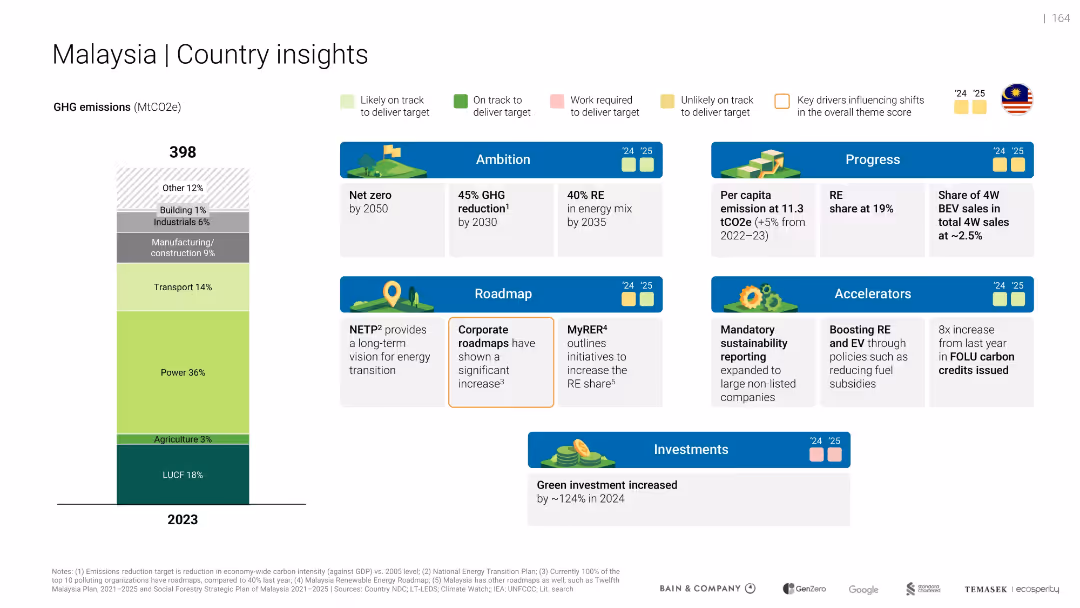
Similar layout to 15765 with GHG emissions chart and thematic insight boxes
Strategic Planning
Environmental Services & Sustainability
Malaysia's GHG and green roadmap overview. Notes strong corporate roadmap progress, increased investment (+124%), and key targets like 45% GHG cut by 2030 and 40% RE share by 2035.
corporate roadmap, share
false
Strategic Planning
Environmental Services & Sustainability
Mixed Chart
Bain
Add to my slides
Remove from favorites
Includes logos of key companies and text descriptions, organized neatly to facilitate comparison and provide a clear overview of corporate actions in sustainability.
Market Analysis and Trends
Environmental Services & Sustainability
Discusses the efforts of major corporations in SEA to advance decarbonization through investments in EVs and renewable energies, emphasizing regional impacts and future trends.
Corporates, decarbonization, SEA, EVs, renewable energies
false
Market Analysis and Trends
Environmental Services & Sustainability
Header Vertical
Bain
Add to my slides
Remove from favorites
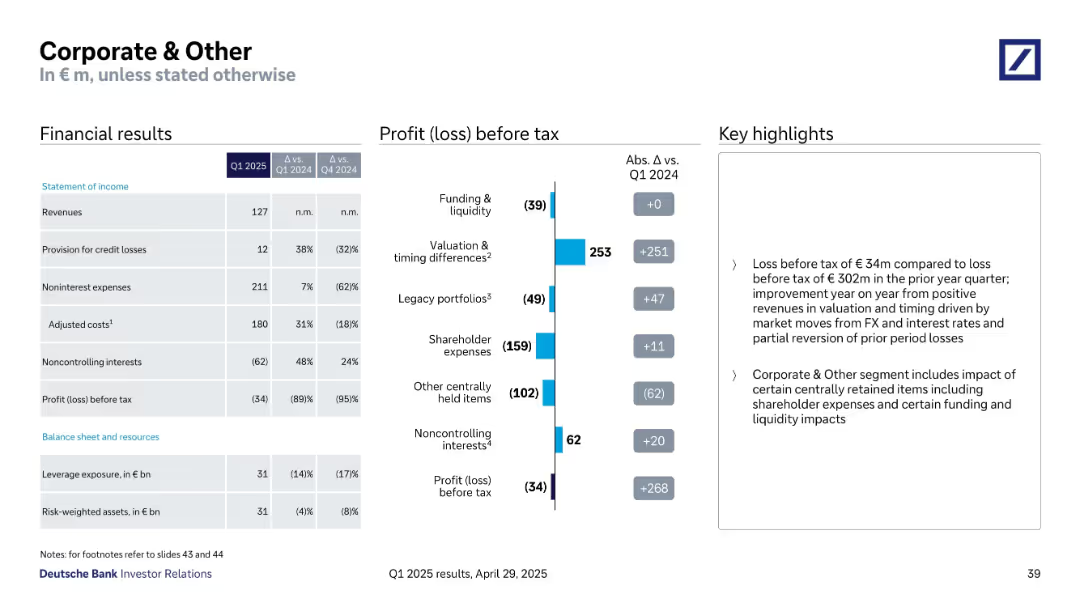
Left-aligned financial tables, middle bar chart showing loss components, and right-aligned text highlights.
Financial Performance
Financial Services
Highlights the Q1 2025 financial results of the “Corporate & Other” segment, showing significant year-on-year improvement in profit/loss before tax, driven by valuation changes and partial reversals of past losses. Key metrics like revenues, costs, and leverage exposure are detailed.
Corporate segment, financial results, profit before tax, valuation, expenses, leverage, Deutsche Bank
false
Financial Performance
Financial Services
Mixed Chart
Deutsche Bank
Add to my slides
Remove from favorites
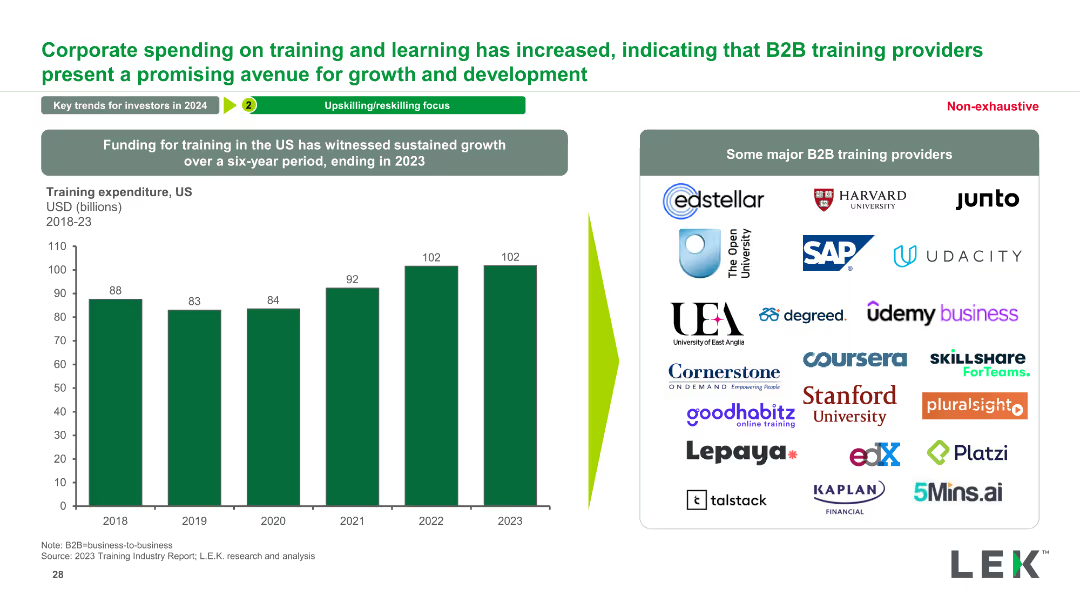
The slide contains a column chart showing the US training expenditure from 2018-2023 and a list of major B2B training providers, supported by logos and brief descriptions.
Financial Performance
Education & Training
This slide highlights the increase in corporate spending on training and learning, indicating growth opportunities for B2B training providers, supported by expenditure data.
corporate spending, training, learning, B2B training providers, growth opportunities, financial performance, training expenditure
false
Financial Performance
Education & Training
Mixed Chart
LEK
Add to my slides
Remove from favorites
Slide packed with bullet points and circular icons to denote statistical data, focusing on planned corporate actions to navigate 2023 uncertainties, includes a quote for emphasis.
Market Analysis and Trends
Professional Services
Details strategic actions that companies plan to take in 2023 to address macro uncertainties, highlighting prioritized areas.
corporate strategy, 2023, planning, uncertainties
false
Market Analysis and Trends
Professional Services
Multiple Chart
BCG
Add to my slides
Remove from favorites
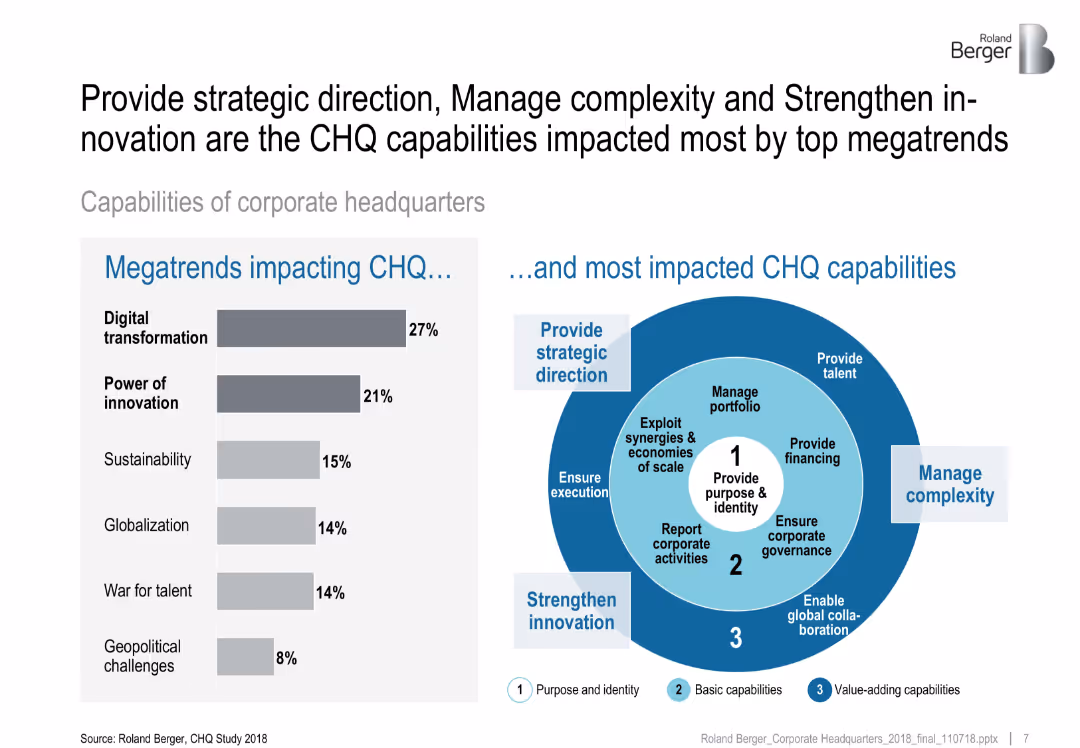
Two-section layout: bar chart showing megatrends impacting CHQ and a radial diagram highlighting CHQ capabilities grouped by theme.
Strategic Planning
Professional Services
This slide identifies digital transformation and innovation as key megatrends affecting corporate headquarters. It connects these trends with core CHQ capabilities such as strategic direction, complexity management, and innovation.
corporate strategy, CHQ capabilities, megatrends, innovation, digital transformation, headquarters, organizational strategy
false
Strategic Planning
Professional Services
Mixed Chart
Roland Berger
Add to my slides
Remove from favorites
The slide displays a diamond-shaped diagram in the center, showing four business areas, flanked by text blocks on each side. It is in a blue and white color scheme with the page number at the bottom right.
Organizational Structure and Change
Financial Services
This slide provides an overview of the presenter's corporate structure, highlighting the integration of services and the focus on client-centricity. It outlines the growth in client coverage and improved relationships as a result of this approach. Ideal for discussions on corporate strategy, organizational change, and client relationship management, it illustrates the company's strategy for unified services and growth in client engagement.
Corporate Strategy, Client Centricity, Business Development, Organizational Structure, Integration
false
Organizational Structure and Change
Financial Services
Framework
Goldman Sachs
Add to my slides
Remove from favorites
Uses various icons and bullet points to compare aspects of JPMorgan's global operations and asset management.
Financial Performance
Financial Services
Examines the mutual benefits within different segments of JPMorgan, including client reach, technology, and community engagement.
Corporate synergy, client reach, technology, brand, marketing, community engagement, talent management
false
Financial Performance
Financial Services
Table
JP Morgan
Add to my slides
Remove from favorites
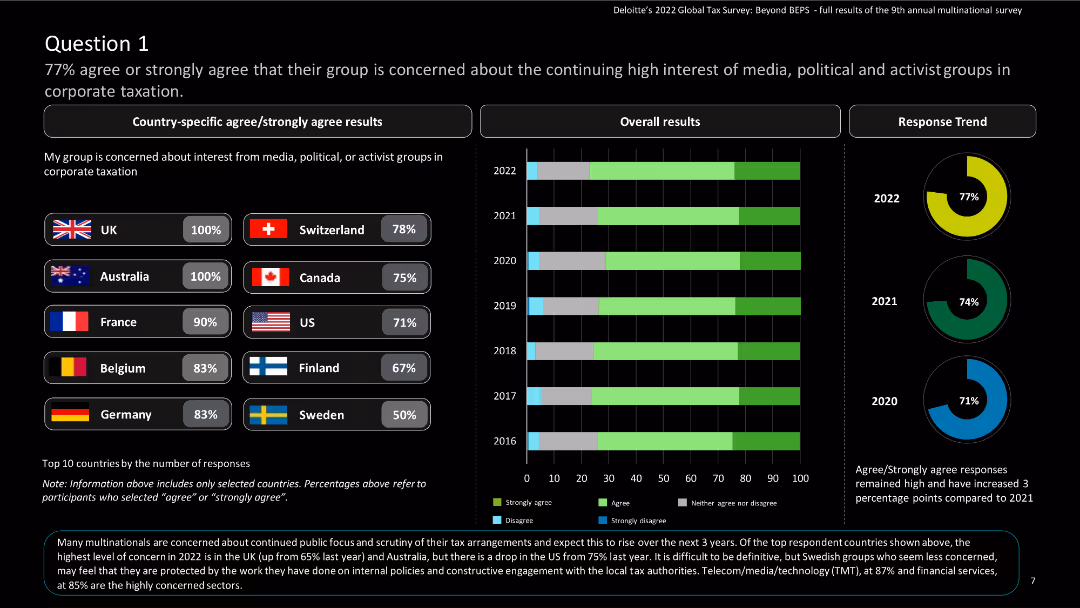
This slide contains country-specific results with flags, a vertical bar chart showing overall results, and response trends.
Risk Assessment and Management
Financial Services
It presents data on the concern levels among multinational groups regarding media, political, or activist groups' interest in corporate taxation.
corporate taxation, multinational groups, media interest, political interest, survey results
false
Risk Assessment and Management
Financial Services
Multiple Chart
Deloitte
Add to my slides
Remove from favorites
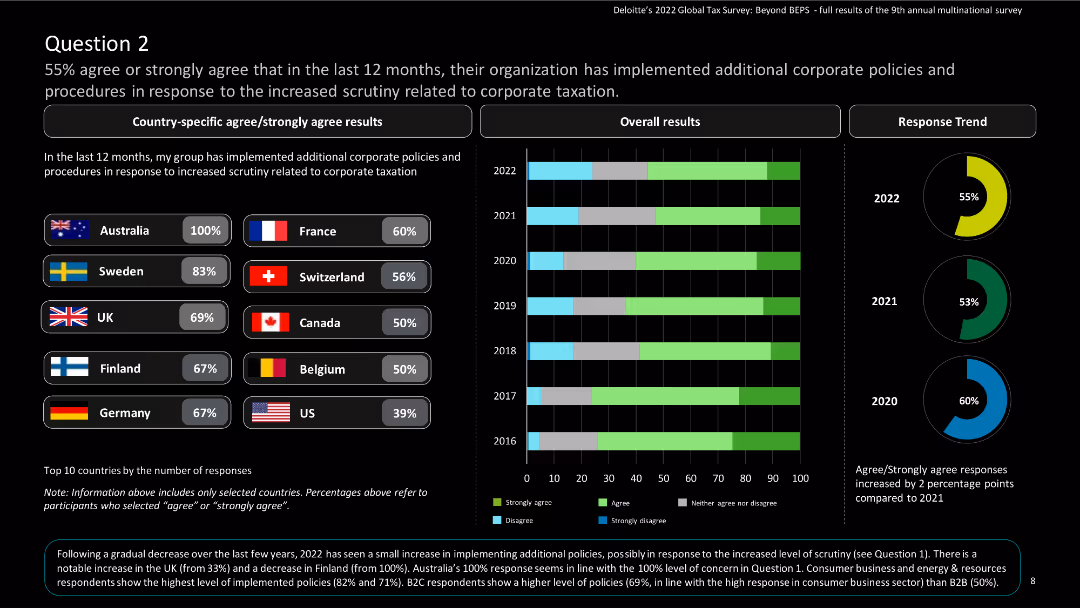
The slide features country-specific results and a column chart showing overall and response trend results over the years.
Regulatory and Compliance
Financial Services
The slide discusses the implementation of additional corporate policies due to increased scrutiny related to corporate taxation.
Corporate taxation, policies, scrutiny, corporate, global tax, Deloitte, agree, strongly agree, survey, multinational
false
Regulatory and Compliance
Financial Services
Multiple Chart
Deloitte
Add to my slides
Remove from favorites
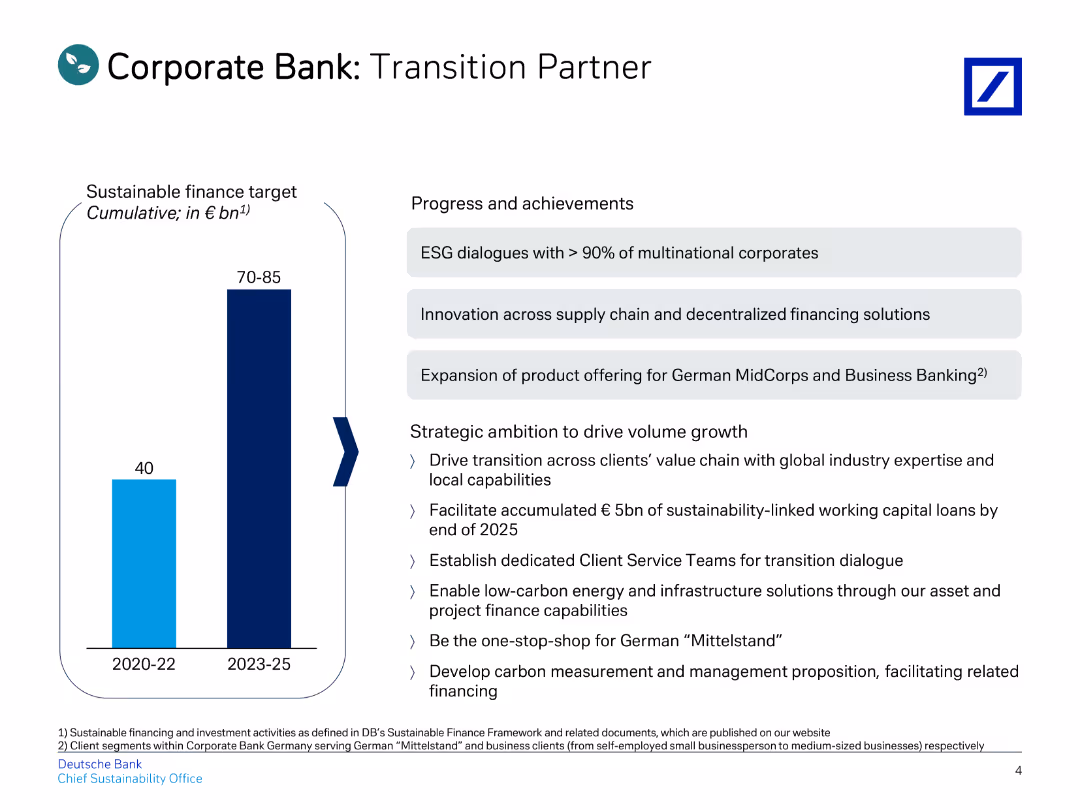
The slide includes a title, a vertical bar chart on the left, and a list of progress and achievements on the right.
Strategic Planning
Financial Services
Details the progress and achievements of the Corporate Bank, focusing on sustainable finance targets and strategic ambitions.
corporate, transition, sustainable, finance, strategy
false
Strategic Planning
Financial Services
Mixed Chart
Deutsche Bank
Add to my slides
Remove from favorites
Two-column layout comparing liability and asset businesses, with a focus on corporate treasury responsibilities.
Regulatory and Compliance
Financial Services
The slide elaborates on the role of corporate treasury in supporting strategic priorities.
corporate treasury, strategic priorities, liabilities, assets
false
Regulatory and Compliance
Financial Services
Linear Flow
Goldman Sachs
Add to my slides
Remove from favorites
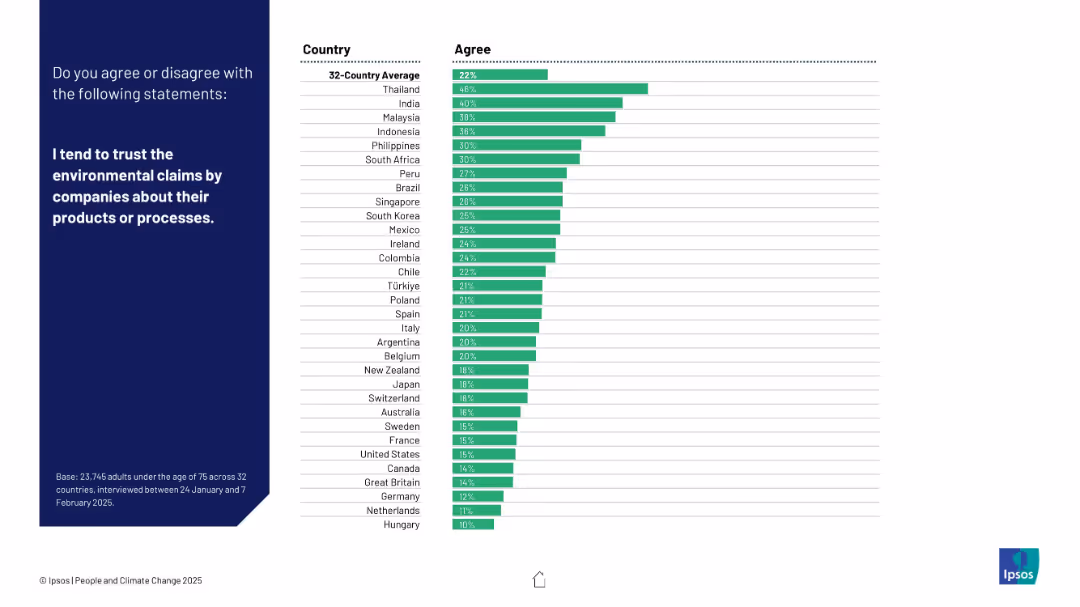
Bar chart of 32 countries showing levels of trust in corporate environmental claims. Dark left panel with white text.
Customer and Market Segmentation
Consumer Goods
Shows public trust in corporate environmental claims. Thailand ranks highest in trust, while many Western countries report low trust in such claims.
corporate trust, environmental claims, greenwashing, consumer perception, Ipsos, brand credibility, sustainability, survey, public opinion, ESG
false
Customer and Market Segmentation
Consumer Goods
Mixed Chart
IPSOS
Add to my slides
Remove from favorites
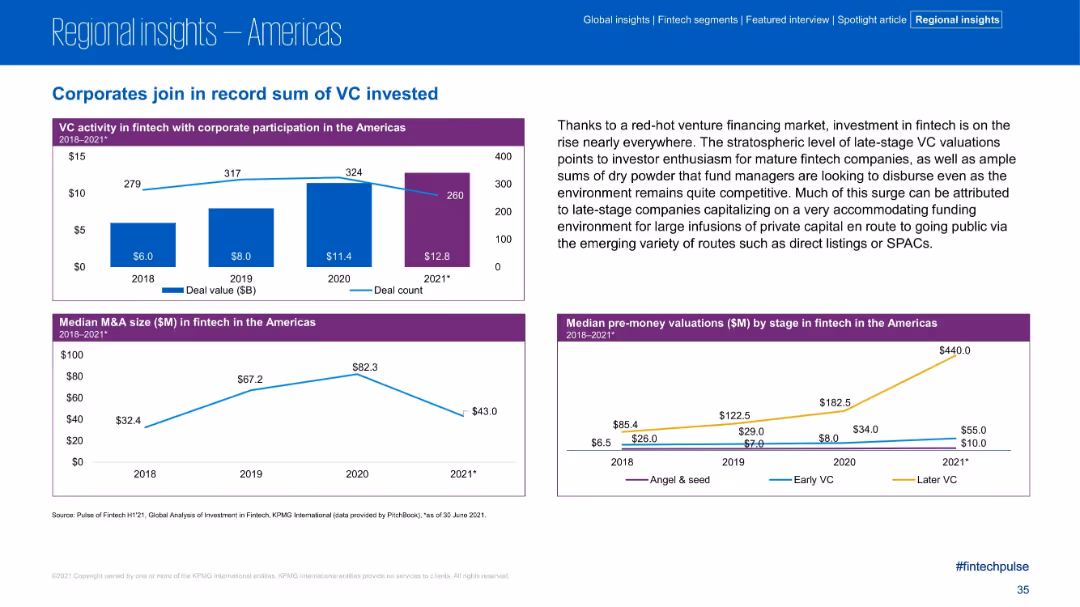
Three charts showing VC corporate participation, median M&A size, and median valuations; right-aligned text block provides qualitative analysis
Strategic Planning
Financial Services
This slide discusses how corporates are increasingly participating in VC deals, contributing to a rise in late-stage valuations and M&A activity. Charts display increasing deal values and median sizes from 2018 to H1 2021, while the text highlights investor enthusiasm and capital availability for late-stage fintechs.
corporate VC, fintech funding, late-stage valuations, M&A size, SPACs, investor enthusiasm, fintech trends
false
Strategic Planning
Financial Services
Multiple Chart
KPMG
Add to my slides
Remove from favorites
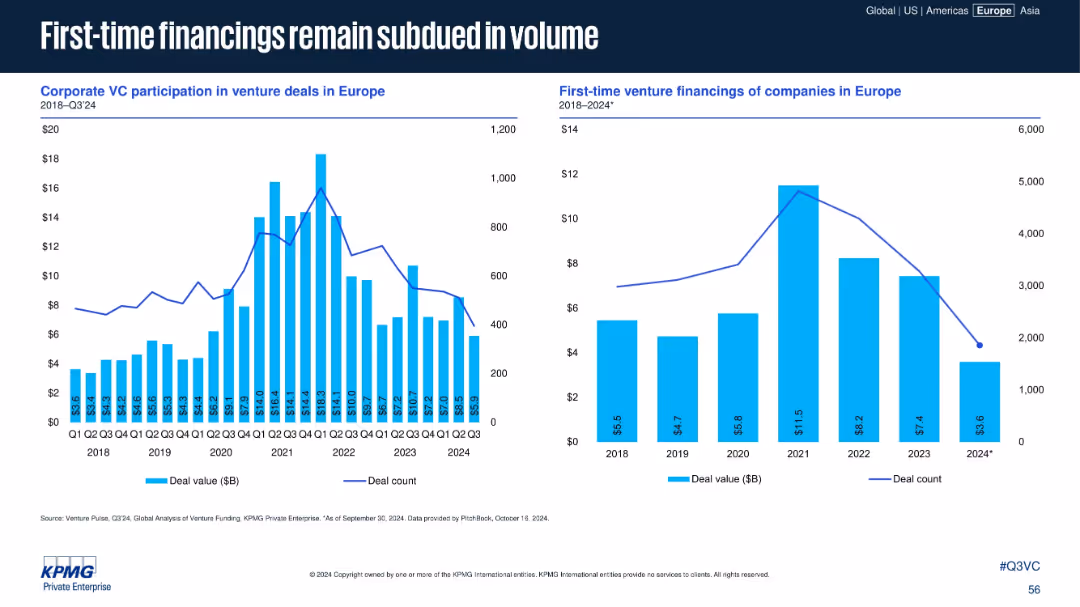
Two bar and line charts: Left (corporate VC participation), Right (first-time financings)
Investment Analysis
Financial Services
This slide compares corporate VC involvement and first-time venture financings. Both metrics peaked in 2021 but have declined steadily, suggesting reduced risk appetite and fewer new startups entering the ecosystem.
corporate VC, first-time financing, deal count, investment decline
false
Investment Analysis
Financial Services
Multiple Chart
KPMG
Add to my slides
Remove from favorites
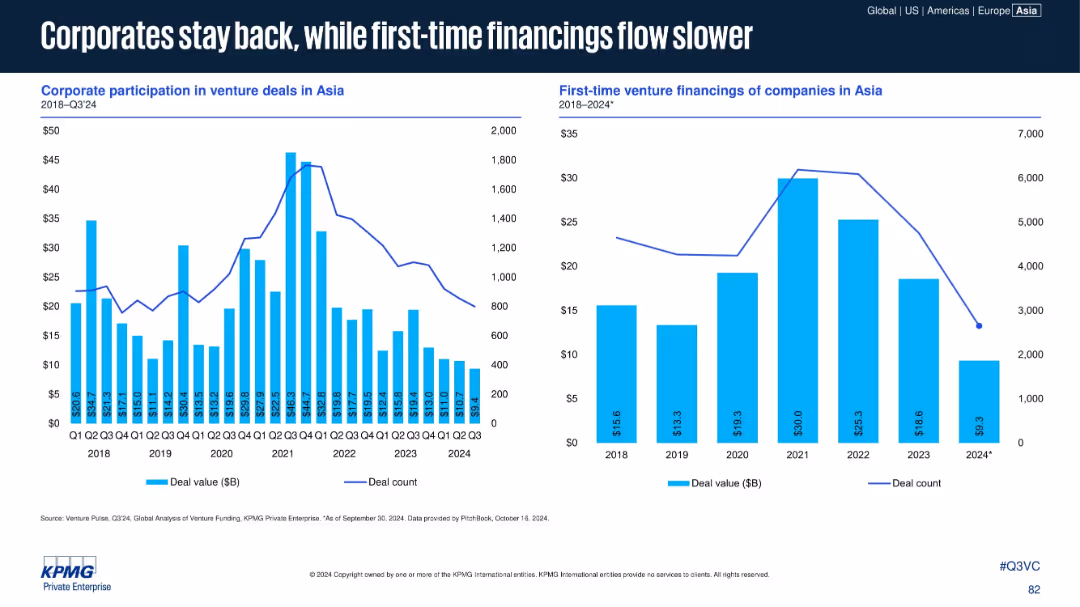
Split slide: Left bar/line chart on corporate VC participation; right bar/line chart on first-time financing trends in Asia (2018–2024).
Strategic Planning
Financial Services
Highlights a decline in corporate venture participation and first-time financing deals in Asia. Emphasizes the reduced involvement of strategic investors and new market entrants, suggesting more cautious capital deployment.
Corporate VC, First-time Funding, Asia, Deal Count, Strategy, 2024
false
Strategic Planning
Financial Services
Multiple Chart
KPMG
Add to my slides
Remove from favorites
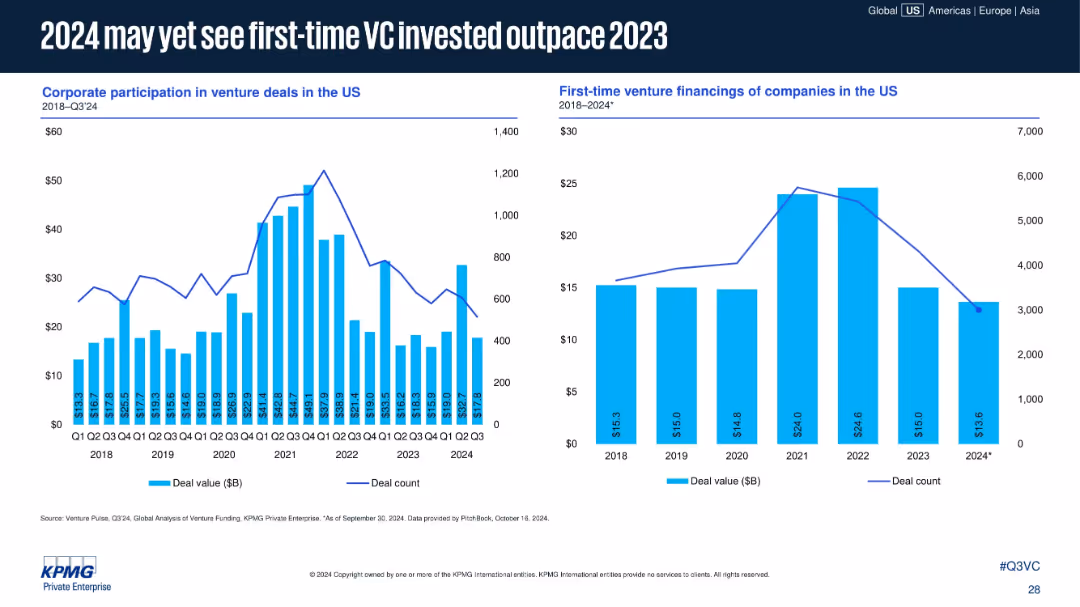
Two bar-line combo charts: left tracks corporate VC participation; right shows first-time VC financings. Timeline spans 2018–Q3 2024.
Sales and Business Development
Financial Services
First-time venture financings are projected to slightly outpace 2023, although deal count is trending down. Corporate VC activity remains volatile, peaking in 2021 and stabilizing in 2024.
corporate VC, first-time funding, venture capital, 2024 forecast, startup investment, funding trends, early-stage companies
false
Sales and Business Development
Financial Services
Multiple Chart
KPMG
Add to my slides
Remove from favorites
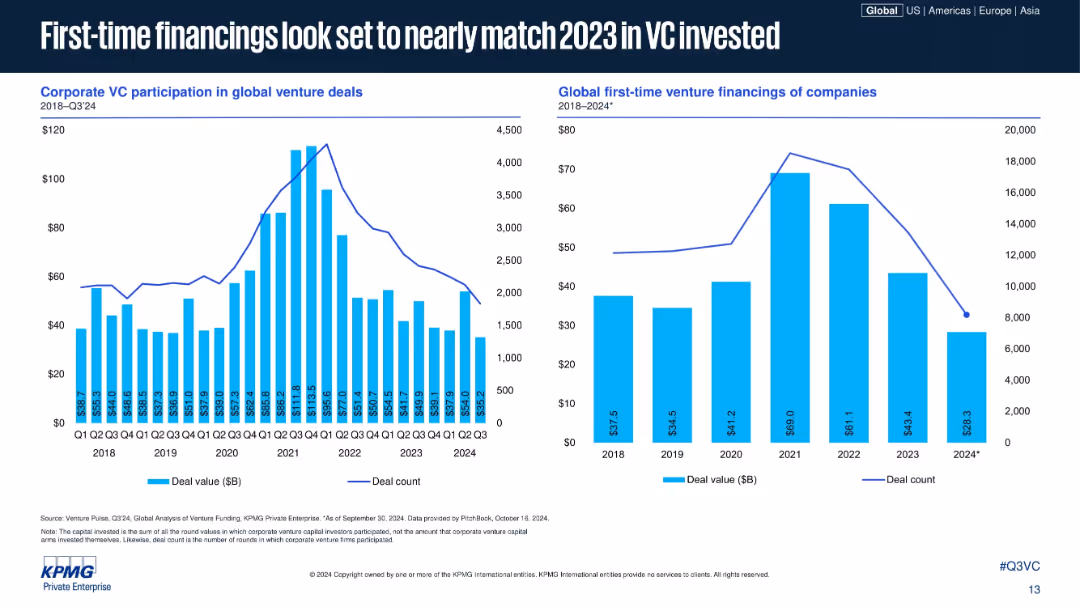
Dual column-line charts: left shows corporate VC participation; right shows global first-time venture financings; years on X-axis, volume and count on Y; consistent styling.
Sales and Business Development
Financial Services
The slide analyzes first-time venture financings and corporate VC participation trends globally. While deal counts have dropped significantly, capital invested is stabilizing, suggesting cautious optimism among new entrants. Corporate VC’s role appears to remain meaningful despite a dip.
corporate VC, first-time funding, venture capital, new deals, global VC, startup investments, deal volume, PitchBook, Q3 2024
false
Sales and Business Development
Financial Services
Multiple Chart
KPMG
Add to my slides
Remove from favorites
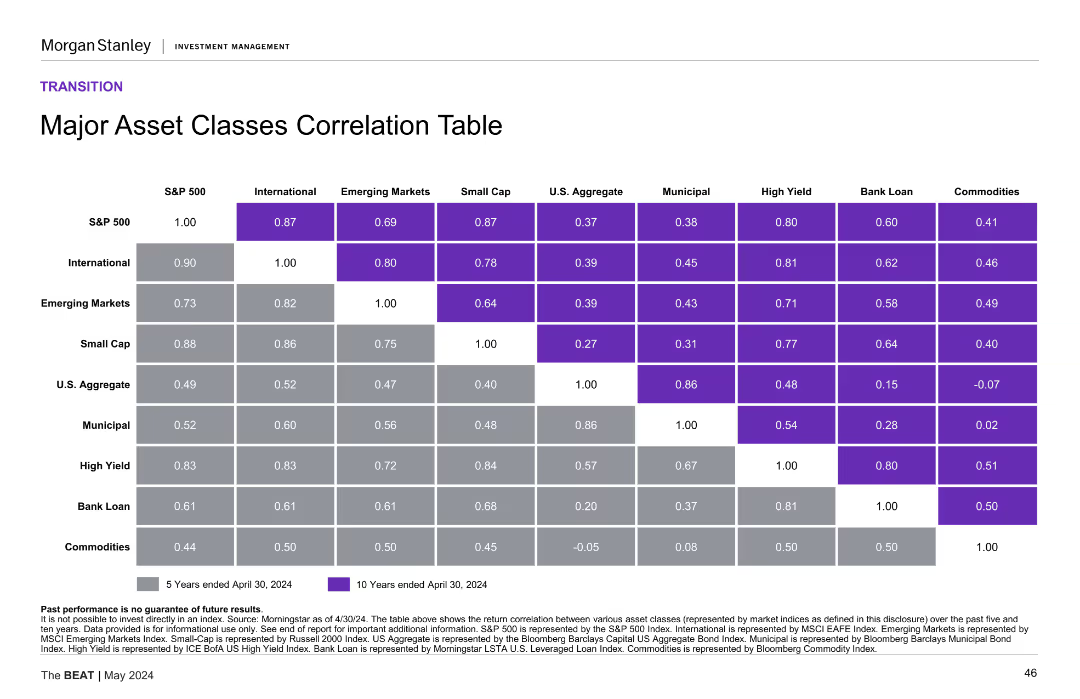
Table with correlation data between major asset classes (e.g., S&P 500, International, Emerging Markets) over 5 and 10 years. Each cell shows correlation coefficient with color coding.
Investment Analysis
Financial Services
Displays correlation coefficients between various asset classes over 5 and 10 years, helping in understanding asset diversification benefits.
Correlation, asset classes, investment
false
Investment Analysis
Financial Services
Table
Morgan Stanley
Add to my slides
Remove from favorites
A table displaying correlation coefficients between different asset classes over 5 and 10 years. Purple shades indicate strength of correlation.
Financial Performance
Financial Services
This slide assists in understanding asset relationships over time, crucial for managing investment risk and building diversified portfolios.
Correlation, Asset Classes, Risk Management, Portfolio, Diversification, Investment, Table, Coefficients
false
Financial Performance
Financial Services
Table
Morgan Stanley
Add to my slides
Remove from favorites
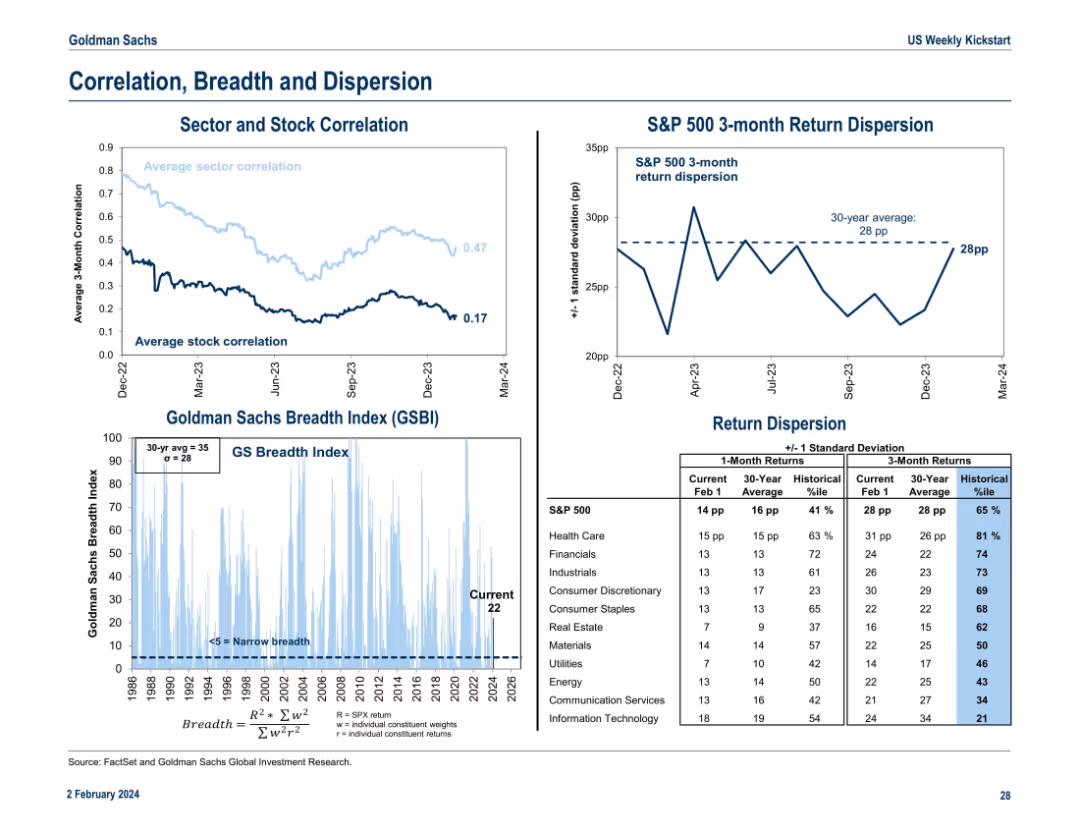
Combines line charts and histograms showing sector/stock correlation, breadth index, and return dispersion. Structured in a three-column layout with legends and annotations.
Risk Assessment and Management
Financial Services
The slide assesses market internals, including correlations among stocks and sectors, breadth of market participation, and return dispersion. It provides insight into market dynamics, concentration risks, and the probability distribution of returns across various sectors.
correlation, breadth, dispersion, stock returns, risk, market structure
false
Risk Assessment and Management
Financial Services
Multiple Chart
Goldman Sachs
Add to my slides
Remove from favorites
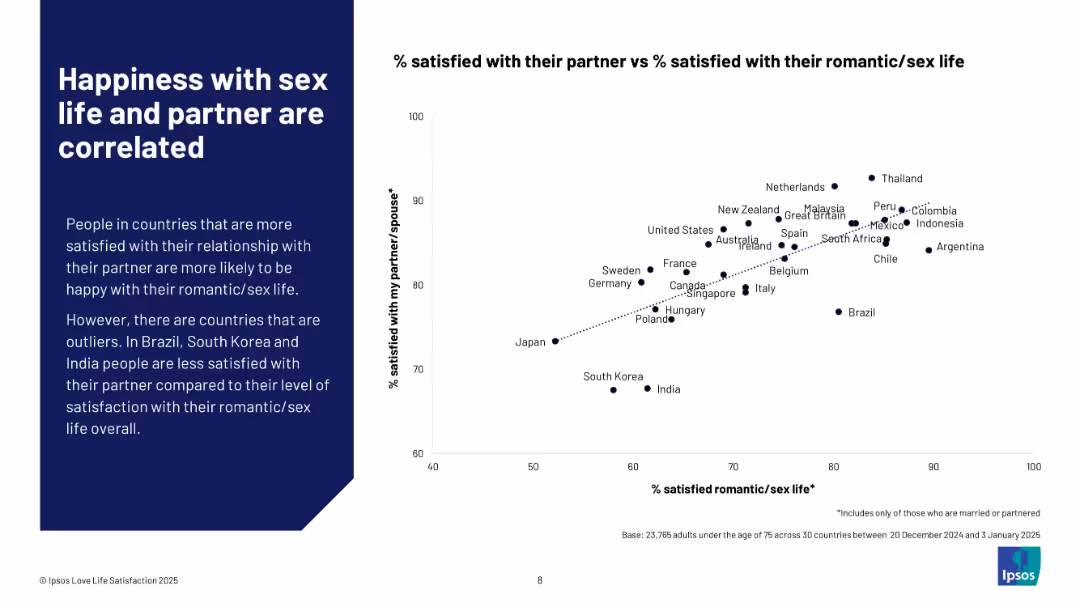
Left side explanatory text with a scatter plot on the right correlating satisfaction with partner vs romantic/sex life.
Human Resources and Talent Management
Professional Services
This slide visually correlates satisfaction with romantic/sex life and partner relationships. A scatter plot shows a strong positive trend across countries, with a few outliers like Brazil, South Korea, and India. It underscores the interconnectedness of relationship and sexual satisfaction.
correlation, partner satisfaction, romantic life, emotional well-being, Ipsos, scatter plot, relationship quality, international trends
false
Human Resources and Talent Management
Professional Services
Mixed Chart
IPSOS
Add to my slides
Remove from favorites
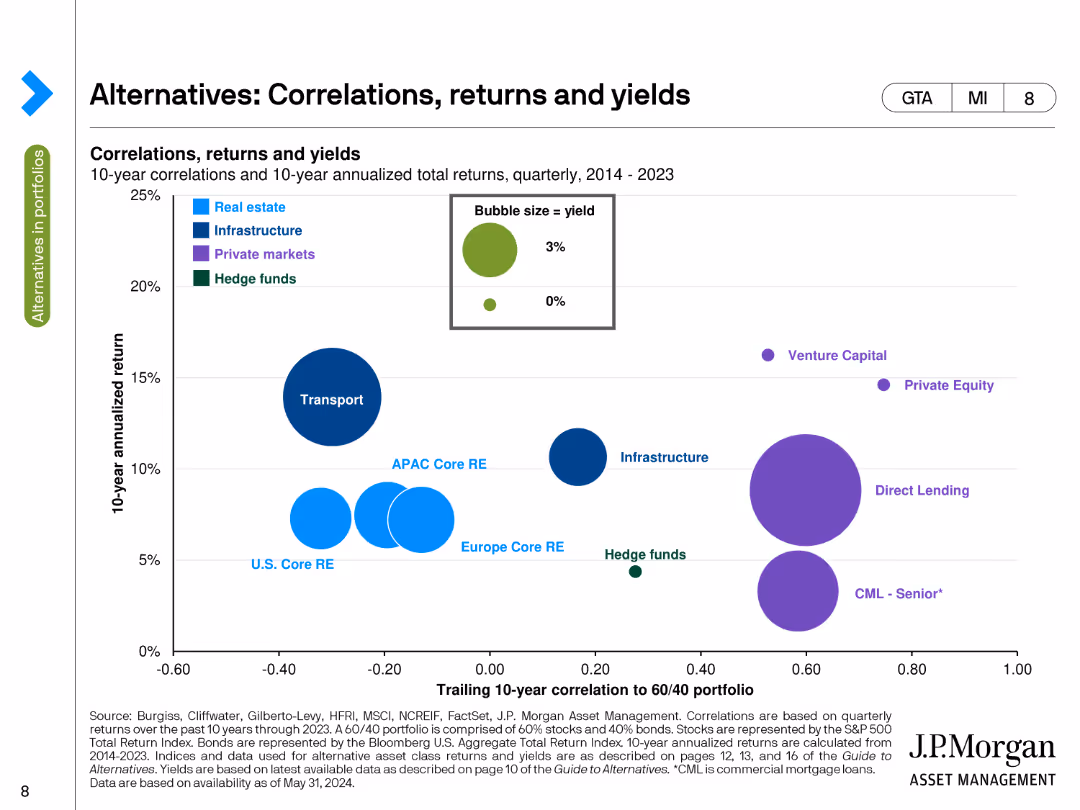
This slide contains a bubble chart showing 10-year correlations and annualized total returns for various asset classes, with bubble size representing yield. The chart uses multiple colors to distinguish between different asset types, such as real estate, infrastructure, and private markets.
Market Analysis and Trends
Financial Services
The slide presents a correlation analysis of alternative assets like real estate, infrastructure, and private markets against a 60/40 portfolio over a 10-year period. It highlights the relationship between return and risk for these asset classes.
Correlation, Returns, Yields, Alternatives, Asset Classes
false
Market Analysis and Trends
Financial Services
Single Chart
JP Morgan
Add to my slides
Remove from favorites
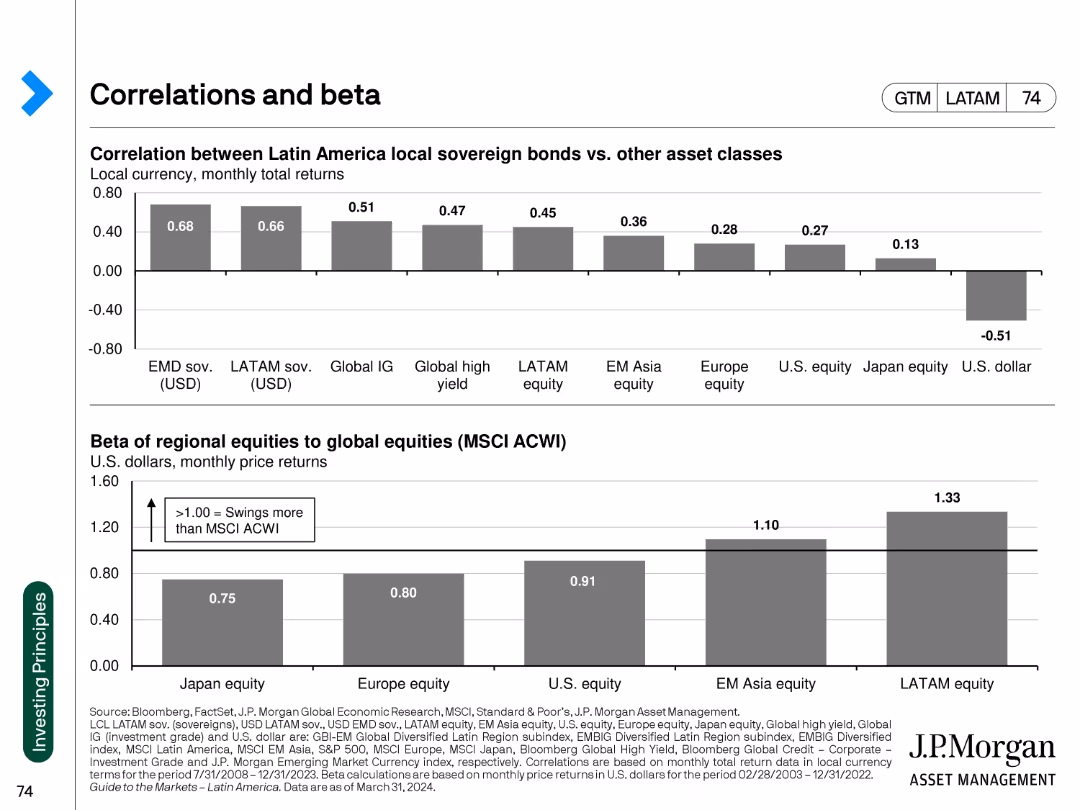
The slide contains bar charts showing correlations between Latin American sovereign bonds and other asset classes, and the beta of regional equities.
Risk Assessment and Management
Financial Services
This slide evaluates the correlation and beta of Latin American sovereign bonds and regional equities, aiding in risk assessment and portfolio diversification strategies.
correlations, beta, Latin American bonds, asset classes, regional equities, risk assessment, financial analysis, market performance
false
Risk Assessment and Management
Financial Services
Multiple Chart
JP Morgan
Add to my slides
Remove from favorites
The slide has two bar charts: one on the left showing correlations of regions and styles to the US 10-year Treasury yield, and one on the right showing sector correlations to the US 10-year Treasury yield.
Investment Analysis
Financial Services
The slide analyzes how different regions, styles, and sectors correlate with the US 10-year Treasury yield, providing insights for investment decisions.
correlations, Treasury yield, regions, sectors, investment analysis, US Treasury, market correlations
false
Investment Analysis
Financial Services
Multiple Chart
JP Morgan
Add to my slides
Remove from favorites
Heatmap and bar chart showing correlations between Asian and global equities, and beta values of different equity markets to the MSCI AC World Index.
Risk Assessment and Management
Financial Services
Investigates correlations and volatility among Asian and global equities, providing insights into risk and market behavior through correlation and beta analysis.
correlation, volatility, equities, heatmap, beta values, risk assessment, MSCI, financial analysis, market behavior
false
Risk Assessment and Management
Financial Services
Mixed Chart
JP Morgan
Add to my slides
Remove from favorites
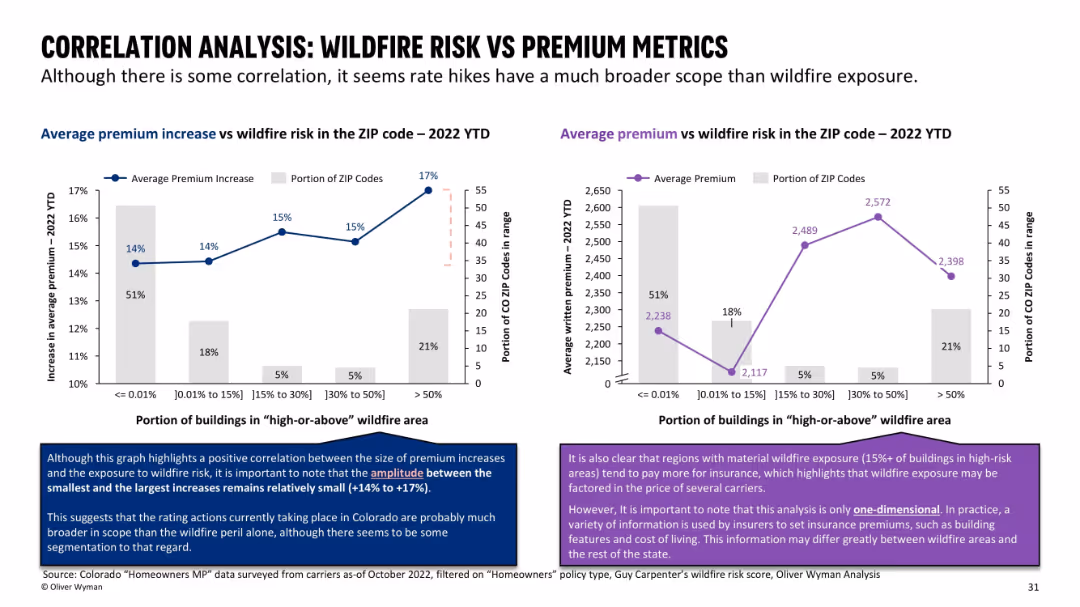
Dual chart layout with bar + line overlays; each chart relates premium data to wildfire exposure level.
Pricing Strategies
Financial Services
Explores correlation between wildfire exposure and premium levels across ZIP codes. Shows that although there is a trend, the difference in premiums across wildfire risk levels is relatively small, indicating that other factors are at play.
correlation, wildfire exposure, premiums, insurance pricing, ZIP codes
false
Pricing Strategies
Financial Services
Multiple Chart
Oliver Wyman
Add to my slides
Remove from favorites
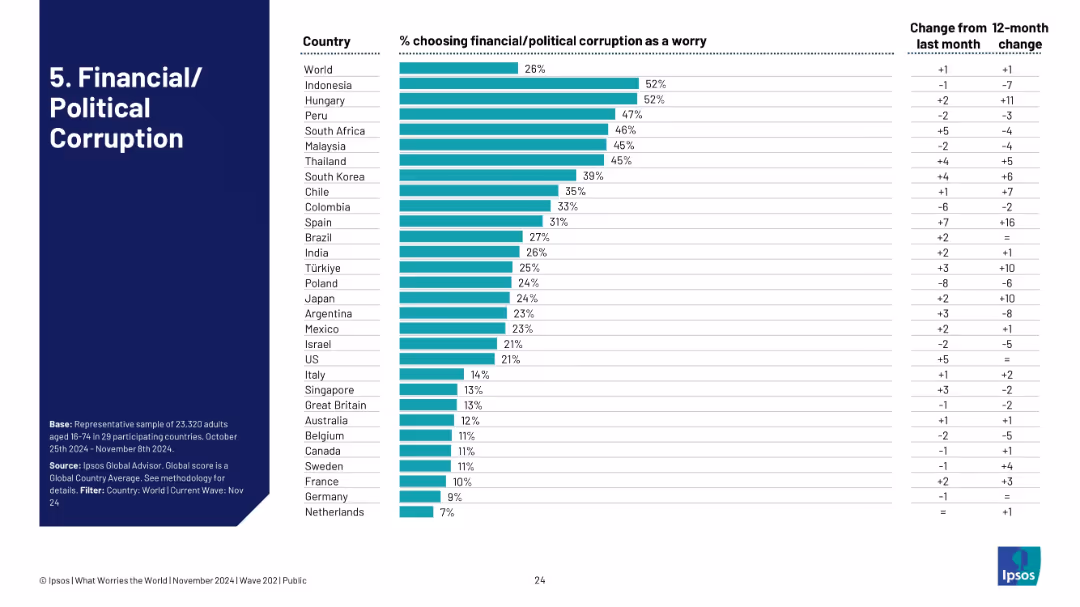
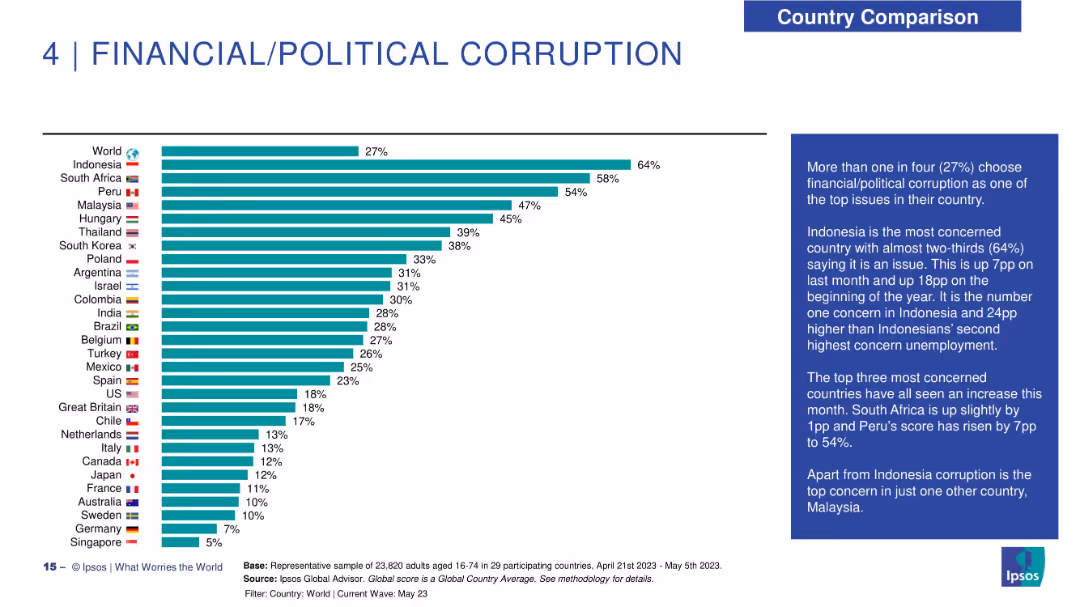
Similar vertical bar chart format, listing % concerned about corruption; includes delta data columns.
Risk Assessment and Management
Government & Public Sector
Highlights global and national levels of concern over financial and political corruption. Indonesia and Hungary top the list at 52%. It tracks opinion shifts and quantifies changes in corruption perception over time.
corruption, financial crime, political distrust, transparency, Ipsos, governance, survey, global perception, risk factors
false
Risk Assessment and Management
Government & Public Sector
Single Chart
IPSOS
Add to my slides
Remove from favorites
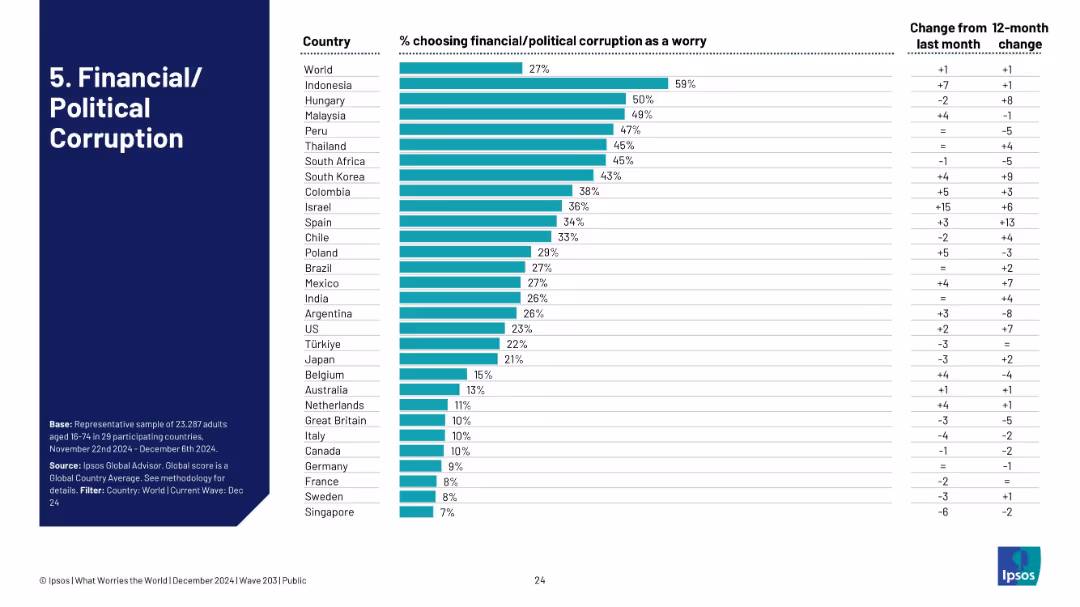
Bar graph depicting the percentage of people citing corruption as a key worry in different countries, with month/year change columns.
Regulatory and Compliance
Government & Public Sector
With 27% of people globally citing corruption as a concern, Indonesia and Hungary stand out. The slide visually compares perceptions by country and time, offering an overview of institutional trust issues worldwide.
corruption, governance, politics, Ipsos, transparency, country trust levels
false
Regulatory and Compliance
Government & Public Sector
Single Chart
IPSOS
Add to my slides
Remove from favorites
Horizontal bar chart with country flags and percentages on the left; explanatory text in a blue box on the right.
Market Analysis and Trends
Government & Public Sector
This slide highlights public perception of financial and political corruption across 29 countries. Indonesia ranks highest with 64% identifying it as a top issue. The global average is 27%. Commentary notes recent rises in concern in several countries including Peru and South Africa.
corruption, public perception, Ipsos, global survey, country comparison, Indonesia, South Africa, concern levels, political issues, May 2023
false
Market Analysis and Trends
Government & Public Sector
Mixed Chart
IPSOS
Add to my slides
Remove from favorites
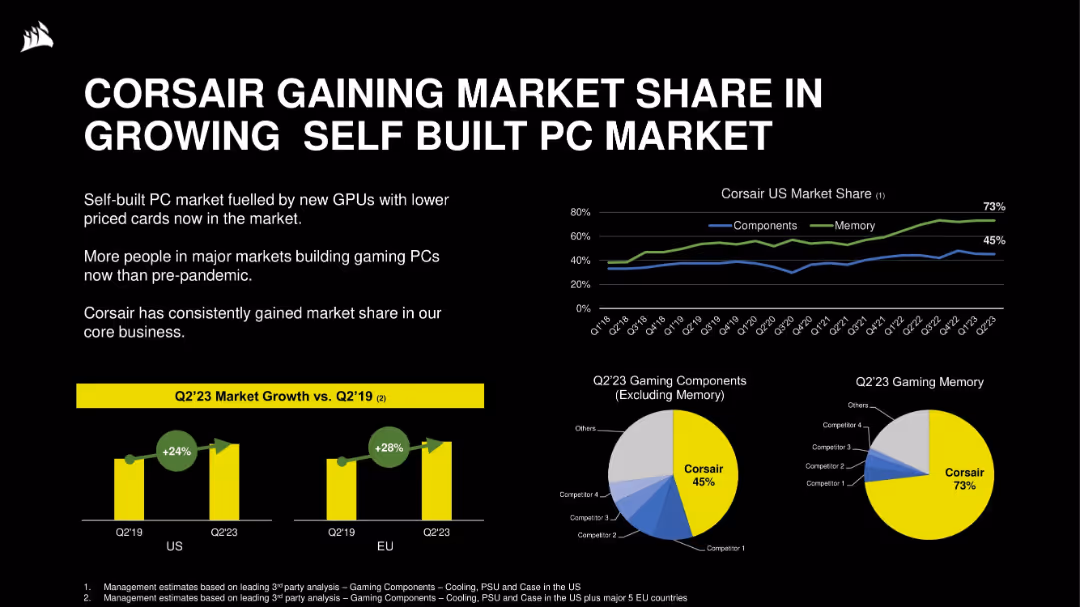
Mixed charts: line chart (US market share), bar chart (market growth), and pie charts (component and memory share). Black background with vibrant accent colors.
Competitive Landscape
Technology & Software
This slide demonstrates Corsair’s market share gains in the gaming hardware space. It presents evidence of dominance in memory (73%) and strong performance in components (45%), backed by market growth since Q2’19 in both US and EU regions.
Corsair, market share, PC components, memory, growth, self-built PC, competitors, Q2’23, hardware
false
Competitive Landscape
Technology & Software
Multiple Chart
Goldman Sachs
Add to my slides
Remove from favorites
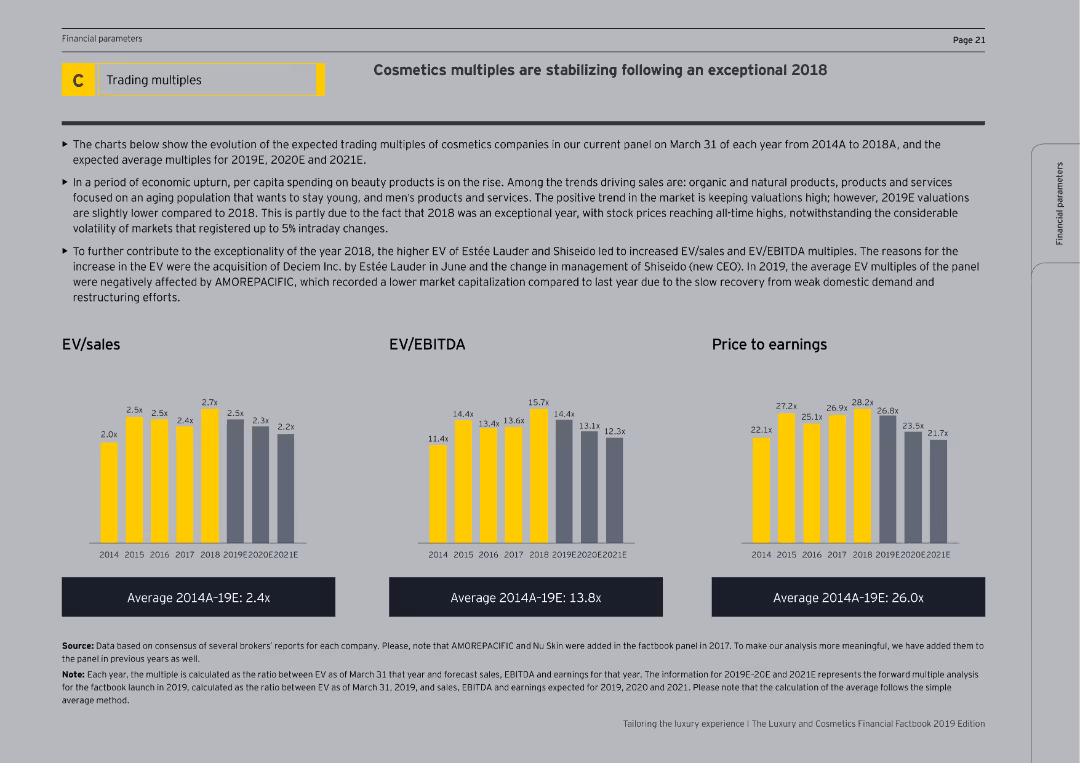
The slide includes column charts showing EV/sales, EV/EBITDA, and price to earnings ratios from 2014 to 2021E. The slide is moderately complex with a thorough analysis of the cosmetics market and factors affecting these financial multiples.
Market Analysis and Trends
Consumer Goods
The slide discusses the stabilization of cosmetics multiples following an exceptional 2018, presenting EV/sales, EV/EBITDA, and price to earnings ratios. It explains market trends, including increased spending on beauty products and the impact of organic and natural products on valuations.
Cosmetics, EV/Sales, EV/EBITDA, Price to Earnings
false
Market Analysis and Trends
Consumer Goods
Multiple Chart
EY
Add to my slides
Remove from favorites
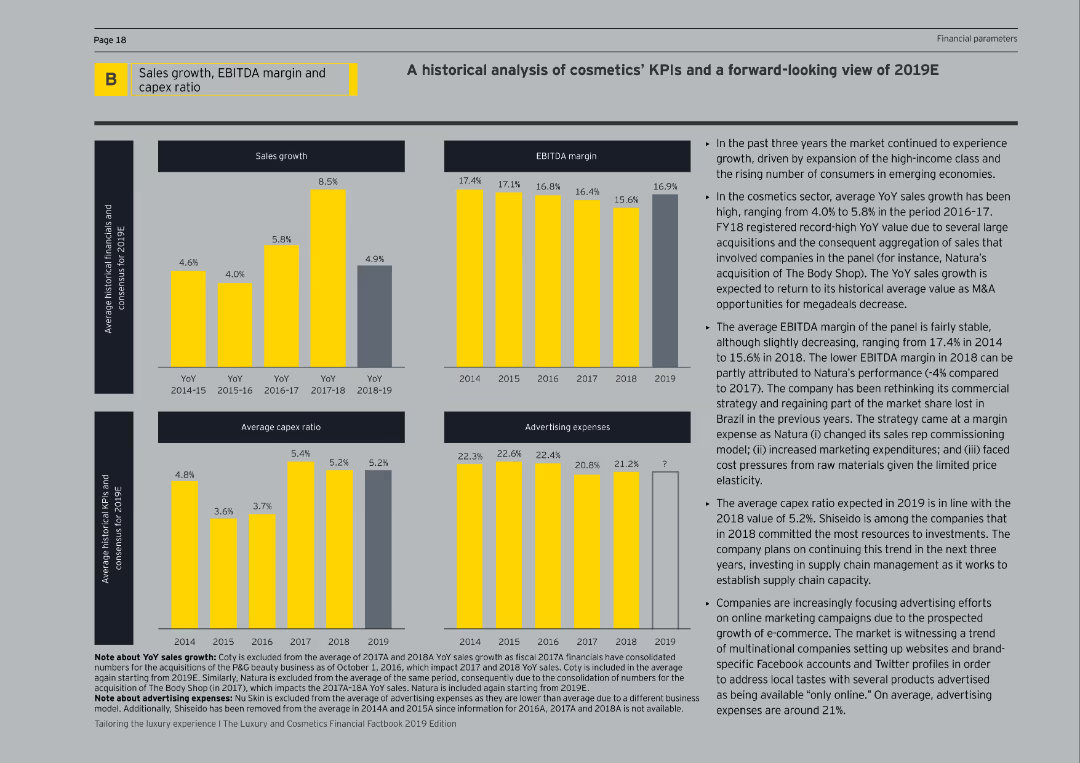
The slide includes multiple column charts detailing sales growth, EBITDA margin, average capex ratio, and advertising expenses over several years. The text description is on the right, explaining the trends and providing future expectations.
Market Analysis and Trends
Consumer Goods
This slide offers a historical analysis of key performance indicators (KPIs) in the cosmetics sector, focusing on sales growth, EBITDA margin, capex ratio, and advertising expenses. It also provides a forward-looking view for 2019, highlighting market drivers and expected performance.
Cosmetics, KPIs, Sales Growth, EBITDA, Capex
false
Market Analysis and Trends
Consumer Goods
Multiple Chart
EY
Add to my slides
Remove from favorites
The slide displays a series of bar charts detailing the percentage of respondents planning cost actions in 2023, segmented by region and type of action like redesigning processes or simplifying organizational structures.
Market Analysis and Trends
Financial Services
This slide presents the strategic plans for cost reduction and improving efficiency in 2023 across different regions, comparing North America, Europe, and Asia in their approaches to handling operational models and organizational structures.
cost actions, organizational efficiency, operational model, regional comparison
false
Market Analysis and Trends
Financial Services
Multiple Chart
BCG
Add to my slides
Remove from favorites
This slide presents Australia's capabilities across various sectors of the battery value chain using column charts and color gradients.
Market Analysis and Trends
Energy & Utilities
Discusses how Australia can utilize cost and differentiation strategies to be competitive in the global battery market.
cost advantage, differentiation, Australia, battery industry
false
Market Analysis and Trends
Energy & Utilities
Mixed Chart
Accenture
Add to my slides
Remove from favorites
Slide includes detailed bar charts showing costs breakdown for FY 2023 and Q4, with annotations explaining key variances and effects.
Financial Performance
Financial Services
Analyzes adjusted costs for FY 2023 and Q4, emphasizing changes in compensation, IT, and professional services.
cost analysis, FY 2023, Q4 2023, financial management, expenses
false
Financial Performance
Financial Services
Multiple Chart
Deutsche Bank
Add to my slides
Remove from favorites
Column charts showing operating expenses, RWA, and achievements in cost reduction
Operational Efficiency
Financial Services
Details cost reductions, balance sheet management, and underlying operating expenses
cost, balance, reductions, efficiency
false
Operational Efficiency
Financial Services
Multiple Chart
UBS
Add to my slides
Remove from favorites
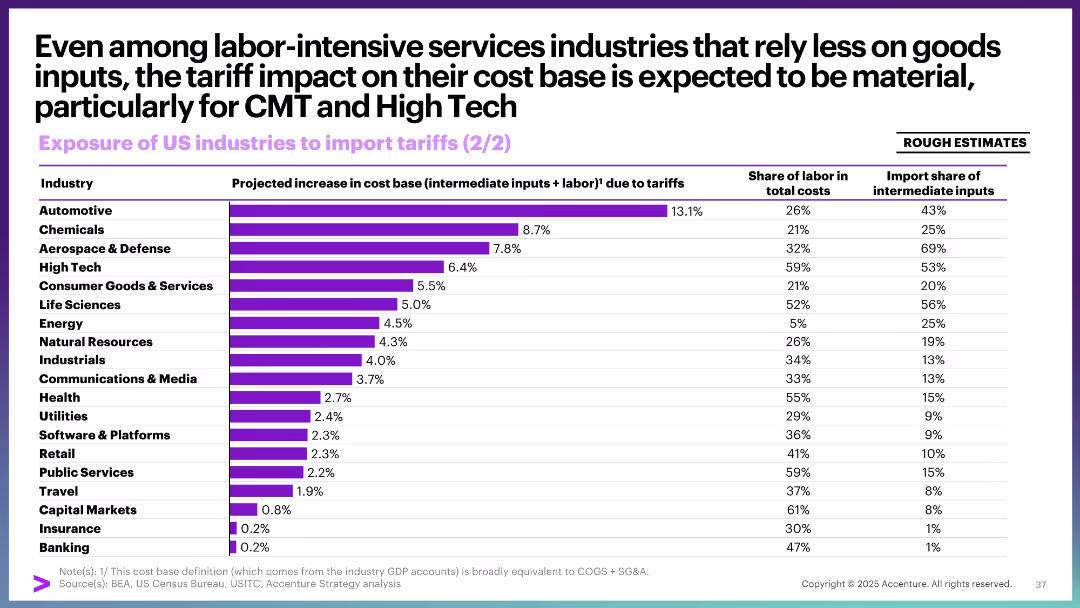
Horizontal bar chart with three data columns: cost impact, labor share, import share
Risk Assessment and Management
Industrial & Manufacturing
This slide analyzes the broader cost base impact of tariffs, even for labor-intensive sectors. It includes data on cost increases, labor share of total costs, and the import share of inputs. High Tech, Aerospace, and Automotive show significant cost increases.
cost base, tariffs, labor-intensive, input costs, import dependency, industry impact
false
Risk Assessment and Management
Industrial & Manufacturing
Single Chart
Accenture
Add to my slides
Remove from favorites
Features multiple bar charts comparing costs in different countries with annotations for potential cost reductions.
Market Analysis and Trends
Energy & Utilities
Evaluates how Australia could become more competitive in the battery sector by refining costs and optimizing production efficiency.
cost competitiveness, refining, Australia, battery industry
false
Market Analysis and Trends
Energy & Utilities
Multiple Chart
Accenture
Add to my slides
Remove from favorites
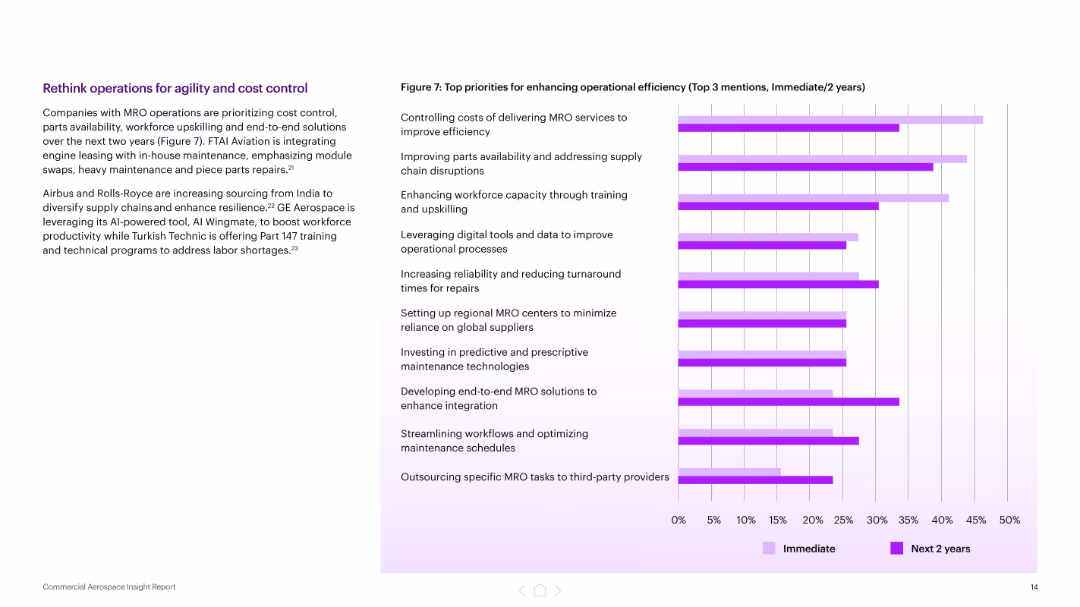
Split layout with explanatory text and a dual-bar chart showing priorities by time horizon
Operational Efficiency
Industrial & Manufacturing
The slide identifies top operational efficiency priorities for MRO companies, including cost control, workforce training, and predictive maintenance. A bar graph shows the immediate vs. 2-year focus for each initiative, supporting a forward-looking strategy for agility and resilience.
cost control, operations, MRO, training, predictive maintenance, efficiency, strategy
false
Operational Efficiency
Industrial & Manufacturing
Mixed Chart
Accenture
Add to my slides
Remove from favorites
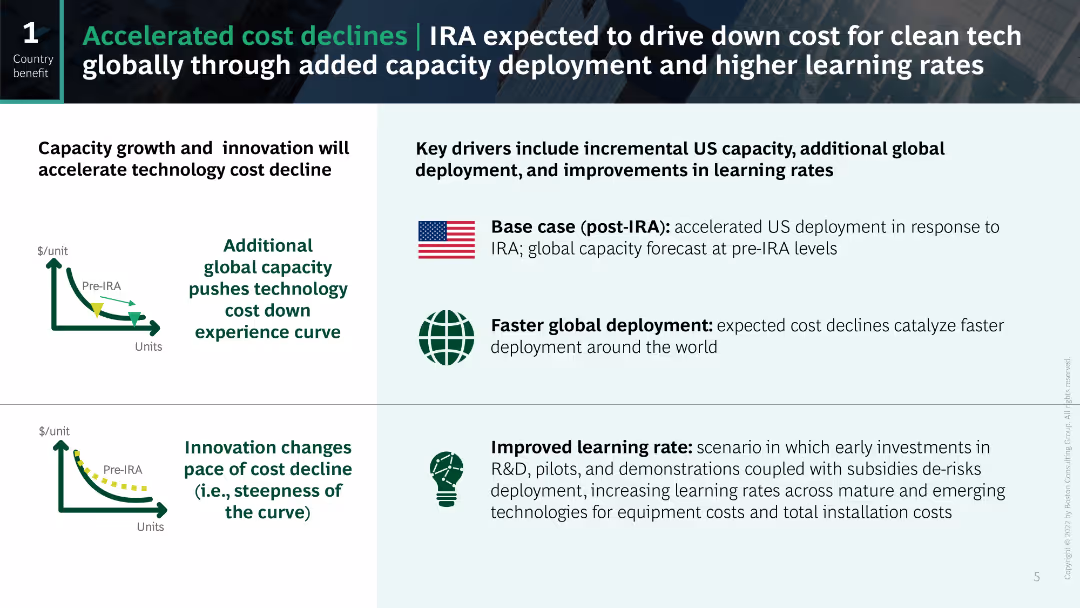
The slide contains a combination of line charts and explanatory text boxes to show cost decline trends and key drivers.
Investment Analysis
Energy & Utilities
The slide explains how the IRA will drive down costs for clean tech through capacity deployment and learning rates.
cost decline, IRA, clean tech, capacity deployment, learning rates
false
Investment Analysis
Energy & Utilities
Header Horizontal
BCG
Add to my slides
Remove from favorites
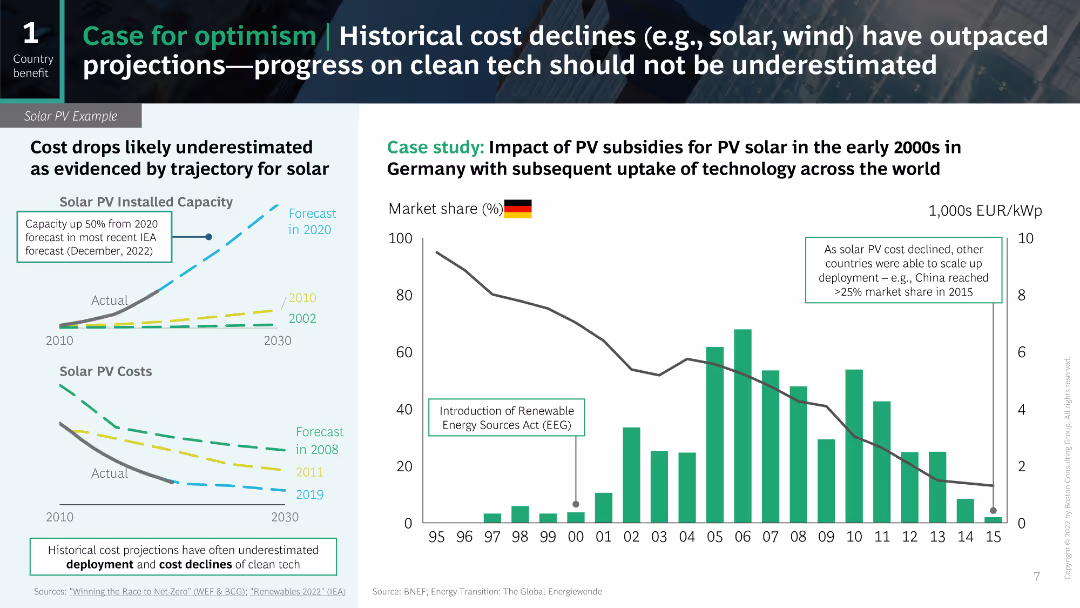
The slide includes line charts and a column chart to show historical and projected cost declines for solar PV technology.
Market Analysis and Trends
Energy & Utilities
The slide provides a case study on the cost declines in solar PV and the underestimated projections for clean tech progress.
cost declines, solar PV, projections, clean tech, case study
false
Market Analysis and Trends
Energy & Utilities
Multiple Chart
BCG
Add to my slides
Remove from favorites
Slide contains a column chart with textual annotations. Layout includes key financial metrics over time.
Financial Performance
Financial Services
Overview of cost efficiencies and projected savings in various areas for a financial institution from 2023 to 2026.
cost, efficiency, 2026, savings, financial
false
Financial Performance
Financial Services
Mixed Chart
Barclays
Add to my slides
Remove from favorites
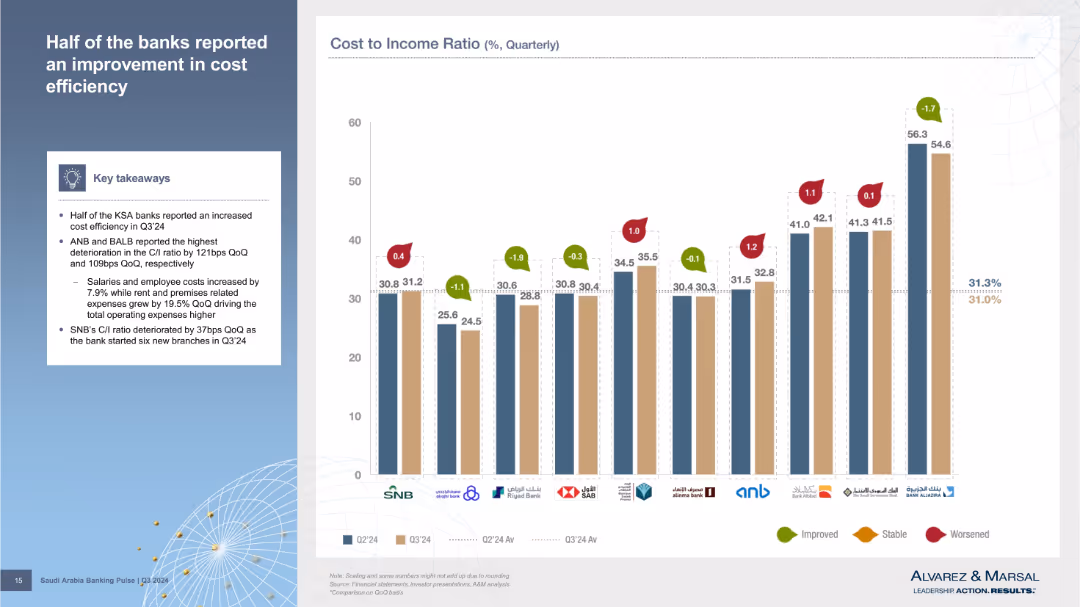
Bar chart showing individual bank C/I ratios for Q2 and Q3’24 with change indicators and a summary box on the left. Each bank's data is represented using color-coded bars and indicators for change direction.
Performance Metrics and KPIs
Financial Services
The chart highlights how various banks performed in terms of cost efficiency, with half showing improvement in their cost-to-income ratios. ANB and BALB had the worst deterioration. Key drivers include increased salaries, rent, and expansion efforts like SNB’s branch openings.
cost efficiency, banks, quarterly comparison, C/I ratio, SNB, ANB, BALB
false
Performance Metrics and KPIs
Financial Services
Mixed Chart
Alvarez & Marsal
Add to my slides
Remove from favorites
The slide includes a scatter plot comparing cost efficiency and capital efficiency among banks. Text boxes explain the efficiency and profitability of UBS's personal and corporate banking.
Operational Efficiency
Financial Services
This slide showcases UBS's cost and capital efficiency, comparing it to Swiss and European peers, and highlights its superior profitability.
Cost Efficiency, Capital Efficiency, UBS, Banking, Profitability
false
Operational Efficiency
Financial Services
Mixed Chart
UBS
Add to my slides
Remove from favorites
A slide with a title, a column chart displaying family law expenditure per finalisation, and a breakdown table of court FTE indicative for FCoA and FCC. Red is used for higher costs, green for lower.
Regulatory and Compliance
Government & Public Sector
The slide offers a cost comparison of family law finalisation in FCoA and FCC, showing the FCC as more cost-effective and discussing the factors contributing to the cost differences between the two courts.
cost efficiency, FCoA, FCC, finalisation expenditure, judicial resource allocation, legal system
false
Regulatory and Compliance
Government & Public Sector
Mixed Chart
PwC/Strategy&
Add to my slides
Remove from favorites
Previous
Next
You don't have any favorites yet.
Please wait loading your favorites slides...
Create a FREE account to continue browsing
Receive Instant Access to 1,000+ slides from companies like McKinsey, Google, and Goldman Sachs
First Name
Last Name
Email
Password
I agree to all
Terms & Privacy Policy
Thank you! Your submission has been received!
Oops! Something went wrong while submitting the form.
Have an account?
Sign in
Upgrade to PRO to Save slides
Advanced Search and Filters
Access to 15,000+ slides
Access to Category Pages
Save/Bookmark Slides
PowerPoint Template Library
Pick a Plan
MONTHLY
$12/month
Billed every month, Cancel anytime.
YEARLY
$9/year
Billed $108 annually, Cancel anytime.
Checkout for $12/month
Checkout for $108/yr
Secured by Stripe | AES-256 bit encryption