My Account
My Slides
Search by Category
Companies
Slide Type
Use Case
Industry
Pricing
Templates
View All Templates
Download Template Slides
✦ AI
AI Prompt Library
AI Search
Feedback
Login
Logout
Get Started
Browse all Slides
Browse all Slides
Create a FREE Account
Instant access to 1,000+ real slides from top companies like McKinsey, BCG, Goldman Sachs, Google and many more!
First Name
Last Name
Email
Password
I agree to all
Terms & Privacy Policy
Thank you! Your submission has been received!
Oops! Something went wrong while submitting the form.
Have an account?
Sign in
Saved Slides
Total No. of slides saved
0
↻ Refresh
✖ Clear all
Contains multiple bar charts aligned horizontally displaying the percentages of consumers delaying, maintaining, or increasing vehicle maintenance and repairs post-COVID-19. Colors differentiate actions across several countries.
Market Analysis and Trends
Transportation & Logistics
Discusses the impact of COVID-19 on consumer behaviors related to vehicle maintenance and repair, showing trends of postponement and additional work done across different nations.
COVID-19 impact, vehicle maintenance, consumer behavior, repair trends, international comparison
false
Market Analysis and Trends
Transportation & Logistics
Single Chart
McKinsey
Add to my slides
Remove from favorites
This slide features multiple bar charts detailing the impact of COVID-19 on various industries like hotels, food services, and entertainment in New York. It shows year-over-year changes in unemployment claims and daily worker hours. Colors differentiate industries for clarity.
Risk Assessment and Management
Financial Services
Analyzes sector-specific impacts of COVID-19, highlighting industries like hospitality and retail severely affected. Suitable for discussions on risk management and strategic planning in response to economic downturns.
COVID-19, industries, unemployment, hospitality, retail, risk management, New York, sector analysis
false
Risk Assessment and Management
Financial Services
Multiple Chart
BCG
Add to my slides
Remove from favorites
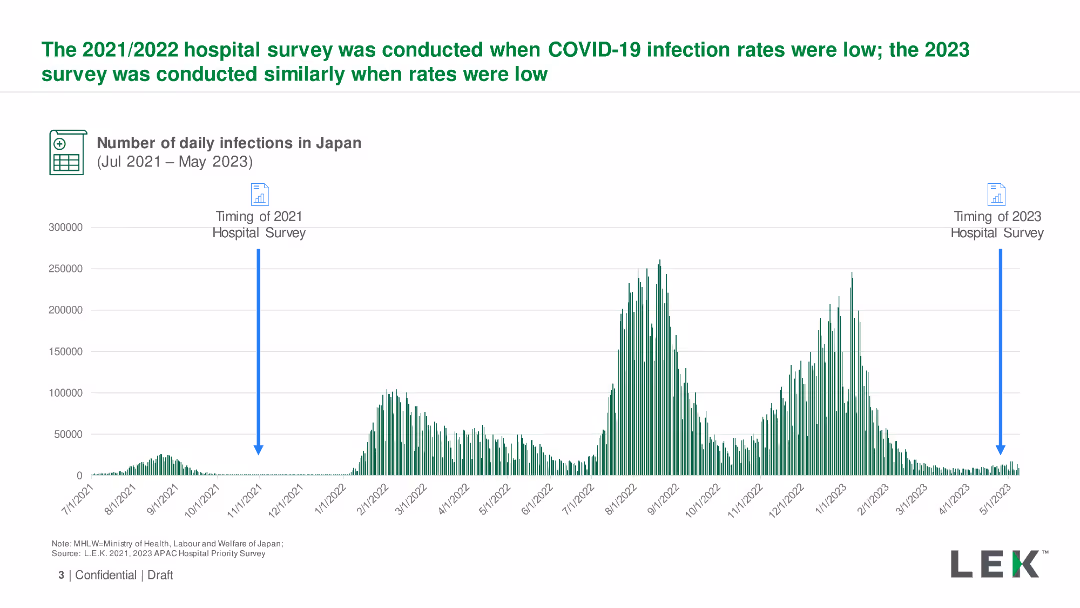
Line chart showing COVID-19 infection rates in Japan from July 2021 to May 2023. Key survey timings are marked. Moderate density with data.
Market Analysis and Trends
Healthcare & Pharmaceuticals
Overview of the timing of hospital surveys in Japan in relation to COVID-19 infection rates, providing context for the survey results.
COVID-19, Infection Rates, Survey Timing, Japan, Hospitals
false
Market Analysis and Trends
Healthcare & Pharmaceuticals
Single Chart
LEK
Add to my slides
Remove from favorites
The slide presents an array of images from various dates and sources, reflecting the ongoing conversation about innovation in response to COVID-19. The design is a grid collage on a black background, with each image given a white border and captioned with the publication date and source. The arrangement is methodical, allowing for each image to contribute to the overall narrative about the importance of innovation.
Technology and Digital Transformation
Technology & Software
This slide depicts a selection of news headlines emphasizing the priority of innovation during the COVID-19 pandemic across different sectors. It serves to underscore the critical role of innovation in addressing global challenges and could be used to illustrate the push for innovation in healthcare, policy, and technology. This visual summary of global news can aid discussions about the cross-industry focus on innovation in light of the pandemic.
COVID-19, innovation priority, global news, healthcare, technology
false
Technology and Digital Transformation
Technology & Software
Header Vertical
BCG
Add to my slides
Remove from favorites
Displays a line chart showing trends in prioritization of innovation, core business, and other aspects during and post-COVID-19 crisis.
Strategic Planning
Professional Services
Analyzes shifts in business focus on innovation during the COVID-19 crisis, highlighting how priorities changed over time and the implications for business strategy post-crisis.
COVID-19, innovation, trends, crisis management, business strategy, core business
false
Strategic Planning
Professional Services
Single Chart
McKinsey
Add to my slides
Remove from favorites
The slide contains two horizontal bar charts on a background image of an airplane, with a cityscape in the background. The charts illustrate investment impacts.
Risk Assessment and Management
Financial Services
Discusses how the Covid-19 pandemic might affect investment strategies in Italy, focusing on sector and country-specific changes, based on investor opinions.
Covid-19, investment, strategy, Italy, impact, sector focus, country focus, investor opinion
false
Risk Assessment and Management
Financial Services
Multiple Chart
EY
Add to my slides
Remove from favorites
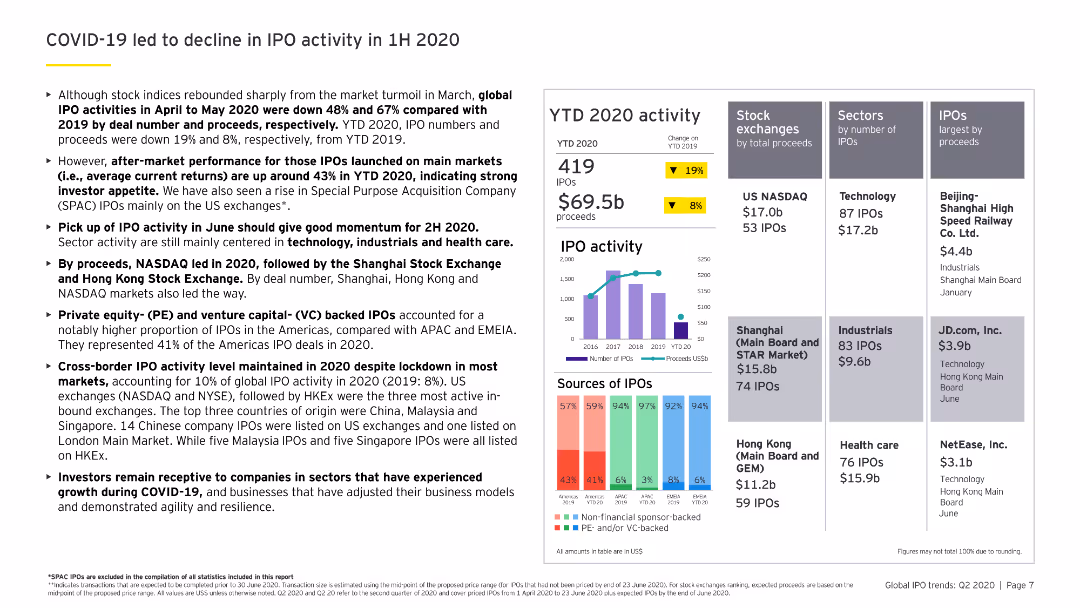
The slide includes various column charts and a bar chart illustrating IPO activities, sources of IPOs, and sectors affected in YTD 2020 compared to YTD 2019.
Risk Assessment and Management
Financial Services
Analyzes the impact of COVID-19 on global IPO activities in the first half of 2020, highlighting the decline in the number of IPOs and proceeds, and identifying key sectors.
COVID-19, IPO decline, 1H 2020, sector impact, financial performance
false
Risk Assessment and Management
Financial Services
Multiple Chart
EY
Add to my slides
Remove from favorites
Displays a column chart detailing the impact of COVID-19 on job satisfaction among deskless workers in France versus a general overview, using shades of green, grey, and red.
Operational Efficiency
Professional Services
Examines the impact of COVID-19 on job satisfaction levels among deskless workers, providing insights into the pandemic’s effects on employee morale.
COVID-19, job satisfaction, impact, deskless workers, column chart
false
Operational Efficiency
Professional Services
Multiple Chart
BCG
Add to my slides
Remove from favorites
Column chart showing potential layoffs percentages due to COVID-19, with varying probabilities. The slide uses a soft blue floral background, adding a visual contrast to the stark data presented.
Human Resources and Talent Management
Professional Services
Discusses the uncertainty and potential for layoffs due to COVID-19, making it relevant for discussions in HR and strategic business planning sessions.
COVID-19, layoffs, business impact, uncertainty
false
Human Resources and Talent Management
Professional Services
Single Chart
McKinsey
Add to my slides
Remove from favorites
Timeline representation with key milestones and decisions made by India, Australia, and Spain regarding lockdown measures in response to COVID-19.
Risk Assessment and Management
Government & Public Sector
Outlines the progression of lockdown measures and responses to possible second waves in various countries.
COVID-19, Lockdown Measures, Second Wave, Policy Response
false
Risk Assessment and Management
Government & Public Sector
Linear Flow
BCG
Add to my slides
Remove from favorites
A scatter plot chart showing cumulative number of cases per million population juxtaposed against a ratio of total tests to total cases for various countries, within a gradient green background indicating preparedness.
Market Analysis and Trends
Healthcare & Pharmaceuticals
Analyzes countries' testing rates in relation to COVID-19 cases to evaluate readiness for relaxing lockdown measures, providing insights into public health strategies.
COVID-19, lockdown measures, testing rates, public health, cumulative cases, preparedness, relax lockdown
false
Market Analysis and Trends
Healthcare & Pharmaceuticals
Mixed Chart
BCG
Add to my slides
Remove from favorites
Slide contains multiple line graphs depicting infection fatality rates and immunity duration scenarios, color-coded for severity impact, with detailed explanatory text and references.
Strategic Planning
Healthcare & Pharmaceuticals
Provides a scenario analysis of long-term COVID-19 impacts based on infection fatality rates and immunity durations, critical for future healthcare strategy and policy planning.
COVID-19, long-term impact, infection fatality rate, immunity duration, scenario planning, healthcare strategy
false
Strategic Planning
Healthcare & Pharmaceuticals
Mixed Chart
McKinsey
Add to my slides
Remove from favorites
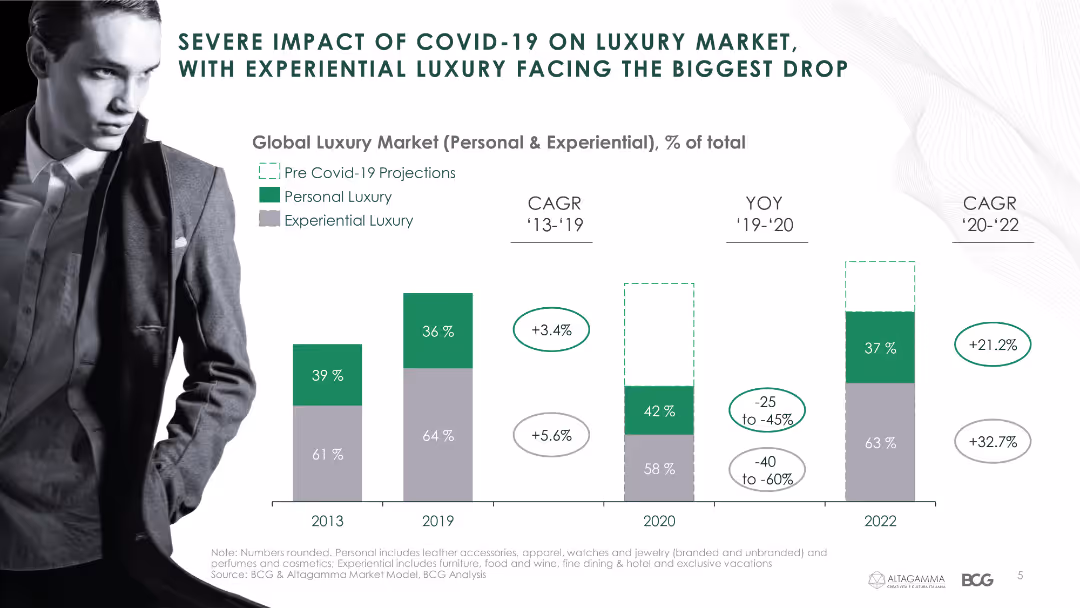
The slide features a column chart depicting the impact of COVID-19 on the luxury market, differentiating between personal and experiential luxury with various metrics.
Market Analysis and Trends
Consumer Goods
This slide illustrates the projected and actual impact of COVID-19 on the luxury market, highlighting changes in CAGR and YOY metrics.
COVID-19, luxury market, projections, personal luxury, experiential luxury, CAGR, YOY
false
Market Analysis and Trends
Consumer Goods
Single Chart
BCG
Add to my slides
Remove from favorites
Contains two line graphs showing the progression of COVID-19 cases in various countries, categorized by stages of the outbreak.
Market Analysis and Trends
Professional Services
Analyzes the progression of COVID-19 by categorizing markets into 'Advancing' or 'Stabilizing' based on case trends and government actions.
COVID-19, Market Analysis, Advancing, Stabilizing, Government Actions, Case Trends, Line Graphs, Global Perspective
false
Market Analysis and Trends
Professional Services
Multiple Chart
Accenture
Add to my slides
Remove from favorites
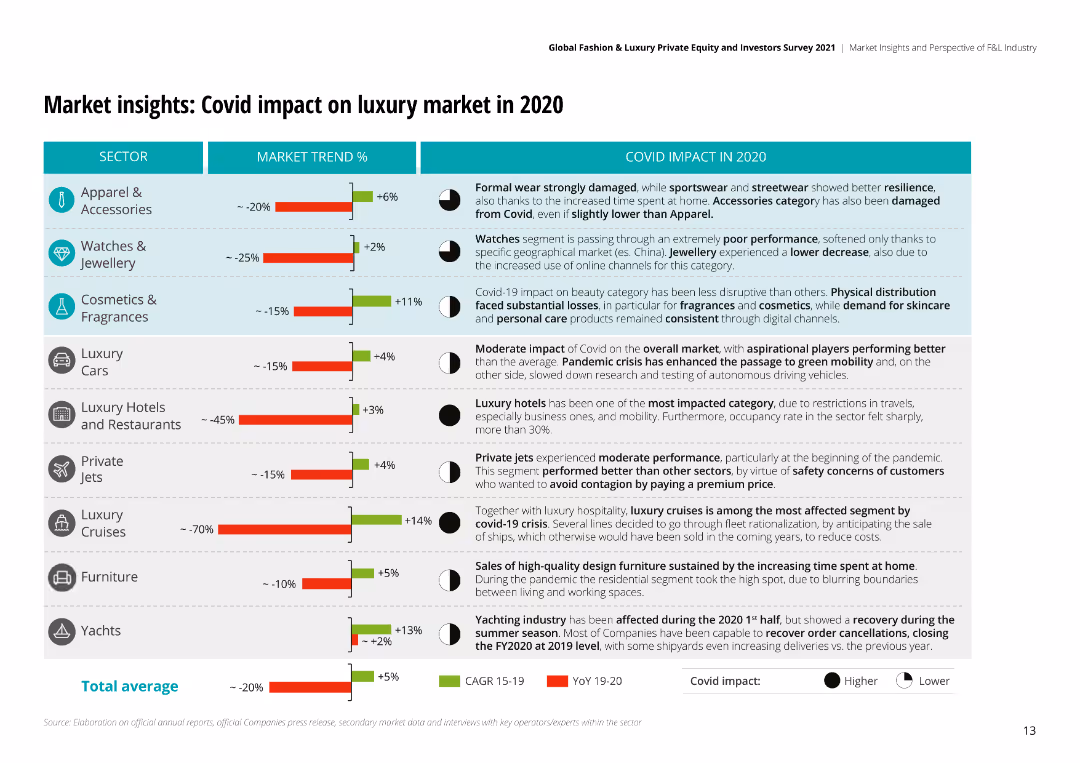
The slide uses a combination of bar charts and textual analysis to detail the impact of COVID-19 on different luxury sectors, including percentages of market trends.
Market Analysis and Trends
Retail & E-commerce
Analyzes the impact of COVID-19 on the luxury market, showing how various sectors like apparel, watches, and hotels were affected during the pandemic.
COVID-19, market impact, luxury, retail, e-commerce, apparel, watches, analysis
false
Market Analysis and Trends
Retail & E-commerce
Mixed Chart
Deloitte
Add to my slides
Remove from favorites
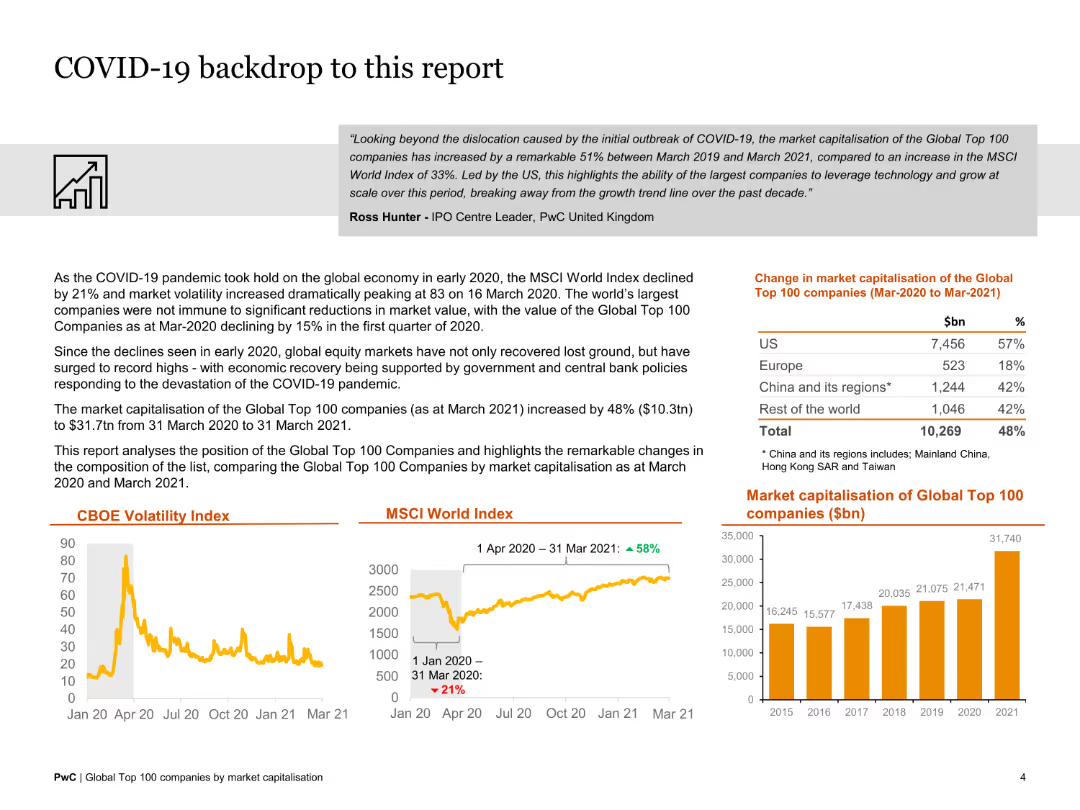
This slide features a mix of text and visual elements, including column charts, line graphs, and data tables. The design is moderately dense with a focus on market capitalization.
Market Analysis and Trends
Financial Services
The slide discusses the impact of COVID-19 on market volatility and the market capitalization of the top 100 companies, comparing data from March 2020 to March 2021.
COVID-19, market volatility, capitalization, impact, 2020-2021, financial analysis, global economy
false
Market Analysis and Trends
Financial Services
Multiple Chart
PwC/Strategy&
Add to my slides
Remove from favorites
Column chart with different concerns people have during COVID-19, showing data comparison between May 2020 and Dec 2020.
Market Analysis and Trends
Healthcare & Pharmaceuticals
Highlights major worries about physical and mental health of family and friends during COVID-19, comparing data between two time points.
COVID-19, mental health, physical health, comparison, family concerns
false
Market Analysis and Trends
Healthcare & Pharmaceuticals
Single Chart
IPSOS
Add to my slides
Remove from favorites
Comprises a descriptive text and a series of bar charts illustrating adherence levels to public health guidelines, segmented by millennials and Gen Z.
Client Case Studies
Healthcare & Pharmaceuticals
Reviews the adherence of millennials and Gen Z to COVID-19 health guidelines, providing statistical insights and societal behaviors.
COVID-19, Millennials, Gen Z, Health Guidelines, Social Research
false
Client Case Studies
Healthcare & Pharmaceuticals
Mixed Chart
Deloitte
Add to my slides
Remove from favorites
Map highlighting surveyed regions, icons representing survey waves and respondent statistics.
Market Analysis and Trends
Transportation & Logistics
Summarizes the scope and methodology of a global survey on automotive and mobility trends amid COVID-19.
COVID-19, Mobility, Survey, Global, Automotive
false
Market Analysis and Trends
Transportation & Logistics
Pillar
McKinsey
Add to my slides
Remove from favorites
Combined line and column charts showing non-residential movement trends and weekly city movement during COVID-19 across various countries.
Operational Efficiency
Transportation & Logistics
Analyzes mobility patterns during the COVID-19 pandemic to assess impacts on transportation and logistics sectors. Useful for planning urban mobility and public transport strategies.
COVID-19, mobility, transportation, logistics, urban planning
false
Operational Efficiency
Transportation & Logistics
Multiple Chart
BCG
Add to my slides
Remove from favorites
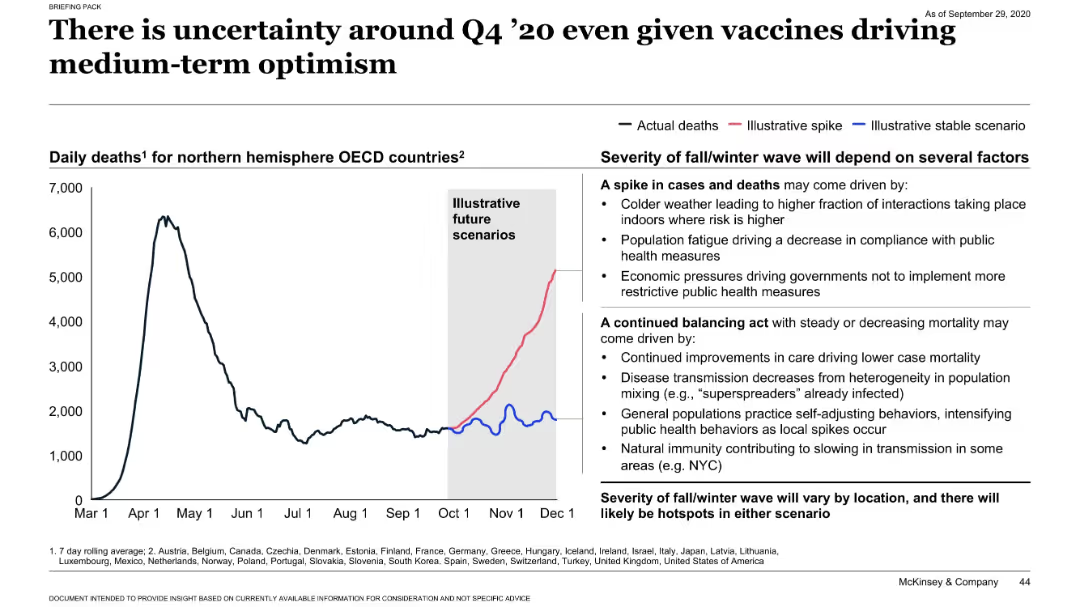
Line chart showing daily deaths and future scenario projections; side panel lists factors driving potential outcomes.
Risk Assessment and Management
Healthcare & Pharmaceuticals
This slide presents possible COVID-19 mortality trends in Q4 2020. It compares actual death rates with projected spikes or stable scenarios. Key factors influencing outcomes include seasonality, public fatigue, compliance with measures, and emerging immunity. It emphasizes regional variability and uncertainty in projections.
COVID-19, mortality, forecast, uncertainty, public health, seasonal trend
false
Risk Assessment and Management
Healthcare & Pharmaceuticals
Mixed Chart
McKinsey
Add to my slides
Remove from favorites
Bar graphs displaying user reliance levels on nbn™ network during COVID-19, visual markers for household upgrades, and supportive text on the side.
Strategic Planning
Technology & Software
Details the critical role of the nbn™ network in keeping users connected for entertainment and support during the pandemic, leading to many upgrading their plans.
COVID-19, nbn network, family connectivity, entertainment reliance, plan upgrades, pandemic response, user reliance, household data
false
Strategic Planning
Technology & Software
Multiple Chart
Accenture
Add to my slides
Remove from favorites
The slide features a complex graph plotting activities by enjoyment and time, with a dotted trend line indicating an increase in work-related activities during COVID-19.
Market Analysis and Trends
Technology & Software
It explores the significant increase in time spent on work-related services over the nbn network due to the pandemic, with a focus on LinkedIn, emails, and web browsing.
COVID-19, nbn network, work activities, time increase, remote work, online engagement, LinkedIn, emails
false
Market Analysis and Trends
Technology & Software
Multiple Chart
Accenture
Add to my slides
Remove from favorites
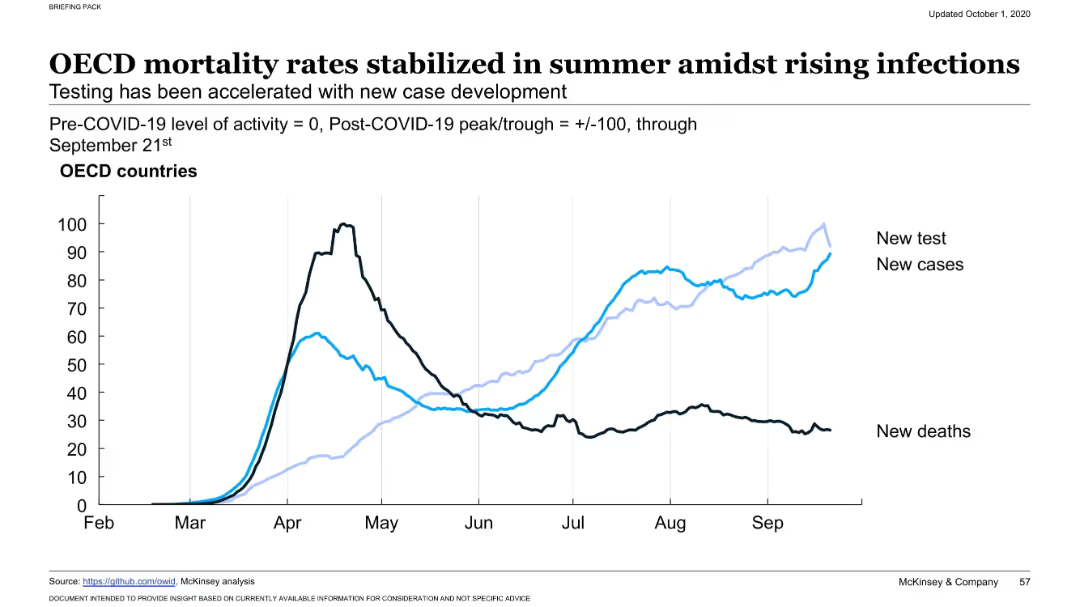
Dual-axis line chart with three data series (new tests, new cases, new deaths) over time. Labels distinguish the series. X-axis runs from February to September. Black and blue lines track different outcomes.
Risk Assessment and Management
Healthcare & Pharmaceuticals
Illustrates that while COVID-19 testing and cases were rising again by late summer, mortality rates in OECD countries had stabilized or declined, implying improved clinical management or treatment effectiveness despite case growth.
COVID-19, OECD, testing rates, new infections, mortality, stabilization, health impact, virus resurgence, summer trend, healthcare capacity
false
Risk Assessment and Management
Healthcare & Pharmaceuticals
Single Chart
McKinsey
Add to my slides
Remove from favorites
The slide features a column chart comparing growth/decline in oil demand from 2019 to 2035 by underlying driver, including economic development and fuel efficiencies.
Market Analysis and Trends
Industrial & Manufacturing
The slide analyzes the impact of COVID-19 on oil demand in comparison to other factors like economic development and fuel efficiencies.
COVID-19, oil demand, behavioral shifts, economic development, fuel efficiency
false
Market Analysis and Trends
Industrial & Manufacturing
Boxed
McKinsey
Add to my slides
Remove from favorites
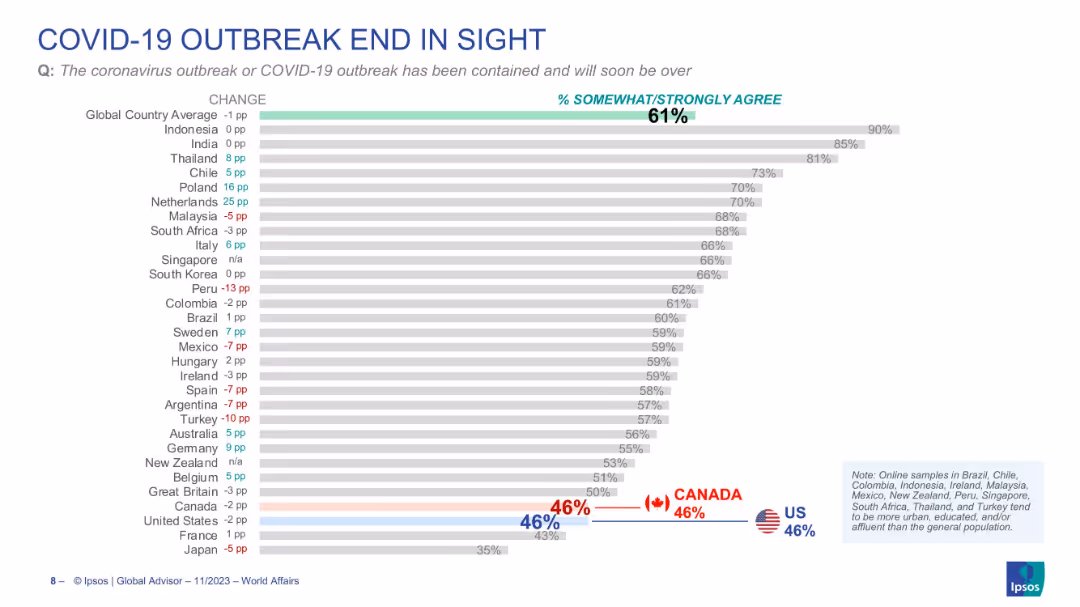
Horizontal bar chart with country comparisons, percentage values, and a central highlighted global average. Data is organized by descending agreement rate.
Market Analysis and Trends
Healthcare & Pharmaceuticals
The slide presents survey data showing the percentage of respondents in various countries who believe the COVID-19 outbreak has been contained and will soon be over. It includes comparison bars by country with % change from previous surveys. Global average is 61%, with countries like Indonesia (90%) and India (85%) being most optimistic.
COVID-19, outbreak, containment, perception, Ipsos, survey, country comparison, pandemic, global opinion, healthcare sentiment
false
Market Analysis and Trends
Healthcare & Pharmaceuticals
Single Chart
IPSOS
Add to my slides
Remove from favorites
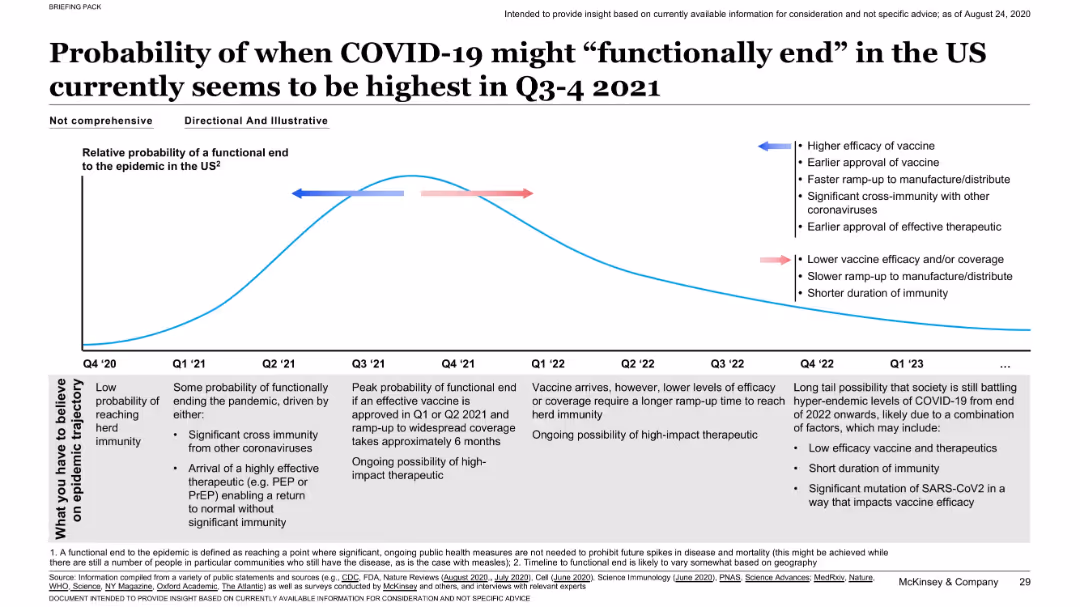
Line chart with a curve representing relative probability over time; annotated with influencing factors; timeline spans Q4 2020 to Q1 2023.
Strategic Planning
Healthcare & Pharmaceuticals
Estimates peak probability for functional end of the pandemic in Q3–Q4 2021, influenced by vaccine efficacy, speed of distribution, and therapeutic developments. Scenarios for faster or slower progress are annotated.
COVID-19, pandemic end, vaccine, immunity, timeline, probability
false
Strategic Planning
Healthcare & Pharmaceuticals
Mixed Chart
McKinsey
Add to my slides
Remove from favorites
Bar chart format, showing low concern levels for Covid-19 globally; tracks change over time.
Regulatory and Compliance
Healthcare & Pharmaceuticals
Displays a significant drop in public concern over Covid-19, with most countries under 5%. The world average is 3%, signaling a diminished pandemic focus as the world adapts to post-pandemic normalcy.
Covid-19, pandemic, healthcare concern, public health, survey, Ipsos, recovery, disease awareness, compliance, perception
false
Regulatory and Compliance
Healthcare & Pharmaceuticals
Single Chart
IPSOS
Add to my slides
Remove from favorites
Black line graph with time axis from 2008 to 2025; notable spikes in 2009 (Swine flu) and 2020–2021.
Market Analysis and Trends
Healthcare & Pharmaceuticals
Tracks public concern over pandemics, with a dramatic peak in April 2020 during COVID-19. Smaller peaks correspond to Ebola and swine flu. Concern plummets post-2022.
COVID-19, pandemic, healthcare, public opinion, Ipsos, H1N1, Ebola, virus, disease, health concern
false
Market Analysis and Trends
Healthcare & Pharmaceuticals
Single Chart
IPSOS
Add to my slides
Remove from favorites
The slide includes pie charts depicting the impact of COVID-19 on home purchasing in Ontario.
Market Analysis and Trends
Real Estate & Construction
It discusses how the pandemic affected the timing of home purchases, with a majority buying earlier than expected.
COVID-19, pandemic, home purchasing, impact, timing, Ontario, pie chart, earlier, expected, analysis
false
Market Analysis and Trends
Real Estate & Construction
Multiple Chart
IPSOS
Add to my slides
Remove from favorites
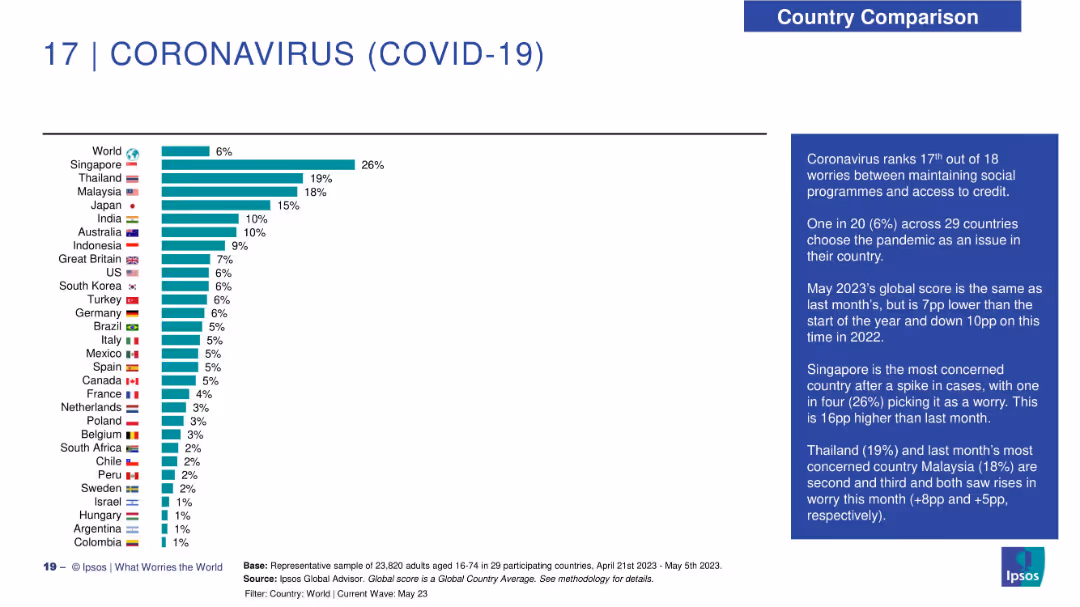
Bar chart ranking countries by concern about COVID-19; right-hand narrative box contextualizes findings.
Risk Assessment and Management
Healthcare & Pharmaceuticals
COVID-19 concern has dropped significantly worldwide, with a 6% global average. Singapore ranks highest (26%) after a recent spike, followed by Thailand (19%) and Malaysia (18%). The chart and commentary reflect declining pandemic-related anxiety across most regions.
COVID-19, pandemic, Ipsos, public health, declining concern, Singapore, global trends, May 2023
false
Risk Assessment and Management
Healthcare & Pharmaceuticals
Mixed Chart
IPSOS
Add to my slides
Remove from favorites
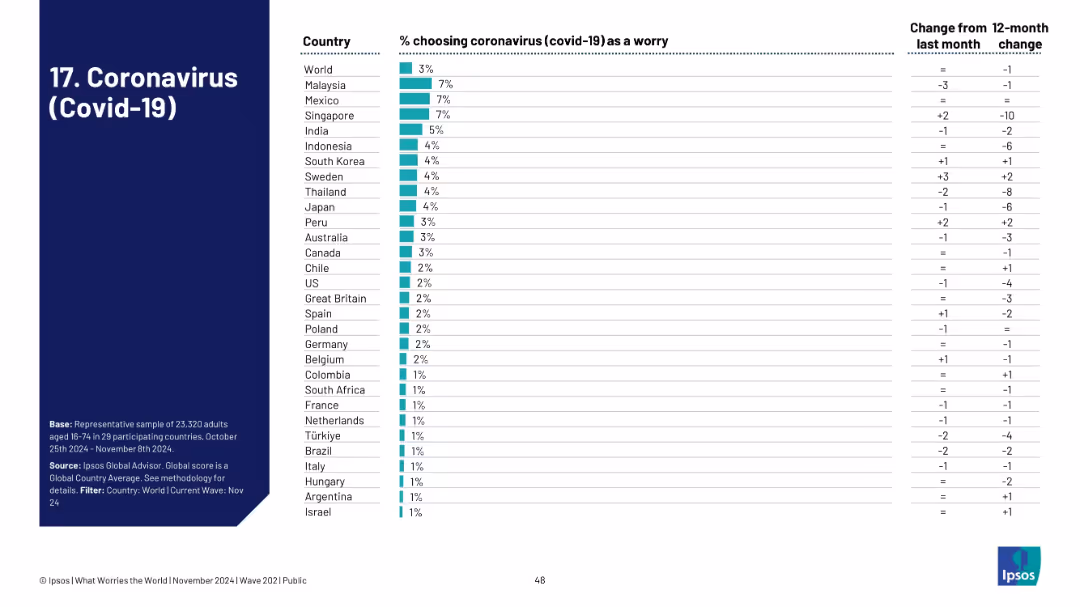
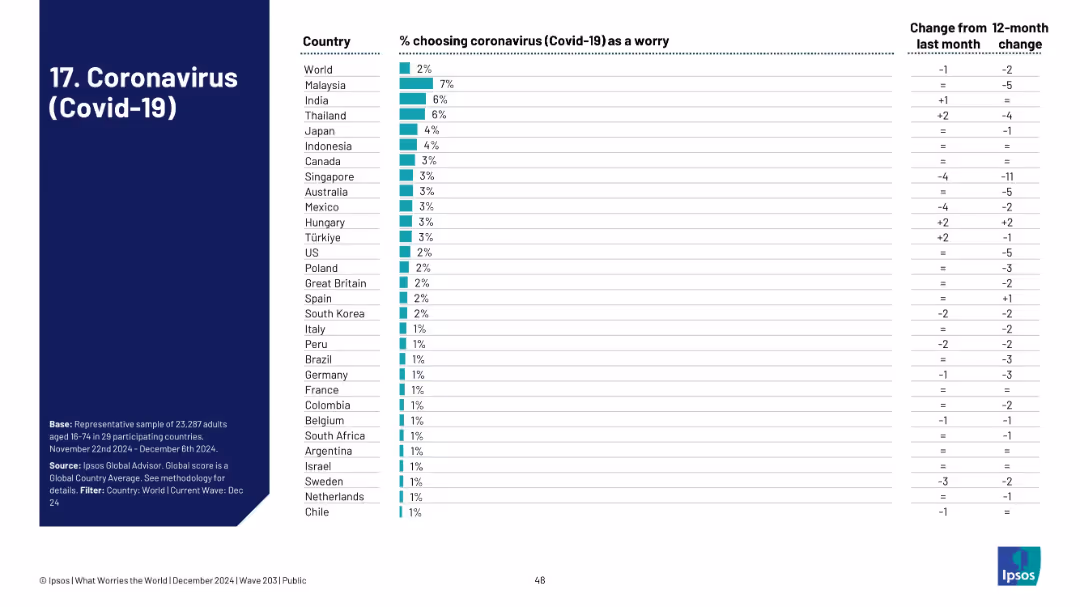
Bar chart showing coronavirus concern levels by country, including global score and trend shifts from prior months and year.
Risk Assessment and Management
Healthcare & Pharmaceuticals
The pandemic now registers only 2% global concern, a dramatic drop. Malaysia and India are relatively higher. The chart reveals a steep global decline in COVID-19 as a pressing issue, signaling a post-pandemic sentiment shift.
COVID-19, pandemic, public health, global recovery, Ipsos, declining concern
false
Risk Assessment and Management
Healthcare & Pharmaceuticals
Single Chart
IPSOS
Add to my slides
Remove from favorites
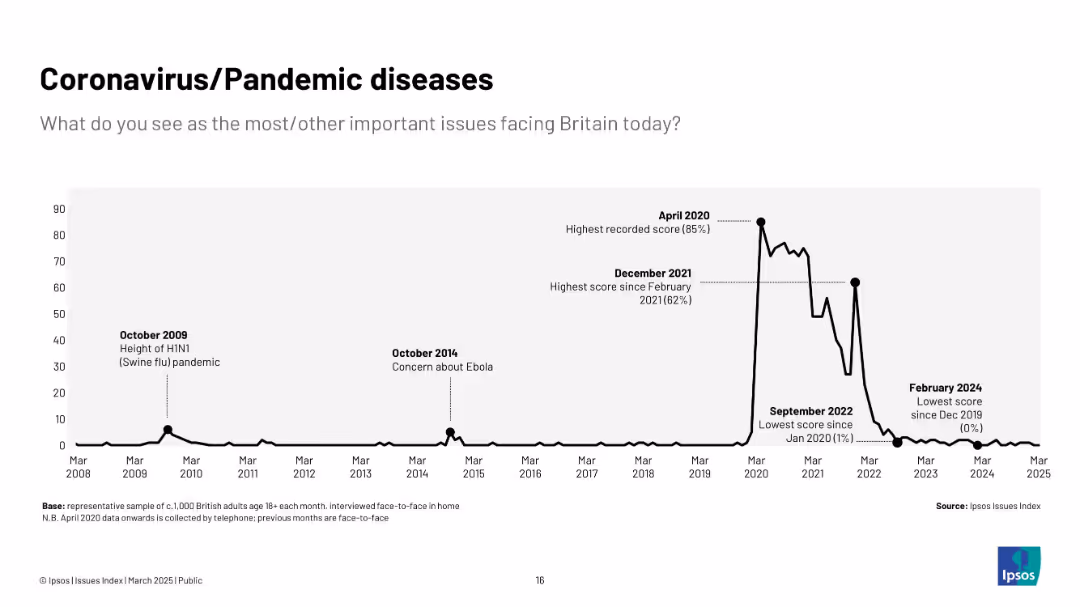
Sharp spike chart showing concern during COVID-19; 2008–2025 timeline; significant peaks labeled (e.g., April 2020, Dec 2021).
Risk Assessment and Management
Healthcare & Pharmaceuticals
Highlights the surge in concern during COVID-19 with peak concern in April 2020. Shows rapid decline by 2023 with minimal ongoing concern.
COVID-19, pandemic, virus, healthcare, UK, Ipsos, public concern, risk
false
Risk Assessment and Management
Healthcare & Pharmaceuticals
Single Chart
IPSOS
Add to my slides
Remove from favorites
Pie chart and accompanying text estimating the duration of COVID-19's impact on personal finances. Different time frames are shown as segments of the pie chart.
Market Analysis and Trends
Financial Services
This slide shows Canadian investors' perceptions of how long COVID-19 will affect their personal finances. It includes predictions ranging from a few months to more than 18 months, highlighting uncertainties and differences based on demographics.
COVID-19, Personal Finances, Canadian, Duration, Impact
false
Market Analysis and Trends
Financial Services
Mixed Chart
IPSOS
Add to my slides
Remove from favorites
Diagram split into three phases—Flatten, Fight, Future—detailing responses and strategic actions in managing the pandemic's impact.
Strategic Planning
Government & Public Sector
Analyzes the phased strategic responses to COVID-19, useful for government and health sectors planning long-term recovery and response strategies.
COVID-19, phases, strategy, government, health, recovery, response
false
Strategic Planning
Government & Public Sector
Linear Flow
BCG
Add to my slides
Remove from favorites
Slide features a comparative visual of two maps of the US, one for each date, showing COVID-19 prevalence by state with a color gradient scale. Simple, clean design with minimal text and a focus on visual data representation.
Market Analysis and Trends
Healthcare & Pharmaceuticals
Illustrates the changes in COVID-19 case prevalence across US states over a two-week period. Used to analyze regional impacts and trends in the spread of the virus.
COVID-19, prevalence, US states, increase, health data, regional analysis, June 2020, two-week comparison
false
Market Analysis and Trends
Healthcare & Pharmaceuticals
Table
McKinsey
Add to my slides
Remove from favorites
The slide features a pie chart with three sections: 51% no impact, 37% more likely, and 13% less likely.
Market Analysis and Trends
Real Estate & Construction
This slide illustrates the impact of the COVID-19 pandemic on the likelihood of listing investment properties, showing how investors' plans have changed.
COVID-19, property listing, investment, pandemic impact, pie chart, investor behavior
false
Market Analysis and Trends
Real Estate & Construction
Single Chart
IPSOS
Add to my slides
Remove from favorites
Includes three column charts comparing percentages of population, cases, and deaths by race, with additional textual explanation on the side regarding factors affecting these disparities.
Market Analysis and Trends
Healthcare & Pharmaceuticals
Examines the racial disparities in COVID-19 impact within the US, highlighting the disproportionate effects on the Black population along with potential contributing social and economic factors.
COVID-19, racial disparity, healthcare access, comorbidities, US demographics, socioeconomic factors
false
Market Analysis and Trends
Healthcare & Pharmaceuticals
Mixed Chart
McKinsey
Add to my slides
Remove from favorites
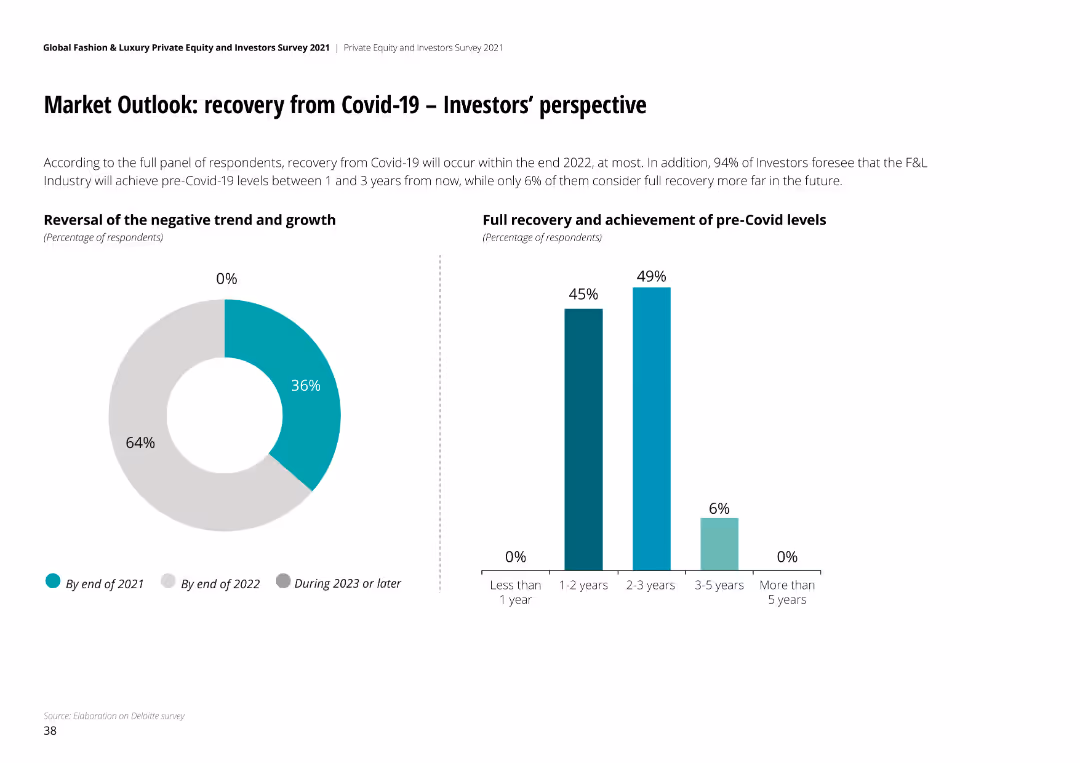
Pie chart and column chart showing timeline for recovery from Covid-19, with full recovery expected between 1 to 3 years by most investors.
Strategic Planning
Financial Services
Recovery from Covid-19 expected by end of 2022 for most investors. 94% foresee F&L industry reaching pre-Covid levels within 3 years, full recovery expected within 1-3 years.
Covid-19 recovery, F&L industry, investor perspective, recovery timeline, pre-Covid levels
false
Strategic Planning
Financial Services
Multiple Chart
Deloitte
Add to my slides
Remove from favorites
This slide uses a timeline format with a multi-colored wave graph showing the progression of COVID-19 through phases labeled "Flatten," "Fight," and "Future." It describes anticipated actions in each phase, like social distancing and vaccine development, aimed at controlling the pandemic's impact.
Strategic Planning
Healthcare & Pharmaceuticals
Analyzes the expected phases of COVID-19 recovery focusing on different strategic responses from government and healthcare systems to mitigate the pandemic's impact. Highlights the importance of coordinated responses in limiting cases and supporting economic recovery.
COVID-19, recovery, healthcare, government, pandemic, phases, vaccine
false
Strategic Planning
Healthcare & Pharmaceuticals
Linear Flow
BCG
Add to my slides
Remove from favorites
The slide presents a flow chart and bullet points outlining assumptions for economic recovery post-lockdown, categorized by industry and region. It includes symbolic representations (flags, state outlines) to visually distinguish between different geographical areas.
Strategic Planning
Financial Services
Outlines potential recovery scenarios from COVID-19 lockdowns, emphasizing different impacts and recovery rates by industry and region. Useful for strategic discussions on preparing for post-COVID economic landscapes.
COVID-19, recovery, industry, region, economic analysis, assumptions, strategic planning, lockdown
false
Strategic Planning
Financial Services
Header Vertical
BCG
Add to my slides
Remove from favorites
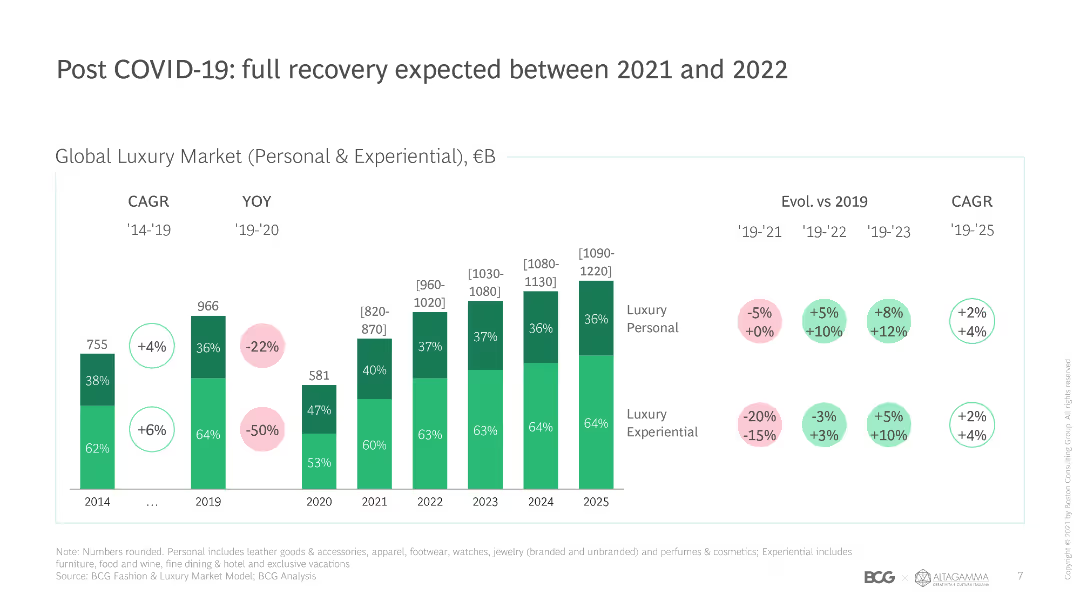
This slide features a column chart comparing global luxury market size and growth rates from 2014 to 2025, with color-coded segments for personal and experiential luxury.
Market Analysis and Trends
Retail & E-commerce
The slide projects the recovery of the global luxury market post-COVID-19, highlighting growth rates and market size for personal and experiential luxury segments.
COVID-19 recovery, luxury market, growth rates, market size, experiential luxury, personal luxury, global trends, projections, CAGR
false
Market Analysis and Trends
Retail & E-commerce
Single Chart
BCG
Add to my slides
Remove from favorites
Multi-layered flowchart with color gradients representing the phases of COVID-19 impact over time, focusing on various societal and economic responses.
Regulatory and Compliance
Government & Public Sector
Analyzes the phased responses to the COVID-19 pandemic, including initial containment efforts and future economic recovery strategies, with implications for policy and societal changes.
COVID-19, recovery, pandemic, policy, phases
false
Regulatory and Compliance
Government & Public Sector
Linear Flow
BCG
Add to my slides
Remove from favorites
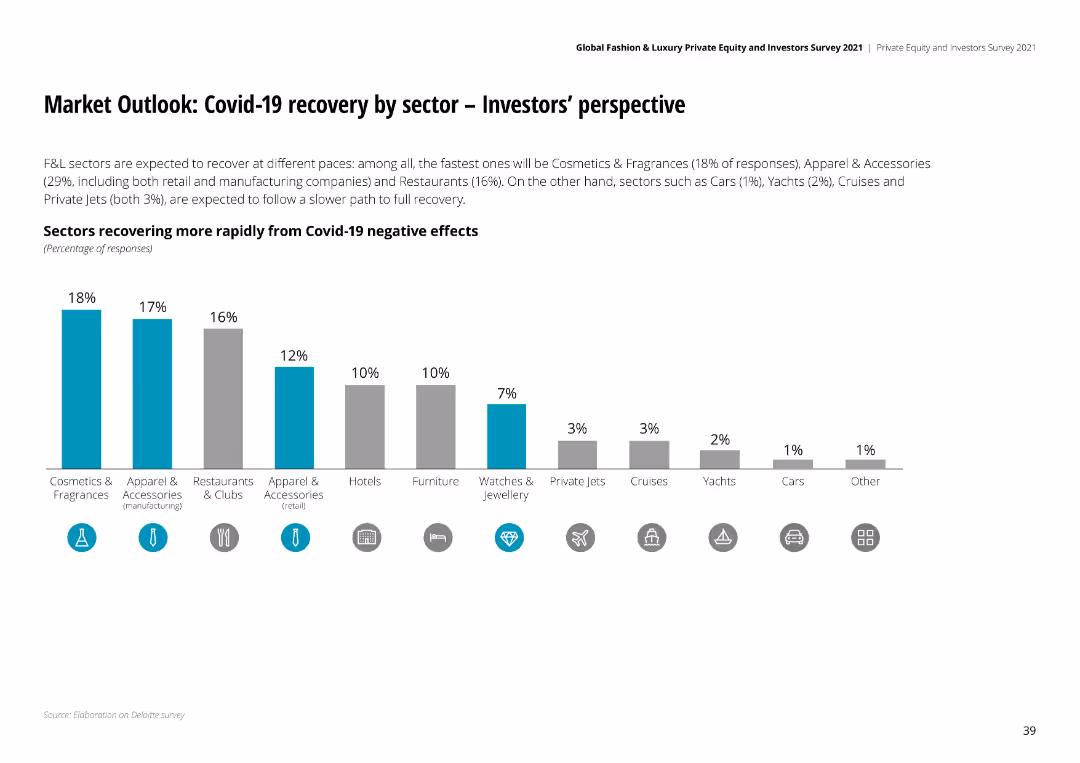
Column chart showing sectors recovering from Covid-19, with Cosmetics & Fragrances, Apparel & Accessories, and Restaurants showing rapid recovery.
Market Analysis and Trends
Financial Services
Different sectors are recovering at varied paces, with Cosmetics & Fragrances and Apparel & Accessories showing the fastest recovery from Covid-19 effects.
Covid-19 recovery, sector analysis, investor perspective, rapid recovery sectors, market trends
false
Market Analysis and Trends
Financial Services
Single Chart
Deloitte
Add to my slides
Remove from favorites
Line charts showing recovery trends post-COVID-19
Risk Assessment and Management
Hospitality & Tourism
Details the impact of COVID-19 on high-end tourism in Europe, showing recovery trends and ongoing challenges in the sector.
COVID-19, recovery, tourism, challenges
false
Risk Assessment and Management
Hospitality & Tourism
Mixed Chart
Bain
Add to my slides
Remove from favorites
Slide includes bullet points, and tables detailing recovery trends and financial strategies.
Strategic Planning
Transportation & Logistics
Provides an update on global and regional recovery trends post-COVID-19, emphasizing financial adaptations.
COVID-19, recovery trends, financial strategy, global impact, market analysis
false
Strategic Planning
Transportation & Logistics
Header Vertical
Deutsche Bank
Add to my slides
Remove from favorites
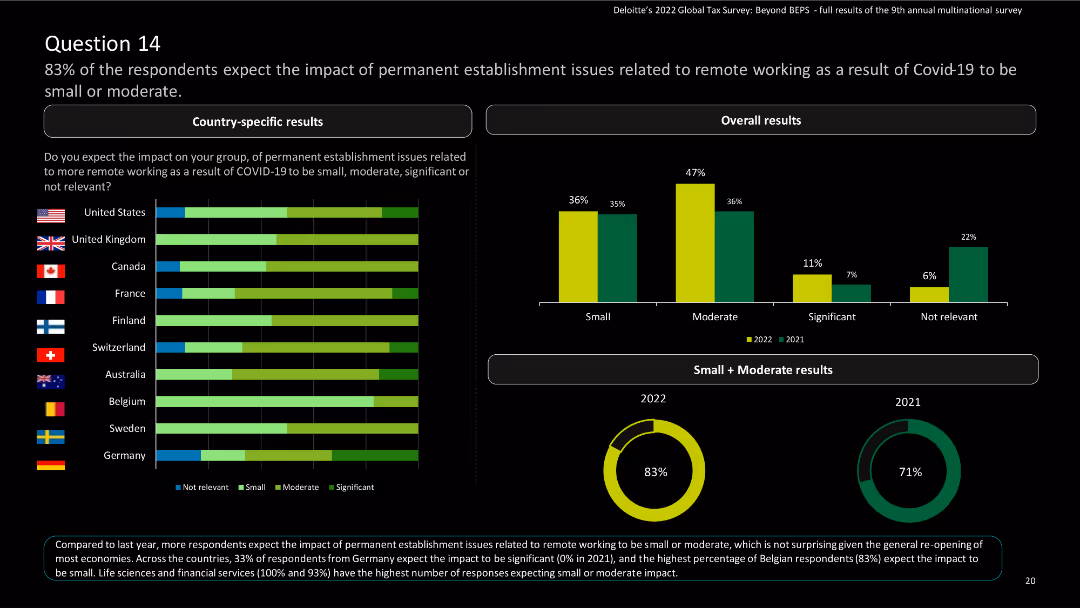
The slide contains horizontal bar charts for country-specific results and a column chart for overall results, along with a donut chart for trends.
Risk Assessment and Management
Financial Services
The slide summarizes survey findings on the impact of remote working on permanent establishment issues due to COVID-19. It includes country-specific and overall results, with trends from 2021 to 2022.
COVID-19, remote working, permanent establishment, financial services, survey results
false
Risk Assessment and Management
Financial Services
Multiple Chart
Deloitte
Add to my slides
Remove from favorites
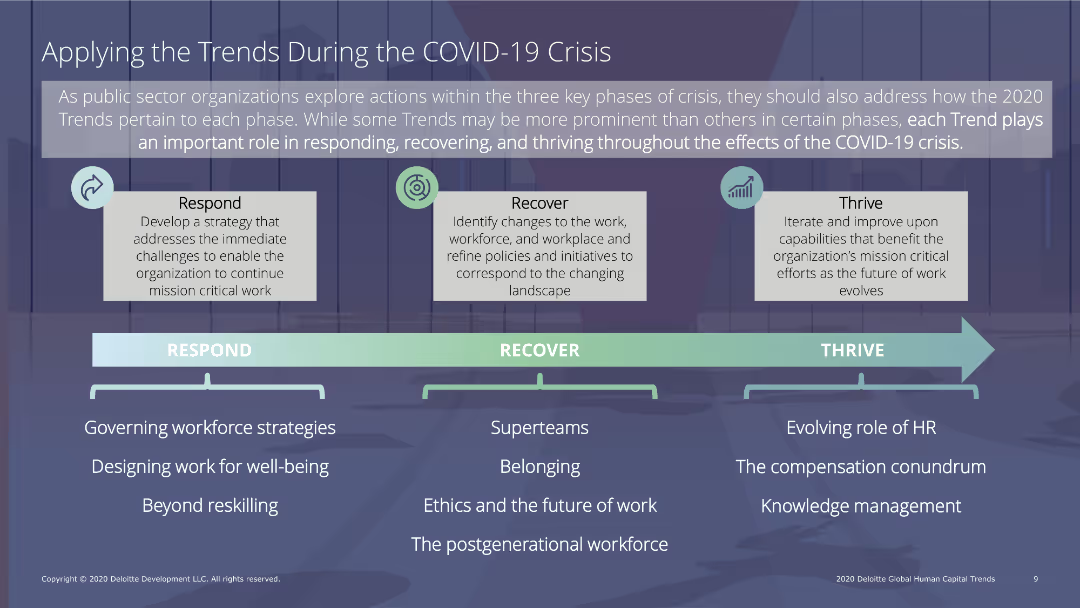
The slide includes a flow diagram outlining strategies for responding to, recovering from, and thriving during the COVID-19 crisis, with text sections detailing specific actions and phases.
Human Resources and Talent Management
Professional Services
The slide outlines a framework for public sector organizations to respond, recover, and thrive during the COVID-19 crisis, with specific strategies for each phase, such as workforce strategies, well-being, and reskilling.
COVID-19 response, crisis management, public sector, recovery, thrive
false
Human Resources and Talent Management
Professional Services
Linear Flow
Deloitte
Add to my slides
Remove from favorites
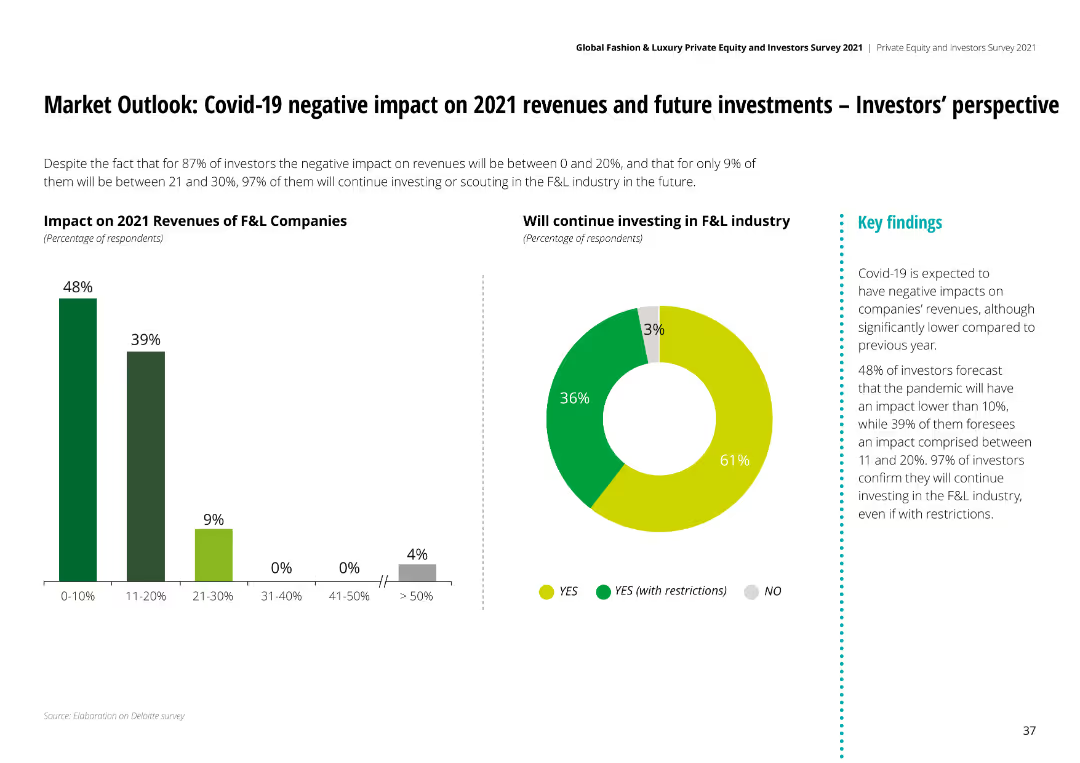
Column chart and pie chart showing impact of Covid-19 on 2021 revenues and future investments in the F&L industry. Most impact is between 0-20%, with 97% continuing investment.
Financial Performance
Financial Services
Despite negative revenue impact, majority of investors plan to continue investing in F&L industry. Revenue impact is mostly below 20%, with future investments unaffected.
Covid-19, revenue impact, future investments, investor confidence, financial outlook
false
Financial Performance
Financial Services
Multiple Chart
Deloitte
Add to my slides
Remove from favorites
Bar chart displaying the impact of COVID-19 on savings goals. The chart compares the percentage of respondents who stopped or continued saving for each goal. A summary at the top provides context.
Risk Assessment and Management
Financial Services
The slide details how the COVID-19 pandemic affected Canadian investors' savings goals, showing the proportion who stopped saving for goals like travel, education, and retirement. It highlights demographic and income differences in the impact of the pandemic on savings behavior.
COVID-19, Savings, Goals, Canadian, Pandemic, Impact
false
Risk Assessment and Management
Financial Services
Mixed Chart
IPSOS
Add to my slides
Remove from favorites
Illustrative graph depicting potential economic recovery scenarios post-COVID-19, categorized as "Flatten," "Fight," and "Future."
Strategic Planning
Professional Services
Outlines possible economic impacts and recovery paths under different COVID-19 management scenarios, highlighting critical decision points for businesses and governments.
COVID-19, scenarios, economic impact, recovery, management, flatten, fight, future, decision making
false
Strategic Planning
Professional Services
Mixed Chart
BCG
Add to my slides
Remove from favorites
The slide contains a mix of icons, text, and colored boxes to represent various sectors and their growth or decline due to COVID-19. The layout is organized and color-coded.
Market Analysis and Trends
Technology & Software
Analyzes the differential impact of COVID-19 on sectors, identifying those that have been set back versus those that have seen growth or acceleration, such as e-commerce.
COVID-19, sectors, e-commerce, online travel, food delivery, growth, setback
false
Market Analysis and Trends
Technology & Software
Table
Bain
Add to my slides
Remove from favorites
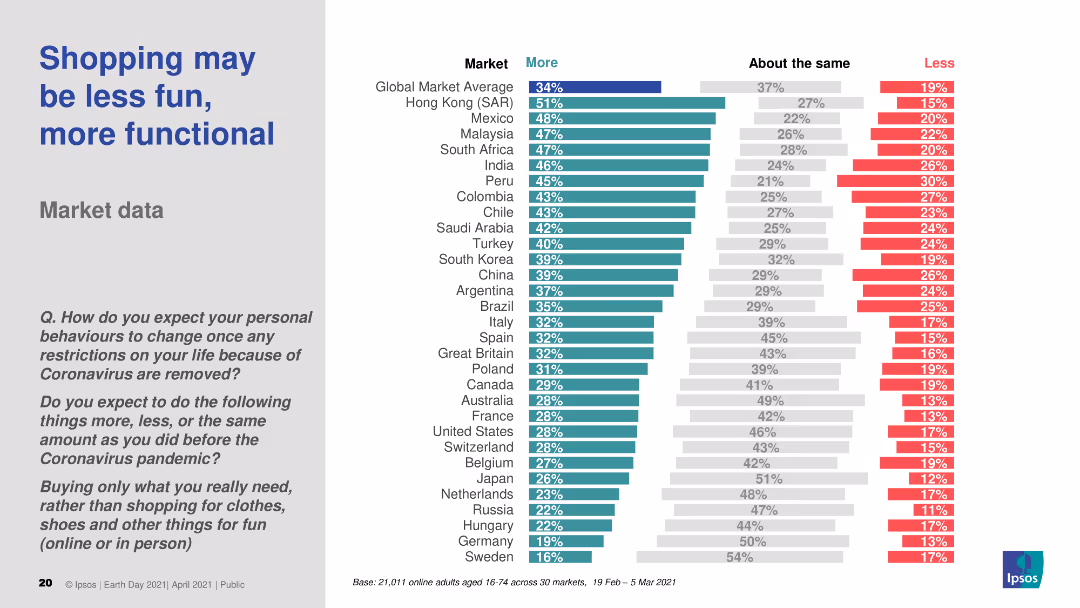
The slide features a column chart comparing the behavior changes in purchasing only essential items across various markets post-COVID-19. The chart uses three color bars to indicate "More," "About the same," and "Less." The text section includes a question and survey details.
Market Analysis and Trends
Retail & E-commerce
The slide presents survey data showing expected changes in personal buying behavior after COVID-19 restrictions are removed, focusing on purchasing essential items rather than non-essential items across multiple global markets.
COVID-19, shopping behavior, essential items, markets, global survey
false
Market Analysis and Trends
Retail & E-commerce
Multiple Chart
IPSOS
Add to my slides
Remove from favorites
Line graphs and scatter plot on a logarithmic scale, comparing the daily growth rates and cumulative confirmed cases across countries.
Regulatory and Compliance
Healthcare & Pharmaceuticals
Analyzes COVID-19 case growth rates and doubling times, indicating which countries are successfully flattening the curve as of April 2020.
COVID-19, statistics, health policy, growth rate, logarithmic scale, flattening the curve, countries, cases, progression
false
Regulatory and Compliance
Healthcare & Pharmaceuticals
Multiple Chart
BCG
Add to my slides
Remove from favorites
A slide listing nine strategic action areas for business leaders post-COVID-19, including crisis management and digital transformation.
Strategic Planning
Professional Services
Outlines essential strategies for businesses navigating post-COVID-19 challenges, focusing on digital transformation, cost management, and supply chain adjustments. Useful for leadership and strategy teams.
COVID-19, strategy, digital transformation, crisis management, supply chain
false
Strategic Planning
Professional Services
Vertical Flow
BCG
Add to my slides
Remove from favorites
Features a line graph depicting various business strategies companies are considering in response to COVID-19, like hiring freezes and salary reductions, overlaid with a large COVID-19 virus image for impact.
Human Resources and Talent Management
Professional Services
Explores how companies plan to adapt their talent strategies in light of the pandemic, with a focus on reducing costs. Useful for HR and strategic planning.
COVID-19, talent acquisition, business strategy, cost reduction, planning
false
Human Resources and Talent Management
Professional Services
Single Chart
McKinsey
Add to my slides
Remove from favorites
Graph showing the cumulative number of tests per million population versus cases per million, along with a column chart comparing testing-to-case ratios by country.
Regulatory and Compliance
Healthcare & Pharmaceuticals
Discusses the scale of COVID-19 testing in various countries and contrasts it with the number of reported cases to evaluate testing adequacy as of April 2020.
COVID-19, testing, healthcare capacity, countries, testing ratios, cases, global overview, adequacy
false
Regulatory and Compliance
Healthcare & Pharmaceuticals
Multiple Chart
BCG
Add to my slides
Remove from favorites
Several rows categorizing types of COVID-19 tests such as presence of viral genome, immune response, and antigen tests, including their availability status and brands involved.
Product and Service Analysis
Healthcare & Pharmaceuticals
Provides an overview of the available COVID-19 testing technologies, their developers, and the stage of availability, highlighting the evolving landscape in diagnostic tests.
COVID-19, testing landscape, viral genome, immune response, antigen tests, diagnostic tests, healthcare technology
false
Product and Service Analysis
Healthcare & Pharmaceuticals
Table
BCG
Add to my slides
Remove from favorites
The slide shows a line graph of COVID-19 test results in Ontario, indicating the waves of the pandemic.
Risk Assessment and Management
Healthcare & Pharmaceuticals
It presents data on the fluctuating positive COVID-19 test results over time, highlighting key dates and events.
COVID-19, test results, waves, Ontario, line graph, pandemic, positive, data, key dates, events
false
Risk Assessment and Management
Healthcare & Pharmaceuticals
Single Chart
IPSOS
Add to my slides
Remove from favorites
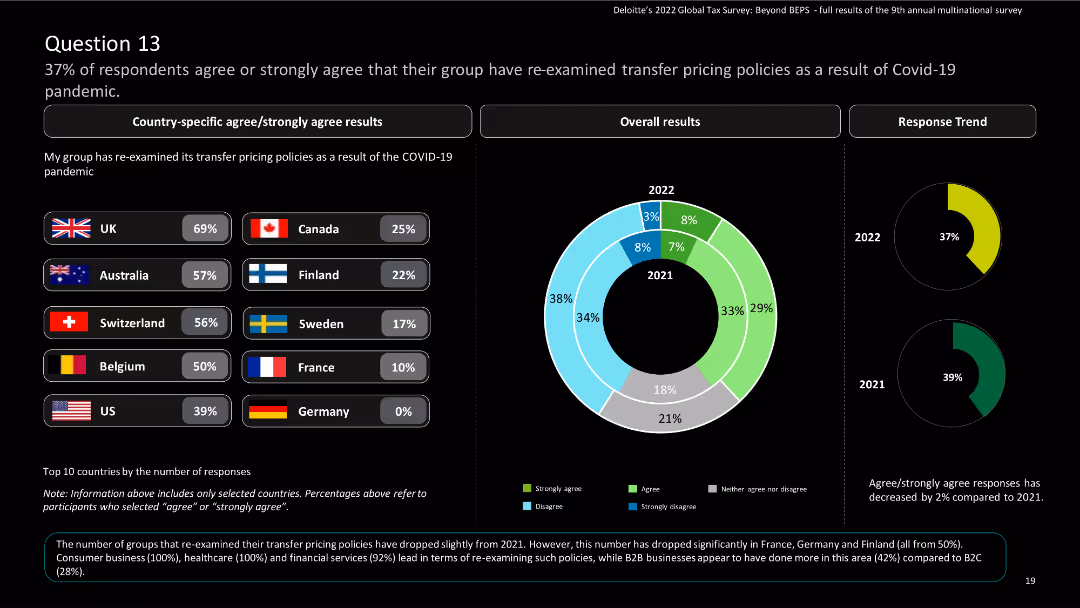
This slide presents country-specific results using bar charts and a donut chart for overall results. It includes country flags and percentages.
Risk Assessment and Management
Financial Services
The slide displays survey results on the re-examination of transfer pricing policies due to COVID-19. It shows country-specific and overall responses, comparing results from 2021 to 2022.
COVID-19, transfer pricing, survey, financial services, policy re-examination
false
Risk Assessment and Management
Financial Services
Multiple Chart
Deloitte
Add to my slides
Remove from favorites
The slide shows a series of horizontal bar charts representing changes in transportation modes post-COVID-19 in Germany, the US, and China, with modes like own car, public transport, and shared mobility.
Market Analysis and Trends
Transportation & Logistics
The slide examines how transportation preferences have shifted post-COVID-19, with continued popularity of personal cars in Germany and the US, and increased use of shared modes in China.
COVID-19, transportation modes, own car, public transport, shared mobility, Germany, US, China, consumer trends
false
Market Analysis and Trends
Transportation & Logistics
Multiple Chart
PwC/Strategy&
Add to my slides
Remove from favorites
Contains multiple bar graphs and a small text section comparing the effects of different treatments on COVID-19 patient outcomes, highlighting dexamethasone and remdesivir.
Product and Service Analysis
Healthcare & Pharmaceuticals
Evaluates the effectiveness of various treatments like dexamethasone and remdesivir on COVID-19, useful for medical professionals and health service planners.
COVID-19, treatment outcomes, dexamethasone, remdesivir, therapeutics, patient care
false
Product and Service Analysis
Healthcare & Pharmaceuticals
Multiple Chart
McKinsey
Add to my slides
Remove from favorites
Contains multiple line graphs and a column chart depicting the impact of COVID-19 on various economic indicators like unemployment claims, credit card sales, and manufacturing activity in New York. Visual cues such as color highlight significant changes or trends.
Regulatory and Compliance
Financial Services
Discusses the immediate economic impacts of COVID-19 through various metrics such as unemployment, sales decline, and manufacturing downturn. Useful for presentations on economic policies and their effectiveness during crisis situations.
COVID-19, unemployment, manufacturing, sales, economic policy, New York, impact, recovery
false
Regulatory and Compliance
Financial Services
Multiple Chart
BCG
Add to my slides
Remove from favorites
Utilizes a stacked area chart to depict the distribution of new COVID-19 cases across US regions from April to July 2020, colored by region.
Market Analysis and Trends
Healthcare & Pharmaceuticals
Presents the regional distribution of new COVID-19 cases in the US, showing how the case load has shifted from the Northeast to the Southern and Western states, providing insights into the dynamics of the pandemic’s domestic spread.
COVID-19, US, cases, regional, 2020
false
Market Analysis and Trends
Healthcare & Pharmaceuticals
Single Chart
McKinsey
Add to my slides
Remove from favorites
The slide features a complex line graph showing the percentage draw-down of the United States Real GDP from the 1900s to the projected 2020s. Two scenarios are highlighted post-2020 with projected impacts of -8% and -13%. The timeline is divided into Pre-WWII and Post-WWII periods. The color scheme includes grey for historical data and blue for future projections.
Market Analysis and Trends
Financial Services
The slide presents a historical analysis of the U.S. GDP over a century, with a focus on the projected economic impact of COVID-19. It suggests that the pandemic could have unprecedented negative effects on the economy, surpassing post-WWII figures.
COVID-19, U.S. GDP, economic impact, historical analysis, projection, WWII, financial crisis, market trends, scenario analysis
false
Market Analysis and Trends
Financial Services
Single Chart
McKinsey
Add to my slides
Remove from favorites
Features a historical line graph of US GDP since 1900 with projections under different COVID-19 scenarios. Highly detailed and informative.
Market Analysis and Trends
Financial Services
Evaluates the potential impact of COVID-19 on US GDP, comparing it to past economic downturns, useful for historical economic comparisons.
COVID-19, US, GDP, Impact, Historical
false
Market Analysis and Trends
Financial Services
Single Chart
McKinsey
Add to my slides
Remove from favorites
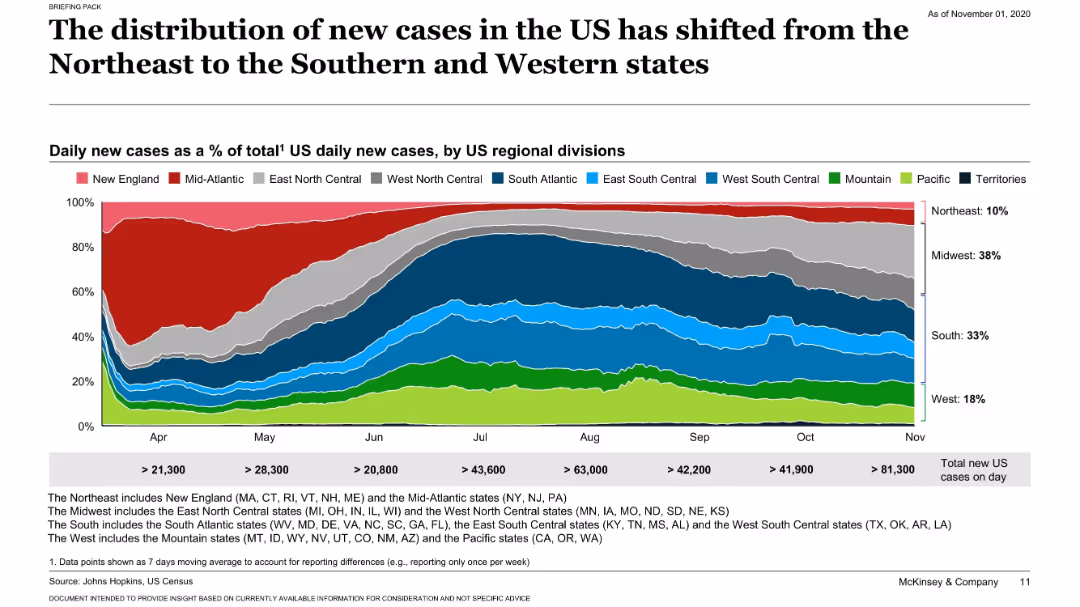
Stacked area chart showing percentage of daily new COVID-19 cases by US region, timeline from March to November, colored by region.
Market Analysis and Trends
Healthcare & Pharmaceuticals
Tracks how the proportion of new COVID-19 cases in the US changed geographically over time. Shows a shift from the Northeast to the South and Midwest. Highlights relative shares and total daily new case counts.
COVID-19, US regions, case distribution, timeline, South, Northeast, McKinsey
false
Market Analysis and Trends
Healthcare & Pharmaceuticals
Single Chart
McKinsey
Add to my slides
Remove from favorites
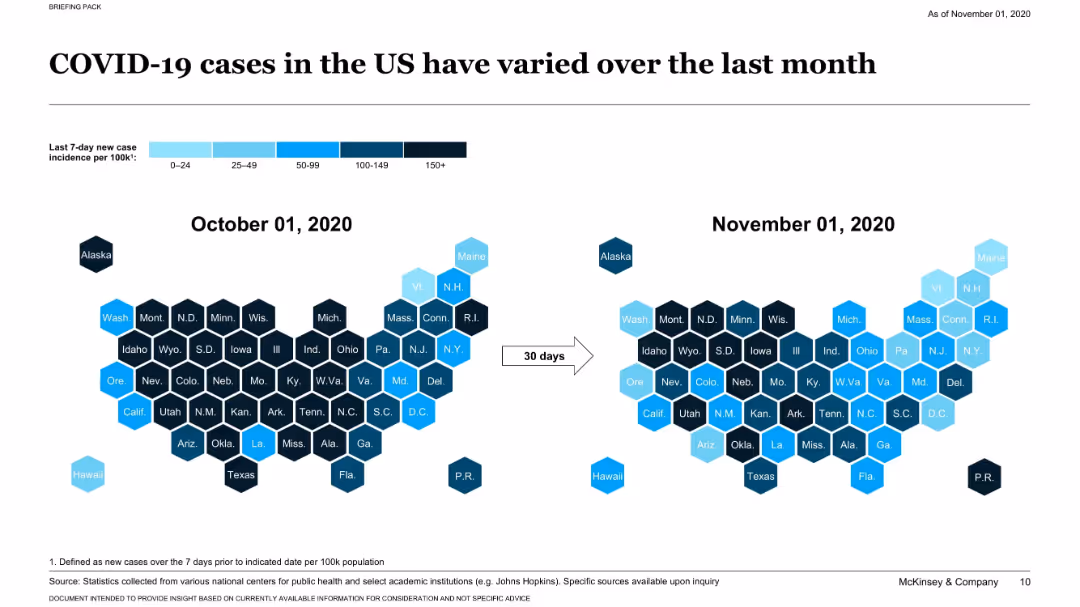
US map in hexagonal tile format; color coded by case rates; comparison of Oct 01 and Nov 01, 2020; arrows show progression.
Risk Assessment and Management
Healthcare & Pharmaceuticals
This slide illustrates the change in US state-level COVID-19 cases over a month using a hex map. Each tile’s color shows incidence rate per 100k people, highlighting the geographical shifts in case burden over 30 days.
COVID-19, US states, incidence rate, map, time comparison, healthcare, McKinsey
false
Risk Assessment and Management
Healthcare & Pharmaceuticals
Single Chart
McKinsey
Add to my slides
Remove from favorites
This slide combines bar chart and a line graph to illustrate vaccination rates and daily vaccine doses administered in the Philippines.
Market Analysis and Trends
Government & Public Sector
This slide offers a visual analysis of COVID-19 vaccination progress in the Philippines, highlighting coverage and vaccination rates.
COVID-19, vaccination, Philippines, public health, pie charts, line graph, vaccine doses, coverage
false
Market Analysis and Trends
Government & Public Sector
Multiple Chart
Deloitte
Add to my slides
Remove from favorites
Pie charts with percentages for different countries.
Regulatory and Compliance
Healthcare & Pharmaceuticals
Showcases vaccination rates across SEA and compares them with global standards, useful for public health analysis and policy discussions. The slide is data-driven, presenting vaccination statistics to inform about regional healthcare status.
COVID-19, vaccination rates, SEA, healthcare, public policy
false
Regulatory and Compliance
Healthcare & Pharmaceuticals
Multiple Chart
Bain
Add to my slides
Remove from favorites
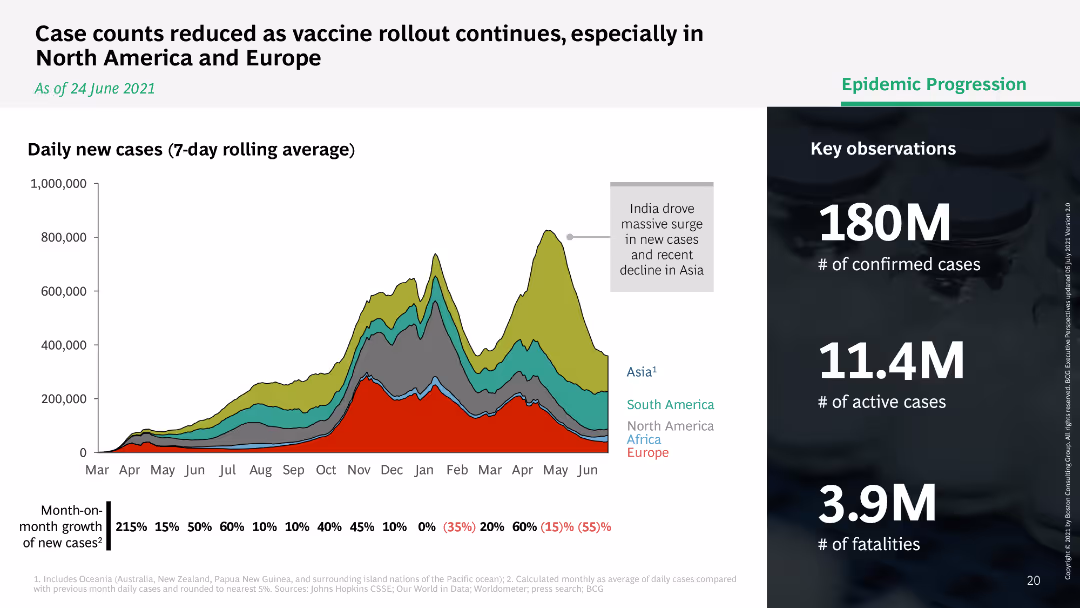
Line chart showing daily new COVID-19 cases by region with a legend indicating Asia, South America, North America, Africa, and Europe.
Market Analysis and Trends
Healthcare & Pharmaceuticals
Displays a 7-day rolling average of daily new COVID-19 cases by region, highlighting a decline in cases as vaccine rollout continues.
COVID-19, vaccine, cases, regions, decline
false
Market Analysis and Trends
Healthcare & Pharmaceuticals
Mixed Chart
BCG
Add to my slides
Remove from favorites
Depicts a timeline with icons representing various vaccine candidates across different trial phases, complemented by a side panel discussing strategic considerations.
Investment Analysis
Healthcare & Pharmaceuticals
Outlines the progress and projected timelines for COVID-19 vaccine development, providing insights for investors and policymakers in healthcare.
COVID-19, vaccine development, clinical trials, healthcare investment, strategic considerations, timeline
false
Investment Analysis
Healthcare & Pharmaceuticals
Mixed Chart
McKinsey
Add to my slides
Remove from favorites
Timeline showing traditional versus accelerated paths for COVID-19 vaccine development, highlighting key phases from discovery to commercial launch.
Strategic Planning
Healthcare & Pharmaceuticals
Provides a timeline for potential COVID-19 vaccine development, comparing traditional and accelerated pathways, important for healthcare planning.
COVID-19, vaccine development, timeline, healthcare, accelerated pathway, traditional, discovery, commercial launch
false
Strategic Planning
Healthcare & Pharmaceuticals
Linear Flow
BCG
Add to my slides
Remove from favorites
The slide includes a detailed timeline and a list layout showing the progress of vaccine development across various phases. Each vaccine candidate is marked with icons indicating their current trial phase and approvals. The design is straightforward, with a focus on delivering comprehensive vaccine status information.
Strategic Planning
Healthcare & Pharmaceuticals
Captures the advancements in COVID-19 vaccine development, detailing the stages of clinical trials and the expected timelines for approvals. It serves as an informative resource on the global effort to develop and distribute vaccines, including key players and their progress.
COVID-19, vaccines, development, trials, healthcare, global, pharmaceuticals
false
Strategic Planning
Healthcare & Pharmaceuticals
Mixed Chart
BCG
Add to my slides
Remove from favorites
Displays various icons representing societal practices, virus monitoring, etc., with checkmarks in green circles indicating impact on spread and severity of infections.
Strategic Planning
Healthcare & Pharmaceuticals
Summarizes the critical factors influencing the duration of the pandemic fight, emphasizing vaccines as the most significant factor in resolving the crisis.
COVID-19, vaccines, societal practices, monitoring, therapeutics
false
Strategic Planning
Healthcare & Pharmaceuticals
Header Horizontal
BCG
Add to my slides
Remove from favorites
Features a stacked area chart for variant frequencies and a scatter plot comparing the antibody resistance of COVID-19 variants.
Regulatory and Compliance
Healthcare & Pharmaceuticals
Details the prevalence of COVID-19 variants and their implications on vaccine efficacy, stressing the need for continued vigilance.
COVID-19 variants, vaccine efficacy, public health, antibody resistance, variant tracking, health policy
false
Regulatory and Compliance
Healthcare & Pharmaceuticals
Multiple Chart
BCG
Add to my slides
Remove from favorites
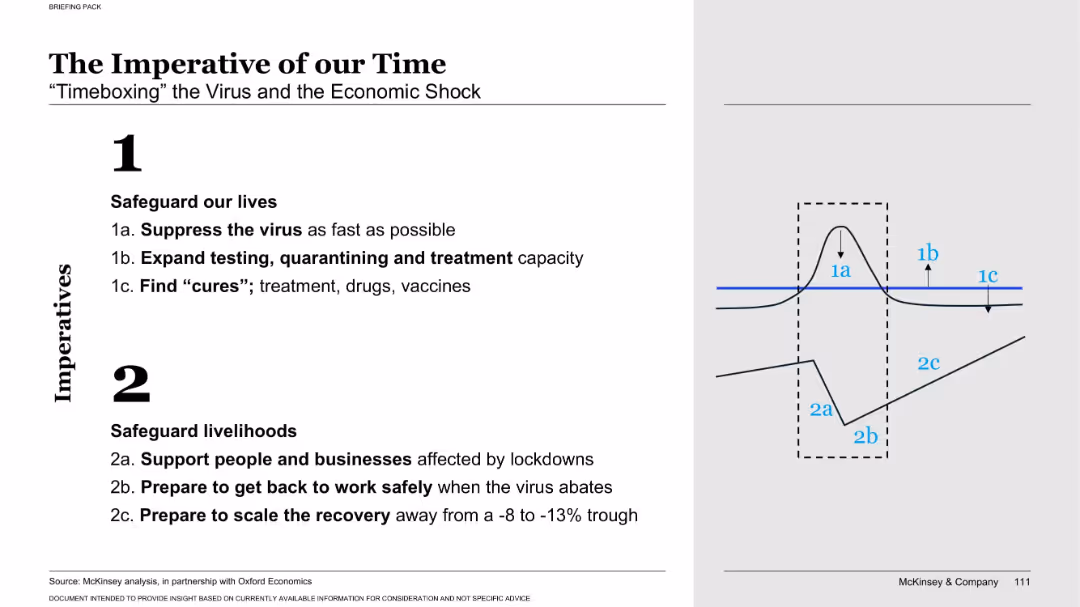
Split layout: left side has text with numbered imperatives; right side includes a simple graph showing timing strategies for pandemic and economic recovery.
Risk Assessment and Management
Government & Public Sector
The slide frames the COVID-19 crisis as a dual imperative—safeguarding lives and livelihoods. It suggests timeboxing interventions for virus suppression and economic recovery, emphasizing urgency and strategic staging of actions.
COVID-19, virus suppression, recovery, economic shock, lives, livelihoods, timeboxing, crisis, imperative
false
Risk Assessment and Management
Government & Public Sector
Mixed Chart
McKinsey
Add to my slides
Remove from favorites
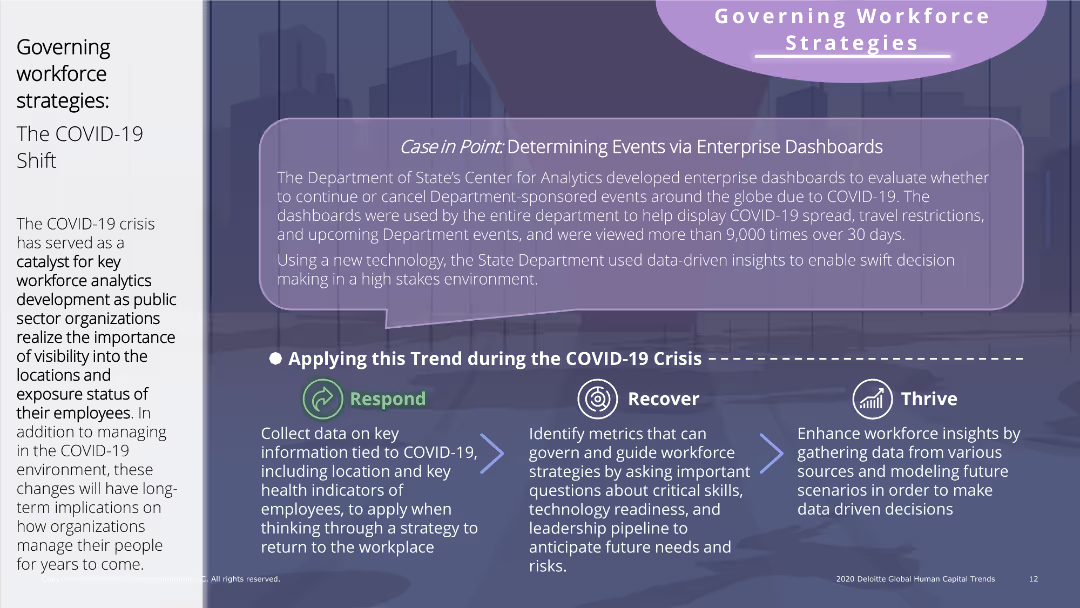
The slide features text on the left and a mix of text and icons on the right. It is moderately dense with a visual focus on a case study and action steps (Respond, Recover, Thrive).
Human Resources and Talent Management
Government & Public Sector
Analyzes the impact of COVID-19 on workforce analytics in public sector organizations, highlighting strategies to respond, recover, and thrive during the crisis.
COVID-19, workforce, analytics, public sector, case study, strategies, response, recovery, thrive
false
Human Resources and Talent Management
Government & Public Sector
Linear Flow
Deloitte
Add to my slides
Remove from favorites
Slide details the transition of workforce priorities from COVID-19 to a new reality, focusing on remote work, health, and organizational resilience.
Human Resources and Talent Management
Professional Services
Discusses evolving workforce strategies in response to COVID-19, emphasizing remote work and health, useful for HR and organizational development.
COVID-19, workforce, remote work, health, organizational change
false
Human Resources and Talent Management
Professional Services
Header Horizontal
BCG
Add to my slides
Remove from favorites
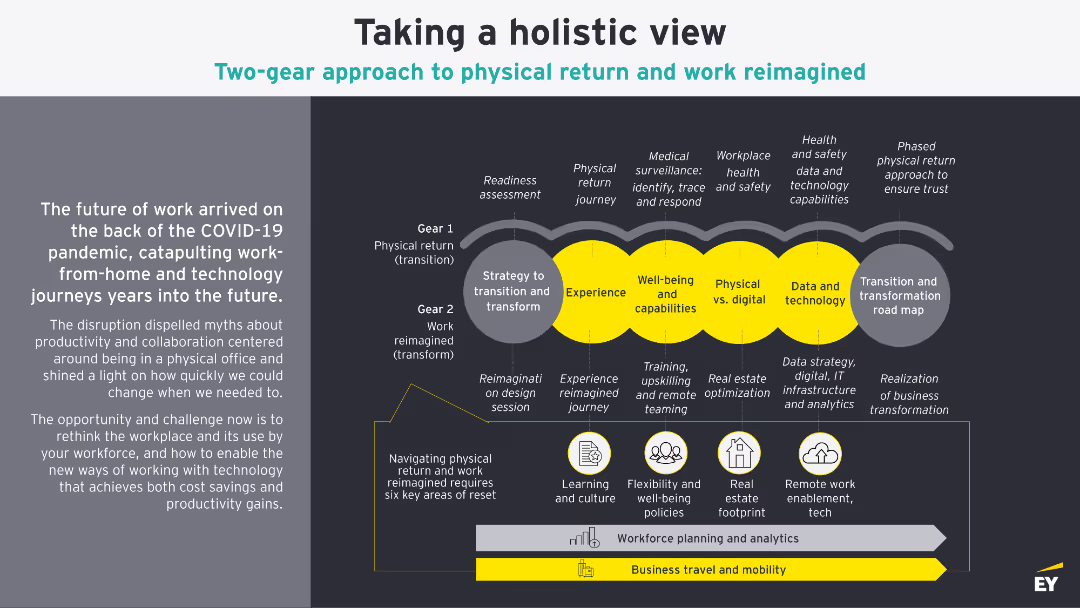
This slide features a detailed diagram illustrating a two-gear approach to physical return and work reimagined. It includes various sections and icons that represent different phases and components of the strategy.
Strategic Planning
Professional Services
The slide discusses how COVID-19 has accelerated changes in the workplace, focusing on physical return and reimagined work strategies. It outlines phases and key areas of reset required for this transition.
COVID-19, workplace, strategy, return, reimagined
false
Strategic Planning
Professional Services
Boxed
EY
Add to my slides
Remove from favorites
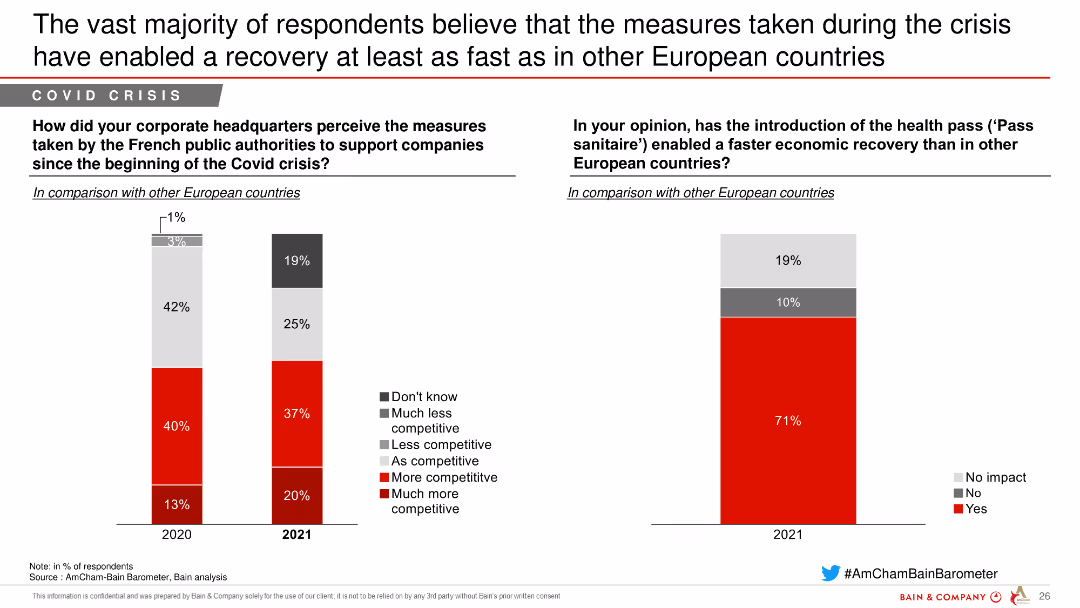
This slide features column charts comparing the competitiveness of French public authorities' measures during the Covid crisis with other European countries and the effect of the health pass.
Regulatory and Compliance
Government & Public Sector
The slide compares the competitiveness impact of measures taken by French public authorities during the Covid crisis and the perceived effectiveness of the health pass in economic recovery.
Covid crisis, recovery, measures, French authorities, competitiveness, European comparison, health pass, public sector
false
Regulatory and Compliance
Government & Public Sector
Multiple Chart
Bain
Add to my slides
Remove from favorites
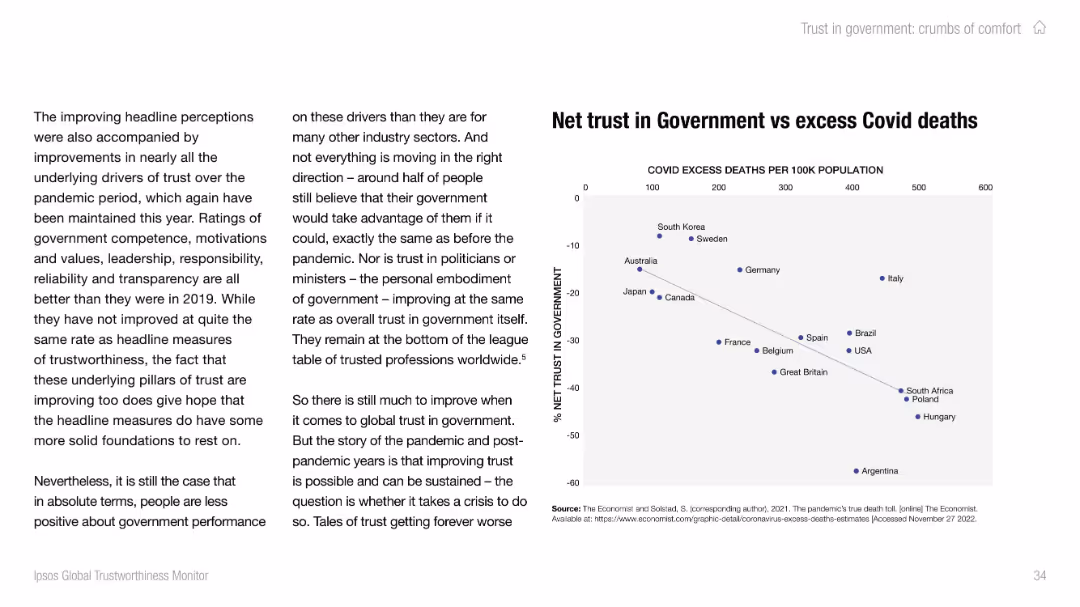
Split layout; left has descriptive text, right shows a scatterplot comparing trust in government and excess Covid deaths by country. Diagonal trend line shown.
Risk Assessment and Management
Government & Public Sector
This slide visually correlates Covid-related excess deaths per 100k population with net trust in government, suggesting an inverse relationship. Countries with higher death rates tend to have lower trust, reflecting governance effectiveness perceptions.
covid deaths, trust, government, correlation, scatterplot, Ipsos, public health, pandemic
false
Risk Assessment and Management
Government & Public Sector
Mixed Chart
IPSOS
Add to my slides
Remove from favorites
Line graphs with mobility data indexed to pre-pandemic baselines.
Operational Efficiency
Technology & Software
Slide with mobility trends indicating consumer behavior change post-COVID restrictions. Useful for analyzing the impact on retail and hospitality industries.
COVID restrictions, consumer behavior, mobility data, retail, hospitality
false
Operational Efficiency
Technology & Software
Multiple Chart
Bain
Add to my slides
Remove from favorites
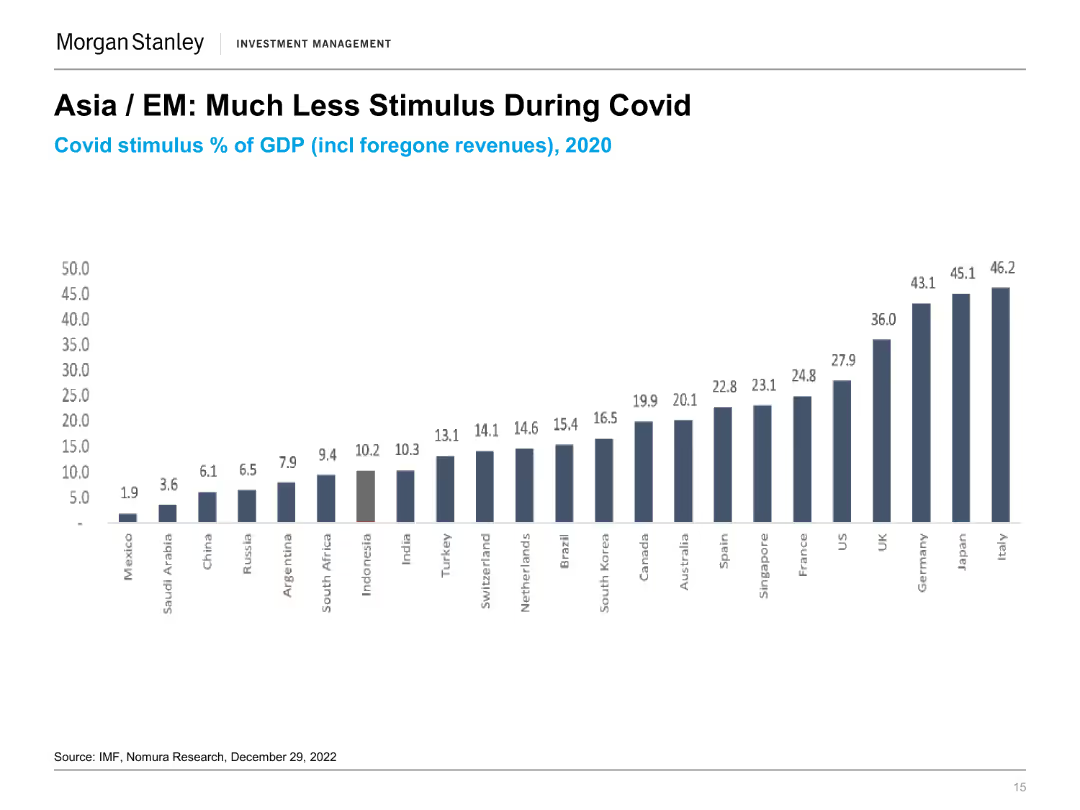
The slide presents a column chart showing the COVID stimulus as a percentage of GDP for various countries in 2020. Each column represents a different country with varying stimulus percentages.
Market Analysis and Trends
Financial Services
The slide compares the level of fiscal stimulus provided by different countries during the COVID-19 pandemic, highlighting the relatively lower stimulus in Asian and emerging markets.
COVID Stimulus, GDP, Fiscal Policy, Market Analysis, Economic Impact, Government Response, Comparative Analysis, Financial Services
false
Market Analysis and Trends
Financial Services
Single Chart
Morgan Stanley
Add to my slides
Remove from favorites
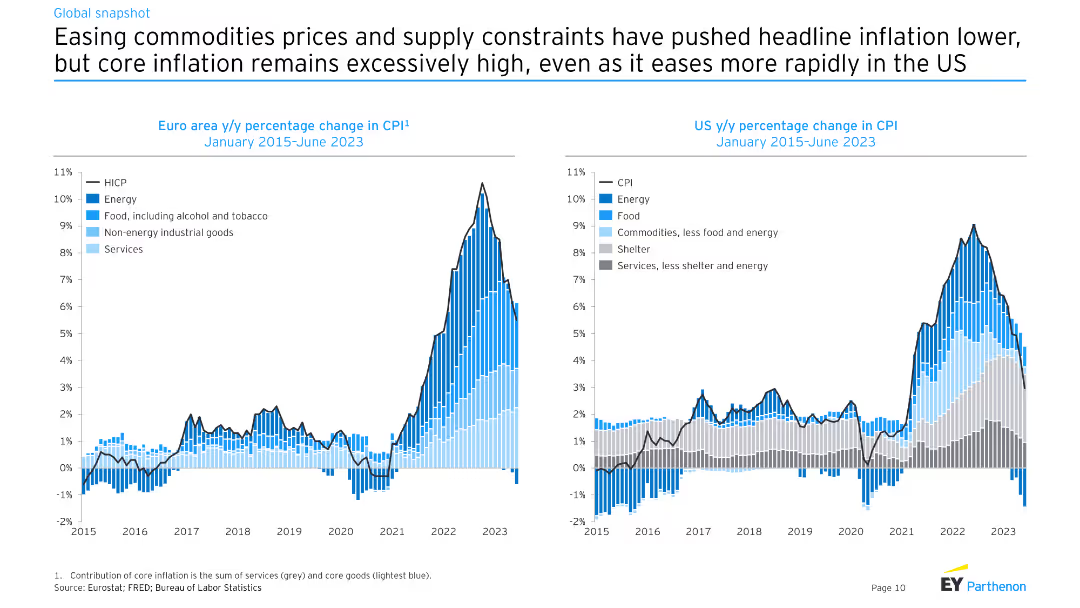
This slide includes two charts: one showing the euro area year-over-year percentage change in CPI from January 2015 to June 2023, and another showing the US year-over-year percentage change in CPI over the same period.
Market Analysis and Trends
Financial Services
The slide compares CPI changes in the euro area and the US, focusing on the impact of easing commodity prices and supply constraints on headline inflation, and the persistent high core inflation rates.
CPI, euro area, US, inflation, commodity prices, economy
false
Market Analysis and Trends
Financial Services
Multiple Chart
EY
Add to my slides
Remove from favorites
The slide has three column charts comparing the drivers of CPI inflation in the US, UK, and Euro area, with segmented bars indicating contributions from different categories.
Market Analysis and Trends
Financial Services
The slide analyzes the recent CPI inflation drivers in the US, UK, and Euro area, emphasizing the impact of energy, food, and housing prices.
CPI, inflation, drivers, US, UK, Euro area
false
Market Analysis and Trends
Financial Services
Multiple Chart
Accenture
Add to my slides
Remove from favorites
This slide features a stacked column chart showing the CPI annual change contribution by category from 2019 to 2023. The chart uses different colors for services, energy, goods, and food, and it's presented over a white background with the title at the top.
Financial Performance
Financial Services
An analytical slide detailing contributions to the Consumer Price Index (CPI) by category, focusing on changes in inflation. It is suitable for discussions on economic health and policy decisions.
CPI, Inflation, Energy, Goods, Services, Food, Economic Analysis, Column Chart, Price Index, July
false
Financial Performance
Financial Services
Single Chart
McKinsey
Add to my slides
Remove from favorites
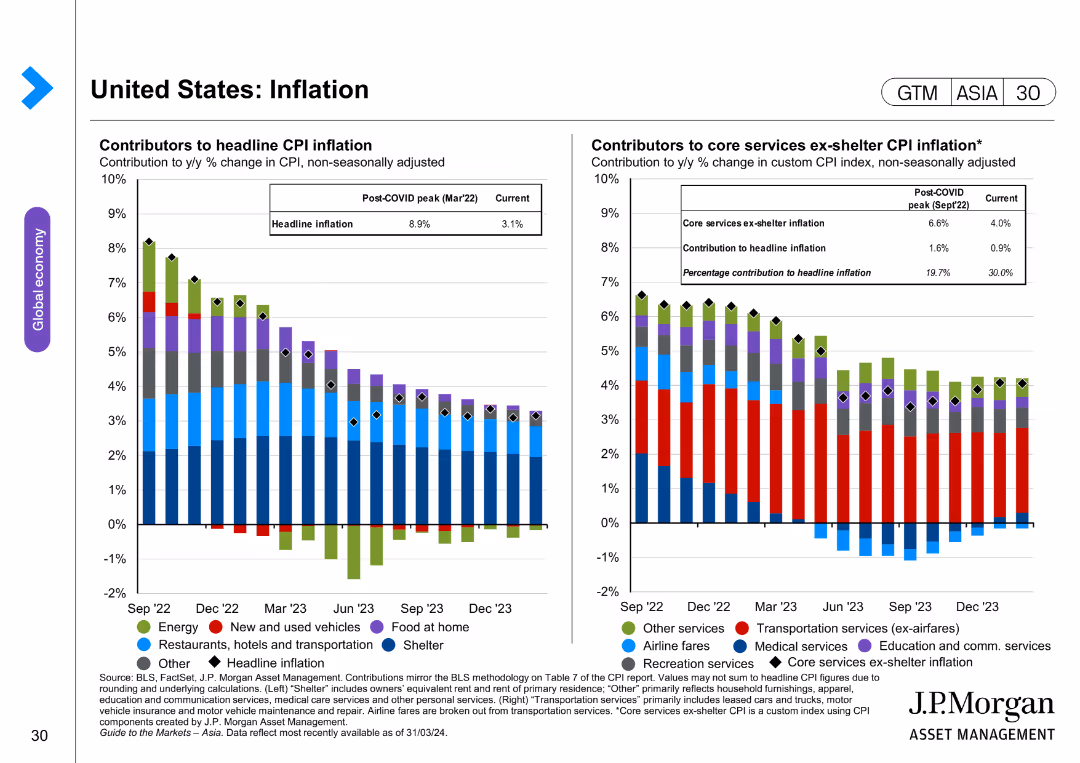
The slide contains two column charts: one showing contributors to headline CPI inflation and another for core services CPI inflation. The layout is moderately complex.
Market Analysis and Trends
Financial Services
This slide examines the contributors to headline CPI inflation and core services CPI inflation, providing a detailed breakdown of different factors affecting inflation.
CPI inflation, headline inflation, core services, economic indicators, inflation contributors
false
Market Analysis and Trends
Financial Services
Multiple Chart
JP Morgan
Add to my slides
Remove from favorites
A line chart illustrates the year-on-year CPI inflation rate and its sequential short-term momentum from 2018 to 2023. A highlighted section indicates recent trends. The slide includes a textbox with implications for corporates and commentary on inflation momentum and Federal Reserve policies.
Market Analysis and Trends
Financial Services
The slide examines the persistent inflation momentum in the US despite base effects lowering headline inflation rates. It suggests that further monetary policy tightening may be needed and advises companies to plan for sustained inflation levels in their strategic planning.
CPI inflation, inflation trends, year-on-year, Federal Reserve, monetary policy, inflation momentum, corporate planning, economic analysis, inflation rate, sequential momentum
false
Market Analysis and Trends
Financial Services
Mixed Chart
Accenture
Add to my slides
Remove from favorites
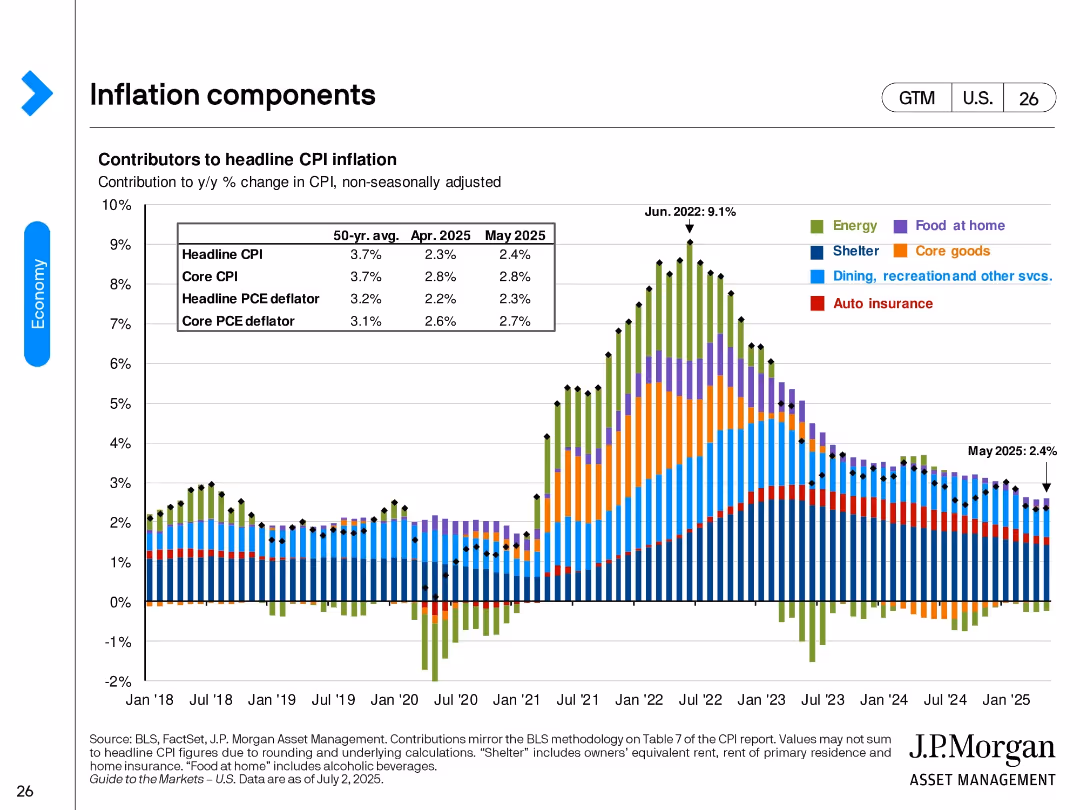
Vertical stacked bar chart showing monthly contributors to CPI inflation from 2018 to 2025. Each category (e.g., energy, shelter, food) is color-coded. A data box summarizes key inflation measures for April and May 2025.
Pricing Strategies
Financial Services
Breaks down CPI inflation by key categories over time. After peaking in mid-2022 (9.1%), inflation rates have moderated. By May 2025, headline CPI stands at 2.4%, with shelter remaining the largest contributor.
CPI, inflation, shelter, energy, core goods, food, consumer prices, May 2025, economic indicators
false
Pricing Strategies
Financial Services
Single Chart
JP Morgan
Add to my slides
Remove from favorites
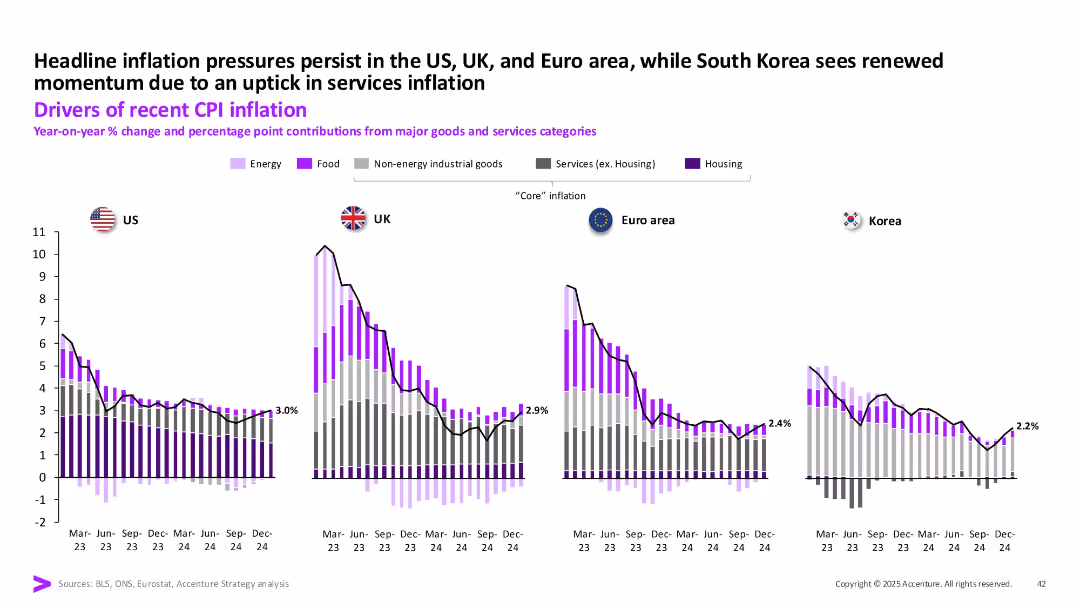
Four-panel bar and line chart visualizing year-on-year % CPI changes in US, UK, Euro Area, and Korea, with colored bar segments for different goods and services categories.
Market Analysis and Trends
Financial Services
This slide analyzes the persistence of inflation across the US, UK, Euro area, and Korea. It highlights contributions of various sectors like energy, food, housing, and services to inflation and notes regional differences in inflation momentum, especially South Korea’s services-led uptick.
CPI, inflation, US, UK, Euro area, Korea, services inflation, housing, food, energy
false
Market Analysis and Trends
Financial Services
Single Chart
Accenture
Add to my slides
Remove from favorites
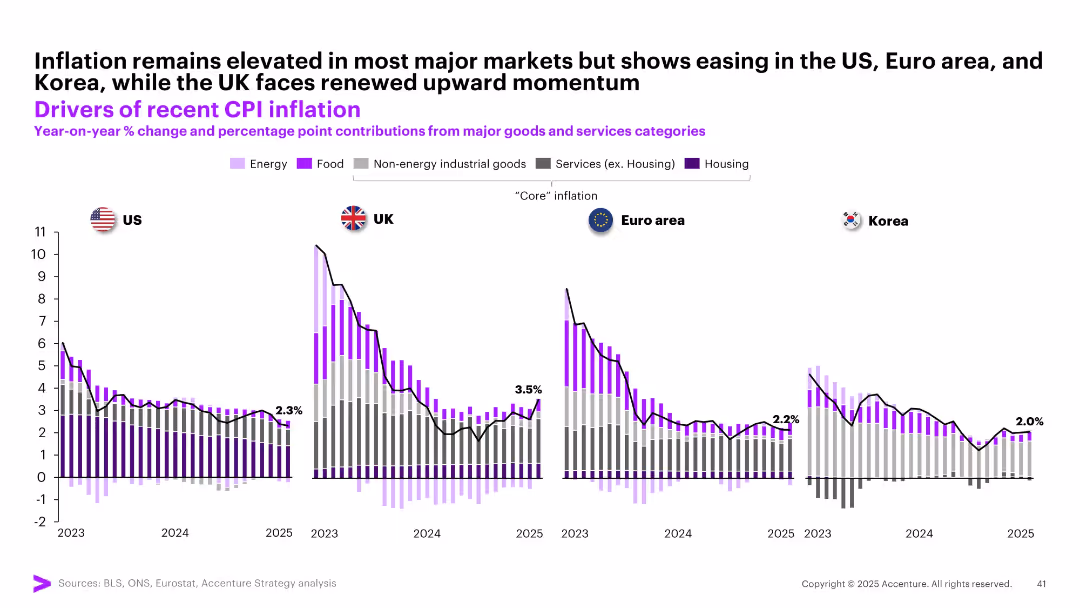
Four-panel comparative bar chart with overlaid trend lines; country flags as labels (US, UK, Euro area, Korea); stacked bars with colors
Market Analysis and Trends
Financial Services
This slide shows year-on-year CPI inflation across the US, UK, Euro area, and Korea from 2023 to 2025. It breaks down contributions to inflation by category (e.g., energy, food, services) and shows easing trends in most regions except the UK, which faces renewed inflationary pressures.
CPI, inflation, US, UK, Korea, Euro area, food, energy, services, core inflation
false
Market Analysis and Trends
Financial Services
Multiple Chart
Accenture
Add to my slides
Remove from favorites
Contains two pie charts detailing podcast advertising revenue share by pricing model (CPM, flat fee) between 2019 and 2020, with a notable increase in CPM.
Market Analysis and Trends
Media & Entertainment
Highlights the dominant use of cost-per-thousand (CPM) pricing in podcast advertising, illustrating its growth from 2019 to 2020.
CPM, podcast advertising, revenue share, pricing model, 2019-2020
false
Market Analysis and Trends
Media & Entertainment
Multiple Chart
PwC/Strategy&
Add to my slides
Remove from favorites
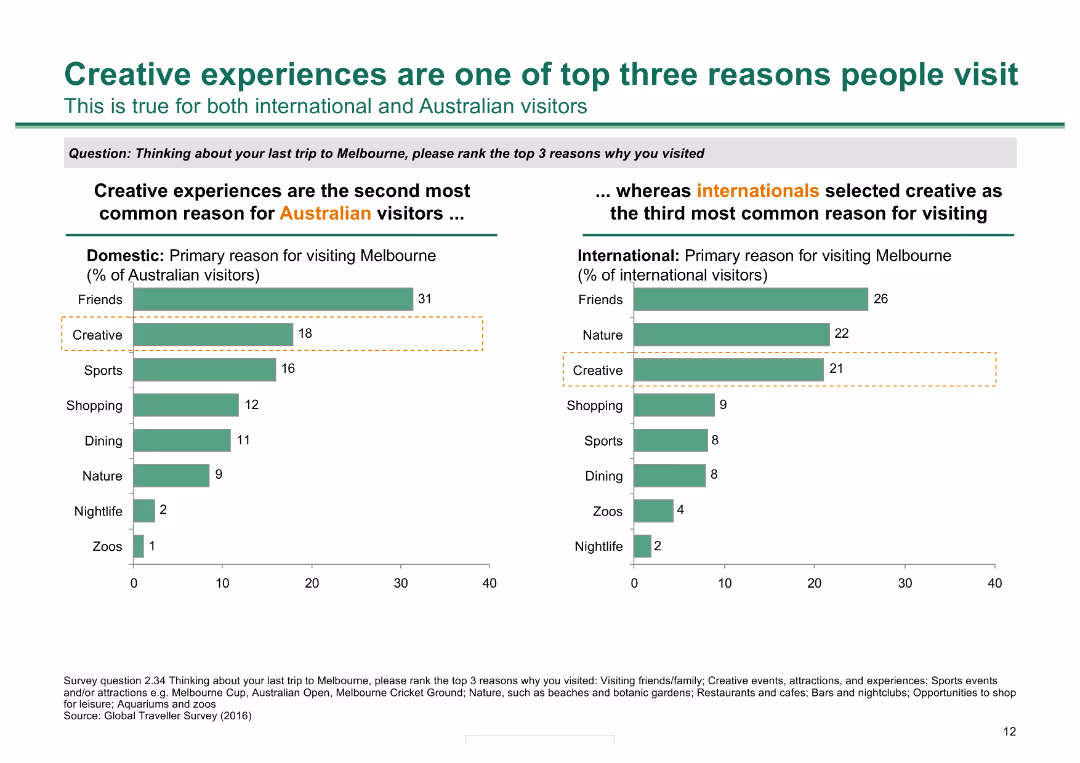
Two column charts: one showing reasons for visiting Melbourne for Australian visitors and the other for international visitors, highlighting creative experiences as a key reason.
Market Analysis and Trends
Hospitality & Tourism
The slide examines the top reasons for visiting Melbourne among domestic and international visitors, emphasizing the significance of creative experiences for both groups.
creative experiences, Melbourne, visitors, reasons, domestic, international, tourism, market analysis, trends
false
Market Analysis and Trends
Hospitality & Tourism
Multiple Chart
BCG
Add to my slides
Remove from favorites
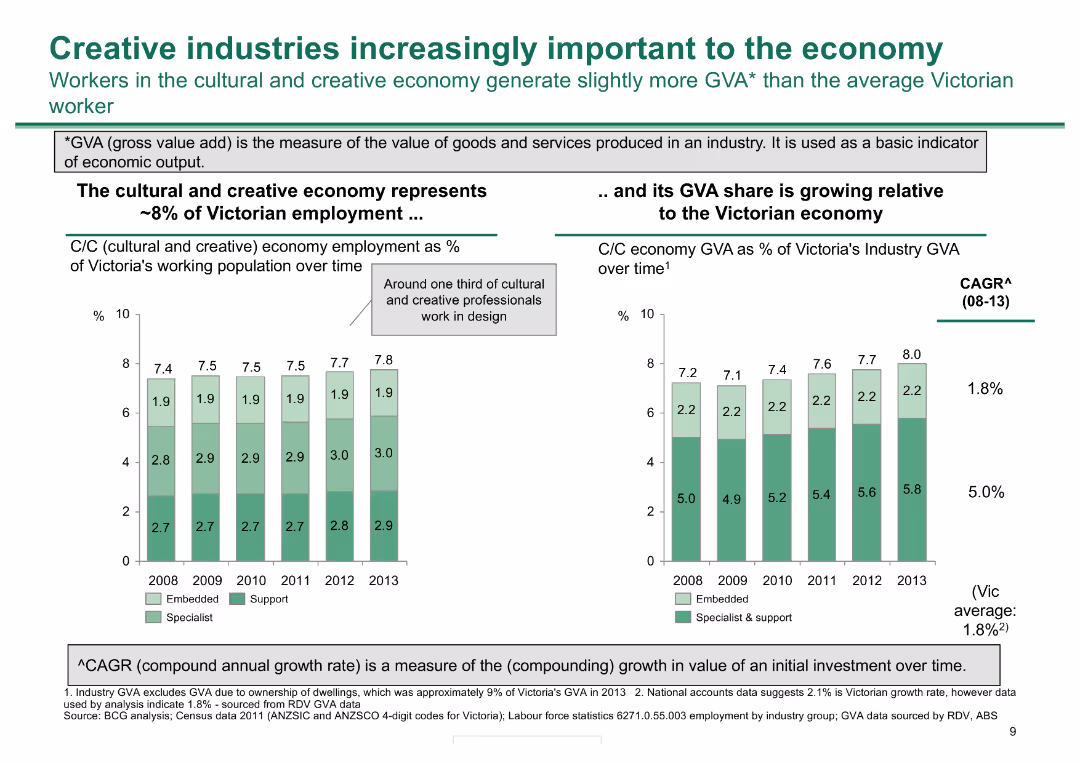
Two column charts: one showing employment percentage in creative industries, and the other showing GVA share of Victoria's industry over time.
Market Analysis and Trends
Media & Entertainment
This slide highlights the growing importance of creative industries in Victoria, showcasing employment trends and the GVA share over time to demonstrate economic impact.
creative industries, employment, GVA, Victoria, economy, trends, growth, market analysis, industry
false
Market Analysis and Trends
Media & Entertainment
Multiple Chart
BCG
Add to my slides
Remove from favorites
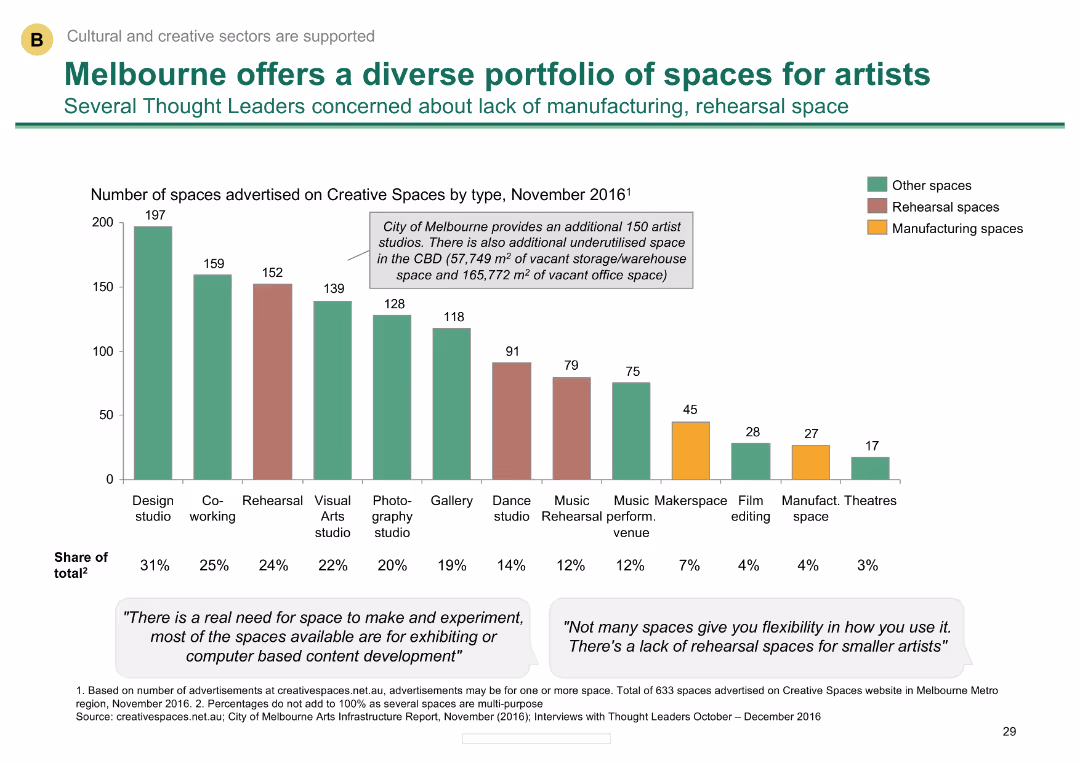
Column chart showing the number of creative spaces by type in Melbourne
Market Analysis and Trends
Media & Entertainment
Outlines the variety of creative spaces available in Melbourne, indicating a lack of manufacturing and rehearsal spaces.
Creative spaces, Melbourne, artist studios, space types, availability
false
Market Analysis and Trends
Media & Entertainment
Mixed Chart
BCG
Add to my slides
Remove from favorites
Images representing five sectors: sports and recreation, restaurants/cafes/bars, environment and heritage, creative and cultural, shopping. Text details Melbourne's creative offerings.
Strategic Planning
Media & Entertainment
The slide showcases Melbourne's diverse cultural and creative sectors, emphasizing the city's offerings in various areas and its focus on creative and cultural industries.
creativity, culture, Melbourne, sectors, sports, recreation, restaurants, heritage, shopping, creative
false
Strategic Planning
Media & Entertainment
Diagram
BCG
Add to my slides
Remove from favorites
Contains a column chart showing the reliance on marketing for creative ideas in high-growth companies, with text suggesting strategies to encourage creativity.
Strategic Planning
Professional Services
This slide discusses strategies for CMOs to foster creativity in their organizations, emphasizing the role of marketing in generating creative ideas in high-growth companies.
creativity, strategies, CMOs, professional services, marketing
false
Strategic Planning
Professional Services
Mixed Chart
Deloitte
Add to my slides
Remove from favorites
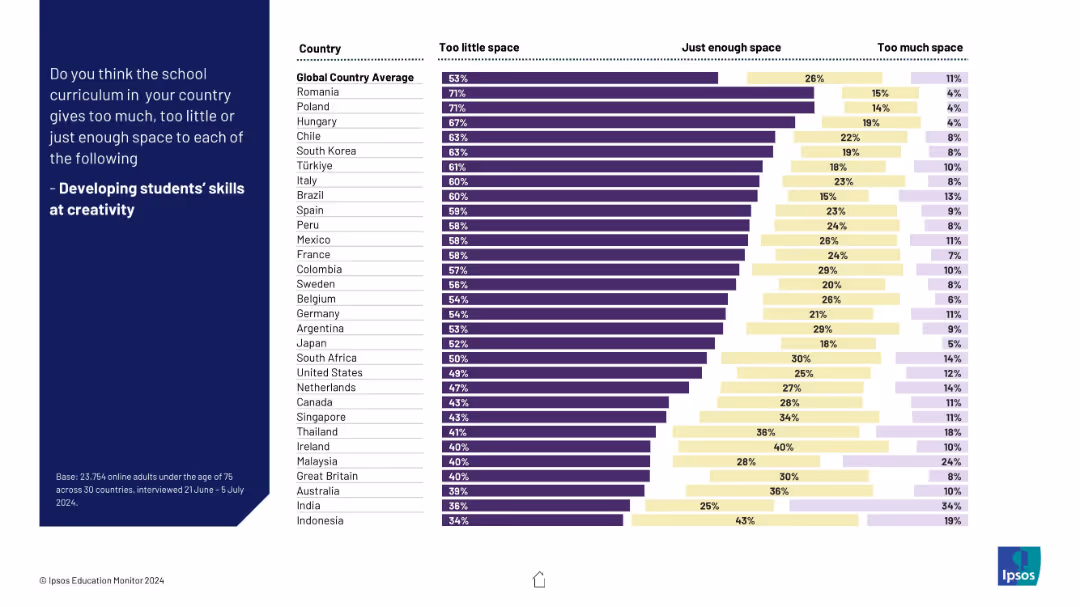
Consistent bar chart layout with responses per country; visualizes views on curriculum space for creativity; organized into three sections.
Human Resources and Talent Management
Education & Training
This slide investigates how well schools promote creativity. Respondents in many countries believe creativity receives too little attention, with Romania and Poland showing the strongest concern.
creativity, student skills, curriculum, innovation, global education, survey data, learning gaps
false
Human Resources and Talent Management
Education & Training
Mixed Chart
IPSOS
Add to my slides
Remove from favorites
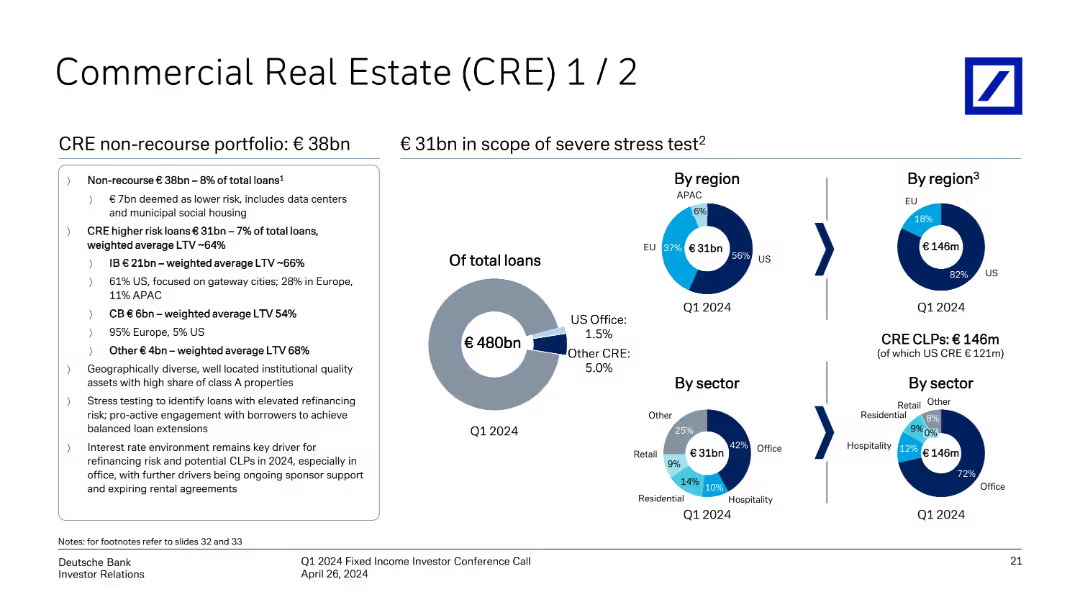
The slide features pie charts detailing CRE portfolio by region and sector, with key highlights on non-recourse and higher-risk loans.
Financial Performance
Financial Services
It provides an overview of Deutsche Bank's commercial real estate portfolio, focusing on non-recourse and higher-risk loans by region and sector.
CRE, commercial real estate, portfolio, non-recourse, higher-risk loans, region, sector, Deutsche Bank
false
Financial Performance
Financial Services
Multiple Chart
Deutsche Bank
Add to my slides
Remove from favorites
Previous
Next
You don't have any favorites yet.
Please wait loading your favorites slides...
Create a FREE account to continue browsing
Receive Instant Access to 1,000+ slides from companies like McKinsey, Google, and Goldman Sachs
First Name
Last Name
Email
Password
I agree to all
Terms & Privacy Policy
Thank you! Your submission has been received!
Oops! Something went wrong while submitting the form.
Have an account?
Sign in
Upgrade to PRO to Save slides
Advanced Search and Filters
Access to 15,000+ slides
Access to Category Pages
Save/Bookmark Slides
PowerPoint Template Library
Pick a Plan
MONTHLY
$12/month
Billed every month, Cancel anytime.
YEARLY
$9/year
Billed $108 annually, Cancel anytime.
Checkout for $12/month
Checkout for $108/yr
Secured by Stripe | AES-256 bit encryption