My Account
My Slides
Search by Category
Companies
Slide Type
Use Case
Industry
Pricing
Templates
View All Templates
Download Template Slides
✦ AI
AI Prompt Library
AI Search
Feedback
Login
Logout
Get Started
Browse all Slides
Browse all Slides
Create a FREE Account
Instant access to 1,000+ real slides from top companies like McKinsey, BCG, Goldman Sachs, Google and many more!
First Name
Last Name
Email
Password
I agree to all
Terms & Privacy Policy
Thank you! Your submission has been received!
Oops! Something went wrong while submitting the form.
Have an account?
Sign in
Saved Slides
Total No. of slides saved
0
↻ Refresh
✖ Clear all
An advanced layout that includes a series of bar graphs comparing the company's CRE concentration to its peers. Each bar graph is dedicated to a different aspect of CRE concentration, such as "Other CRE," "Multifamily," and "Office CRE." The slide is information-dense, using different shades of blue and gray to differentiate between the company and its peers.
Competitive Landscape
Financial Services
The slide compares the company’s commercial real estate (CRE) concentration to that of its peers, highlighting a strategic position of having the lowest CRE concentration. It serves to underline the company's prudent risk management practices in loan portfolio distribution.
CRE Concentration, Competitive Analysis, Risk Management, Real Estate, Loan Portfolio, Peer Comparison, Strategy, Market Position
false
Competitive Landscape
Financial Services
Multiple Chart
Morgan Stanley
Add to my slides
Remove from favorites
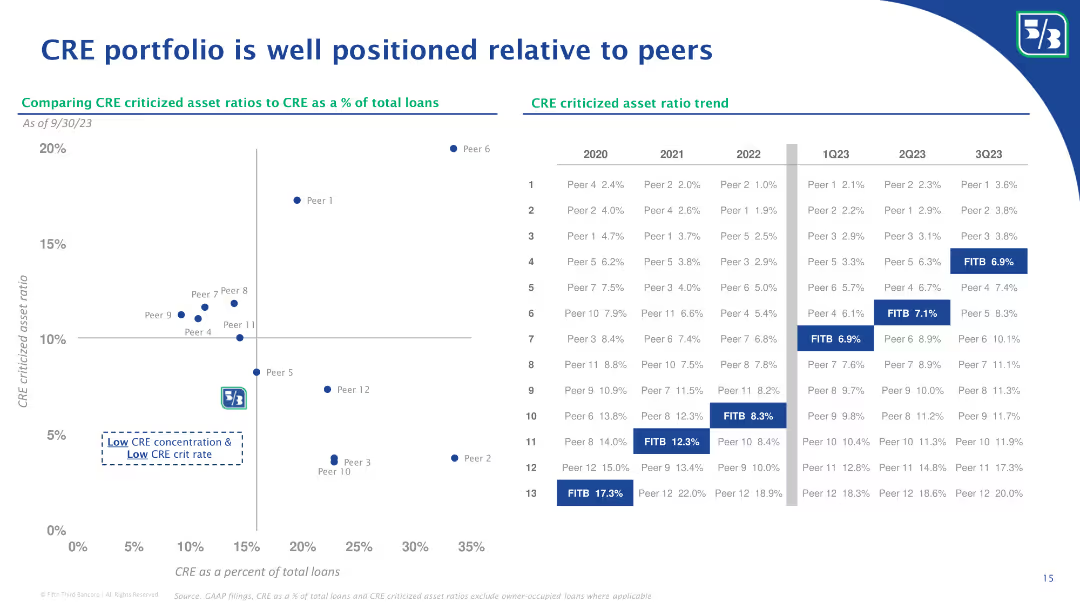
A scatter plot chart comparing CRE criticized asset ratios to CRE as a percentage of total loans. Includes a table detailing asset ratios over time.
Market Analysis and Trends
Real Estate & Construction
The slide compares the criticized asset ratios of CRE portfolios relative to peers, showing trends over several quarters.
CRE, criticized asset ratio, peer comparison, scatter plot, market analysis, asset ratio trend, real estate
false
Market Analysis and Trends
Real Estate & Construction
Mixed Chart
Goldman Sachs
Add to my slides
Remove from favorites
Column charts representing portfolio loans with quarterly changes, alongside a bar chart for FICO score distribution at origination. Clear and easy to understand layout.
Client Case Studies
Financial Services
Provides a snapshot of the credit card loan portfolio, emphasizing financial trends and borrower credit score distribution. It can serve as a case study in financial presentations to discuss credit risk management and customer profile analysis.
Credit Card, Financials, Risk, Portfolio, Scores
false
Client Case Studies
Financial Services
Multiple Chart
Morgan Stanley
Add to my slides
Remove from favorites
Displays a mobile interface showing credit card offers, along with comparison bars indicating growth in audience, engagement, and monetization.
Market Analysis and Trends
Financial Services
Discusses the impact of strategic growth drivers on the credit card sector, detailing how enhancements in data management and customer engagement have significantly increased revenue potential and market positioning in the credit card vertical.
credit card, growth, monetization, market position, data management
false
Market Analysis and Trends
Financial Services
Table
Barclays
Add to my slides
Remove from favorites
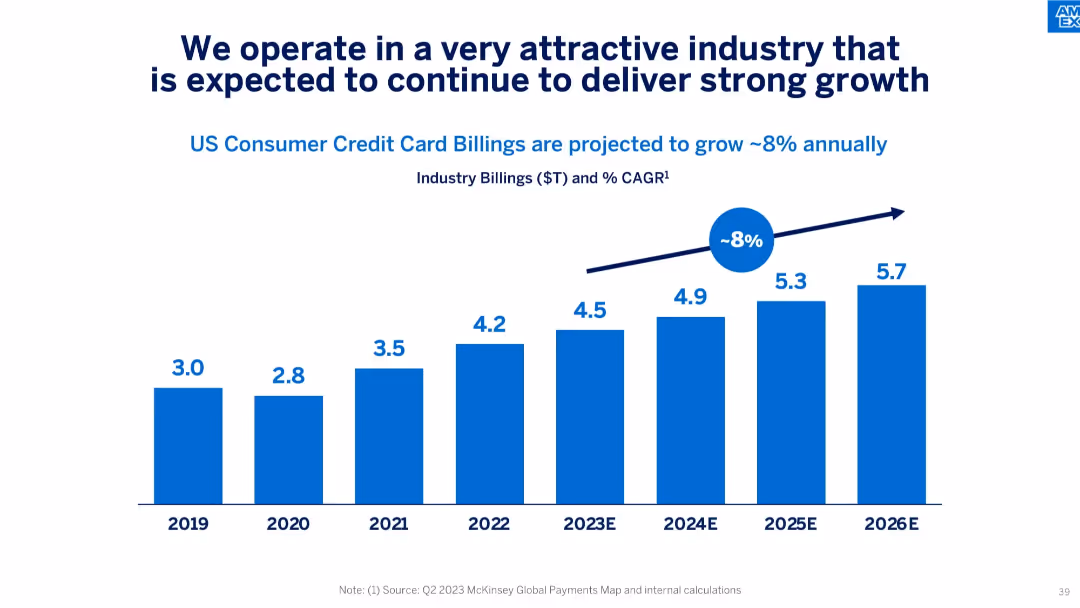
Single-column bar chart showing historical and projected US credit card billings with CAGR annotation.
Market Analysis and Trends
Financial Services
Projects strong 8% annual growth in US consumer credit card billings through 2026, indicating favorable industry trends and long-term opportunity for growth.
credit card industry, growth forecast, CAGR, billing volume, market trends, consumer credit
false
Market Analysis and Trends
Financial Services
Single Chart
McKinsey
Add to my slides
Remove from favorites
The slide contains two column charts showing net loans and advances, along with coverage rates and arrears rates for UK and US cards.
Risk Assessment and Management
Financial Services
The slide presents data on credit card portfolio risk positions for both UK and US markets, highlighting net loans, advances, and arrears rates, indicating stable risk management.
credit card, risk, portfolio, net loans, advances, arrears, UK, US, column chart, financial
false
Risk Assessment and Management
Financial Services
Multiple Chart
Barclays
Add to my slides
Remove from favorites
The slide contains a mix of column charts and textual information. It's color-coded and has headers like 'Active Accounts' and 'Sales Volume'. The layout is dense with data points and percentages highlighted.
Financial Performance
Financial Services
The slide presents data on the card franchise's performance, such as sales volume and customer retention rates. It may be used for financial reviews or shareholder presentations.
credit card, sales volume, industry leader, customer retention, net revenue
false
Financial Performance
Financial Services
Multiple Chart
JP Morgan
Add to my slides
Remove from favorites
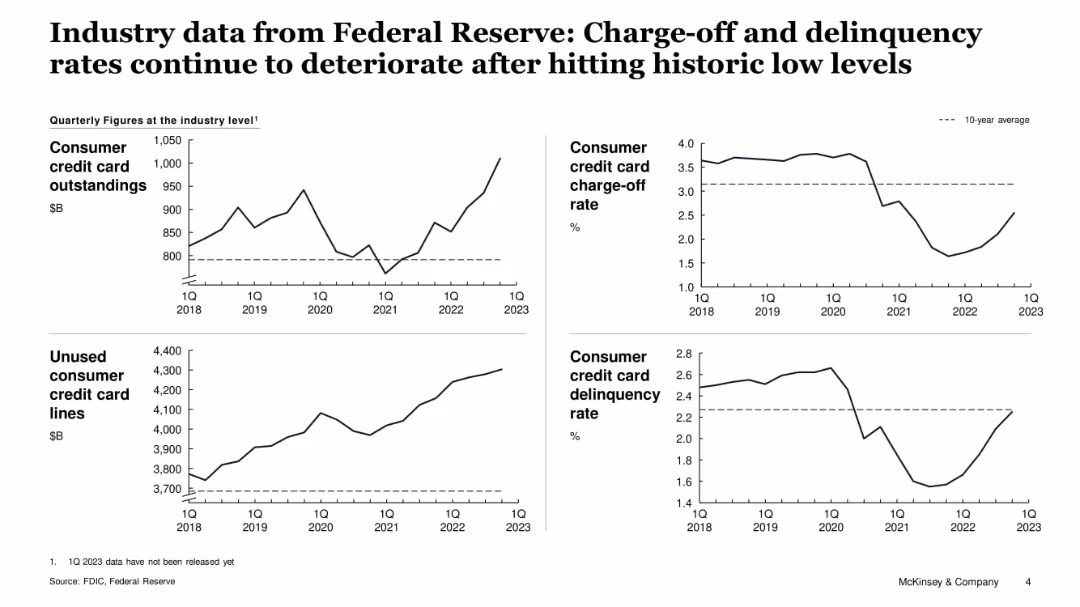
Four-line charts showing consumer credit trends including outstandings, charge-off and delinquency rates
Risk Assessment and Management
Financial Services
The slide tracks consumer credit card trends from 2018 to 2023. It notes a rise in outstandings and unused credit, while both charge-off and delinquency rates are increasing after historic lows. These trends may signal rising consumer financial stress despite broader economic recovery.
credit cards, delinquencies, charge-offs, consumer debt, financial risk, Federal Reserve, trends
false
Risk Assessment and Management
Financial Services
Single Chart
McKinsey
Add to my slides
Remove from favorites
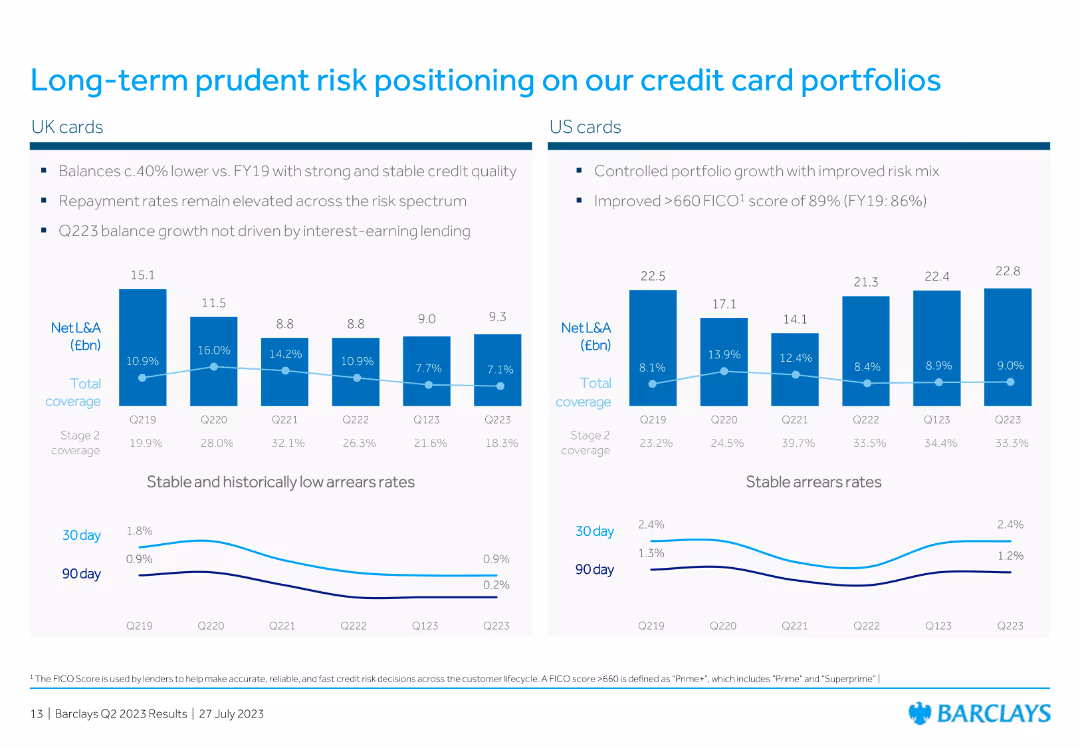
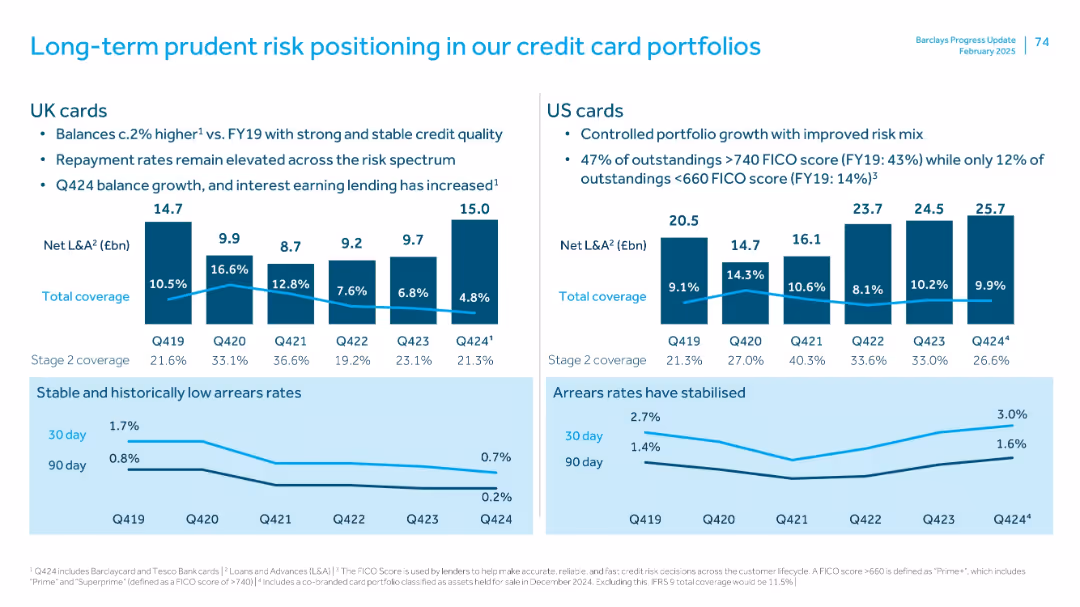
Two vertical bar charts with supporting bullet points and line charts on delinquencies and arrears
Risk Assessment and Management
Financial Services
Demonstrates disciplined credit card portfolio growth in the UK and US, with stable delinquency rates, strong FICO score distribution, and clear risk metrics like stage 2 coverage and net loans & advances.
credit cards, delinquencies, risk, UK, US, FICO
false
Risk Assessment and Management
Financial Services
Multiple Chart
Barclays
Add to my slides
Remove from favorites
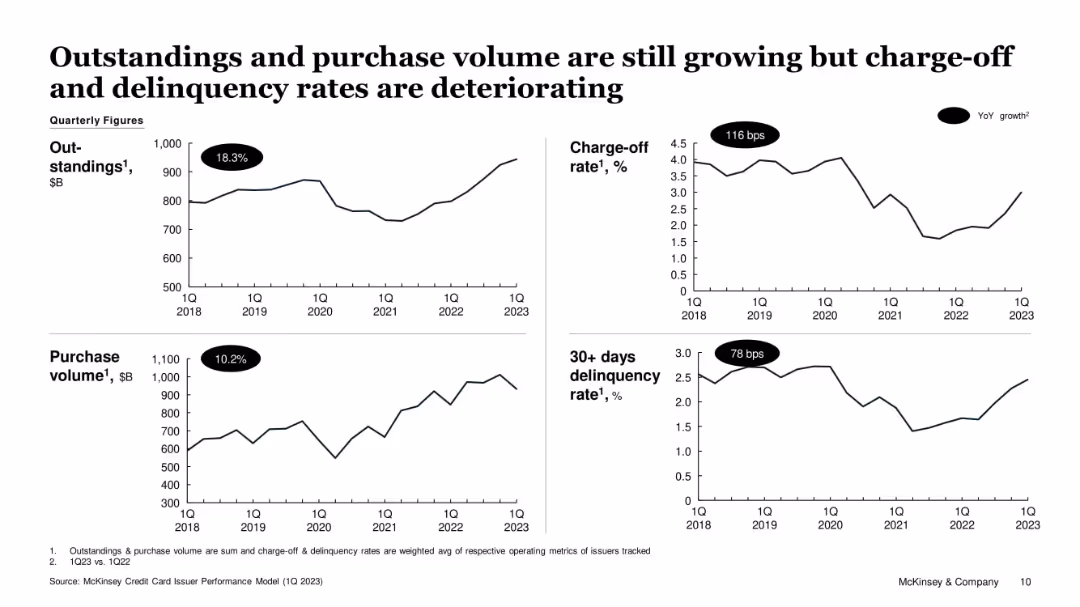
Four-panel line chart dashboard format; clear YoY labels for growth in key credit indicators
Performance Metrics and KPIs
Financial Services
The slide presents trends in credit metrics from 2018 to 2023. Despite 18.3% growth in outstandings and 10.2% growth in purchase volume, charge-off and 30+ day delinquency rates have risen significantly. This suggests increased consumer borrowing risks despite continued credit activity expansion.
credit cards, outstandings, delinquency, charge-off, purchase volume, consumer risk, McKinsey
false
Performance Metrics and KPIs
Financial Services
Single Chart
McKinsey
Add to my slides
Remove from favorites
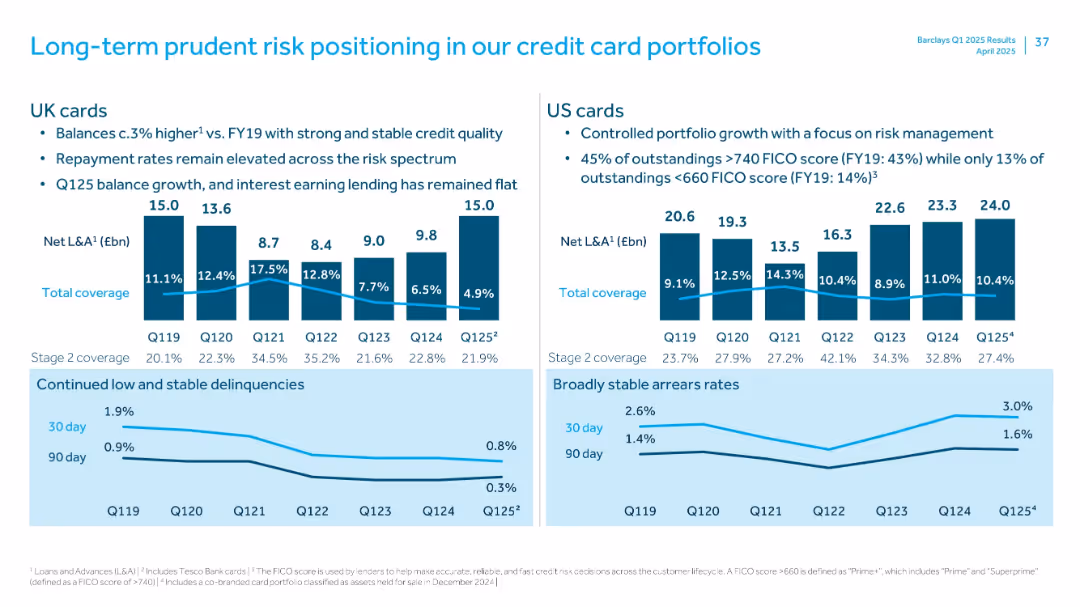
Dual-column format: UK cards (left), US cards (right); bar and line charts of net balances, coverage, and arrears trends
Risk Assessment and Management
Financial Services
This slide assesses credit card risk across UK and US segments. It shows net loans & advances, total and Stage 2 coverage, and arrears rates. Trends show stabilization and improvement in credit quality, aided by portfolio control, higher FICO score proportions, and strong repayment rates.
credit cards, risk coverage, arrears, FICO score, Stage 2, loan balances
false
Risk Assessment and Management
Financial Services
Multiple Chart
Barclays
Add to my slides
Remove from favorites
Two large column charts comparing UK and US credit card metrics, with additional trend lines below.
Risk Assessment and Management
Financial Services
Analyzes risk metrics for credit card portfolios in UK and US, highlighting changes in arrears and repayment rates.
credit cards, risk management, UK, US, financial stability
false
Risk Assessment and Management
Financial Services
Multiple Chart
Barclays
Add to my slides
Remove from favorites
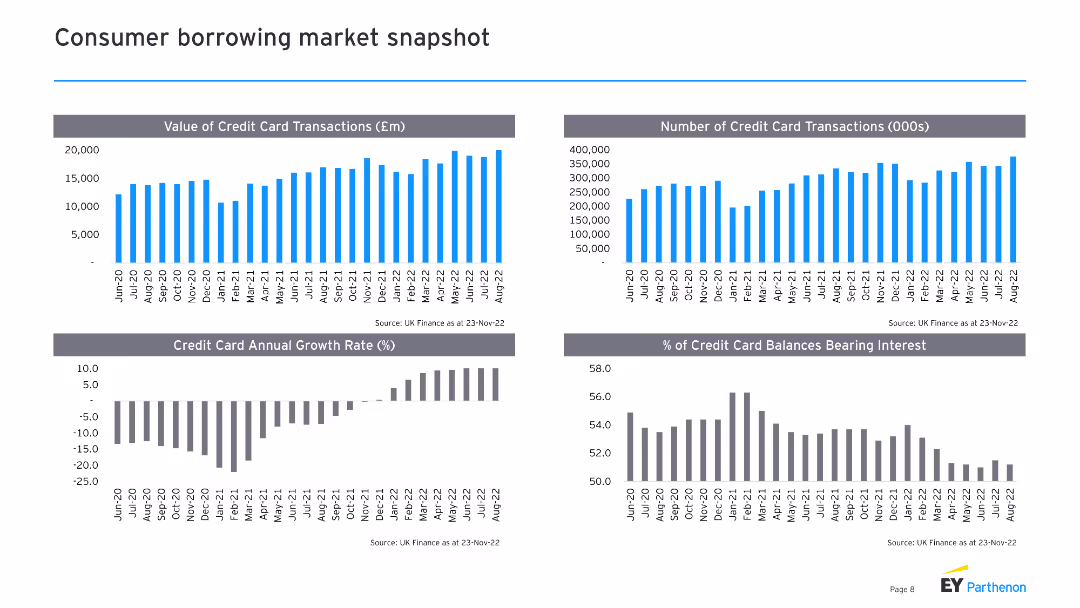
The slide contains four column charts, showing values of credit card transactions, number of credit card transactions, credit card annual growth rate, and percentage of credit card balances bearing interest over time.
Market Analysis and Trends
Financial Services
The slide provides an overview of consumer borrowing trends, focusing on credit card transactions, growth rates, and balances, useful for analyzing market conditions and consumer behavior.
credit card, transactions, growth rate, balances, trends
false
Market Analysis and Trends
Financial Services
Multiple Chart
EY
Add to my slides
Remove from favorites
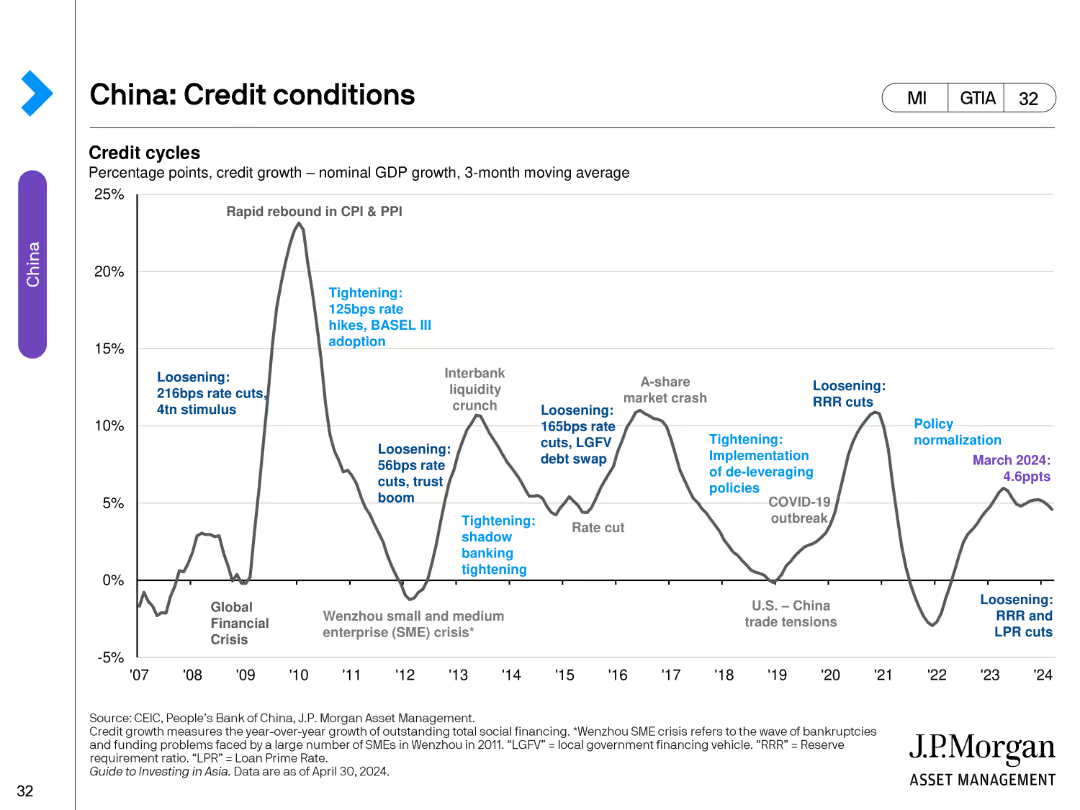
The slide contains a single line chart tracking credit cycles, percentage points, and GDP growth with notable economic events and policy changes annotated.
Market Analysis and Trends
Financial Services
This slide provides an overview of China's credit conditions, detailing changes in credit growth and notable economic and policy events.
Credit, Conditions, China, GDP, Policy
false
Market Analysis and Trends
Financial Services
Single Chart
JP Morgan
Add to my slides
Remove from favorites
A slide with two large area graphs, overlaid with line graphs, displaying global credit creation data. The visual elements are significant, indicating the data's impact and importance.
Investment Analysis
Financial Services
Explains the impact of quantitative tightening on global credit, important for investors and analysts monitoring the financial sector's health. This slide likely informs discussions on macroeconomic policy effects on investment environments.
Credit Creation, Quantitative Tightening, Global, Finance
false
Investment Analysis
Financial Services
Multiple Chart
Morgan Stanley
Add to my slides
Remove from favorites
The slide features a column chart with historical data on leveraged finance fees, broken down by sponsors and corporates.
Risk Assessment and Management
Financial Services
The slide presents data on how Credit Suisse has managed leveraged finance fees through different credit cycles, showing the market share and trends over time.
credit cycles, leveraged finance, Credit Suisse, fees, market share, trends, sponsors, corporates, management
false
Risk Assessment and Management
Financial Services
Single Chart
Credit Suisse
Add to my slides
Remove from favorites
The slide contains three distinct content blocks with bullet points outlining strategies for business expansion and differentiation.
Strategic Planning
Financial Services
This slide outlines the company's strategies for maintaining and extending its industry lead by expanding core data assets, differentiating new businesses, and leveraging innovation in financial technology and other services.
credit, expansion, fintech, differentiation, analytics
false
Strategic Planning
Financial Services
Header Horizontal
Barclays
Add to my slides
Remove from favorites
Slide features a large pie chart illustrating credit exposure, complemented by smaller column and pie charts detailing the breakdown by subsegment and rating, and exposure by business area.
Investment Analysis
Financial Services
Examines BBVA's credit exposure to the oil and gas sector, showcasing limited risk and investment grade focus. Suitable for evaluating sector-specific credit risk and investment strategies.
Credit Exposure, Oil and Gas, Investment Grade, Risk Assessment, Business Areas, Credit Risk
false
Investment Analysis
Financial Services
Multiple Chart
Morgan Stanley
Add to my slides
Remove from favorites
The slide includes a column chart showing APAC WM&C credit volume over different quarters. The layout is simple with blue and white colors and bulleted points on the right outlining key details.
Risk Assessment and Management
Financial Services
The slide explains the approach to credit growth in APAC WM&C through client selection and pricing discipline. It highlights credit volume growth, client deleveraging, and the composition of the loan book.
Credit Growth, Client Selection, Pricing Discipline, APAC, WM&C
false
Risk Assessment and Management
Financial Services
Mixed Chart
Credit Suisse
Add to my slides
Remove from favorites
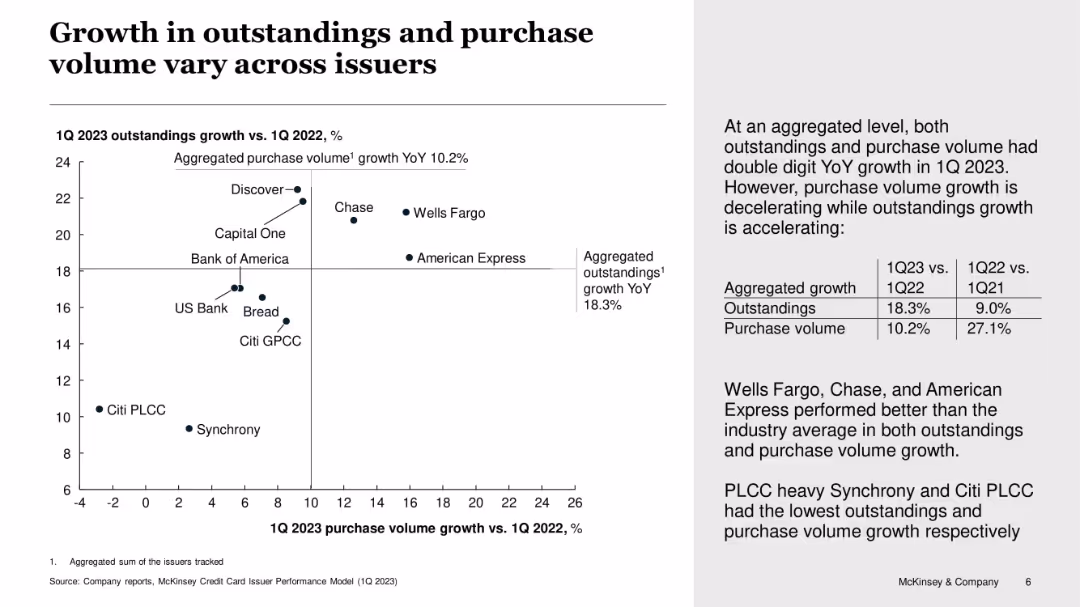
Scatter plot comparing purchase volume vs outstandings YoY growth; with supporting commentary
Performance Metrics and KPIs
Financial Services
This slide compares credit card issuers based on growth in purchase volume and outstandings for Q1 2023. While overall growth is strong, some issuers like Discover and Chase lead both metrics, whereas PLCC-heavy firms like Synchrony and Citi PLCC lag behind. Commentary highlights issuer-level differences.
credit growth, issuers, outstandings, purchase volume, performance, Synchrony, Discover, McKinsey
false
Performance Metrics and KPIs
Financial Services
Mixed Chart
McKinsey
Add to my slides
Remove from favorites
Two line charts show the growth in loan balances and the net change in credit standards for small and medium-sized banks versus large banks from 2019 to Q4 2022. Accompanying text outlines implications for corporate strategies regarding financing and market conditions.
Market Analysis and Trends
Financial Services
This slide analyzes the impact of market and regulatory pressures on smaller US banks and the resultant credit contraction. It highlights implications for corporates, including increased costs for borrowing, stricter lending standards, and potential economic impacts.
Credit growth, lending standards, small banks, large banks, market pressure, regulatory impact, financing, corporate implications, economic impact
false
Market Analysis and Trends
Financial Services
Multiple Chart
Accenture
Add to my slides
Remove from favorites
The slide is divided into four sections each containing a set of column charts, representing various credit ratings over time. Colors differentiate the rating categories.
Market Analysis and Trends
Financial Services
The slide presents trends in credit quality of US and European markets, distinguishing between investment grades and high yields. Useful for financial trend analysis.
credit, investment, trends, US, Europe, bond, loan, market, quality, rating
false
Market Analysis and Trends
Financial Services
Multiple Chart
Morgan Stanley
Add to my slides
Remove from favorites
Features a combination of column charts and text, comparing IFRS and US GAAP credit loss expenses. The layout is moderately complex with detailed data comparisons.
Regulatory and Compliance
Financial Services
The slide compares credit loss expenses and allowances under IFRS and US GAAP, highlighting differences in financial impact, useful for compliance and financial reporting.
Credit, Loss, Comparison, IFRS, GAAP
false
Regulatory and Compliance
Financial Services
Mixed Chart
UBS
Add to my slides
Remove from favorites
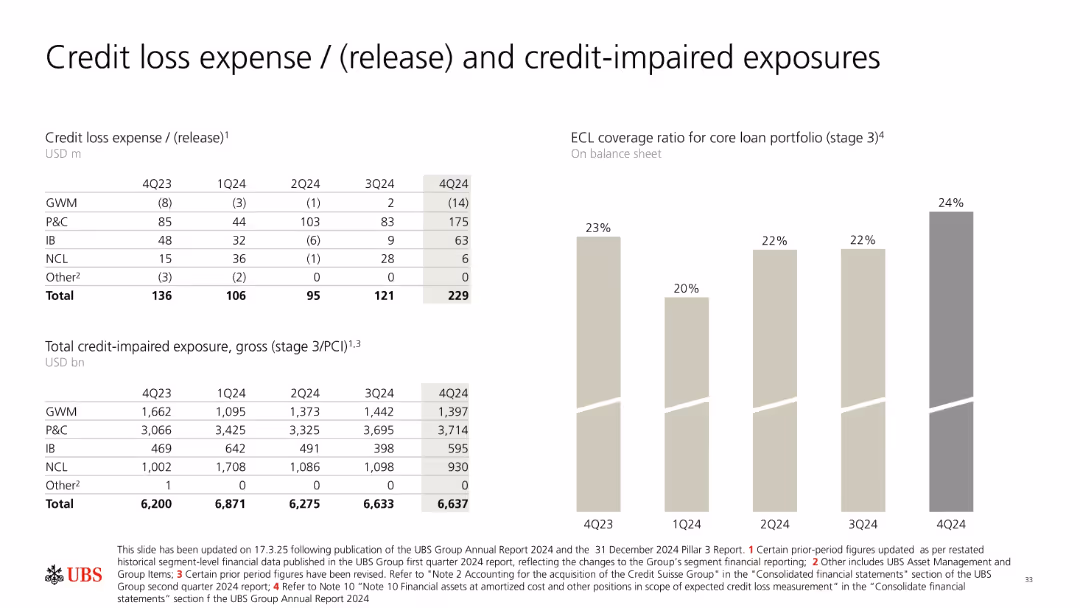
Tables showing credit loss expense/release and credit impaired exposure, with bar charts of ECL coverage ratios over time.
Risk Assessment and Management
Financial Services
Presentation of UBS's credit loss expenses and impaired exposures, focusing on trends in expected credit loss (ECL) coverage ratios.
Credit loss, ECL, exposures, impairment, trends
false
Risk Assessment and Management
Financial Services
Mixed Chart
UBS
Add to my slides
Remove from favorites
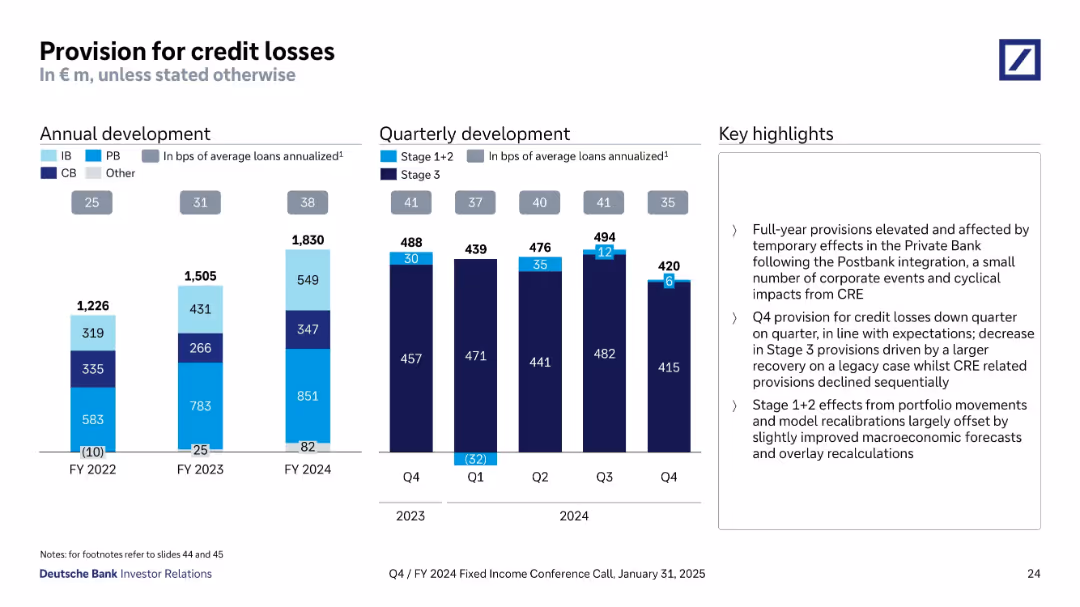
Features bar charts and bullet points for financial data.
Risk Assessment and Management
Financial Services
Provides detailed view of credit loss provisions annually and quarterly.
credit, losses, financial, risk
false
Risk Assessment and Management
Financial Services
Multiple Chart
Deutsche Bank
Add to my slides
Remove from favorites
Features a series of column chart representing provisions for credit losses over several quarters. Each bar is annotated with figures for quick comparison, and key points are summarized on the side.
Risk Assessment and Management
Financial Services
This slide focuses on the quarterly provisions for credit losses, offering a detailed view of financial health and risk management strategies. It highlights trends and provides insights into the effectiveness of risk management practices within the financial sector.
credit losses, financial, risk management, trends, quarterly
false
Risk Assessment and Management
Financial Services
Mixed Chart
Deutsche Bank
Add to my slides
Remove from favorites
Contains multiple column charts showing annual and quarterly development of credit loss provisions, differentiated by bank divisions such as Investment and Private Bank, using varying colors.
Risk Assessment and Management
Financial Services
Summarizes the changes in provisions for credit losses over time, showing how economic conditions and bank strategies impact the financial health and risk management.
credit, losses, financial, risk, provisions
false
Risk Assessment and Management
Financial Services
Multiple Chart
Deutsche Bank
Add to my slides
Remove from favorites
Slide includes stacked column charts displaying credit losses and stages of loans across different banking sectors.
Risk Assessment and Management
Financial Services
Analyzes credit loss provisions and the status of stage 3 loans in Q1 2023 across various banking divisions, illustrating risk management and credit performance within the bank.
credit losses, loans, risk management, Q1 2023
false
Risk Assessment and Management
Financial Services
Multiple Chart
Deutsche Bank
Add to my slides
Remove from favorites
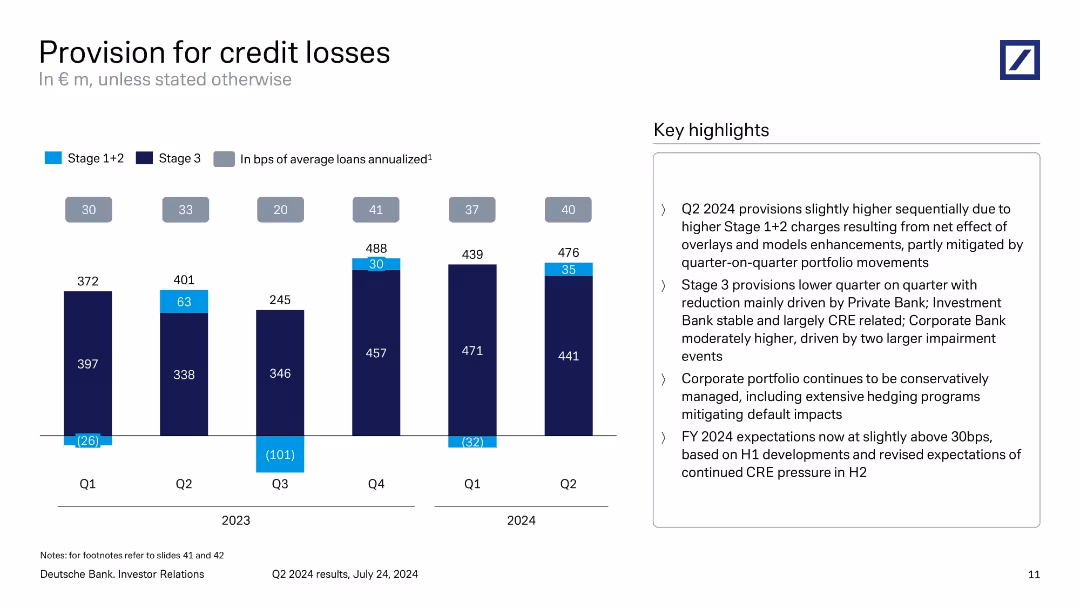
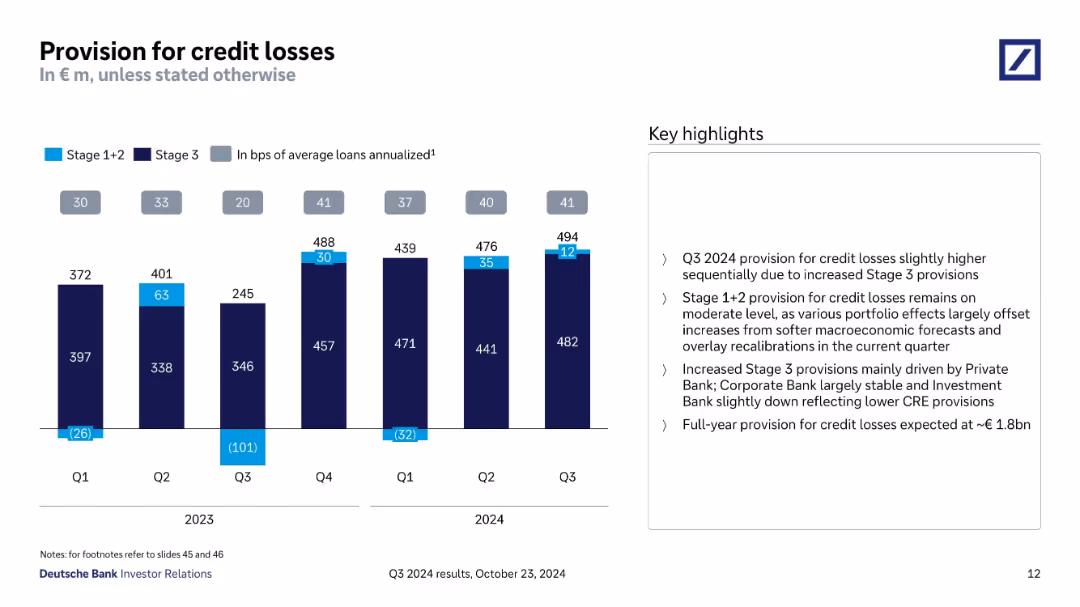
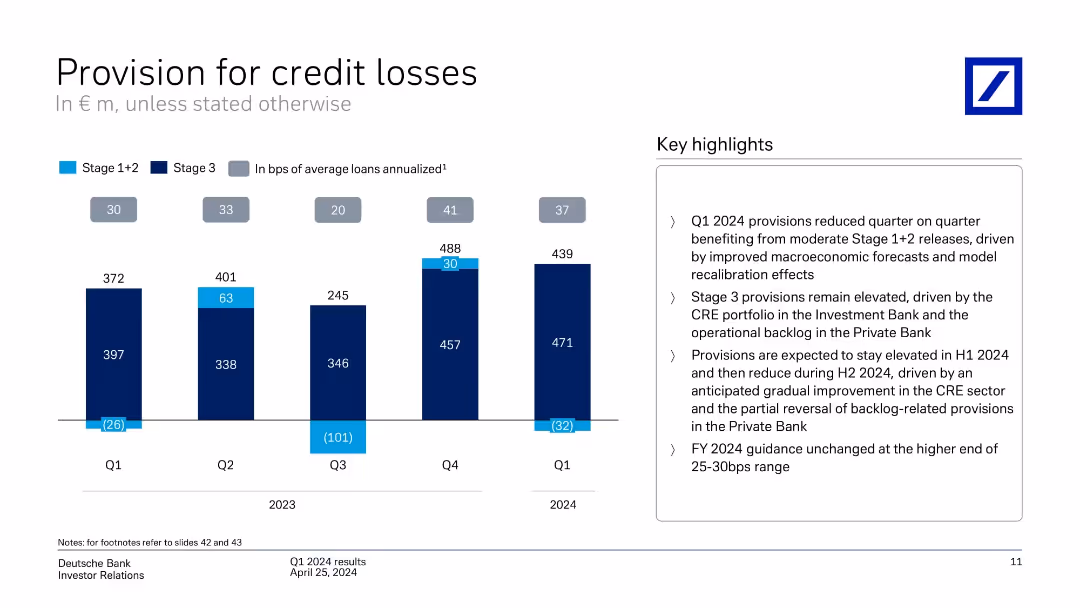
Vertical bar chart over 6 quarters, split by stages 1+2 and 3, with bps overlay and commentary box on the right.
Risk Assessment and Management
Financial Services
Depicts provision for credit losses over recent quarters, segmented by impairment stage. Notes elevated provisions in Q2 2024, driven by overlays, model changes, and impairment events. Commentary includes outlook for FY 2024 provisions and continued conservative risk management.
credit losses, provision, impairment, risk management, Stage 3, CRE, Deutsche Bank
false
Risk Assessment and Management
Financial Services
Mixed Chart
Deutsche Bank
Add to my slides
Remove from favorites
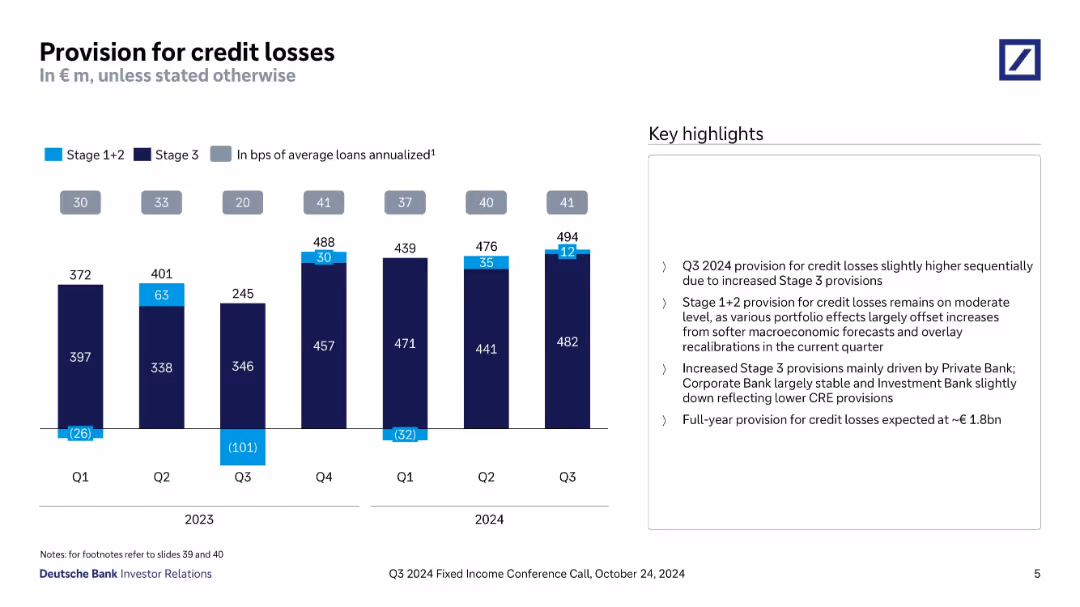
Bar chart with stacked components (Stage 1+2 and Stage 3 losses) across quarters. A sidebar provides key highlights summarizing provision drivers and future expectations.
Risk Assessment and Management
Financial Services
Shows quarterly trend in provisions for credit losses, with emphasis on stable Stage 1+2 provisioning and increasing Stage 3 driven by the Private Bank. It notes macroeconomic adjustments and forecasts full-year provisions of ~€1.8bn.
credit losses, provisioning, Stage 3, macroeconomic impact, Private Bank, risk, Q3 2024, annualized loans
false
Risk Assessment and Management
Financial Services
Mixed Chart
Deutsche Bank
Add to my slides
Remove from favorites
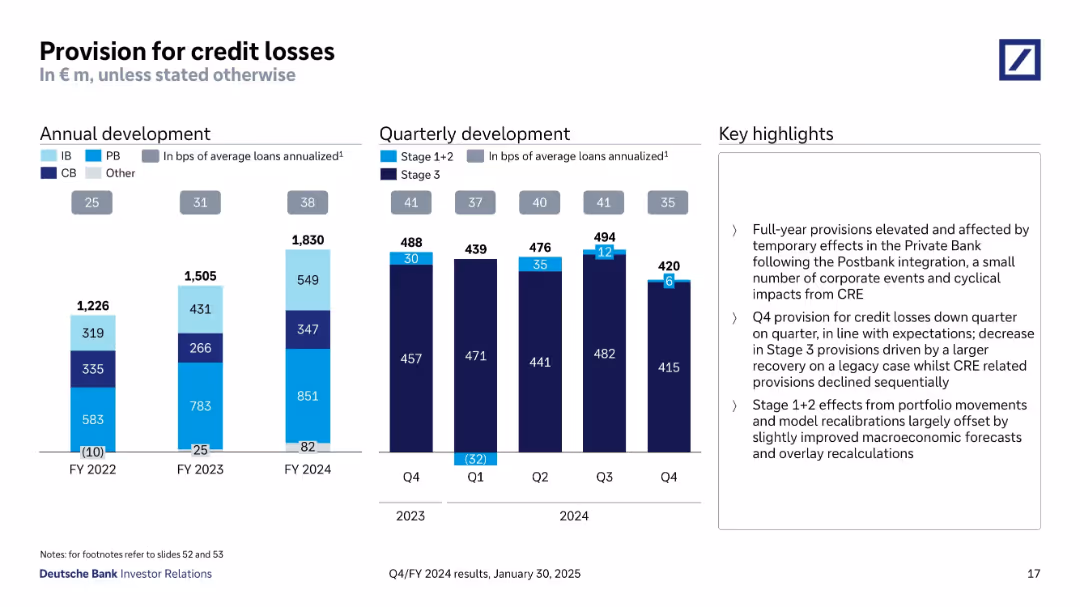
Two bar graphs showing annual and quarterly development of credit loss provisions. Segment categories and stage breakdowns shown.
Risk Assessment and Management
Financial Services
Shows Deutsche Bank’s annual and quarterly provisions for credit losses, including breakdown by segment and loan stage. Notes effects from Postbank integration and cyclical events. Q4 2024 saw a decline in Stage 3 provisions due to a legacy recovery.
credit losses, provision, risk, loan quality, Postbank, stage 3
false
Risk Assessment and Management
Financial Services
Multiple Chart
Deutsche Bank
Add to my slides
Remove from favorites
The slide features a vertical column chart displaying credit loss provisions by quarter, with detailed annotations. Additional key highlights are listed on the right.
Risk Assessment and Management
Financial Services
The slide details the provisions for credit losses across different quarters, emphasizing the impact of economic factors and forecast adjustments.
credit losses, provisions, financial health, risk management, Deutsche Bank, Q1 2024, economic forecast, quarterly performance, investor relations
false
Risk Assessment and Management
Financial Services
Mixed Chart
Deutsche Bank
Add to my slides
Remove from favorites
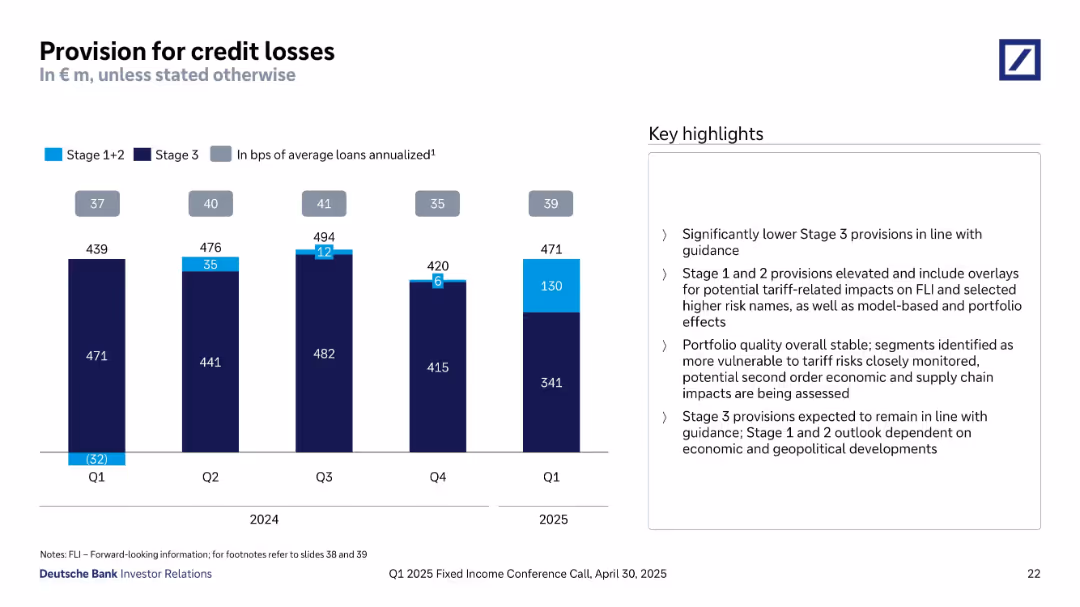
Bar chart tracking provision breakdown (Stage 1+2 vs Stage 3) from Q1 2024 to Q1 2025; bullet points on right.
Risk Assessment and Management
Financial Services
The slide tracks provisions for credit losses over five quarters, indicating a shift toward Stage 1+2 provisions driven by tariff and geopolitical risks. It notes stable portfolio quality and stresses on monitoring vulnerable segments.
credit losses, provisions, Stage 1+2, Stage 3, tariff risk, portfolio quality, Q1 2025, risk overlays
false
Risk Assessment and Management
Financial Services
Mixed Chart
Deutsche Bank
Add to my slides
Remove from favorites
Bar chart with Stage 1+2 vs Stage 3 provisions; numerical and visual breakdown by quarter.
Risk Assessment and Management
Financial Services
Illustrates quarterly credit loss provisions split by stage, showing a slight increase in Q3 2024 due to Stage 3 provisions. Includes analysis of underlying drivers and expected full-year provision (~€1.8bn).
credit losses, provisions, Stage 3, risk, quarterly comparison
false
Risk Assessment and Management
Financial Services
Mixed Chart
Deutsche Bank
Add to my slides
Remove from favorites
A column chart showing the provision for credit losses by stage, with key highlights on the right. The slide is detailed with a focus on credit loss provisions over different quarters.
Risk Assessment and Management
Financial Services
The slide details the provisions for credit losses in Q1 2024, breaking down the amounts by stage and providing key insights on trends and future expectations.
Credit losses, provisions, stage breakdown, Q1 2024, trends
false
Risk Assessment and Management
Financial Services
Mixed Chart
Deutsche Bank
Add to my slides
Remove from favorites
Features column charts showing the provision for credit losses in different stages, with annotations explaining the fiscal quarter trends.
Risk Assessment and Management
Financial Services
Discusses changes in provisions for credit losses at Deutsche Bank, emphasizing improvements in risk management and economic forecasting.
credit losses, risk management, banking, provisions, forecasting
false
Risk Assessment and Management
Financial Services
Mixed Chart
Deutsche Bank
Add to my slides
Remove from favorites
Features column charts illustrating credit loss provisions over several quarters. It uses color coding to differentiate between stages of credit, complemented by succinct explanatory notes.
Risk Assessment and Management
Financial Services
Focuses on the trends in credit loss provisions at Deutsche Bank, showing historical data and recent quarterly changes. It is valuable for risk management analysis and financial planning.
credit losses, risk management, quarterly trends, financial planning
false
Risk Assessment and Management
Financial Services
Mixed Chart
Deutsche Bank
Add to my slides
Remove from favorites
Column charts showing provisions for credit losses over several quarters with an additional line graph overlay for average loans. Includes key highlights.
Risk Assessment and Management
Financial Services
Discusses credit loss provisions, showcasing trends and risk management strategies in response to economic conditions.
Credit losses, risk management, trends
false
Risk Assessment and Management
Financial Services
Mixed Chart
Deutsche Bank
Add to my slides
Remove from favorites
Bar chart displaying Stage 1+2 and Stage 3 provisions for five quarters; includes bps of average loans as a metric
Risk Assessment and Management
Financial Services
This slide tracks Deutsche Bank’s credit loss provisions over five quarters, emphasizing a sharp drop in Stage 3 losses and a rise in Stage 1+2 due to broader macroeconomic and model-based factors.
credit losses, Stage 1+2, Stage 3, provisions, risk, Deutsche Bank
false
Risk Assessment and Management
Financial Services
Mixed Chart
Deutsche Bank
Add to my slides
Remove from favorites
Contains column charts and tables. Blue shades differentiate between Private, Corporate, and Investment Banks. Dense with numerical data.
Financial Performance
Financial Services
Analyzes credit loss provisions and stage 3 loans across different banking segments over several quarters. Used for financial analysis.
Credit losses, stage 3 loans, banking, financial data, provisions, coverage ratios, amortized cost, investment calls
false
Financial Performance
Financial Services
Multiple Chart
Deutsche Bank
Add to my slides
Remove from favorites
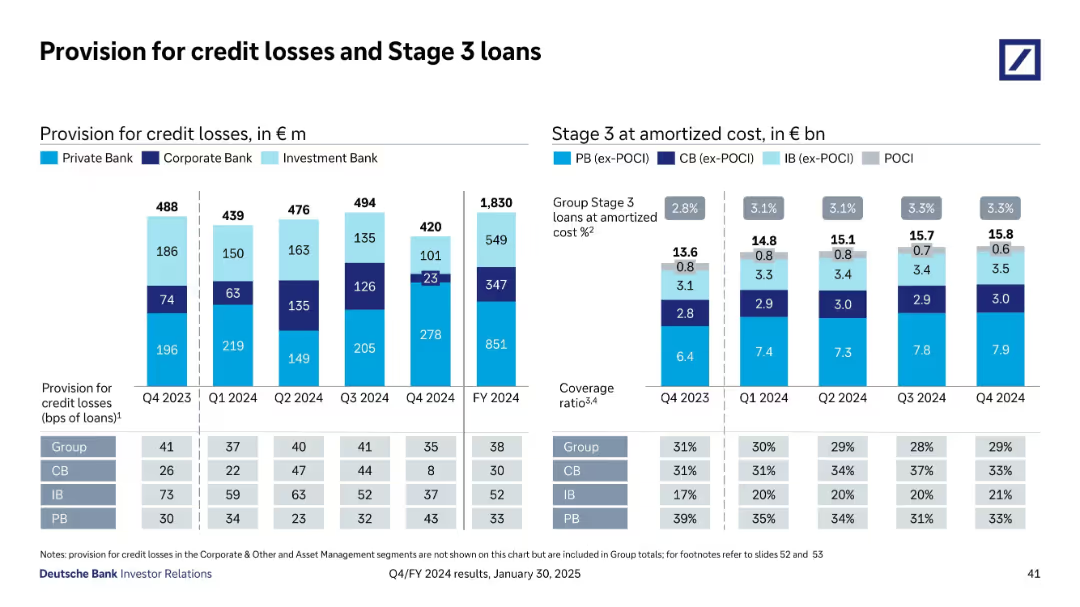
This slide presents multiple column charts and tables detailing the provision for credit losses across different bank divisions (Private, Corporate, Investment) over multiple quarters, alongside data on stage 3 loans. Color coding differentiates the bank types and stages of loans with respective numbers and percentages.
Risk Assessment and Management
Financial Services
This slide offers a detailed review of credit losses and exposure by banking segment, tracking changes over recent quarters. It helps in assessing the financial health and risk exposure of bank divisions, crucial for financial stability and regulatory compliance.
credit losses, stage 3 loans, banking, risk exposure, quarterly data, private bank, corporate bank, investment bank
false
Risk Assessment and Management
Financial Services
Multiple Chart
Deutsche Bank
Add to my slides
Remove from favorites
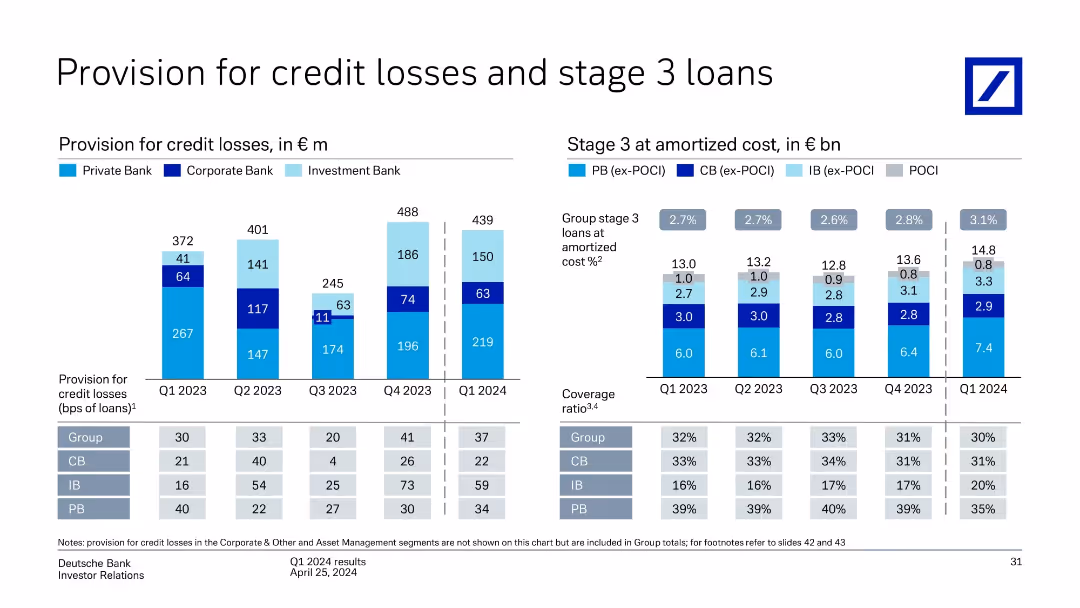
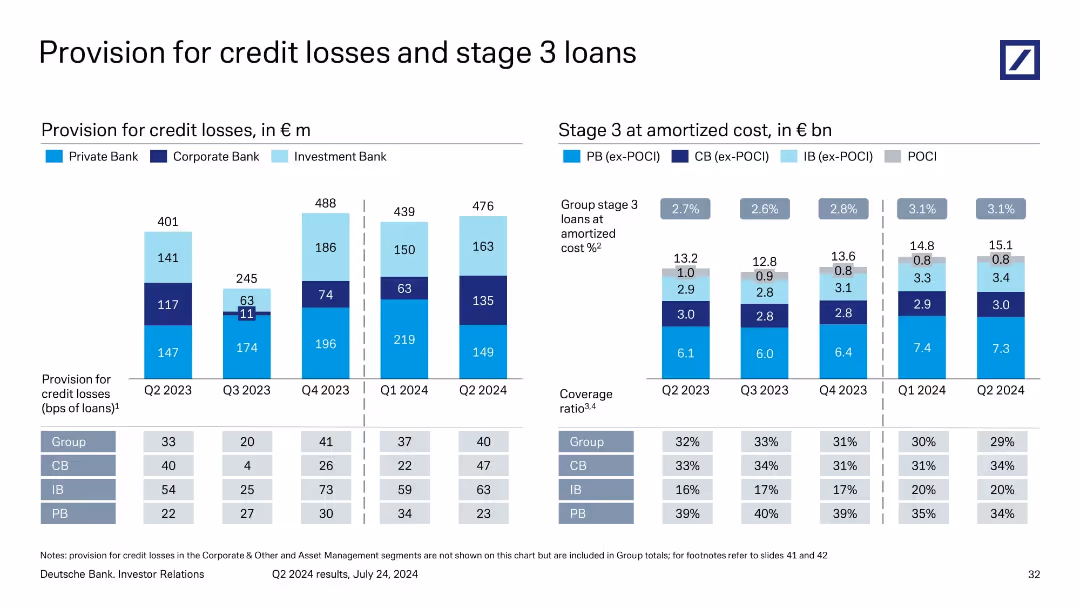
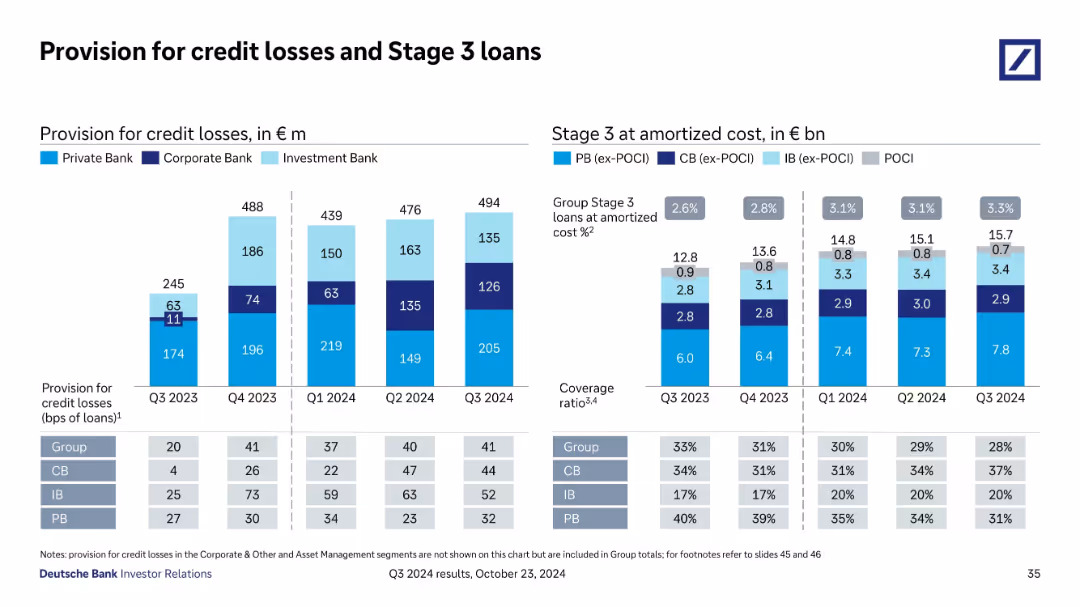
Two sets of bar charts: Left – quarterly provisions for credit losses by unit; Right – stage 3 loan volumes at amortized cost and related coverage ratios.
Risk Assessment and Management
Financial Services
Depicts Deutsche Bank’s credit risk provisioning trends and stage 3 loans from Q1 2023 to Q1 2024. Credit losses peaked in Q4 2023 and declined slightly in Q1 2024. Coverage ratios and stage 3 loan volumes are tracked, showing increasing risk in Private Bank segment.
credit losses, stage 3 loans, provisioning, risk coverage, amortized cost, Deutsche Bank
false
Risk Assessment and Management
Financial Services
Multiple Chart
Deutsche Bank
Add to my slides
Remove from favorites
This slide features column charts detailing provisions for credit losses and stage 3 loans across different business divisions (Private Bank, Corporate Bank, Investment Bank) for Q1 2023 to Q1 2024.
Risk Assessment and Management
Financial Services
The slide discusses Deutsche Bank's provisions for credit losses and the status of stage 3 loans from Q1 2023 to Q1 2024, highlighting changes across Private Bank, Corporate Bank, and Investment Bank.
credit losses, stage 3 loans, provisions, business divisions, Deutsche Bank, Q1 2024
false
Risk Assessment and Management
Financial Services
Multiple Chart
Deutsche Bank
Add to my slides
Remove from favorites
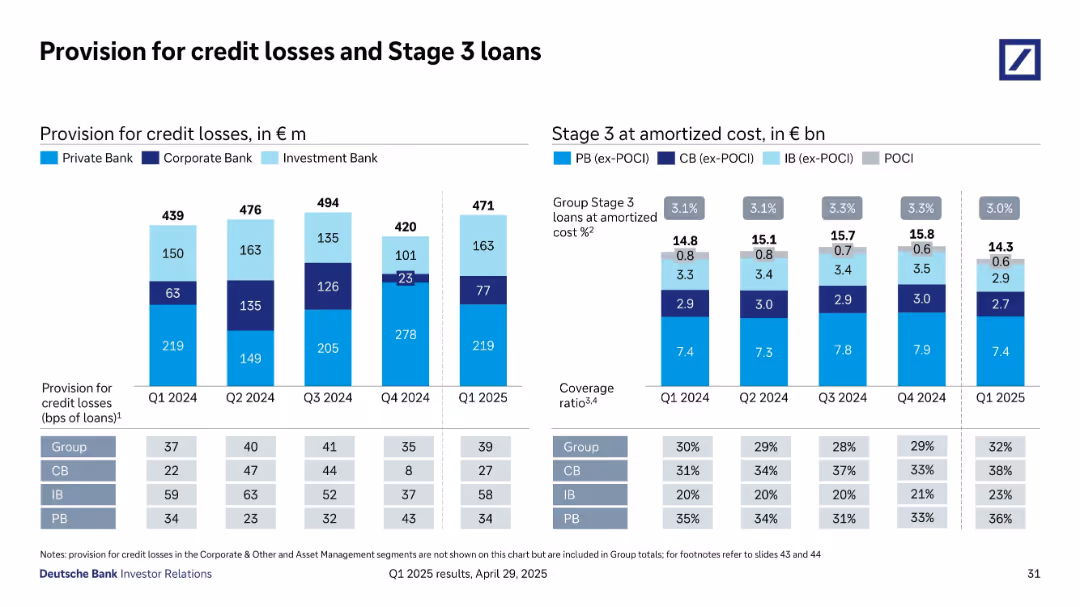
Stacked bar and column charts show credit loss provisions and Stage 3 loan amounts by division and time; includes table and key metrics
Risk Assessment and Management
Financial Services
Shows provisions for credit losses and Stage 3 loan balances by business unit from Q4 2023 to Q4 2024. Group-level ratios, coverage, and bps data illustrate a relatively stable risk environment, with investment and private banks absorbing most losses; Corporate Bank fluctuates moderately.
credit losses, Stage 3 loans, provisions, risk, amortized cost, coverage
false
Risk Assessment and Management
Financial Services
Multiple Chart
Deutsche Bank
Add to my slides
Remove from favorites
Two-column layout with vertical stacked bar charts; left side shows provisions over 5 quarters; right side shows stage 3 loans and coverage ratios over time.
Risk Assessment and Management
Financial Services
The slide details Deutsche Bank’s provision for credit losses by business segment over five quarters, alongside stage 3 loan balances and associated coverage ratios. It shows trends in credit provisioning and risk levels in private, corporate, and investment banking, highlighting the bank’s exposure and risk mitigation efforts.
credit losses, stage 3 loans, provisions, risk coverage, banking sectors
false
Risk Assessment and Management
Financial Services
Multiple Chart
Deutsche Bank
Add to my slides
Remove from favorites
Includes stacked column charts and column charts detailing provisions for credit losses and the status of stage 3 loans across various bank divisions, enhanced with quantitative data and coverage ratios.
Risk Assessment and Management
Financial Services
Analyzes provisions for credit losses and the condition of stage 3 loans at Deutsche Bank in Q2 2023, offering insights into the bank's financial health and risk management practices.
Credit losses, stage 3 loans, risk management, financial health, Deutsche Bank, Q2 2023, banking sectors
false
Risk Assessment and Management
Financial Services
Multiple Chart
Deutsche Bank
Add to my slides
Remove from favorites
Bar chart with stacked bars showing quarterly data for Stage 1+2 and Stage 3 provisions; highlights on right
Risk Assessment and Management
Financial Services
Displays Deutsche Bank's credit loss provisions over five quarters, detailing movements in Stage 1+2 and Stage 3 losses. Highlights note factors driving the provisions and outlook for FY2024, including macroeconomic improvements and CRE challenges.
credit losses, Stage 3, macroeconomic, CRE, forecast, Q1 2024, provisions
false
Risk Assessment and Management
Financial Services
Mixed Chart
Deutsche Bank
Add to my slides
Remove from favorites
Pie chart of SUB loan book breakdown by sector, with bullet points on quality and performance of credit.
Risk Assessment and Management
Financial Services
Shows the composition of SUB loan book and emphasizes the low level of provisions for credit losses, highlighting strong loan quality.
Credit losses, SUB loan book, sector breakdown, loan quality, provisions
false
Risk Assessment and Management
Financial Services
Mixed Chart
Credit Suisse
Add to my slides
Remove from favorites
The slide has a column chart and several blocks of explanatory text on the side. It shows different stages of credit loss expenses and their respective allowances.
Risk Assessment and Management
Financial Services
The slide details the credit loss expenses and allowances under IFRS 9, showing the distribution across different business stages and industries, useful for risk management analysis.
Credit, Loss, Expense, Allowance, IFRS
false
Risk Assessment and Management
Financial Services
Mixed Chart
UBS
Add to my slides
Remove from favorites
The slide presents a table with credit loss expenses and a column chart showing ECL coverage ratios. It uses a structured layout with clear data segmentation.
Financial Performance
Financial Services
It details credit loss expenses and impaired exposures, providing figures by business segment and the evolution of ECL coverage ratios over time.
credit loss, expenses, impaired, ECL, ratios, exposures, UBS, 2Q23, financial, release
false
Financial Performance
Financial Services
Mixed Chart
UBS
Add to my slides
Remove from favorites
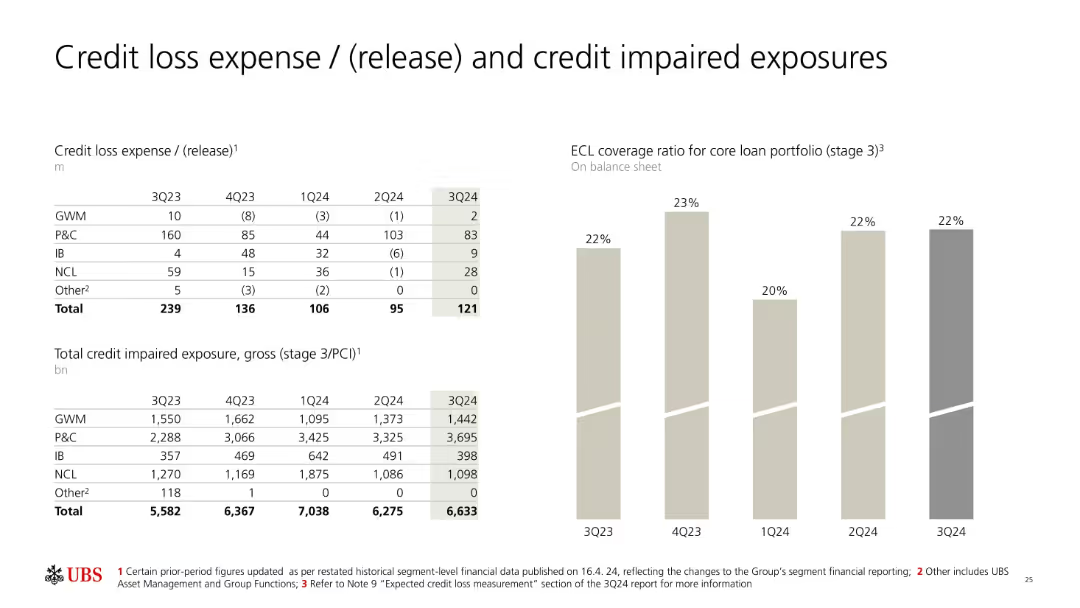
Data tables and bar chart showing credit loss expense and exposure across segments and quarters; beige/gray color scheme.
Risk Assessment and Management
Financial Services
The slide tracks credit loss expenses and gross impaired exposures by business segment over five quarters. It includes ECL coverage ratios, showing stable risk provisions. The data reflect UBS’s prudent risk management and trends in credit impairment.
credit loss, impaired exposure, ECL, UBS, P&C, GWM, risk management, segment analysis, quarterly data
false
Risk Assessment and Management
Financial Services
Mixed Chart
UBS
Add to my slides
Remove from favorites
Table of credit loss by business segment and bar chart of ECL coverage ratio; additional table shows total credit-impaired exposure by segment. Simple dual-pane layout.
Risk Assessment and Management
Financial Services
Analyzes UBS’s credit loss expenses across GWM, P&C, IB, NCL segments for the last five quarters and tracks changes in expected credit loss (ECL) ratios. Provides granularity on gross credit-impaired exposures segmented by business line, supporting risk management insights.
credit loss, impairment, ECL, GWM, P&C, risk, UBS
false
Risk Assessment and Management
Financial Services
Mixed Chart
UBS
Add to my slides
Remove from favorites
Combination of bar graphs: annual development on the left and quarterly breakdown on the right. Uses color-coded segments by business type and provisioning stage. Right-side textbox outlines quarterly changes.
Risk Assessment and Management
Financial Services
This slide tracks Deutsche Bank's credit loss provisions from FY2022 to FY2024, highlighting increases due to Postbank integration and cyclical factors. It also compares quarterly movements, showing a decline in Q4 2024 driven by recovery in legacy cases and lower CRE provisions. Staging (1+2 vs 3) is used to differentiate risk exposure levels.
credit loss provisions, CRE, Postbank, provisioning stages, Q4 2024, recovery, Deutsche Bank, credit risk
false
Risk Assessment and Management
Financial Services
Multiple Chart
Deutsche Bank
Add to my slides
Remove from favorites
Dual-column chart displaying provisions for credit losses over five quarters and Stage 3 loan developments. Tables at bottom summarize coverage and loss ratios.
Risk Assessment and Management
Financial Services
This slide reports credit loss provisions and Stage 3 loans by banking segment from Q1 2024 to Q1 2025. It provides key figures on provision volumes, group and segment coverage ratios, and Stage 3 amortized cost, emphasizing changes in credit risk exposure and overall coverage strength.
credit loss, provisions, Stage 3 loans, amortized cost, risk ratios
false
Risk Assessment and Management
Financial Services
Multiple Chart
Deutsche Bank
Add to my slides
Remove from favorites
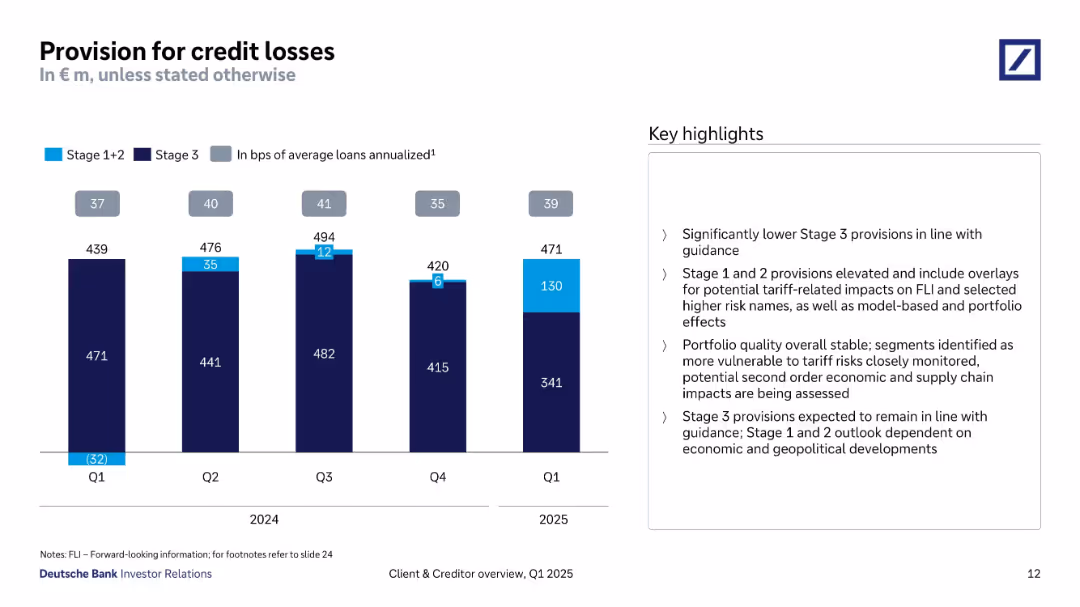
Stacked bar chart shows Stage 1+2 and Stage 3 provisions from Q1 2024 to Q1 2025. A line above represents the provision rate in bps. Key highlights are provided on the right.
Risk Assessment and Management
Financial Services
This slide tracks provisions for credit losses, showing a decline in Stage 3 losses and a rise in Stage 1+2 overlays due to tariff risks and economic uncertainties. The Q1 2025 provision totals €471m, with a reduced share from Stage 3. Highlights explain the outlook for provisions remains stable but subject to economic and geopolitical changes. Close monitoring continues for vulnerable segments and tariff-related impacts.
credit loss, provision, Stage 1+2, Stage 3, economic risk, portfolio quality, tariff impact, risk reserves
false
Risk Assessment and Management
Financial Services
Mixed Chart
Deutsche Bank
Add to my slides
Remove from favorites
Dual-panel layout with stacked bars for quarterly credit loss provisions by segment and amortized Stage 3 loan costs; includes ratios for coverage and provision bps.
Risk Assessment and Management
Financial Services
This slide reports Deutsche Bank’s provisions for credit losses and the evolution of Stage 3 loans. It breaks down loss provisions and Stage 3 costs by banking division, showing increased Stage 3 ratio and stable coverage. It’s used to monitor asset quality and risk exposure.
credit loss, Stage 3 loans, provisions, risk, amortized, ratios, Q3 2024
false
Risk Assessment and Management
Financial Services
Multiple Chart
Deutsche Bank
Add to my slides
Remove from favorites
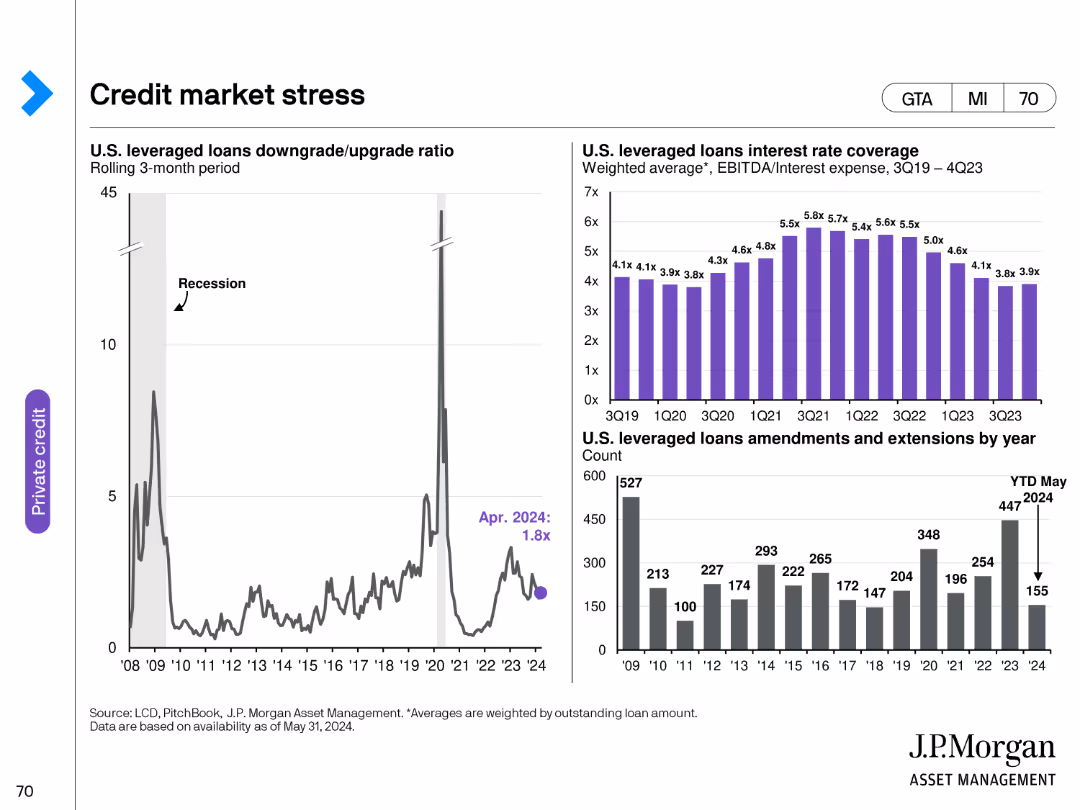
This slide features a line chart, a column chart, and a bar chart. The line chart shows the U.S. leveraged loans downgrade/upgrade ratio, the column chart displays U.S. leveraged loans interest rate coverage, and the bar chart indicates U.S. leveraged loans amendments and extensions by year.
Risk Assessment and Management
Financial Services
The slide discusses the stress in the credit market, focusing on U.S. leveraged loans. It provides insights into the downgrade/upgrade ratio, interest rate coverage, and amendment trends.
credit market, leveraged loans, downgrade, interest rate, amendments
false
Risk Assessment and Management
Financial Services
Multiple Chart
JP Morgan
Add to my slides
Remove from favorites
The slide includes a column chart showing leverage ratios, debt service coverage, and equity contribution over different periods.
Risk Assessment and Management
Financial Services
The slide discusses concerns in credit markets, including rising interest rates and leverage multiples, along with mitigants like a strong economy.
credit markets, concerns, leverage ratio, debt service, equity contribution, interest rates, mitigants, trends
false
Risk Assessment and Management
Financial Services
Multiple Chart
Credit Suisse
Add to my slides
Remove from favorites
The slide includes a bar chart for U.S. credit maturity schedules and an index weighting by credit rating, along with a line chart for high yield default rates by credit rating. Different colors distinguish various ratings and time periods.
Risk Assessment and Management
Financial Services
It analyzes the maturity schedules of U.S. investment grade and high yield bonds, the weighting of credit ratings within the high yield index, and recent default rates by rating, providing insights into credit risks and trends.
Credit maturity, default risks, high yield, investment grade, credit ratings
false
Risk Assessment and Management
Financial Services
Multiple Chart
JP Morgan
Add to my slides
Remove from favorites
Column charts comparing NCO ratios with peers, and by business segment. Includes bullet points for key commentary. Uses green and grey for distinction.
Financial Performance
Financial Services
This slide compares the bank's credit performance with peers, highlighting NCO ratios and providing commentary on disciplined capital allocation and asset quality improvements.
credit, NCO, performance, peer, capital
false
Financial Performance
Financial Services
Multiple Chart
Barclays
Add to my slides
Remove from favorites
The slide uses a text boxes to present net charge-offs and allowances for credit losses. It uses color coding to differentiate between the years and financial metrics.
Risk Assessment and Management
Financial Services
The slide provides an overview of credit risk at JPMorgan Chase & Co., illustrating past performance and future outlook, which is crucial for risk management presentations.
credit, net charge-offs, credit losses, JPMorgan, risk management, outlook
false
Risk Assessment and Management
Financial Services
Table
JP Morgan
Add to my slides
Remove from favorites
The slide has a clear, two-column layout with a title at the top. The left side features bullet points discussing credit risk outlook with blue highlights for key phrases. The right side shows a table labeled 'Net Charge-off Guidance' with columns for years and rows for different loan types.
Market Analysis and Trends
Financial Services
The slide details the outlook on credit normalization, highlighting strong consumer balance sheets and expectations for normalization of delinquency rates and charge-offs in various loan categories.
credit, normalization, liquidity, delinquency, charge-off rates, consumer behavior, financial outlook, loan categories
false
Market Analysis and Trends
Financial Services
Table
JP Morgan
Add to my slides
Remove from favorites
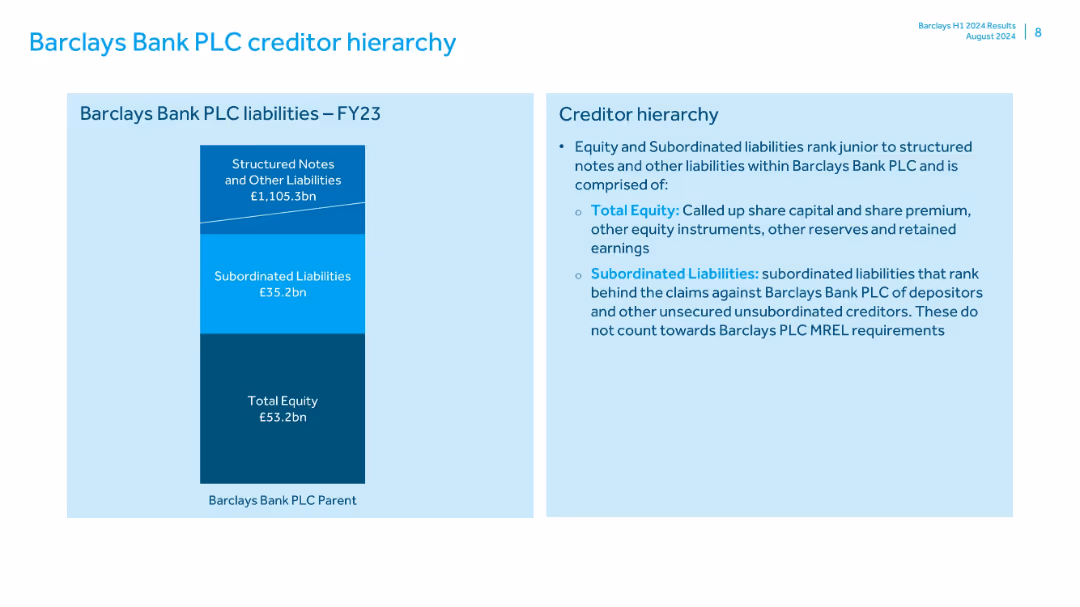
Two-panel layout with a vertical stacked bar chart on the left showing equity and liabilities, and bullet point text explanations on the right. Simple blue theme.
Risk Assessment and Management
Financial Services
The slide outlines Barclays Bank PLC’s FY23 creditor hierarchy, breaking down liabilities into structured notes, subordinated liabilities, and total equity. It explains the ranking of each component in terms of claim priority, with a focus on total equity and subordinated liabilities.
creditor hierarchy, equity, liabilities, subordinated, structured notes, Barclays, FY23, risk tiering, financial structure
false
Risk Assessment and Management
Financial Services
Mixed Chart
Barclays
Add to my slides
Remove from favorites
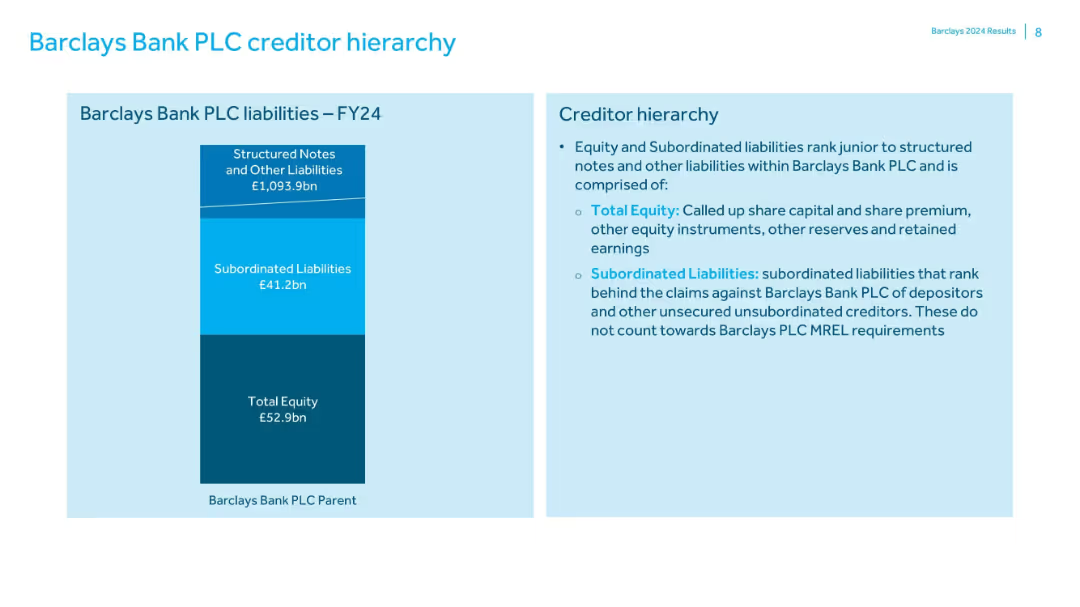
Split panel with a stacked bar chart showing FY24 liabilities and equity and a text explanation of creditor ranking and definitions.
Risk Assessment and Management
Financial Services
Outlines the liability structure of Barclays Bank PLC including £1,093.9bn in structured notes and other liabilities, £41.2bn subordinated liabilities, and £52.9bn equity. Describes the hierarchy of claims in the event of resolution.
creditor hierarchy, liabilities, equity, Barclays, subordinated debt, capital structure
false
Risk Assessment and Management
Financial Services
Mixed Chart
Barclays
Add to my slides
Remove from favorites
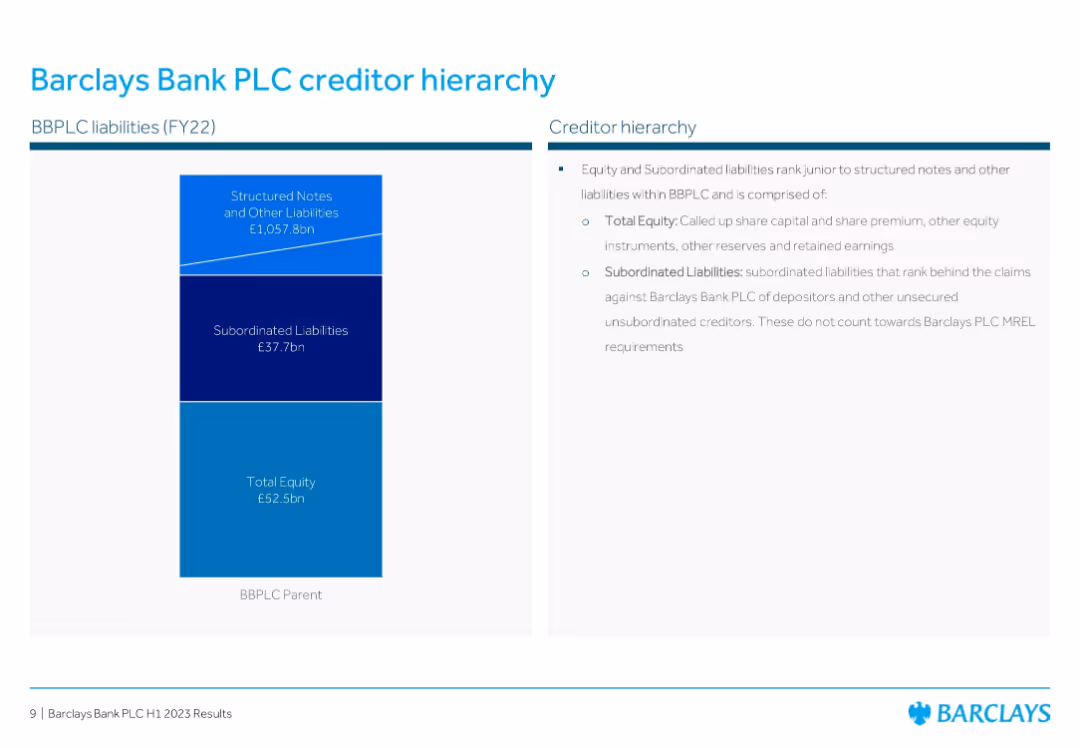
Stacked chart with equity and liability breakdown + bullet points explanation
Corporate Finance and Valuation
Financial Services
Illustrates the creditor hierarchy of Barclays Bank PLC for FY22. Details how structured notes, subordinated liabilities, and total equity are structured and ranked in terms of claims in the creditor stack.
Creditor Hierarchy, Subordinated Liabilities, Equity, Barclays, FY22, Capital Structure, Risk Ranking
false
Corporate Finance and Valuation
Financial Services
Mixed Chart
Barclays
Add to my slides
Remove from favorites
This slide contains three sets of column charts detailing net charge-offs in dollars and percentages, with additional explanatory text and callouts on the right side.
Risk Assessment and Management
Financial Services
The slide provides a positive credit outlook by showing historical and current net charge-offs, suggesting strong economic fundamentals and risk management strategies.
credit, outlook, net charge-offs, economic, risk management, column charts, JPMorgan
false
Risk Assessment and Management
Financial Services
Mixed Chart
JP Morgan
Add to my slides
Remove from favorites
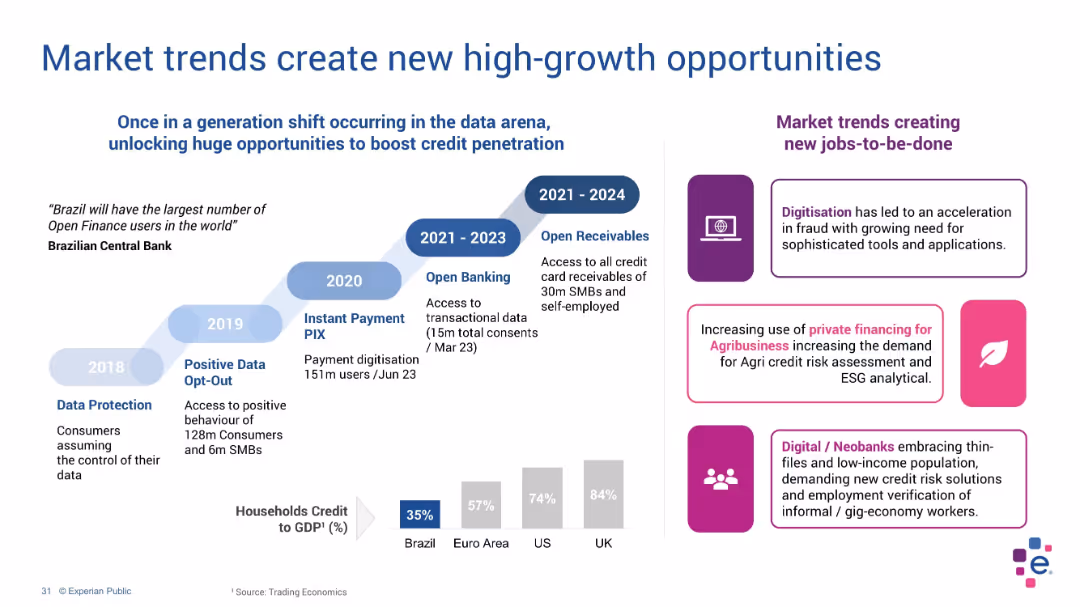
Timeline and side panel layout; blue timeline with icons and purple callouts
Market Analysis and Trends
Technology & Software
This slide highlights the evolution of Brazil's data ecosystem and regulatory shifts enabling credit expansion. It includes market trends such as digitization, agribusiness financing, and fintech adoption, supported by a historical data timeline.
credit penetration, Brazil, Open Finance, trends, agribusiness, fintech
false
Market Analysis and Trends
Technology & Software
Mixed Chart
Barclays
Add to my slides
Remove from favorites
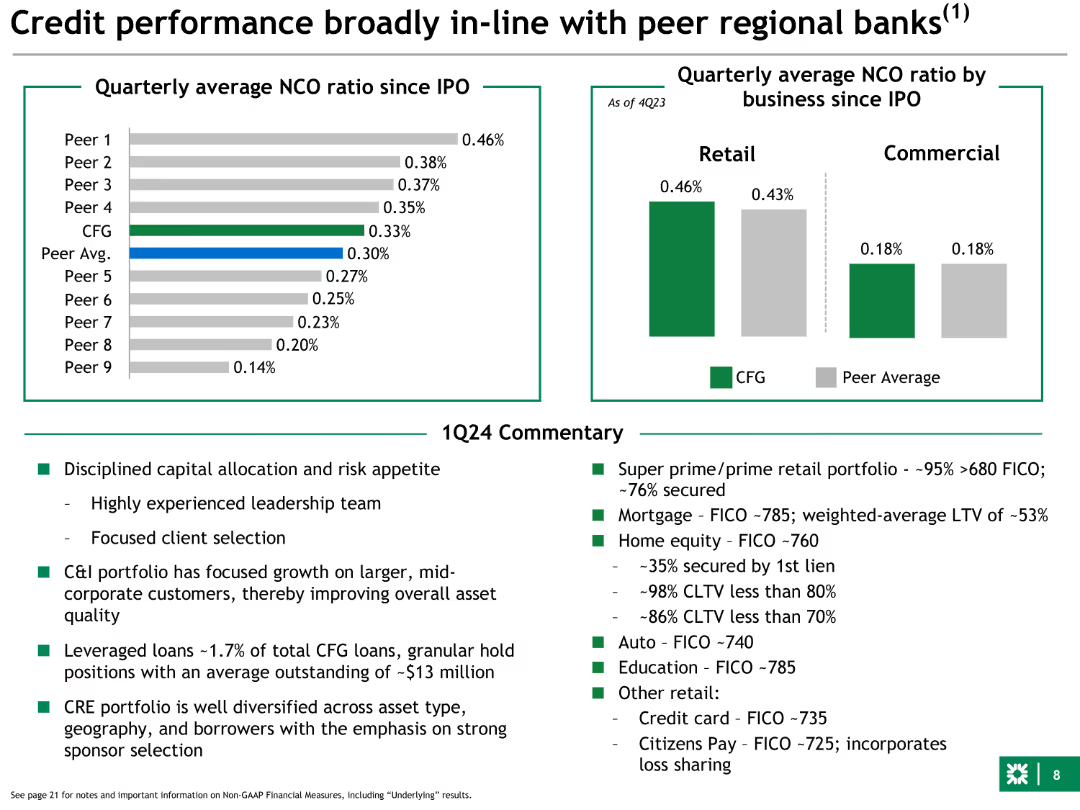
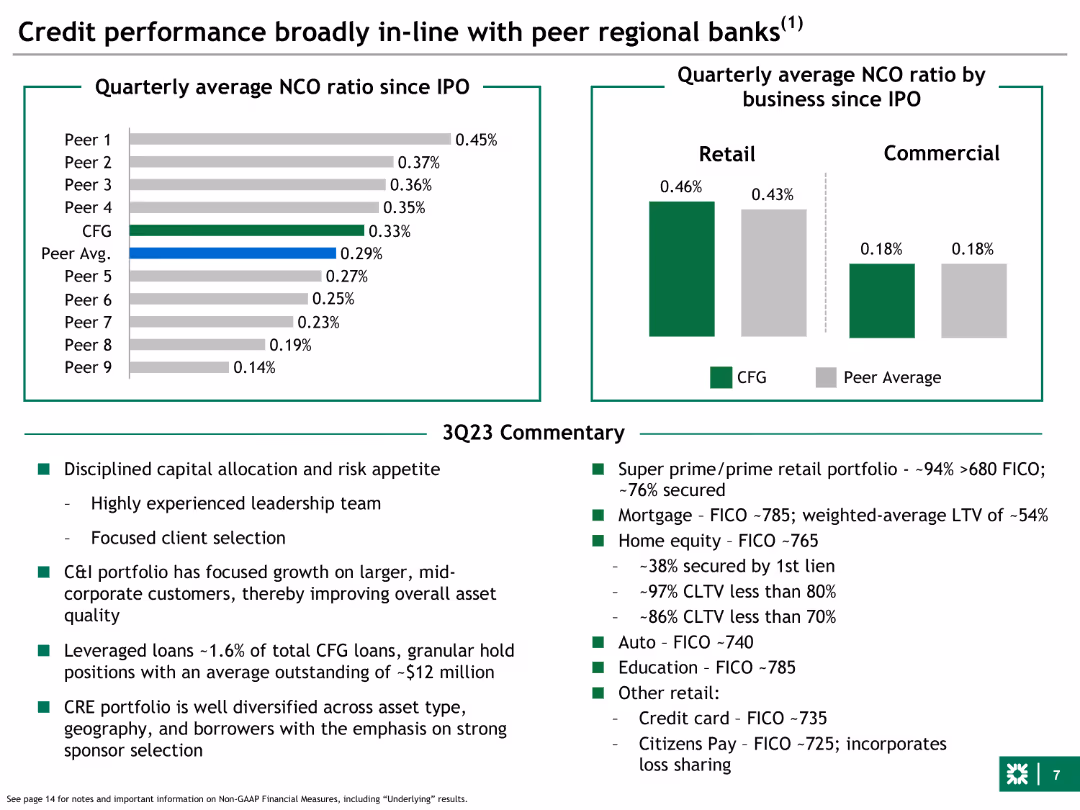
Two sets of bar charts: left side shows quarterly average NCO ratios since IPO; right side compares NCO ratios by business segment (retail and commercial) for Citizens and peers.
Financial Performance
Financial Services
Reviews credit performance of Citizens compared to peer regional banks, highlighting non-performing loan ratios and overall credit quality, segmented by retail and commercial sectors.
credit, performance, Citizens, regional banks, NCO, ratios, business segments, retail, commercial
false
Financial Performance
Financial Services
Multiple Chart
Goldman Sachs
Add to my slides
Remove from favorites
Slide includes a mix of textual information, divided into sections with headers and bullet points.
Risk Assessment and Management
Financial Services
This slide analyzes the credit performance of a financial institution, specifically focusing on loan delinquencies and loss mitigations. It is aimed at evaluating the credit risk management and recovery strategies in place.
Credit, Performance, Loans, Delinquency, Risk Management, Forbearance, Financial Institution, Loss Mitigation
false
Risk Assessment and Management
Financial Services
Header Vertical
Morgan Stanley
Add to my slides
Remove from favorites
This slide includes two column charts comparing the growth of Global Fixed Income and Credit Investments Group from 2015 to 3Q19, with additional information on innovative offerings.
Investment Analysis
Financial Services
The slide highlights the creation of a leading credit platform, detailing the growth in assets under management and innovative, higher-margin offerings.
Credit Platform, AuM, Fixed Income, Investments, Innovation
false
Investment Analysis
Financial Services
Multiple Chart
Credit Suisse
Add to my slides
Remove from favorites
Bar graphs comparing credit ratings and CDS spreads
Risk Assessment and Management
Financial Services
Santander's credit profile in comparison to European peers
Credit Profile, CDS Spreads, Banking, Risk Management, Ratings
false
Risk Assessment and Management
Financial Services
Multiple Chart
Morgan Stanley
Add to my slides
Remove from favorites
An advanced slide that features four sets of line graphs depicting total net charge-offs and non-performing loans, complemented by text summaries on the right-hand side. The graphs are detailed, using blue tones to represent different data points over time. The right side of the slide provides bullet points highlighting key actions taken since the financial crisis to improve credit profile.
Risk Assessment and Management
Financial Services
This slide aims to demonstrate the significant improvements in the company's credit profile, featuring historical data on net charge-offs and non-performing loans, as well as selected actions taken since the financial crisis. The goal is to show effective risk management and financial stability to stakeholders.
Credit Profile, Risk Management, Net Charge-Offs, Non-Performing Loans, Financial Stability, Strategic Actions, Financial Crisis
false
Risk Assessment and Management
Financial Services
Multiple Chart
Morgan Stanley
Add to my slides
Remove from favorites
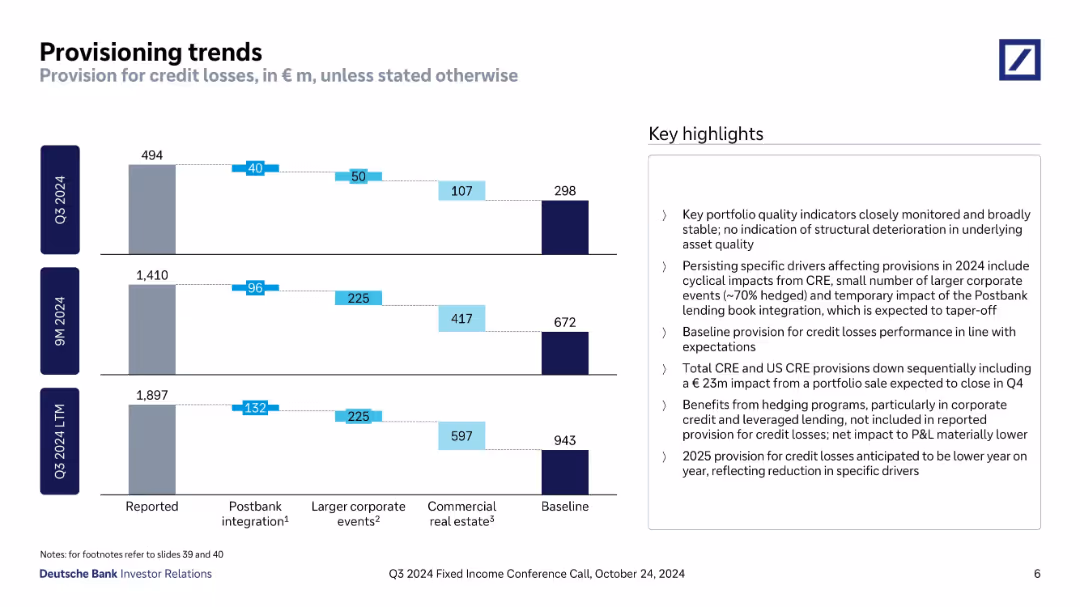
Vertical bar chart decomposing credit loss provisions for Q3 2024, 9M 2024, and Q3 LTM into Postbank, corporate events, and CRE. Sidebar with detailed insights.
Risk Assessment and Management
Financial Services
Breaks down total provisioning into components such as Postbank integration and real estate. Highlights stable asset quality, tapering impact from specific events, and anticipates lower provisions in 2025 due to waning special drivers.
credit provision, Postbank, CRE, provisioning trend, risk management, 9M 2024, baseline provisions
false
Risk Assessment and Management
Financial Services
Mixed Chart
Deutsche Bank
Add to my slides
Remove from favorites
This slide is comprised of three visual elements: a line chart showing a declining delinquency rate, a column chart showing a decrease in net charge-offs, and another column chart showing a significant reduction in risky loans. Each chart is accompanied by descriptive text that provides context to the data. The design is straightforward, aiming to communicate improvements in credit quality.
Risk Assessment and Management
Financial Services
The slide demonstrates improvements in the credit quality of the bank's loan portfolio, showing decreased delinquency and charge-off rates, as well as a healthier loan composition. It is ideal for presenting financial stability and risk management progress to stakeholders.
credit quality, loan portfolio, delinquency rate, risk management
false
Risk Assessment and Management
Financial Services
Multiple Chart
JP Morgan
Add to my slides
Remove from favorites
This slide features a column chart with three columns representing different portfolios. The layout includes text boxes and numerical data.
Risk Assessment and Management
Financial Services
The slide analyzes the credit quality of different loan portfolios, highlighting their exposure to leveraged lending and the auto manufacturing sub-sector.
credit quality, loan portfolio, leveraged lending, exposure, auto manufacturing, sub-sector, column chart, financial analysis
false
Risk Assessment and Management
Financial Services
Mixed Chart
Goldman Sachs
Add to my slides
Remove from favorites
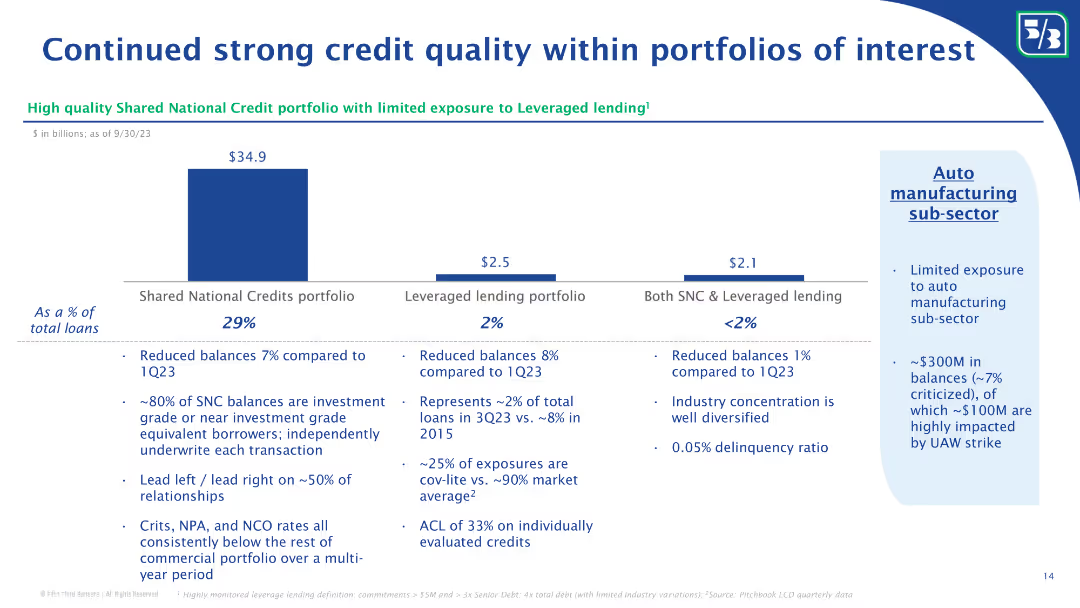
The slide features a large blue column chart for the Shared National Credits portfolio, leveraged lending and auto manufacturing exposure, and text boxes for detailed annotations.
Risk Assessment and Management
Financial Services
Discusses the bank's credit portfolio quality, focusing on the Shared National Credit portfolio, leveraged lending exposures, and the auto manufacturing sub-sector.
credit quality, national credit portfolio, leveraged lending, auto manufacturing, risk
false
Risk Assessment and Management
Financial Services
Mixed Chart
Goldman Sachs
Add to my slides
Remove from favorites
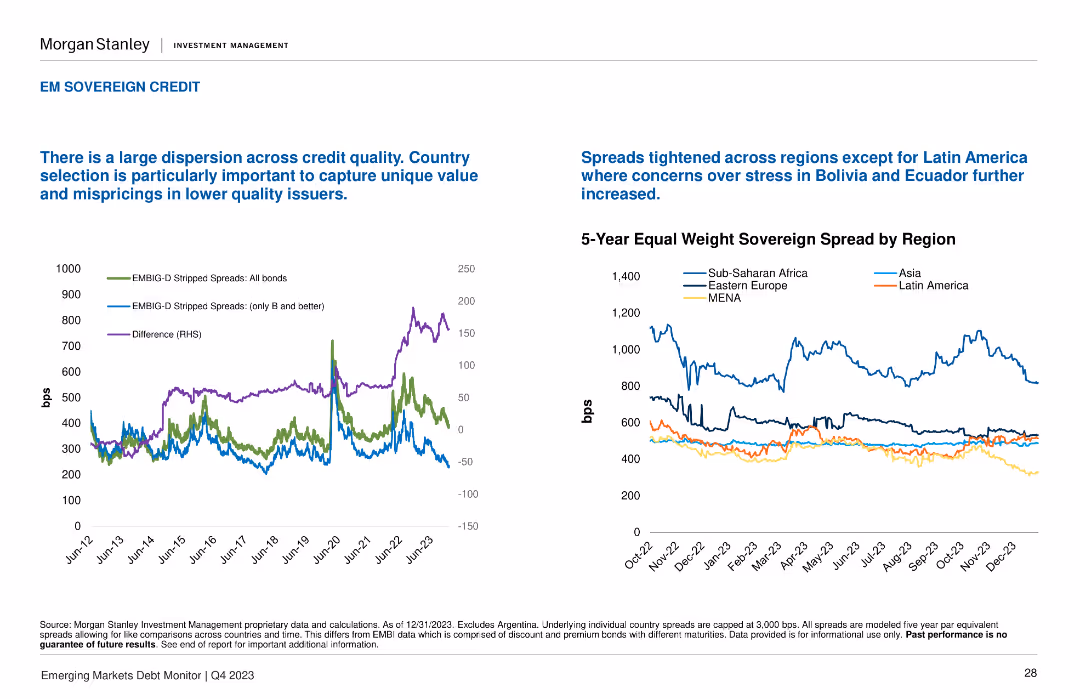
This slide includes two line charts: one showing the EMBIG-D stripped spreads and the other showing the 5-Year Equal Weight Sovereign Spread by Region.
Market Analysis and Trends
Financial Services
It discusses the dispersion across credit quality and the tightening spreads in most regions, except for Latin America. Important for regional credit risk analysis.
credit quality, regional analysis, spreads, EMBIG-D, sovereign
false
Market Analysis and Trends
Financial Services
Multiple Chart
Morgan Stanley
Add to my slides
Remove from favorites
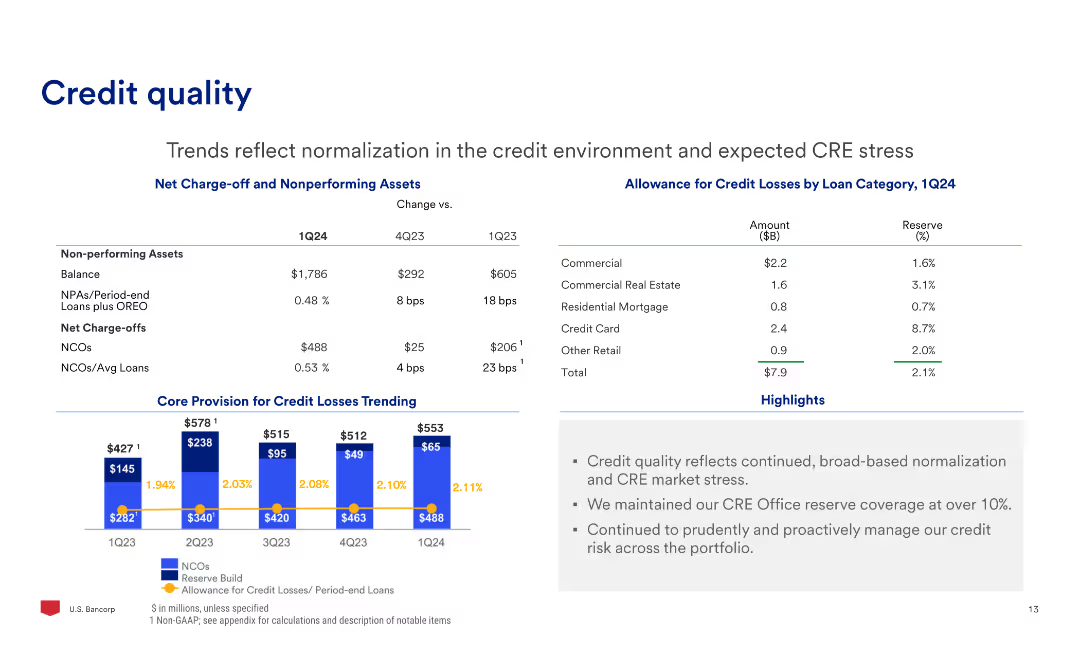
The slide contains a table with data on non-performing assets and allowance for credit losses, column charts showing net charge-offs and core provision for credit losses trending, and text.
Risk Assessment and Management
Financial Services
The slide reviews trends in credit quality, focusing on the normalization in the credit environment and expected CRE stress, with data on charge-offs and credit loss allowances.
Credit, Quality, Risk, Assets, Allowance, Losses
false
Risk Assessment and Management
Financial Services
Mixed Chart
Barclays
Add to my slides
Remove from favorites
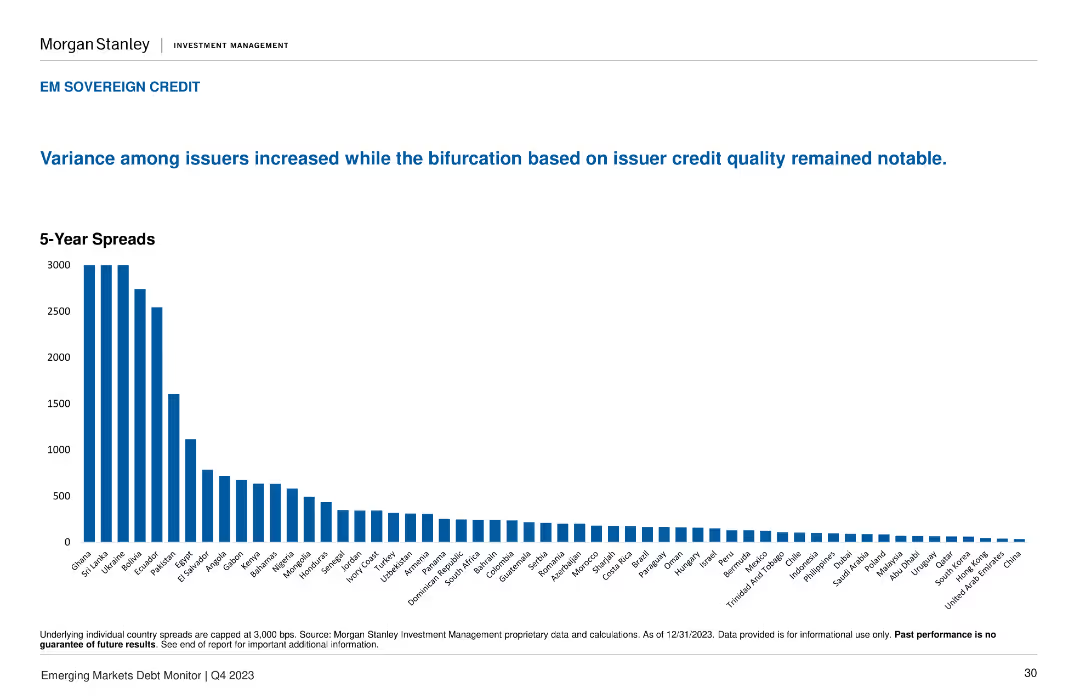
A column chart shows the 5-Year Spreads for various countries, highlighting significant variance among issuers.
Risk Assessment and Management
Financial Services
It discusses the increased variance among issuers and the bifurcation based on issuer credit quality. Important for assessing credit risk and issuer performance.
credit quality, spreads, issuers, variance, EM
false
Risk Assessment and Management
Financial Services
Single Chart
Morgan Stanley
Add to my slides
Remove from favorites
Comparative chart of long-term senior unsecured debt credit ratings by Moody's, S&P, and Fitch for various banks, including UBS and its peers.
Competitive Landscape
Financial Services
Comparison of credit ratings of UBS against major competitors, highlighting the rating differences and outlooks from various agencies.
Credit ratings, comparison, competitors, Moody's, S&P
false
Competitive Landscape
Financial Services
Table
UBS
Add to my slides
Remove from favorites
Comparative chart of long-term senior unsecured debt credit ratings by Moody's, S&P, and Fitch for holding companies, including UBS and its peers.
Competitive Landscape
Financial Services
Comparison of credit ratings for UBS and its peers' holding companies, illustrating rating differences and outlooks from various agencies.
Credit ratings, holding companies, comparison, Moody's, S&P
false
Competitive Landscape
Financial Services
Table
UBS
Add to my slides
Remove from favorites
This slide features two graphs tracking the credit ratings of Macquarie Bank against other financial institutions by Standard & Poor’s and Moody’s from 2007. Each graph is color-coded to distinguish rating upgrades, downgrades, and stability. The slide is information-dense yet remains legible and ordered.
Risk Assessment and Management
Financial Services
It presents Macquarie Bank's credit ratings stability compared to other banks, highlighting resilience in ratings through financial events. This slide is likely used to reassure investors of Macquarie's solid standing and risk management over time, especially during economically turbulent periods.
credit ratings, Macquarie Bank, stability, Standard & Poor’s, Moody’s, financial institutions, risk management, long-term analysis
false
Risk Assessment and Management
Financial Services
Multiple Chart
Morgan Stanley
Add to my slides
Remove from favorites
Similar to the previous slide, this one uses a comparative chart layout to show credit ratings from major agencies for holding companies.
Competitive Landscape
Financial Services
It highlights credit ratings for UBS and competitors' holding companies, detailing their ratings and outlooks as of September 2023.
credit ratings, peer comparison, holding company, Moody's, S&P, Fitch, UBS, financial, September 2023
false
Competitive Landscape
Financial Services
Table
UBS
Add to my slides
Remove from favorites
This slide features a comparative chart with ratings from Moody's, S&P, and Fitch for various financial institutions. Symbols indicate rating levels and outlooks.
Competitive Landscape
Financial Services
It compares credit ratings for UBS and its peers, providing a visual representation of ratings across different agencies as of September 2023.
credit ratings, peer comparison, Moody's, S&P, Fitch, UBS, financial, operating company, September 2023
false
Competitive Landscape
Financial Services
Table
UBS
Add to my slides
Remove from favorites
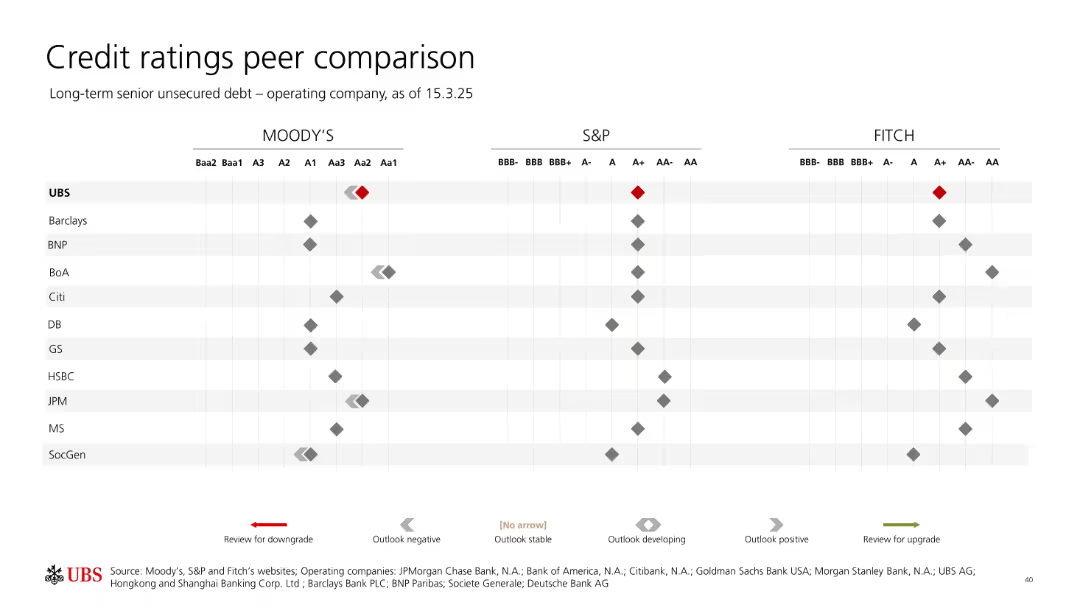
Comparative dot matrix chart with Moody’s, S&P, and Fitch ratings across multiple banks; UBS highlighted.
Competitive Landscape
Financial Services
This slide compares UBS's credit ratings with key global banking peers across Moody’s, S&P, and Fitch for their operating companies. UBS holds relatively strong ratings, indicated with red diamonds, and is benchmarked against competitors like JPM, Barclays, and Citi.
credit rating, UBS, peer comparison, Moody’s, Fitch, S&P, debt rating, bank peers, outlook, unsecured debt
false
Competitive Landscape
Financial Services
Single Chart
UBS
Add to my slides
Remove from favorites
The slide showcases a graphical representation of credit rating upgrades from four different agencies over a period, enhancing readability with a comparison format.
Investment Analysis
Financial Services
This slide confirms the bank’s credit rating upgrades by various agencies, illustrating the financial stability and improved creditworthiness from 2019 to 2023, suitable for investment analysis.
credit, rating, upgrade, financial, stability, agencies, transformation, investment, analysis, comparison
false
Investment Analysis
Financial Services
Table
Deutsche Bank
Add to my slides
Remove from favorites
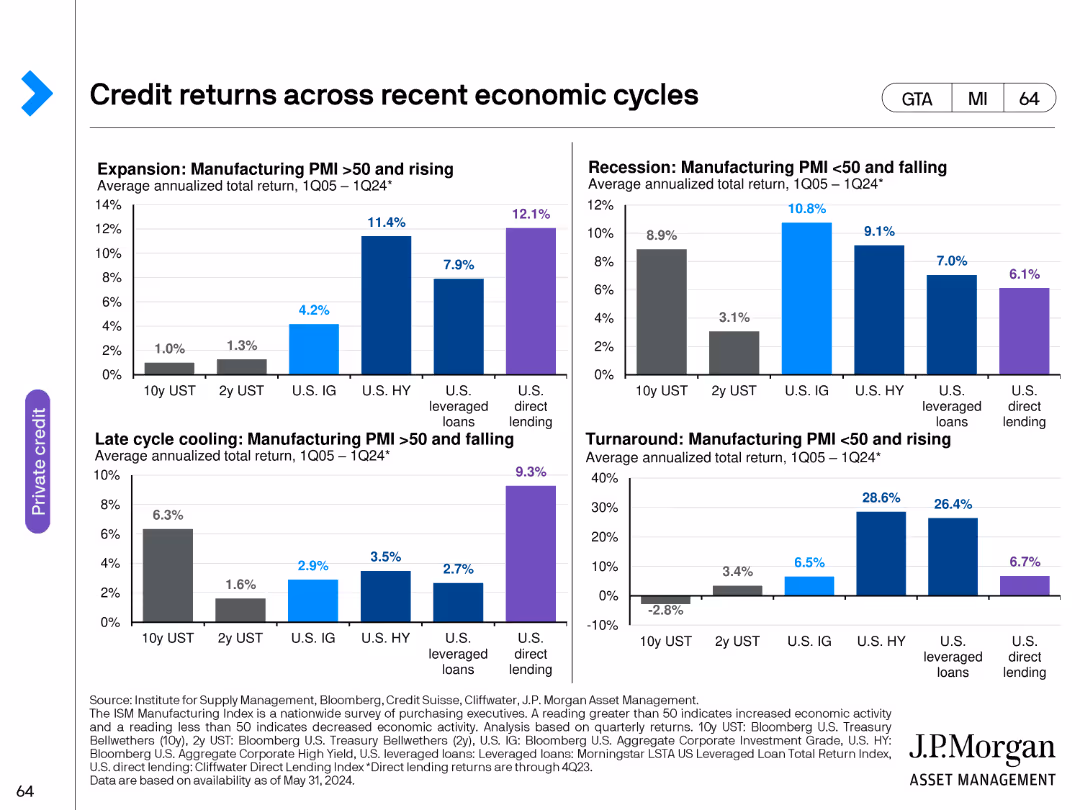
This slide includes four column charts, each showing credit returns during different economic cycles: expansion, recession, late cycle cooling, and turnaround. Data is categorized by different types of credit returns.
Market Analysis and Trends
Financial Services
The slide compares credit returns across various economic cycles, offering a detailed analysis of how different credit instruments perform in diverse economic conditions.
credit returns, economic cycles, financial analysis, credit instruments
false
Market Analysis and Trends
Financial Services
Multiple Chart
JP Morgan
Add to my slides
Remove from favorites
The slide contains a line chart comparing delinquency rates and two column charts showing industry versus Chase stats on card outstandings and auto originations. It also has bullet points with insights.
Risk Assessment and Management
Financial Services
This slide presents risk management data comparing Chase's credit profile and decision making with industry averages. It could be used to demonstrate financial stability and prudent risk management strategies.
Credit risk, Balance sheet, Capital, Liquidity, Portfolio
false
Risk Assessment and Management
Financial Services
Multiple Chart
JP Morgan
Add to my slides
Remove from favorites
Uses pie charts to show CRE loan exposure by type and region, with a central focus on the large proportion of warehouse facilities.
Risk Assessment and Management
Financial Services
Provides insights into the composition and regional spread of CRE loan exposure, emphasizing the significance of warehouse facilities. Useful for discussions on risk exposure and investment decisions in the real estate sector.
Credit Risk, CRE, Loan Exposure, Warehouse Facilities, Regional Spread, Americas, EMEA, Asia, Distressed Properties, Healthcare, Residential Property
false
Risk Assessment and Management
Financial Services
Multiple Chart
Goldman Sachs
Add to my slides
Remove from favorites
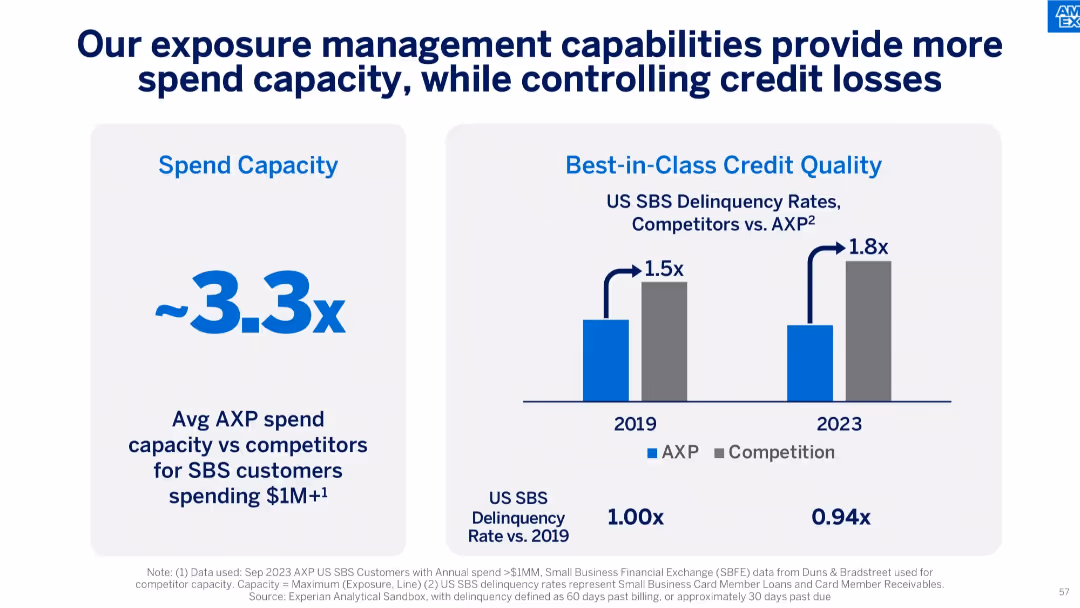
Two-panel layout: left shows 3.3x spend capacity advantage, right shows comparative delinquency rates between AXP and competitors for 2019 and 2023.
Risk Assessment and Management
Financial Services
This slide highlights AXP’s superior exposure management capabilities, offering higher spend capacity while maintaining industry-leading low delinquency rates, enhancing both growth and risk control.
credit risk, delinquency, spend capacity, AXP, exposure management, small business, financial discipline
false
Risk Assessment and Management
Financial Services
Mixed Chart
McKinsey
Add to my slides
Remove from favorites
This slide includes a comparative table chart analyzing credit card and auto loan risk metrics across various issuers. Metrics like 'Sub-Prime Mix' and '30+ DQs' are assessed. The use of a clean table layout with color highlights for Chase bank allows easy comparison of the data. There are also percentage points provided for quick insight into performance.
Risk Assessment and Management
Financial Services
Highlighting risk performance metrics in lending, this slide is key for financial analysts and investors, providing insight into credit risk and the bank's standing relative to industry peers. It serves as a base for discussions on risk management strategies, portfolio quality, and the health of the lending market, crucial for operational reviews and risk assessment meetings.
Credit Risk, Financial Analysis, Risk Management, Lending, Performance Metrics, Portfolio Quality, Market Health
false
Risk Assessment and Management
Financial Services
Table
JP Morgan
Add to my slides
Remove from favorites
A circular flow diagram in the center, segment headers, and a column with statistical data on the right. The design is simple with blue highlights and a light background.
Risk Assessment and Management
Financial Services
Discusses a holistic approach to consumer credit risk management, highlighting governance, product design, foundational credit decision framework, and modern tech infrastructure.
Credit risk, holistic, governance, technology, finance
false
Risk Assessment and Management
Financial Services
Framework
Goldman Sachs
Add to my slides
Remove from favorites
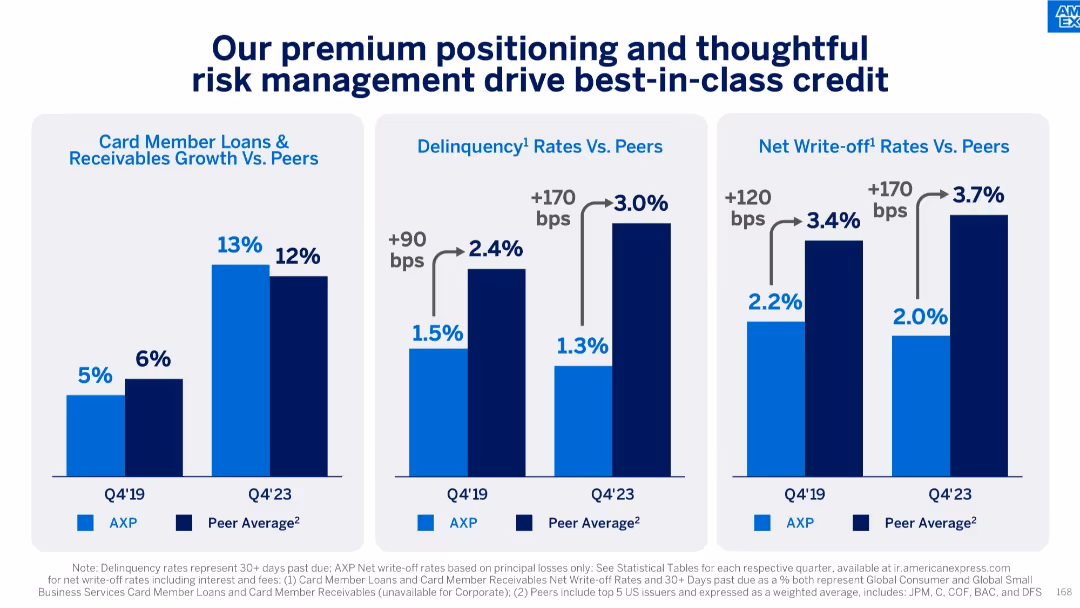
Three-panel bar chart comparing AXP vs peers in growth, delinquency, and write-off rates; Q4’19 vs Q4’23
Risk Assessment and Management
Financial Services
This slide shows American Express outperforming peers in card member loan growth while maintaining lower delinquency and write-off rates. It attributes success to superior credit risk management and premium customer base positioning.
credit risk, loan growth, delinquency, write-offs, peer comparison, premium strategy
false
Risk Assessment and Management
Financial Services
Single Chart
McKinsey
Add to my slides
Remove from favorites
The slide features several pie charts on loan distribution by type and geography and a comprehensive table summarizing the loan portfolio.
Risk Assessment and Management
Financial Services
Delivers a snapshot of the credit risk associated with the loan portfolio, showing loan sizes, security, and sectoral and geographical spread. Used in risk management to evaluate and discuss loan distributions and associated credit risks.
Credit Risk, Loan Portfolio, Corporate, Wealth Management, Real Estate, Consumer, Geographic Distribution, Loan Security, Key Metrics, Total Loans
false
Risk Assessment and Management
Financial Services
Multiple Chart
Goldman Sachs
Add to my slides
Remove from favorites
Includes stacked column charts and a table detailing credit losses and loan stages across different banking sectors.
Risk Assessment and Management
Financial Services
The slide focuses on credit loss provisions and the categorization of loans in different stages for various banking sectors, providing essential information for risk assessment and financial stability analysis. It is especially useful for credit analysts and financial risk managers looking at credit quality, risk exposure, and the effectiveness of credit management strategies within the banking industry.
Credit Risk, Loan Stages, Banking Sectors, Risk Management, Financial Stability
false
Risk Assessment and Management
Financial Services
Multiple Chart
Deutsche Bank
Add to my slides
Remove from favorites
A slide with a line chart showing 'Red Flag Exposure' percentages over time, and two pie charts depicting the rating outlook for Non-IG and IG corporate bank portfolios.
Risk Assessment and Management
Financial Services
The slide shows the tracking of credit and market movements by PMG analysts, with a focus on red flag exposure and the rating outlook for corporate bank portfolios.
credit risk, market movements, PMG analysts, red flag exposure, corporate bank, rating outlook, non-IG, IG, financial analysis
false
Risk Assessment and Management
Financial Services
Multiple Chart
Credit Suisse
Add to my slides
Remove from favorites
This slide includes a series of heatmaps detailing credit risk indicators and distressed company percentages across various sectors.
Risk Assessment and Management
Financial Services
Presents credit risk data and company distress levels across multiple sectors, providing insights into the economic impact and risk assessment by sector.
credit risk, sectors, distress levels, economic impact, heatmap
false
Risk Assessment and Management
Financial Services
Table
BCG
Add to my slides
Remove from favorites
This slide presents a horizontal sequence of mobile app screens showing features of the Credit Journey service, including credit score access, historical scores, and tailored offers. Each screen is annotated with explanations of features.
Financial Performance
Financial Services
This slide outlines the Credit Journey service offered by Chase, showing various app functionalities aimed at enhancing customer engagement and providing value through tailored financial products and services.
credit score, customer engagement, app, Chase, financial products, tailored offers, identity protection, historical scores
false
Financial Performance
Financial Services
Linear Flow
JP Morgan
Add to my slides
Remove from favorites
The slide has two line graphs, one showing the high yield index spread to worst and the other showing capital markets revenues.
Financial Performance
Financial Services
The slide highlights Credit Suisse's resilience in maintaining positive revenue through various credit shocks since 2011, supported by visual data trends.
credit shocks, revenue, Credit Suisse, high yield index, capital markets, resilience, trends, financial performance
false
Financial Performance
Financial Services
Multiple Chart
Credit Suisse
Add to my slides
Remove from favorites
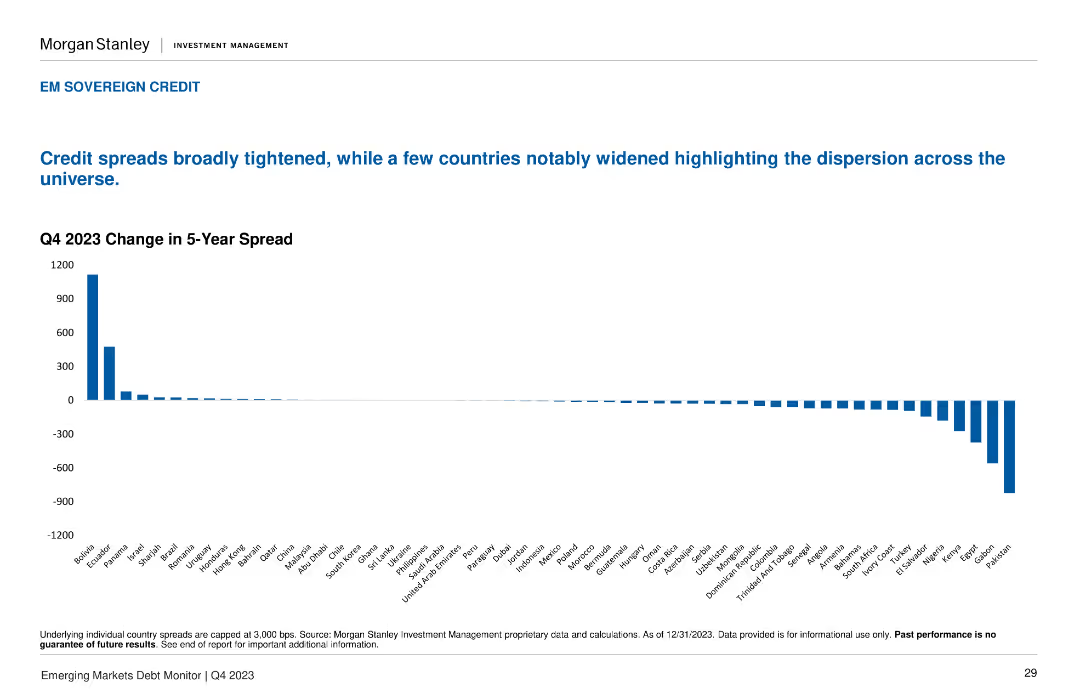
A column chart displays the Q4 2023 Change in 5-Year Spread for various countries, showing positive and negative changes across the board.
Market Analysis and Trends
Financial Services
The slide highlights the broad tightening of credit spreads, with notable widenings in a few countries. Useful for tracking credit spread changes across emerging markets.
credit spreads, change, Q4 2023, sovereign, EM
false
Market Analysis and Trends
Financial Services
Single Chart
Morgan Stanley
Add to my slides
Remove from favorites
Previous
Next
You don't have any favorites yet.
Please wait loading your favorites slides...
Create a FREE account to continue browsing
Receive Instant Access to 1,000+ slides from companies like McKinsey, Google, and Goldman Sachs
First Name
Last Name
Email
Password
I agree to all
Terms & Privacy Policy
Thank you! Your submission has been received!
Oops! Something went wrong while submitting the form.
Have an account?
Sign in
Upgrade to PRO to Save slides
Advanced Search and Filters
Access to 15,000+ slides
Access to Category Pages
Save/Bookmark Slides
PowerPoint Template Library
Pick a Plan
MONTHLY
$12/month
Billed every month, Cancel anytime.
YEARLY
$9/year
Billed $108 annually, Cancel anytime.
Checkout for $12/month
Checkout for $108/yr
Secured by Stripe | AES-256 bit encryption