My Account
My Slides
Search by Category
Companies
Slide Type
Use Case
Industry
Pricing
Templates
View All Templates
Download Template Slides
✦ AI
AI Prompt Library
AI Search
Feedback
Login
Logout
Get Started
Browse all Slides
Browse all Slides
Create a FREE Account
Instant access to 1,000+ real slides from top companies like McKinsey, BCG, Goldman Sachs, Google and many more!
First Name
Last Name
Email
Password
I agree to all
Terms & Privacy Policy
Thank you! Your submission has been received!
Oops! Something went wrong while submitting the form.
Have an account?
Sign in
Saved Slides
Total No. of slides saved
0
↻ Refresh
✖ Clear all
Horizontal stacked bar chart of countries showing belief that their country is in decline; includes historical agreement percentages by year.
Market Analysis and Trends
Government & Public Sector
Ranks countries by belief in national decline; South Africa, Netherlands, and Sweden top the list. Year-over-year data from 2016 to 2023 shows dynamic shifts.
country trends, decline sentiment, Ipsos, longitudinal, public opinion, country comparison
false
Market Analysis and Trends
Government & Public Sector
Mixed Chart
IPSOS
Add to my slides
Remove from favorites
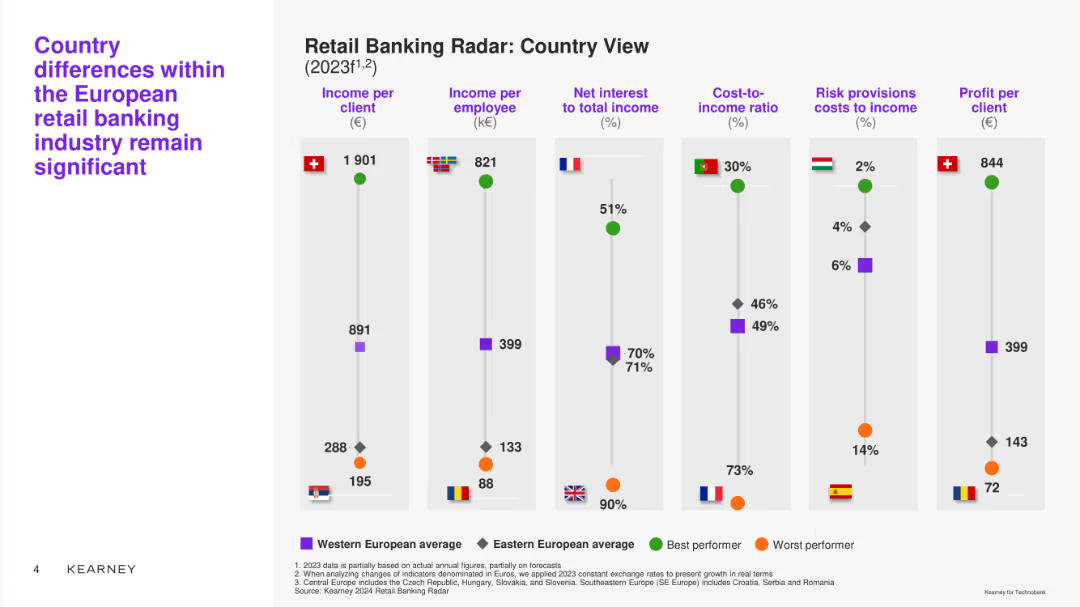
Column chart comparing different metrics (income per client, income per employee, etc.) across various European countries. Uses color-coded markers for Western and Eastern Europe.
Market Analysis and Trends
Financial Services
Analyzes significant country differences in the European retail banking industry, comparing key financial indicators across countries.
country view, income, comparison, Europe, retail banks
false
Market Analysis and Trends
Financial Services
Single Chart
Kearney
Add to my slides
Remove from favorites
Contains a graph with three key nodes labeled "Fear", "Growth", and "Courage and vulnerability" connected by arrows on a grid background.
Strategic Planning
Professional Services
Discusses the necessity of courage in strategic cost transformation by examining performance and value creation.
courage, vulnerability, growth, performance, strategic
false
Strategic Planning
Professional Services
Diagram
Deloitte
Add to my slides
Remove from favorites
This slide consists of four column charts contrasting average attendances for final order finalisation in FCoA and FCC, split into non-trial and trial attendances, annotated with percentage differences. The design is clear with red and yellow colors.
Regulatory and Compliance
Government & Public Sector
The slide analyzes court attendances per final order finalisation, revealing a stark contrast between trial and non-trial cases, and between FCoA and FCC, suggesting a double attendance requirement for FCoA litigants proceeding to trial.
court attendances, trial, non-trial, FCoA, FCC, final order finalisation
false
Regulatory and Compliance
Government & Public Sector
Mixed Chart
PwC/Strategy&
Add to my slides
Remove from favorites
Utilizes a series of column charts with descriptive text, using colors like red, orange, and beige to differentiate data points and time frames.
Regulatory and Compliance
Government & Public Sector
Examines the backlog of cases in courts, clearance rates, and the age of matters at the time of finalization to identify areas for process improvement.
Court backlog, clearance rates, case age, legal process, judicial efficiency, case management, finalization rates
false
Regulatory and Compliance
Government & Public Sector
Multiple Chart
PwC/Strategy&
Add to my slides
Remove from favorites
Composed of four column charts, this slide compares attendance rates and interim to final order ratios between two court types. It employs contrasting colors to differentiate data points across multiple years.
Regulatory and Compliance
Government & Public Sector
The slide contrasts court practices between two court types, analyzing average attendance rates and the use of interim orders. It indicates a disparity in management and suggests areas for process improvement in court proceedings.
court practice, attendance rates, interim orders, comparison
false
Regulatory and Compliance
Government & Public Sector
Multiple Chart
PwC/Strategy&
Add to my slides
Remove from favorites
The slide has a red and black theme with two column charts showcasing judicial and non-judicial FTE breakdowns, and a table comparing FTEs across family law. It contains a small amount of text to explain the graphics.
Operational Efficiency
Government & Public Sector
This slide presents the full-time equivalent (FTE) staffing breakdown in family law courts, comparing judicial and non-judicial roles, and provides insights into resource allocation and operational structure of the courts.
courts, FTE breakdown, family law, judicial staffing, operational efficiency, resource allocation, bar graph, pie charts
false
Operational Efficiency
Government & Public Sector
Multiple Chart
PwC/Strategy&
Add to my slides
Remove from favorites
Slide presents a densely packed combination of text and column charts, displaying FTE per state and territory with red and black to differentiate judicial and non-judicial staff. It also includes text explaining the distribution of staff in major states.
Regulatory and Compliance
Government & Public Sector
Analyzes staffing distribution of courts across various states and territories, useful for comparing resource allocation and identifying potential areas needing attention.
courts, staffing, FTE, resource allocation, states
false
Regulatory and Compliance
Government & Public Sector
Multiple Chart
PwC/Strategy&
Add to my slides
Remove from favorites
This slide shows a line chart depicting the maturity curve of CO₂ utilization technologies. It includes various stages and labeled points for different utilization methods.
Technology and Digital Transformation
Energy & Utilities
It details the maturity stages of CO₂ utilization technologies, from lab work to mature technology, highlighting methods like synthetic methane, methanol, saline formation, and enhanced coal bed methane.
CO₂ utilization, maturity curve, synthetic methane, methanol, saline formation, coal bed methane, energy, utilities
false
Technology and Digital Transformation
Energy & Utilities
Single Chart
Kearney
Add to my slides
Remove from favorites
The slide presents two column charts, one showing the percentage of cov-lite loans and the other showing incurrence debt percentages.
Risk Assessment and Management
Financial Services
The slide addresses risks associated with covenant-lite loans and compares them with traditional loans, highlighting concerns and mitigants.
covenant-lite loans, risks, Credit Suisse, incurrence debt, traditional loans, mitigants, comparisons, credit quality
false
Risk Assessment and Management
Financial Services
Multiple Chart
Credit Suisse
Add to my slides
Remove from favorites
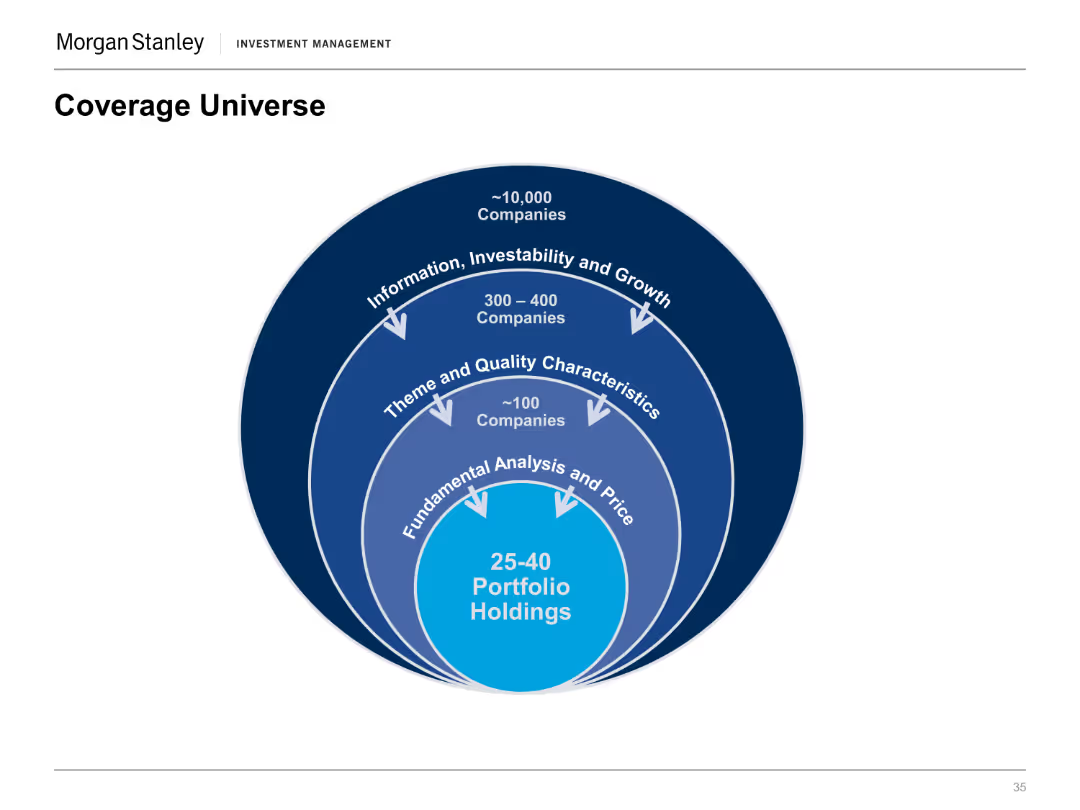
A concentric circle diagram depicting the coverage universe, from 10,000 companies to 25-40 portfolio holdings, with layers for information and growth stages.
Strategic Planning
Financial Services
This slide illustrates the narrowing focus from a wide universe of companies down to a select number of portfolio holdings based on specific criteria.
Coverage, Universe, Portfolio, Holdings, Information, Growth, Theme, Characteristics, Analysis, Investment
false
Strategic Planning
Financial Services
Diagram
Morgan Stanley
Add to my slides
Remove from favorites
Includes several line graphs showing predicted infection paths under different immunity and infection rate scenarios, annotated for clarity and comparison.
Strategic Planning
Healthcare & Pharmaceuticals
Analyzes potential COVID-19 infection trajectories for Austria under various public health response scenarios, aiding in policy decision-making and strategy adjustment.
COVID-19, Austria, scenario analysis, infection rates, public health response, policy planning
false
Strategic Planning
Healthcare & Pharmaceuticals
Multiple Chart
McKinsey
Add to my slides
Remove from favorites
Slide contains multiple column charts comparing consumer valuation of autonomous vehicles before and after COVID-19 across several countries. Each country is represented with a flag and percentage changes are shown in blue and black columns.
Market Analysis and Trends
Technology & Software
This slide analyzes the shift in consumer values regarding autonomous vehicles due to the COVID-19 pandemic, highlighting significant regional differences and the impact on technology and transportation industries.
COVID-19, autonomous vehicles, consumer behavior, market analysis, technology, transportation
false
Market Analysis and Trends
Technology & Software
Single Chart
McKinsey
Add to my slides
Remove from favorites
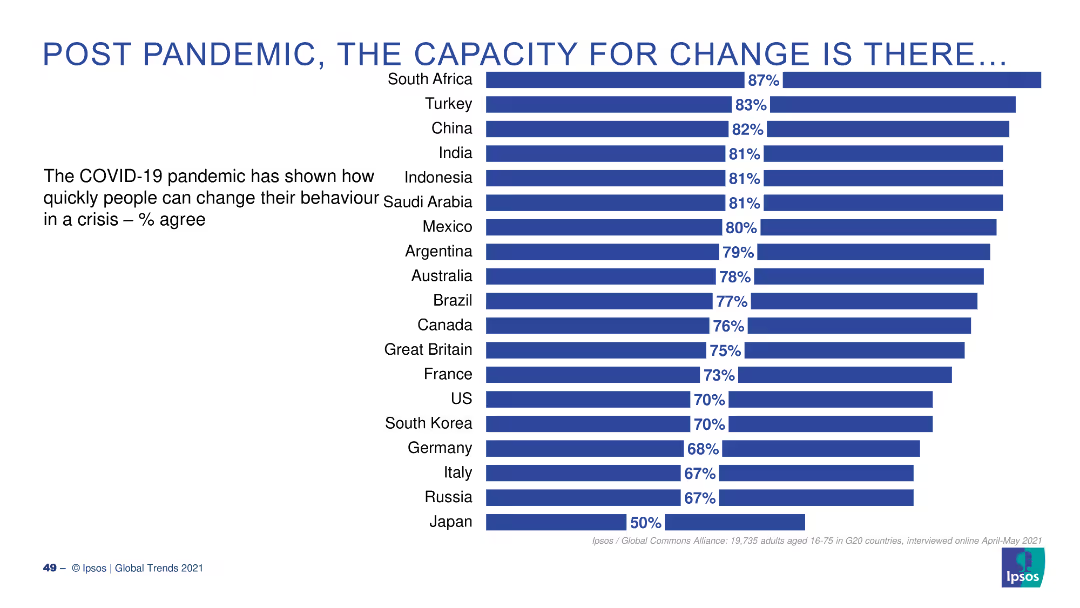
The slide features a horizontal bar chart displaying percentages of people from various countries who agree that the COVID-19 pandemic has shown how quickly behavior can change in a crisis.
Market Analysis and Trends
Healthcare & Pharmaceuticals
The slide shows data from a survey indicating the percentage of people in different countries who believe that the COVID-19 pandemic has demonstrated the capacity for rapid behavior change.
COVID-19, behavior change, survey, global trends, crisis response
false
Market Analysis and Trends
Healthcare & Pharmaceuticals
Single Chart
IPSOS
Add to my slides
Remove from favorites
This slide features a column chart showing projected declines in general fund receipts for New York from 2020 to 2024, due to COVID-19. The charts use different shades of green to represent original budget gaps versus the impact of COVID-19.
Financial Performance
Government & Public Sector
Analyzes the fiscal impact of COVID-19 on New York’s budget, highlighting changes in fund receipts and total budget gaps. Useful for financial and governmental presentations on managing budget shortfalls during pandemics.
COVID-19, budget, New York, fund receipts, fiscal impact, projections, government finance
false
Financial Performance
Government & Public Sector
Single Chart
BCG
Add to my slides
Remove from favorites
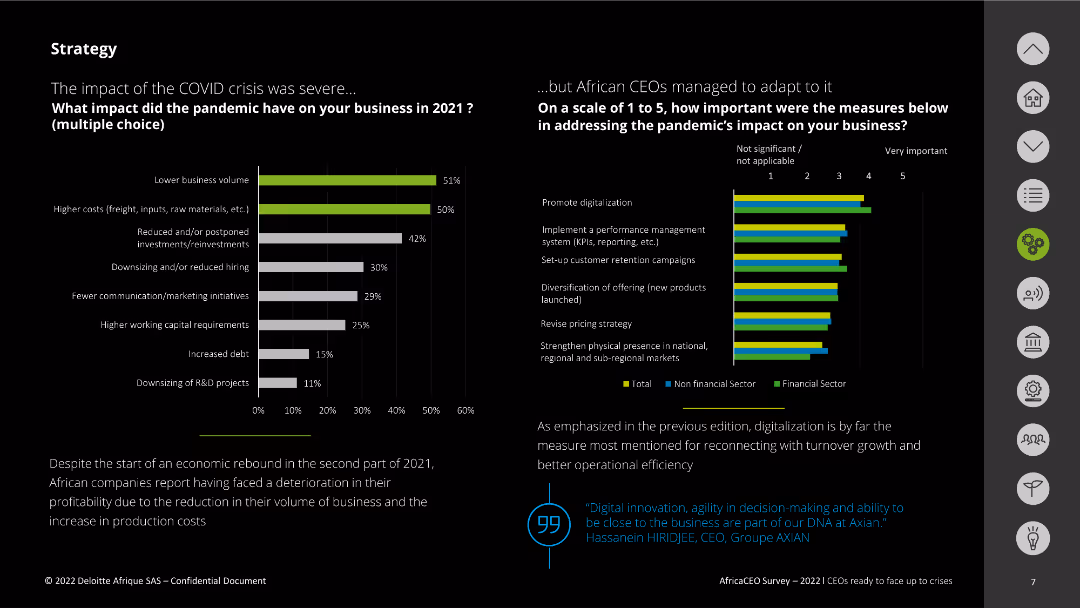
The slide contains two column charts comparing the impact of the pandemic on businesses and the importance of various measures to adapt. The charts are colored green and gray for different sectors, with key points highlighted in text below.
Risk Assessment and Management
Professional Services
This slide presents the impact of the COVID-19 pandemic on businesses in 2021 and the measures African CEOs took to adapt. It shows the effects on business volume and costs and highlights digitalization as a key adaptation strategy.
COVID-19, business impact, adaptation, digitalization, measures
false
Risk Assessment and Management
Professional Services
Multiple Chart
Deloitte
Add to my slides
Remove from favorites
The slide features multiple column charts with percentages indicating new car purchase intent and changes in mobility mode.
Market Analysis and Trends
Transportation & Logistics
Analyzes the impact of COVID-19 on consumer behaviors related to car buying, aftermarket services, and mobility preferences.
COVID-19, car purchase, mobility, consumer behavior, market analysis
false
Market Analysis and Trends
Transportation & Logistics
Multiple Chart
McKinsey
Add to my slides
Remove from favorites
Large area graph showing the daily new cases with a 7-day rolling average, accompanied by key observations that include numerical and percentage data.
Risk Assessment and Management
Government & Public Sector
Analyzes the rise in COVID-19 cases in early July 2020 and provides a snapshot of the global situation with key statistics on active cases, recoveries, and fatalities.
COVID-19, Case Growth, Recovery Rates, Summer Spread
false
Risk Assessment and Management
Government & Public Sector
Single Chart
BCG
Add to my slides
Remove from favorites
Features three line graphs comparing the daily new confirmed COVID-19 cases per million in various countries, color-coded by scenario (resurgence, continuation, delayed).
Market Analysis and Trends
Healthcare & Pharmaceuticals
Provides an overview of COVID-19 case trends in different countries, classifying them into categories based on their pandemic stage: resurgence, continuation, or delayed.
COVID-19, cases, countries, trends, analysis
false
Market Analysis and Trends
Healthcare & Pharmaceuticals
Multiple Chart
BCG
Add to my slides
Remove from favorites
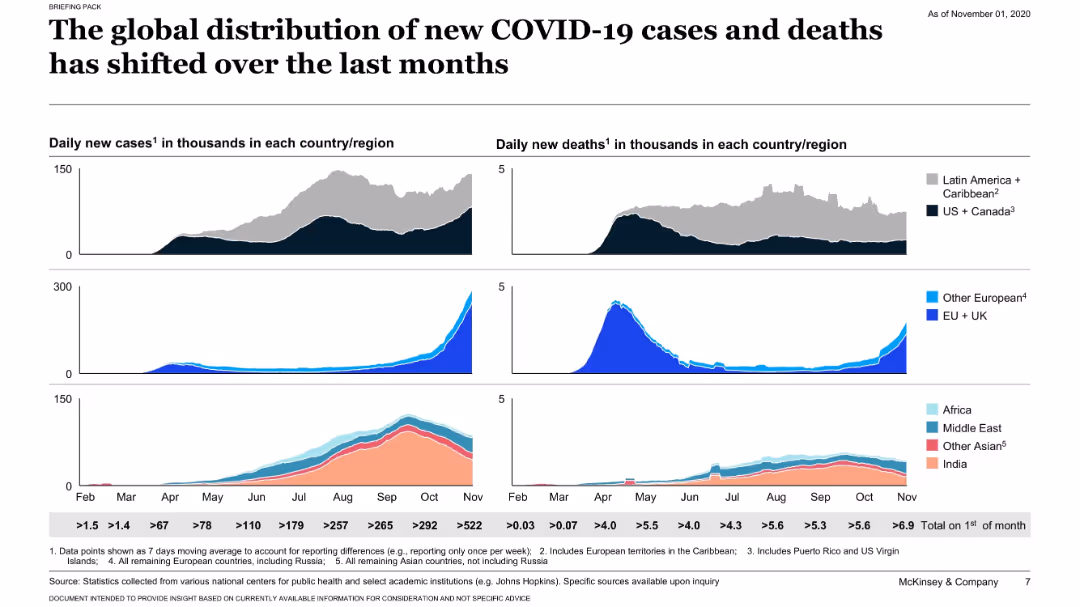
Grid of area graphs showing daily new cases and deaths by region; stacked visuals by geography; minimalistic dark background.
Risk Assessment and Management
Healthcare & Pharmaceuticals
This slide uses visual graphs to show how COVID-19 cases and deaths have evolved over months by region. It highlights a shift in the pandemic’s epicenter over time across continents.
COVID-19, cases, deaths, timeline, regional, global trends, healthcare, McKinsey
false
Risk Assessment and Management
Healthcare & Pharmaceuticals
Single Chart
McKinsey
Add to my slides
Remove from favorites
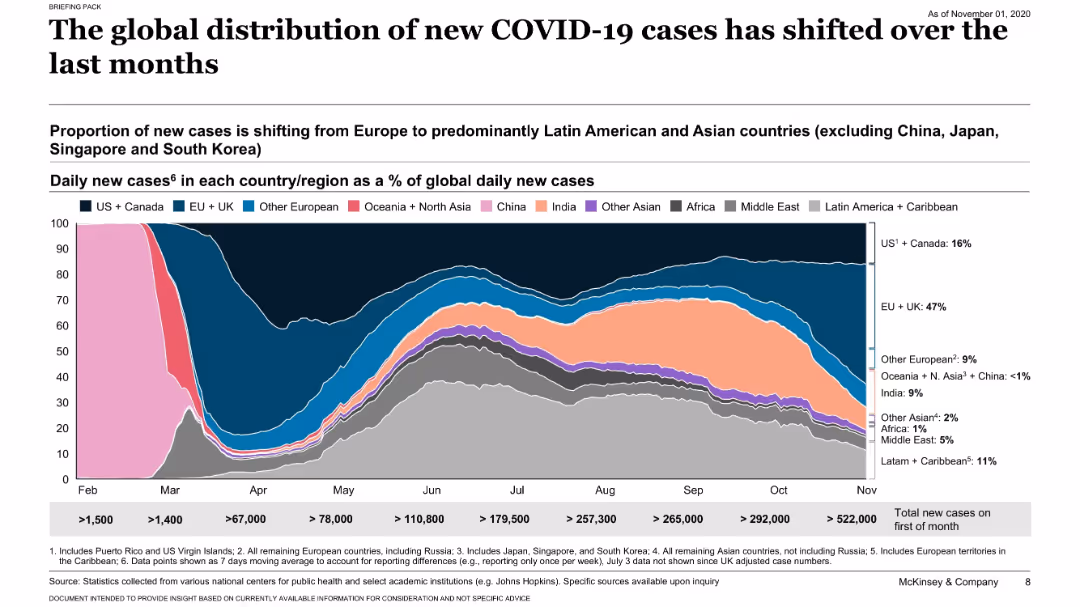
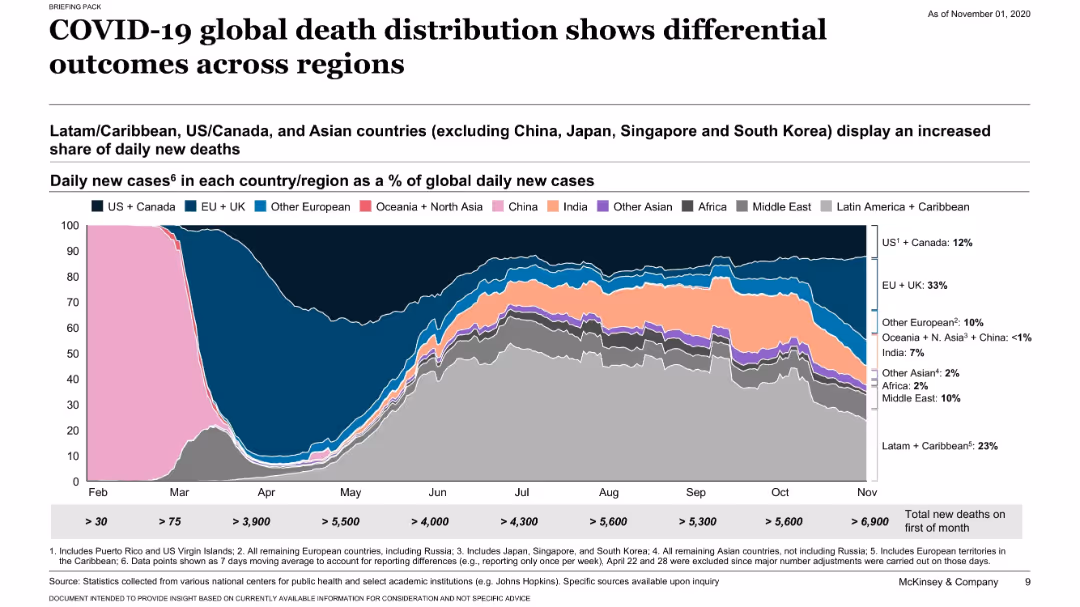
Stacked area chart showing regional proportions of global daily new cases; labeled by country group; legend and timeline below.
Risk Assessment and Management
Healthcare & Pharmaceuticals
The slide shows a shift in the proportion of daily COVID-19 cases from Europe to Latin America and Asia. It presents data as a percentage of global daily cases, reflecting geographic transitions in the pandemic.
COVID-19, cases, distribution, regional shifts, pandemic, McKinsey, trend
false
Risk Assessment and Management
Healthcare & Pharmaceuticals
Single Chart
McKinsey
Add to my slides
Remove from favorites
Slide with a graph displaying the cumulative number of COVID-19 cases by date, colored by region, with annotations and a key.
Risk Assessment and Management
Healthcare & Pharmaceuticals
The slide is analytical, comparing the spread of COVID-19 across regions, useful for policymakers or health professionals assessing risk and progression.
COVID-19, cases, Europe, U.S., Asia, transmission, data analysis, risk management
false
Risk Assessment and Management
Healthcare & Pharmaceuticals
Mixed Chart
McKinsey
Add to my slides
Remove from favorites
Features a stacked area chart showing the proportion of new COVID-19 cases by region over time, highlighting shifts from January to July 2020.
Market Analysis and Trends
Healthcare & Pharmaceuticals
Tracks the change in the distribution of new COVID-19 cases globally, illustrating the shifts from predominantly European to North American, Latin American, and Asian regions, providing a timeline of the pandemic spread.
COVID-19, cases, global, trends, 2020
false
Market Analysis and Trends
Healthcare & Pharmaceuticals
Single Chart
McKinsey
Add to my slides
Remove from favorites
The slide displays multiple line graphs with color-coded lines representing different countries.
Strategic Planning
Healthcare & Pharmaceuticals
This slide compares COVID-19 case trends in various countries, categorized into groups like 'Continuation' and 'Crush and contain', useful for analyzing pandemic responses.
COVID-19, cases, trends, countries, graphs
false
Strategic Planning
Healthcare & Pharmaceuticals
Multiple Chart
BCG
Add to my slides
Remove from favorites
Shows a stacked area chart of daily new COVID-19 cases by region and highlights key epidemic progression metrics.
Regulatory and Compliance
Healthcare & Pharmaceuticals
Analyzes regional COVID-19 case trends and the progress in vaccine rollout, emphasizing the significant drop in cases due to vaccination efforts.
COVID-19, case trends, vaccine rollout, regional data, public health, epidemic progression
false
Regulatory and Compliance
Healthcare & Pharmaceuticals
Mixed Chart
BCG
Add to my slides
Remove from favorites
The slide features a series of icons representing different communication channels, each accompanied by a percentage showing adoption or changes. This visual layout allows for a quick assessment of how COVID-19 has influenced channel strategies.
Technology and Digital Transformation
Professional Services
Discusses the transformation in marketing channels due to COVID-19, focusing on the shift towards more digital and direct-to-consumer approaches. It provides insights into how companies are adapting their communication and sales strategies in response to the pandemic, which is valuable for planning future marketing and sales initiatives.
COVID-19, Channel Strategy, Digital Transformation, Marketing, Sales
false
Technology and Digital Transformation
Professional Services
Pillar
Deloitte
Add to my slides
Remove from favorites
Line graphs comparing daily traffic index, coal consumption, and property transactions in China before and during COVID-19, marked with key dates.
Strategic Planning
Financial Services
Tracks the early signs of economic recovery in China, analyzing daily activities, energy consumption, and property transactions as of April 2020.
COVID-19, China, economic recovery, traffic, coal consumption, property transactions, analysis, recovery tracking
false
Strategic Planning
Financial Services
Multiple Chart
BCG
Add to my slides
Remove from favorites
Features a series of column charts comparing shifts in consumer behavior across various service sectors. The design utilizes blue tones and is labeled for clarity.
Market Analysis and Trends
Technology & Software
This slide shows the changes in user behavior due to COVID-19, with significant shifts to online services in food delivery, groceries, and education. Useful for analyzing consumer trends and market shifts during a pandemic.
COVID-19, consumer behavior, food delivery, online services, education, groceries
false
Market Analysis and Trends
Technology & Software
Single Chart
Bain
Add to my slides
Remove from favorites
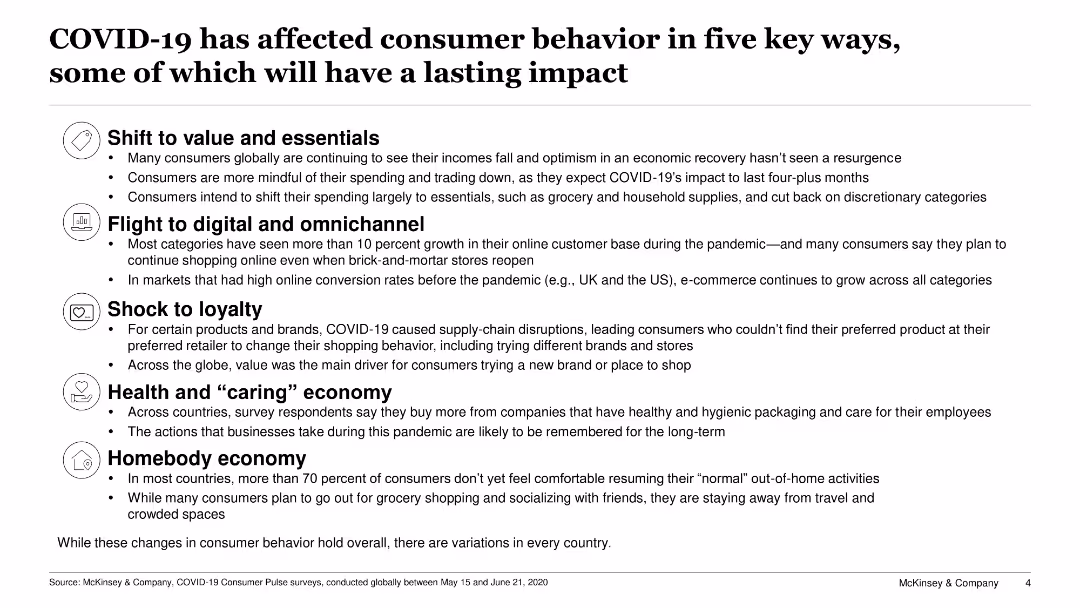
Lists five key impacts of COVID-19 on consumer behavior with bullet points for each, including value shift, digital shift, loyalty shock, health economy, and homebody economy.
Strategic Planning
Consumer Goods
The slide details the long-term impacts of COVID-19 on consumer behavior, emphasizing shifts towards value and essentials, digital adoption, changes in loyalty, and health-focused buying.
COVID-19, consumer behavior, long-term impact, digital shift, health economy
false
Strategic Planning
Consumer Goods
Header Vertical
McKinsey
Add to my slides
Remove from favorites
Depicts a woman and child shopping online, with a bold purple title indicating a focus on COVID-19's impact on retail consumers.
Market Analysis and Trends
Retail & E-commerce
Introduces a report on how COVID-19 has altered consumer behavior, specifically in the retail sector, with data-driven insights.
COVID-19, consumer behavior, retail, market research, data-driven insights, consumer insights
false
Market Analysis and Trends
Retail & E-commerce
Title
Accenture
Add to my slides
Remove from favorites
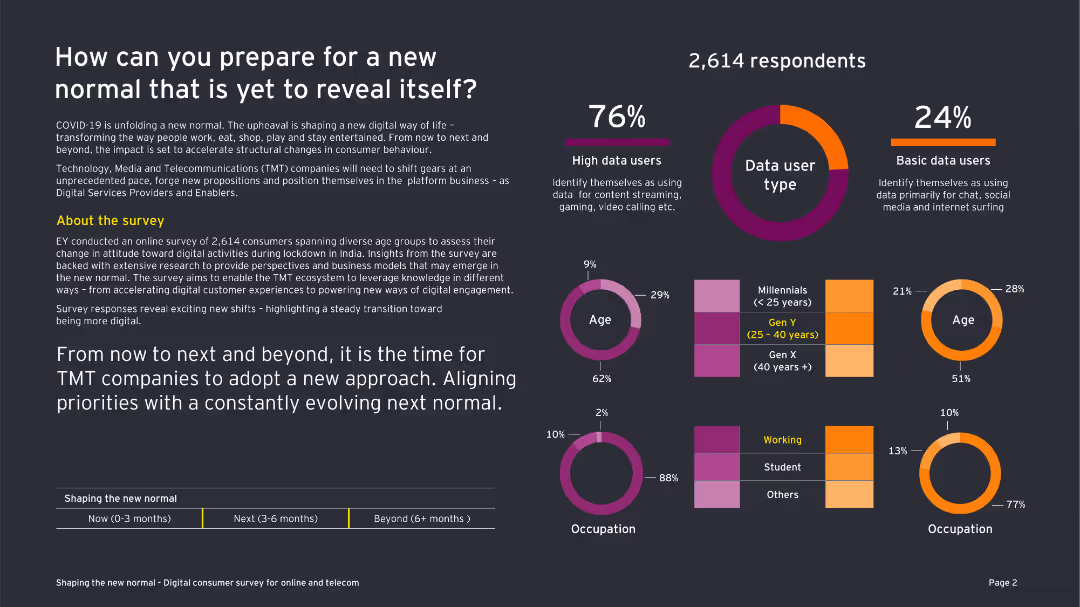
This slide features a combination of text and various charts including a column chart, pie chart, and doughnut chart. The design is moderately dense.
Market Analysis and Trends
Telecommunications
The slide discusses the impact of COVID-19 on consumer behavior in the telecommunications sector, using survey data from 2,614 respondents.
COVID-19, consumer behavior, telecommunications, survey, data usage, TMT companies, new normal, digital engagement, technology
false
Market Analysis and Trends
Telecommunications
Multiple Chart
EY
Add to my slides
Remove from favorites
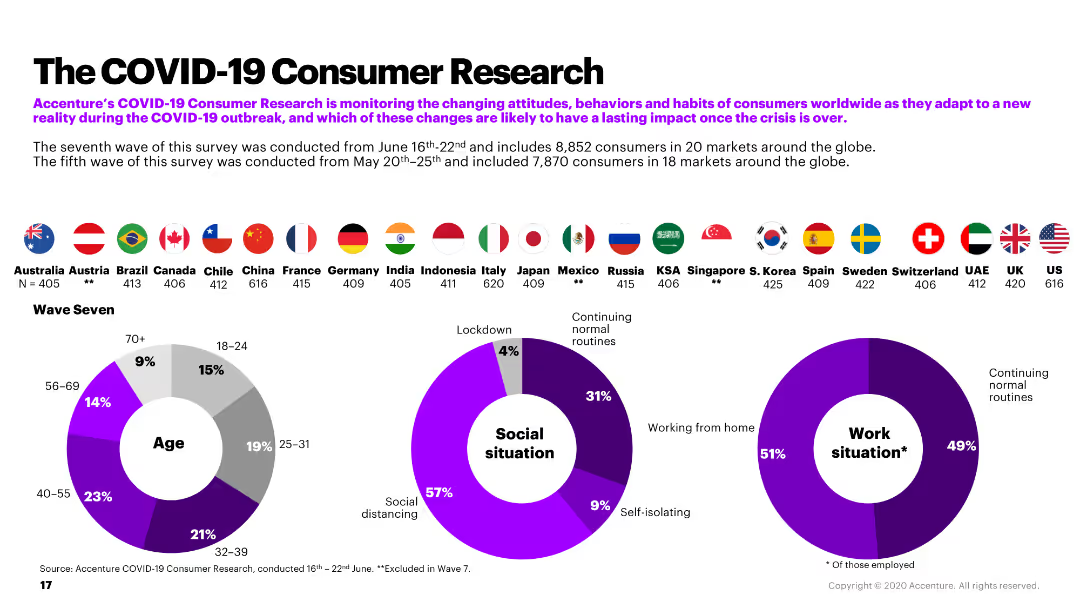
The slide includes a combination of pie charts and country flags, summarizing the demographic and situational data from Accenture's COVID-19 consumer research.
Market Analysis and Trends
Retail & E-commerce
The slide provides an overview of Accenture's COVID-19 consumer research, detailing demographics, social situations, and work situations during the pandemic.
COVID-19, consumer research, demographics, social situation, work situation
false
Market Analysis and Trends
Retail & E-commerce
Multiple Chart
Accenture
Add to my slides
Remove from favorites
This slide features a complex chart with a key explaining demographics, a world map, and a large pie chart in the center describing work situations.
Market Analysis and Trends
Retail & E-commerce
Details Accenture's research on consumer behavior during COVID-19, showing how attitudes, behaviors, and habits are likely to change post-crisis.
COVID-19, Consumer Research, Global Survey, Work Situations, Social Distancing, Demographics, Behavioral Change
false
Market Analysis and Trends
Retail & E-commerce
Mixed Chart
Accenture
Add to my slides
Remove from favorites
Line graph comparing consumer sentiment over time in five countries regarding the ongoing impact of COVID-19.
Market Analysis and Trends
Consumer Goods
Tracks changes in consumer sentiment during the COVID-19 pandemic across different regions, useful for market analysis in consumer goods industries.
COVID-19, consumer sentiment, market analysis, trends, regions
false
Market Analysis and Trends
Consumer Goods
Single Chart
BCG
Add to my slides
Remove from favorites
Bar charts showing U.S. consumer willingness to resume activities post-lockdown under various conditions, with observations on current sentiment.
Strategic Planning
Financial Services
Surveys U.S. consumer sentiment on resuming everyday activities post-COVID-19 lockdown, indicating varied readiness depending on conditions.
COVID-19, consumer sentiment, U.S., activities, lockdown, behavior analysis, readiness, conditions
false
Strategic Planning
Financial Services
Multiple Chart
BCG
Add to my slides
Remove from favorites
A large multi-colored area graph dominates this slide, charting the increase in daily COVID-19 cases by region from March to December. The background is gray, and each region (like North America, South America) is represented in a different color, with key data points highlighted on the graph.
Strategic Planning
Healthcare & Pharmaceuticals
Details the dramatic increase in COVID-19 cases globally with a focus on recent months. It provides a visual analysis of the pandemic's surge in different regions, emphasizing the growth in cases and the ongoing challenges in managing the spread.
COVID-19, daily cases, global, regions, pandemic, trends, healthcare
false
Strategic Planning
Healthcare & Pharmaceuticals
Single Chart
BCG
Add to my slides
Remove from favorites
Slide includes multiple column charts comparing COVID-19 death rates and case growth across top countries, emphasizing European and North American data.
Risk Assessment and Management
Healthcare & Pharmaceuticals
Analyzes COVID-19 death rates per capita in top affected countries, particularly in Europe and North America, and discusses the trends in new cases, offering insights into the pandemic's regional impacts as of June 2020.
COVID-19, death rates, Europe, North America
false
Risk Assessment and Management
Healthcare & Pharmaceuticals
Mixed Chart
McKinsey
Add to my slides
Remove from favorites
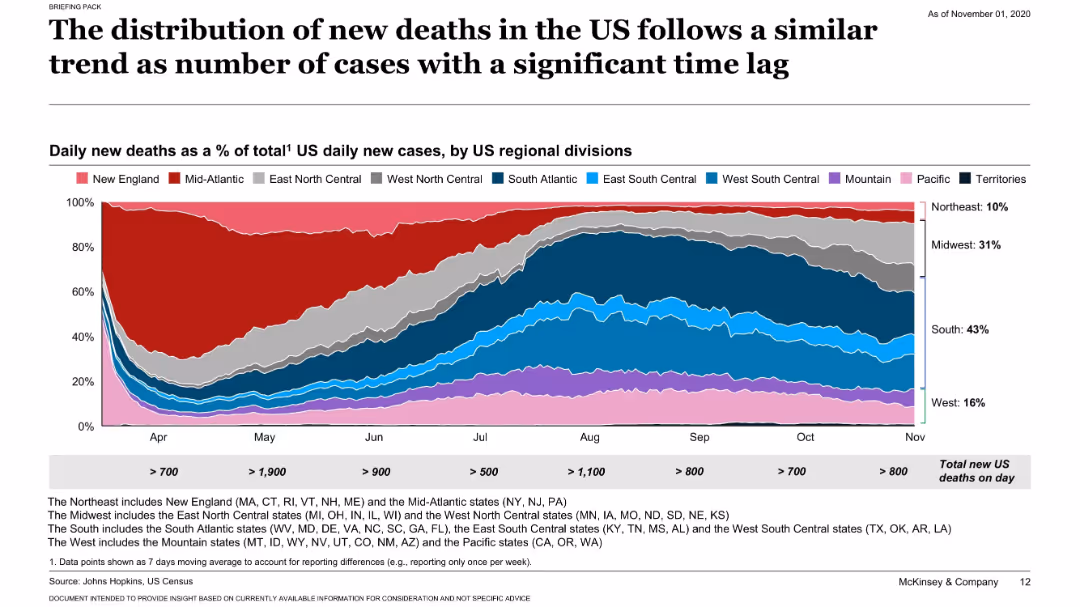
Similar stacked area chart as slide 17401, but for daily new deaths instead of cases.
Market Analysis and Trends
Healthcare & Pharmaceuticals
Displays a delayed but similar regional shift in new COVID-19 deaths across the US, suggesting a lagging correlation with the rise in cases seen in earlier months.
COVID-19, deaths, regional analysis, time lag, US trends
false
Market Analysis and Trends
Healthcare & Pharmaceuticals
Single Chart
McKinsey
Add to my slides
Remove from favorites
Similar layout to previous slide but for death rates; stacked area chart showing daily deaths by region; regional shares labeled.
Risk Assessment and Management
Healthcare & Pharmaceuticals
This slide compares global COVID-19 death distribution across regions. It shows that Latin America, the US/Canada, and Asian countries have increasing shares of daily new deaths, suggesting varied regional outcomes.
COVID-19, deaths, regional comparison, mortality, McKinsey, pandemic, distribution
false
Risk Assessment and Management
Healthcare & Pharmaceuticals
Single Chart
McKinsey
Add to my slides
Remove from favorites
Contains a line chart showing the change in consumer sentiment about COVID-19 over time in the US and emerging markets. The layout is simple with clear labels and a contrasting color scheme for clarity.
Market Analysis and Trends
Healthcare & Pharmaceuticals
Discusses changes in consumer confidence in the US and emerging markets due to the COVID-19 Delta variant, using survey data to illustrate perceptions over time and expectations for economic recovery.
COVID-19, Delta Variant, Consumer Sentiment, Markets
false
Market Analysis and Trends
Healthcare & Pharmaceuticals
Mixed Chart
BCG
Add to my slides
Remove from favorites
Features a stacked area chart tracking the frequency of COVID-19 variants over time with multiple color-coded layers representing different variants.
Market Analysis and Trends
Healthcare & Pharmaceuticals
This slide presents the dominance of the Delta variant among COVID-19 cases over time, useful for epidemiological tracking and vaccine strategy adjustments.
COVID-19, Delta variant, epidemiology, vaccine strategy, variant tracking
false
Market Analysis and Trends
Healthcare & Pharmaceuticals
Single Chart
BCG
Add to my slides
Remove from favorites
This slide features a detailed area graph depicting the rolling average of daily new COVID-19 cases globally, segmented by continent. The design is straightforward, focusing on the data presentation with minimal distractions. The color coding by region helps in distinguishing the data visually.
Market Analysis and Trends
Healthcare & Pharmaceuticals
Offers an in-depth analysis of the spread of the COVID-19 Delta variant and its impact on global case numbers. Highlights the effectiveness of vaccination efforts in reducing case numbers and discusses potential future trends in the pandemic's progression, providing valuable insights for healthcare and public health planning.
COVID-19, Delta variant, global health, pandemic trends, vaccination impact, public health, area graph
false
Market Analysis and Trends
Healthcare & Pharmaceuticals
Mixed Chart
BCG
Add to my slides
Remove from favorites
Line graph comparing daily cases per million population in several countries with accompanying text on lockdown strategies and cumulative cases.
Risk Assessment and Management
Government & Public Sector
Compares COVID-19 case trends in different countries and correlates them with their respective lockdown strategies.
COVID-19, Developed Economies, Lockdown Strategies, Case Trends
false
Risk Assessment and Management
Government & Public Sector
Single Chart
BCG
Add to my slides
Remove from favorites
This slide compares the percentage of respondents engaging in online activities before and after COVID-19 with bar graphs and a textual summary.
Market Analysis and Trends
Technology & Software
It shows how the pandemic increased online engagement and awareness, crucial for understanding consumer behavior changes and market opportunities.
COVID-19, digital adoption, online activities, market analysis, consumer behavior, awareness, engagement, pandemic
false
Market Analysis and Trends
Technology & Software
Multiple Chart
Kearney
Add to my slides
Remove from favorites
With a deep purple backdrop, the slide includes vertical bar graphs illustrating pre and post-COVID-19 online activity changes.
Market Analysis and Trends
Technology & Software
Highlights the amplified use of telehealth, online learning, shopping, and government services on the nbn network as a result of COVID-19.
COVID-19, digital alternatives, nbn network, online activities, telehealth, online learning, government services
false
Market Analysis and Trends
Technology & Software
Multiple Chart
Accenture
Add to my slides
Remove from favorites
The slide features a mix of icons, bullet points, and sections of text, with a bold title at the top. It uses contrasting blue and white color blocks to differentiate points.
Strategic Planning
Healthcare & Pharmaceuticals
This slide details how COVID-19 has accelerated the adoption of digital solutions in healthcare, emphasizing innovations and pre-COVID-19 impediments to digital transformation in patient support solutions.
COVID-19, Digital Solutions, Healthcare, Patient Support, Telemedicine, e-Pharmacy, Innovation, Barriers, Adoption, Transformation
false
Strategic Planning
Healthcare & Pharmaceuticals
Header Vertical
Bain
Add to my slides
Remove from favorites
Three-column chart with icons: a clock (>80% more urgent), a hand with a dollar sign (~65% anticipate more investments), and a gear (priorities on remote work and automation).
Market Analysis and Trends
Technology & Software
Highlights increased urgency and investment in digital transformation post-COVID-19. Useful for discussing strategic planning in technology adoption and operational adjustments within businesses.
COVID-19, digital transformation, investment, remote work, cybersecurity, marketing, automation
false
Market Analysis and Trends
Technology & Software
Pillar
BCG
Add to my slides
Remove from favorites
Pie chart showing the estimated duration of COVID-19's economic impact. Segments represent different time frames, with a majority predicting a prolonged effect. Text explains the context.
Market Analysis and Trends
Financial Services
This slide presents Canadian investors' views on the duration of COVID-19's impact on the economy, with a significant portion expecting the effects to last until April 2022 or longer. It discusses the variations in perceptions based on age and gender.
COVID-19, Economic Impact, Canadian, Duration, Prediction
false
Market Analysis and Trends
Financial Services
Mixed Chart
IPSOS
Add to my slides
Remove from favorites
Color-coded matrix showing potential economic impacts in the U.S. based on different lengths of COVID-19 suppression and associated economic downturns.
Financial Performance
Financial Services
Analyzes the potential economic losses from COVID-19 in the U.S. under various suppression scenario lengths, useful for financial planning and analysis.
COVID-19, economic impact, financial analysis, suppression, U.S., scenarios, losses, planning
false
Financial Performance
Financial Services
Table
BCG
Add to my slides
Remove from favorites
The slide contains an area chart showing the projected economic impact of COVID-19 on New York's GDP, compared to the pre-COVID baseline. It visually represents data points through shading and text annotations to highlight key figures like total economic loss.
Financial Performance
Government & Public Sector
Provides detailed projections of the economic impact of COVID-19 on New York, including total loss and timeline to recovery. Valuable for discussions on fiscal planning and economic strategies in response to pandemics.
COVID-19, economic impact, GDP, New York, projections, recovery, fiscal planning
false
Financial Performance
Government & Public Sector
Mixed Chart
BCG
Add to my slides
Remove from favorites
Slide shows bar graphs comparing economic conditions globally, with a focus on how perceptions have shifted over the last six months.
Market Analysis and Trends
Financial Services
Discusses the economic impact of COVID-19 worldwide, showing trends in economic perception and conditions over recent months. Essential for financial analysts and economic forecasters.
COVID-19, economic impact, global economy, market conditions, financial analysis, trend analysis
false
Market Analysis and Trends
Financial Services
Multiple Chart
McKinsey
Add to my slides
Remove from favorites
This slide presents multiple data visualizations, including bar charts and line graphs, tracking COVID-19's impact on various factors like mobility, economic forecasts, and consumer activity from August to November. Each section uses a different color to denote the type of data being represented, like green for mobility and red for GDP.
Strategic Planning
Financial Services
Summarizes key metrics affected by COVID-19, such as global epidemic progression, mobility trends, GDP forecasts, and stock market performance. It provides a comprehensive overview of how different sectors and regions are recovering from the pandemic impacts.
COVID-19, economic impact, healthcare, GDP, mobility, stock markets
false
Strategic Planning
Financial Services
Mixed Chart
BCG
Add to my slides
Remove from favorites
The slide features a column chart and line graph visualizing the Philippine economy's GDP growth, unemployment trends, and PSE Index values during the COVID-19 pandemic.
Market Analysis and Trends
Government & Public Sector
Analyzes the economic impact of COVID-19 on the Philippines, detailing GDP changes, unemployment rates, and stock market performance.
COVID-19, economic impact, Philippines, GDP, unemployment, stock market, column chart, line graph
false
Market Analysis and Trends
Government & Public Sector
Mixed Chart
Deloitte
Add to my slides
Remove from favorites
Detailed diagrams and calculations explaining the methodology to estimate economic impact of COVID-19 by combining sectoral data with expected duration of crisis measures.
Strategic Planning
Financial Services
Explores the methodology to estimate economic impacts of COVID-19, combining industry-specific data with projected lengths of lockdowns and restrictions.
COVID-19, economic impact, sectoral analysis, lockdown duration, crisis measures, economic methodology
false
Strategic Planning
Financial Services
Multiple Chart
BCG
Add to my slides
Remove from favorites
Highly data-centric slide with graphs, charts, and bullet points presenting various leading indicators for economic recovery.
Performance Metrics and KPIs
Technology & Software
Provides a detailed dashboard of leading indicators related to COVID-19's economic impact in China, valuable for analysts and strategists.
COVID-19, economic indicators, China, Hubei, recovery tracking, consumer confidence, economic restart
false
Performance Metrics and KPIs
Technology & Software
Multiple Chart
McKinsey
Add to my slides
Remove from favorites
Bar chart illustrating the expected time for economic recovery post-COVID-19, ranging from one year to more than five years. Additional text provides insights.
Risk Assessment and Management
Financial Services
The slide outlines expectations for the Canadian economy's recovery time post-COVID-19, showing a range of predictions from one year to more than five years. It highlights the divide between optimists and pessimists regarding the economic rebound timeline.
COVID-19, Economic Recovery, Canadian, Timeline, Prediction
false
Risk Assessment and Management
Financial Services
Mixed Chart
IPSOS
Add to my slides
Remove from favorites
Bar charts displaying U.S. employment and revenue by sector during COVID-19, segmented by contact intensity and susceptibility to lockdown measures.
Market Analysis and Trends
Professional Services
Examines the impact of COVID-19 on various U.S. economic sectors, offering insights into employment and revenue changes under different restrictions.
COVID-19, economic sectors, employment, revenue, U.S., impact analysis, lockdown, sector analysis
false
Market Analysis and Trends
Professional Services
Multiple Chart
BCG
Add to my slides
Remove from favorites
Data-heavy slide with bar graphs and charts showing daily cases, growth of daily new cases, recovery rates, and testing data for the top 15 economies by GDP.
Risk Assessment and Management
Government & Public Sector
Presents detailed COVID-19 case numbers, recovery rates, and testing data for major economies, highlighting the disparity in pandemic management.
COVID-19, Economy, Recovery, Testing, GDP, Pandemic Management
false
Risk Assessment and Management
Government & Public Sector
Multiple Chart
BCG
Add to my slides
Remove from favorites
A bar graph displays the number of school days lost in different regions due to COVID-19, with dual-color bars representing fully and partially closed schools.
Market Analysis and Trends
Education & Training
This slide quantifies the educational disruption caused by COVID-19, showcasing the number of school days lost in different regions globally. It highlights the long-term effects on educational equality and economic impact.
COVID-19, education, impact, school closures
false
Market Analysis and Trends
Education & Training
Mixed Chart
Roland Berger
Add to my slides
Remove from favorites
The slide features a timeline table format, showcasing key educational developments during COVID-19 across various countries. It uses shades of blue for emphasis and has a clear header.
Regulatory and Compliance
Education & Training
It displays the educational response to COVID-19 in Southeast Asia, with timelines for school closures and alternative educational arrangements, demonstrating the shift towards online learning solutions.
COVID-19, Education, Response, SEA, School Closures, Online Learning, Alternatives, Timelines, Developments, Shift
false
Regulatory and Compliance
Education & Training
Mixed Chart
Bain
Add to my slides
Remove from favorites
Contains stacked area chart and a line chart displaying global COVID-19 cases over time. Utilizes a color gradient for different continents.
Regulatory and Compliance
Healthcare & Pharmaceuticals
Slide presents global COVID-19 epidemic progression with a focus on daily cases and cumulative totals by region. Analyzes trends in case growth rates.
COVID-19, epidemic, cases, global, trends
false
Regulatory and Compliance
Healthcare & Pharmaceuticals
Multiple Chart
BCG
Add to my slides
Remove from favorites
Features a complex multi-line graph illustrating different response strategies and epidemic trajectories by country with color-coded lines and icons representing national flags.
Strategic Planning
Healthcare & Pharmaceuticals
Compares COVID-19 response strategies and their effectiveness across various countries, highlighting different stages of epidemic control and potential end-state strategies.
COVID-19, epidemic curve, country comparison, response strategies, healthcare policy, international
false
Strategic Planning
Healthcare & Pharmaceuticals
Mixed Chart
McKinsey
Add to my slides
Remove from favorites
Showcases a world map and timeline of COVID-19 case statistics, using color gradients to denote varying conditions across regions, complemented by key data points on recoveries and infection rates.
Strategic Planning
Healthcare & Pharmaceuticals
Provides a global overview of COVID-19 recovery rates and case doubling times, useful for public health monitoring and response planning.
COVID-19, Epidemic monitoring, Global health, Public health, Recovery rates
false
Strategic Planning
Healthcare & Pharmaceuticals
Mixed Chart
BCG
Add to my slides
Remove from favorites
Two distinct graphs are shown. The first graph plots daily growth rates of total cases with a log scale of confirmed cases, categorizing countries by their cases doubling rate. The second graph displays cumulative number of confirmed cases for selected countries with a curve that shows the progression over days.
Market Analysis and Trends
Healthcare & Pharmaceuticals
This slide visualizes the COVID-19 case growth trends and containment efforts across different countries, useful for analyzing epidemic progression and virus monitoring.
COVID-19, epidemic progression, virus monitoring, case growth, containment efforts, daily growth rate, cumulative cases, log scale
false
Market Analysis and Trends
Healthcare & Pharmaceuticals
Multiple Chart
BCG
Add to my slides
Remove from favorites
Line chart comparing daily COVID-19 cases per million among the world's largest economies, annotated with key statistics on recent tests and case trends.
Regulatory and Compliance
Healthcare & Pharmaceuticals
Provides a comparative analysis of COVID-19 impact in major economies, focusing on daily cases per million and testing rates.
COVID-19, epidemiology, economies, cases
false
Regulatory and Compliance
Healthcare & Pharmaceuticals
Single Chart
BCG
Add to my slides
Remove from favorites
Slide displays a line graph showing an epidemic curve with stages marked by circles, and a dotted line representing potential future scenarios, set against a dark background.
Strategic Planning
Healthcare & Pharmaceuticals
Discusses the uncertainty in long-term COVID-19 spread and potential outcomes depending on public health decisions. Useful for strategic planning in healthcare and government policy-making.
COVID-19, epidemiology, healthcare capacity, epidemic curve, public health, future scenarios
false
Strategic Planning
Healthcare & Pharmaceuticals
Single Chart
McKinsey
Add to my slides
Remove from favorites
This slide presents data in a series of well-organized tables and charts. It compares epidemiological data across various European countries with economic indicators on the side. There's a consistent color theme for visual clarity.
Market Analysis and Trends
Government & Public Sector
This slide compares COVID-19 data among European countries, with a focus on epidemiological and economic impacts. It is designed for presenting to stakeholders interested in the pandemic's effects and measures like travel restrictions and health notices, with country-specific details for a granular approach.
COVID-19, Europe, Data Comparison, Travel Restrictions, Health Notice, Economic Impact, Epidemiological Data, Country-Specific, Pandemic, Measures
false
Market Analysis and Trends
Government & Public Sector
Multiple Chart
McKinsey
Add to my slides
Remove from favorites
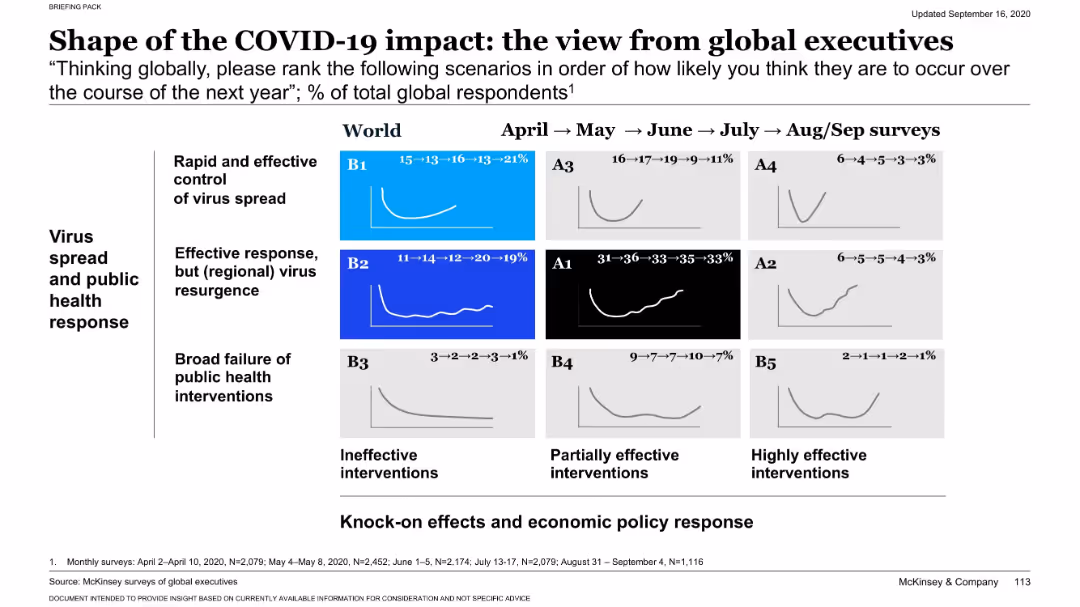
This slide includes a series of mini line charts depicting global executive opinions on various potential outcomes of the COVID-19 impact over the next year.
Risk Assessment and Management
Healthcare & Pharmaceuticals
Provides insights into executive expectations globally on public health response effectiveness and the potential scenarios regarding virus control or resurgence.
COVID-19, executive insights, health response, scenarios, impact
false
Risk Assessment and Management
Healthcare & Pharmaceuticals
Multiple Chart
McKinsey
Add to my slides
Remove from favorites
Matrix view of scenarios with color-coded probability rankings from surveys over several months.
Market Analysis and Trends
Government & Public Sector
Survey data from global executives ranks COVID-19 recovery scenarios by likelihood. The A1 (virus resurgence, muted recovery) scenario holds the highest probability, reflecting executive concerns over recurrence and slow recovery as of August/September 2020.
COVID-19, executive survey, scenario ranking, impact, probability, recovery, virus resurgence, muted growth
false
Market Analysis and Trends
Government & Public Sector
Single Chart
McKinsey
Add to my slides
Remove from favorites
The slide contains text analysis and a pie chart comparing the perceived impact of COVID-19 and the 2007-08 Financial Crisis on investors. Clean white background.
Market Analysis and Trends
Financial Services
This slide compares the impact of COVID-19 and the Financial Crisis of 2007-08 on investors, highlighting differences in perception and resulting investment behavior.
COVID-19, Financial Crisis, comparison, perception, investment behavior
false
Market Analysis and Trends
Financial Services
Mixed Chart
IPSOS
Add to my slides
Remove from favorites
Stacked bar chart showing the self-assessed financial situations of respondents compared to pre-COVID-19. The chart divides responses into categories from 'Much worse off' to 'Much better off'.
Risk Assessment and Management
Financial Services
The slide analyzes the perceived financial impact of COVID-19 on Canadian investors, indicating that a significant portion felt worse off financially. It highlights variations across income groups, showing those with lower incomes were more adversely affected.
COVID-19, Financial Impact, Canadian, Income, Pandemic
false
Risk Assessment and Management
Financial Services
Mixed Chart
IPSOS
Add to my slides
Remove from favorites
Bar chart showing the estimated time for financial recovery among households post-COVID-19. Categories range from one year to more than five years.
Risk Assessment and Management
Financial Services
The slide details the estimated time for Canadian households to recover financially from COVID-19, with responses indicating a range from one year to more than five years. It also notes a small percentage of respondents who feel their finances were not significantly impacted.
COVID-19, Financial Recovery, Canadian, Households, Pandemic
false
Risk Assessment and Management
Financial Services
Mixed Chart
IPSOS
Add to my slides
Remove from favorites
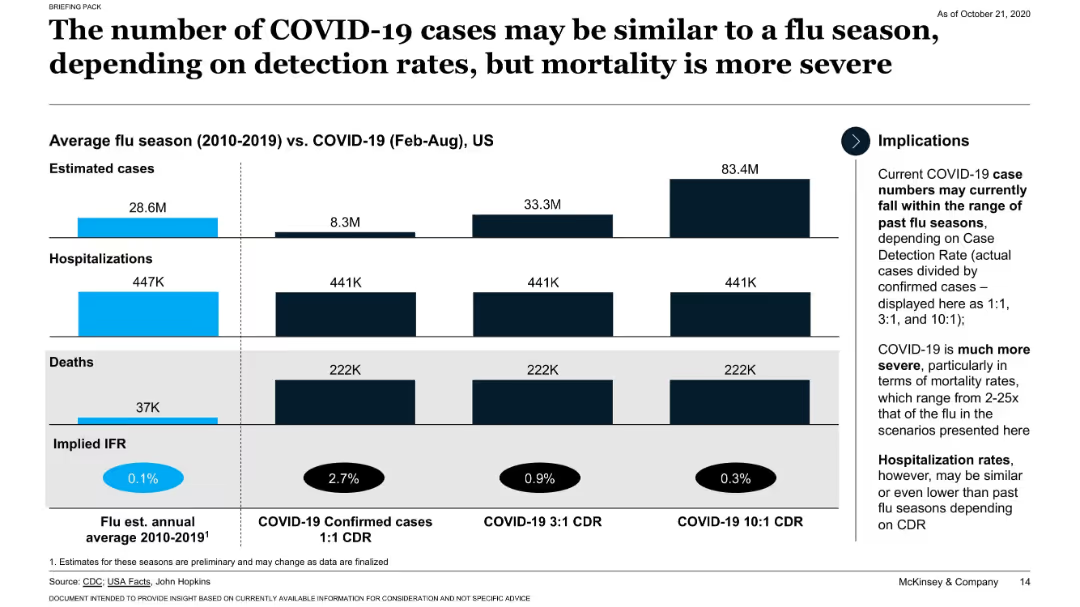
Side-by-side bar comparisons for flu vs. COVID-19 metrics across three case detection ratios (CDRs), with implications on right.
Strategic Planning
Healthcare & Pharmaceuticals
Compares COVID-19 and flu seasons in terms of estimated cases, hospitalizations, and deaths under varying detection assumptions. Highlights the much higher implied fatality rate for COVID-19 under all modeled detection scenarios.
COVID-19, flu comparison, hospitalizations, case detection, IFR
false
Strategic Planning
Healthcare & Pharmaceuticals
Mixed Chart
McKinsey
Add to my slides
Remove from favorites
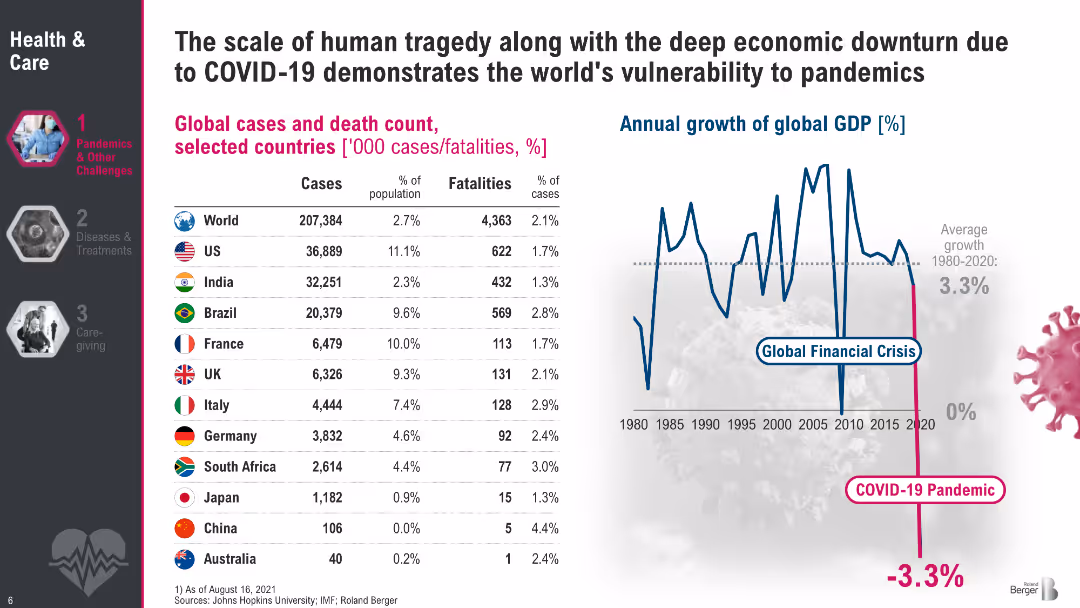
Split layout: left side features a table of COVID-19 cases and fatalities by country; right side shows a line graph of global GDP growth from 1980 to 2020 with a sharp drop in 2020; white background with pink and blue accents; sidebar navigation on the left.
Performance Metrics and KPIs
Healthcare & Pharmaceuticals
Demonstrates the global scale and impact of COVID-19, with detailed statistics on cases and fatalities across selected countries. It highlights how pandemics influence human health and global economic performance, with GDP data showing a sharp contraction in 2020. The slide contextualizes pandemic vulnerability using both health and economic indicators.
COVID-19, GDP impact, global health, fatalities, economic downturn, pandemic, WHO data, IMF, vulnerability
false
Performance Metrics and KPIs
Healthcare & Pharmaceuticals
Mixed Chart
Roland Berger
Add to my slides
Remove from favorites
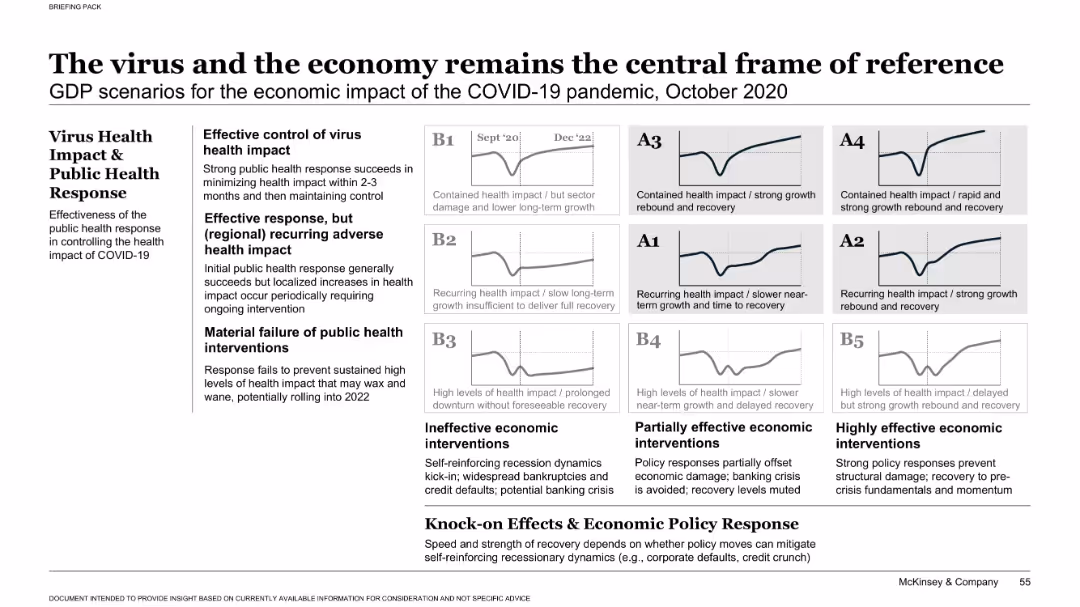
Matrix-style layout with 3x3 grid of small charts representing GDP scenarios, grouped by effectiveness of virus response and economic policy response. Left-hand text box explains scenario categories. Neutral color palette.
Strategic Planning
Professional Services
Presents a framework of nine GDP recovery scenarios based on public health response and economic interventions. It highlights three tiers of virus control (effective, recurring, and failure) and three levels of economic response (ineffective to highly effective), leading to different economic trajectories.
COVID-19, GDP scenarios, economic impact, virus response, policy impact, strategic framework, recovery models, public health, recession risk, intervention outcomes
false
Strategic Planning
Professional Services
Single Chart
McKinsey
Add to my slides
Remove from favorites
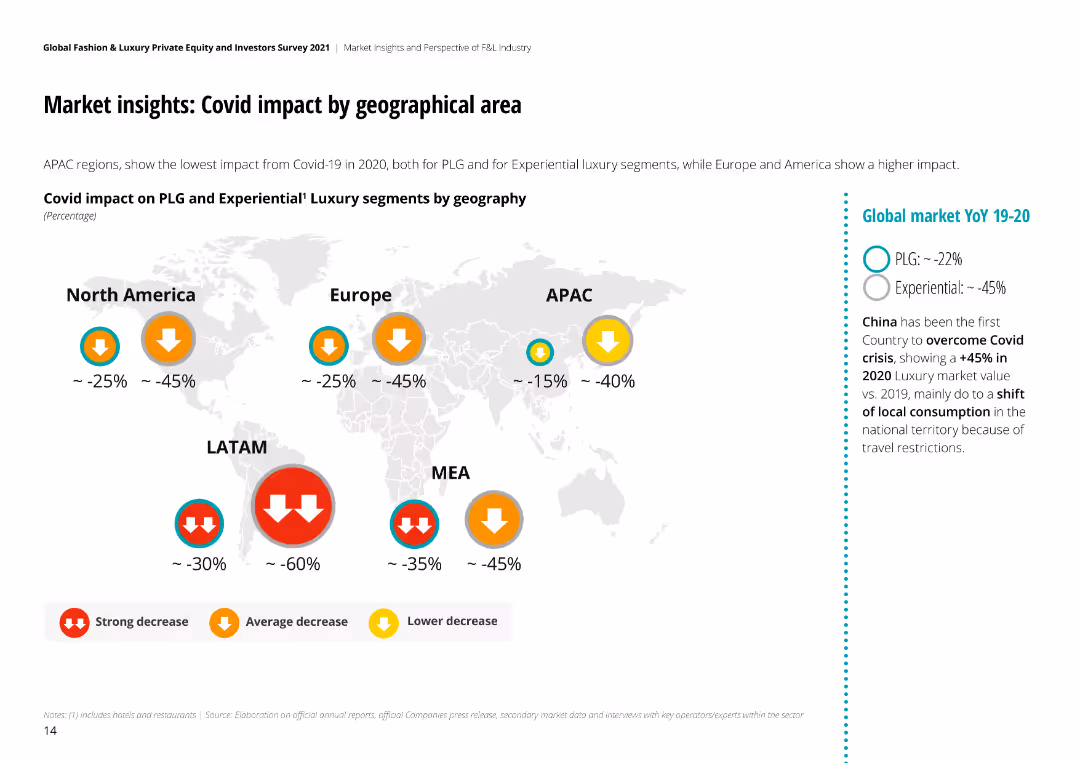
The slide includes a world map with color-coded arrows indicating the degree of COVID-19 impact on luxury markets by region, along with textual analysis.
Market Analysis and Trends
Retail & E-commerce
Examines the geographical impact of COVID-19 on the luxury market, comparing regions such as North America, Europe, APAC, LATAM, and MEA.
COVID-19, geographical impact, luxury, market, retail, e-commerce, regions, analysis
false
Market Analysis and Trends
Retail & E-commerce
Graphic
Deloitte
Add to my slides
Remove from favorites
This slide features a detailed comparison of three uncertainty scenarios: Base, Downside, and Upside. It uses icons and color coding for visual distinction.
Risk Assessment and Management
Professional Services
Discusses three potential economic scenarios regarding impacts such as COVID-19, geopolitical risks, and global supply chains. Each scenario (Base, Downside, Upside) includes detailed impacts and macroeconomic driver information. Useful for risk assessment and strategic decision-making.
COVID-19, Geopolitical Risk, Supply Chain, Inflation, GDP, Scenario Analysis, Economic Drivers, Risk Management
false
Risk Assessment and Management
Professional Services
Table
Deloitte
Add to my slides
Remove from favorites
This slide presents a world map colored to indicate COVID-19 case numbers and deaths as of July 2020, with detailed statistics for each region.
Market Analysis and Trends
Healthcare & Pharmaceuticals
Provides an overview of global COVID-19 cases and deaths, highlighting significant data points and trends as of July 2020, useful for understanding the pandemic’s international impact at that time.
COVID-19, global, cases, deaths, 2020
false
Market Analysis and Trends
Healthcare & Pharmaceuticals
Graphic
McKinsey
Add to my slides
Remove from favorites
World map with data points and legends indicating COVID-19 spread and statistics, high visual complexity.
Risk Assessment and Management
Healthcare & Pharmaceuticals
Global dashboard showing the spread and impact of COVID-19, useful for risk assessment and international response planning.
COVID-19, global dashboard, transmission, pandemic, risk management, health crisis, leading indicators
false
Risk Assessment and Management
Healthcare & Pharmaceuticals
Graphic
McKinsey
Add to my slides
Remove from favorites
Features multiple small graphs showing different predicted scenarios for virus control globally, based on executive surveys over time.
Market Analysis and Trends
Healthcare & Pharmaceuticals
Provides a global perspective on expected COVID-19 outcomes, summarizing executive opinions and highlighting the variability in expected virus control scenarios.
COVID-19, global expectations, public health response, executive survey, virus outcomes, scenario analysis
false
Market Analysis and Trends
Healthcare & Pharmaceuticals
Multiple Chart
McKinsey
Add to my slides
Remove from favorites
The slide displays a complex array of data including graphs, charts, and tables summarizing various impacts of COVID-19 globally. It includes a variety of visual elements like color-coded sections, numerical indicators, and brief text explanations to convey information effectively.
Industry Overview
Financial Services
This comprehensive dashboard captures the global impact of COVID-19 across multiple dimensions, including epidemic progression, consumer activity, economic effects, and business impacts. It provides a snapshot of changes over time, offering insights into how different regions and sectors are navigating the pandemic.
COVID-19, global impact, economic effects, consumer behavior, business impacts, epidemic data, dashboard
false
Industry Overview
Financial Services
Mixed Chart
BCG
Add to my slides
Remove from favorites
Timeline showing different countries' responses to COVID-19 with a focus on lockdown measures and case doubling times.
Regulatory and Compliance
Government & Public Sector
Examines the timing and types of responses implemented by various countries to the COVID-19 pandemic, useful for comparative policy analysis and planning.
COVID-19, global response, lockdown, policy, timeline
false
Regulatory and Compliance
Government & Public Sector
Mixed Chart
BCG
Add to my slides
Remove from favorites
List of key government actions to combat COVID-19 with descriptive footnotes and examples of countries implementing these actions.
Risk Assessment and Management
Government & Public Sector
Suggests five critical actions that governments can take to protect the population and limit hospitalizations during the pandemic.
COVID-19, Government Actions, Hospitalizations, Protective Measures
false
Risk Assessment and Management
Government & Public Sector
Pillar
BCG
Add to my slides
Remove from favorites
Multiple small graphs displaying the effect of various government actions on COVID-19 case growth rates across different countries, using a day-by-day comparison.
Regulatory and Compliance
Government & Public Sector
Assesses the impact of measures like school closures and travel restrictions on the COVID-19 spread, useful for policymakers and public health officials.
COVID-19, government response, public health, measures, effectiveness, policy, case reduction, spread, actions
false
Regulatory and Compliance
Government & Public Sector
Multiple Chart
BCG
Add to my slides
Remove from favorites
Text-heavy slide with headings and subheadings, outlining the document's objectives and leadership guidance.
Industry Overview
Government & Public Sector
Summarizes the global impact of COVID-19 and the need for an integrated response from leaders across sectors.
COVID-19, Health Crisis, Leadership, Integrated Response, Societal Impact
false
Industry Overview
Government & Public Sector
Text Only
BCG
Add to my slides
Remove from favorites
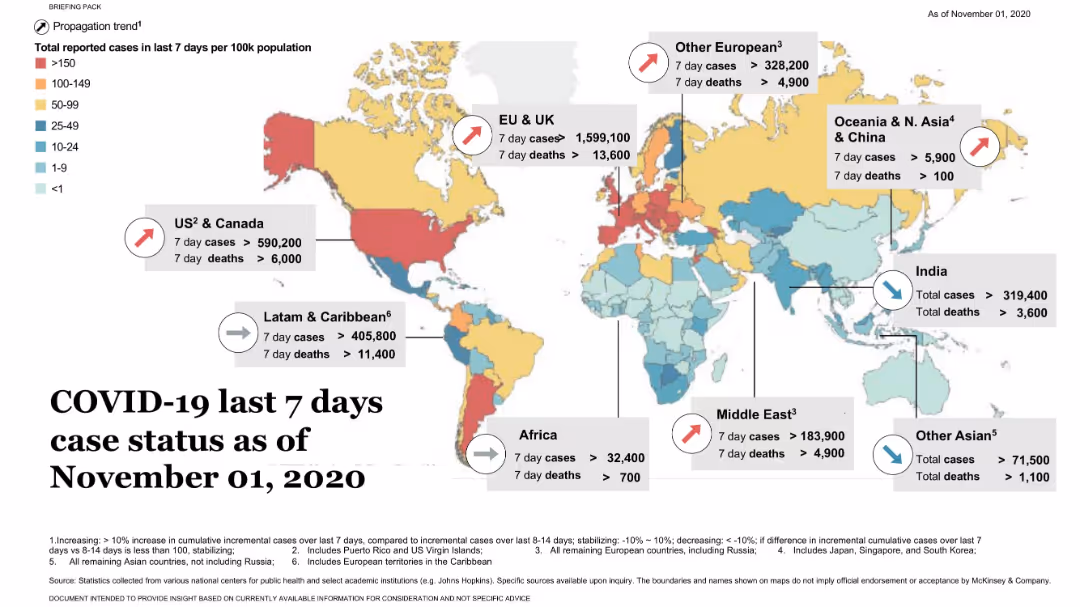
World map with heatmap coloring and arrows for trend direction; regional stats in callouts; legend and notes at bottom.
Risk Assessment and Management
Healthcare & Pharmaceuticals
This slide presents a global heatmap of COVID-19 case rates by region for a 7-day period. Regional callouts show case and death figures, with trend indicators (rising/stabilizing/decreasing).
COVID-19, heatmap, global health, cases, deaths, McKinsey, pandemic, trend
false
Risk Assessment and Management
Healthcare & Pharmaceuticals
Uncategorized
McKinsey
Add to my slides
Remove from favorites
The slide presents a table with percentages showing alternative sites of care hospitals will invest in, such as diagnostic imaging centers and rural health clinics, across various countries.
Strategic Planning
Healthcare & Pharmaceuticals
The slide discusses the shift in hospital investment priorities post-COVID-19, with a focus on diagnostic imaging centers, rural health clinics, and skilled nursing facilities across different countries, reflecting changing healthcare dynamics.
COVID-19, hospital priorities, investment, care sites, global
false
Strategic Planning
Healthcare & Pharmaceuticals
Table
LEK
Add to my slides
Remove from favorites
The slide displays a combination of icons and column charts in green shades, illustrating the types of shortages (hospital beds, supplies, medical staff) and the utilization of ICU beds in the U.S. during different COVID-19 waves. The design is clear, with direct comparisons between the first and current waves.
Strategic Planning
Healthcare & Pharmaceuticals
Discusses the pressure on hospital systems due to surging COVID-19 cases, showing data on ICU utilization and the types of resource shortages. It serves as an analysis tool to understand the strain on healthcare infrastructure during different pandemic waves.
COVID-19, hospitals, ICU, healthcare, shortages, cases, pressure
false
Strategic Planning
Healthcare & Pharmaceuticals
Mixed Chart
BCG
Add to my slides
Remove from favorites
U.S. map with color gradients representing daily cases per million, bar graphs for top 5 states by daily cases, and temporal changes from April to July.
Risk Assessment and Management
Government & Public Sector
Displays the shift in COVID-19 hotspots within the U.S. over time, with a focus on case distribution per state.
COVID-19, Hotspots, Case Distribution, USA, Regional Shift
false
Risk Assessment and Management
Government & Public Sector
Mixed Chart
BCG
Add to my slides
Remove from favorites
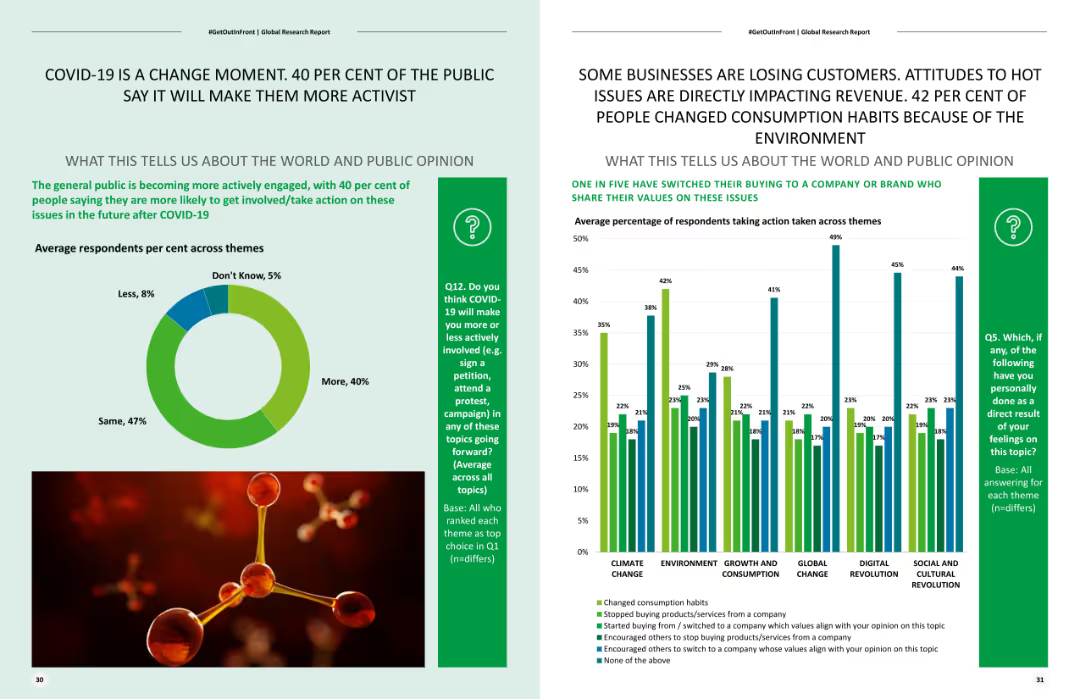
Includes a pie chart showing the distribution of expected future activism levels post-COVID-19 and a column chart on changes in consumption habits due to environmental concerns.
Risk Assessment and Management
Healthcare & Pharmaceuticals
Analyzes the impact of COVID-19 on future activism, illustrating how public sentiment towards activism has increased and affected consumer behavior.
COVID-19 impact, activism, consumer behavior, environmental concerns, future trends
false
Risk Assessment and Management
Healthcare & Pharmaceuticals
Multiple Chart
Deloitte
Add to my slides
Remove from favorites
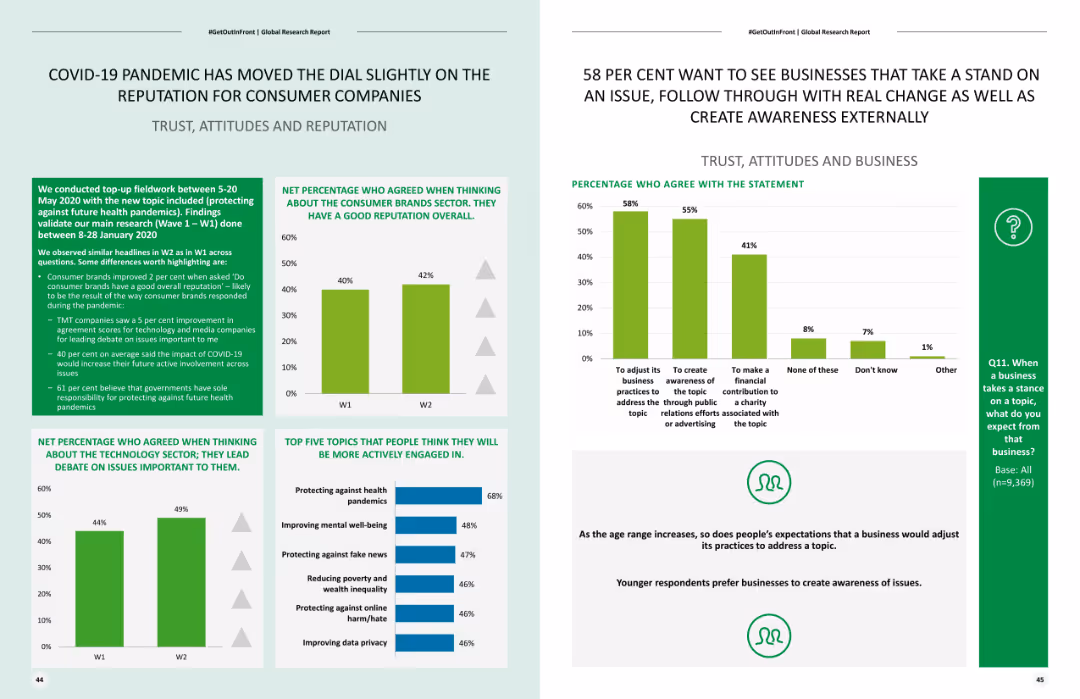
Displays column charts showing changes in reputation for consumer companies pre and post-COVID-19, and a list of top issues for future engagement.
Market Analysis and Trends
Consumer Goods
Examines how the COVID-19 pandemic has affected the reputation of consumer companies and identifies key areas for future engagement and public concerns.
COVID-19 impact, consumer companies, reputation, future engagement, public concerns
false
Market Analysis and Trends
Consumer Goods
Multiple Chart
Deloitte
Add to my slides
Remove from favorites
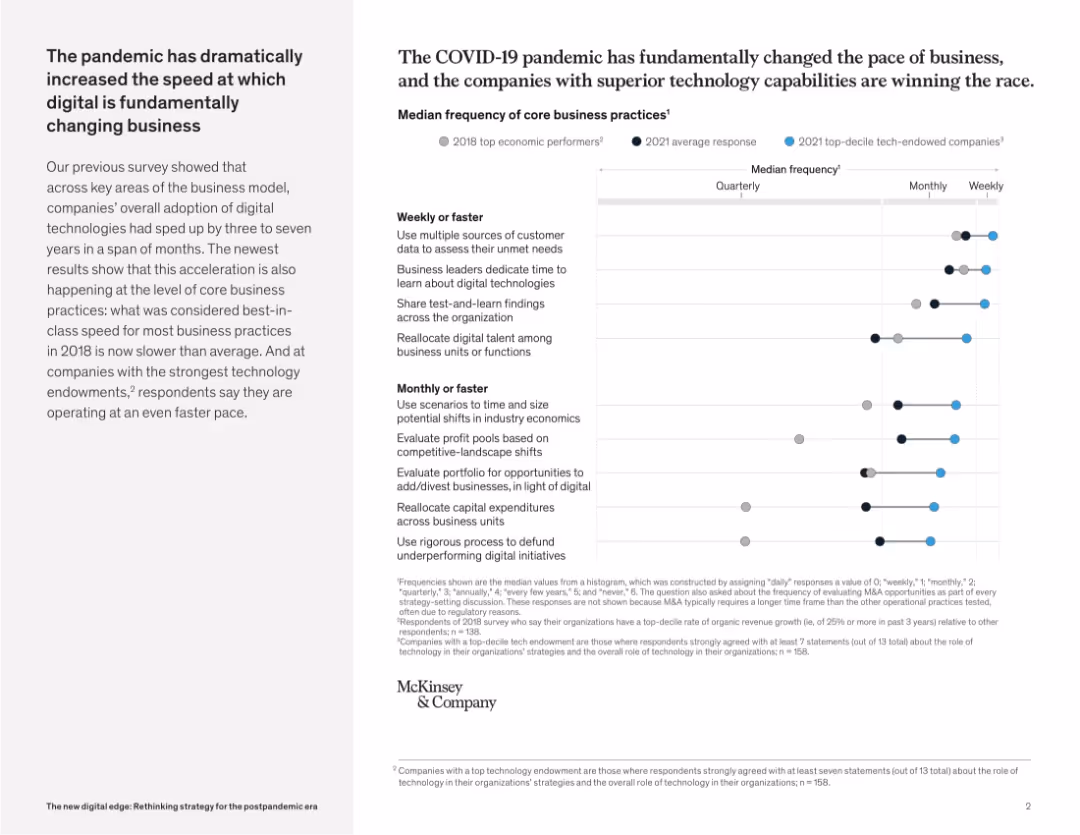
Right-heavy layout featuring dot plot chart comparing 2018 vs 2021 business process frequency across tech-maturity tiers. Left side contains narrative.
Market Analysis and Trends
Technology & Software
This slide demonstrates how COVID-19 accelerated digital transformation, especially in companies with strong tech capabilities. Business practices that were monthly in 2018 are now performed weekly, indicating a dramatic pace shift.
COVID-19 impact, digital acceleration, core processes, business transformation, tech capabilities, pace of change, pandemic disruption
false
Market Analysis and Trends
Technology & Software
Mixed Chart
McKinsey
Add to my slides
Remove from favorites
Featuring a vertical bar graph, this slide depicts the timeline of COVID-19's impact on the US economy. Accompanying text boxes provide additional insights into investors' perspectives.
Market Analysis and Trends
Financial Services
Presents investors' beliefs on the diminishing economic impact of COVID-19, relevant for assessing market risks and investment approaches.
COVID-19 Impact, Economic Analysis, Investor Beliefs, Risk Assessment, Market Sentiment, Investment Decisions, Economic Recovery, Pandemic Effects, Health Crisis, Investment Strategies
false
Market Analysis and Trends
Financial Services
Single Chart
BCG
Add to my slides
Remove from favorites
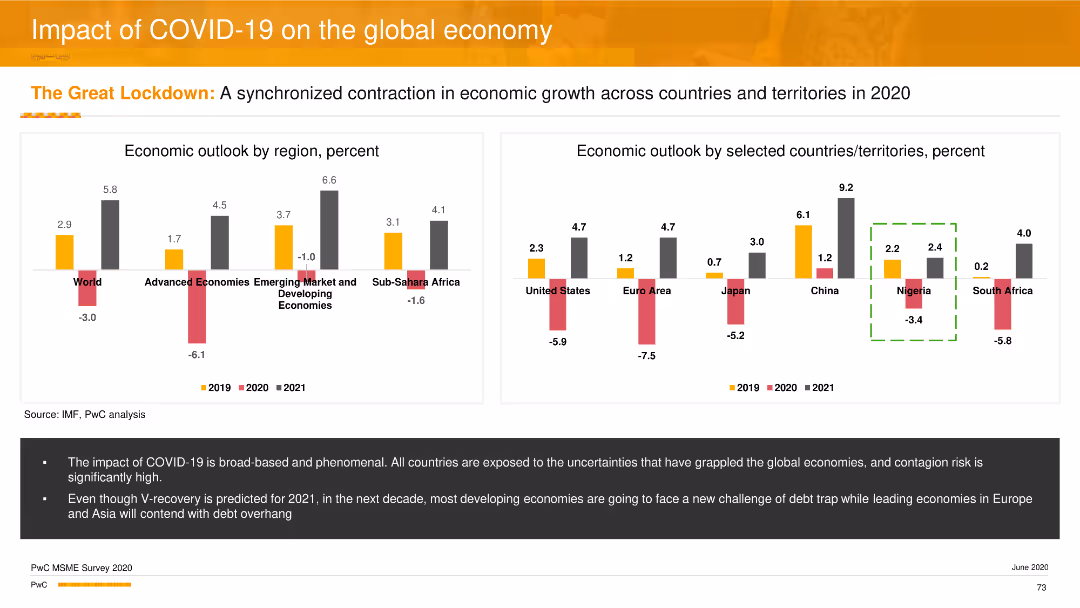
Two column charts showing the economic outlook by region and by selected countries for 2019, 2020, and 2021, highlighting the contraction due to COVID-19. Orange, grey, and black bars represent different years.
Risk Assessment and Management
Professional Services
This slide assesses the economic impact of COVID-19 globally, showing a synchronized contraction in economic growth across various regions and countries, with predictions for recovery in 2021.
COVID-19 impact, economic outlook, global economy, professional services, column chart
false
Risk Assessment and Management
Professional Services
Multiple Chart
PwC/Strategy&
Add to my slides
Remove from favorites
A column chart showing employment losses in the first six months of 2020 across various Canadian metropolitan areas, highlighting the significant impact on Metro Vancouver.
Market Analysis and Trends
Professional Services
This slide presents the economic impact of COVID-19, focusing on employment losses in Canadian metropolitan areas, with a spotlight on the severe impact on Metro Vancouver.
COVID-19 impact, employment losses, Metro Vancouver, Canada
false
Market Analysis and Trends
Professional Services
Single Chart
Deloitte
Add to my slides
Remove from favorites
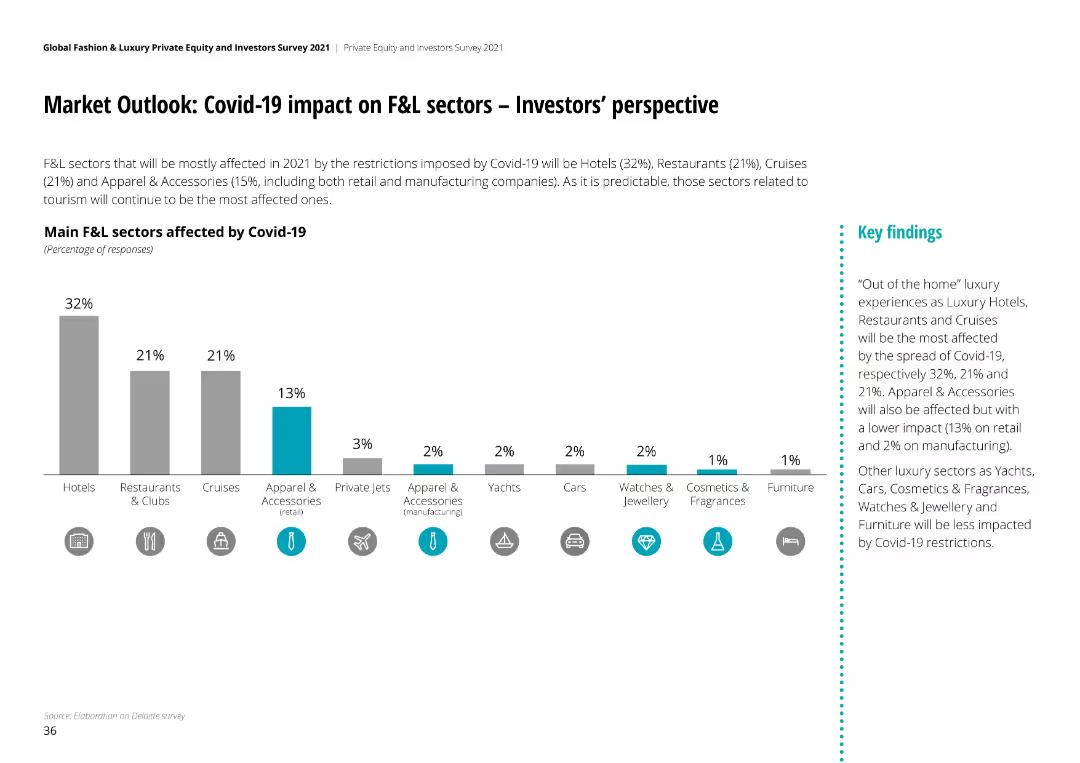
Column chart showing percentage of F&L sectors affected by Covid-19, with Hotels, Restaurants, and Cruises being the most affected, followed by other sectors.
Risk Assessment and Management
Financial Services
The slide details the sectors most impacted by Covid-19, with Hotels (32%), Restaurants (21%), and Cruises (21%) being the hardest hit. Apparel & Accessories follow.
Covid-19 impact, F&L sectors, investor perspective, sector analysis, pandemic effects
false
Risk Assessment and Management
Financial Services
Mixed Chart
Deloitte
Add to my slides
Remove from favorites
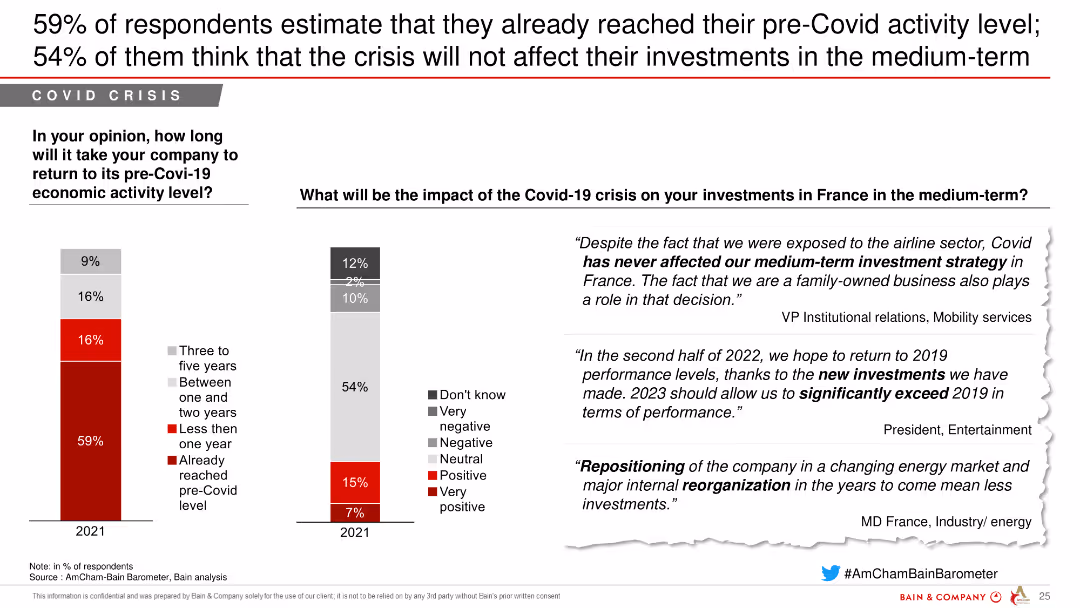
This slide contains column charts depicting the expected duration to return to pre-Covid economic levels and the projected impact of the Covid-19 crisis on medium-term investments in France.
Risk Assessment and Management
Healthcare & Pharmaceuticals
The slide assesses the impact of the Covid-19 crisis on investments in France, including the duration to return to pre-Covid levels and the overall medium-term outlook of respondents.
Covid-19, impact, investments, France, economic levels, crisis, healthcare, pharmaceuticals
false
Risk Assessment and Management
Healthcare & Pharmaceuticals
Multiple Chart
Bain
Add to my slides
Remove from favorites
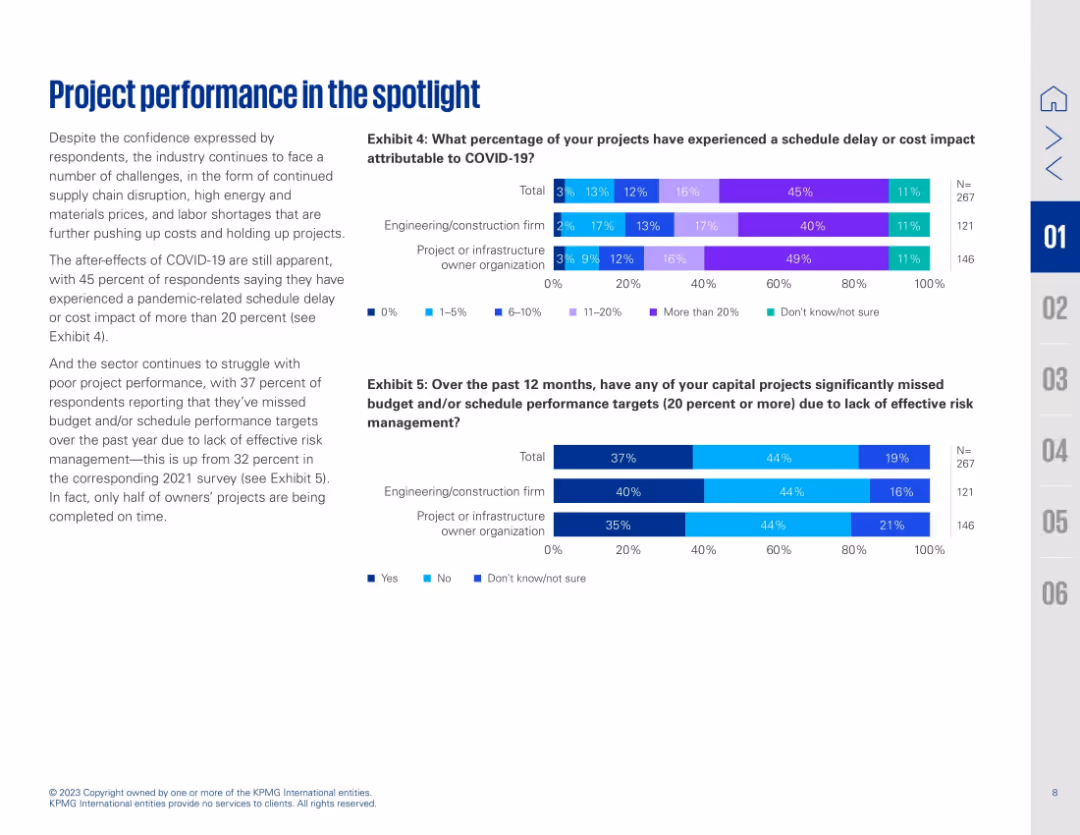
Two-column layout with text on the left and two horizontal bar charts on the right (Exhibits 4 & 5). Blue and purple gradient bars represent survey percentages.
Performance Metrics and KPIs
Real Estate & Construction
Highlights how COVID-19 continues to impact project performance, with many projects experiencing delays or cost increases. Exhibit 4 shows the extent of COVID-related schedule delays, while Exhibit 5 reveals that 37% of projects missed targets due to ineffective risk management. The slide emphasizes ongoing struggles in project delivery despite some return to confidence post-pandemic.
COVID-19 impact, project delay, cost overrun, risk management, schedule, survey data, construction, performance issues, engineering, metrics
false
Performance Metrics and KPIs
Real Estate & Construction
Multiple Chart
KPMG
Add to my slides
Remove from favorites
Bar chart showing the percentage of companies experiencing various degrees of revenue impact due to COVID-19.
Risk Assessment and Management
Professional Services
This slide details the financial impact of COVID-19 on companies, highlighting different extents of revenue decreases and increases.
COVID-19 impact, revenue changes, company performance, financial risk
false
Risk Assessment and Management
Professional Services
Single Chart
PwC/Strategy&
Add to my slides
Remove from favorites
The slide has a title at the top, text in the middle, and a column chart at the bottom illustrating COVID-19 impact on respondents.
Risk Assessment and Management
Healthcare & Pharmaceuticals
Presents data on COVID-19 impact, showing that 33% of respondents had COVID-19 or knew someone who had. Data is categorized by relationships such as family members and friends.
COVID-19, Impact, Survey, Health, Data
false
Risk Assessment and Management
Healthcare & Pharmaceuticals
Single Chart
IPSOS
Add to my slides
Remove from favorites
Previous
Next
You don't have any favorites yet.
Please wait loading your favorites slides...
Create a FREE account to continue browsing
Receive Instant Access to 1,000+ slides from companies like McKinsey, Google, and Goldman Sachs
First Name
Last Name
Email
Password
I agree to all
Terms & Privacy Policy
Thank you! Your submission has been received!
Oops! Something went wrong while submitting the form.
Have an account?
Sign in
Upgrade to PRO to Save slides
Advanced Search and Filters
Access to 15,000+ slides
Access to Category Pages
Save/Bookmark Slides
PowerPoint Template Library
Pick a Plan
MONTHLY
$12/month
Billed every month, Cancel anytime.
YEARLY
$9/year
Billed $108 annually, Cancel anytime.
Checkout for $12/month
Checkout for $108/yr
Secured by Stripe | AES-256 bit encryption


![[Country] is in decline](https://cdn.prod.website-files.com/654e70fb59937215cac87b19/6899bd2cb729b6bf115e8c68_nKBIWqbk_PqjoIb92MCay5JTPTHPMlp7bf8lVyQtNSg.avif)