My Account
My Slides
Search by Category
Companies
Slide Type
Use Case
Industry
Pricing
Templates
View All Templates
Download Template Slides
✦ AI
AI Prompt Library
AI Search
Feedback
Login
Logout
Get Started
Browse all Slides
Browse all Slides
Create a FREE Account
Instant access to 1,000+ real slides from top companies like McKinsey, BCG, Goldman Sachs, Google and many more!
First Name
Last Name
Email
Password
I agree to all
Terms & Privacy Policy
Thank you! Your submission has been received!
Oops! Something went wrong while submitting the form.
Have an account?
Sign in
Saved Slides
Total No. of slides saved
0
↻ Refresh
✖ Clear all
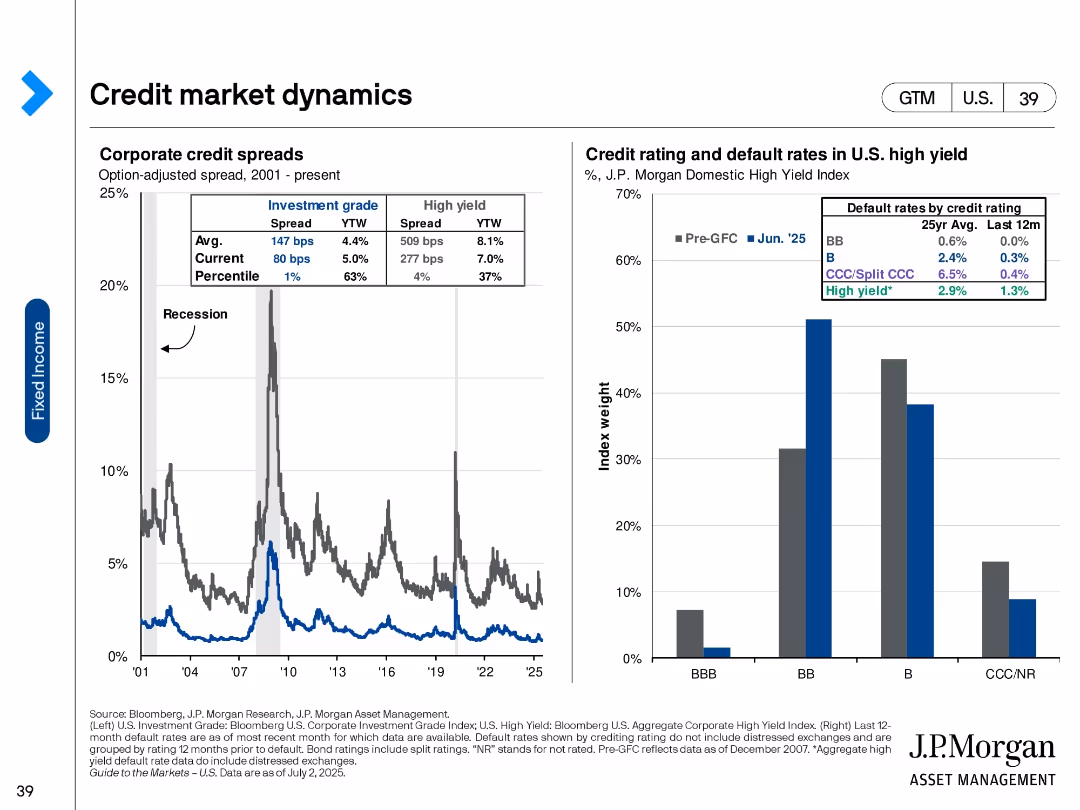
Dual-panel with time-series chart of corporate credit spreads and bar chart of credit ratings and default rates.
Risk Assessment and Management
Financial Services
This slide analyzes corporate credit market dynamics by showing credit spreads and default rates segmented by credit ratings. It reflects the historical and current spreads for investment-grade and high-yield bonds, along with recent default data.
Credit spreads, defaults, high yield, investment grade, corporate bonds, credit ratings, recession risk, financial risk, fixed income
false
Risk Assessment and Management
Financial Services
Multiple Chart
JP Morgan
Add to my slides
Remove from favorites
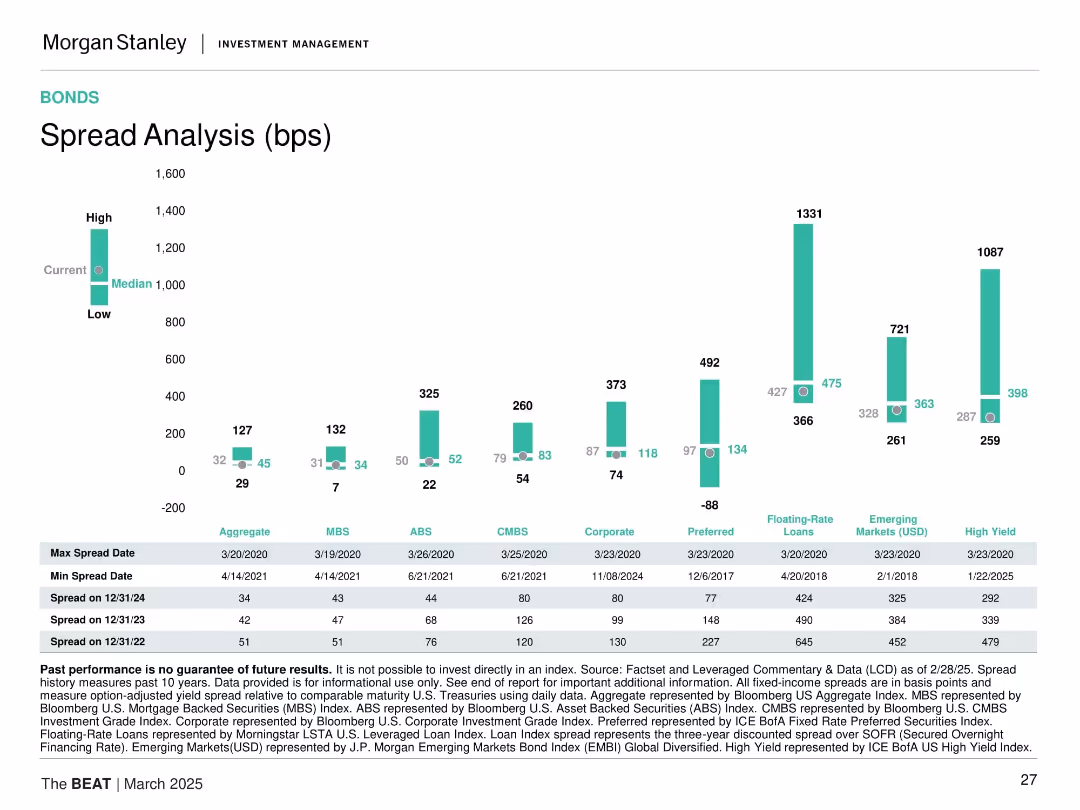
Vertical bar chart showing high/median/low spreads for different bond sectors. Categories like ABS, MBS, CMBS, High Yield, etc. are color-coded. Table below gives historical context.
Risk Assessment and Management
Financial Services
This slide examines credit spreads across major fixed income sectors, comparing current levels to historical ranges. It emphasizes widening spreads in high-yield and emerging market debt, highlighting potential risk and return opportunities across credit markets.
credit spreads, risk premium, ABS, MBS, high yield, emerging markets, fixed income, bond market, risk management
false
Risk Assessment and Management
Financial Services
Mixed Chart
Morgan Stanley
Add to my slides
Remove from favorites
The slide features a line chart comparing the share prices of Credit Suisse and European banks index from Jan 2021 to Apr 2023. Annotations highlight significant drops. The textbox discusses corporate implications of the Credit Suisse crisis and market competition changes.
Risk Assessment and Management
Financial Services
This slide outlines the structural and idiosyncratic issues leading to Credit Suisse's crisis, emphasizing broader repercussions for Swiss and European banking systems. It includes implications for corporates, such as reduced competition and renewed focus on treasury operations.
Credit Suisse, fallout, European banks, share prices, market competition, banking crisis, structural issues, corporate implications, treasury operations, risk
false
Risk Assessment and Management
Financial Services
Mixed Chart
Accenture
Add to my slides
Remove from favorites
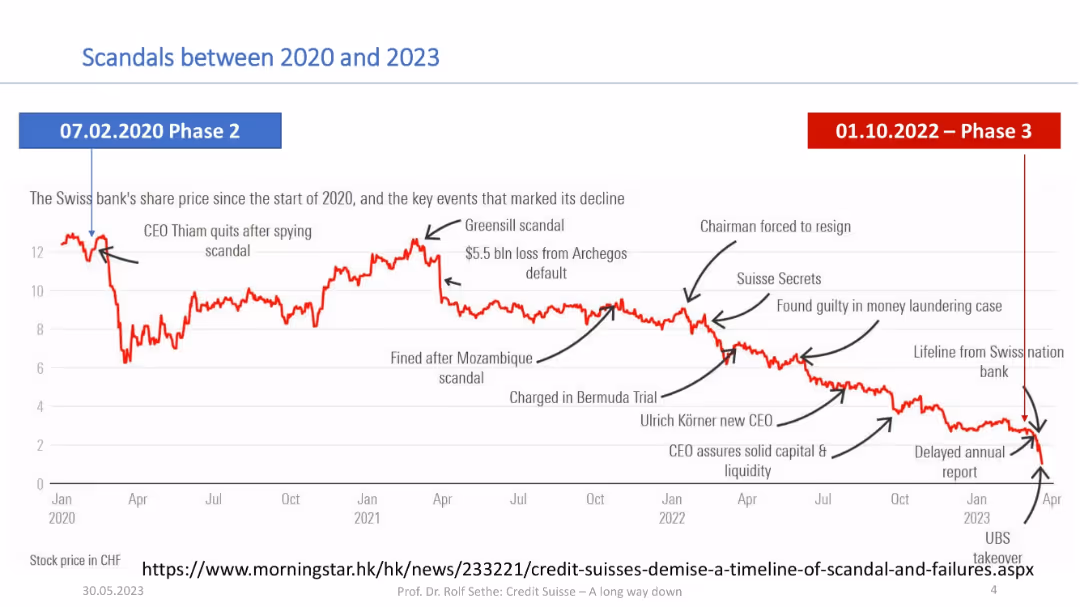
Timeline chart showing Credit Suisse stock decline from 2020–2023 with annotated scandal events; clean white/red/blue design.
Risk Assessment and Management
Financial Services
The slide highlights the steep drop in Credit Suisse’s share price from 2020 to 2023, annotated with major scandals and governance issues (e.g., Greensill, Archegos, Mozambique). It visually links reputational events to the stock’s deterioration.
Credit Suisse, scandals, Greensill, Archegos, share decline, timeline, UBS takeover, reputational risk
false
Risk Assessment and Management
Financial Services
Single Chart
Credit Suisse
Add to my slides
Remove from favorites
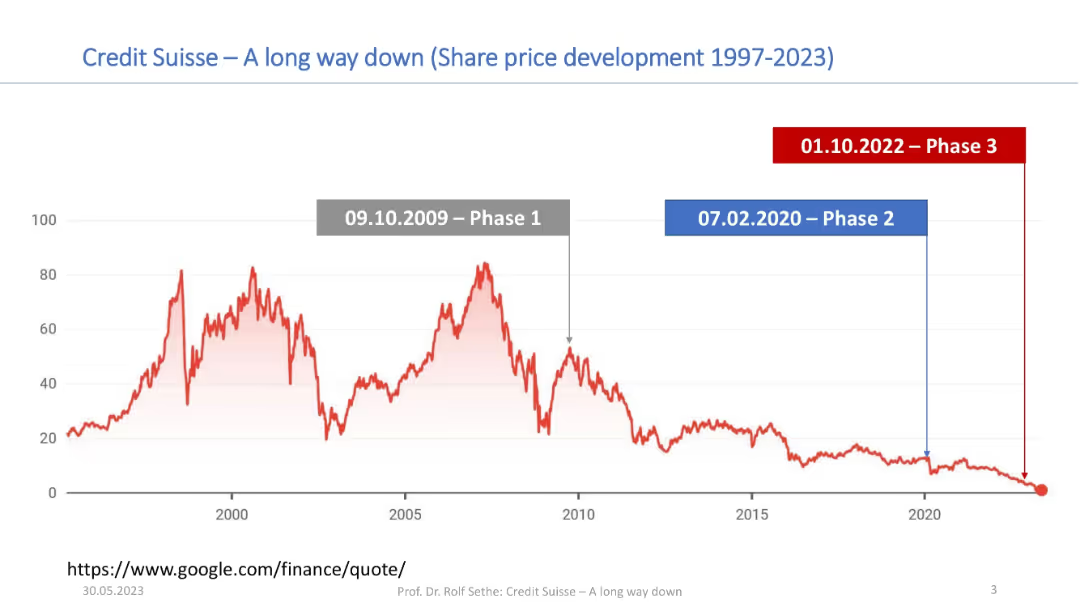
Long-term line graph (1997–2023) of Credit Suisse’s share price; three key decline phases marked by colored banners.
Market Analysis and Trends
Financial Services
A historical stock chart for Credit Suisse tracks its share price decline from 1997 to 2023, marked in three distinct phases. Major peaks and subsequent collapses are highlighted to show long-term performance trends leading to the firm’s downfall.
Credit Suisse, stock price, share performance, decline, phases, timeline, 1997–2023, financial history
false
Market Analysis and Trends
Financial Services
Single Chart
Credit Suisse
Add to my slides
Remove from favorites
This slide is highly detailed, containing both textual information and multiple graphical elements. There's a pie chart detailing commercial portfolio balances by industry, a column chart comparing CRE as a percentage of total loans, and a small table with key statistics about office CRE. The color scheme is blue and green, with the graphs clearly labeled and information bullet-pointed for clarity.
Financial Performance
Financial Services
The slide presents a disciplined client selection strategy and a well-diversified commercial portfolio. It's aimed at showcasing strong credit results through economic cycles, indicating a conservative approach to commercial real estate concentration among peers and a stable criticized asset ratio. Intended to convey the company’s robust underwriting standards and focused banking coverage.
Credit, Underwriting, Portfolio, CRE, Diversification, Strategy, Risk, Financial Stability, Commercial Banking, Asset Ratio
false
Financial Performance
Financial Services
Multiple Chart
Morgan Stanley
Add to my slides
Remove from favorites
This slide provides a line graph and two column charts, depicting unemployment rate forecasts and firmwide allowance for credit losses. The graphics are in shades of blue, and the line graph includes a forecast line with marked points. The column charts compare figures from different years with a pre-pandemic average, using clear color differentiation to enhance readability.
Risk Assessment and Management
Financial Services
Analyzing the unemployment rate forecast and allowance for credit losses, Slide 17 communicates JPMorgan's prudent financial reserves in anticipation of credit normalization and economic changes expected through the year.
Credit, Unemployment, Forecast, Allowance, Losses, Financial Reserves, Normalization, Pandemic Comparison
false
Risk Assessment and Management
Financial Services
Multiple Chart
JP Morgan
Add to my slides
Remove from favorites
A dual-axis line chart shows the percentage of banks tightening lending standards over time, contrasting US and Eurozone conditions. The slide background is white with grey recession markers.
Risk Assessment and Management
Financial Services
The slide compares credit conditions between the US and Eurozone, highlighting the risks associated with tighter lending standards. It is used to convey the potential impacts on financial stability and market conditions, likely serving as a risk assessment tool for investors or policy-makers.
Credit, US, Eurozone, Banks, Lending, Risk, Recession, Standards, 2023
false
Risk Assessment and Management
Financial Services
Multiple Chart
JP Morgan
Add to my slides
Remove from favorites
The slide features a column chart showing IWM credit volume in CHF bn across different sectors and key risk metrics like investment grade credit exposure and secured loans. Bullet points provide additional insights into the portfolio composition.
Financial Performance
Financial Services
The slide offers an overview of the credit volume portfolio, highlighting the distribution across various sectors like export finance and real estate. It details risk metrics, emphasizing secured loans and the proportion of investment-grade exposure.
credit volume, portfolio, risk metrics, secured loans, investment grade
false
Financial Performance
Financial Services
Mixed Chart
Credit Suisse
Add to my slides
Remove from favorites
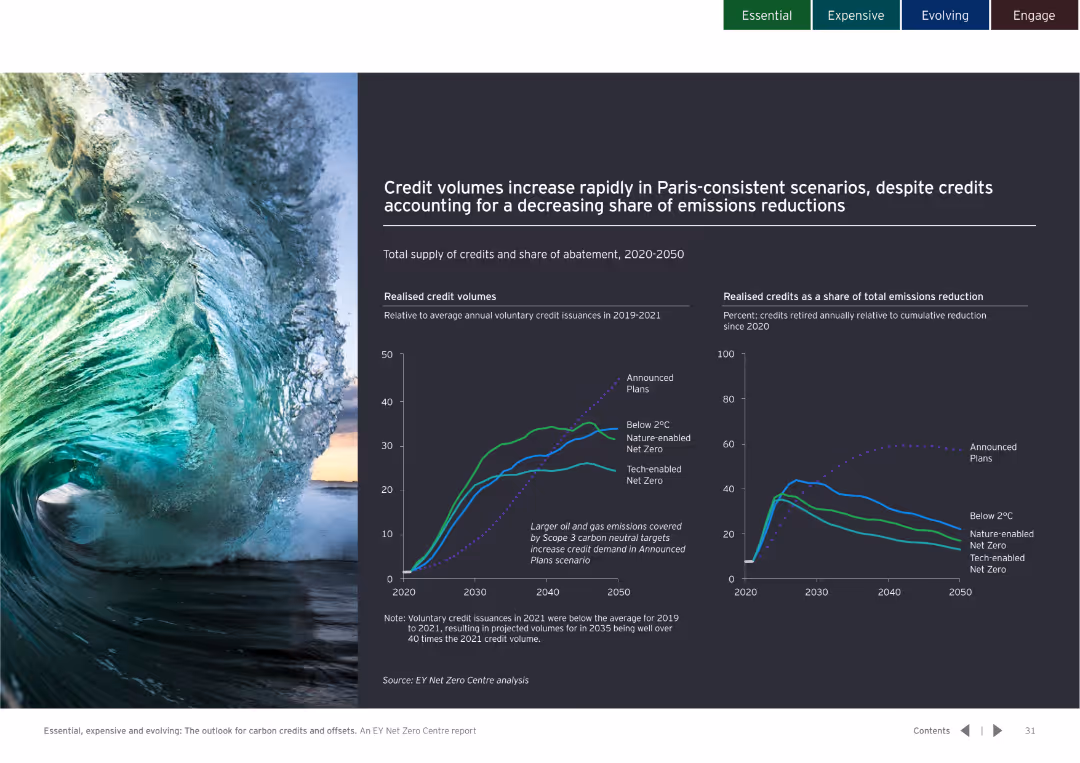
Dark background with two line graphs depicting credit volumes and share of emissions reduction over time. Text explains trends and implications.
Market Analysis and Trends
Environmental Services & Sustainability
Examines the rapid increase in credit volumes under different scenarios and the decreasing share of emissions reductions from credits.
credit volumes, emissions reduction, Paris agreement
false
Market Analysis and Trends
Environmental Services & Sustainability
Multiple Chart
EY
Add to my slides
Remove from favorites
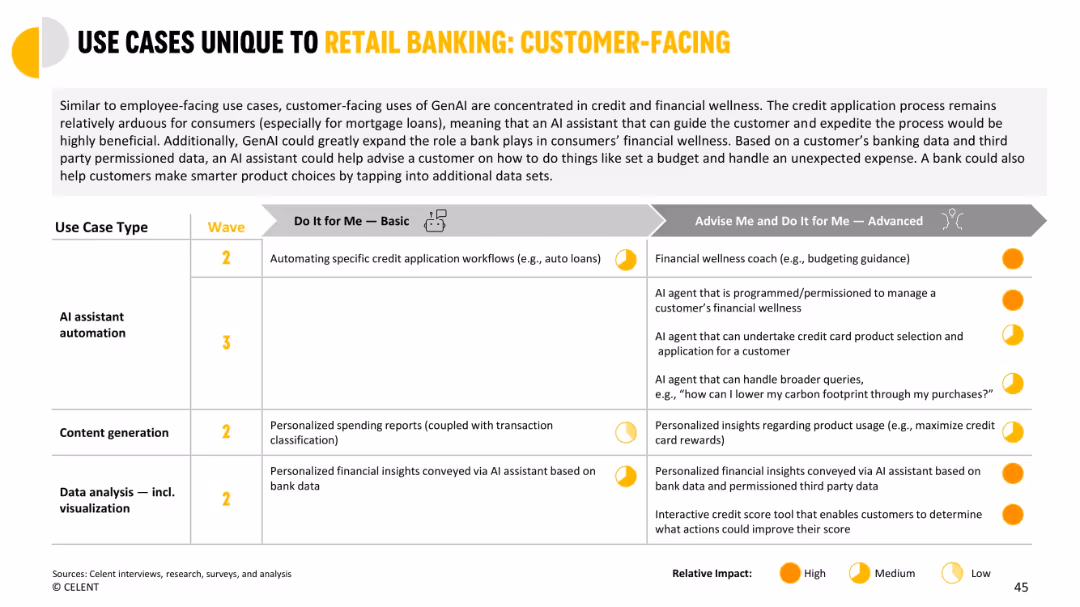
Split table showing customer-facing use cases mapped to waves and impact categories across functions.
Customer and Market Segmentation
Financial Services
Shows GenAI applications for guiding consumers in credit workflows and financial wellness. Includes personalized insights, automated assistance, and financial coaching, progressing from simple automation to fully autonomous AI agents.
credit workflow, customer-facing, personalization, insights, automation, financial coach
false
Customer and Market Segmentation
Financial Services
Mixed Chart
Oliver Wyman
Add to my slides
Remove from favorites
The slide is text-heavy, highlighting key financial and business achievements with bullet points, such as 'History of Strong Operating Performance & Investment Grade Credit Metrics'. It has a blue and white color scheme with bold headings for each section.
Financial Performance
Financial Services
This slide provides an overview of the company's creditworthiness, showcasing diverse revenue streams, strong management, and robust financial metrics. Aimed at investors or stakeholders for evaluating the company's operational success and strategic direction.
creditworthiness, revenue, EBITDA, management, growth
false
Financial Performance
Financial Services
Table
Goldman Sachs
Add to my slides
Remove from favorites
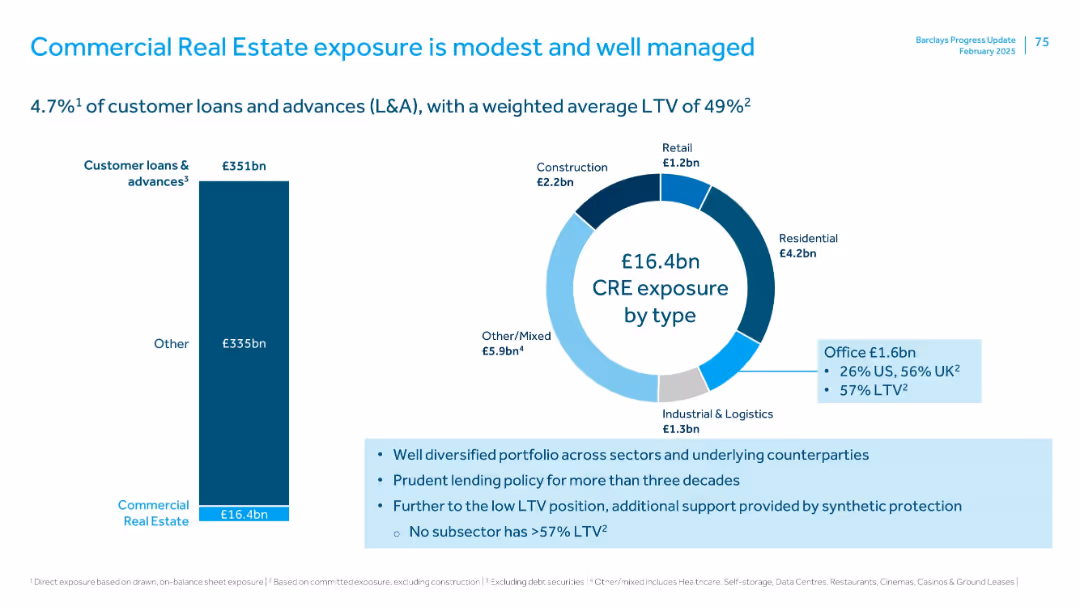
Two-panel layout with bar chart on the left and a donut chart on the right. Text box summary beneath with bullet points. Barclays branding.
Risk Assessment and Management
Financial Services
Highlights that CRE exposure accounts for 4.7% of customer loans and is well diversified. A breakdown of exposure by property type is shown. Notes low LTV ratios and synthetic protection as risk mitigation.
CRE, exposure, LTV, property type, diversification, risk, office, loans
false
Risk Assessment and Management
Financial Services
Multiple Chart
Barclays
Add to my slides
Remove from favorites
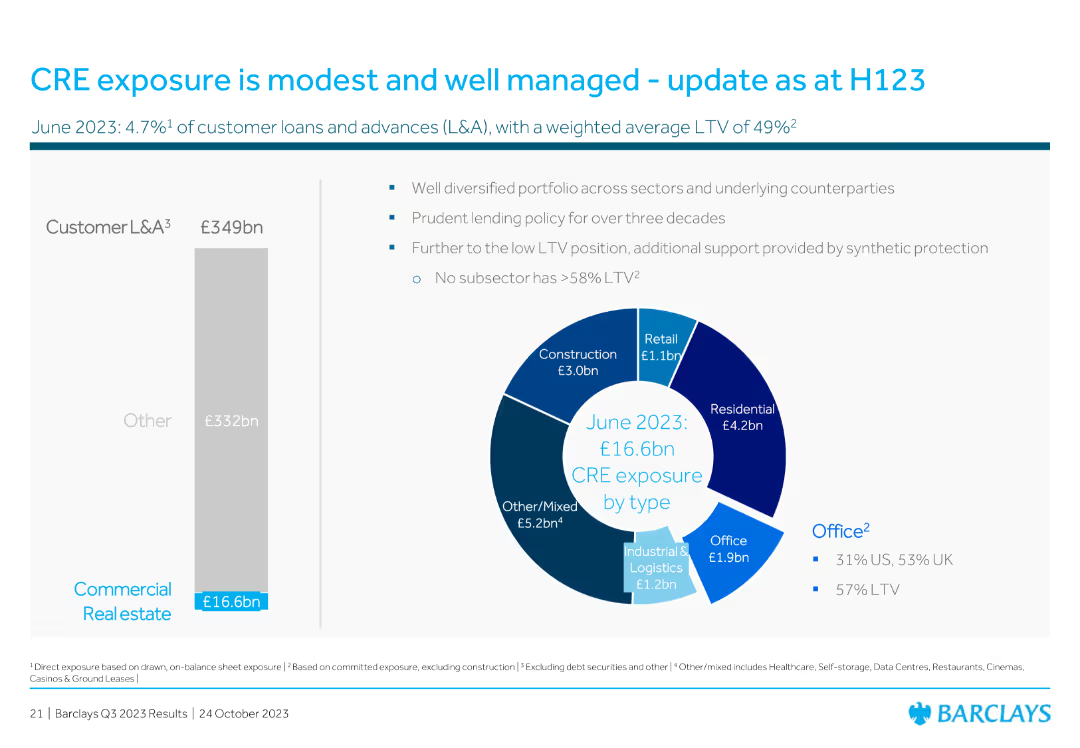
Features a pie chart illustrating CRE exposure by type and a vertical bar chart showing customer loans and advances. The layout is straightforward and data-centric.
Risk Assessment and Management
Real Estate & Construction
The slide discusses the modest and well-managed exposure to Commercial Real Estate (CRE), with detailed breakdowns of exposure types and prudent lending policies.
CRE, exposure, real estate, customer loans, advances, prudent lending, portfolio, diversification
false
Risk Assessment and Management
Real Estate & Construction
Multiple Chart
Barclays
Add to my slides
Remove from favorites
Featuring pie charts and a vertical column chart, this slide visualizes the CRE portfolio by region and sector, and investment exposures by type. The design is straightforward, using different colors for various categories.
Investment Analysis
Real Estate & Construction
This slide details the distribution and risk management of a commercial real estate portfolio, emphasizing geographic diversity and sponsorship strength. It's particularly useful for discussions on sector-specific investments and risk assessments in real estate markets.
CRE, investment, real estate, risk management
false
Investment Analysis
Real Estate & Construction
Multiple Chart
Deutsche Bank
Add to my slides
Remove from favorites
Includes pie charts and a column chart showcasing types of real estate and financial risk assessments. Detailed annotations aid in understanding.
Investment Analysis
Real Estate & Construction
Further analysis of the CRE investment risks and modifications for loan recovery, important for strategic real estate management.
CRE, investment risks, loan management, real estate, strategic planning
false
Investment Analysis
Real Estate & Construction
Multiple Chart
Deutsche Bank
Add to my slides
Remove from favorites
The slide features multiple icon-based indicators representing key business aspects, such as lending, investment, and innovation, accompanied by column charts reflecting loan origination metrics. Layout is well-organized with a clear division between text and graphical data.
Financial Performance
Financial Services
This slide discusses JPMorgan's strategic positioning in commercial real estate, emphasizing innovations and results in loan processing speed and investments.
CRE, lending, innovation, real estate, performance, investment, transparency, risk management, digital delivery
false
Financial Performance
Financial Services
Mixed Chart
JP Morgan
Add to my slides
Remove from favorites
Features three columns consisting of bullet points and pie charts, alongside text boxes outlining key financial data.
Risk Assessment and Management
Real Estate & Construction
Details the focus portfolio of non-recourse CRE lending with breakdowns by sectors such as office, hotels, and residential.
CRE lending, portfolio, real estate sectors, financial analysis
false
Risk Assessment and Management
Real Estate & Construction
Multiple Chart
Deutsche Bank
Add to my slides
Remove from favorites
This slide offers a mix of pie charts and bar charts, showcasing the CRE portfolio distribution by loan type and region, including specific risk assessments and loan values. Also includes textual data points on risk strategies and regional distributions.
Risk Assessment and Management
Real Estate & Construction
Focuses on the commercial real estate loan portfolio, analyzing risk distribution and loan values across different regions and types. Useful for real estate investment risk management and strategic planning, providing insights into market conditions and potential stress scenarios.
CRE, loan distribution, risk management, real estate, regional analysis, loan values, stress scenarios
false
Risk Assessment and Management
Real Estate & Construction
Multiple Chart
Deutsche Bank
Add to my slides
Remove from favorites
Showcases a pie chart for the CRE portfolio by asset class and a line chart for CRE net charge-offs, along with textual commentary on market trends and risk management.
Risk Assessment and Management
Financial Services
Assesses the CRE loan portfolio's risk approach, emphasizing credit performance, loan quality, and focused asset class strategy, considering market trends and interest rate effects.
CRE, loan portfolio, risk discipline, JPMC, credit performance, loan quality, asset class strategy, market trends
false
Risk Assessment and Management
Financial Services
Multiple Chart
JP Morgan
Add to my slides
Remove from favorites
This slide includes pie charts and bar charts showing the CRE loan risk management and CLPs per quarter, with key highlights on stress tests.
Financial Performance
Financial Services
It discusses the management of Deutsche Bank's CRE loans, including stress test outcomes and risk management strategies for US CRE.
CRE, loan risk management, CLPs, stress test, risk strategies, US CRE, Deutsche Bank
false
Financial Performance
Financial Services
Multiple Chart
Deutsche Bank
Add to my slides
Remove from favorites
The slide has a large pie chart, a table, and bullet point highlights, under a clear title. It has a moderate design complexity, focusing on specific data sets.
Investment Analysis
Financial Services
It details the commercial real estate loan portfolio, highlighting distribution and investment grades. Used for detailed market analysis in real estate, to inform investment decisions, or to present to stakeholders regarding property portfolio status.
CRE Loans, Investment Grade, Office Properties, Net Charge-Off Ratio
false
Investment Analysis
Financial Services
Mixed Chart
Goldman Sachs
Add to my slides
Remove from favorites
This slide includes pie charts, a small table, and a text section outlining CRE loan details.
Financial Performance
Real Estate & Construction
Analyzes commercial real estate loan segments and associated investment data, likely used in real estate market analysis or investment strategy sessions.
CRE, Loans, Investment Grade, Real Estate Analysis
false
Financial Performance
Real Estate & Construction
Mixed Chart
Goldman Sachs
Add to my slides
Remove from favorites
Slide includes pie charts and a column chart representing CRE loan distribution by region and sector, accompanied by key risk management strategies.
Investment Analysis
Real Estate & Construction
Focuses on the bank's commercial real estate portfolio, analyzing loan distribution and discussing risk mitigation in real estate investments.
CRE, loans, risk management, real estate
false
Investment Analysis
Real Estate & Construction
Multiple Chart
Deutsche Bank
Add to my slides
Remove from favorites
Contains pie charts for CRE stress test results, column charts for loan modifications, and textual annotations.
Market Analysis and Trends
Financial Services
Details the scope of CRE under stress tests, loan risk management, and quarter-over-quarter changes in CRE loans and credit loss provisions. Used for financial trend analysis and risk management.
CRE, loans, stress test, risk management, Q3 2023
false
Market Analysis and Trends
Financial Services
Multiple Chart
Deutsche Bank
Add to my slides
Remove from favorites
Split into two halves: left side has a text box with bullet points and headers, right side includes four donut charts showing loan data breakdowns by region and sector.
Risk Assessment and Management
Financial Services
Details Deutsche Bank’s €37bn CRE non-recourse portfolio, with breakdowns by loan category and LTVs. It highlights stress-tested loans (€30bn), regions (US, EU, APAC), and sectors (office, retail, hospitality). Emphasizes credit loss provisions and stress testing.
CRE, LTV, Stress Test, Loan Breakdown, Region, Sector, Office, EU, US
false
Risk Assessment and Management
Financial Services
Mixed Chart
Deutsche Bank
Add to my slides
Remove from favorites
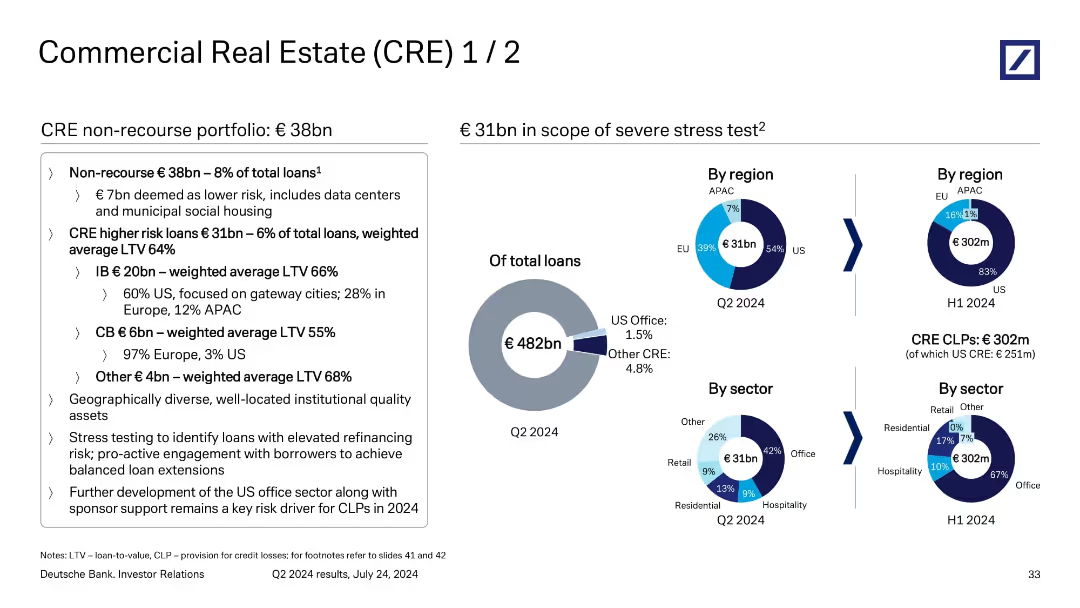
Balanced layout: text analysis on left, three donut/pie charts on right showing geographic and sector exposure to CRE loans.
Investment Analysis
Financial Services
The slide outlines Deutsche Bank’s €38bn non-recourse CRE loan portfolio, breaking down higher-risk segments by region and sector. It highlights a €31bn subset exposed to severe stress test conditions and discusses risk concentrations in the US office market. It also quantifies provisions (CLPs) related to CRE in H1 2024.
CRE, non-recourse loans, US office risk, CLPs, stress testing
false
Investment Analysis
Financial Services
Mixed Chart
Deutsche Bank
Add to my slides
Remove from favorites
The slide includes pie charts showing the CRE portfolio's regional and sectoral distribution. It also details the non-recourse portfolio and higher risk loans with weighted average LTVs.
Risk Assessment and Management
Real Estate & Construction
Details the composition and risk profile of the CRE portfolio, including non-recourse and higher risk loans. It highlights geographical and sectoral diversification and weighted average loan-to-value ratios, indicating the bank's exposure and risk management in CRE.
CRE, non-recourse, LTV, portfolio distribution, risk management
false
Risk Assessment and Management
Real Estate & Construction
Multiple Chart
Deutsche Bank
Add to my slides
Remove from favorites
Multiple donut charts showing CRE stress testing exposure by region and sector; text box outlines risk mitigation and portfolio quality.
Risk Assessment and Management
Financial Services
Covers Deutsche Bank’s €37bn non-recourse CRE portfolio, with €30bn in stress testing. Portfolio is diversified by region and sector, with most risk in US office segment. Stress testing identifies refinancing risk, and Q3 2024 CRE CLPs total €409m, largely driven by US office exposure.
CRE, non-recourse, stress testing, US office, CLPs, risk, Deutsche Bank, Q3 2024
false
Risk Assessment and Management
Financial Services
Mixed Chart
Deutsche Bank
Add to my slides
Remove from favorites
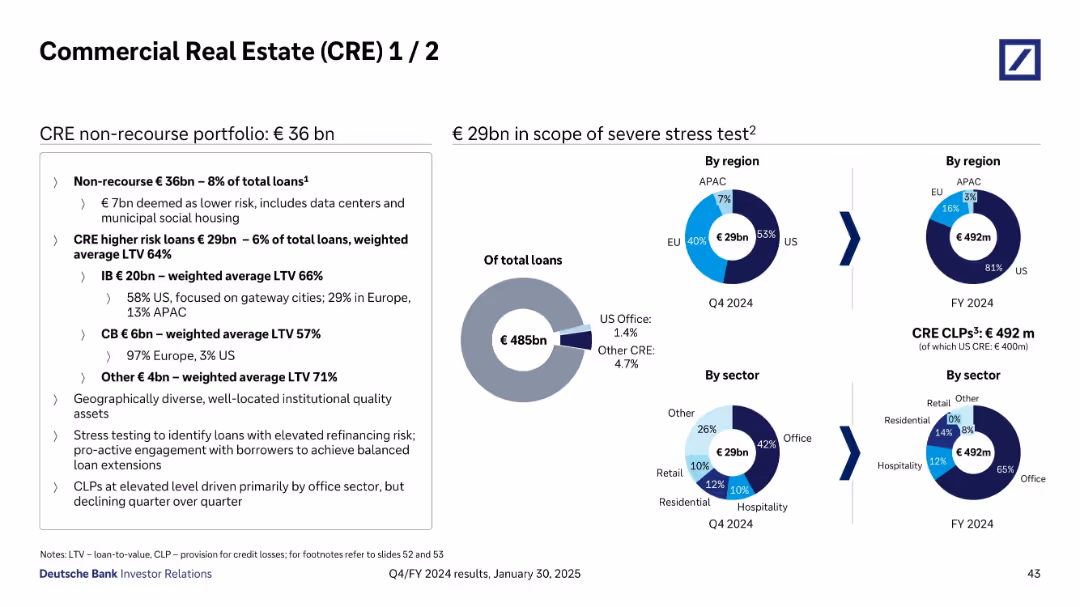
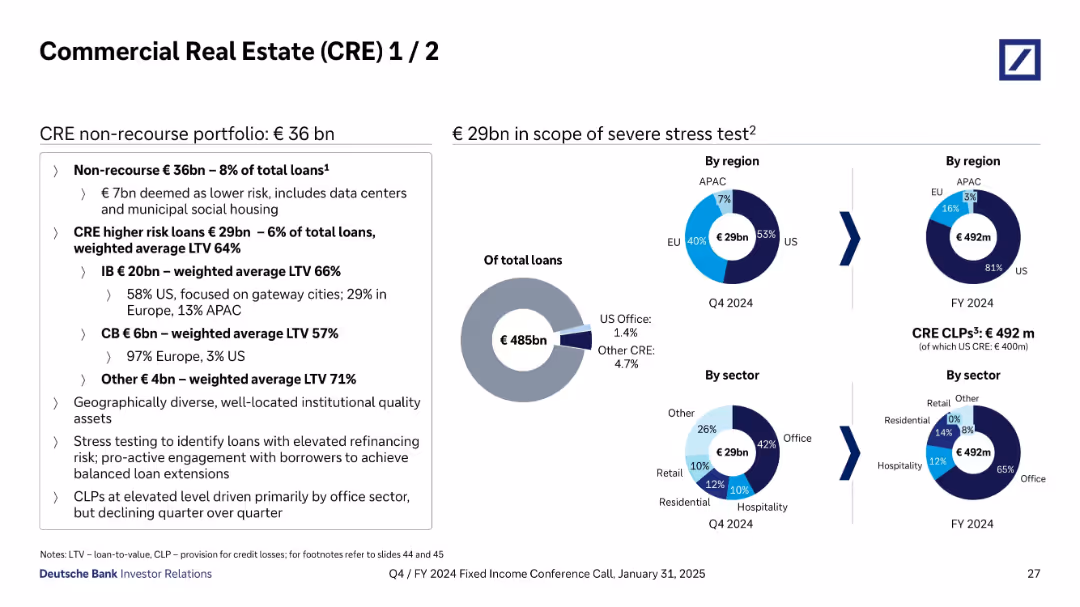
Infographic layout with CRE loan portfolio breakdown by region and sector; left side text box outlines portfolio quality and LTV statistics
Investment Analysis
Financial Services
Focuses on the €36bn non-recourse CRE portfolio, with €29bn undergoing stress tests. Breakdowns show regional and sectoral exposure, especially to US offices. Weighted average LTVs and CLPs are included, with comments on stress testing, refinancing risks, and borrower engagement strategies.
CRE, non-recourse, stress test, US office, LTV, portfolio exposure
false
Investment Analysis
Financial Services
Mixed Chart
Deutsche Bank
Add to my slides
Remove from favorites
A scatter plot dominates the slide, comparing the CRE criticized asset ratio to other peers, paired with a detailed trend analysis table. The design is clean, with a blue and white theme, and includes textual explanations.
Market Analysis and Trends
Financial Services
Analyzes the bank's commercial real estate portfolio in relation to its peers, with a focus on criticized asset ratios and trends over recent years.
CRE portfolio, commercial real estate, asset ratios, peer comparison, trends
false
Market Analysis and Trends
Financial Services
Mixed Chart
Goldman Sachs
Add to my slides
Remove from favorites
Features multiple pie charts and lists detailing the composition and risk assessment of commercial real estate loans.
Risk Assessment and Management
Real Estate & Construction
Dedicated to commercial real estate (CRE) loan analysis, this slide provides detailed insights into loan values, risk categories, and geographic distribution. It is tailored for real estate investors, financial analysts, and risk managers, focusing on assessing the risk profile, market trends, and financial health of the CRE portfolio. It also includes data on non-recourse loans and exposure under stress test conditions.
CRE, Risk Assessment, Real Estate Investment, Loan Analysis, Stress Testing
false
Risk Assessment and Management
Real Estate & Construction
Multiple Chart
Deutsche Bank
Add to my slides
Remove from favorites
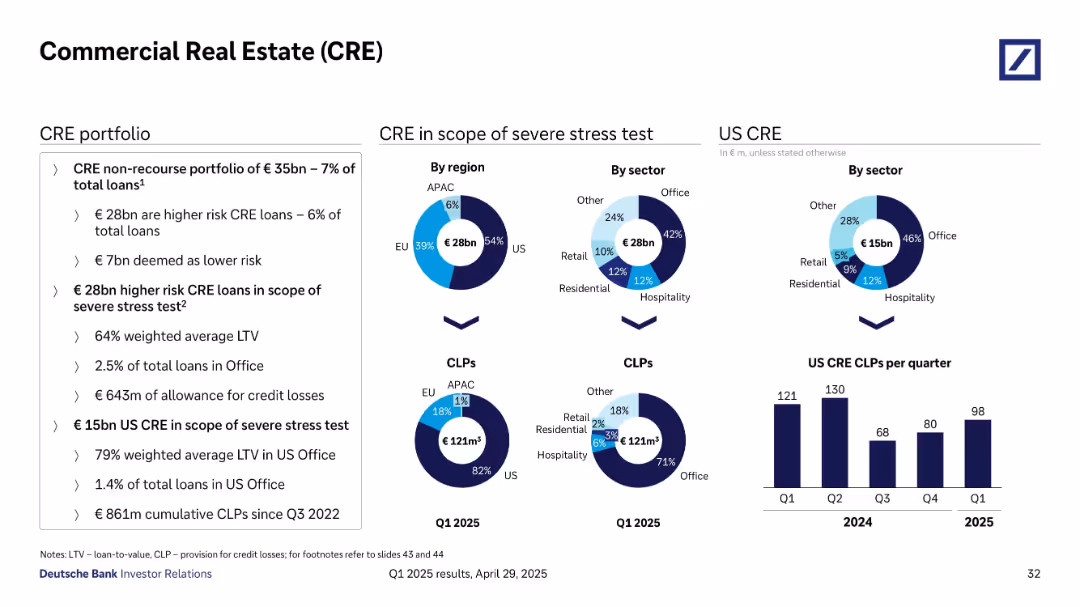
Multi-chart layout with pie charts and bar graphs analyzing CRE portfolio risk by region, sector, and loss provisioning (CLPs). Uses contrasting color schemes for segmentation.
Risk Assessment and Management
Real Estate & Construction
Deutsche Bank’s CRE exposure is analyzed, focusing on €28bn of higher-risk loans, stress testing, regional and sectoral distribution (especially US and Office sector), and provisions for credit losses. It also tracks quarterly trends in US CLPs, providing context on CRE risk concentration and mitigation strategies.
CRE, risk, CLP, stress test, loan-to-value, US exposure, sector analysis
false
Risk Assessment and Management
Real Estate & Construction
Multiple Chart
Deutsche Bank
Add to my slides
Remove from favorites
Slide displays two charts on commercial real estate risk. Left side includes a bar chart showing bank loan exposure to CRE as percentage of total assets for various countries. Right side has pie charts detailing CRE debt ownership in US and Europe.
Risk Assessment and Management
Financial Services
This slide provides a visual analysis of commercial real estate risks, focusing on the exposure of banks' and financial institutions' balance sheets in the US and Europe. Useful for discussions on market risk management.
CRE risk, financial exposure, US, Europe, banks, balance sheets
false
Risk Assessment and Management
Financial Services
Multiple Chart
Accenture
Add to my slides
Remove from favorites
Displays pie charts and a column chart, using blue shades to show geographical and sector-based CRE data.
Risk Assessment and Management
Real Estate & Construction
Continues risk analysis of CRE, focusing on loan modifications and defaults, providing insights for financial strategy.
CRE, risk management, loans, defaults, modifications, stress test, US market, financial analysis
false
Risk Assessment and Management
Real Estate & Construction
Multiple Chart
Deutsche Bank
Add to my slides
Remove from favorites
A slide with multiple data presentations: bar graphs and a line graph, along with text explanations.
Risk Assessment and Management
Financial Services
This slide discusses commercial real estate (CRE) loan portfolios, risk management, and market competition. It's used for financial analysis and risk assessment in real estate banking.
CRE, Risk Management, Portfolio, Loans, Market, Banking, Real Estate, Analysis
false
Risk Assessment and Management
Financial Services
Multiple Chart
JP Morgan
Add to my slides
Remove from favorites
Pie charts and column charts depict type distribution of US CRE in a stress test and historical data on modified loans.
Investment Analysis
Real Estate & Construction
Continues from previous slide, further analyzing US CRE risk management, highlighting stress-tested portfolios and loan modification trends.
CRE, risk management, stress test, US, loan modifications, investment, real estate
false
Investment Analysis
Real Estate & Construction
Multiple Chart
Deutsche Bank
Add to my slides
Remove from favorites
This slide includes three images representing different banking services, each with a text description and bullet points outlining key aspects.
Strategic Planning
Financial Services
Highlights strategic approaches in community development, real estate, and commercial term lending banking, suitable for discussions on long-term strategic planning in real estate finance.
CRE, Strategic Planning, Real Estate Finance, Banking, Community Development, Term Lending
false
Strategic Planning
Financial Services
Table
JP Morgan
Add to my slides
Remove from favorites
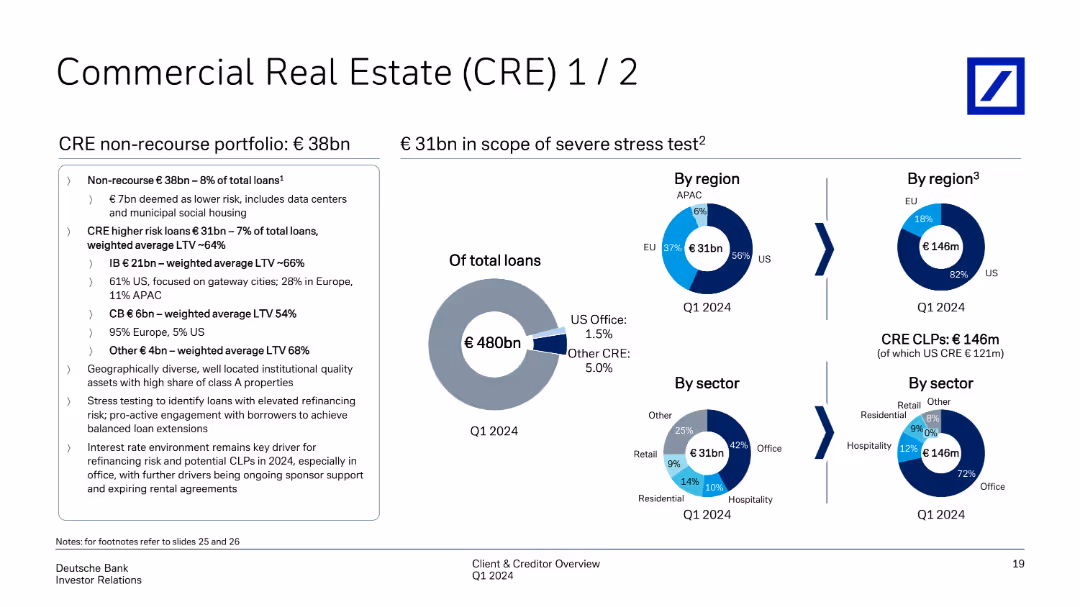
Split into two sections: left text box summarizing CRE portfolio composition; right side includes pie charts by region and sector and loan scope under stress test.
Risk Assessment and Management
Financial Services
Breaks down Deutsche Bank’s €36bn non-recourse CRE portfolio, highlighting €29bn in higher-risk loans and their geographic and sectoral distribution. Provides stress test scope and Credit Loss Provision data, notably focused on US office exposure.
CRE, stress test, LTV, CLPs, office loans, US exposure, EU, APAC, sectors
false
Risk Assessment and Management
Financial Services
Mixed Chart
Deutsche Bank
Add to my slides
Remove from favorites
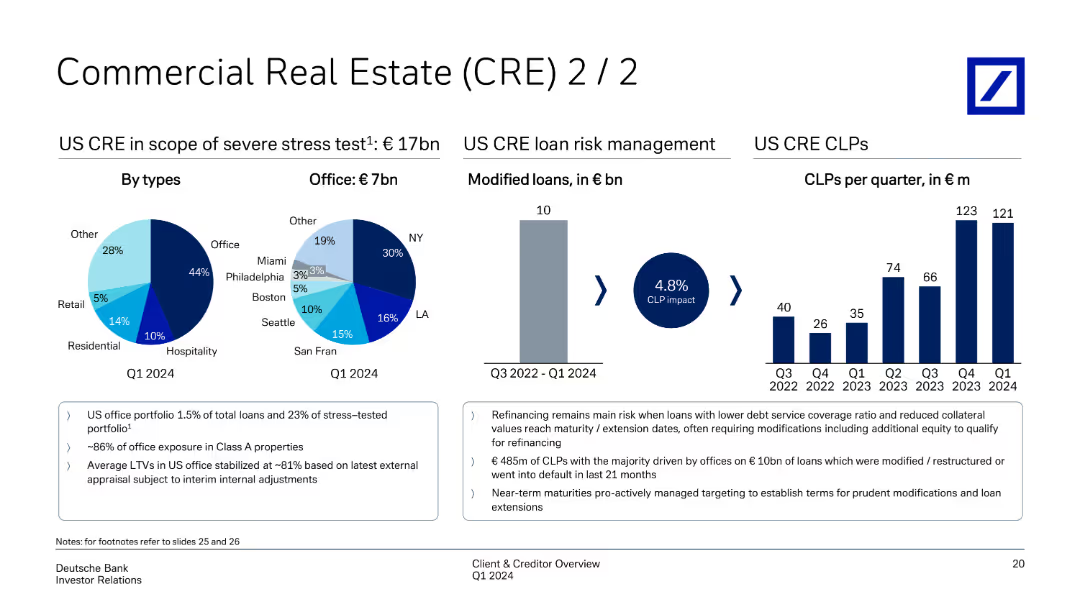
Features pie charts on CRE in severe stress tests, by types, and office distribution. It also shows a bar chart of modified loans and CLPs per quarter, indicating risk management actions.
Risk Assessment and Management
Real Estate & Construction
Explores CRE portfolio under stress scenarios, highlighting types and office distribution. The slide presents modified loans and CLPs, detailing risk management practices to handle potential defaults and refinancing risks within the CRE segment.
CRE, stress test, modified loans, CLPs, risk management
false
Risk Assessment and Management
Real Estate & Construction
Multiple Chart
Deutsche Bank
Add to my slides
Remove from favorites
The slide presents several pie charts and a column chart detailing the types of CRE loans in the US by city and the quarterly changes in CLPs. It includes annotations for risk management strategies and impacts.
Risk Assessment and Management
Real Estate & Construction
Explores the dynamics of the U.S. CRE market, focusing on loan modifications, risk management practices, and recent trends in CLPs. Supports strategic decision-making in managing real estate portfolios, especially in understanding geographic and sector-specific risks.
CRE, US market, loan modifications, risk management, geographic risks, sector-specific risks, CLPs
false
Risk Assessment and Management
Real Estate & Construction
Multiple Chart
Deutsche Bank
Add to my slides
Remove from favorites
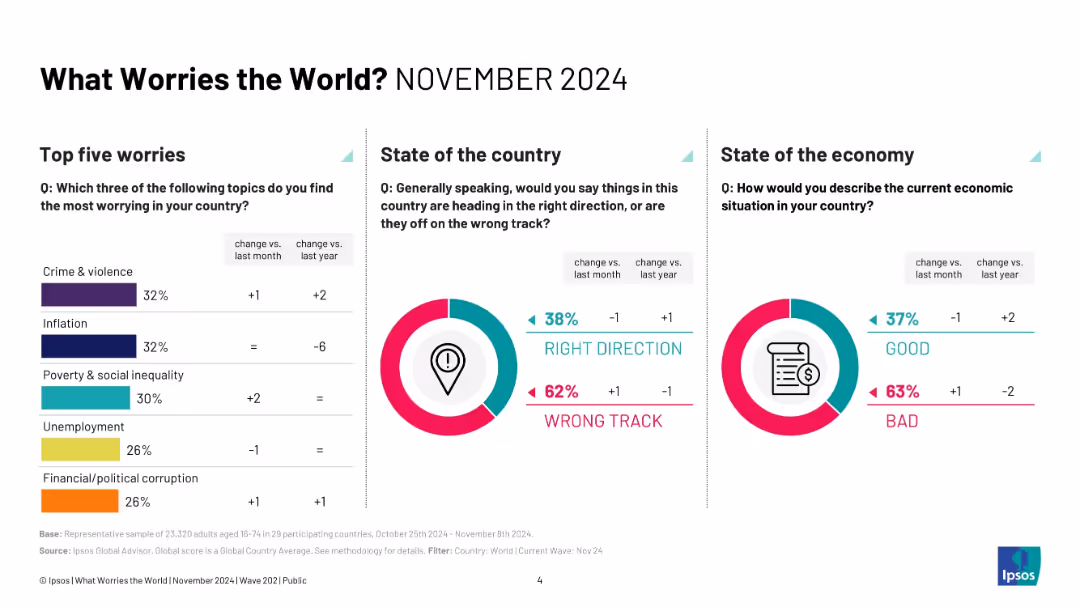
Three-column layout with bar charts, pie charts, and percentage deltas; minimalist, infographic style.
Market Analysis and Trends
Professional Services
This slide presents survey results from November 2024 identifying the top five global worries—crime/violence, inflation, inequality, unemployment, and corruption. It also reports on public sentiment regarding the direction of their country and their economy, showing more people feel things are on the wrong track.
crime, inflation, inequality, public sentiment, survey, Ipsos, trends, economy, global concerns, 2024
false
Market Analysis and Trends
Professional Services
Multiple Chart
IPSOS
Add to my slides
Remove from favorites
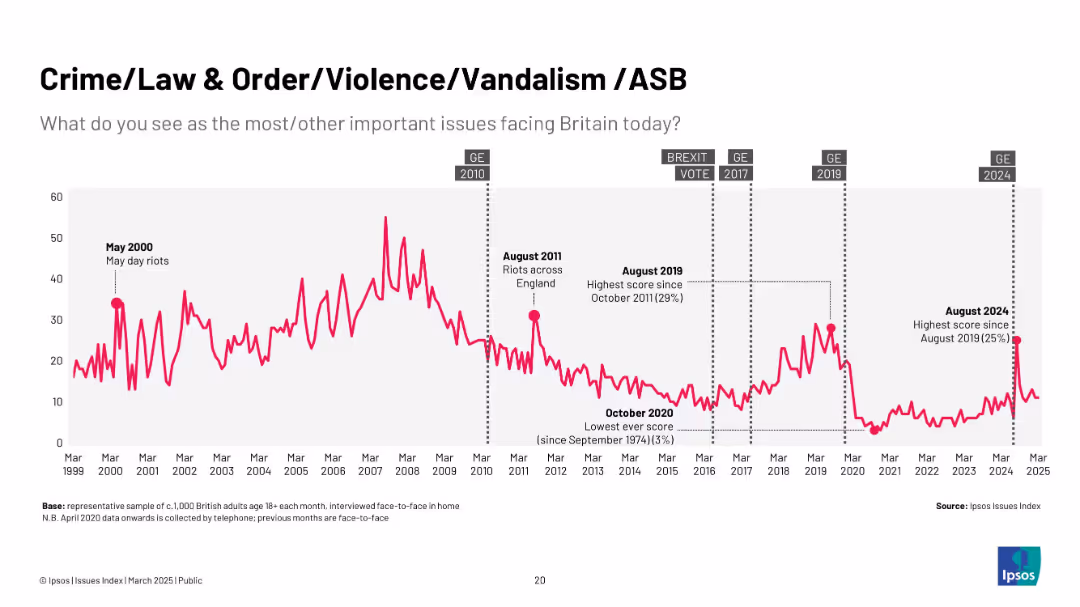
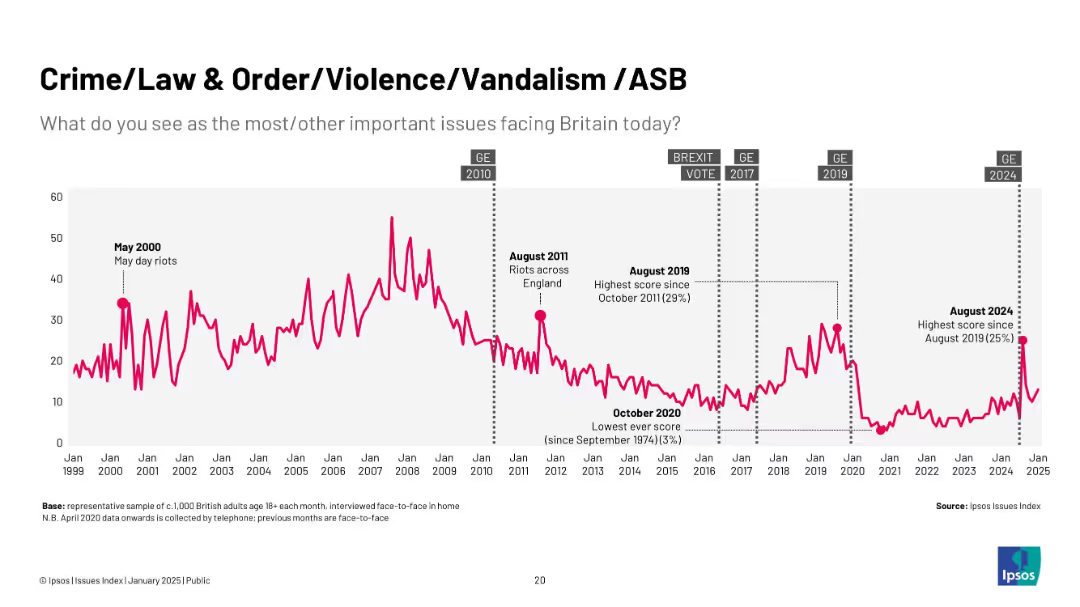
Bold pink line chart from 1999 to 2025 with crime event annotations and political time markers.
Market Analysis and Trends
Government & Public Sector
Shows long-term public concern about crime and law enforcement. Peaks include riots and major crime events, with a notable increase again in 2024.
crime, law and order, violence, vandalism, UK public concern, riots, policing, antisocial behaviour
false
Market Analysis and Trends
Government & Public Sector
Single Chart
IPSOS
Add to my slides
Remove from favorites
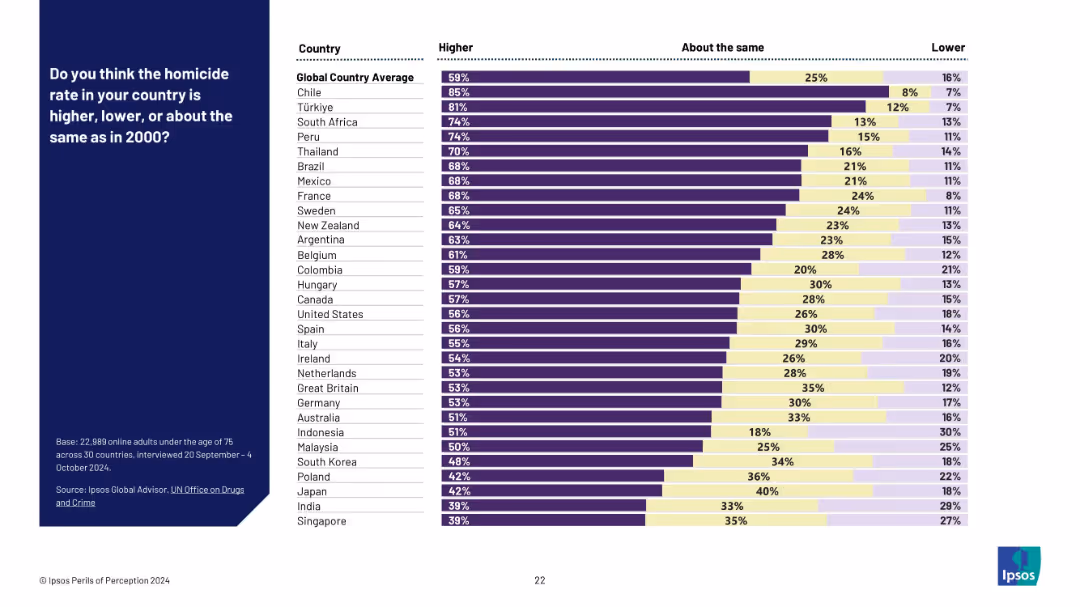
Stacked bar chart with three categories: higher, about the same, and lower; results by country.
Risk Assessment and Management
Government & Public Sector
This slide explores public perceptions about crime trends, specifically homicide rates since 2000. The chart reveals that in most countries, a majority believe rates have risen, even where they have declined or remained stable.
crime perception, homicide trends, public opinion, time comparison, Ipsos global data, fear of crime, social perception bias
false
Risk Assessment and Management
Government & Public Sector
Mixed Chart
IPSOS
Add to my slides
Remove from favorites
Line graph showing public concern trends in Britain (1999–2025) with event annotations (e.g. May Day riots, Brexit).
Market Analysis and Trends
Government & Public Sector
This slide shows the public’s concern over crime, law and order, violence, and anti-social behavior over time. Peaks in concern correlate with events such as riots or general elections. The data is sourced from Ipsos’ Issues Index.
crime, public concern, trends, riots, elections, Ipsos, ASB, UK, timeline
false
Market Analysis and Trends
Government & Public Sector
Single Chart
IPSOS
Add to my slides
Remove from favorites
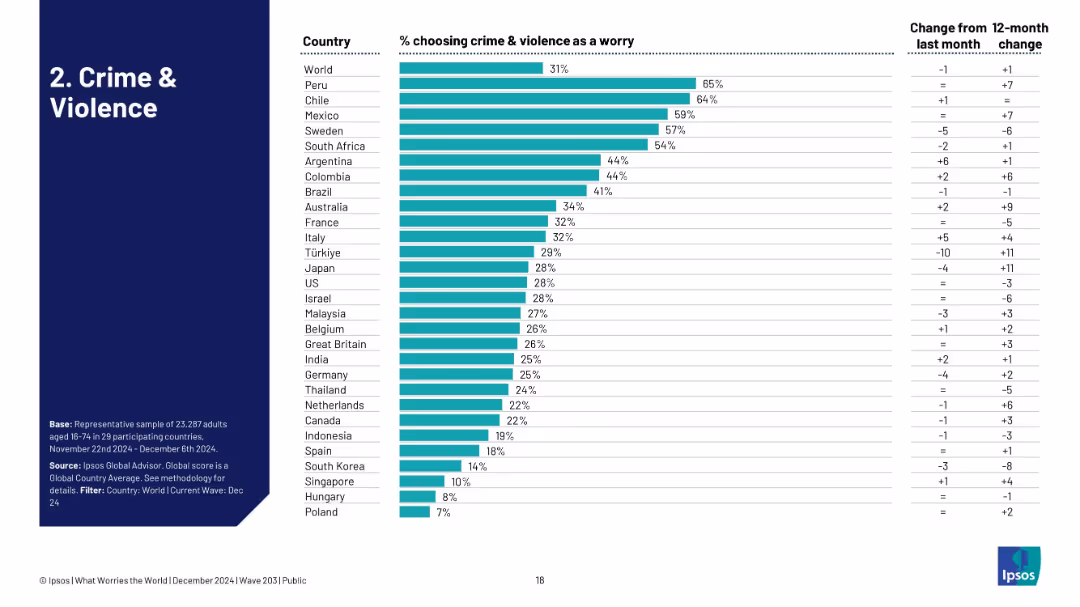
Ranked country list in bar chart format; includes world average and change from last month/year.
Market Analysis and Trends
Professional Services
The slide presents a country-level breakdown of the percentage of respondents selecting crime and violence as a top concern. Peru, Chile, and Sweden lead globally. Change indicators highlight recent shifts, revealing regions experiencing increasing concern.
crime, violence, global concern, regional analysis, monthly change, survey, Ipsos, public safety
false
Market Analysis and Trends
Professional Services
Single Chart
IPSOS
Add to my slides
Remove from favorites
Vertical bar chart showing country-wise worry levels regarding crime and violence, with monthly and yearly changes.
Risk Assessment and Management
Government & Public Sector
The chart shows 31% of global respondents worry most about crime and violence, with Peru and Chile leading. Trends over time are also tracked, showing notable increases in Japan and Türkiye.
crime, violence, public safety, concern levels, Ipsos, security, regional disparity
false
Risk Assessment and Management
Government & Public Sector
Single Chart
IPSOS
Add to my slides
Remove from favorites
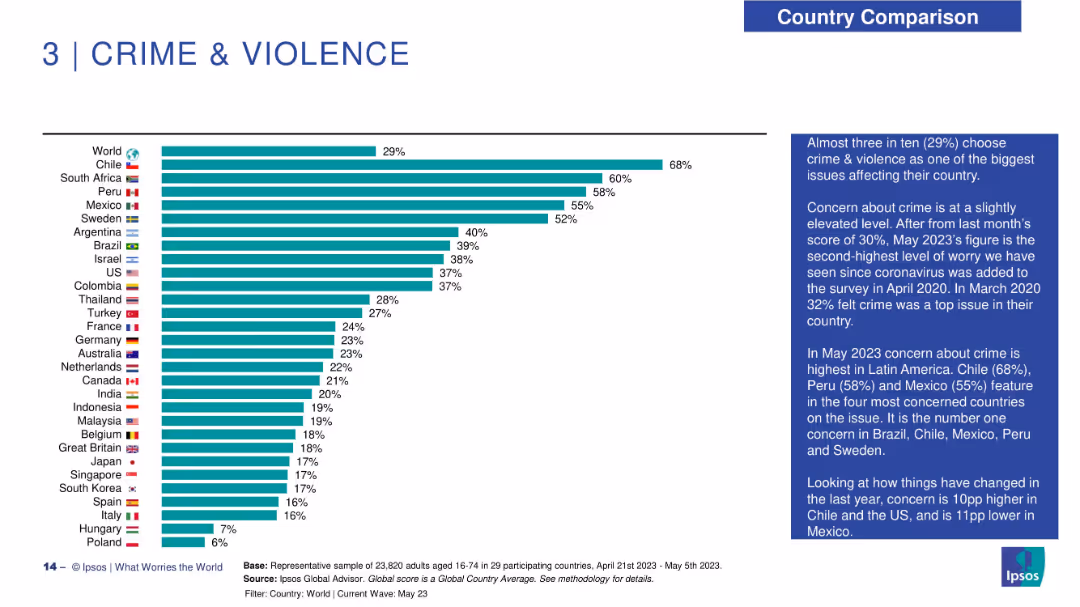
Bar chart layout on left with country flags and names on the Y-axis and horizontal bars indicating concern percentage. Right side features a narrative analysis in a dark blue box. Consistent with other slides in visual style.
Market Analysis and Trends
Government & Public Sector
This slide presents public concern over crime and violence across 29 countries. Chile has the highest concern (68%), followed by South Africa (60%) and Peru (58%). The global average is 29%. The right-hand commentary discusses Latin America's prominence in concern and notes recent changes, such as increased concern in Chile and decreased concern in Mexico.
crime, violence, public safety, global perception, concern levels, Latin America, Ipsos, societal issues, survey trends, insecurity
false
Market Analysis and Trends
Government & Public Sector
Mixed Chart
IPSOS
Add to my slides
Remove from favorites
Diagram-based slide with icons representing different stages of crisis management linked in a timeline format.
Strategic Planning
Professional Services
Advises on the expected evolution of a 'Nerve Center' during different phases of a crisis, beneficial for leadership and strategy planning.
crisis evolution, management, resilience, resolve, return, reimagination, reform, leadership
false
Strategic Planning
Professional Services
Graphic
McKinsey
Add to my slides
Remove from favorites
The slide includes text, a survey bar chart, and images representing local and global communication dynamics during crisis management.
Risk Assessment and Management
Professional Services
Highlights the importance of empowering local teams to manage crises effectively within the framework of global policies, ensuring quick and coordinated responses.
Crisis management, local teams, global policies, communication, survey
false
Risk Assessment and Management
Professional Services
Mixed Chart
IPSOS
Add to my slides
Remove from favorites
The slide has a text section on the left with a circular diagram on the right showing the impact of crises on companies, divided into three outcomes: worse, similar, and better.
Risk Assessment and Management
Financial Services
This slide highlights strategies companies use to emerge stronger post-crisis, with 42% reporting being in a better place post-crisis due to effective crisis management.
Crisis management, post-crisis, resilience, strategies, outcomes
false
Risk Assessment and Management
Financial Services
Mixed Chart
PwC/Strategy&
Add to my slides
Remove from favorites
This slide is divided into three main sections, each highlighted in different colors representing phases: Flatten, Fight, Future. It includes bullet points and a source citation at the bottom. The text is balanced with the layout, making it easy to follow.
Strategic Planning
Professional Services
The slide outlines strategic measures for crisis management in three phases—Flatten, Fight, Future—detailing specific actions like deep-diving into outcomes, refining processes, and coordinating other areas from a response team. It serves to guide strategic crisis management during different operational phases.
crisis management, strategic planning, operational phases, Flatten, Fight, Future, response team, business continuity, process refinement, engagement
false
Strategic Planning
Professional Services
Table
BCG
Add to my slides
Remove from favorites
Uses icons and numbered lists to outline nine strategic action areas for business leaders in managing crises.
Strategic Planning
Professional Services
Details a comprehensive crisis management framework for businesses, with specific actions to navigate through and emerge stronger from a crisis.
crisis management, strategies, business leaders, action areas, framework
false
Strategic Planning
Professional Services
Vertical Flow
BCG
Add to my slides
Remove from favorites
Detailed slide with multiple bullet points and percentage indicators, showing the allocation of tasks within a 'Nerve Center' structure.
Strategic Planning
Professional Services
Describes the 'Nerve Center' concept for crisis management, detailing team responsibilities and decision-making processes. Suitable for management strategy sessions.
crisis management, team roles, decision-making, operations, strategy, planning, nerve center, 5Rs
false
Strategic Planning
Professional Services
Header Horizontal
McKinsey
Add to my slides
Remove from favorites
Diagram showing crisis preparation options with a profit-time curve indicating different stages of crisis and corresponding actions like budget cuts and performance programs.
Risk Assessment and Management
Professional Services
The slide presents approaches to crisis preparation, suggesting strategic reassessment, performance programs, and restructuring as key methods to address potential crises.
crisis preparation, early warning, risk management, strategic planning, crisis stages
false
Risk Assessment and Management
Professional Services
Diagram
Roland Berger
Add to my slides
Remove from favorites
The slide features a schematic diagram showing crisis preparation stages from planning to insolvency. Text explains the stages and crisis preparation options.
Risk Assessment and Management
Professional Services
It discusses strategies for crisis preparation, detailing different stages of a crisis and the corresponding actions to mitigate risks and manage potential disruptions.
Crisis preparation, risk management, early warning systems, planning, stages, mitigation
false
Risk Assessment and Management
Professional Services
Multiple Chart
Roland Berger
Add to my slides
Remove from favorites
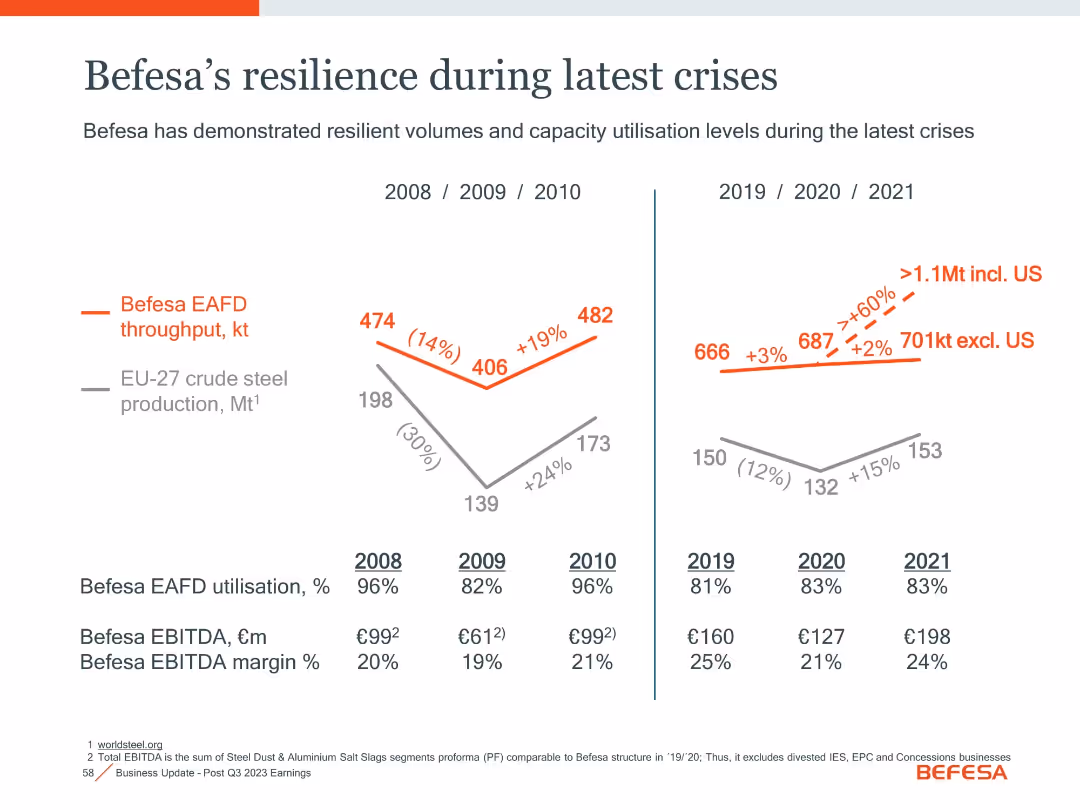
Dual time-series charts comparing steel production vs. Befesa throughput, with utilization and margin tables.
Risk Assessment and Management
Industrial & Manufacturing
Highlights Befesa’s operational stability during economic downturns (2008–2010, 2019–2021), maintaining high utilization and EBITDA margins despite steel production declines.
crisis resilience, utilization, EBITDA margin, steel production, stability
false
Risk Assessment and Management
Industrial & Manufacturing
Single Chart
Goldman Sachs
Add to my slides
Remove from favorites
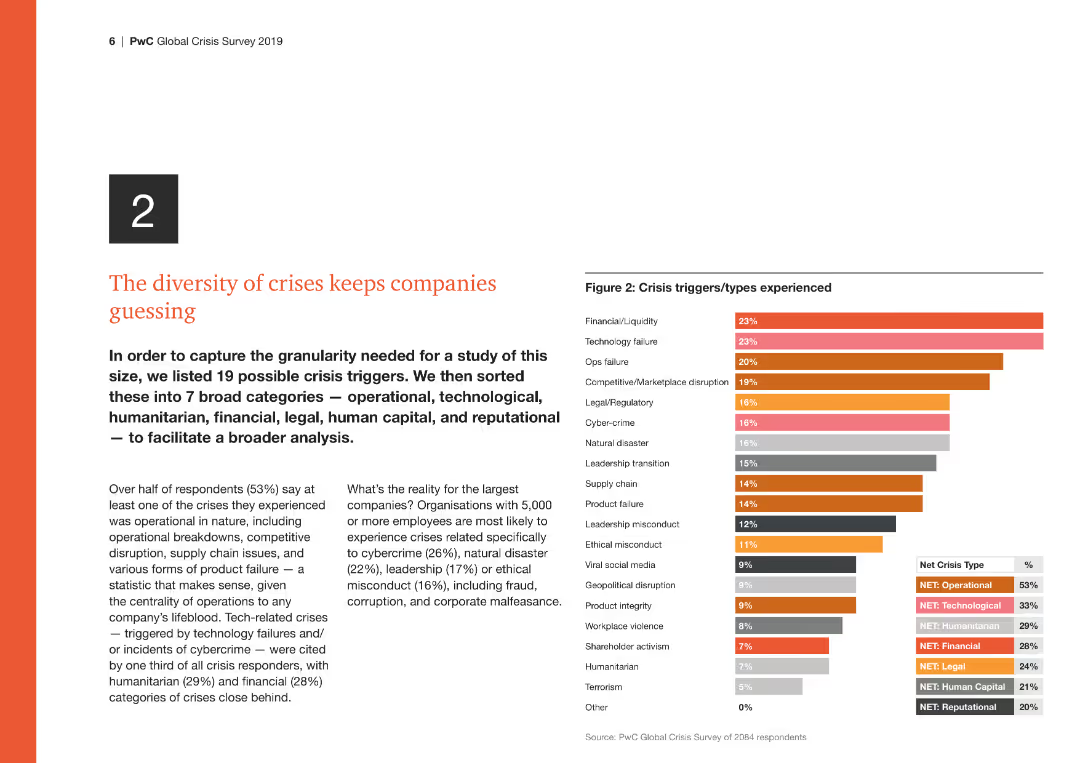
The slide includes a column chart on the right side showing different crisis triggers/types experienced, with financial/liquidity and technology failure at the top.
Risk Assessment and Management
Financial Services
This slide lists 19 possible crisis triggers categorized into seven broad categories for comprehensive analysis, highlighting the importance of diverse crisis preparedness.
Crisis triggers, financial, operational, technology, human capital, reputational
false
Risk Assessment and Management
Financial Services
Mixed Chart
PwC/Strategy&
Add to my slides
Remove from favorites
This slide features a world map annotated with major producing countries and the specific critical materials they supply, particularly highlighting China's dominant role as a supplier. Each country is marked with icons representing different materials, and percentages are provided to show the extent of their production share. The slide is visually engaging, with a clear focus on the geographic distribution of material production and the dependence on certain regions for these essential supplies.
Risk Assessment and Management
Industrial & Manufacturing
This slide explores the global production concentration of critical raw materials, emphasizing the significant role of China and other key countries in the supply chain. It discusses the implications of this concentration on material availability and potential risks associated with geopolitical dependencies.
critical materials, China, Europe, global supply chain, production concentration, geopolitical risks, raw materials, supply dependence, economic security, strategic resources
false
Risk Assessment and Management
Industrial & Manufacturing
Mixed Chart
Roland Berger
Add to my slides
Remove from favorites
This slide displays a scatter plot illustrating the current supply risk and economic importance of various critical raw materials identified by an EU study. Each material, such as antimony, cobalt, and tungsten, is plotted according to its supply risk and economic relevance. The graph is complemented by annotations that explain the criticality assessment criteria, including factors like substitutability and concentration of production. The design is straightforward, emphasizing clarity and focus on the plotted data points.
Risk Assessment and Management
Industrial & Manufacturing
This slide highlights the findings of an EU study on critical raw materials, presenting their supply risks and economic impacts. It provides insights into the strategic importance of these materials to the European manufacturing sector and discusses potential supply chain vulnerabilities.
critical materials, supply risk, economic impact, EU study, manufacturing, strategic resources, substitutability, production concentration, global trade, resource management
false
Risk Assessment and Management
Industrial & Manufacturing
Single Chart
Roland Berger
Add to my slides
Remove from favorites
This slide features a scatter plot comparing the current and projected supply risks for various critical materials like barytes, borate, and molybdenum in 2030. Each material is plotted based on its current supply risk against the predicted future risk, emphasizing those with expected increases in risk. The design incorporates a linear trend line to visualize the expected change in risk level, and annotations provide context about the production-to-reserves ratio, which influences these projections.
Risk Assessment and Management
Industrial & Manufacturing
This slide provides a projection of future supply risks for selected critical materials based on their current production practices and reserves. It highlights materials like barytes, borate, and molybdenum, predicting increased risks due to continued heavy reliance on existing reserves without adjustments in production strategies.
critical materials, supply risk, future projections, resource management, mining, production practices, risk assessment, barytes, borate, molybdenum, sustainability
false
Risk Assessment and Management
Industrial & Manufacturing
Mixed Chart
Roland Berger
Add to my slides
Remove from favorites
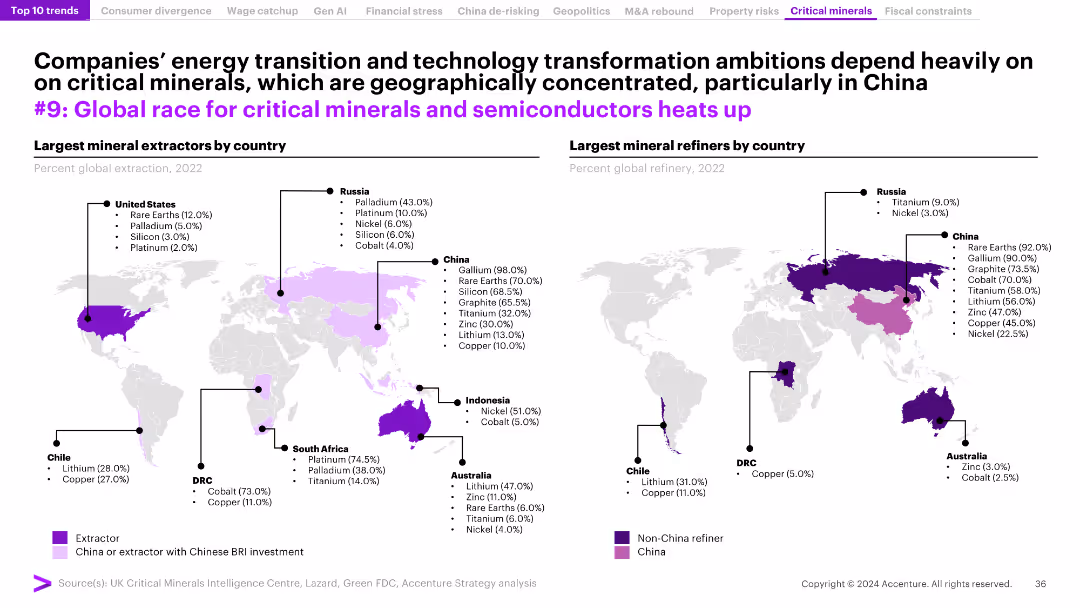
The slide features two world maps showing the largest mineral extractors and refiners by country in 2022, with commentary on the implications for global supply chains.
Market Analysis and Trends
Environmental Services & Sustainability
The slide explores the global competition for critical minerals and semiconductors, emphasizing the geographical concentration of resources and their importance for technology and energy transitions.
critical minerals, semiconductors, global supply chains, extraction, refining
false
Market Analysis and Trends
Environmental Services & Sustainability
Graphic
Accenture
Add to my slides
Remove from favorites
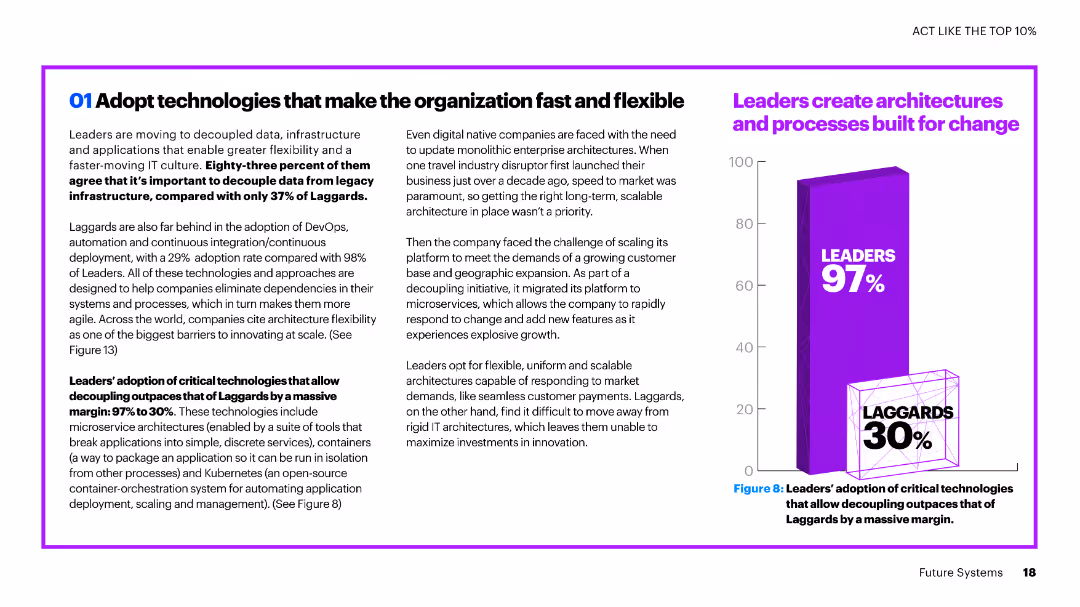
A two-column slide with text on the left and a large column chart on the right showing the adoption rates of critical technologies among leaders and laggards.
Technology and Digital Transformation
Technology & Software
The slide discusses the importance of adopting decoupled data, infrastructure, and applications for agility, with leaders significantly outpacing laggards in the adoption of critical technologies that enable organizational flexibility.
critical technologies, adoption, leaders, laggards, flexibility, decoupling, data, infrastructure, applications, agility
false
Technology and Digital Transformation
Technology & Software
Mixed Chart
Accenture
Add to my slides
Remove from favorites
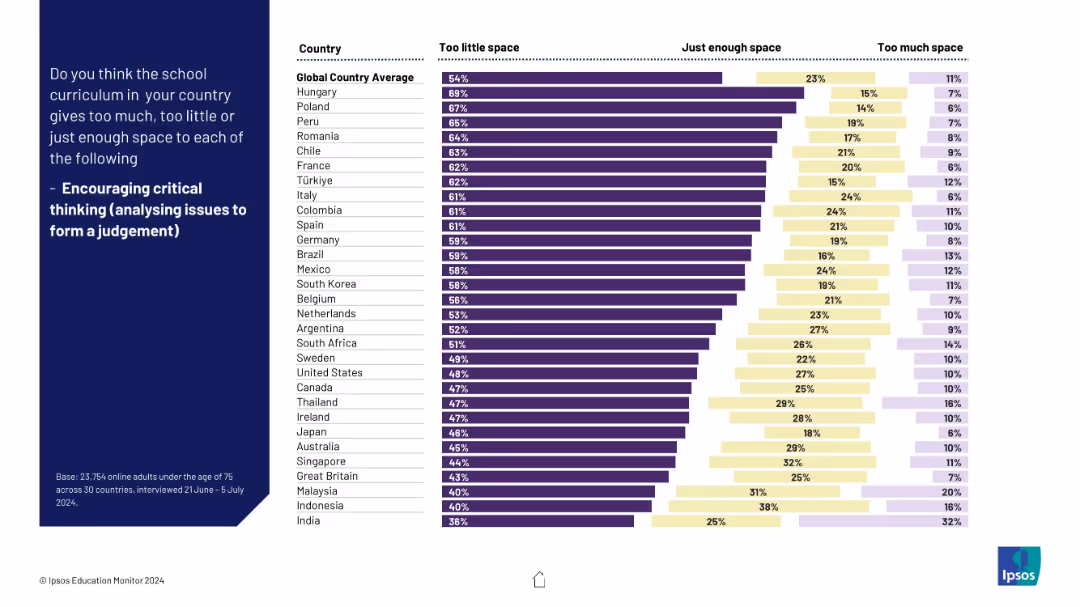
Horizontal bar chart ranking countries by whether curriculum provides too little, enough, or too much focus on critical thinking; three-color legend.
Strategic Planning
Education & Training
The slide presents opinions on whether national curricula allocate sufficient time to critical thinking. Most respondents across countries feel there is too little focus on developing analytical judgment.
critical thinking, education, curriculum, skills, global opinion, too little, judgement, survey
false
Strategic Planning
Education & Training
Mixed Chart
IPSOS
Add to my slides
Remove from favorites
Slide features two line charts tracking budget changes for customer relationship management and brand building over several years, indicating recent trends and future predictions.
Strategic Planning
Professional Services
Analyzing the budget trends for customer relationship management and brand building, the slide shows increasing investment in these areas.
CRM, brand building, budgets, trends, planning
false
Strategic Planning
Professional Services
Single Chart
Deloitte
Add to my slides
Remove from favorites
Text and symbolic representations explaining the roles of the CRO in AI implementation and risk management.
Risk Assessment and Management
Technology & Software
Highlights the dual role of CROs in enabling and overseeing AI adoption in risk management.
CRO, AI implementation, risk management, roles
false
Risk Assessment and Management
Technology & Software
Header Vertical
PwC/Strategy&
Add to my slides
Remove from favorites
The slide is divided into six sections, each with a circular chart showing performance metrics in areas like strategy, ESG guidelines, environmental impact, stakeholders, employee wellbeing, and governance. Each chart is color-coded and labeled with percentages.
Performance Metrics and KPIs
Environmental Services & Sustainability
This slide presents performance metrics for Croatian companies in various ESG-related segments, highlighting their strengths in strategy and business planning, stakeholder impact, and areas needing improvement. It uses circular charts to visually represent performance percentages.
Croatian, ESG, performance, metrics, strategy
false
Performance Metrics and KPIs
Environmental Services & Sustainability
Multiple Chart
Kearney
Add to my slides
Remove from favorites
The slide compares ESG strategy, emission targets, and DEI (diversity, equity, and inclusion) between large companies and SMEs using horizontal bar charts. Each section provides a breakdown of specific metrics within these categories.
Market Analysis and Trends
Environmental Services & Sustainability
This slide compares the ESG strategies, emission targets, and DEI practices of larger Croatian companies versus SMEs, showing that larger companies tend to have more developed ESG strategies and emission targets. It uses bar charts to depict the comparative data.
Croatian, ESG, strategy, emission, DEI
false
Market Analysis and Trends
Environmental Services & Sustainability
Multiple Chart
Kearney
Add to my slides
Remove from favorites
An informative slide summarizes key investment opportunities in the crop industry, featuring four key themes illustrated with circular icons and brief descriptions. The design is clean and corporate, with a mix of graphics and text.
Industry Overview
Agriculture & Food Production
Aimed at investors, this slide summarizes the attractive characteristics of the crop market, emphasizing the long-term fundamentals, market downturns, technological innovations, and M&A opportunities. It serves as an agenda slide, highlighting key themes that will be discussed in detail throughout the presentation.
Crop Industry, Investment, Opportunities, Value Chain, Themes, Fundamentals, Technology, M&A
false
Industry Overview
Agriculture & Food Production
Pillar
EY
Add to my slides
Remove from favorites
A text-heavy slide divided into four sections, each with an icon, describing key themes in the crop market. The blue color scheme is consistent with the rest of the presentation.
Strategic Planning
Agriculture & Food Production
Four key themes are outlined related to crop market investments, including fundamental industry trends and questions for strategic considerations.
crop market, investment themes, industry issues, strategic planning, agriculture, fundamental trends
false
Strategic Planning
Agriculture & Food Production
Pillar
EY
Add to my slides
Remove from favorites
Featuring a colorful stacked column chart, the slide shows US agriculture crop production by region. The slide is data-dense, with multiple crops listed within each geographic segment.
Investment Analysis
Agriculture & Food Production
This slide displays the 2015 crop production values across different US regions, comparing the economic impact of various crops within the agriculture industry.
crop production, regional analysis, agriculture, US markets, economic impact, 2015 data
false
Investment Analysis
Agriculture & Food Production
Single Chart
EY
Add to my slides
Remove from favorites
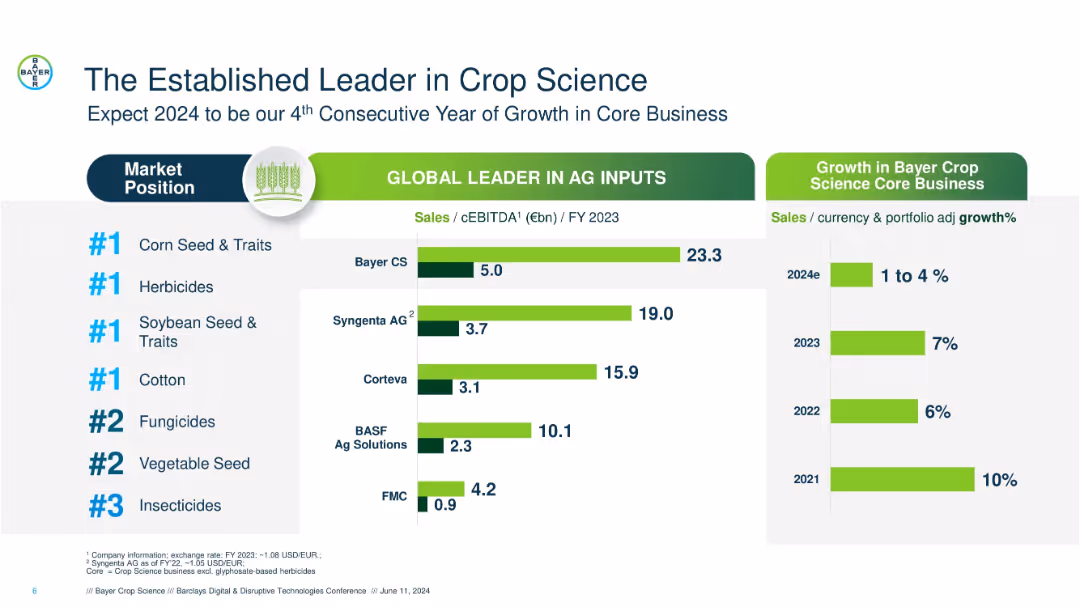
Bar and ranking chart format with green-highlighted bars; left-aligned text, central charts, and minimal icons.
Competitive Landscape
Agriculture & Food Production
Displays Bayer Crop Science’s #1 positions in various crop science segments, compares competitors’ sales and cEBITDA, and shows past and projected growth rates, reinforcing leadership and market confidence.
crop science, market leader, Bayer, Syngenta, growth rate, sales, herbicides, seeds, EBITDA, competitors
false
Competitive Landscape
Agriculture & Food Production
Multiple Chart
Barclays
Add to my slides
Remove from favorites
The slide includes column charts showing sales and EBITDA growth for Q2 2020. Bullet points provide details on growth drivers and margin expansion.
Financial Performance
Agriculture & Food Production
This slide reviews Crop Science's financial performance in Q2 2020, focusing on sales and EBITDA growth, driven by regional performance and volume growth, despite challenges in specific markets.
Crop Science, Sales Growth, EBITDA, Margin Expansion, Q2 2020
false
Financial Performance
Agriculture & Food Production
Multiple Chart
Credit Suisse
Add to my slides
Remove from favorites
The slide has a large number "05" and a bar chart. The right side lists ways CROs expect their roles to evolve, while the left provides an overview of the CRO's changing role.
Strategic Planning
Financial Services
This slide explains the evolving role of CROs in the insurance industry, highlighting future expectations and the importance of strategic risk management.
CRO, risk management, insurance, role evolution, strategic planning
false
Strategic Planning
Financial Services
Mixed Chart
EY
Add to my slides
Remove from favorites
Comparative analysis with a table showing top 10 CRO risk priorities from 2012 to 2022, alongside a bar chart of top risk priorities for the next 12 months.
Risk Assessment and Management
Financial Services
This slide presents a comprehensive view of changing CRO risk priorities over a decade, emphasizing cybersecurity and credit risk as top concerns for the coming year.
CRO, Risk Priorities, Cybersecurity, Credit Risk, Analysis
false
Risk Assessment and Management
Financial Services
Mixed Chart
EY
Add to my slides
Remove from favorites
The slide combines text and a column chart, depicting the alignment between CROs and boards on key risk management priorities, including cybersecurity risk and business model risk.
Strategic Planning
Financial Services
It illustrates the alignment of risk management priorities between CROs and boards, focusing on cybersecurity and business model risks. This slide is crucial for strategic planning and ensuring cohesive risk management strategies across leadership levels.
CROs, boards, risk management, alignment, cybersecurity, business model
false
Strategic Planning
Financial Services
Multiple Chart
EY
Add to my slides
Remove from favorites
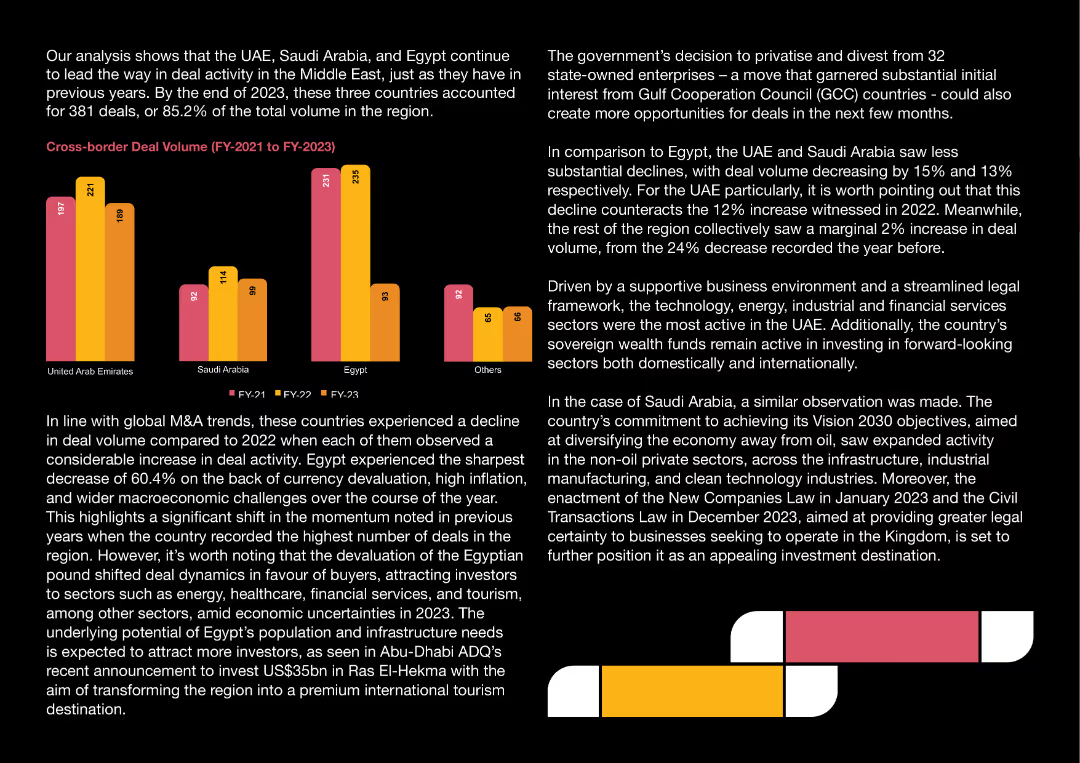
Column chart with three years (FY-21, FY-22, FY-23) of cross-border deal volumes for UAE, Saudi Arabia, Egypt, and Others. Colored bars represent each year.
Market Analysis and Trends
Financial Services
Analyzes the decline in cross-border deal volumes across the Middle East in 2023 compared to previous years. Highlights factors impacting the decline.
Cross-border, Deal Volume, UAE, Saudi Arabia, Egypt
false
Market Analysis and Trends
Financial Services
Mixed Chart
PwC/Strategy&
Add to my slides
Remove from favorites
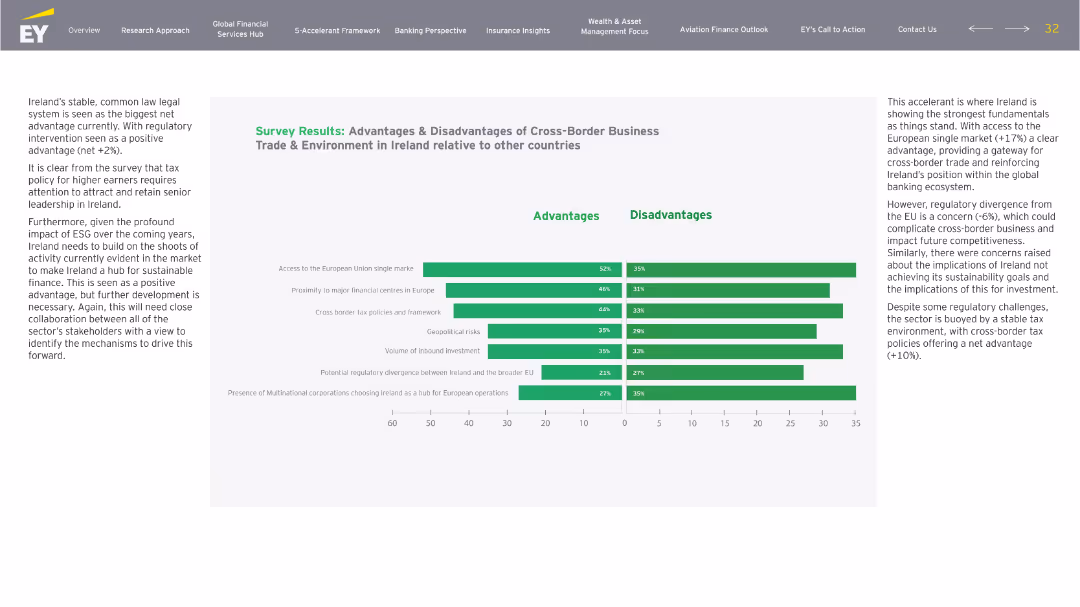
Side-by-side bar chart analysis with descriptive paragraph to the left and horizontal bar charts in green to the right. Advantages and disadvantages split, same categories reused from earlier.
Market Analysis and Trends
Financial Services
Expands on the earlier trade slide with more granular survey data. Reinforces Ireland’s edge in EU access and global HQ proximity, but flags regulatory divergence and sustainability gaps as concerns. Presents stakeholders’ feedback for future policy alignment.
cross-border, EU, trade, sustainability, regulation, investment
false
Market Analysis and Trends
Financial Services
Mixed Chart
EY
Add to my slides
Remove from favorites
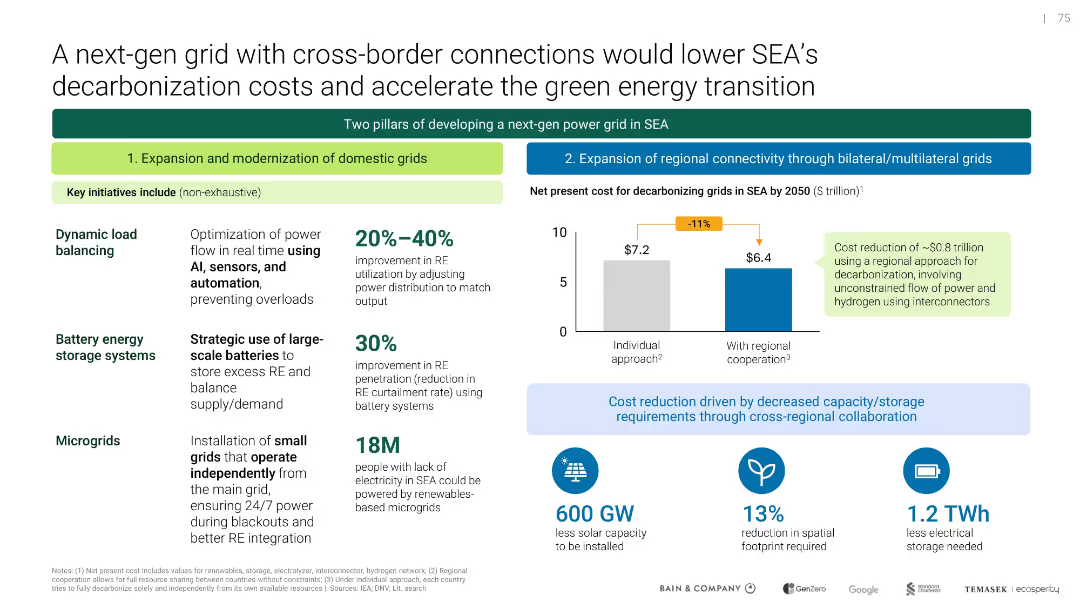
Two-column format with left side showing initiatives and benefits, and right side showing cost comparison chart; use of icons and color-coded sections
Technology and Digital Transformation
Energy & Utilities
Proposes a two-pillar strategy—modernizing domestic grids and expanding regional interconnectivity—to reduce decarbonization costs. Quantifies benefits like reduced solar capacity and electrical storage needs with cooperation.
cross-border grid, decarbonization, regional cooperation, RE integration, battery systems
false
Technology and Digital Transformation
Energy & Utilities
Mixed Chart
Bain
Add to my slides
Remove from favorites
Contains column charts, data tables, and trend lines. The slide is visually rich with information on cross-border and outbound IPO activities in the Asia-Pacific region.
Market Analysis and Trends
Financial Services
Discusses the trends in cross-border and outbound IPO activities in the Asia-Pacific region for 2019, including transaction sizes and the performance of main and junior markets.
cross-border IPO, Asia-Pacific, market trends, 2019, transactions
false
Market Analysis and Trends
Financial Services
Multiple Chart
EY
Add to my slides
Remove from favorites
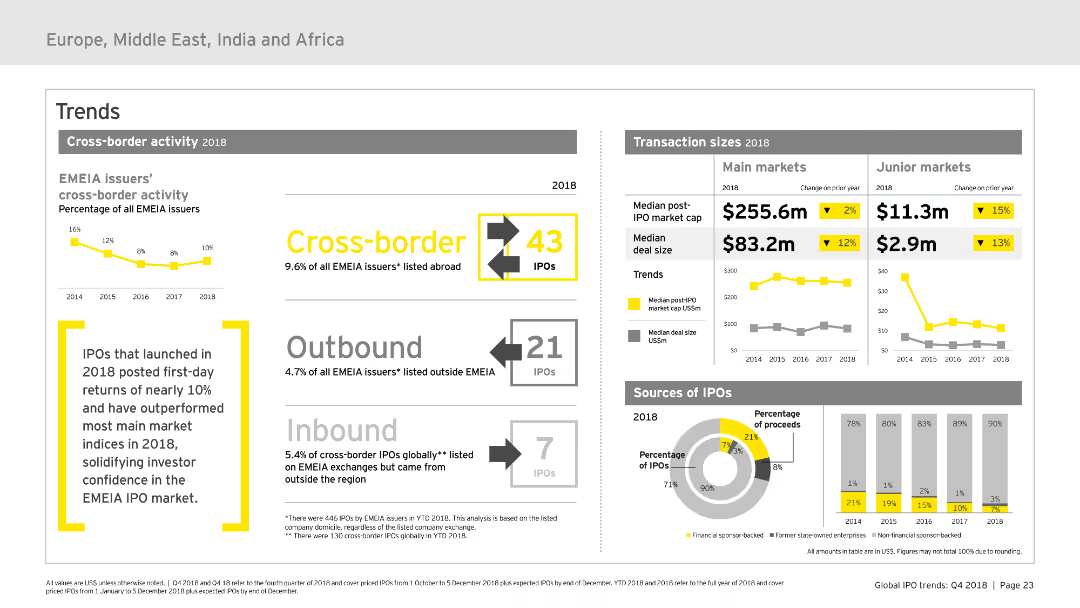
The slide focuses on cross-border activity within the EMEIA IPO market, using various charts and infographics to display outbound and inbound IPOs, transaction sizes, and sources of IPOs. The visual layout is moderately complex, balancing text and visual elements for clarity.
Market Analysis and Trends
Financial Services
Analyzes cross-border IPO activities in EMEIA for 2018, detailing outbound and inbound IPOs, transaction sizes, and origins. Highlights key trends and provides a comprehensive overview of market movements.
cross-border, IPO, EMEIA, trends, transactions
false
Market Analysis and Trends
Financial Services
Multiple Chart
EY
Add to my slides
Remove from favorites
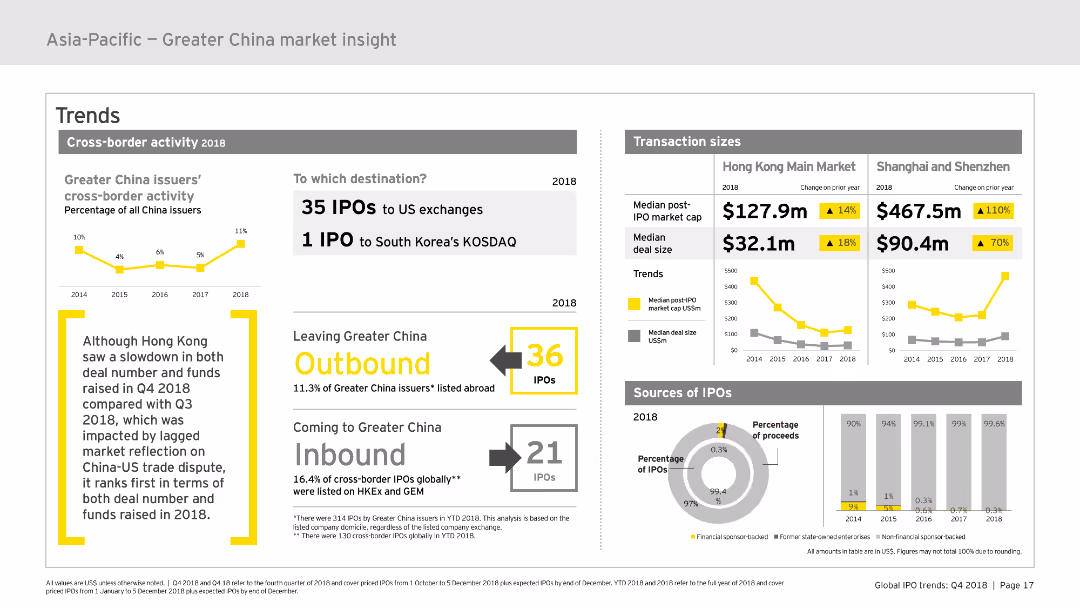
Focuses on cross-border activity in the Greater China IPO market. It uses charts to show outbound and inbound IPOs, destinations, and transaction sizes. The slide is designed with a moderate complexity, balancing text and visual elements effectively.
Market Analysis and Trends
Financial Services
Examines the trends in cross-border IPO activities for Greater China, including the number of IPOs, transaction sizes, and main destinations for outbound and inbound IPOs. Useful for understanding market movements and trends.
cross-border, IPO, Greater China, trends, transactions
false
Market Analysis and Trends
Financial Services
Multiple Chart
EY
Add to my slides
Remove from favorites
The slide features tables comparing the number of cross-border IPOs by jurisdiction and destination for YTD 2021 and 2022. It highlights significant changes and includes a textual analysis of geopolitical impacts on IPO activity.
Regulatory and Compliance
Financial Services
This slide reviews cross-border IPO activity, showing a significant decrease from 2021 to 2022. It discusses the influence of geopolitical considerations on IPO markets, with detailed tables comparing jurisdictions of origin and destination.
Cross-border IPOs, Geopolitical impact, Financial services, IPO activity, Market analysis
false
Regulatory and Compliance
Financial Services
Table
EY
Add to my slides
Remove from favorites
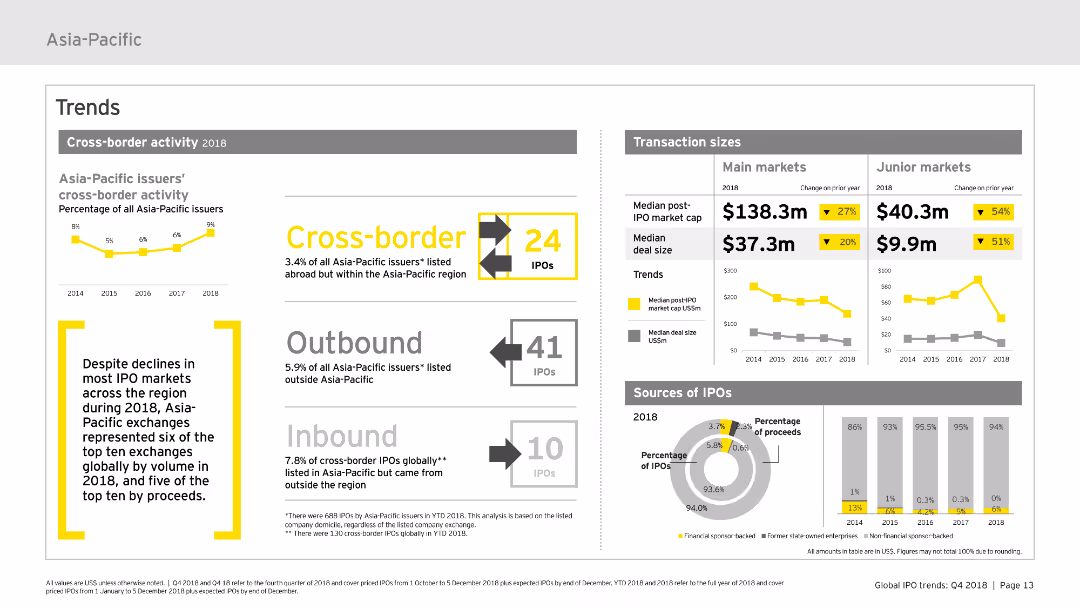
Features various charts and infographics focusing on cross-border activity within the Asia-Pacific IPO market. It uses bar charts to illustrate transaction sizes and sources of IPOs, along with textual highlights to provide context. The layout is clear, designed to show trends effectively.
Market Analysis and Trends
Financial Services
Analyzes the cross-border IPO activities in the Asia-Pacific region for 2018, detailing transaction sizes and the origins and destinations of IPOs. It highlights key trends and changes over the year.
cross-border, IPO, transaction sizes, trends, Asia-Pacific
false
Market Analysis and Trends
Financial Services
Multiple Chart
EY
Add to my slides
Remove from favorites
Light background with yellow title banner, text-heavy content, and two charts illustrating cross-border listings and their performance.
Market Analysis and Trends
Financial Services
This slide highlights the outperformance of small cross-border IPOs compared to larger offerings in after-market returns. It features charts showing the number of cross-border listings over years and the percentage of IPOs with current prices above their offer prices.
cross-border listings, IPO performance, after-market returns, 2023, financial trends
false
Market Analysis and Trends
Financial Services
Multiple Chart
EY
Add to my slides
Remove from favorites
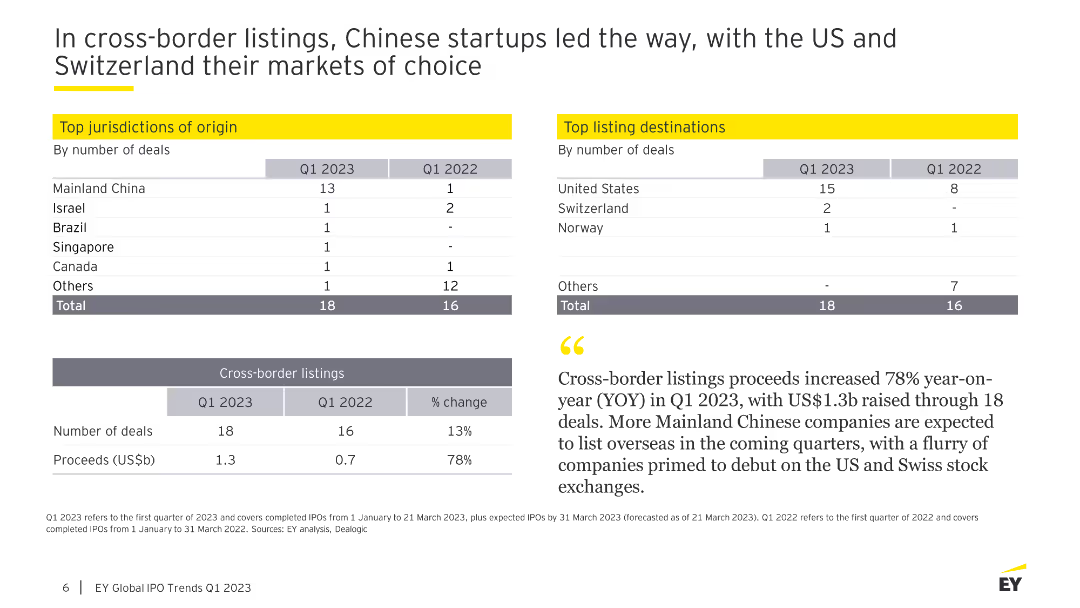
This slide includes tables showing top jurisdictions of origin and listing destinations by number of deals for Q1 2023 and Q1 2022.
Market Analysis and Trends
Financial Services
The slide details cross-border IPO activities, emphasizing Chinese startups leading in deals and the US and Switzerland as top listing destinations.
cross-border listings, IPOs, jurisdictions, deals, China, US, Switzerland, market analysis, financial services
false
Market Analysis and Trends
Financial Services
Header Horizontal
EY
Add to my slides
Remove from favorites
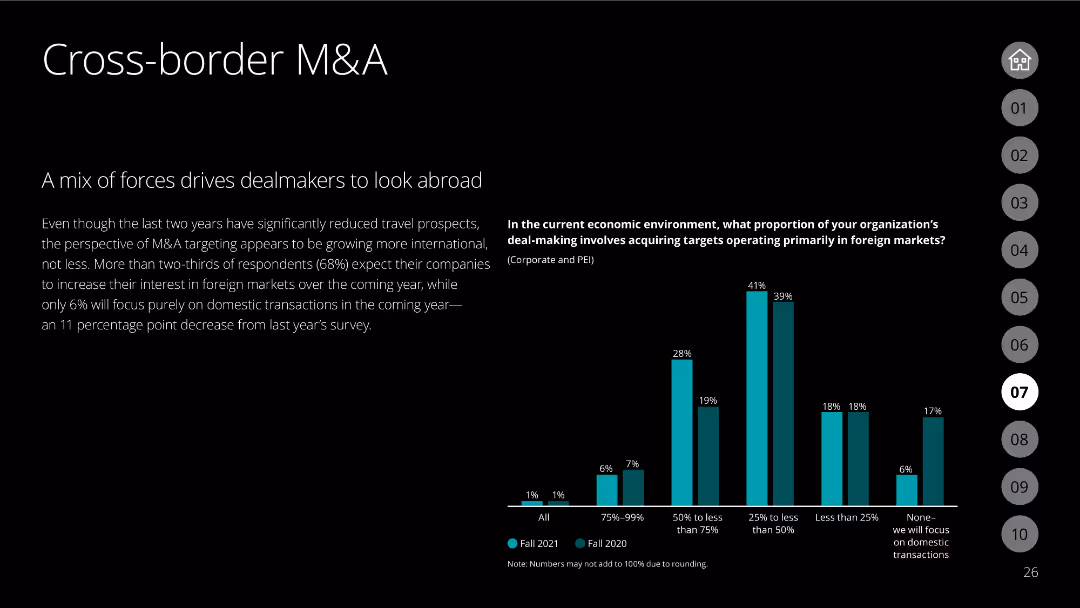
The slide features a black background with white text discussing the trend of cross-border M&A. A column chart compares the proportion of organizations focusing on foreign markets in 2020 and 2021.
Mergers and Acquisitions
Financial Services
Analyzes the shift in focus towards international markets for M&A activities, driven by survey data comparing the focus on foreign markets over two consecutive years.
cross-border M&A, international markets, foreign focus, survey comparison
false
Mergers and Acquisitions
Financial Services
Mixed Chart
Deloitte
Add to my slides
Remove from favorites
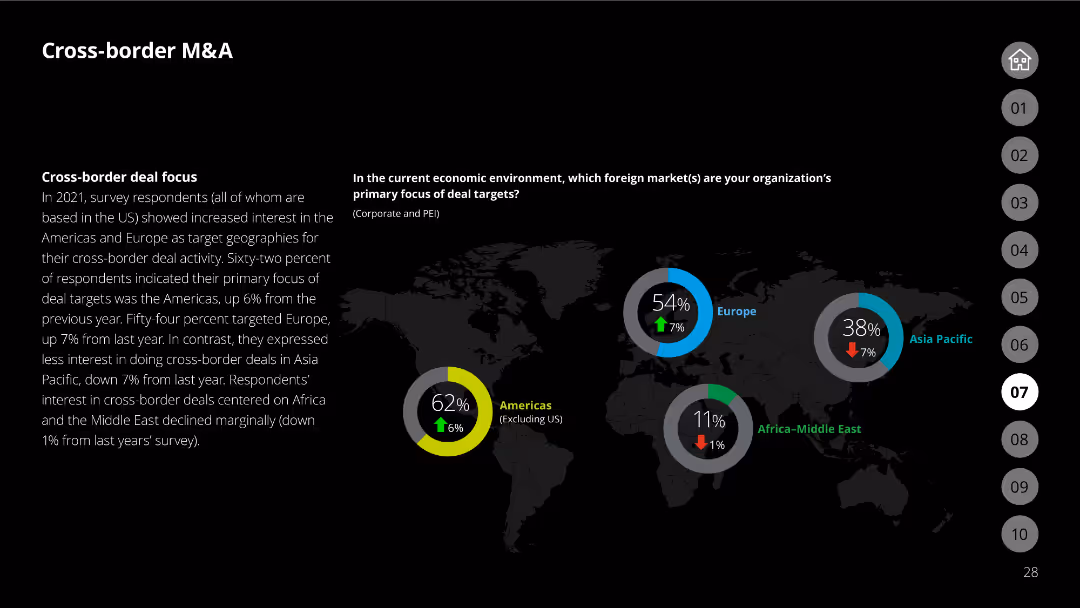
The slide includes a world map indicating the primary focus of deal targets in various regions, with percentages showing the focus in the Americas, Europe, Asia Pacific, and Africa-Middle East.
Mergers and Acquisitions
Financial Services
Discusses the regional focus of cross-border M&A activities, highlighting survey results on which foreign markets organizations are targeting most for their deals.
cross-border M&A, regional focus, foreign markets, survey results, deal targets
false
Mergers and Acquisitions
Financial Services
Multiple Chart
Deloitte
Add to my slides
Remove from favorites
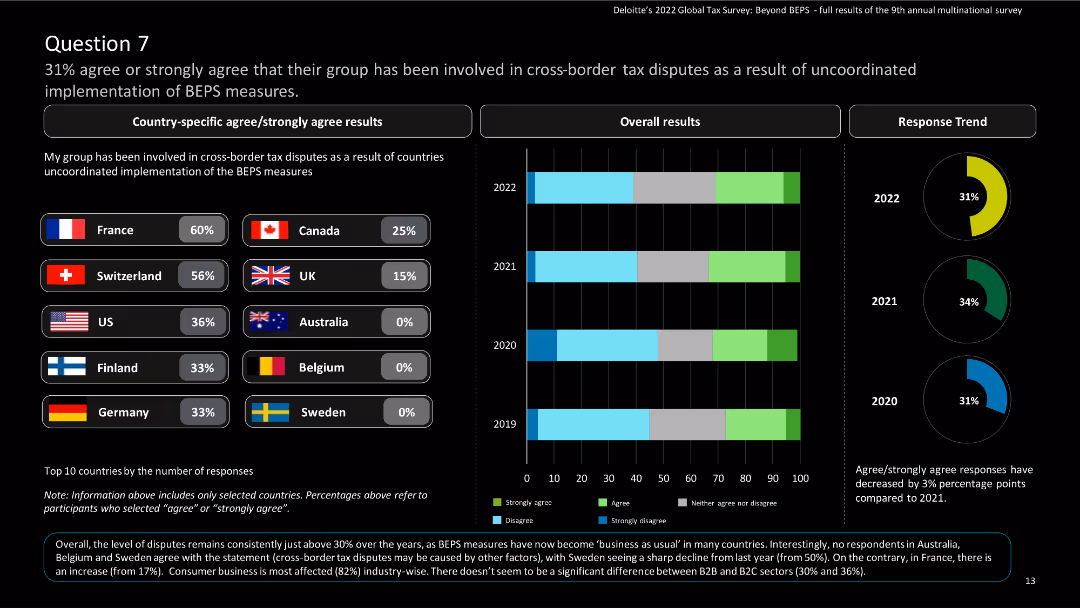
The slide features country-specific results and a column chart showing overall and response trend results over the years.
Regulatory and Compliance
Financial Services
The slide highlights cross-border tax disputes due to uncoordinated implementation of BEPS measures.
Cross-border, tax disputes, BEPS, global tax, Deloitte, agree, strongly agree, survey, multinational
false
Regulatory and Compliance
Financial Services
Multiple Chart
Deloitte
Add to my slides
Remove from favorites
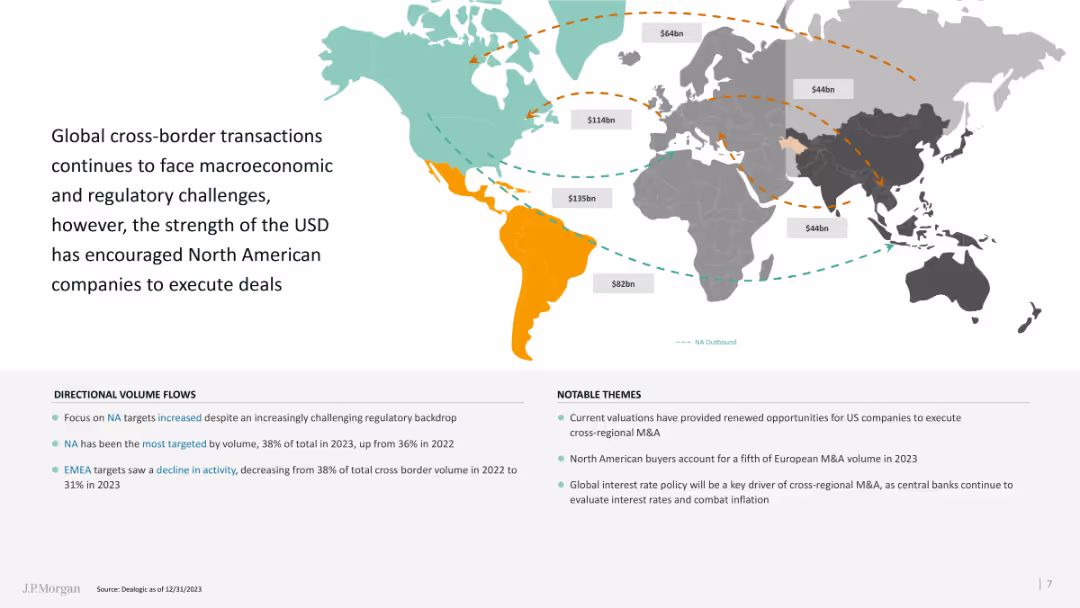
The slide includes a world map with transaction volumes marked and several directional flow arrows.
Market Analysis and Trends
Financial Services
This slide highlights global cross-border M&A activity, focusing on regional trends and the impact of USD strength.
Cross-border, transactions, global, M&A, USD strength
false
Market Analysis and Trends
Financial Services
Graphic
JP Morgan
Add to my slides
Remove from favorites
Text-heavy, detailing the benefits of integrating different GBS functions across a unified platform and a column chart
Operational Efficiency
Professional Services
Discusses cross-functional improvements, data integrity, and reduced handoffs in GBS operations.
cross-functional, GBS, improvements, data integrity, efficiency
false
Operational Efficiency
Professional Services
Mixed Chart
Deloitte
Add to my slides
Remove from favorites
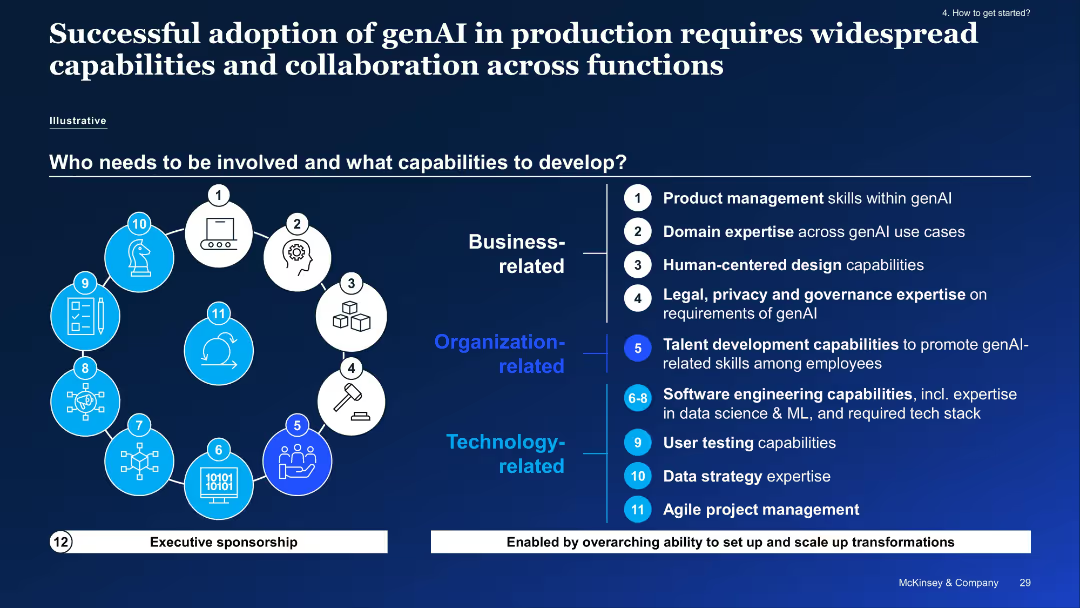
Visual icons with role-based capabilities split into business, organizational, and tech categories; key capabilities listed.
Organizational Structure and Change
Industrial & Manufacturing
Details cross-functional capabilities needed for successful genAI deployment, spanning PM skills, legal expertise, and agile project management, emphasizing executive sponsorship and transformation setup.
cross-functional, genAI, collaboration, governance, talent, data strategy, agile
false
Organizational Structure and Change
Industrial & Manufacturing
Vertical Flow
McKinsey
Add to my slides
Remove from favorites
The slide contains two charts: a line chart for Brent crude oil spot prices and a column chart for global inventory changes, both from Jan 2021 to Jan 2023.
Market Analysis and Trends
Energy & Utilities
The slide discusses the recent trends in crude oil prices and inventories, emphasizing supply-demand dynamics and future price pressures.
crude oil, prices, inventories, energy, market trends, supply-demand
false
Market Analysis and Trends
Energy & Utilities
Multiple Chart
Accenture
Add to my slides
Remove from favorites
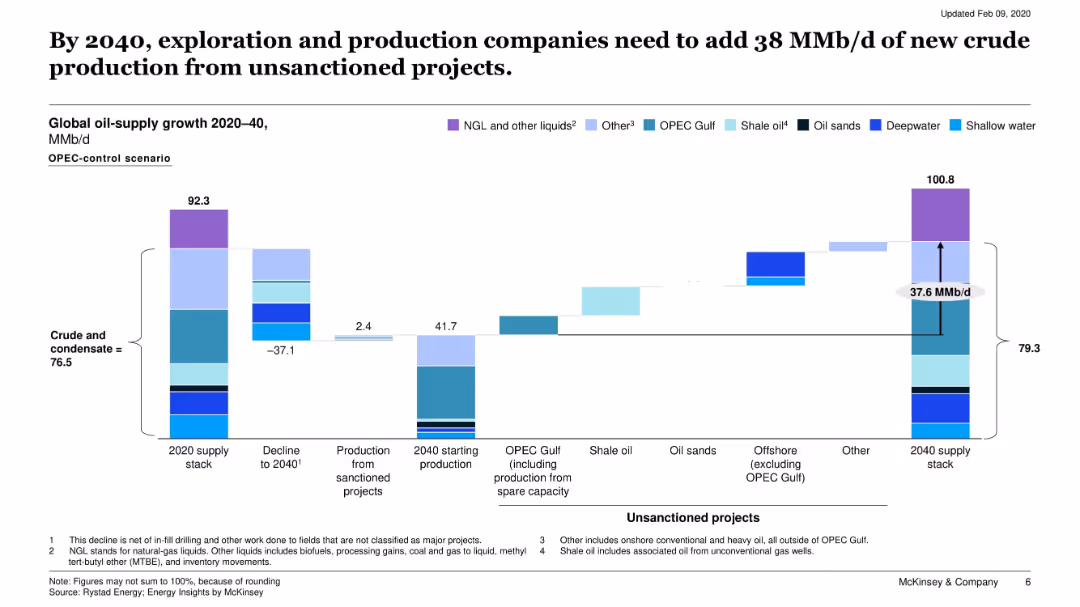
Waterfall chart showing oil supply growth from 2020 to 2040, segmented by project type and status (sanctioned, unsanctioned).
Strategic Planning
Energy & Utilities
This slide outlines the projected gap in global oil supply by 2040, requiring significant input from unsanctioned projects. It breaks down supply contributions by type (OPEC, shale, deepwater, etc.).
crude supply, unsanctioned projects, oil production, 2040 forecast, OPEC, shale
false
Strategic Planning
Energy & Utilities
Single Chart
McKinsey
Add to my slides
Remove from favorites
This slide displays a column chart illustrating various sources of crypto asset acquisitions in 2023 and 2022. The sources include trading platforms, DEX, mining, and others, with corresponding percentages.
Market Analysis and Trends
Financial Services
The slide highlights the most common sources of crypto asset acquisitions, comparing data from 2023 to 2022. It is useful for understanding how people obtain crypto assets and the shifts in acquisition methods.
Crypto, Acquisition, Sources, Trading, Comparison
false
Market Analysis and Trends
Financial Services
Mixed Chart
IPSOS
Add to my slides
Remove from favorites
Column chart showing the sources of crypto asset acquisition, with categories like centralized trading platforms, friends, and mining/staking.
Market Analysis and Trends
Financial Services
Details the various sources through which crypto asset owners acquire their assets, emphasizing the dominance of centralized trading platforms.
crypto acquisition, trading platforms, asset sources, financial analysis, market trends
false
Market Analysis and Trends
Financial Services
Mixed Chart
IPSOS
Add to my slides
Remove from favorites
The slide includes a column chart depicting different sources of crypto asset advertising in 2022 and 2023, with percentages and age group breakdowns.
Market Analysis and Trends
Media & Entertainment
It analyzes where people see crypto advertisements, such as social media, online ads, and traditional media, noting a significant decrease in overall awareness from 2022 to 2023.
Crypto ads, advertising sources, 2023, 2022, social media, online ads, traditional media, awareness, age groups
false
Market Analysis and Trends
Media & Entertainment
Multiple Chart
IPSOS
Add to my slides
Remove from favorites
The slide includes a column chart on the right showing different advertising sources for crypto assets, with corresponding percentage bars on the left. The layout is moderately complex.
Market Analysis and Trends
Financial Services
This slide highlights various sources where people have seen crypto asset advertisements, such as social media and online ads. It aims to understand the most effective advertising channels for crypto assets.
crypto, advertising, sources, media, trends
false
Market Analysis and Trends
Financial Services
Multiple Chart
IPSOS
Add to my slides
Remove from favorites
The slide features a column chart on the right showing the willingness to purchase crypto assets after seeing advertisements, with a breakdown of responses on the left. The layout is moderately complex.
Market Analysis and Trends
Financial Services
This slide examines the impact of advertising on the willingness to buy crypto assets, showing that most people remain neutral while some become more or less willing to purchase. It aims to evaluate advertising effectiveness.
crypto, advertising, willingness, impact, responses
false
Market Analysis and Trends
Financial Services
Mixed Chart
IPSOS
Add to my slides
Remove from favorites
This slide contains a column chart comparing types of crypto assets held in 2022 and 2023, with percentages and specific cryptocurrencies listed.
Market Analysis and Trends
Financial Services
It lists the cryptocurrencies and other assets held by Canadians, including Bitcoin and Ethereum, with changes in holding patterns between 2022 and 2023.
Crypto assets, 2023, 2022, holdings, Bitcoin, Ethereum, cryptocurrencies, holding patterns
false
Market Analysis and Trends
Financial Services
Multiple Chart
IPSOS
Add to my slides
Remove from favorites
Previous
Next
You don't have any favorites yet.
Please wait loading your favorites slides...
Create a FREE account to continue browsing
Receive Instant Access to 1,000+ slides from companies like McKinsey, Google, and Goldman Sachs
First Name
Last Name
Email
Password
I agree to all
Terms & Privacy Policy
Thank you! Your submission has been received!
Oops! Something went wrong while submitting the form.
Have an account?
Sign in
Upgrade to PRO to Save slides
Advanced Search and Filters
Access to 15,000+ slides
Access to Category Pages
Save/Bookmark Slides
PowerPoint Template Library
Pick a Plan
MONTHLY
$12/month
Billed every month, Cancel anytime.
YEARLY
$9/year
Billed $108 annually, Cancel anytime.
Checkout for $12/month
Checkout for $108/yr
Secured by Stripe | AES-256 bit encryption