My Account
My Slides
Search by Category
Companies
Slide Type
Use Case
Industry
Pricing
Templates
View All Templates
Download Template Slides
✦ AI
AI Prompt Library
AI Search
Feedback
Login
Logout
Get Started
Browse all Slides
Browse all Slides
Create a FREE Account
Instant access to 1,000+ real slides from top companies like McKinsey, BCG, Goldman Sachs, Google and many more!
First Name
Last Name
Email
Password
I agree to all
Terms & Privacy Policy
Thank you! Your submission has been received!
Oops! Something went wrong while submitting the form.
Have an account?
Sign in
Saved Slides
Total No. of slides saved
0
↻ Refresh
✖ Clear all
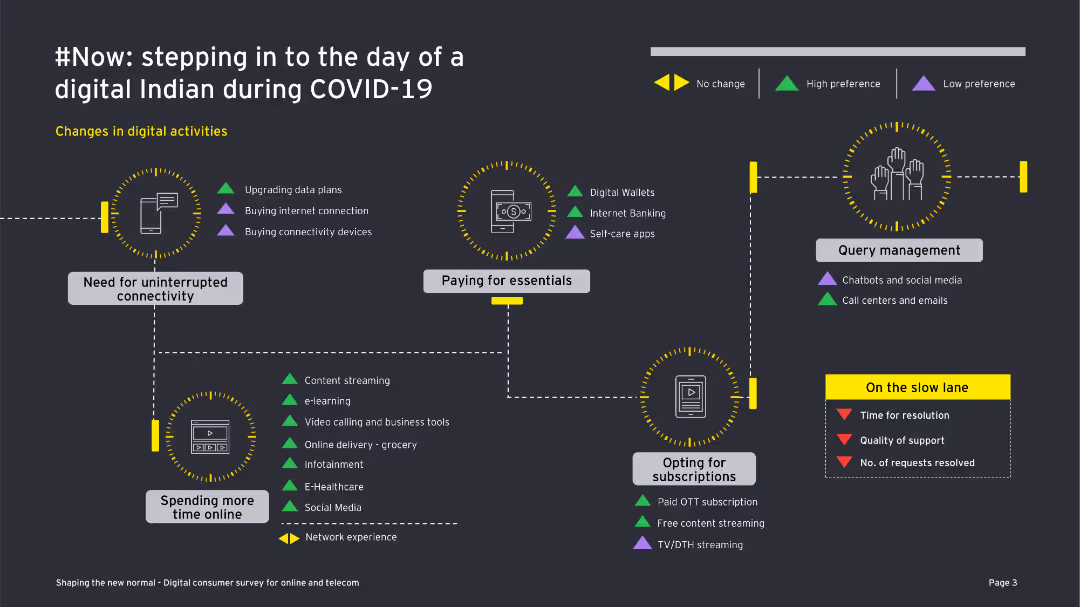
This slide contains a flowchart showing changes in digital activities with icons and directional arrows. The visual elements are moderately detailed.
Market Analysis and Trends
Telecommunications
The slide illustrates the shift in digital activities of Indian consumers during COVID-19, highlighting needs for connectivity and preferences for services.
digital activities, COVID-19, consumer behavior, connectivity, digital wallets, internet banking, e-learning, subscriptions, social media, customer support
false
Market Analysis and Trends
Telecommunications
Diagram
EY
Add to my slides
Remove from favorites
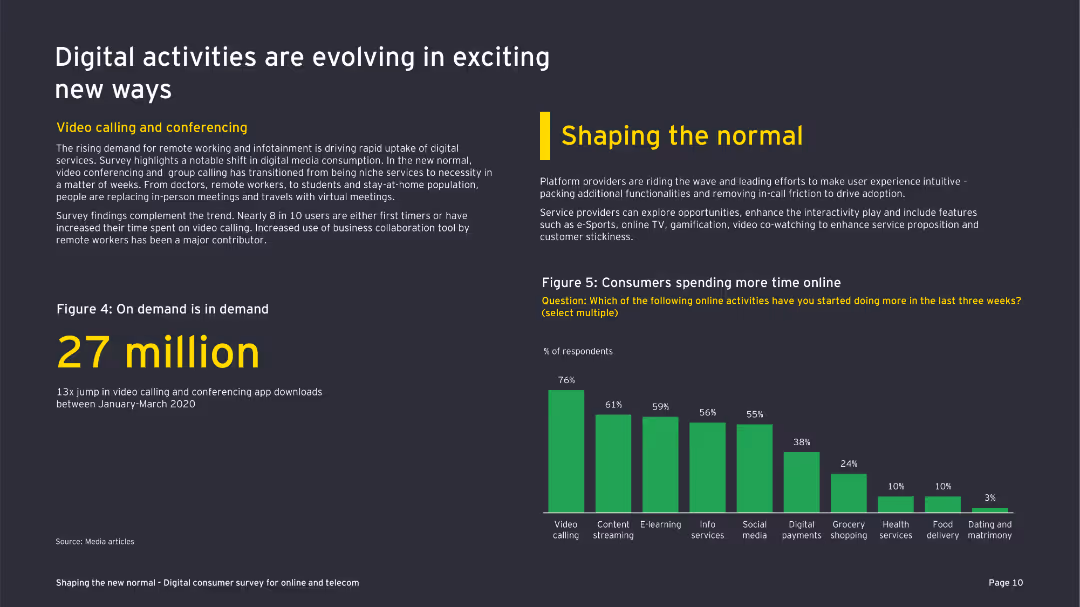
This slide features text with supporting statistics and a column chart showing increased digital activities. The layout is moderately detailed.
Technology and Digital Transformation
Telecommunications
The slide explores the evolution of digital activities such as video calling and content streaming during COVID-19, supported by survey statistics.
digital activities, video calling, content streaming, COVID-19, digital transformation, telecom, survey, consumer behavior
false
Technology and Digital Transformation
Telecommunications
Mixed Chart
EY
Add to my slides
Remove from favorites
Contains column charts comparing traditional and digital sales interactions among B2B decision-makers.
Technology and Digital Transformation
Technology & Software
Examines the rise in digital sales channels, highlighting consumer and business preferences for digital interactions over traditional methods during the COVID-19 pandemic.
Digital Adoption, B2B, Sales, COVID-19, Trends
false
Technology and Digital Transformation
Technology & Software
Multiple Chart
McKinsey
Add to my slides
Remove from favorites
The slide includes a bar chart comparing the percentage of respondents expressing various concerns about digital health adoption in 2021 versus 2022, such as patient privacy and solution incompatibility.
Risk Assessment and Management
Healthcare & Pharmaceuticals
The slide addresses the growing concerns regarding digital health adoption, highlighting issues like increased concerns about patient privacy, incompatibility between digital solutions, and the shortage of talent for developing and implementing these solutions.
Digital adoption, concerns, patient privacy, compatibility
false
Risk Assessment and Management
Healthcare & Pharmaceuticals
Single Chart
LEK
Add to my slides
Remove from favorites
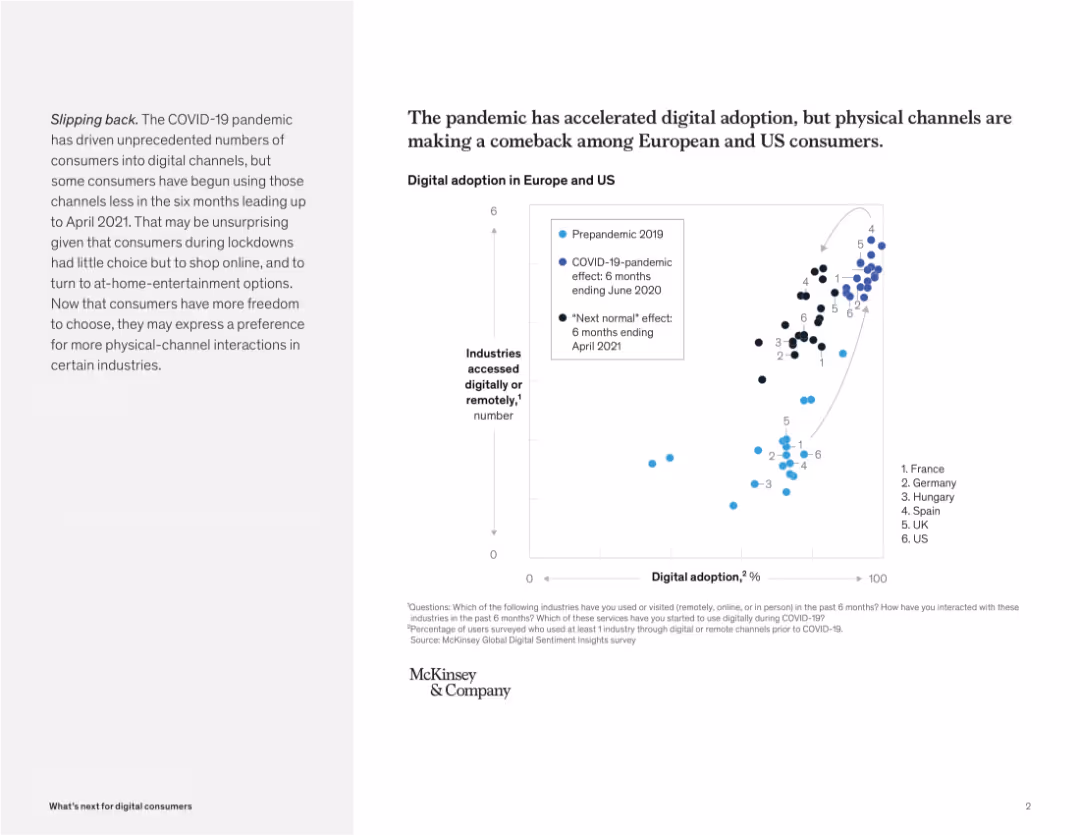
Scatterplot showing digital adoption levels over time with reference to pre-pandemic and COVID-19 periods. Paragraph on the left.
Market Analysis and Trends
Retail & E-commerce
The slide tracks shifts in digital vs. physical channel usage by consumers in Europe and the US during and after the pandemic. It reveals a potential pullback in digital usage as physical channels regain preference post-lockdown.
digital adoption, consumer behavior, pandemic trends, remote access, physical channels, Europe, US, McKinsey
false
Market Analysis and Trends
Retail & E-commerce
Mixed Chart
McKinsey
Add to my slides
Remove from favorites
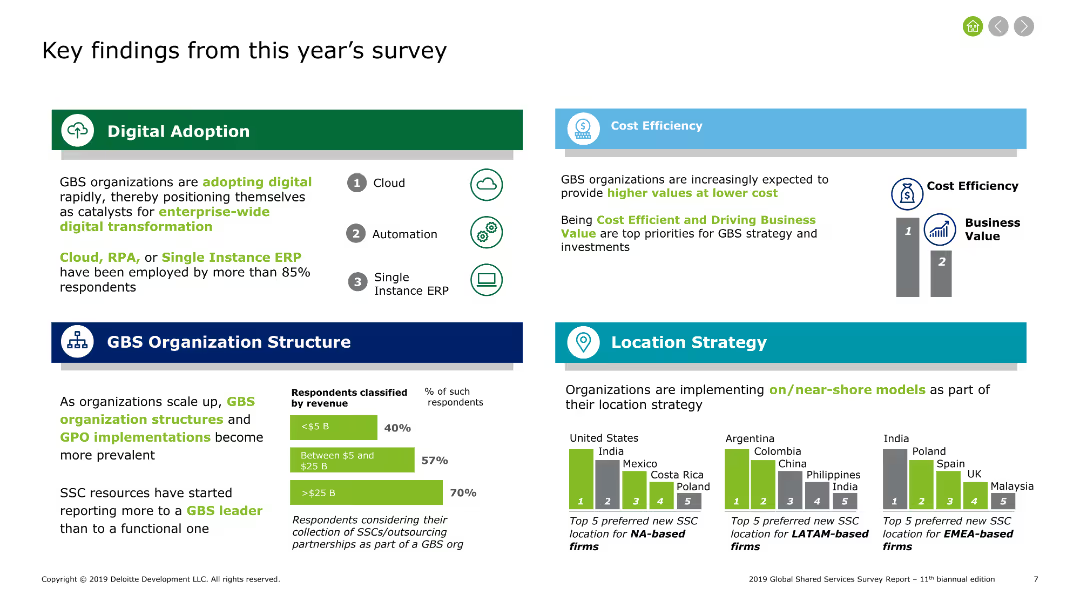
Multiple sections with text and charts outlining key findings from the survey on digital adoption, cost efficiency, organizational structure, and location strategy.
Market Analysis and Trends
Professional Services
Highlights key survey findings on digital adoption, cost efficiency, organizational changes, and location strategies, indicating significant trends and priorities in shared services.
digital adoption, cost efficiency, organization, strategy
false
Market Analysis and Trends
Professional Services
Multiple Chart
Deloitte
Add to my slides
Remove from favorites
Includes column charts comparing the implementation of digital technologies like Cloud, BI, RPA, and Cognitive & AI across regions.
Operational Efficiency
Technology & Software
Discusses the lagging adoption of digital technologies in the Nordics for cost reduction compared to other regions, projected implementation over the next 24 months, and the success outcomes of these technologies.
Digital Adoption, Cost Reduction, Technology Implementation, Nordic
false
Operational Efficiency
Technology & Software
Multiple Chart
Deloitte
Add to my slides
Remove from favorites
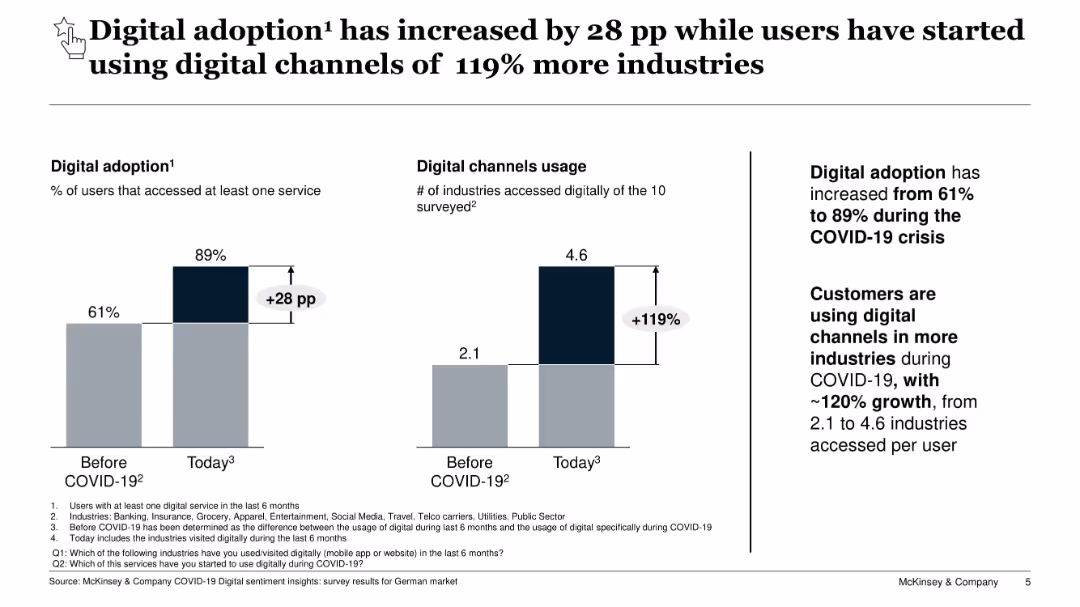
Two side-by-side bar charts showing digital service access pre- and post-COVID. Text emphasizes digital channel expansion.
Technology and Digital Transformation
Technology & Software
Shows a sharp increase in digital adoption and number of industries accessed digitally by users due to COVID-19. Highlights the behavioral shift in consumer engagement across industries in the German market.
digital adoption, COVID-19, consumer behavior, digital transformation
false
Technology and Digital Transformation
Technology & Software
Mixed Chart
McKinsey
Add to my slides
Remove from favorites
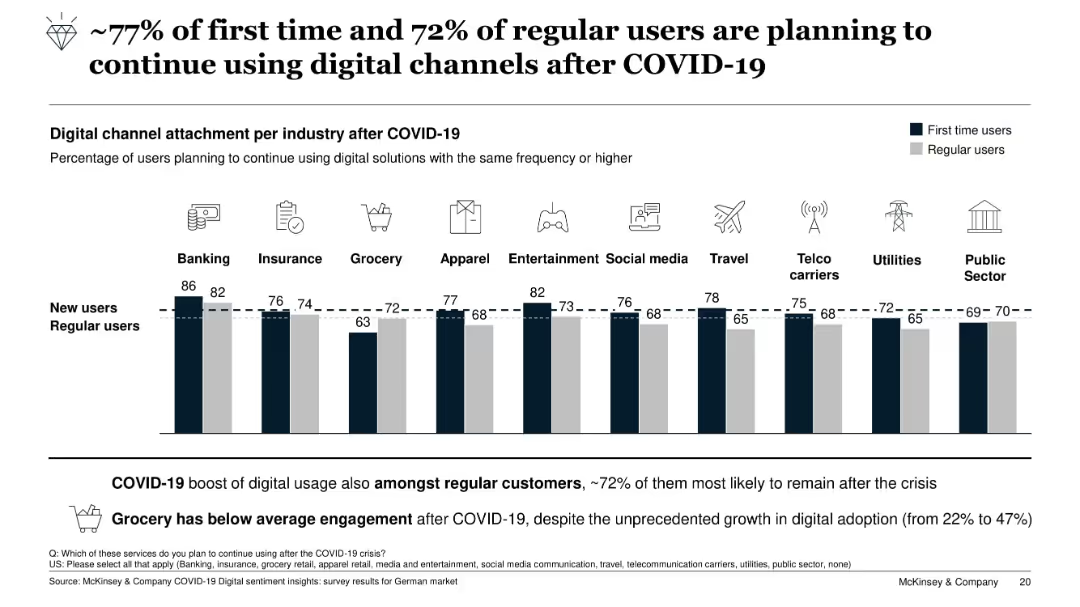
Bar chart comparing percentage of first-time vs regular users intending to continue using digital channels post-COVID-19, categorized by industry
Strategic Planning
Technology & Software
This slide shows strong digital channel retention post-COVID-19, especially in banking and entertainment. Even first-time users are likely to continue. Grocery shows the weakest engagement retention. The trend underscores the pandemic’s push towards permanent digital habits.
digital adoption, COVID-19, consumer behavior, retention, grocery, banking, user trends
false
Strategic Planning
Technology & Software
Single Chart
McKinsey
Add to my slides
Remove from favorites
This slide displays percentages and bullet points detailing the increase in usage of digital services like online retail, digital wallets, and streaming services. Each chart is accompanied by explanatory text.
Technology and Digital Transformation
Technology & Software
Explores the surge in digital tool adoption among consumers, driven by the pandemic, and compares it to historical trends such as the SARS outbreak. Highlights the increased dependence on digital platforms and services.
Digital Adoption, COVID-19, E-commerce, Streaming
false
Technology and Digital Transformation
Technology & Software
Header Horizontal
BCG
Add to my slides
Remove from favorites
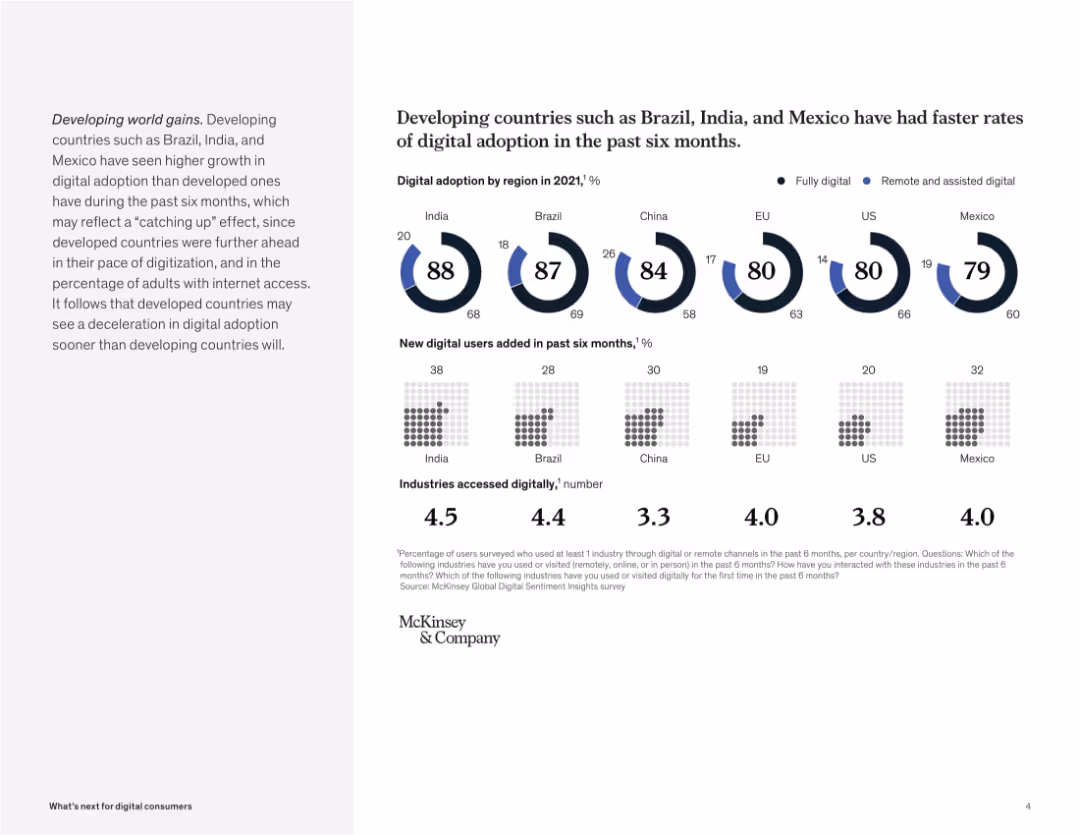
Circular progress charts and grids display digital adoption levels, new digital users, and industries accessed across countries.
Industry Overview
Telecommunications
The slide compares digital adoption across developed and developing countries, showing that emerging markets like India and Brazil are growing faster in adoption and new user generation, though this may be a catch-up effect.
digital adoption, emerging markets, Brazil, India, Mexico, remote access, industry engagement, technology growth, McKinsey
false
Industry Overview
Telecommunications
Multiple Chart
McKinsey
Add to my slides
Remove from favorites
Showcases column charts for digital application starts and loan engagement, and a large light blue bar indicating the growth of visitors on the MyHome platform. Annotations provide additional context for the data.
Operational Efficiency
Financial Services
Highlights the growth of digital adoption in the home lending process, with an increase in applications started digitally, customer engagement with digital loan capabilities, and MyHome platform traffic, leading to improved customer outcomes.
Digital Adoption, Home Lending, Customer Engagement, Platform Growth, Efficiency
false
Operational Efficiency
Financial Services
Multiple Chart
JP Morgan
Add to my slides
Remove from favorites
Bullet points and icons create a navigable visual hierarchy. The design is straightforward, highlighting the key imperatives for digital adoption acceleration.
Strategic Planning
Technology & Software
Focuses on the imperatives that need to be accelerated to boost digital adoption in Indonesia. Aimed at guiding government policy development and enhancing the Indonesian internet economy, especially in tier 2 and 3 cities.
Digital Adoption, Imperatives, Policy Development, Internet Economy, Indonesia, Tier 2 and 3 Cities, Government
false
Strategic Planning
Technology & Software
Pillar
Kearney
Add to my slides
Remove from favorites
Matrix arrangement of icons representing digital adoption enablers against a grayscale backdrop. Organized and digestible presentation of key elements.
Market Analysis and Trends
Technology & Software
Evaluates Indonesia's digital ecosystem, identifying enablers for digital adoption. Useful for stakeholders to assess capabilities and strategize on improving digital infrastructure and policy.
Digital Adoption, Infrastructure, Access to Capital, Regulatory, Talent Development, Consumer Education, Ecosystem
false
Market Analysis and Trends
Technology & Software
Pillar
Kearney
Add to my slides
Remove from favorites
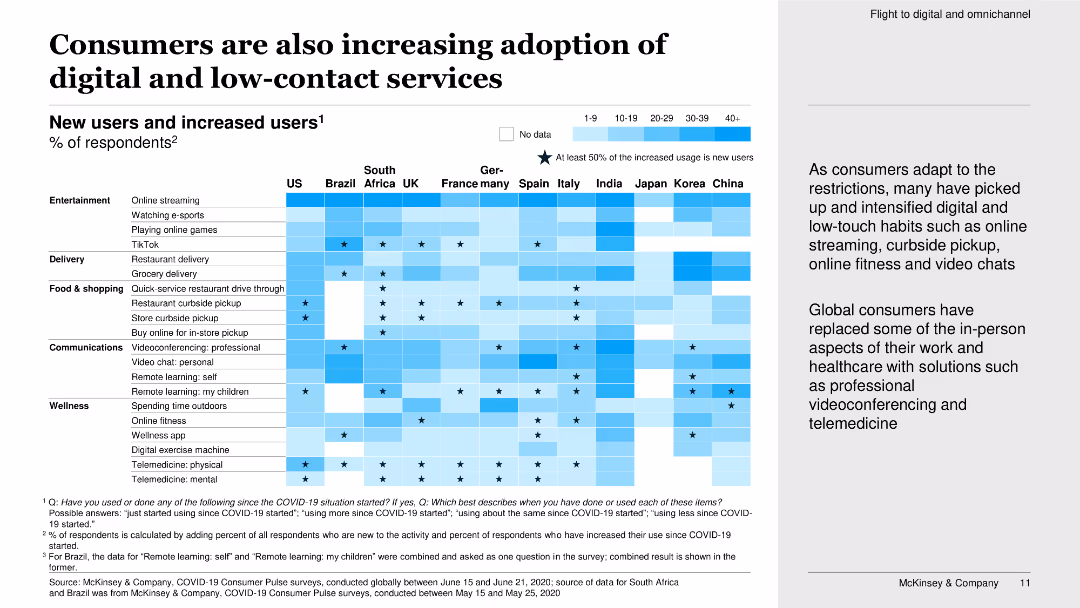
This slide features a heatmap chart showing the percentage of new and increased users of various digital and low-contact services during COVID-19.
Market Analysis and Trends
Technology & Software
The slide examines the adoption of digital and low-contact services during COVID-19, indicating a significant rise in new and increased users for these services.
digital adoption, low-contact services, COVID-19, heatmap, new users, increased users, survey, consumer behavior
false
Market Analysis and Trends
Technology & Software
Boxed
McKinsey
Add to my slides
Remove from favorites
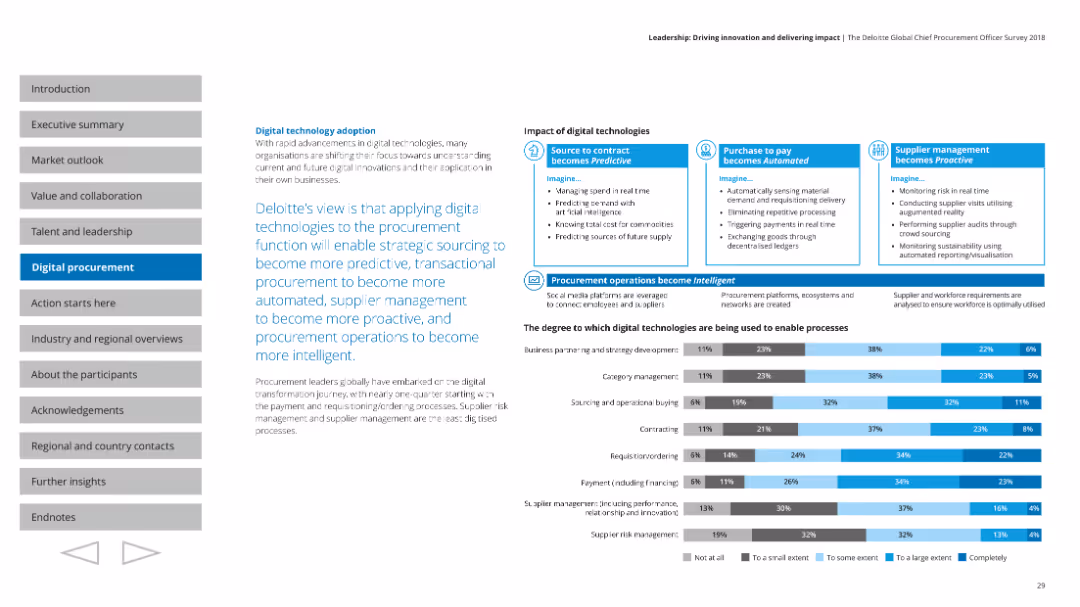
Contains a combination of charts and descriptive text blocks, highlighting the impact of digital technologies on procurement processes and strategies.
Technology and Digital Transformation
Professional Services
Describes the role of digital technologies in transforming procurement functions, making them more predictive, automated, and proactive.
Digital adoption, procurement, strategy, technology impact
false
Technology and Digital Transformation
Professional Services
Mixed Chart
Deloitte
Add to my slides
Remove from favorites
A comparative slide with a two-column list ranking barriers to adoption by geography, complemented by side notes highlighting regional nuances.
Strategic Planning
Technology & Software
Highlights the regional differences in barriers to digital adoption between Java and non-Java areas, emphasizing the importance of a localized approach for startups and investors.
digital adoption, regional barriers, Java, non-Java, Indonesia, startups, investors
false
Strategic Planning
Technology & Software
Table
Kearney
Add to my slides
Remove from favorites
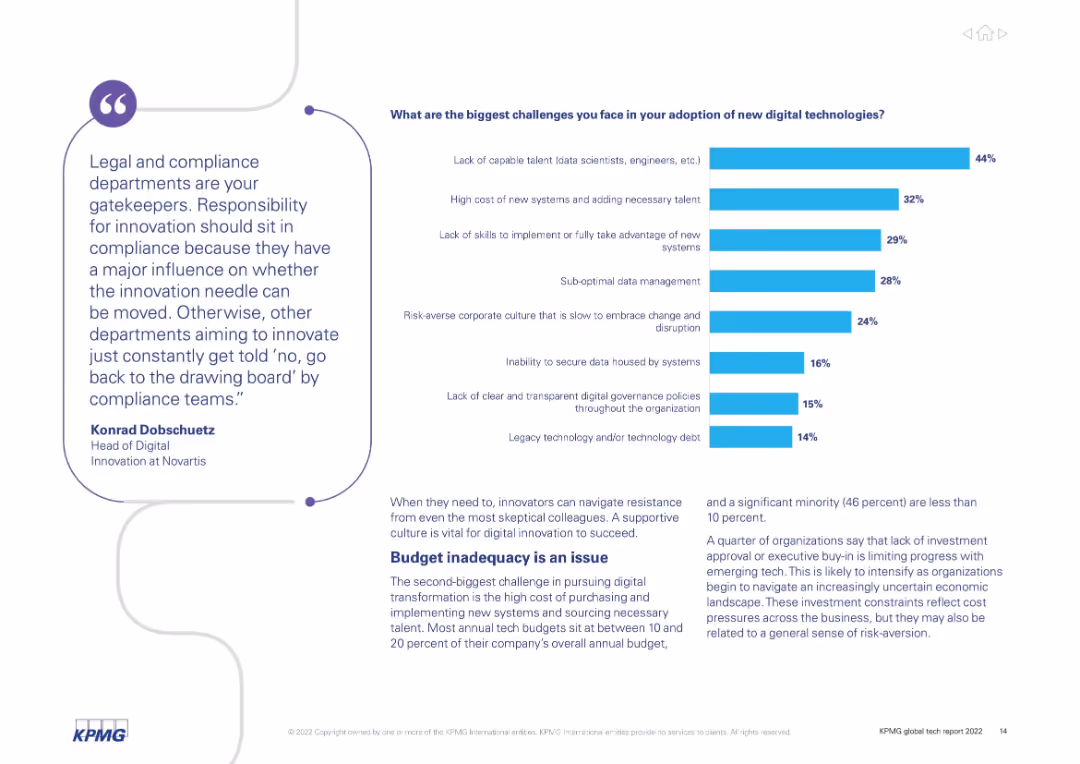
Split layout: left side features a quotation in a large speech bubble; right side contains a horizontal bar chart with ranked adoption challenges in blue.
Technology and Digital Transformation
Technology & Software
Highlights key barriers to digital technology adoption, including lack of capable talent, high system costs, and sub-optimal data management. Also discusses cultural and budget-related obstacles to innovation.
digital adoption, talent gap, system cost, compliance, innovation, risk-aversion, governance, budget constraints
false
Technology and Digital Transformation
Technology & Software
Mixed Chart
KPMG
Add to my slides
Remove from favorites
A line graph depicts the digital adoption curve over time, contrasting metropolitan areas with tier 2 and 3 cities, alongside descriptive texts.
Strategic Planning
Technology & Software
The slide predicts the digital adoption trends in Indonesia, with tier 2 and 3 cities catching up to the digital habits of tier 1 cities within the next five years.
digital adoption, trend analysis, metropolitan areas, tier cities, Indonesia, technology use
false
Strategic Planning
Technology & Software
Mixed Chart
Kearney
Add to my slides
Remove from favorites
This slide displays a column chart with six sets of bars representing different digital service sectors. It contrasts the incremental adoption in H1 2022 with adoption as of 2021. Annotations provide insights on e-commerce and digital media consumption. Colors vary in shades of blue.
Market Analysis and Trends
Technology & Software
The slide analyzes the normalization of digital adoption growth post-acceleration phase, showing the saturation in various sectors such as e-commerce and digital media. It is a market analysis tool that can be used to gauge the digital service sector's plateau in growth and the potential for market consolidation or diversification.
digital adoption, urban users, SEA, e-commerce, normalization, growth, sector saturation, column chart
false
Market Analysis and Trends
Technology & Software
Single Chart
Bain
Add to my slides
Remove from favorites
An illustrative slide with two figures and accompanying icons and text boxes, outlining benefits of digitalization in terms of revenue, profit, productivity, and wages.
Investment Analysis
Technology & Software
It showcases the advantages of being digitally advanced, contrasting the benefits accrued by 'digital haves' versus 'have-mores'. The slide could be used to argue for increased digital investment in a strategic business context.
digital, advantages, business, investment, strategy
false
Investment Analysis
Technology & Software
Uncategorized
McKinsey
Add to my slides
Remove from favorites
This slide contains pie charts and bullet points. The pie charts for 2018 and 2027 show the shift from non-digital to digital advertising in Hong Kong compared to global trends. The layout neatly contrasts the scenarios over time with well-labeled charts and supportive text explaining the trend toward digital advertising due to technology advancements and social media influence.
Market Analysis and Trends
Media & Entertainment
Offers a comparative analysis of the shift in advertising from non-digital to digital platforms in Hong Kong and globally. Useful for understanding market trends and the impact of digital transformation on advertising strategies.
digital advertising, Hong Kong, global trends, market shift, technology impact, social media
false
Market Analysis and Trends
Media & Entertainment
Multiple Chart
PwC/Strategy&
Add to my slides
Remove from favorites
Provides insights into digital advertising strategies with column charts showing growth rates in digital communication spending across different industries, focusing on social media and video platforms.
Market Analysis and Trends
Media & Entertainment
Explores how different industries are uniquely increasing their digital advertising efforts, particularly through social media and video, highlighting the universal shift towards these platforms.
digital advertising, industry trends, social media, video platforms, marketing strategies
false
Market Analysis and Trends
Media & Entertainment
Mixed Chart
Bain
Add to my slides
Remove from favorites
Features column charts and textual analysis comparing customer use of online and offline channels for different types of purchases, focusing on percentages of usage across various industries.
Market Analysis and Trends
Retail & E-commerce
Analyzes the shift in consumer behavior towards online platforms and digital channels, noting significant trends in how different sectors are adapting to the digital age.
digital age, consumer behavior, online shopping, channel usage, retail
false
Market Analysis and Trends
Retail & E-commerce
Multiple Chart
Bain
Add to my slides
Remove from favorites
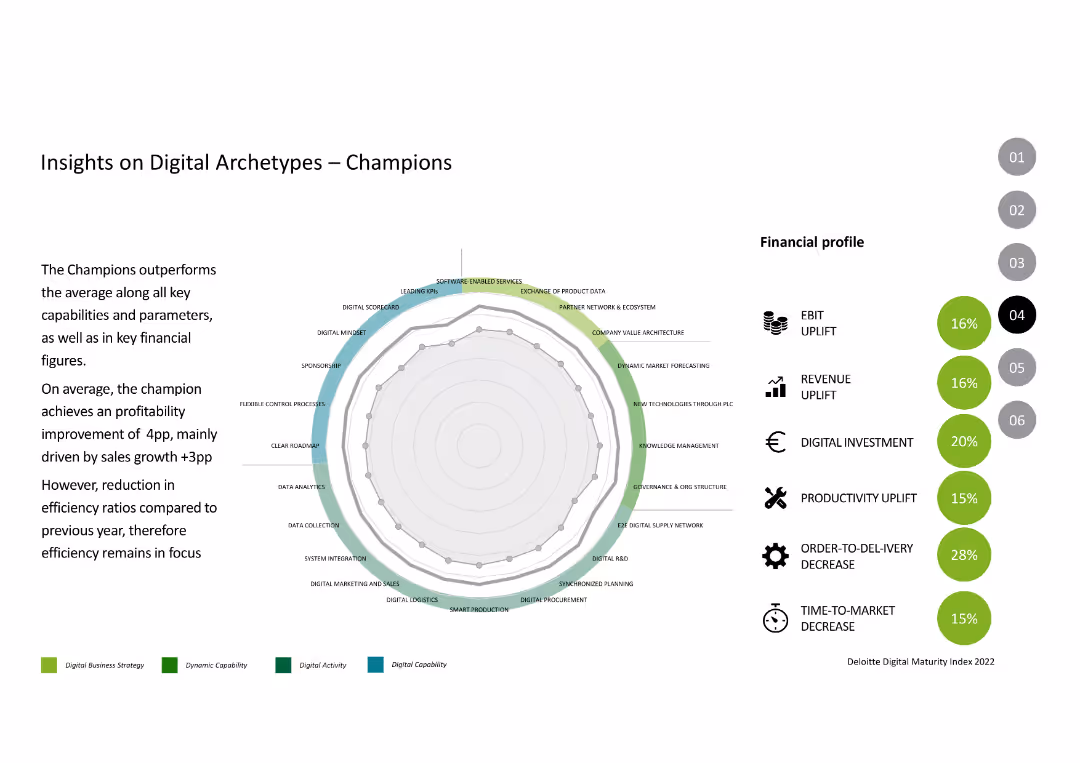
The slide features a radar chart with multiple parameters like digital mindset, market forecasting, and software-enabled services, alongside financial profile metrics like EBIT and revenue uplift.
Competitive Landscape
Industrial & Manufacturing
This slide analyzes the performance of "Champions" in digital transformation, highlighting their strengths in various digital capabilities and financial metrics.
Digital Archetypes, Champions, Performance, Digital Transformation, Financial Metrics
false
Competitive Landscape
Industrial & Manufacturing
Mixed Chart
Deloitte
Add to my slides
Remove from favorites
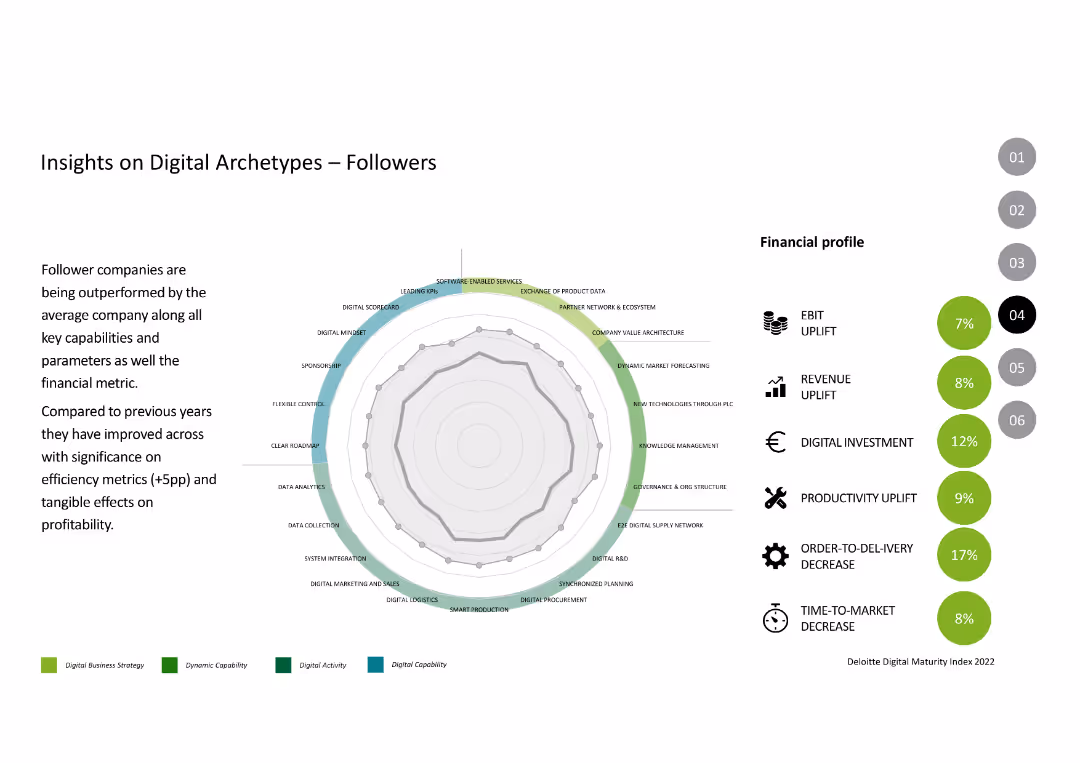
The slide contains a radar chart and financial profile metrics like EBIT uplift, revenue uplift, and productivity uplift, similar to other archetype slides.
Competitive Landscape
Industrial & Manufacturing
The slide provides insights into the "Followers" archetype, showing how they are outperformed by the average company but have made significant improvements in efficiency and profitability.
Digital Archetypes, Followers, Performance, Digital Capabilities, Financial Metrics
false
Competitive Landscape
Industrial & Manufacturing
Mixed Chart
Deloitte
Add to my slides
Remove from favorites
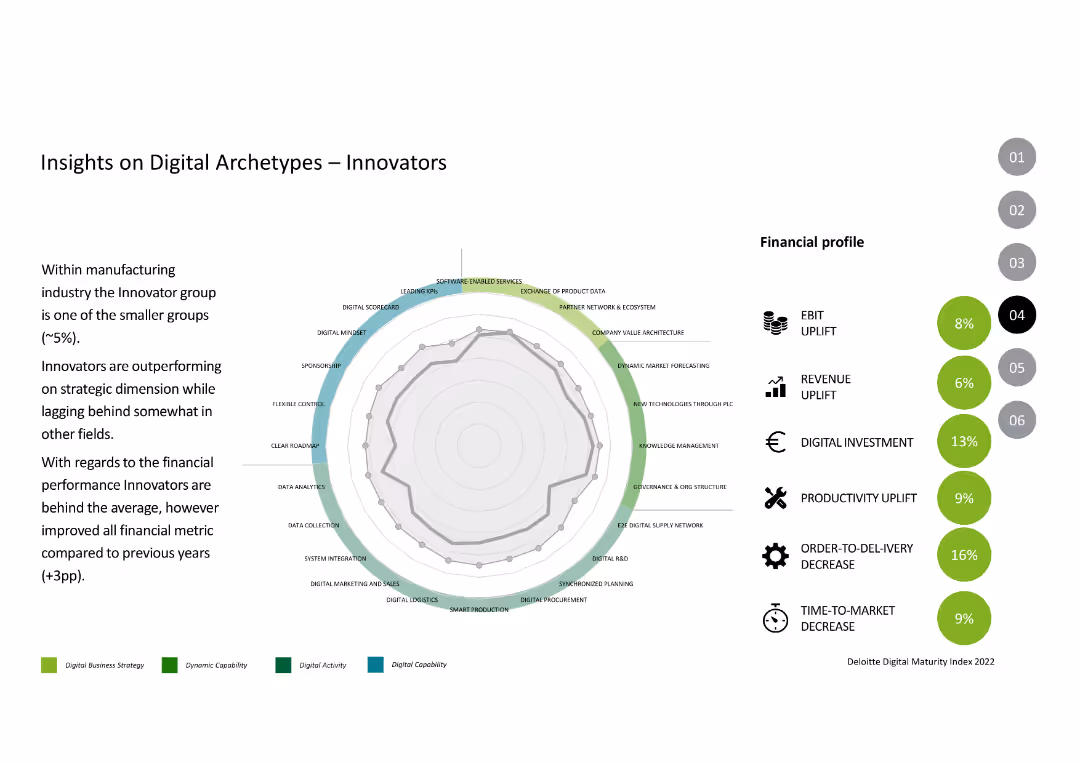
The slide features a radar chart with various parameters like digital mindset and software-enabled services, along with financial metrics such as EBIT and revenue uplift.
Competitive Landscape
Industrial & Manufacturing
This slide describes the "Innovators" archetype, focusing on their strengths in strategic dimensions and improvements in financial performance compared to previous years.
Digital Archetypes, Innovators, Performance, Digital Capabilities, Financial Metrics
false
Competitive Landscape
Industrial & Manufacturing
Mixed Chart
Deloitte
Add to my slides
Remove from favorites
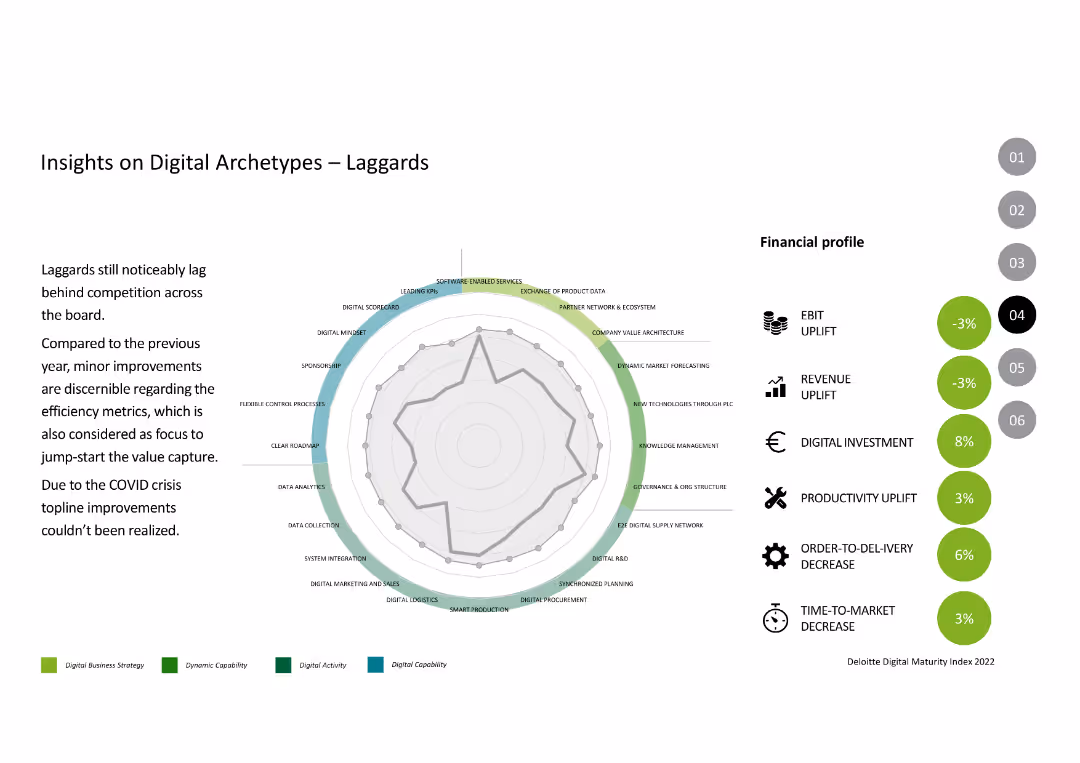
The slide features a radar chart and financial profile metrics like EBIT uplift, revenue uplift, and productivity uplift, similar to previous archetype slides.
Competitive Landscape
Industrial & Manufacturing
This slide discusses the "Laggards" archetype, focusing on their lagging performance compared to competition, highlighting their minor improvements and impact of the COVID crisis.
Digital Archetypes, Laggards, Performance, Digital Capabilities, Financial Metrics
false
Competitive Landscape
Industrial & Manufacturing
Mixed Chart
Deloitte
Add to my slides
Remove from favorites
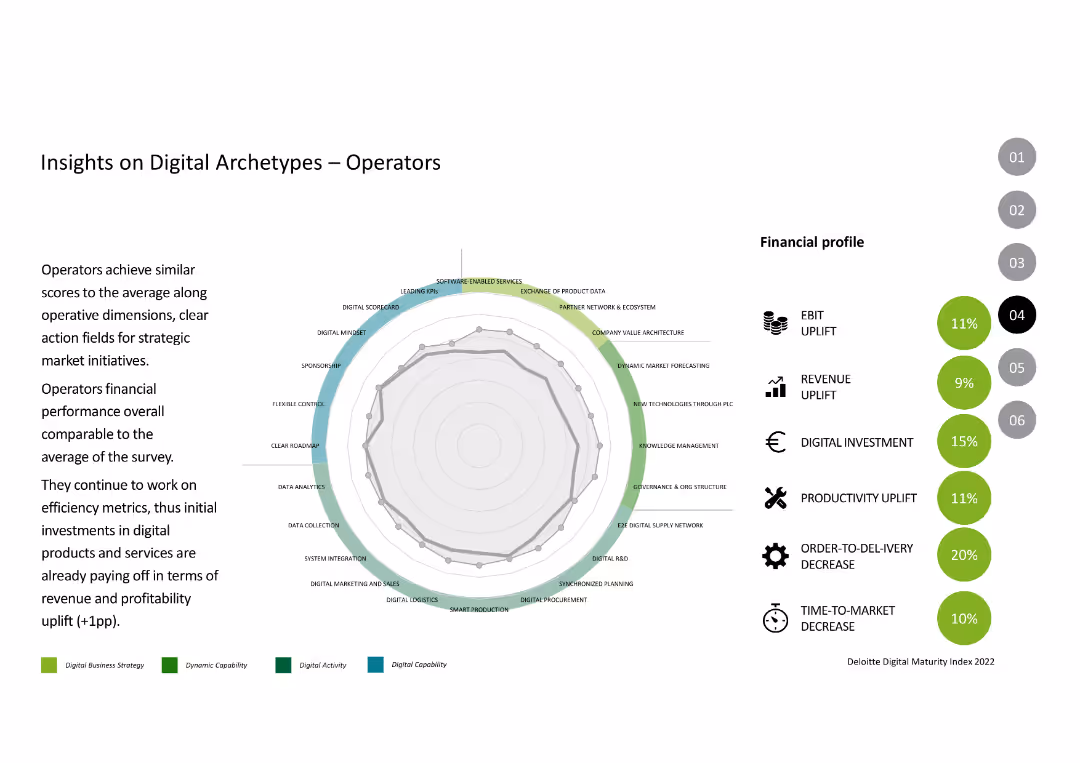
The slide includes a radar chart showing capabilities and financial metrics like EBIT uplift, revenue uplift, and productivity uplift, similar to previous archetype slides.
Competitive Landscape
Industrial & Manufacturing
The slide analyzes the "Operators" archetype, comparing their digital capabilities and financial performance to the average, highlighting their strengths and areas for improvement.
Digital Archetypes, Operators, Performance, Digital Capabilities, Financial Metrics
false
Competitive Landscape
Industrial & Manufacturing
Mixed Chart
Deloitte
Add to my slides
Remove from favorites
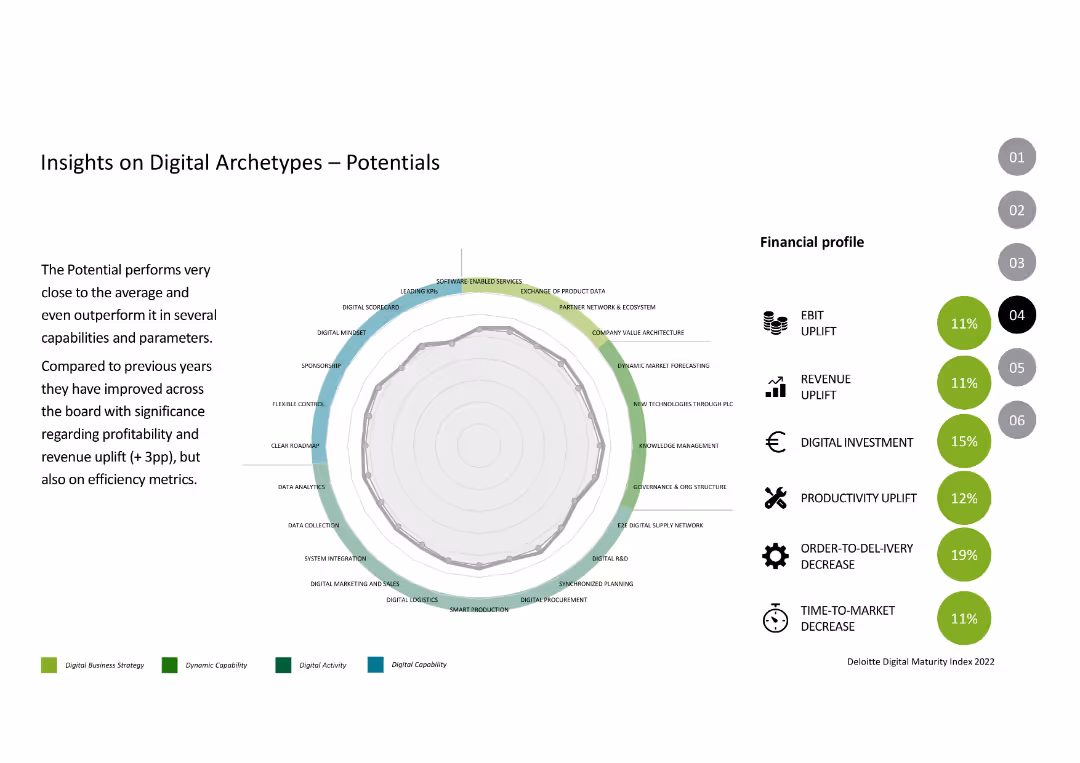
The slide includes a radar chart showing capabilities and parameters, with financial profile metrics like EBIT, revenue uplift, and productivity uplift.
Competitive Landscape
Industrial & Manufacturing
The slide discusses the "Potentials" archetype, showing their improvement in digital capabilities and financial performance over the previous year.
Digital Archetypes, Potentials, Performance, Digital Capabilities, Financial Metrics
false
Competitive Landscape
Industrial & Manufacturing
Mixed Chart
Deloitte
Add to my slides
Remove from favorites
Five sections each with an icon and text: Native tokens, Stablecoins & CBDCs, Governance tokens, NFTs, Tokenized real world assets. Icons represent various digital assets.
Product and Service Analysis
Financial Services
Describes five types of digital assets issued on blockchains: native tokens, stablecoins, governance tokens, NFTs, and tokenized real world assets. For product categorization in blockchain services.
Digital Assets, Blockchain, NFTs, Stablecoins, Governance, Tokenization, Real World Assets
false
Product and Service Analysis
Financial Services
Table
McKinsey
Add to my slides
Remove from favorites
Flow chart showing the evolution of digital asset use cases: Store of value, Medium of exchange, Financial services. Icons and descriptions for each phase.
Strategic Planning
Financial Services
Describes the evolution and future potential of digital asset use cases in financial services. Ideal for strategic discussions on the adoption and integration of digital assets.
Digital Assets, Evolution, Financial Services, Use Cases, Store of Value, Medium of Exchange
false
Strategic Planning
Financial Services
Linear Flow
McKinsey
Add to my slides
Remove from favorites
Layout showing a variety of financial service segments and their engagements with digital assets.
Technology and Digital Transformation
Financial Services
Explains the diversification of traditional financial services into digital assets, highlighting major players and their roles.
Digital Assets, Finance, Banks, Investment, Innovation
false
Technology and Digital Transformation
Financial Services
Table
McKinsey
Add to my slides
Remove from favorites
A table and a graph showing digital asset engagement in various countries. Highlighting data points and percentages.
Market Analysis and Trends
Financial Services
Analyzes global engagement with digital assets, detailing percentages of adults involved in digital assets across multiple countries, with future engagement predictions. Useful for market analysis presentations.
Digital Assets, Global, Engagement, Market Analysis, Trends, Predictions, Countries
false
Market Analysis and Trends
Financial Services
Boxed
McKinsey
Add to my slides
Remove from favorites
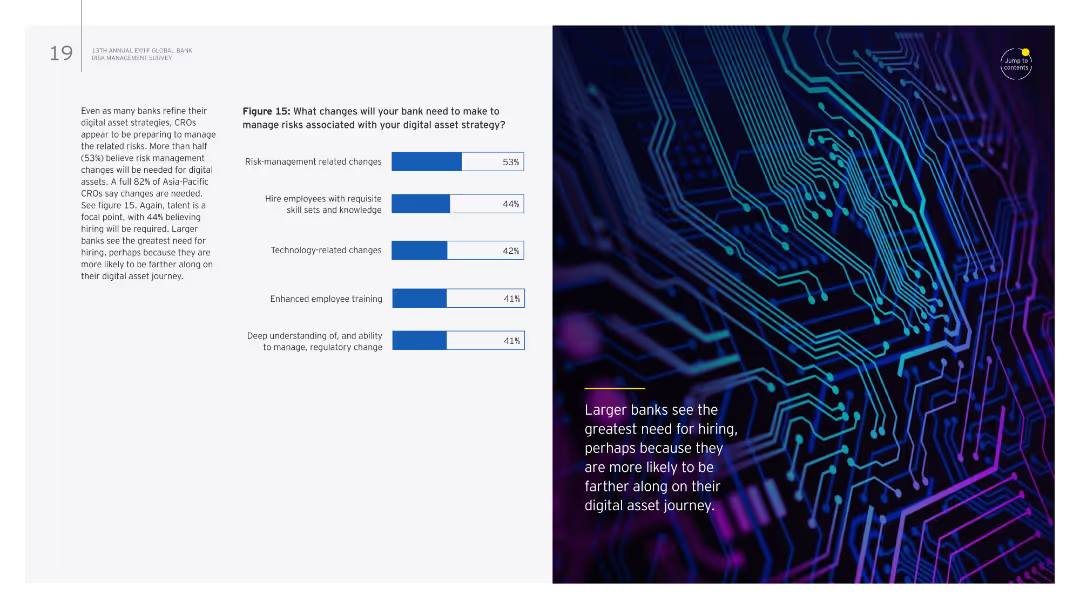
The slide features a column chart detailing necessary changes to manage risks associated with digital asset strategies, highlighting risk management and technology-related changes.
Risk Assessment and Management
Financial Services
This slide identifies necessary changes for managing risks associated with digital asset strategies, emphasizing the importance of risk management-related changes and enhanced employee training.
digital assets, risk management, column chart, changes
false
Risk Assessment and Management
Financial Services
Multiple Chart
EY
Add to my slides
Remove from favorites
The slide combines text with a column chart on the right. The chart lists changes needed in banks to manage risks associated with digital asset strategies.
Risk Assessment and Management
Financial Services
It details necessary changes for banks to manage digital asset strategy risks, focusing on risk management, hiring, technology, training, and regulatory understanding.
Digital assets, risk management, hiring, technology, training
false
Risk Assessment and Management
Financial Services
Mixed Chart
EY
Add to my slides
Remove from favorites
The slide features text and two column charts. The charts outline elements of digital asset strategy pursued by banks and methods for informing the strategy.
Technology and Digital Transformation
Financial Services
It discusses the development of digital asset strategies by banks, including key elements and methods for effectively implementing and managing digital assets.
Digital assets, strategy, development, banks, management
false
Technology and Digital Transformation
Financial Services
Multiple Chart
EY
Add to my slides
Remove from favorites
This slide juxtaposes text with icons and diagrams. The left side has bullet points, and the right side displays a flowchart of a digital banking platform ecosystem. The use of space is balanced, with the Macquarie logo at the bottom left.
Technology and Digital Transformation
Financial Services
The slide communicates the bank's commitment to technology, detailing cloud migration strategies and data analytics platforms. It highlights key technological advancements within banking services, emphasizing a move towards cloud-based platforms to enhance service delivery and operations.
digital banking, cloud migration, data analytics, technology, platform, services, strategy
false
Technology and Digital Transformation
Financial Services
Header Vertical
Morgan Stanley
Add to my slides
Remove from favorites
A Venn diagram centralizes the slide, flanked by bulleted text that presents the bank's criteria, competitive advantages, and value proposition. The layout is engaging, using color to differentiate between elements.
Technology and Digital Transformation
Financial Services
The slide provides insights into the firm's vision and strategic criteria for establishing a leading digital consumer bank, emphasizing its strengths and customer-centric value proposition.
digital banking, consumer finance, strategy, value proposition
false
Technology and Digital Transformation
Financial Services
Table
Goldman Sachs
Add to my slides
Remove from favorites
Slide includes a side-by-side comparison of digital platform statistics and a US map showing branch network distribution. It highlights the digital banking platform's features with screenshots and boasts impressive engagement metrics with clean iconography and a blue color scheme to complement the bank's branding.
Financial Performance
Financial Services
Describes the success of a digital banking platform, illustrating customer engagement metrics and branch distribution. It underscores the ease of doing business with the bank through its digital services and branch network, emphasizing customer satisfaction and accessibility.
Digital Banking, Customer Engagement, Branch Network, User Metrics, Accessibility, Customer Satisfaction
false
Financial Performance
Financial Services
Mixed Chart
JP Morgan
Add to my slides
Remove from favorites
Dominated by large column charts, this slide visually compares customer, deposit balance, loan/card balance, and revenue growth over a three-year period. The use of contrasting colors highlights the growth in each segment.
Financial Performance
Financial Services
It communicates the progress of the firm’s digital banking services, reflecting on the expansion in customer numbers, deposit and loan balances, and revenue, showing substantial growth since inception.
digital banking, customer growth, deposit balance, revenue growth
false
Financial Performance
Financial Services
Multiple Chart
Goldman Sachs
Add to my slides
Remove from favorites
This slide is divided into two main sections, with the left side featuring a table with two columns for SMEs and Individuals, and the right side presenting a numbered list of key points about the Santander Global Platform. The table includes logos of affiliated services. There's a significant amount of text, and visual aids like arrows and numbers guide the reader through the content. The color scheme is a mix of red, blue, and white, with the Santander logo prominently placed at the top.
Market Analysis and Trends
Financial Services
The slide analyzes the Santander Global Platform's offerings for SMEs and individuals and outlines the strategy for digital banking solutions. It's appropriate for presentations discussing digital transformation, payment solutions, and market expansion strategies.
Digital Banking, Global Payments, SMEs, Individuals, Santander, Fintech, Open Platform, Banking Solutions, Financial Services
false
Market Analysis and Trends
Financial Services
Vertical Flow
Morgan Stanley
Add to my slides
Remove from favorites
Features column charts and informational text blocks discussing international banking revenue and digital banking.
Market Analysis and Trends
Financial Services
The slide outlines JPMorgan's strategy and positioning for growth in digital banking outside the U.S., with projections and comparative analysis.
Digital banking, market growth, international, revenue, cost analysis, traditional banking, digital challengers
false
Market Analysis and Trends
Financial Services
Multiple Chart
JP Morgan
Add to my slides
Remove from favorites
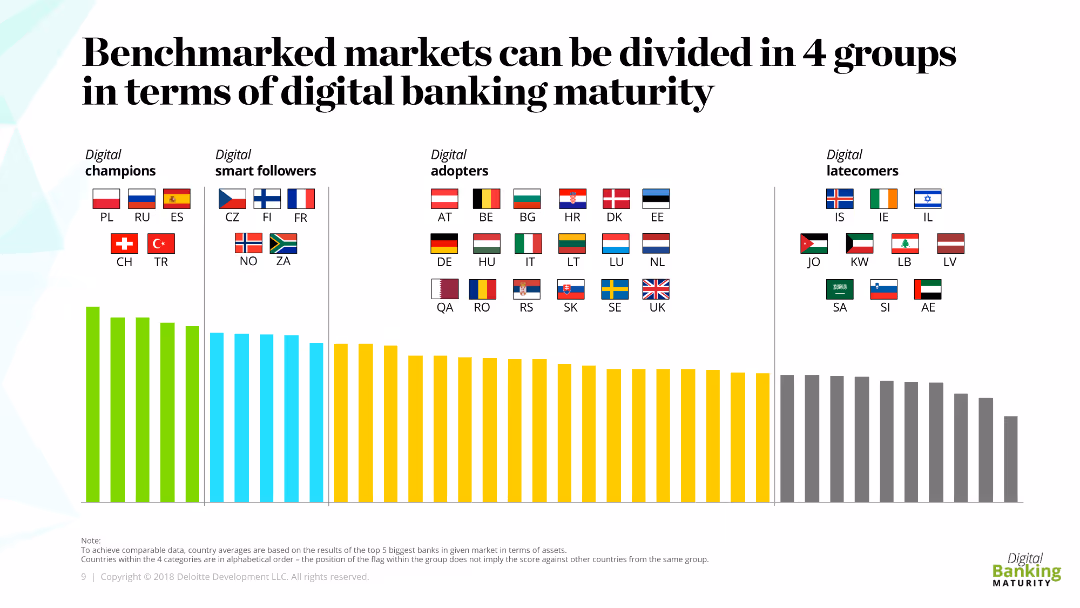
Vertical bar chart showing digital banking maturity across various countries segmented into digital champions, smart followers, adopters, and latecomers.
Market Analysis and Trends
Financial Services
Compares digital banking maturity across different markets, categorizing countries into champions, smart followers, adopters, and latecomers based on maturity levels.
digital banking, maturity, market comparison, champions, adopters, bar chart
false
Market Analysis and Trends
Financial Services
Mixed Chart
Deloitte
Add to my slides
Remove from favorites
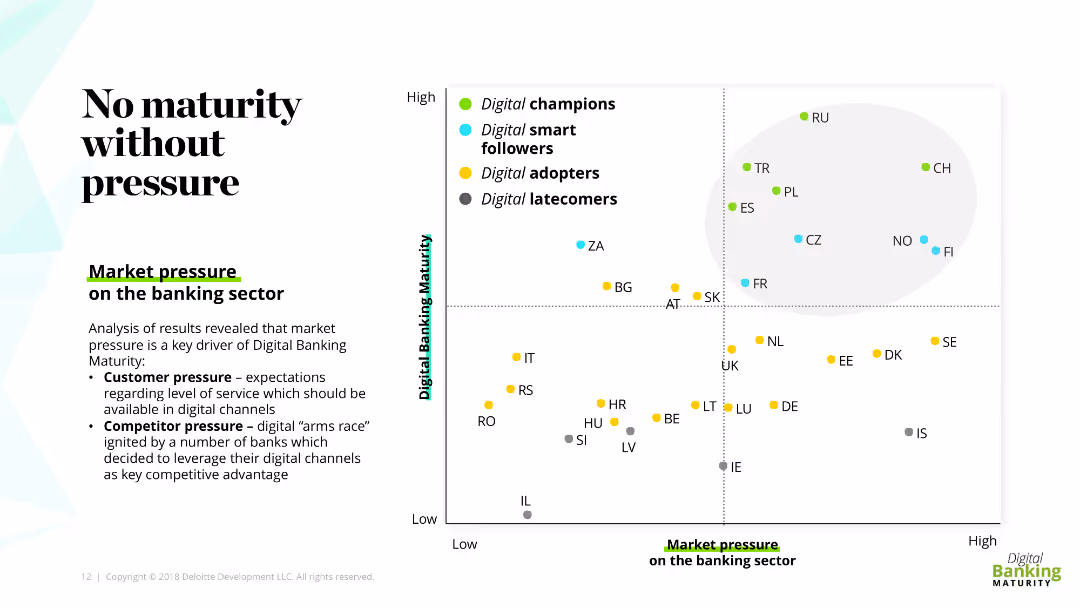
Scatter plot showing digital banking maturity against market pressure on the banking sector, segmented into champions, followers, adopters, and latecomers.
Market Analysis and Trends
Financial Services
Analyzes the impact of market pressure on digital banking maturity, with insights into customer and competitor pressure influencing digital channels in the banking sector.
digital banking, maturity, market pressure, customer pressure, scatter plot
false
Market Analysis and Trends
Financial Services
Mixed Chart
Deloitte
Add to my slides
Remove from favorites
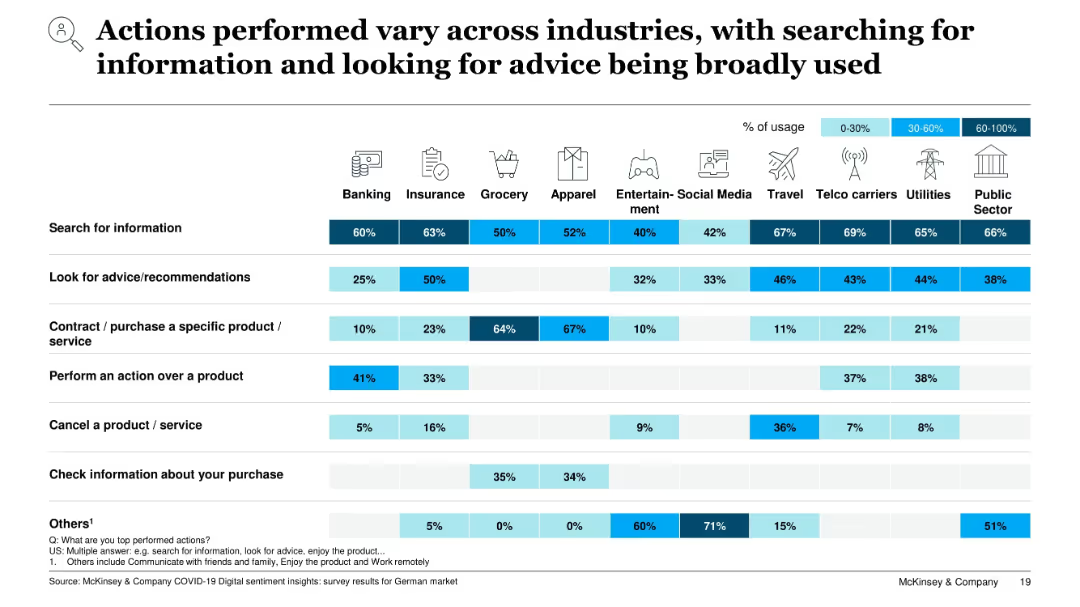
Matrix layout comparing consumer digital actions by industry; horizontal bars shaded by usage percentage bands (0–30%, 30–60%, 60–100%)
Market Analysis and Trends
Technology & Software
This slide shows how different industries exhibit varying digital behaviors. Actions like searching for information and seeking recommendations are widespread, while actions like purchase or service cancellation vary significantly by sector. The visual highlights digital engagement levels across multiple industries in Germany.
digital behavior, industry comparison, user actions, search, recommendations, purchase, utilities, telecom, COVID-19 impact
false
Market Analysis and Trends
Technology & Software
Single Chart
McKinsey
Add to my slides
Remove from favorites
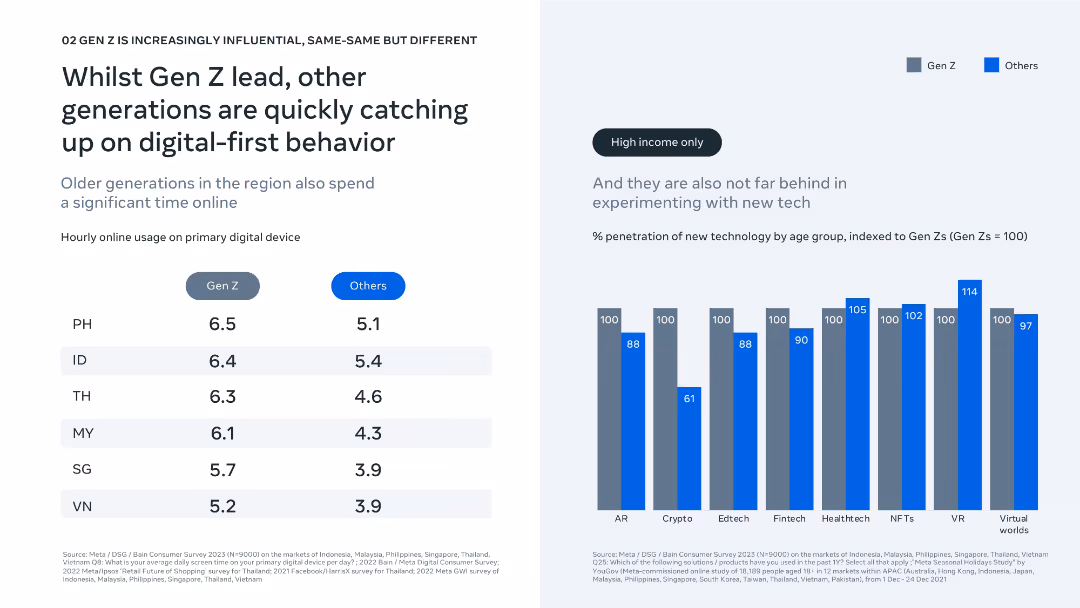
Dual-column layout showing device usage and tech adoption; clean bar and comparison chart visuals.
Technology and Digital Transformation
Technology & Software
The slide shows Gen Z leads in online engagement and tech adoption, but older generations are rapidly catching up, especially in high-income segments. Charts show hourly device usage and penetration of new tech by generation.
digital behavior, online usage, Gen Z, technology adoption, fintech, AR, VR, generational comparison, screen time, innovation trends
false
Technology and Digital Transformation
Technology & Software
Mixed Chart
Bain
Add to my slides
Remove from favorites
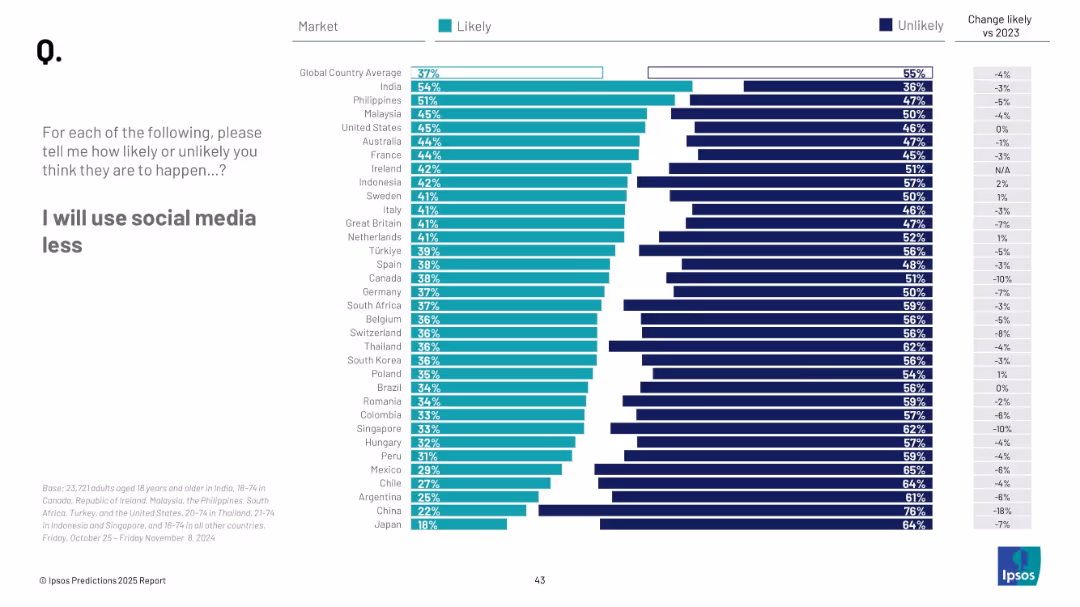
Horizontal bar chart with teal and navy split; countries listed; includes "Change likely vs 2023" column
Market Analysis and Trends
Media & Entertainment
This slide displays global self-predictions on reducing social media usage. India and the Philippines show highest intent, while Japan and China show low likelihood.
digital behavior, social media, lifestyle change, personal habits, prediction, survey, usage trends, 2025
false
Market Analysis and Trends
Media & Entertainment
Mixed Chart
IPSOS
Add to my slides
Remove from favorites
Features a multi-layered area chart depicting cloud, virtual, and physical CPU adoption from 2017 to 2018, accompanied by metrics on computing power and cost efficiency.
Technology and Digital Transformation
Financial Services
This slide details digital business capabilities enhancement through advanced infrastructure and cloud adoption, showcasing significant improvements in computing power and cost efficiency.
digital business, infrastructure, cloud computing, CPU adoption, computing power, cost efficiency, advanced infrastructure, cognitive computing
false
Technology and Digital Transformation
Financial Services
Mixed Chart
Credit Suisse
Add to my slides
Remove from favorites
Slide includes a clear title, three sets of bullet lists under "Traditional approaches" and "Additional approaches", icons, and a clickable white paper download link.
Industry Overview
Technology & Software
This slide presents different digital business models that companies can adopt, such as "Build", "Buy", "Partner", "Invest", and "Incubate/Accelerate". It describes when each approach is most appropriate.
digital business models, build, buy, partner, invest, incubate
false
Industry Overview
Technology & Software
Header Vertical
Accenture
Add to my slides
Remove from favorites
Dual panel layout with bar charts comparing digital capabilities in 2016 and 2019 on the left and an image of a woman using a phone on the right.
Technology and Digital Transformation
Healthcare & Pharmaceuticals
Illustrates the increasing expectations and use of digital capabilities in healthcare, such as prescription refills and online appointments.
digital, capabilities, healthcare, technology, rise
false
Technology and Digital Transformation
Healthcare & Pharmaceuticals
Multiple Chart
Accenture
Add to my slides
Remove from favorites
Two large blue panels with text and circular images depicting key areas of growth. Smaller images and bullet points elaborate on core strategies for enhancing digital capabilities.
Strategic Planning
Financial Services
Highlights strategic initiatives for business growth, focusing on digital enhancement and distribution optimization. These are aimed at maintaining a strong market position and driving future success.
Digital Capabilities, Partnerships, Growth
false
Strategic Planning
Financial Services
Table
Goldman Sachs
Add to my slides
Remove from favorites
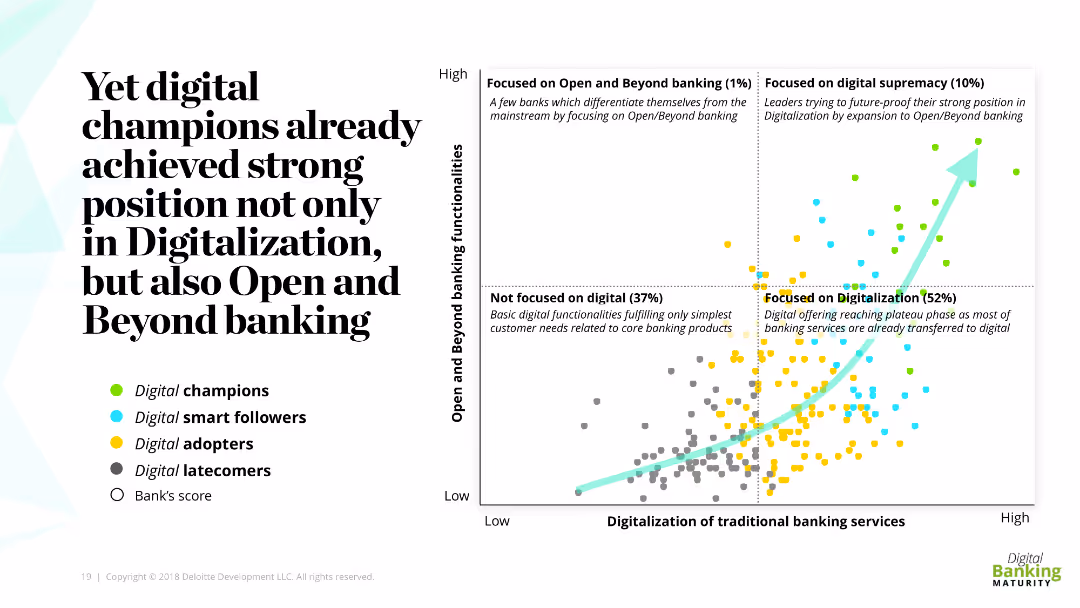
The slide contains a scatter plot graph showing banks' focus on digitalization and open banking functionalities. Different colors represent digital champions, smart followers, adopters, and latecomers. The slide also includes descriptive text on digital champions' positions.
Competitive Landscape
Financial Services
This slide highlights the strong position achieved by digital champions in both digitalization and open banking functionalities. It categorizes banks based on their focus and digital capabilities, showing leaders in digital supremacy and open banking.
digital champions, open banking, digitalization, competitive landscape, banks
false
Competitive Landscape
Financial Services
Mixed Chart
Deloitte
Add to my slides
Remove from favorites
Text-focused slide with icons and percentages showing consumer use of digital banking channels and the emotional disconnect experienced.
Market Analysis and Trends
Financial Services
Highlights the functional yet emotionally lacking nature of digital banking channels, and the difficulty in maintaining personal customer relationships.
digital channels, impersonal, banking, consumer, emotional disconnect, customer relationship, insights, survey
false
Market Analysis and Trends
Financial Services
Mixed Chart
Accenture
Add to my slides
Remove from favorites
The slide uses a balanced mix of text and simple icons to detail modules for digital commerce. Each module has a corresponding icon, with a two-tone color scheme that enhances readability.
Operational Efficiency
Retail & E-commerce
It explains the critical modules necessary for successful digital commerce execution. Ideal for e-commerce strategy sessions and operational planning.
digital commerce, operational planning, e-commerce strategy, module analysis
false
Operational Efficiency
Retail & E-commerce
Pillar
Bain
Add to my slides
Remove from favorites
A bar chart showing risk scores across various markets and years, with textual content on the left describing the context of digital commerce challenges and operational difficulties.
Market Analysis and Trends
Technology & Software
Explores the impact of digital technologies on operational issues in digital commerce, with specific data on various risks such as crime, logistics, and trade across different markets.
digital commerce, operational risk, technology, market analysis, logistics, trade, crime, consumer risk, operational difficulties, mitigation
false
Market Analysis and Trends
Technology & Software
Mixed Chart
Accenture
Add to my slides
Remove from favorites
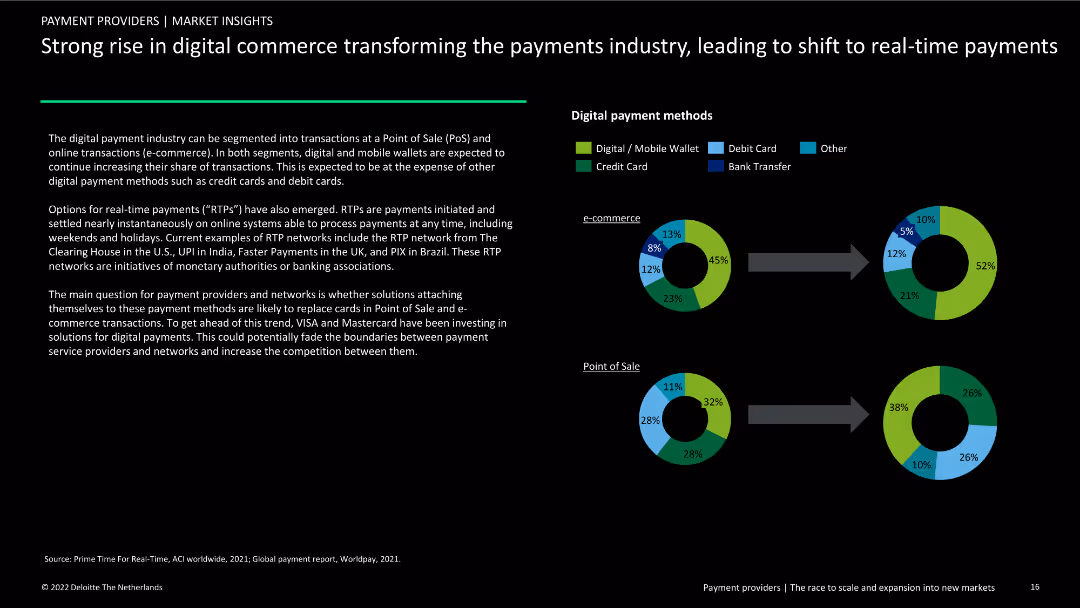
Contains two donut charts showing digital payment methods for e-commerce and Point of Sale (PoS). Includes text explaining the rise of digital wallets and real-time payments.
Market Analysis and Trends
Financial Services
Examination of the shift to digital and real-time payments in e-commerce and PoS, highlighting the increasing use of mobile wallets and instant payment methods.
digital commerce, payments industry, e-commerce, PoS, digital wallets, real-time payments, market analysis, financial services, trends, transformation
false
Market Analysis and Trends
Financial Services
Multiple Chart
Deloitte
Add to my slides
Remove from favorites
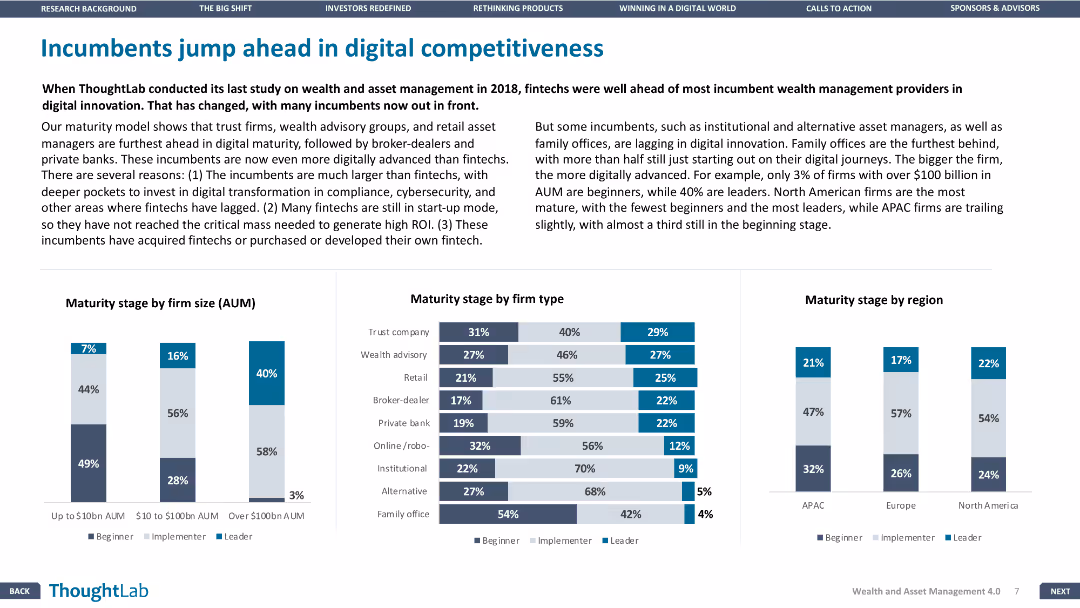
This slide features three column charts comparing maturity stages by firm size, type, and region. Text on the left provides context.
Competitive Landscape
Financial Services
The slide compares the digital maturity of various financial institutions, highlighting the differences in competitiveness by firm size, type, and region.
Digital competitiveness, Financial Services, Maturity, Firm size, Region
false
Competitive Landscape
Financial Services
Multiple Chart
Deloitte
Add to my slides
Remove from favorites
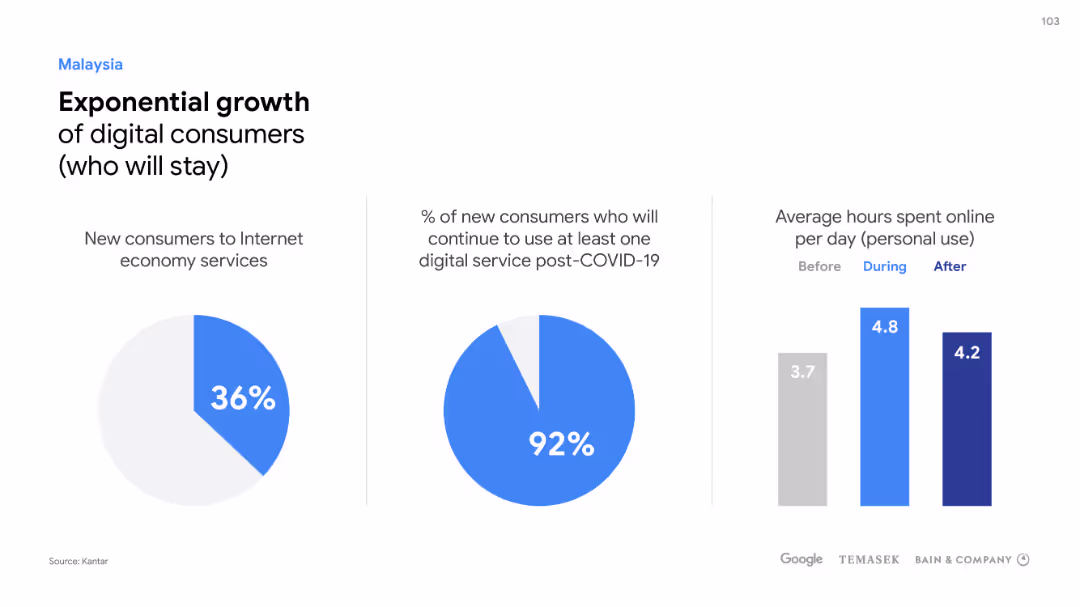
Slide with pie charts and a bar graph, contrasting digital consumer growth and engagement pre and post COVID-19.
Market Analysis and Trends
Technology & Software
Highlights the surge and potential permanence of digital consumers in Indonesia, emphasizing continued engagement.
digital, consumers, growth, engagement, COVID-19, Indonesia, permanence
false
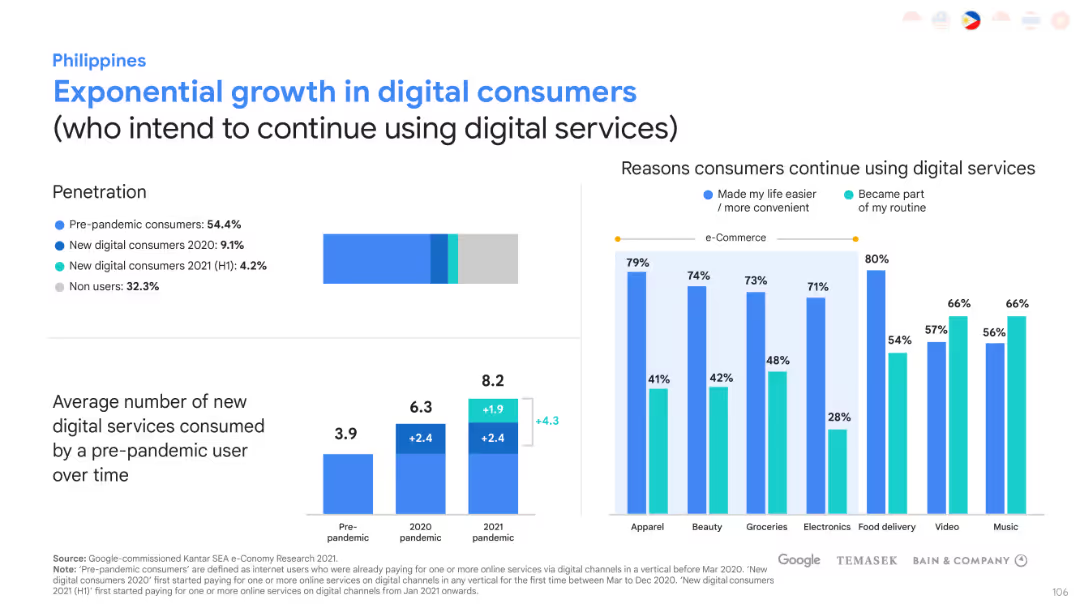
Market Analysis and Trends
Technology & Software
Multiple Chart
Bain
Add to my slides
Remove from favorites
Features a pie chart and two column charts with annotations, presenting data on new consumers to internet economy services and their predicted behaviors post-COVID-19 in Singapore.
Market Analysis and Trends
Technology & Software
The slide discusses the significant uptake in digital services and the potential permanence of these changes, valuable for understanding consumer behavior in the digital space.
Digital Consumers, Growth, Singapore, Internet Economy
false
Market Analysis and Trends
Technology & Software
Multiple Chart
Bain
Add to my slides
Remove from favorites
Consists of three pie charts showing the percentage of new Internet economy consumers, their retention post-COVID-19, and changes in online hours spent, respectively, set against a white background.
Market Analysis and Trends
Technology & Software
The slide shows the surge in Vietnam's digital consumer base during COVID-19, the retention rates of digital services post-pandemic, and the increase in average hours spent online.
Digital Consumers, Growth, Vietnam, COVID-19, Retention
false
Market Analysis and Trends
Technology & Software
Multiple Chart
Bain
Add to my slides
Remove from favorites
A text-focused slide that includes icons representing various product categories to show changes in consumer purchasing trends over time, particularly noting an increase in online grocery shopping.
Operational Efficiency
Retail & E-commerce
Details the evolution of first-time digital consumer purchasing patterns, with a recent uptick in online grocery shopping, reflecting the impact of digital transformation and changing consumer preferences.
Digital consumer, shopping trends, online groceries, Southeast Asia, consumer behavior
false
Operational Efficiency
Retail & E-commerce
Header Horizontal
Bain
Add to my slides
Remove from favorites
A data-driven slide with bar graphs, column charts, and a pie chart. High density of information, contrasting colors, and significant textual content.
Market Analysis and Trends
Technology & Software
It presents a detailed analysis of digital consumer behavior in Indonesia, covering e-commerce, media usage, and a breakdown of the willingness to pay for sustainable products, intended for market analysis purposes.
digital consumers, Indonesia, e-commerce, media usage, sustainability
false
Market Analysis and Trends
Technology & Software
Multiple Chart
Bain
Add to my slides
Remove from favorites
The layout includes bar graphs, column charts, and a pie chart, mirroring slide 1613 but with Malaysia-specific data. Neatly organized and color-coded for clarity.
Market Analysis and Trends
Technology & Software
The slide conveys detailed metrics on Malaysia's digital consumer behavior, specifically in e-commerce and media usage, suitable for market research and digital strategy development.
digital consumers, Malaysia, e-commerce, media usage, market research
false
Market Analysis and Trends
Technology & Software
Multiple Chart
Bain
Add to my slides
Remove from favorites
Two pie charts and a column chart detail Malaysia's digital consumer growth, continuity post-COVID-19, and online activity.
Market Analysis and Trends
Technology & Software
Demonstrates Malaysia's digital consumer surge and the ongoing engagement in internet economy services post-pandemic.
Digital consumers, Malaysia, Growth, Internet economy, COVID-19, Online activity, Engagement
false
Market Analysis and Trends
Technology & Software
Multiple Chart
Bain
Add to my slides
Remove from favorites
This slide contains bar charts and graphical representations of consumer growth data, juxtaposed with textual information to provide context.
Market Analysis and Trends
Technology & Software
Assesses the expansion of digital consumer bases in Singapore and their commitment to digital services, particularly e-commerce, reflecting consumer habits and preferences.
Digital consumers, Market expansion, E-commerce, Consumer commitment
false
Market Analysis and Trends
Technology & Software
Multiple Chart
Bain
Add to my slides
Remove from favorites
Uses statistics and infographic elements to discuss the behaviors and preferences of digital consumers across different age groups.
Market Analysis and Trends
Technology & Software
Analyzes emerging digital consumer segments and their potential impact on the market, highlighting their preferences and behaviors.
digital consumers, market impact, consumer behavior, e-commerce, online shopping, demographics, consumer preferences, market segmentation
false
Market Analysis and Trends
Technology & Software
Mixed Chart
Accenture
Add to my slides
Remove from favorites
This slide has bar charts and graphs to represent the growth of digital consumers. The layout is balanced with textual information on one side and graphical data on the other.
Market Analysis and Trends
Technology & Software
Analyzes the digital consumer penetration and growth in the Philippines. It also explores the reasons consumers prefer to continue using digital services, highlighting e-commerce adoption.
Digital consumers, Market penetration, E-commerce, Consumer preferences
false
Market Analysis and Trends
Technology & Software
Multiple Chart
Bain
Add to my slides
Remove from favorites
The slide features a large, bold title in blue at the top, with bar graphs comparing pre-pandemic consumers and new digital consumers across multiple Southeast Asian countries. There's a light blue overlay with text indicating three aspects: Continued adoption, Deepening usage, and New way of life.
Market Analysis and Trends
Technology & Software
This slide presents a comparative analysis of digital consumer growth in Southeast Asia, focusing on the increased proportion of online consumption due to the pandemic.
digital consumers, pandemic, SEA, growth, online consumption, Thailand, Philippines, charts
false
Market Analysis and Trends
Technology & Software
Single Chart
Bain
Add to my slides
Remove from favorites
A pie chart dominates half the slide, with complementary circular graphics and minimal text for clarity in comparison.
Market Analysis and Trends
Technology & Software
Examines the influx of new digital consumers during the pandemic, offering a breakdown that could influence digital marketing strategies.
digital consumers, pandemic trends, consumer analysis, SEA, pre-pandemic comparison, internet economy
false
Market Analysis and Trends
Technology & Software
Single Chart
Bain
Add to my slides
Remove from favorites
The slide features two pie charts and a column chart showing the growth of digital consumers in the Philippines.
Market Analysis and Trends
Technology & Software
Captures the Philippines' notable increase in digital consumers who are likely to continue using internet services post-COVID-19.
Digital consumers, Philippines, Growth, Internet services, COVID-19, Usage trends, Continuity
false
Market Analysis and Trends
Technology & Software
Multiple Chart
Bain
Add to my slides
Remove from favorites
A combination of bar graphs and statistical data showcasing usage intent, media frequency, and adoption rates across various digital services.
Market Analysis and Trends
Technology & Software
This slide offers a quantitative glimpse into the behaviors of digital consumers in the Philippines, with implications for targeted marketing and service design.
digital consumers, Philippines, media usage, market analysis, adoption rates, services
false
Market Analysis and Trends
Technology & Software
Multiple Chart
Bain
Add to my slides
Remove from favorites
Contains a set of blue vertical columns divided into metro and non-metro areas, with country flags for SEA regions.
Market Analysis and Trends
Technology & Software
Analyzes where new digital consumers are located within SEA countries, comparing metro versus non-metro areas.
digital consumers, SEA, metro, non-metro, geographic trends
false
Market Analysis and Trends
Technology & Software
Single Chart
Bain
Add to my slides
Remove from favorites
Features a bar graph and key numerical highlight with color coding to differentiate countries. The design is clean and focuses on data presentation.
Market Analysis and Trends
Technology & Software
This slide compares the percentage of internet users who have made purchases online across different SEA countries, useful for analyzing e-commerce trends.
digital consumers, SEA, online shopping, internet usage, country comparison, e-commerce trends
false
Market Analysis and Trends
Technology & Software
Single Chart
Bain
Add to my slides
Remove from favorites
This slide features a combination of column charts, a pie chart, and bar graphs arranged neatly alongside corresponding descriptions. It has a clean layout with a mix of blue tones against a white background, and each section is clearly separated by headings. The pie chart is highlighted in green in the lower right corner, providing a visual anchor.
Market Analysis and Trends
Technology & Software
The slide presents a detailed statistical analysis of digital consumers in Singapore, segmented into different services and media usage. It includes future usage intent, media consumption frequency, and the adoption rates of digital services among urban users. This would be used to understand market penetration and consumer behavior in digital services, as well as the willingness to pay for sustainable products.
digital consumers, Singapore, media usage, service adoption, sustainability
false
Market Analysis and Trends
Technology & Software
Multiple Chart
Bain
Add to my slides
Remove from favorites
This slide features a bar chart representing digital consumer growth, a line graph, and significant numeric highlights.
Industry Overview
Retail & E-commerce
The slide presents digital consumer trends, online spending outlook, and smartphone penetration rates in Southeast Asia, emphasizing Malaysia's growth. It is used to highlight regional digital growth prospects and year-on-year changes in consumer behavior.
digital consumers, smartphone penetration, online spending, Southeast Asia, Malaysia
false
Industry Overview
Retail & E-commerce
Multiple Chart
Bain
Add to my slides
Remove from favorites
A slide with textual content on the left and two pie charts on the right showing demographics of digital consumers in terms of country, tier, age, and gender.
Market Analysis and Trends
Retail & E-commerce
Presents the demographic breakdown of a survey of over 16,000 digital consumers in Southeast Asia, giving insights into the regional digital consumer landscape.
Digital consumers, Southeast Asia, demographics, survey, pie chart
false
Market Analysis and Trends
Retail & E-commerce
Multiple Chart
Bain
Add to my slides
Remove from favorites
A combination of bar charts and graphs show digital consumer growth and the reasons for using digital services, with a clean layout.
Market Analysis and Trends
Technology & Software
Analyzes the dramatic increase in digital consumers in Thailand and their commitment to continue using digital services.
Digital, Consumers, Thailand, Growth, Services, Penetration, E-commerce, Reasons, Continuation
false
Market Analysis and Trends
Technology & Software
Multiple Chart
Bain
Add to my slides
Remove from favorites
Similar to slide 1631, this one is structured with column charts, bar graphs, and a pie chart, showcasing media usage and service adoption rates in Thailand. It uses a color palette of blue and grey, with green highlighting the pie chart for emphasis.
Market Analysis and Trends
Technology & Software
This slide is a comparative analysis of digital consumer behavior in Thailand, detailing usage intent and media consumption. It reveals the adoption rates of digital services and the willingness to pay more for sustainable products and services, vital for understanding consumer priorities and market opportunities in Thailand.
digital consumers, Thailand, media usage, adoption rates, sustainability
false
Market Analysis and Trends
Technology & Software
Multiple Chart
Bain
Add to my slides
Remove from favorites
This slide contains bar charts and graphical representation of reasons for digital service usage, with a clear and simple color scheme.
Market Analysis and Trends
Technology & Software
Investigates Vietnam's increase in digital consumers and their preferences for continued use of digital services.
Digital Consumers, Vietnam, Growth, Services, Preferences, Continuation, Analysis
false
Market Analysis and Trends
Technology & Software
Multiple Chart
Bain
Add to my slides
Remove from favorites
Two graphs illustrating an increase in time spent online and e-commerce sales, juxtaposed to convey the correlation between digital consumption and retail trends.
Market Analysis and Trends
Retail & E-commerce
Analyzes the rise in digital media consumption and e-commerce growth due to the pandemic, highlighting shifts in consumer behavior and market opportunities.
Digital Consumption, E-commerce Growth, Pandemic Impact, Consumer Behavior, Retail Trends, Marketing Budgets, Digital Sales, ASEAN Market, Online Retail, Marketing Strategy
false
Market Analysis and Trends
Retail & E-commerce
Multiple Chart
BCG
Add to my slides
Remove from favorites
Features comparisons and diagrams explaining hyper-personalization in digital consumer experiences, including examples like NIKEiD and Ginger.io.
Customer and Market Segmentation
Media & Entertainment
Analyzes trends in digital consumption, focusing on the shift towards hyper-personalized customer experiences enabled by AI and other technologies.
digital consumption, hyper-personalization, AI, retail trends, customer experience, NIKEiD, Ginger.io
false
Customer and Market Segmentation
Media & Entertainment
Table
Accenture
Add to my slides
Remove from favorites
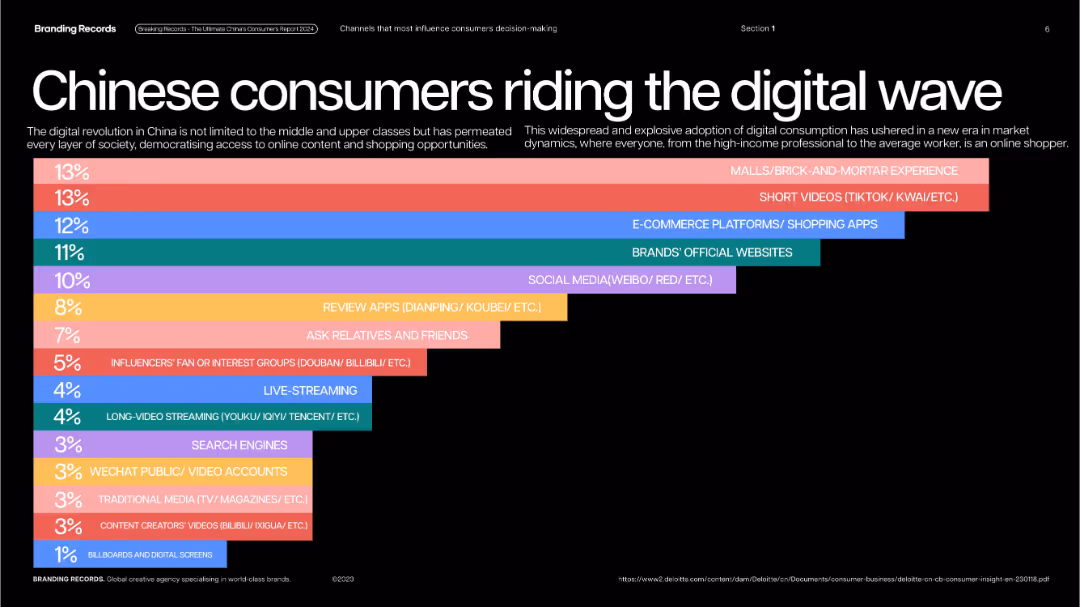
Full black background with horizontal color-coded bar chart by percentage influence of media types.
Customer and Market Segmentation
Technology & Software
Lists the top digital and traditional channels influencing Chinese consumer decisions. E-commerce platforms, short videos, malls, and social media are among the top sources guiding purchase behavior.
digital consumption, influencer channels, apps, short videos, shopping platforms
false
Customer and Market Segmentation
Technology & Software
Single Chart
McKinsey
Add to my slides
Remove from favorites
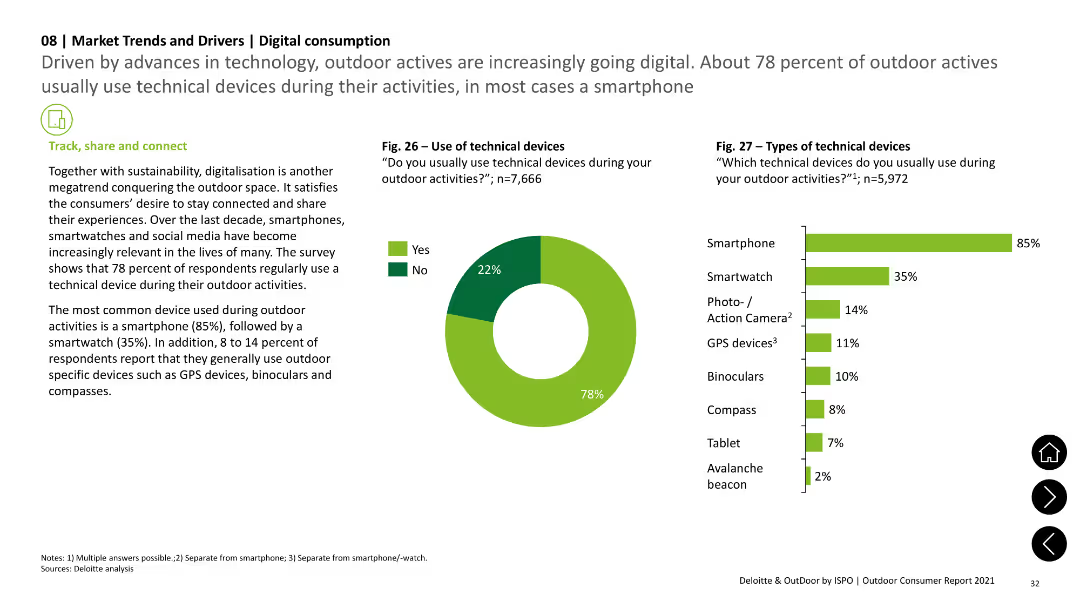
The slide includes a pie chart showing the use of technical devices during outdoor activities and a column chart illustrating the types of devices used, such as smartphones and smartwatches. Text sections provide additional context.
Technology and Digital Transformation
Technology & Software
The slide explores the increasing use of digital devices like smartphones and smartwatches by outdoor enthusiasts, supported by survey data on the prevalence and types of devices used.
digital consumption, technology, smartphones, smartwatches, survey data
false
Technology and Digital Transformation
Technology & Software
Multiple Chart
Deloitte
Add to my slides
Remove from favorites
The slide includes a pie chart and text highlighting the significance of short and medium-length videos in digital consumption habits.
Customer and Market Segmentation
Retail & E-commerce
Explains the integral role of short and medium videos in digital consumption, providing statistics on the average number of videos viewed each day by consumers, underscoring the importance for marketing strategies.
Digital consumption, videos, consumer habits, Southeast Asia, statistics
false
Customer and Market Segmentation
Retail & E-commerce
Single Chart
Bain
Add to my slides
Remove from favorites
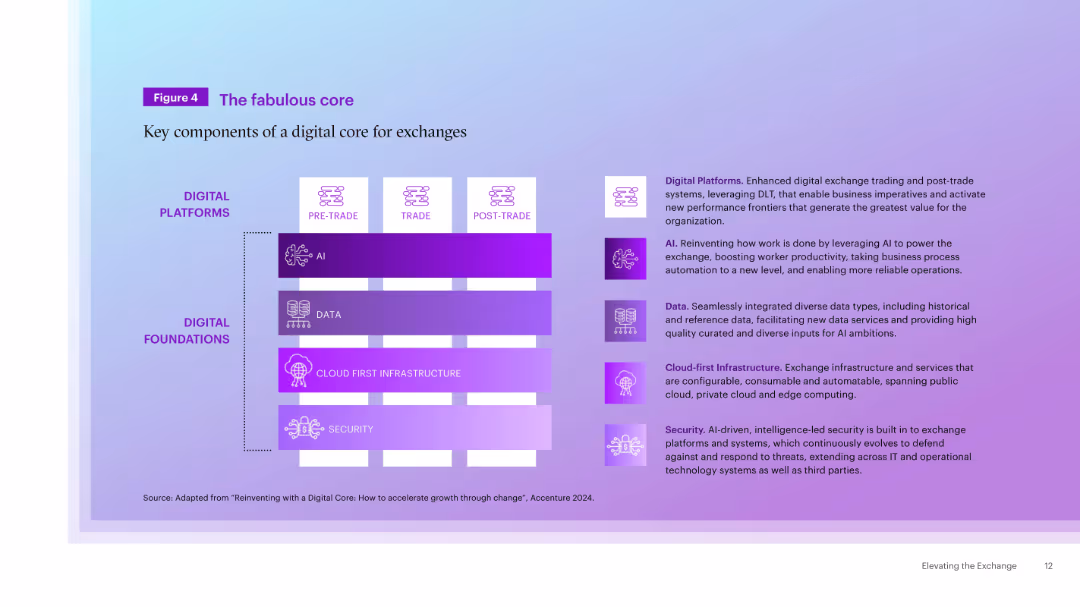
Two-column layout with diagram on left showing stacked elements (AI, Data, Cloud, Security) under Digital Platforms/Foundations, and descriptions on right.
Technology and Digital Transformation
Technology & Software
The slide outlines the core components of a digital core for exchanges, highlighting AI, data, cloud-first infrastructure, and security as foundational elements enabling robust digital platforms for trading and post-trade services.
Digital Core, AI, Data, Infrastructure, Security, Exchange, Technology, Platforms, Automation
false
Technology and Digital Transformation
Technology & Software
Table
Accenture
Add to my slides
Remove from favorites
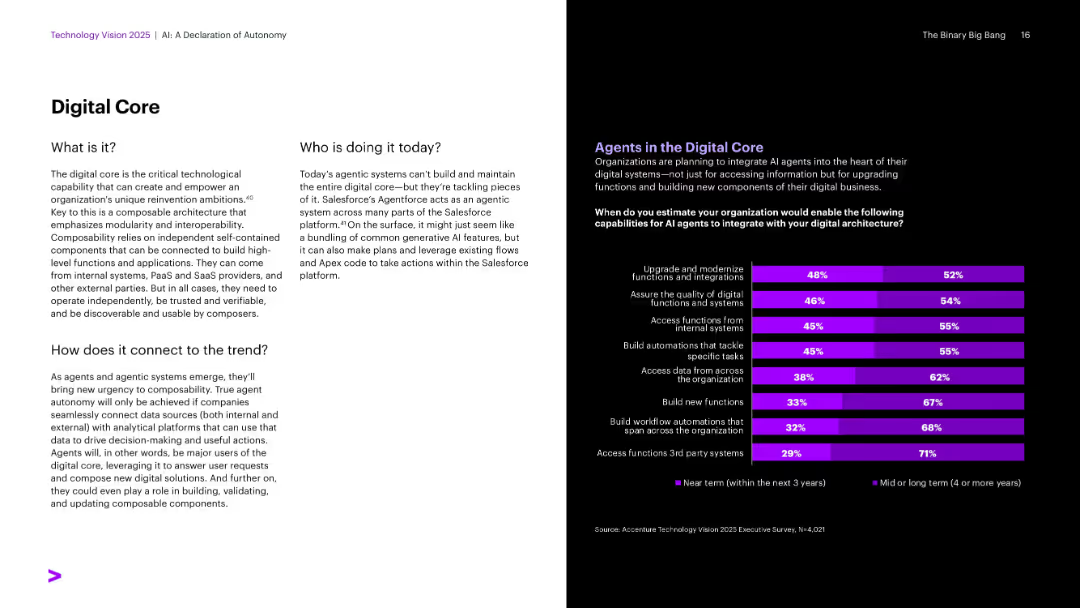
Split layout with white and black backgrounds. Bar chart on right with company survey results. Text on left defines digital core concept.
Technology and Digital Transformation
Artificial Intelligence
Defines the digital core and composability in the context of agentic systems. Survey results show planned enterprise integrations of AI agents into digital systems over the short and long term.
Digital Core, AI Integration, Composability, Enterprise Systems, Salesforce, Automation
false
Technology and Digital Transformation
Artificial Intelligence
Mixed Chart
Accenture
Add to my slides
Remove from favorites
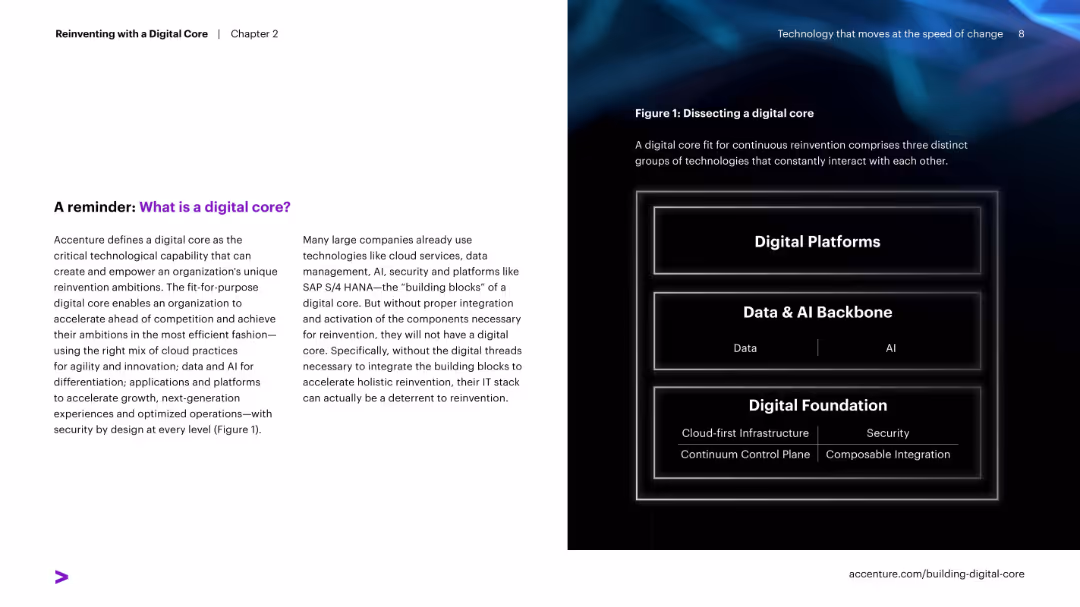
Two-column layout with text on the left and a dark-themed infographic on the right. The infographic contains three stacked boxes labeled Digital Platforms, Data & AI Backbone, and Digital Foundation.
Technology and Digital Transformation
Technology & Software
Introduces the concept of a "digital core" as a foundational capability for business reinvention, emphasizing the integration of platforms, data/AI, and cloud infrastructure. It highlights the importance of secure, agile, and integrated systems.
digital core, cloud, AI, data, digital foundation, security, platforms, SAP, integration, transformation
false
Technology and Digital Transformation
Technology & Software
Boxed
Accenture
Add to my slides
Remove from favorites
Clean white background with large minimal text and three central visual anchor points connected by lines.
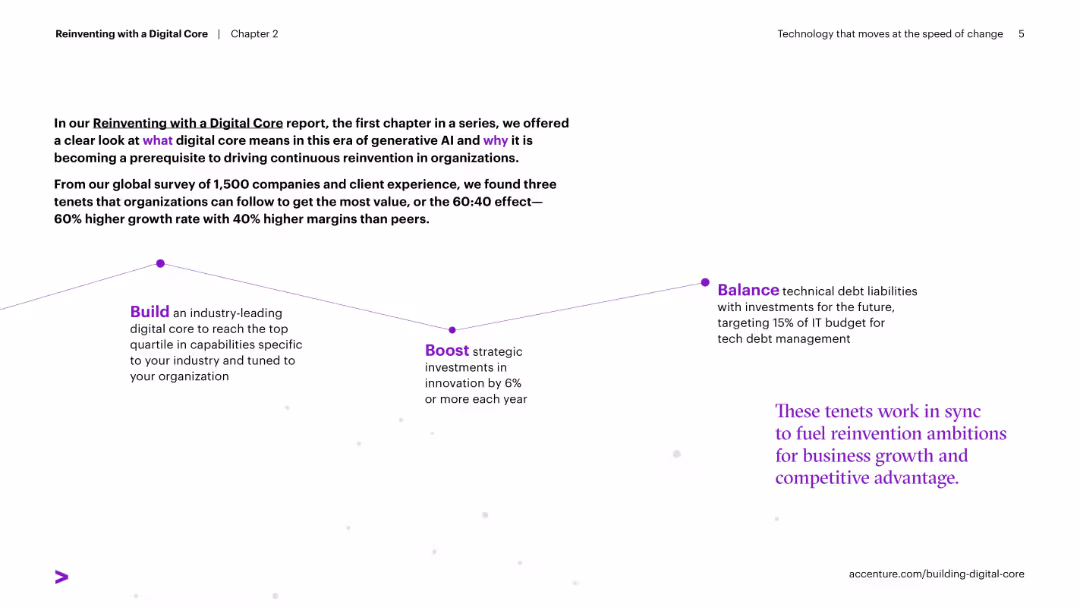
Strategic Planning
Technology & Software
This slide outlines three core principles for digital transformation based on a global survey: Build a strong digital core, Boost innovation investment, and Balance tech debt. It emphasizes the importance of aligning digital efforts for competitive advantage in the era of AI-driven change.
Digital core, IT strategy, tech debt, innovation, business transformation
false
Strategic Planning
Technology & Software
Linear Flow
Accenture
Add to my slides
Remove from favorites
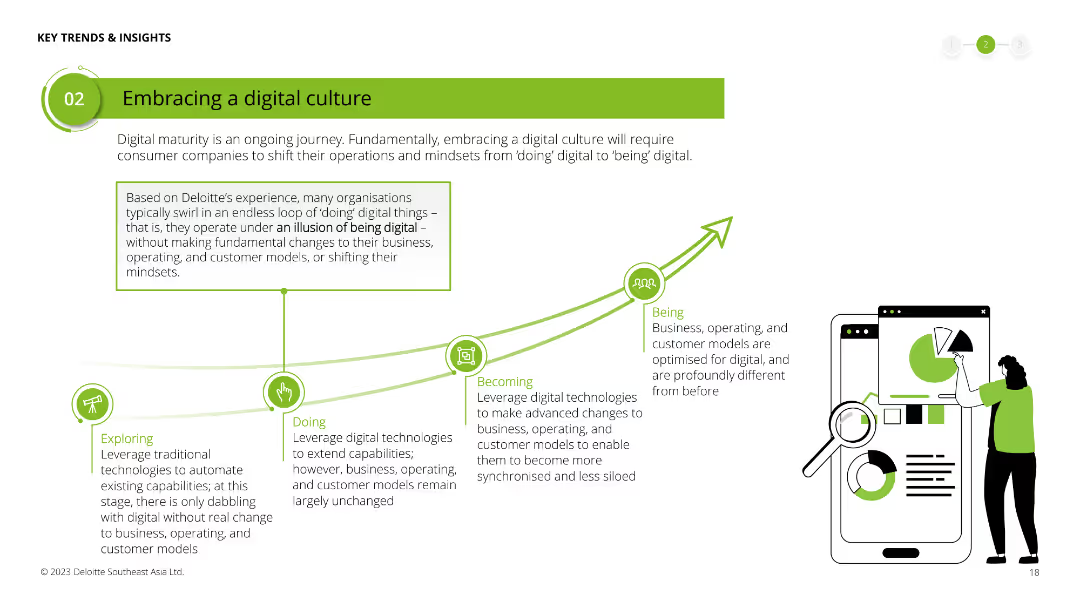
Illustrates a conceptual journey from "Exploring" to "Being" a digital company with a line chart and icons representing different stages. Large text box in the center with a detailed explanation.
Human Resources and Talent Management
Technology & Software
Discusses the stages of digital maturity for organizations, emphasizing the shift from just doing digital tasks to fully being digital in their culture and operations.
digital culture, maturity, organizational change, digital transformation, exploring, doing, becoming, being
false
Human Resources and Talent Management
Technology & Software
Linear Flow
Deloitte
Add to my slides
Remove from favorites
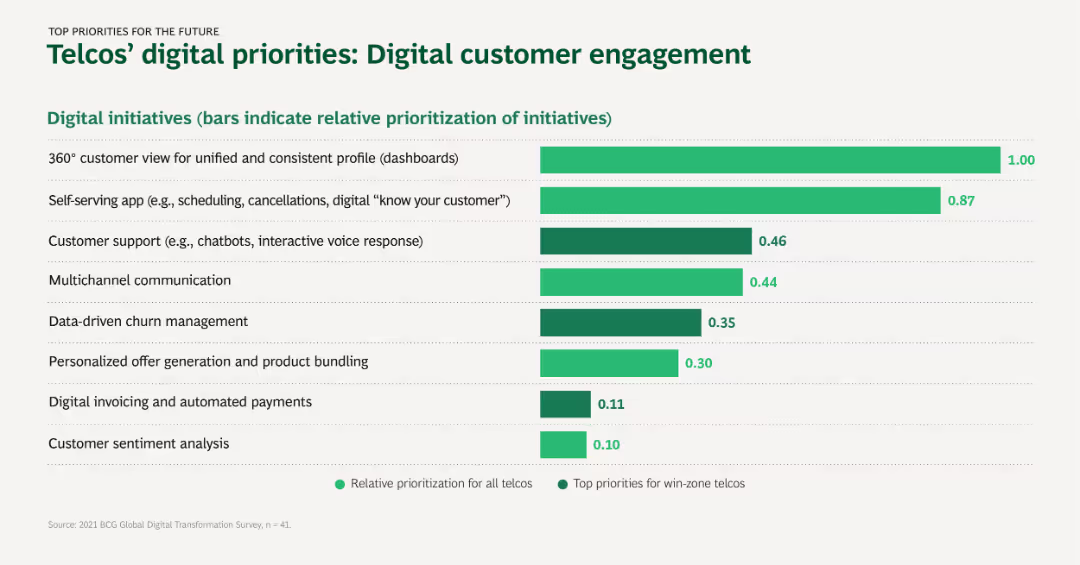
The slide features a bar chart ranking digital initiatives by their prioritization among telcos, with a focus on 360° customer view and self-serving apps.
Customer and Market Segmentation
Telecommunications
This slide highlights the top digital initiatives prioritized by telcos for enhancing customer engagement, emphasizing the importance of a unified customer view and interactive customer support tools.
Digital customer engagement, Telcos, Prioritization, 360° customer view, Self-serving apps
false
Customer and Market Segmentation
Telecommunications
Single Chart
BCG
Add to my slides
Remove from favorites
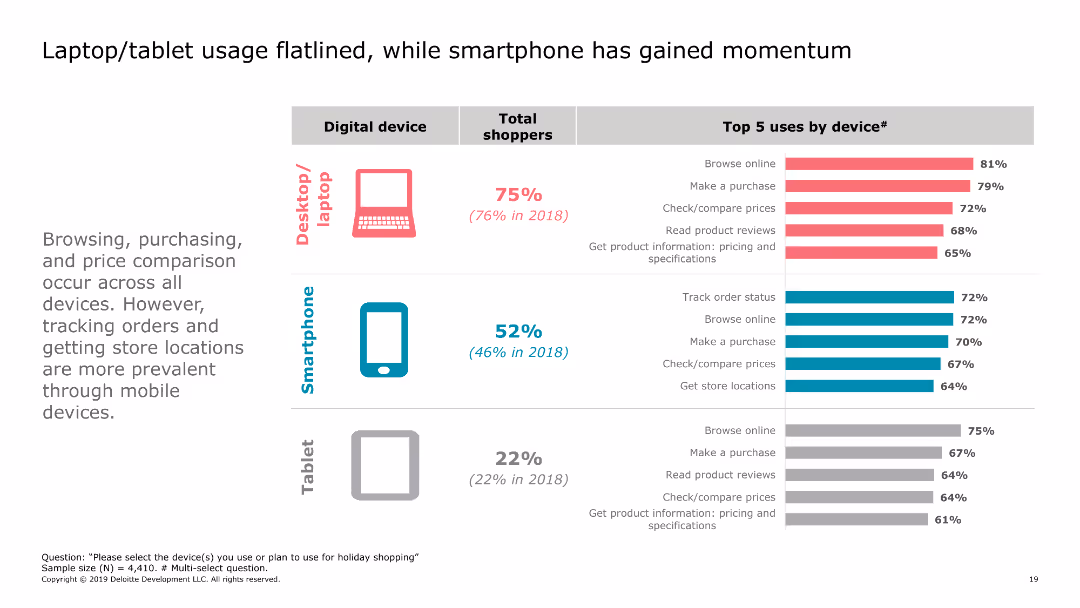
The slide features a comparison of digital device usage for holiday shopping, including laptops, smartphones, and tablets, with bar charts for top uses by device.
Market Analysis and Trends
Retail & E-commerce
The slide analyzes the prevalence of different digital devices for holiday shopping, highlighting the top activities performed on each device.
digital devices, holiday shopping, consumer behavior, retail, e-commerce, technology usage, 2019, device comparison, shopping trends
false
Market Analysis and Trends
Retail & E-commerce
Multiple Chart
Deloitte
Add to my slides
Remove from favorites
Slide includes multiple pie charts illustrating daily usage rates for various digital devices, and a photograph of a man using a smartwatch.
Market Analysis and Trends
Telecommunications
Discusses the varying daily usage rates of digital devices, from smartphones to VR headsets, highlighting the multifunctionality of smartphones.
digital devices, usage rates, smartphone, smartwatch, VR headset
false
Market Analysis and Trends
Telecommunications
Mixed Chart
Deloitte
Add to my slides
Remove from favorites
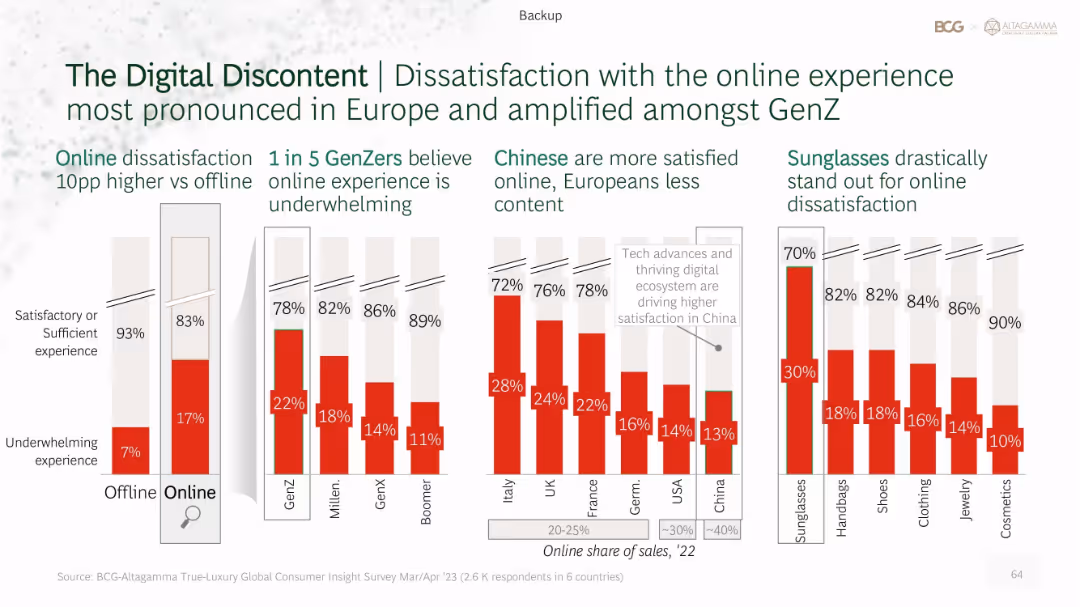
Multi-bar layout comparing dissatisfaction rates by shopping mode, generation, region, and product type. Red bars highlight underwhelming experience percentages.
Customer and Market Segmentation
Retail & E-commerce
Investigates online shopping dissatisfaction in luxury retail. Gen Z reports highest discontent. Europeans are less satisfied than Chinese consumers. Sunglasses have the highest dissatisfaction among product categories. Emphasizes need for better online experience design.
digital discontent, Gen Z, regional variation, online retail, dissatisfaction, product types
false
Customer and Market Segmentation
Retail & E-commerce
Single Chart
BCG
Add to my slides
Remove from favorites
Column chart showing digital discovery rates for OTT, movie studios, and LTV, with a narrative section on prevailing views and consumer reality.
Market Analysis and Trends
Media & Entertainment
This slide discusses the rise of digital discovery in LTV, OTT, and movie studios, highlighting the increasing influence of digital channels on content discovery.
digital, discovery, LTV, OTT, movie studios
false
Market Analysis and Trends
Media & Entertainment
Mixed Chart
BCG
Add to my slides
Remove from favorites
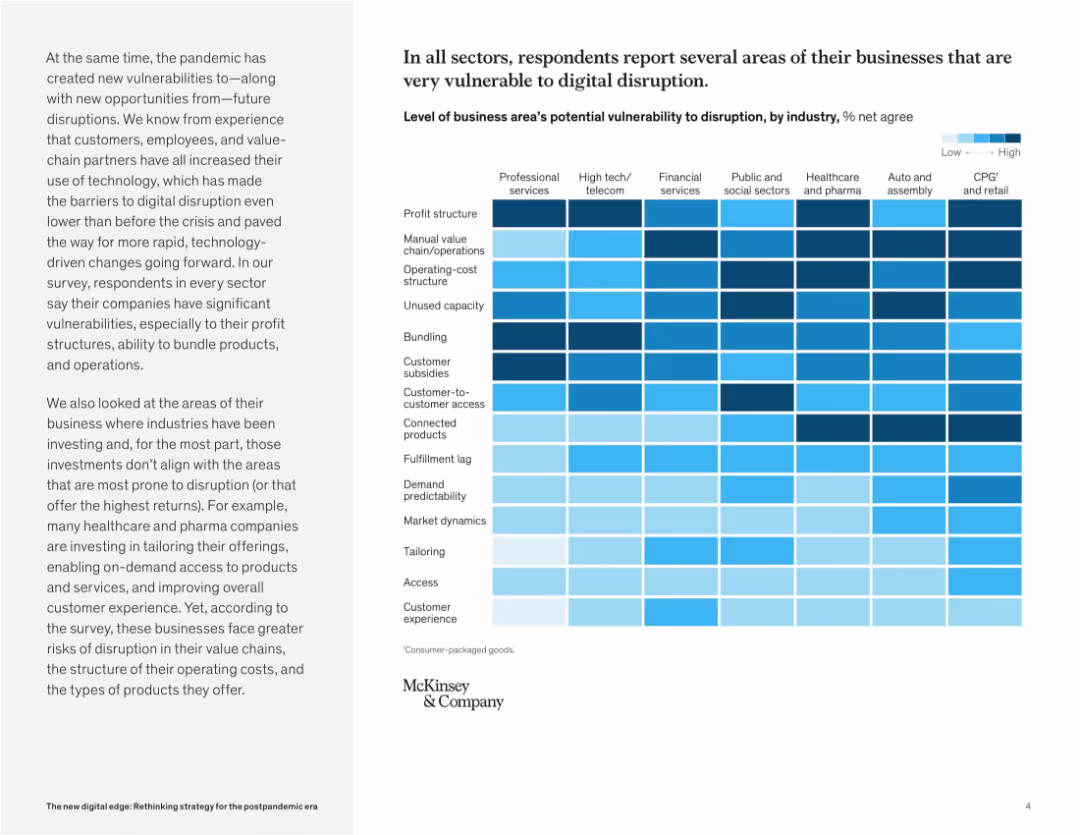
Heatmap chart dominates the right side, showing digital vulnerability levels by business area and industry. Left panel provides context and insights.
Risk Assessment and Management
Technology & Software
This slide presents a heatmap revealing how vulnerable different industries are to digital disruption. Profit structures, customer access, and bundling are common weak points. The chart emphasizes where companies may face operational or structural threats.
digital disruption, business risk, vulnerability, industry comparison, technology impact, customer access, operations, transformation
false
Risk Assessment and Management
Technology & Software
Mixed Chart
McKinsey
Add to my slides
Remove from favorites
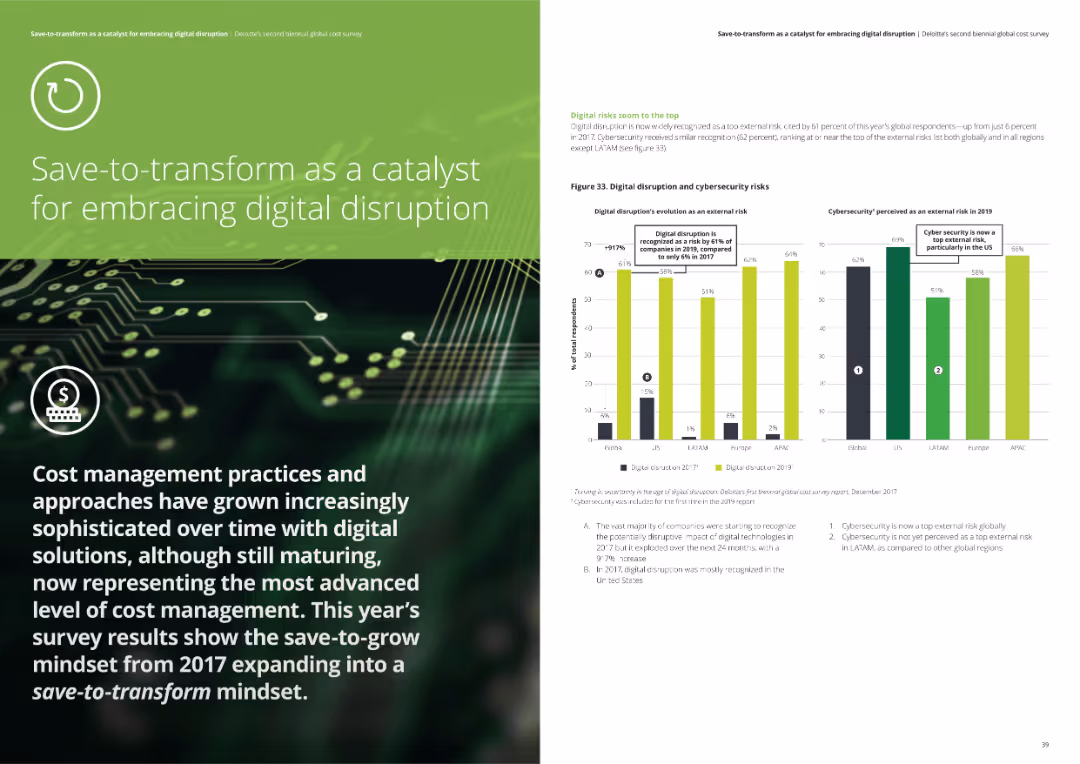
The slide has a green-themed background with a digital circuit overlay and white text. It contains icons and a prominent title. The right side has a column chart displaying digital disruption and cybersecurity risks across various regions.
Technology and Digital Transformation
Professional Services
The slide discusses the evolution of cost management practices and the growing significance of digital solutions. It highlights survey results showing an increased recognition of digital disruption as an external risk.
digital disruption, cybersecurity risks, cost management, survey results, external risk
false
Technology and Digital Transformation
Professional Services
Multiple Chart
Deloitte
Add to my slides
Remove from favorites
Bar and column charts display the perception of digital disruption across different industries and organization types.
Market Analysis and Trends
Technology & Software
Analyzes how different sectors and types of organizations perceive the disruptive potential of digital technology.
digital disruption, industry comparison, business models, organizational types, technology impact
false
Market Analysis and Trends
Technology & Software
Multiple Chart
BCG
Add to my slides
Remove from favorites
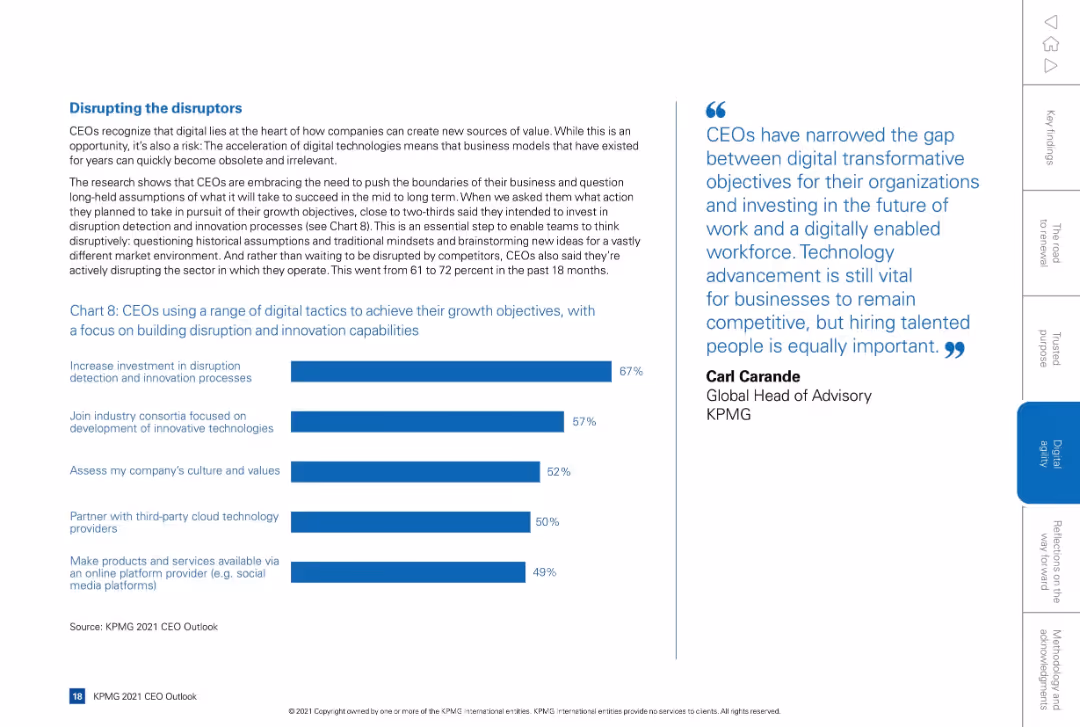
Text on the left discusses digital disruption strategy; right side contains a horizontal bar chart and a quote. Blue and white color scheme.
Operational Efficiency
Technology & Software
Describes CEO initiatives to address disruption through digital tactics such as innovation investments and tech partnerships. Bar chart shows top tactics: disruption detection, industry consortia, culture/value assessments. Encourages proactive disruption strategy.
digital disruption, innovation, strategy, tech investment, cloud, values
false
Operational Efficiency
Technology & Software
Mixed Chart
KPMG
Add to my slides
Remove from favorites
Depicts a disruption index graph comparing various industries by internet penetration levels, with personal luxury goods highlighted for 2018 and projected for 2025.
Technology and Digital Transformation
Retail & E-commerce
Discusses the impact of digital penetration on the luxury industry, comparing it to other sectors and forecasting a significant shift in industry dynamics by 2025 due to increased internet use and digital shopping behaviors.
Digital Disruption, Luxury Industry, Internet Penetration, Forecast
false
Technology and Digital Transformation
Retail & E-commerce
Single Chart
Bain
Add to my slides
Remove from favorites
Previous
Next
You don't have any favorites yet.
Please wait loading your favorites slides...
Create a FREE account to continue browsing
Receive Instant Access to 1,000+ slides from companies like McKinsey, Google, and Goldman Sachs
First Name
Last Name
Email
Password
I agree to all
Terms & Privacy Policy
Thank you! Your submission has been received!
Oops! Something went wrong while submitting the form.
Have an account?
Sign in
Upgrade to PRO to Save slides
Advanced Search and Filters
Access to 15,000+ slides
Access to Category Pages
Save/Bookmark Slides
PowerPoint Template Library
Pick a Plan
MONTHLY
$12/month
Billed every month, Cancel anytime.
YEARLY
$9/year
Billed $108 annually, Cancel anytime.
Checkout for $12/month
Checkout for $108/yr
Secured by Stripe | AES-256 bit encryption