My Account
My Slides
Search by Category
Companies
Slide Type
Use Case
Industry
Pricing
Templates
View All Templates
Download Template Slides
✦ AI
AI Prompt Library
AI Search
Feedback
Login
Logout
Get Started
Browse all Slides
Browse all Slides
Create a FREE Account
Instant access to 1,000+ real slides from top companies like McKinsey, BCG, Goldman Sachs, Google and many more!
First Name
Last Name
Email
Password
I agree to all
Terms & Privacy Policy
Thank you! Your submission has been received!
Oops! Something went wrong while submitting the form.
Have an account?
Sign in
Saved Slides
Total No. of slides saved
0
↻ Refresh
✖ Clear all
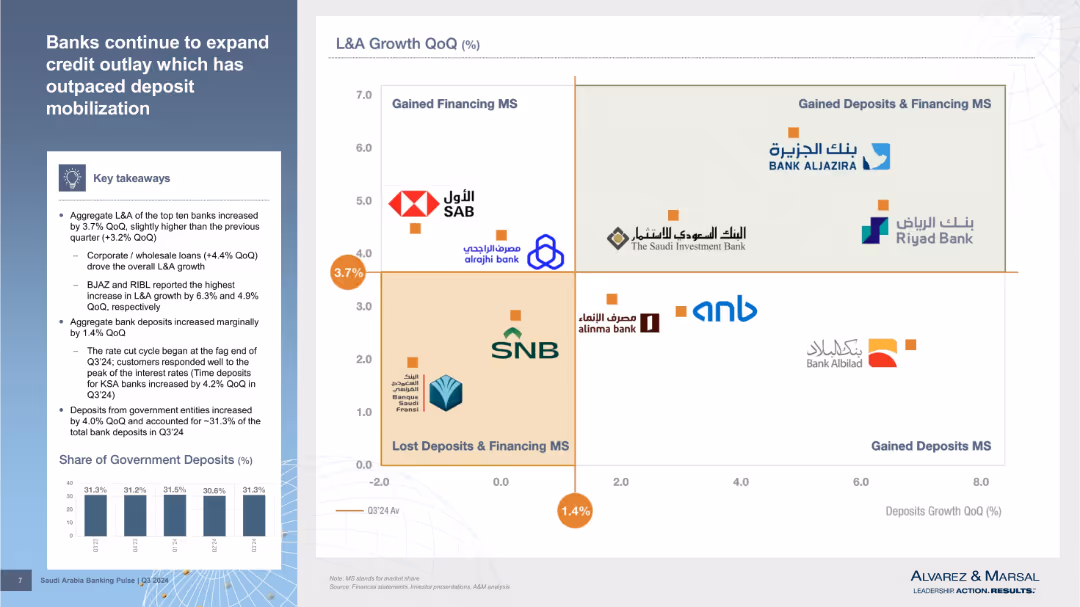
Left section with key takeaways; main graphic is a 2D matrix chart comparing deposit and loan growth QoQ for banks, plotted with logos.
Market Analysis and Trends
Financial Services
Compares L&A vs. deposits growth of top KSA banks. Visual quadrant categorizes banks based on performance, revealing which gained or lost market share in deposits and financing.
deposit growth, loan growth, market share, KSA banks, SAB, RIBL, corporate loans, L&A, Q3’24 trends, credit outlay
false
Market Analysis and Trends
Financial Services
Multiple Chart
Alvarez & Marsal
Add to my slides
Remove from favorites
The slide contains a column chart comparing deposit growth rates between Chase and other banks, and a bar chart comparing new primary bank relationships. The column chart shows Chase leading with a 9.4% growth, and the bar chart shows Chase with the largest share at 23%. Below, two indicators show an increase in customer satisfaction and a decrease in attrition rate with arrows highlighting the changes.
Market Analysis and Trends
Financial Services
This slide compares the deposit growth and acquisition of new primary bank relationships for Chase against its competitors, illustrating its market lead. It demonstrates the bank's strategic advantage in customer satisfaction and retention, which could be discussed for strategic planning and market positioning.
deposit growth, market lead, customer satisfaction, attrition rate
false
Market Analysis and Trends
Financial Services
Multiple Chart
JP Morgan
Add to my slides
Remove from favorites
Two column charts show 3-year deposit CAGR and national retail deposit share, with Chase compared against industry and large banks. The slide has a clear visual distinction between Chase and its peers, using color coding to highlight differences.
Market Analysis and Trends
Financial Services
This slide analyzes the bank's deposit growth and market share relative to the industry, emphasizing the bank's outperformance in deposit CAGR and its ascension in retail deposit share rankings, evidencing competitive advantage and market influence.
Deposit growth, Market share, Competitive analysis, CAGR, Retail banking, Industry comparison
false
Market Analysis and Trends
Financial Services
Multiple Chart
JP Morgan
Add to my slides
Remove from favorites
Column chart show deposit amounts and percentages by channels from Q4 2019 to Q1 2022 and deposit target goals for 2024. An arrow indicates a significant increase in deposits through strategic channels, accompanied by explanatory text.
Financial Performance
Financial Services
Showcases the increase in deposits over time, focusing on the strategic channels contributing to growth. It sets forth target goals for consumer and transaction banking deposits by 2024, reflecting the company's ambitions and market analysis efforts.
deposit growth, strategic channels, 2024 targets, market analysis, column chart
false
Financial Performance
Financial Services
Mixed Chart
Goldman Sachs
Add to my slides
Remove from favorites
The slide features a column chart comparing average teller transactions per customer in 2014 and 2018, with a significant decrease shown. There's a large number on the right side highlighting a statistic, and three text blocks summarizing key points.
Market Analysis and Trends
Financial Services
The slide presents data showing a decrease in teller transactions per customer, emphasizing the importance of a physical bank presence despite growing self-service options. It is likely used to discuss customer behavior trends and branch strategy in the banking industry.
deposit growth, teller transactions, branches, self-service, customer behavior, physical network, banking, industry, household usage, flexibility
false
Market Analysis and Trends
Financial Services
Mixed Chart
JP Morgan
Add to my slides
Remove from favorites
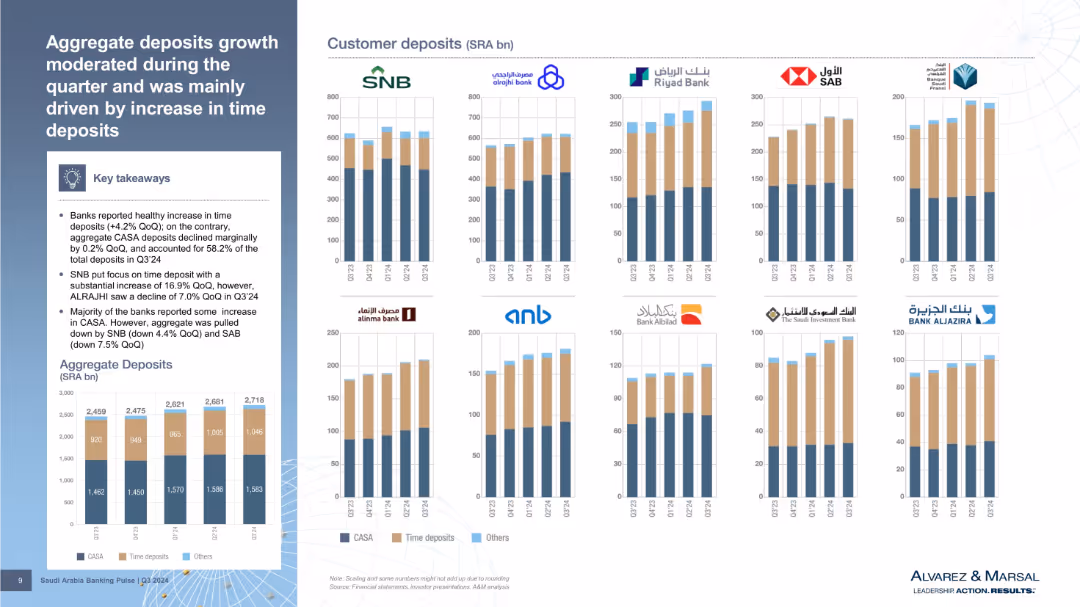
Similar format to previous slide: key takeaways on left; right side features stacked bar charts of customer deposits by type (CASA, time, others) for each bank.
Customer and Market Segmentation
Financial Services
Analyzes deposit growth drivers, with emphasis on time deposits. Breaks down CASA vs. time deposit shares and highlights performance across banks like SNB and ALRAJHI.
deposit mix, time deposits, CASA, customer behavior, bank deposits, Q3’24, deposit composition, financial performance
false
Customer and Market Segmentation
Financial Services
Multiple Chart
Alvarez & Marsal
Add to my slides
Remove from favorites
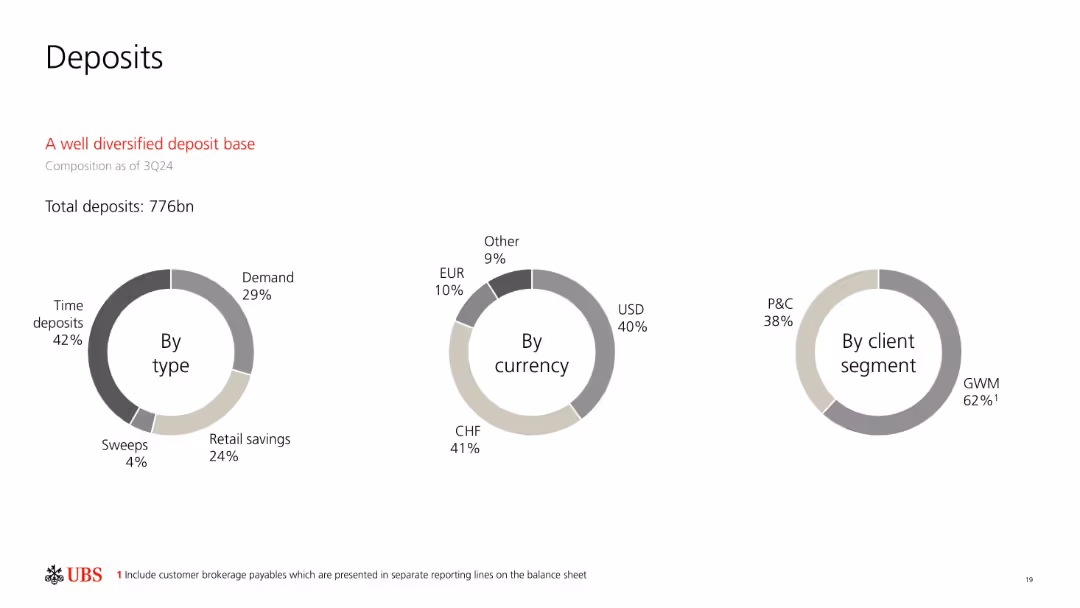
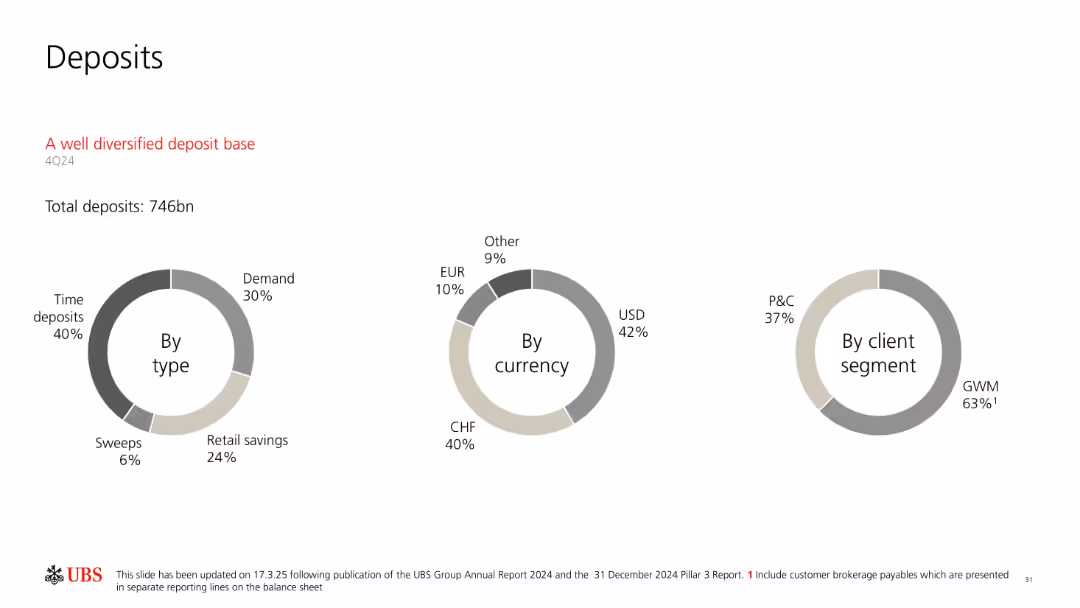
Three donut charts labeled "By type," "By currency," and "By client segment" using neutral tones; red subheading for emphasis.
Customer and Market Segmentation
Financial Services
This slide shows the composition of UBS’s deposit base as of 3Q24. Deposits total 776bn, broken down by type (e.g., time deposits), currency (e.g., CHF, USD), and client segment (e.g., GWM and P&C). The visual underscores diversification across key categories.
deposit mix, time deposits, demand deposits, client segments, CHF, USD, diversified, banking, 3Q24
false
Customer and Market Segmentation
Financial Services
Single Chart
UBS
Add to my slides
Remove from favorites
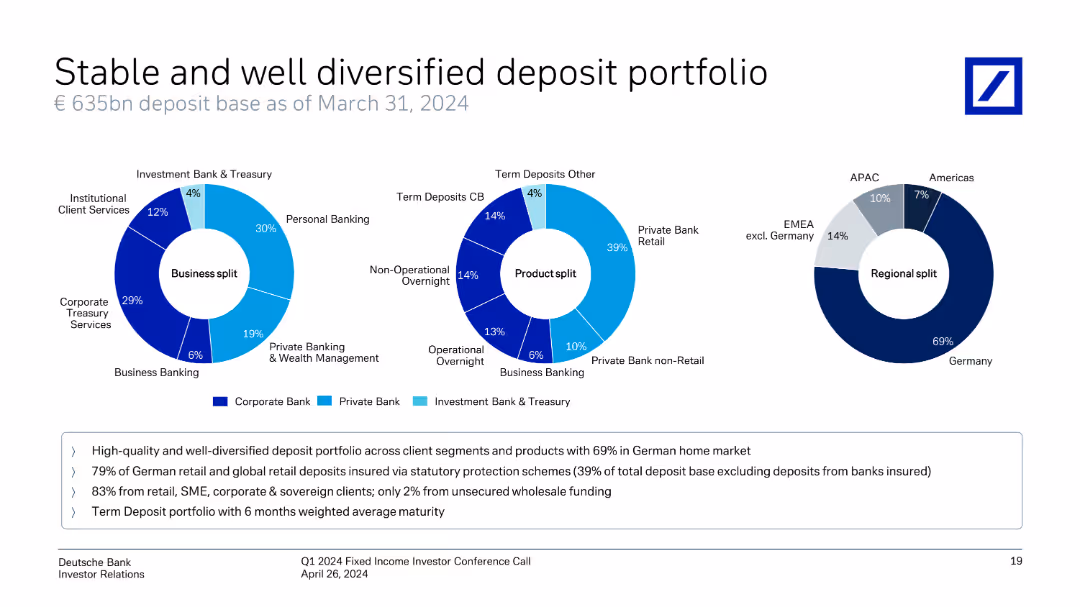
The slide displays three pie charts showing business split, product split, and regional split of the deposit portfolio as of March 31, 2024.
Financial Performance
Financial Services
It details Deutsche Bank's diversified deposit portfolio, including business, product, and regional splits, with relevant metrics.
deposit portfolio, diversification, business split, product split, regional split, Deutsche Bank
false
Financial Performance
Financial Services
Multiple Chart
Deutsche Bank
Add to my slides
Remove from favorites
Three donut charts presenting €650bn deposit base by segment, product type, and region; bullet-point summary at the bottom.
Financial Performance
Financial Services
As of Q3 2024, Deutsche Bank’s €650bn deposit base is highly diversified—69% from Germany, 81% from stable client groups. Product mix includes a significant portion in retail and term deposits, with an average 7-month maturity, reflecting a stable, low-risk funding foundation.
deposit portfolio, diversification, Germany, retail deposits, funding stability
false
Financial Performance
Financial Services
Mixed Chart
Deutsche Bank
Add to my slides
Remove from favorites
A line chart showing the difference between central bank policy rates and banks' average deposit rates in the Euro area and the UK over time, with commentary on the right.
Market Analysis and Trends
Financial Services
This slide explains the impact of central bank policy rate changes on bank deposit rates in Europe and the UK, highlighting implications for corporate cash balances and bank earnings.
Deposit pricing, central bank rates, Euro area, UK, bank earnings, corporate implications
false
Market Analysis and Trends
Financial Services
Mixed Chart
Accenture
Add to my slides
Remove from favorites
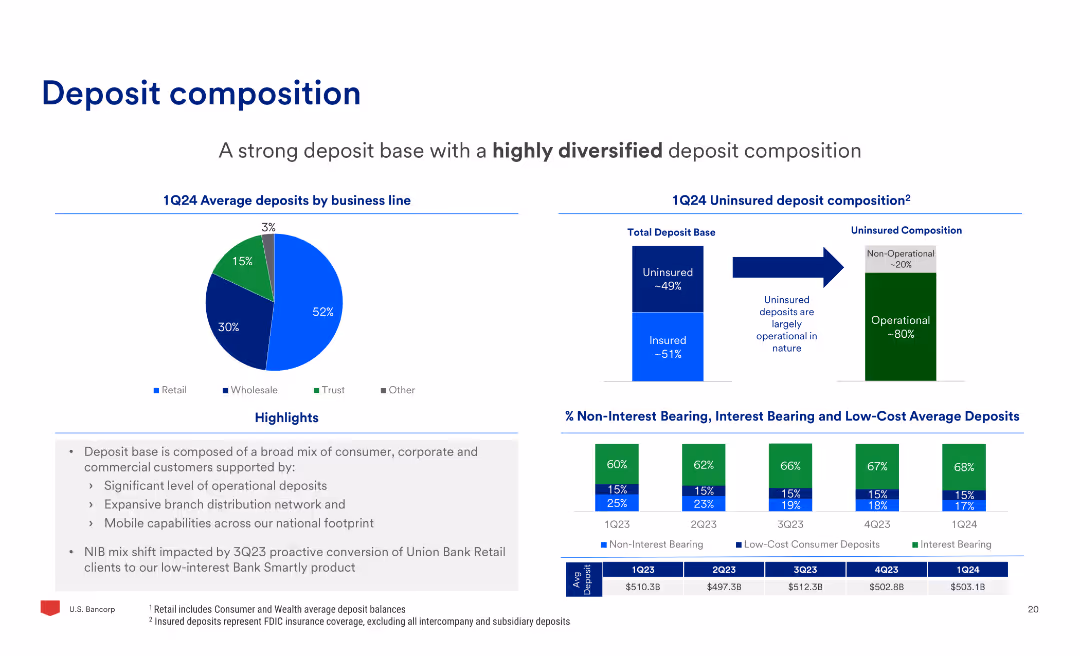
The slide includes a pie chart of average deposits by business line, a bar chart of uninsured deposit composition, and a bar chart of non-interest bearing, interest bearing, and low-cost deposits.
Market Analysis and Trends
Financial Services
The slide analyzes the deposit composition, highlighting the diversification of deposits by business line and the composition of uninsured deposits, with a focus on operational deposits.
Deposits, Composition, Business, Uninsured, Interest, Operational
false
Market Analysis and Trends
Financial Services
Multiple Chart
Barclays
Add to my slides
Remove from favorites
Donut charts showing breakdown of deposits by type, currency, and client segment, along with summary of new deposits and money inflows.
Financial Performance
Financial Services
Analysis of UBS's deposit base, including new deposits, types of deposits, and distribution by currency and client segment.
Deposits, currency, segments, inflows, diversification
false
Financial Performance
Financial Services
Multiple Chart
UBS
Add to my slides
Remove from favorites
This slide includes a pie chart and a checklist. The pie chart illustrates the composition of total deposits, and the checklist outlines the characteristics of the deposits. The slide is clear and informative with a straightforward presentation of data.
Operational Efficiency
Financial Services
It breaks down the firm's deposit base, showing diversification and insurance coverage. With details on deposit types and insurance, it could be used for presentations on financial stability and deposit strategies.
Deposits, Diversification, FDIC Insured, Funding Liabilities, Deposit Composition
false
Operational Efficiency
Financial Services
Mixed Chart
Goldman Sachs
Add to my slides
Remove from favorites
Features complex pie charts detailing the composition of the deposit base across different banking segments.
Financial Performance
Financial Services
Reviews the stability and diversification of the bank's deposit portfolio, emphasizing strong positions in key market segments.
deposits, diversification, finance, stability, banking, market segments
false
Financial Performance
Financial Services
Multiple Chart
Deutsche Bank
Add to my slides
Remove from favorites
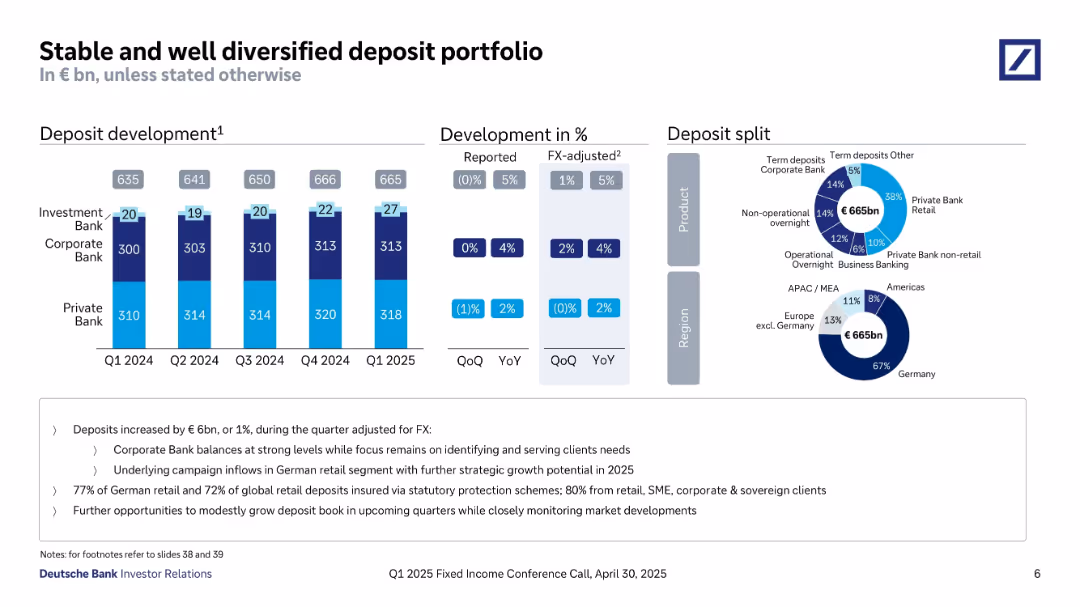
Includes stacked bar charts of deposit development, % development table, donut charts showing product and regional splits, and descriptive text.
Performance Metrics and KPIs
Financial Services
The slide reports stable deposit growth (+€6bn QoQ) to €665bn by Q1 2025. It analyzes composition across Corporate, Private, and Investment Banks, and discusses insurance protection and potential for further growth in retail deposits.
Deposits, Diversification, Growth, Private Bank, Corporate Bank, Product Split, Region Split, Insurance
false
Performance Metrics and KPIs
Financial Services
Multiple Chart
Deutsche Bank
Add to my slides
Remove from favorites
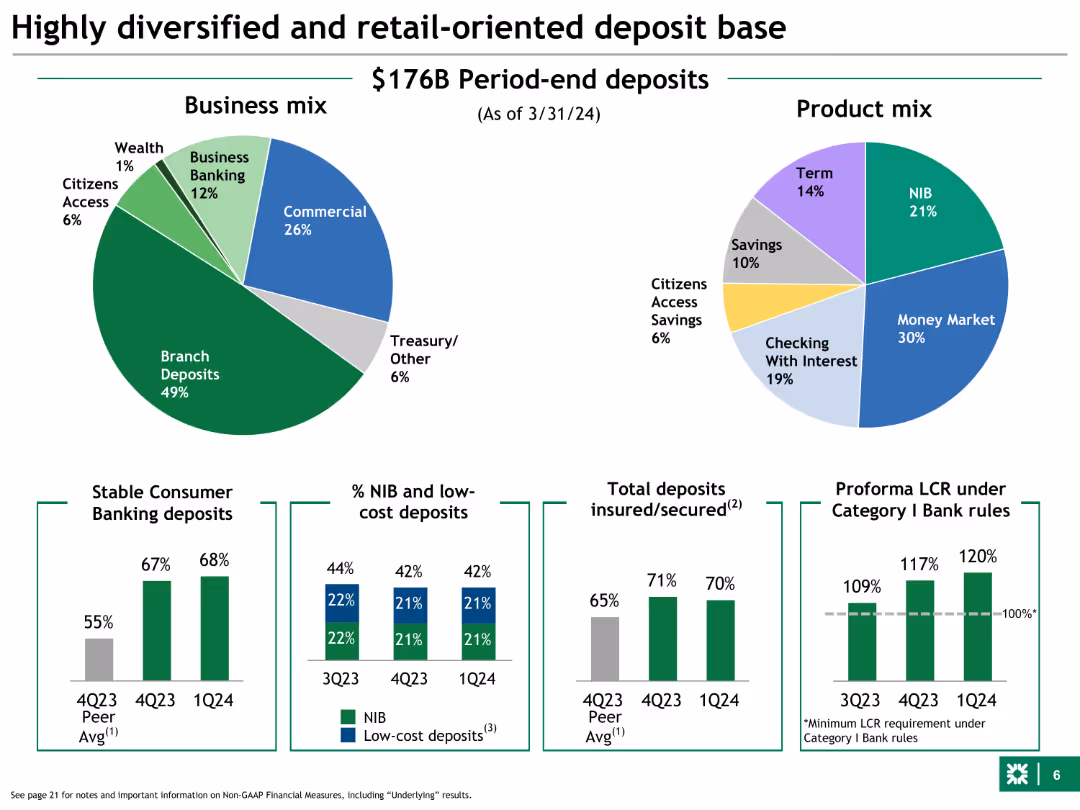
Pie charts showing business mix and product mix, along with bar charts for deposit metrics. Uses various colors to distinguish different segments.
Market Analysis and Trends
Financial Services
This slide illustrates the bank's diverse deposit base, breaking down business and product mix, and showing stability and growth in consumer banking deposits.
deposits, diversification, product mix, stability, growth
false
Market Analysis and Trends
Financial Services
Multiple Chart
Barclays
Add to my slides
Remove from favorites
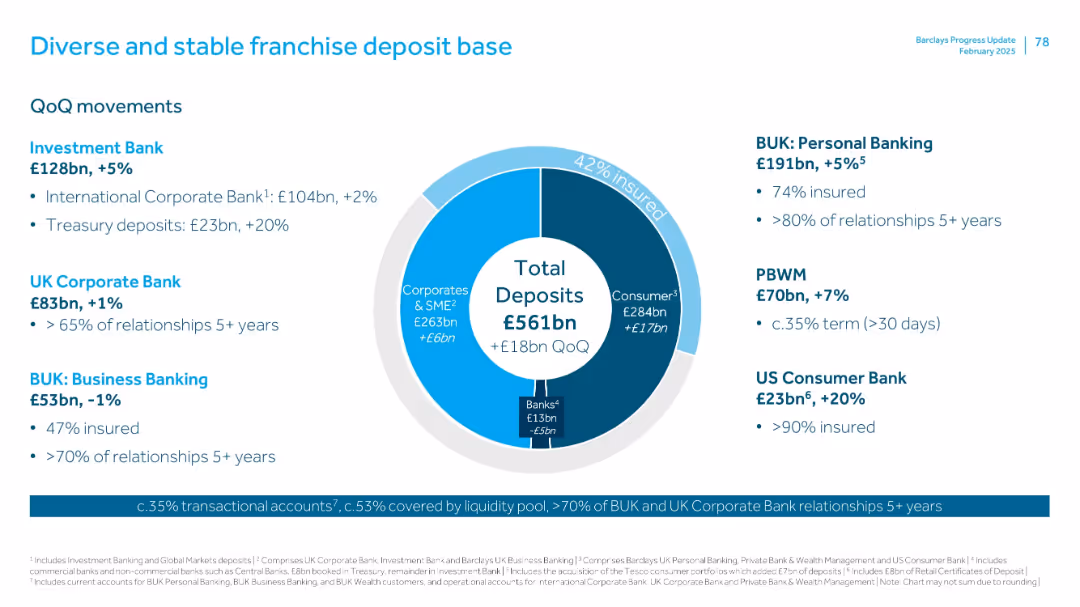
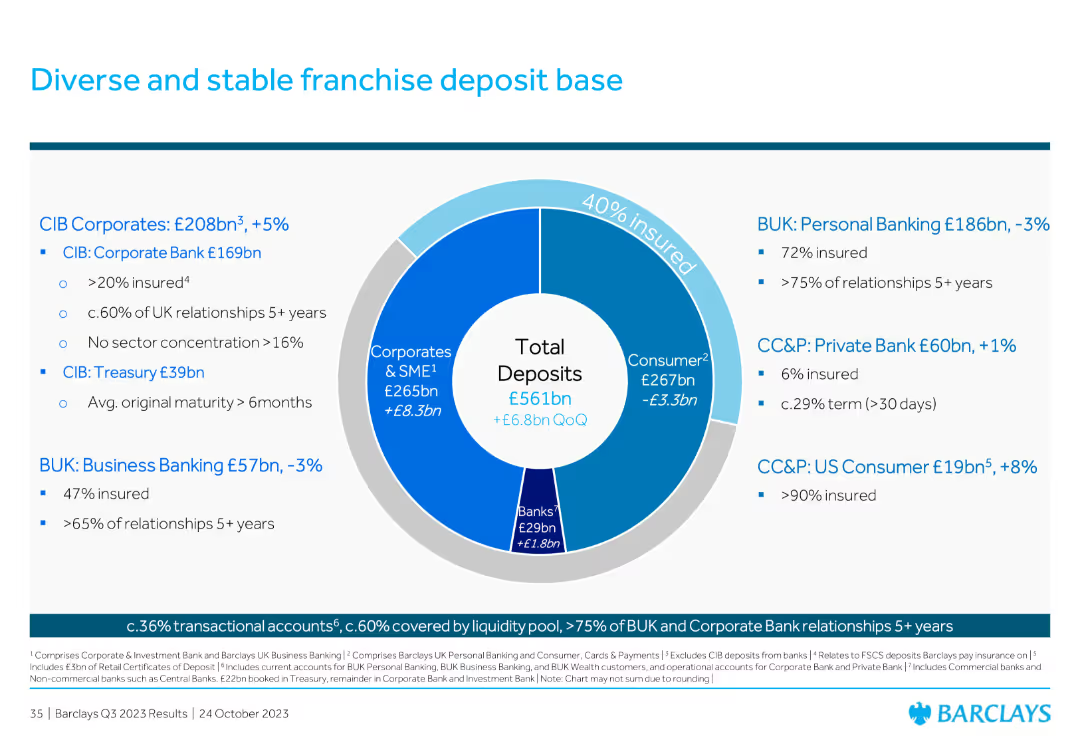
Donut chart at center showing breakdown of total deposits. Accompanied by textual breakdown of QoQ changes in segments. Clean white-blue design.
Financial Performance
Financial Services
Illustrates deposit diversification across segments like Investment Bank, UK Corporate, and Personal Banking. Notes 42% of deposits are insured and emphasizes long-standing client relationships. Displays £561bn in total deposits with £18bn QoQ growth.
deposits, diversification, QoQ, personal banking, insured, franchise
false
Financial Performance
Financial Services
Mixed Chart
Barclays
Add to my slides
Remove from favorites
The slide includes a text box with key deposit figures, followed by multiple pie charts categorizing deposits by type, currency, and client segment.
Financial Performance
Financial Services
It presents a breakdown of deposits, showcasing diversification by type, currency, and client segment, with figures for net new deposits.
deposits, diversification, type, currency, client segment, UBS, 2Q23, stability, trends, net new
false
Financial Performance
Financial Services
Multiple Chart
UBS
Add to my slides
Remove from favorites
The slide shows a time-series column chart with incremental increases annotated, and text boxes highlighting key figures and trends in customer deposits.
Market Analysis and Trends
Financial Services
Highlights the consistent growth in Macquarie's customer deposits, emphasizing the strategy behind expanding the deposit base over several years.
Deposits, Growth, Strategy, BFS, CMA
false
Market Analysis and Trends
Financial Services
Mixed Chart
Morgan Stanley
Add to my slides
Remove from favorites
Three donut charts showing total deposits of 746bn by type, currency, and client segment. Light minimalist layout.
Customer and Market Segmentation
Financial Services
Breaks down UBS’s 4Q24 deposit base by deposit type (time, demand, savings), currency (USD, CHF, EUR), and client segment (GWM, P&C). Highlights diversification across deposit characteristics and dominant contribution from GWM clients.
deposits, GWM, P&C, currency, UBS, time deposits, diversification
false
Customer and Market Segmentation
Financial Services
Single Chart
UBS
Add to my slides
Remove from favorites
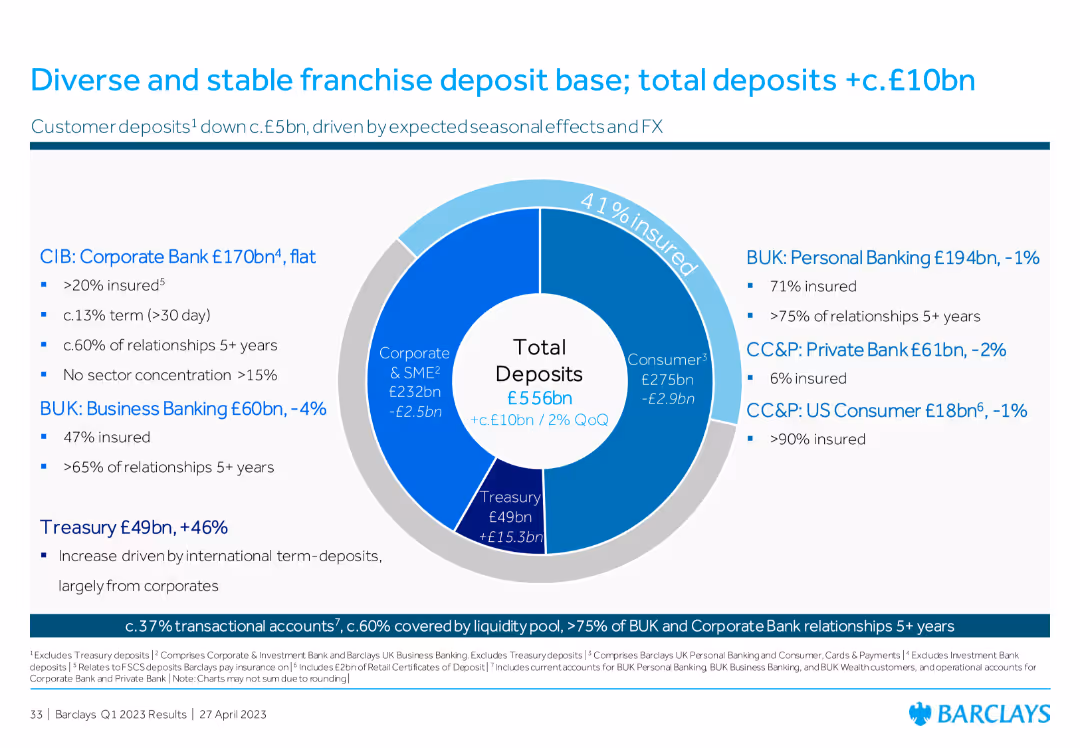
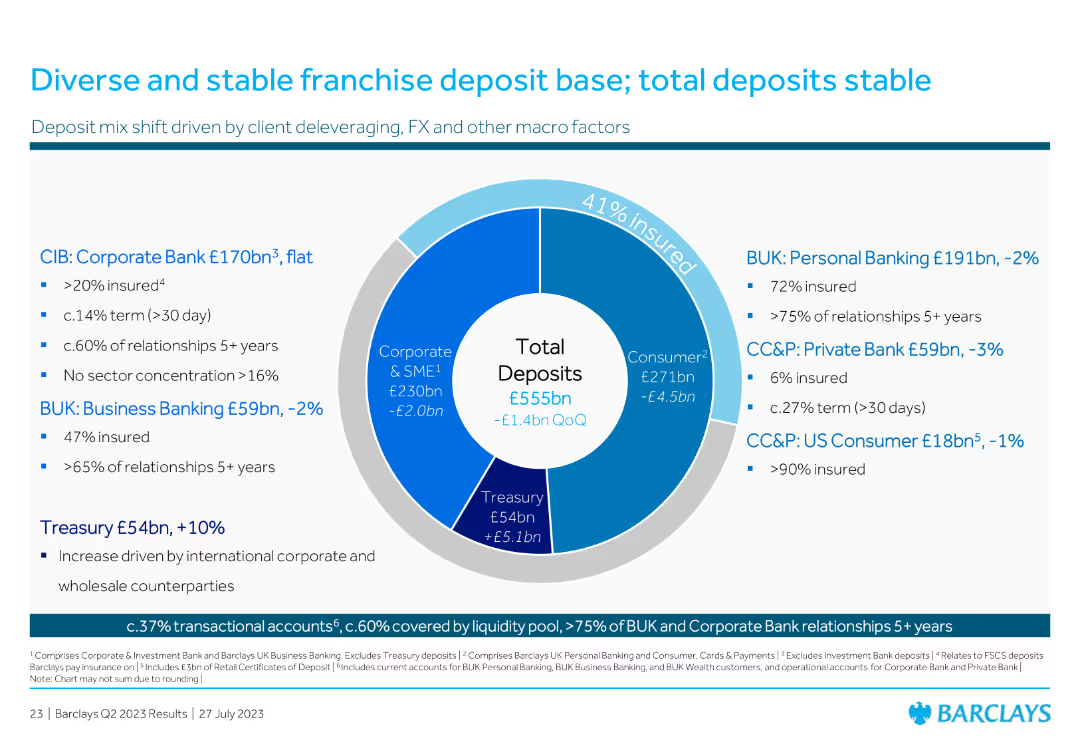
Central pie chart illustrating total deposits with segments for Corporates & SME, Consumer, and Banks. Surrounding text and bullet points provide detailed data points.
Market Analysis and Trends
Financial Services
Highlights the composition and insurance of Barclays' deposit base across different business segments, emphasizing stability and insurance coverage.
deposits, insurance, stability, Barclays, market analysis, franchise, SME, consumer, banks, trends
false
Market Analysis and Trends
Financial Services
Mixed Chart
Barclays
Add to my slides
Remove from favorites
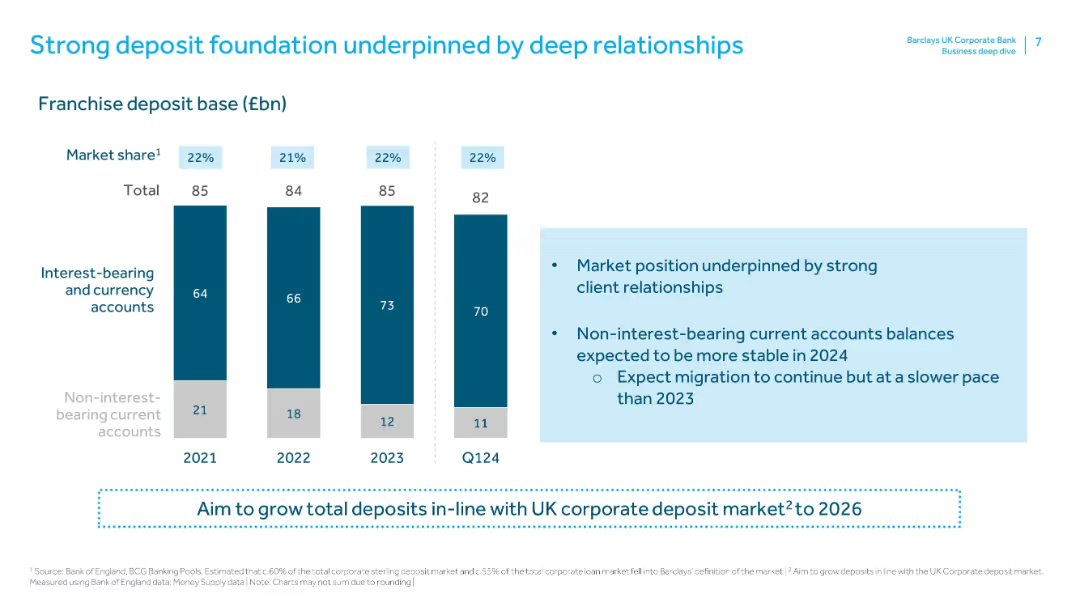
Contains vertical bars showing interest-bearing and non-interest-bearing accounts (2021–Q1 2024). Right side has a text box detailing market position and expectations for 2024.
Strategic Planning
Financial Services
Highlights Barclays UKCB’s strong market share (22%) and client relationships in deposits. It also shows a shift from non-interest to interest-bearing accounts and outlines expectations for stabilization and slower migration in 2024.
deposits, interest-bearing, market share, client relationships, account balances, deposit growth, franchise base, strategic planning
false
Strategic Planning
Financial Services
Mixed Chart
Barclays
Add to my slides
Remove from favorites
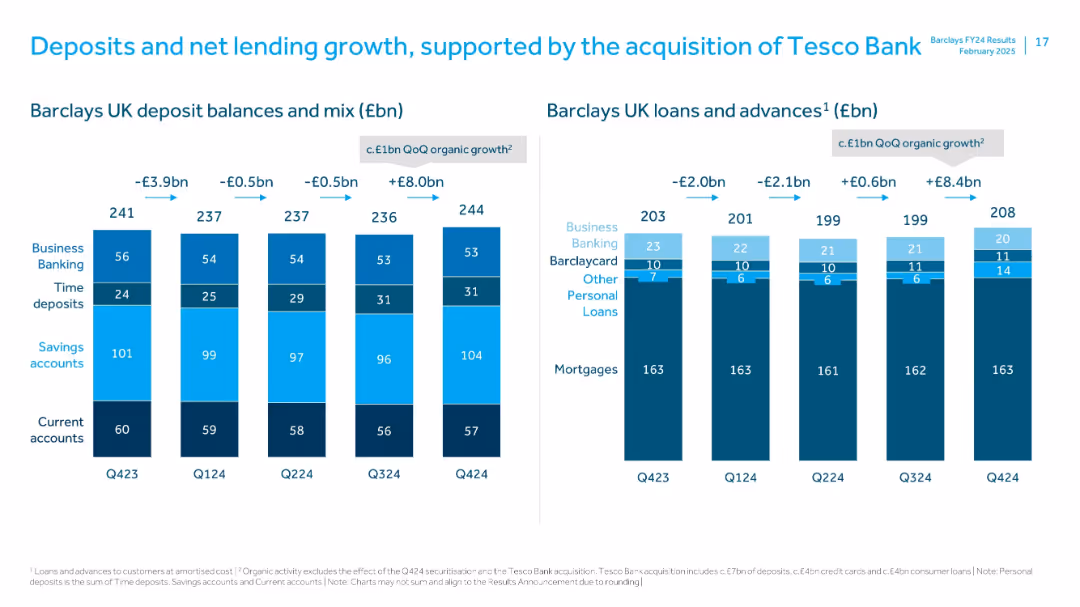
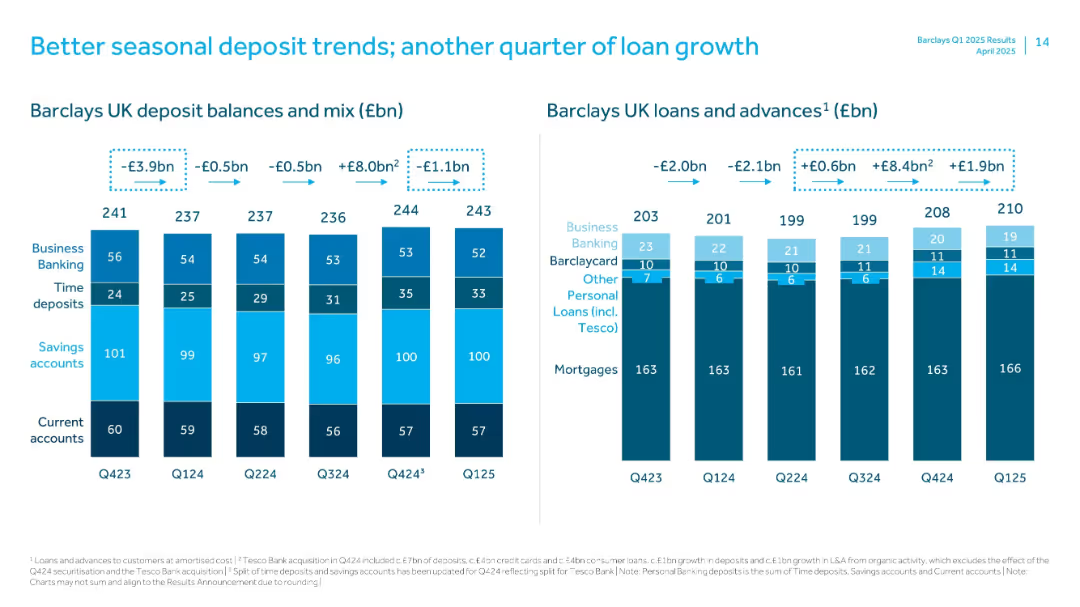
Two-panel layout: deposits on left and loans on right; both with stacked bars and color-coded segments; arrows show net movements
Strategic Planning
Financial Services
Analyzes Barclays UK deposit and lending activity, noting a £1bn QoQ organic growth. The Tesco Bank acquisition contributes materially to growth across deposits, loans, and cards. Trends in segment mix are visually emphasized.
deposits, lending, Tesco acquisition, organic growth, Barclays UK, Q424, segment mix
false
Strategic Planning
Financial Services
Multiple Chart
Barclays
Add to my slides
Remove from favorites
Includes multiple pie charts and a column chart detailing the deposit and loan distribution by business type and product, with annotations explaining key strategies.
Financial Performance
Financial Services
This slide details the bank's deposit and loan structures as of Q1 2023, highlighting diversity and stability across different banking sectors and products, and outlines how these are managed to mitigate risks and ensure growth.
Deposits, Loans, Banking, Diversification, Q1 2023, Risk Management, Stability, Growth
false
Financial Performance
Financial Services
Multiple Chart
Deutsche Bank
Add to my slides
Remove from favorites
Dual stacked bar charts tracking deposit balances/mix and loans/advances over time, segmented by category.
Performance Metrics and KPIs
Financial Services
Compares quarterly trends in deposits and loan growth. Deposit balances show seasonal shifts, while loans and advances have seen consistent growth. Breakdowns include business banking, savings, current accounts, and personal loans including Tesco.
Deposits, Loans, Barclays UK, Seasonal Trends, Tesco, Q125, Personal Banking, Advances, Balances
false
Performance Metrics and KPIs
Financial Services
Multiple Chart
Barclays
Add to my slides
Remove from favorites
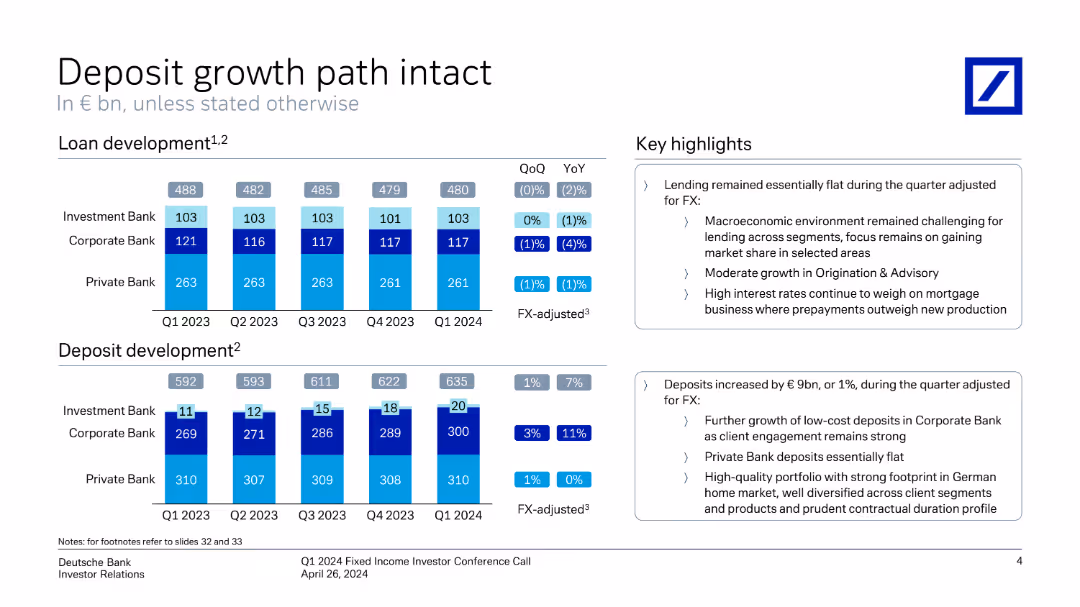
The slide includes two sets of vertical column charts comparing loan and deposit developments across quarters, with key highlights on the right.
Financial Performance
Financial Services
The slide provides a comparison of loan and deposit growth over several quarters, highlighting stability and growth in Deutsche Bank's financial operations.
deposits, loans, financial growth, stability, Deutsche Bank, Q1 2024, investor relations, quarterly performance, financial operations, market trends
false
Financial Performance
Financial Services
Multiple Chart
Deutsche Bank
Add to my slides
Remove from favorites
Contains a series of column charts and data tables presenting loan and deposit figures over several quarters, with emphasis on trends and adjustments for currency effects.
Financial Performance
Financial Services
Details recent trends in the bank's deposit and loan figures, illustrating strategic financial management and stability in the face of economic challenges, with a focus on year-over-year comparisons and foreign exchange adjustments.
Deposits, Loans, Trends, Financial Stability, Economic Challenges, Currency Adjustments
false
Financial Performance
Financial Services
Multiple Chart
Deutsche Bank
Add to my slides
Remove from favorites
Includes multiple pie charts showing the composition of deposits by type and region, using a color-coded scheme for clarity. Regional distribution is detailed in a secondary pie chart with associated legends.
Market Analysis and Trends
Financial Services
Analyzes the deposit structure in the German market, highlighting the distribution across various banking sectors and regions. It provides a market analysis perspective, focusing on customer segmentation and funding sources within the financial sector.
deposits, market analysis, financial, segmentation, regional
false
Market Analysis and Trends
Financial Services
Multiple Chart
Deutsche Bank
Add to my slides
Remove from favorites
The slide contains a column chart showing BUK deposit balances and mix (£bn) from Dec 2019 to Sep 2023. It also features a net interest margin bridge for FY23 guidance.
Financial Performance
Financial Services
The slide presents Barclays UK's deposit mix and provides guidance for FY23 net interest margin, detailing deposit balances and mix changes over time and the factors affecting net interest margin.
deposits, mix, NIM, guidance, FY23
false
Financial Performance
Financial Services
Multiple Chart
Barclays
Add to my slides
Remove from favorites
Line graph comparing deposit franchise performance among peers, and a scatter plot representing deposit relationships. Text explanation on the side.
Market Analysis and Trends
Financial Services
Comparative performance analysis of the deposit franchise with peers, highlighting growth and operational relationships. Used for market positioning and competitive analysis.
deposits, performance, comparison, peers, banking industry, market analysis
false
Market Analysis and Trends
Financial Services
Multiple Chart
Morgan Stanley
Add to my slides
Remove from favorites
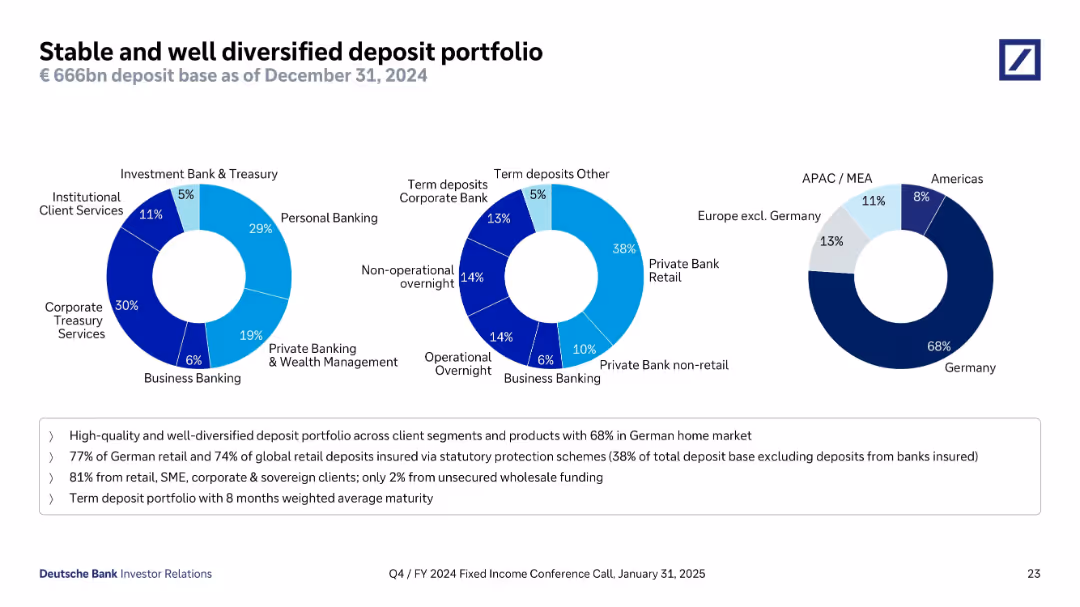
Three donut charts show deposit distribution by client type, deposit type, and geography. The visuals are clean and colored to separate categories. A text box below summarizes key figures and metrics.
Customer and Market Segmentation
Financial Services
This slide details Deutsche Bank’s €666bn deposit base as of December 2024. It shows client type diversification (e.g., retail, corporate), deposit types (term, overnight), and geographic spread (68% in Germany). It emphasizes a high-quality, insured, and well-diversified deposit base, primarily from stable retail and corporate sources.
deposits, retail, corporate, Germany, diversification, deposit insurance, stability, Deutsche Bank
false
Customer and Market Segmentation
Financial Services
Mixed Chart
Deutsche Bank
Add to my slides
Remove from favorites
The slide includes a pie chart in the center showing the distribution of total deposits across different sectors, with detailed bullet points surrounding it.
Market Analysis and Trends
Financial Services
This slide presents the distribution and stability of the deposit base, emphasizing the diversity across different banking sectors and the overall increase in deposits, despite a slight decline in some areas.
deposits, stability, banking sectors, market trends
false
Market Analysis and Trends
Financial Services
Mixed Chart
Barclays
Add to my slides
Remove from favorites
Features a pie chart and bullet points outlining the composition of total deposits across different segments.
Financial Performance
Financial Services
Highlights the diversity and stability of the franchise deposit base, showing stable total deposits and their composition.
deposits, stable, franchise, diversity, base
false
Financial Performance
Financial Services
Mixed Chart
Barclays
Add to my slides
Remove from favorites
Shows a pie chart detailing the composition of total deposits and key bullet points on segment performance.
Financial Performance
Financial Services
Emphasizes the stability and diversity of the deposit base, with data on different segments and total deposits.
deposits, stable, franchise, diversity, segments
false
Financial Performance
Financial Services
Mixed Chart
Barclays
Add to my slides
Remove from favorites
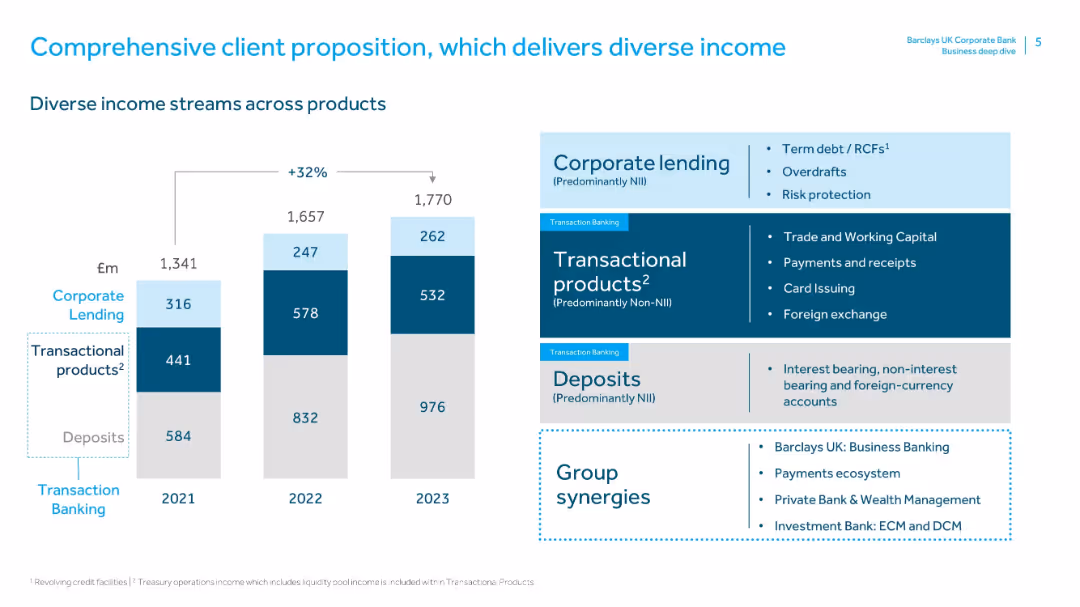
Left side features a vertical stacked bar chart (2021–2023) with segments for Deposits, Transactional Products, and Corporate Lending. Right side includes color-coded text boxes with descriptions of each segment. Clean, corporate layout with blue color palette.
Product and Service Analysis
Financial Services
This slide shows how Barclays UK Corporate Bank generates income from diverse products—Deposits, Transactional Products, and Corporate Lending—with a 32% growth in total income from 2021 to 2023. It outlines product characteristics and synergies from other Barclays divisions.
deposits, transactional products, corporate lending, income growth, group synergies, NII, non-NII, diversification, product analysis, revenue streams
false
Product and Service Analysis
Financial Services
Mixed Chart
Barclays
Add to my slides
Remove from favorites
Detailed slide with column charts depicting deposit balances over quarters and net interest margin (NIM) movements, illustrating financial trends.
Financial Performance
Financial Services
Discusses improvements in deposit trends and their impact on net interest margins, showing strategic financial management over the fiscal year.
deposit trends, net interest margin, NIM, FY23, financial trends, Barclays, banking
false
Financial Performance
Financial Services
Multiple Chart
Barclays
Add to my slides
Remove from favorites
The slide features a column chart comparing depot costs in Australia, the US, and France. Bullet points explain the factors affecting depot costs and their role in the supply chain.
Operational Efficiency
Transportation & Logistics
It analyzes depot costs in Australia relative to the US and France, discussing the reliance on intermediate storage and the implications for supply chain efficiency in the cement industry.
depot costs, supply chain, Australia, US, France, cement industry
false
Operational Efficiency
Transportation & Logistics
Mixed Chart
LEK
Add to my slides
Remove from favorites
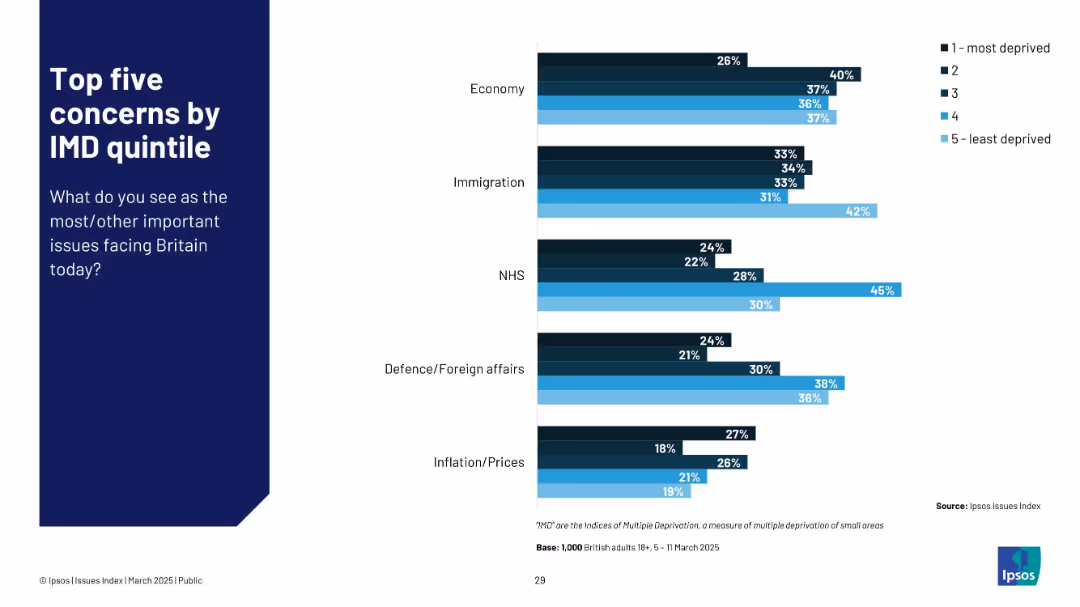
Ranked bar chart using shades of blue to represent quintiles (most to least deprived). Covers top 5 concerns: Economy, Immigration, NHS, Defence, Inflation.
Risk Assessment and Management
Government & Public Sector
Shows correlation between deprivation and concern areas. Most deprived rank immigration highest, while least deprived prioritize NHS and economy. Displays disparities in concern levels across socio-economic status.
deprivation index, public concern, IMD, inequality, Ipsos, socio-economic analysis
false
Risk Assessment and Management
Government & Public Sector
Mixed Chart
IPSOS
Add to my slides
Remove from favorites
Column charts illustrate the progression of risk-weighted assets and leverage exposure from 3Q22 to 2025 targets.
Risk Assessment and Management
Financial Services
Reviews the progress of the Non-Core Unit’s de-risking activities, reducing risk-weighted assets and leverage exposure, with significant liquidity generation.
de-risking, NCU, risk-weighted assets, leverage exposure, financial strategy
false
Risk Assessment and Management
Financial Services
Multiple Chart
Credit Suisse
Add to my slides
Remove from favorites
The slide contains a line chart showing the number of mentions of "De-risk" or "Decouple" in company documents from 2013 to 2024, along with annotations for significant events.
Risk Assessment and Management
Financial Services
The slide discusses the diversification of global supply chains, government incentives for local production, technology and security concerns, and weaker market growth in China.
De-risking, supply chains, government incentives, security concerns, China
false
Risk Assessment and Management
Financial Services
Mixed Chart
Accenture
Add to my slides
Remove from favorites
Includes a column chart with additional numerical data panels explaining the net effects of financial derivatives and regulations.
Regulatory and Compliance
Financial Services
Details on derivative exposure and impacts of netting on financial reporting, critical for compliance and risk management.
derivatives, financial reporting, compliance, risk management, netting
false
Regulatory and Compliance
Financial Services
Mixed Chart
Deutsche Bank
Add to my slides
Remove from favorites
The slide shows a stacked column chart illustrating the impact of netting and collateral on IFRS derivative trading assets, alongside bullet points for additional context. The design is minimalistic yet effective in conveying complex financial concepts.
Financial Performance
Financial Services
Reviews the net positions of derivative trading assets after adjustments for netting and collateral, serving as an analysis tool for understanding financial risk and asset management in banking.
derivatives, financial risk, banking, assets management
false
Financial Performance
Financial Services
Mixed Chart
Deutsche Bank
Add to my slides
Remove from favorites
Displays a complex visualization of derivatives trading assets under IFRS with a column chart showing impacts of netting and collateral. Also includes a textual description of key points below the chart.
Risk Assessment and Management
Financial Services
Outlines the netting and collateral effects on the financial position of derivatives under IFRS accounting, offering insights into risk management practices and economic exposure.
derivatives, financial, trading, risk, IFRS
false
Risk Assessment and Management
Financial Services
Mixed Chart
Deutsche Bank
Add to my slides
Remove from favorites
Features column chart with blue and grey colors illustrating derivatives and financial impacts. Clear layout with key points.
Risk Assessment and Management
Financial Services
Evaluates the impacts of netting and collateral on derivatives for risk reduction in financial reporting.
Derivatives, IFRS, financial risk, collateral, netting, financial reporting, asset management
false
Risk Assessment and Management
Financial Services
Mixed Chart
Deutsche Bank
Add to my slides
Remove from favorites
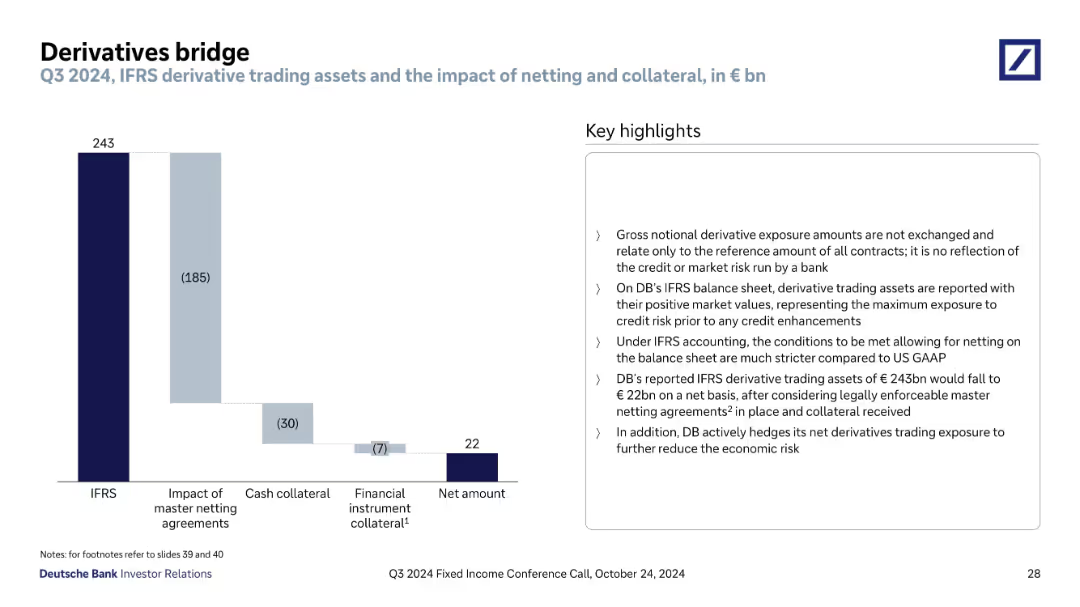
Waterfall chart on left and explanatory bullet points on right; simple, segmented bars; dark-to-light blue gradient shows reduction stages
Financial Performance
Financial Services
The slide explains how Deutsche Bank’s derivative trading assets are adjusted from IFRS-reported values to net amounts through master netting agreements and collateral. It emphasizes risk reduction strategies and accounting treatment.
derivatives, IFRS, netting, collateral, credit risk, financial exposure, accounting, Deutsche Bank, Q3 2024, trading assets
false
Financial Performance
Financial Services
Mixed Chart
Deutsche Bank
Add to my slides
Remove from favorites
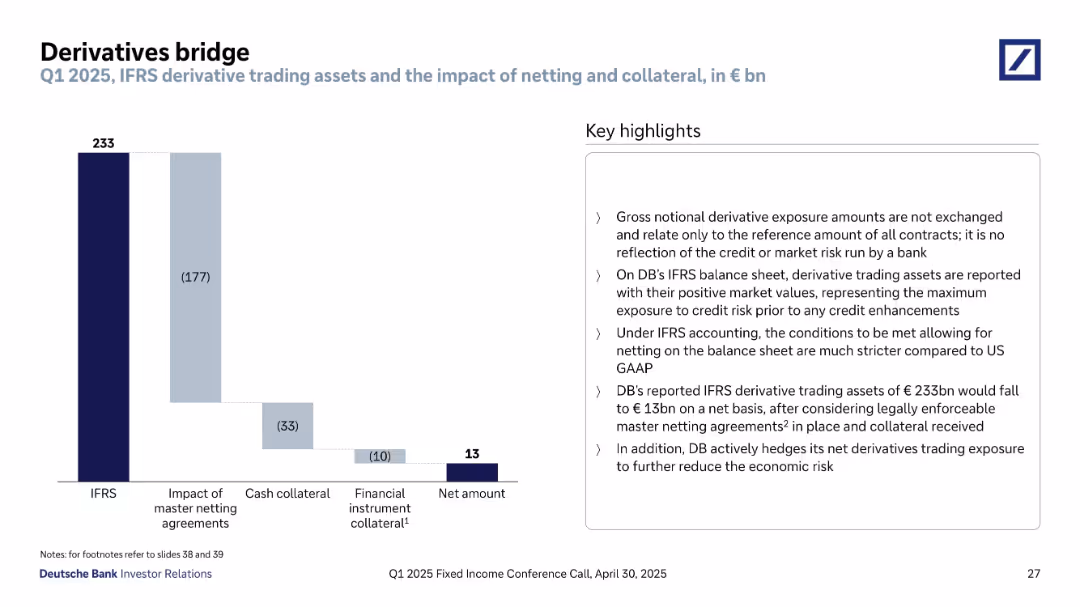
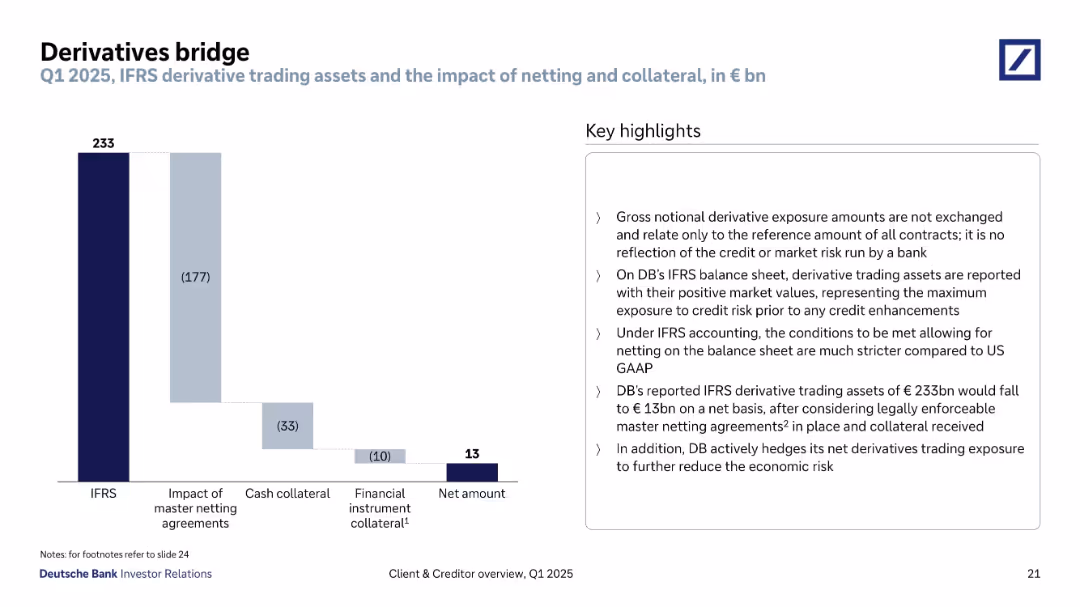
Waterfall chart showing IFRS to net amount adjustments; summary box on right.
Risk Assessment and Management
Financial Services
Shows how Deutsche Bank’s derivative trading asset value reduces from €233bn (IFRS) to €13bn net through netting and collateral. Explains IFRS accounting treatment versus U.S. GAAP, credit risk representation, and risk hedging strategies. Highlights conservative exposure reporting and efforts to minimize economic risk through netting and collateral management.
derivatives, IFRS, netting, collateral, credit risk, risk management, Deutsche Bank, waterfall chart, accounting treatment
false
Risk Assessment and Management
Financial Services
Mixed Chart
Deutsche Bank
Add to my slides
Remove from favorites
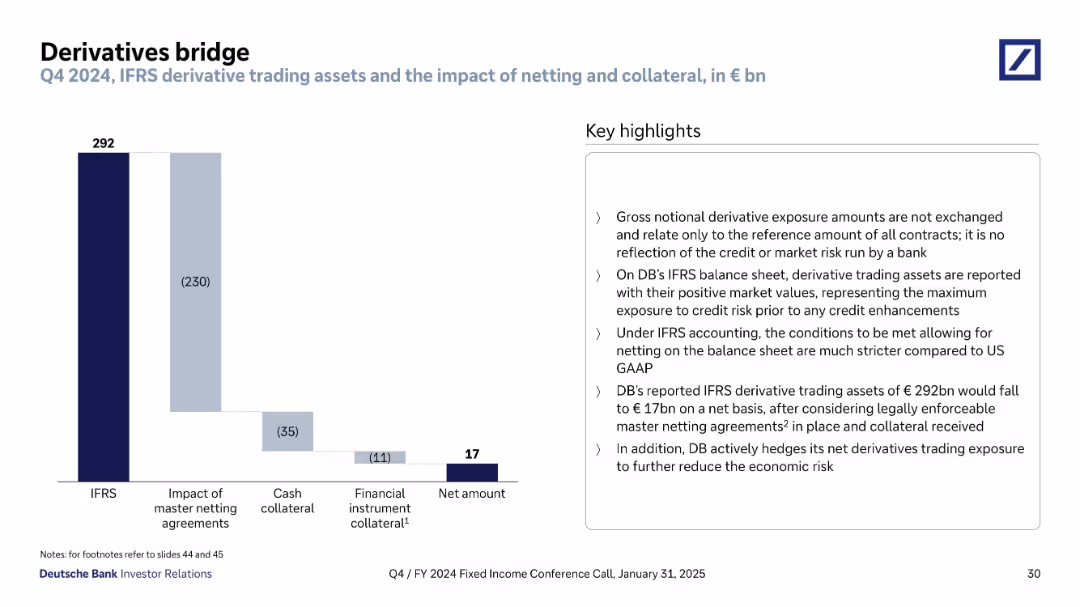
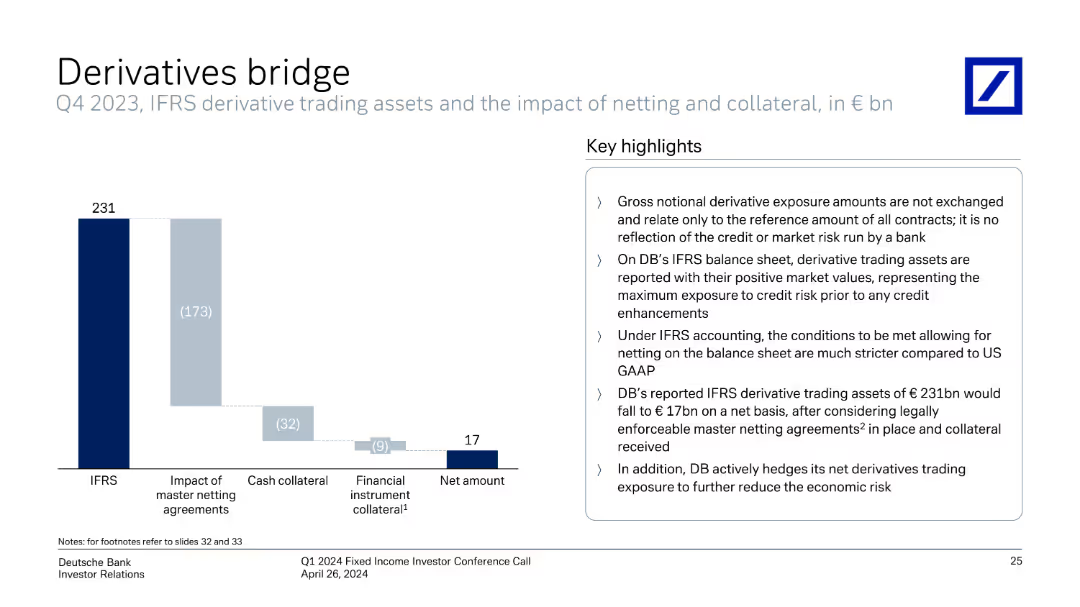
Waterfall bar chart from IFRS derivative assets (€292bn) to net amount (€17bn), adjusted for netting and collateral; summary box on right with explanations.
Regulatory and Compliance
Financial Services
Explains how Deutsche Bank adjusts gross IFRS derivative assets to derive the net risk exposure using netting agreements and collateral. Highlights strict IFRS rules compared to US GAAP and active hedging to reduce exposure.
derivatives, IFRS, netting, collateral, exposure, credit risk, GAAP
false
Regulatory and Compliance
Financial Services
Mixed Chart
Deutsche Bank
Add to my slides
Remove from favorites
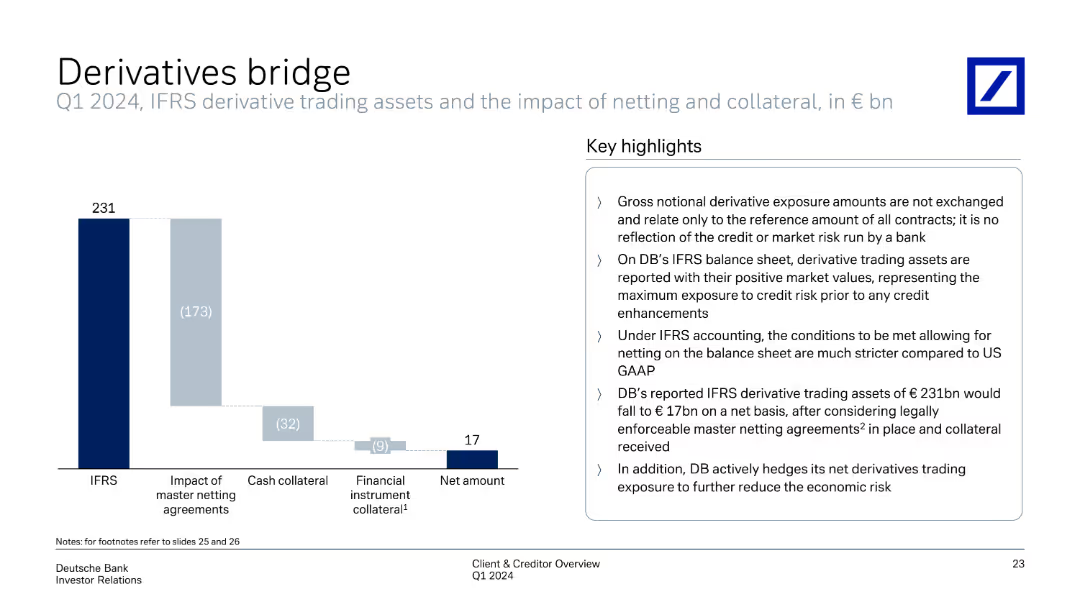
Contains a column chart explaining IFRS derivative trading assets, including the impact of netting and collateral. The right side summarizes key highlights of derivatives trading exposure and accounting treatment under IFRS.
Risk Assessment and Management
Financial Services
Summarizes IFRS derivative trading assets, illustrating netting and collateral impacts. The slide provides key highlights on gross notional exposure, IFRS accounting differences, and risk mitigation strategies employed by the bank to manage derivatives exposure.
derivatives, IFRS, netting, collateral, trading exposure
false
Risk Assessment and Management
Financial Services
Mixed Chart
Deutsche Bank
Add to my slides
Remove from favorites
Waterfall chart showing IFRS gross to net amount reconciliation with right-aligned key highlights box. Clean layout with descending bars and annotations.
Risk Assessment and Management
Financial Services
Outlines Deutsche Bank’s derivative trading exposure under IFRS accounting rules. Highlights the effects of netting agreements and collateral on reducing the gross €233bn exposure to €13bn net, emphasizing reduced economic and credit risk.
derivatives, IFRS, netting, exposure, collateral, risk mitigation
false
Risk Assessment and Management
Financial Services
Mixed Chart
Deutsche Bank
Add to my slides
Remove from favorites
Column chart showing IFRS derivative trading assets and net amounts with key highlights on the right.
Risk Assessment and Management
Financial Services
Explains the impact of netting and collateral on derivative trading assets, highlighting the gross and net amounts reported under IFRS.
derivatives, IFRS, trading assets, netting, collateral, exposure, financial reporting
false
Risk Assessment and Management
Financial Services
Mixed Chart
Deutsche Bank
Add to my slides
Remove from favorites
Column chart showing the breakdown of IFRS derivative trading assets and their net amounts with detailed annotations.
Risk Assessment and Management
Financial Services
Details the netting and collateral impacts on the derivative trading assets, offering insights into risk management and financial positioning.
derivatives, risk management, IFRS, netting, collateral, financial positioning, assets
false
Risk Assessment and Management
Financial Services
Mixed Chart
Deutsche Bank
Add to my slides
Remove from favorites
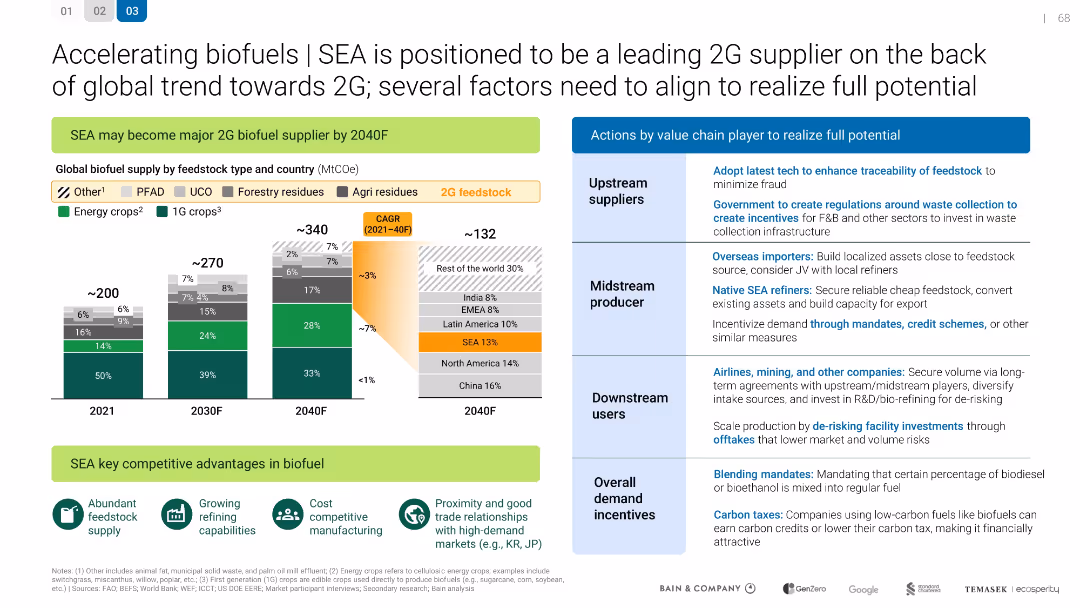
SEA is positioned to be a leading 2G supplier
Technology and Digital Transformation
Energy & Utilities
Technology and Digital Transformation
Describes how SEA can become a major 2G biofuel supplier by 2040. Details feedstock supply projections and value chain actions needed for success, including regulations, investment, and market development.
false
Technology and Digital Transformation
Energy & Utilities
Mixed Chart
Bain
Add to my slides
Remove from favorites
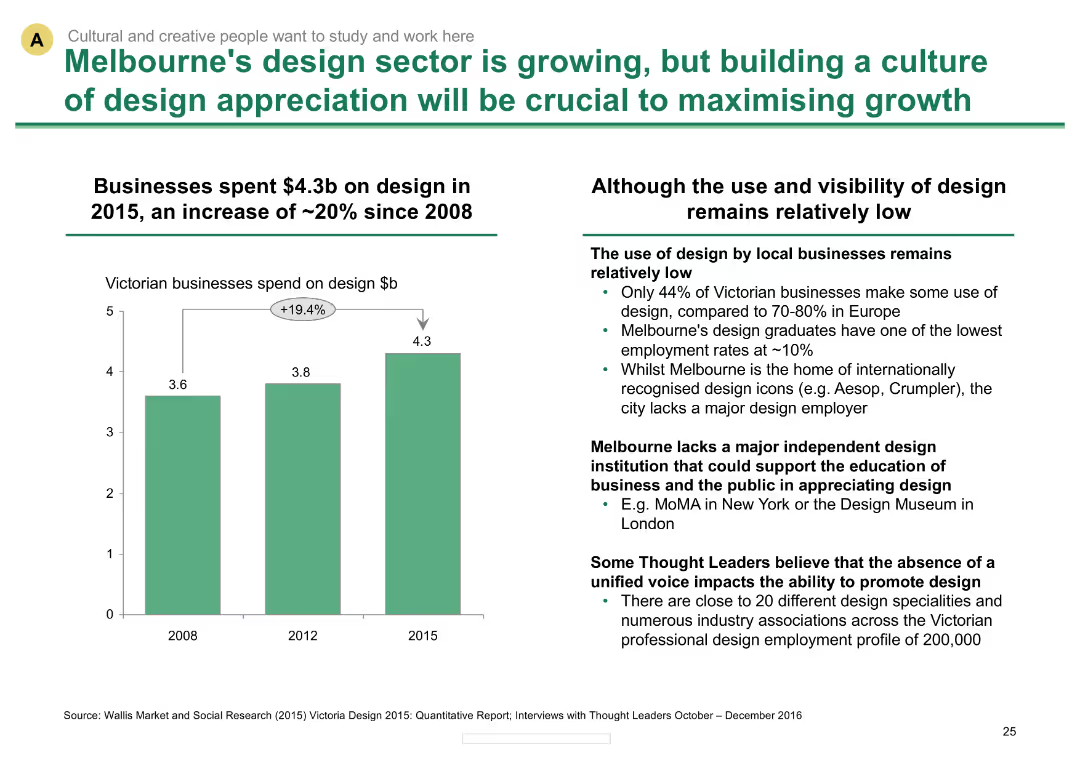
Column chart showing growth in design spending; text describing challenges in design sector visibility
Market Analysis and Trends
Industrial & Manufacturing
Analyzes growth in Melbourne's design sector and challenges in increasing design appreciation among businesses
Design sector growth, business spending, design challenges, Melbourne, industry trends
false
Market Analysis and Trends
Industrial & Manufacturing
Mixed Chart
BCG
Add to my slides
Remove from favorites
This slide displays three sets of column charts showing job search status, job satisfaction, and burnout levels among various age groups of deskless workers.
Human Resources and Talent Management
Professional Services
Analyzes job satisfaction and burnout rates among different age groups of deskless workers, highlighting trends and challenges in workforce management.
deskless workers, age groups, job satisfaction, burnout, column charts
false
Human Resources and Talent Management
Professional Services
Multiple Chart
BCG
Add to my slides
Remove from favorites
Graphical representation of deskless workers in various industries, icons for each sector, and a high-impact indicator.
Technology and Digital Transformation
Technology & Software
Overview of industries with a high proportion of non-desk workers potentially affected by AR/VR technologies, emphasizing immersive reality's scalability in these sectors.
Deskless workers, industries, AR, VR, immersive reality, scalability
false
Technology and Digital Transformation
Technology & Software
Graphic
McKinsey
Add to my slides
Remove from favorites
The slide shows a column chart comparing the quitting risk among deskless workers across various industries like retail, transportation, manufacturing, and healthcare, using different shades of green.
Market Analysis and Trends
Professional Services
This slide shows the risk of deskless workers quitting across different industries, useful for business analysts and industry stakeholders to understand labor stability.
deskless workers, industries, quitting risk, column chart
false
Market Analysis and Trends
Professional Services
Single Chart
BCG
Add to my slides
Remove from favorites
Includes a green gradient chart correlating various workplace needs with employee attrition risks, alongside their stated importance.
Organizational Structure and Change
Professional Services
Discusses the dichotomy between deskless workers’ stated important needs and those that actually influence their decisions to leave, essential for HR strategy.
deskless workers, needs, attrition, emotional support, chart
false
Organizational Structure and Change
Professional Services
Single Chart
BCG
Add to my slides
Remove from favorites
The slide presents a column chart comparing deskless workers at risk of quitting by country (UK, Germany, US, France) using shades of green to differentiate levels of quitting risk (actively looking, passively looking, not looking).
Industry Overview
Government & Public Sector
This slide analyzes the proportion of deskless workers in different countries considering quitting their jobs, highlighting the UK as having the highest risk, useful for HR and government studies on labor markets.
deskless workers, quitting, UK, comparison, column chart
false
Industry Overview
Government & Public Sector
Single Chart
BCG
Add to my slides
Remove from favorites
Features a column chart showing the quitting propensity of deskless workers based on their tenure at the job, using varying shades of green.
Risk Assessment and Management
Professional Services
Analyzes the likelihood of quitting among deskless workers based on job tenure, important for risk assessments in workforce management.
deskless workers, tenure, quitting likelihood, column chart
false
Risk Assessment and Management
Professional Services
Single Chart
BCG
Add to my slides
Remove from favorites
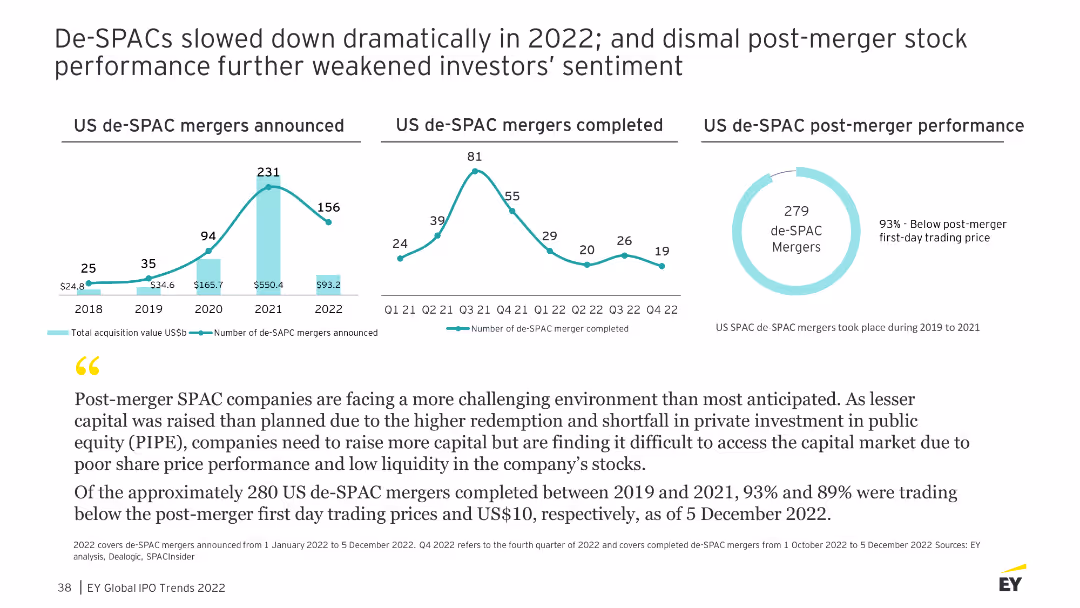
The slide shows multiple line charts illustrating the number of de-SPAC mergers announced and completed, as well as their post-merger performance from 2018 to 2022.
Market Analysis and Trends
Financial Services
Analyzes the decline in de-SPAC activity and the poor post-merger performance, highlighting challenges in the SPAC market.
de-SPAC, mergers, performance, market analysis
false
Market Analysis and Trends
Financial Services
Multiple Chart
EY
Add to my slides
Remove from favorites
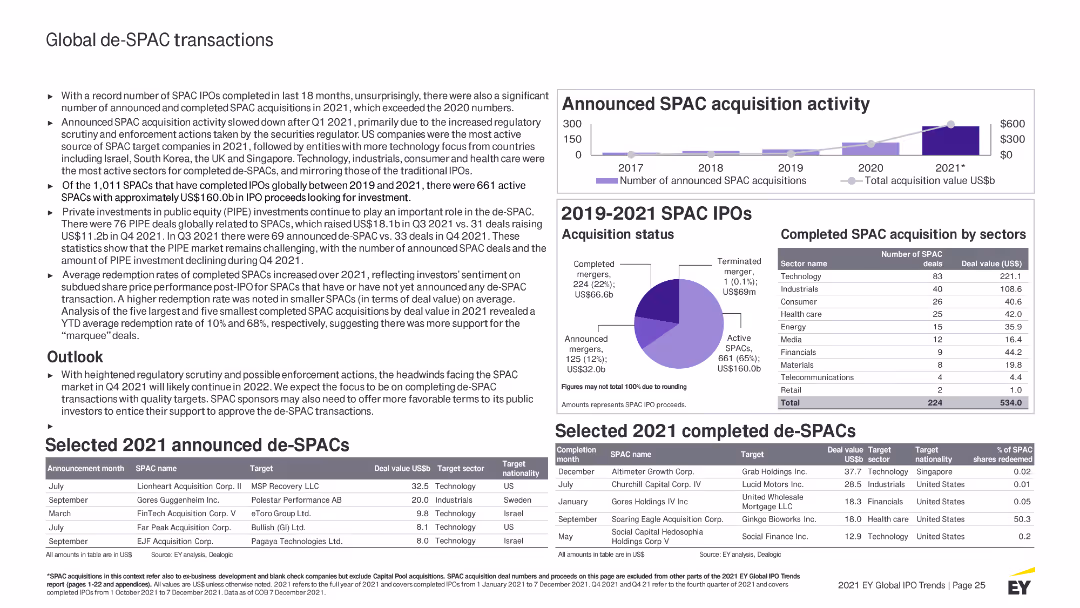
This slide includes column charts, pie charts, tables, and bullet points with highlighted key figures. Uses purple and blue to indicate different data sets.
Market Analysis and Trends
Financial Services
Reviews global de-SPAC transactions completed in 2021, detailing acquisition activities, sector performances, and outlook for future de-SPAC activities.
de-SPAC, transactions, global, 2021 activity, acquisitions, sectors, performance, outlook, PIPE investments, regulatory impact
false
Market Analysis and Trends
Financial Services
Multiple Chart
EY
Add to my slides
Remove from favorites
This slide uses a content layout with a process flow diagram and a detailed table outlining reasons for IV-E ineligibility and related processes. The layout is moderately detailed with a balance of text and visual elements.
Financial Performance
Government & Public Sector
Slide features a flowchart of the fiscal specialist unit process and a table of reasons for IV-E ineligibility with solutions.
Details the fiscal process for identifying funding and overcoming ineligibility issues, providing a flowchart and a table with next steps to address common problems.
false
Financial Performance
Government & Public Sector
Linear Flow
Alvarez & Marsal
Add to my slides
Remove from favorites
The slide is structured with sections on implementation requirements, timeline outline, and risks. Icons and text boxes detail the necessary people, processes, technology, and preparatory work. A timeline outlines project phases over four years, and a risk section discusses potential challenges.
Strategic Planning
Technology & Software
Slide features implementation requirements, timeline outline, and risks. Includes icons and text blocks for various sections.
Details the implementation requirements for IT systems development, including people, process, and technology aspects, along with risks and a timeline.
false
Strategic Planning
Technology & Software
Table
Alvarez & Marsal
Add to my slides
Remove from favorites
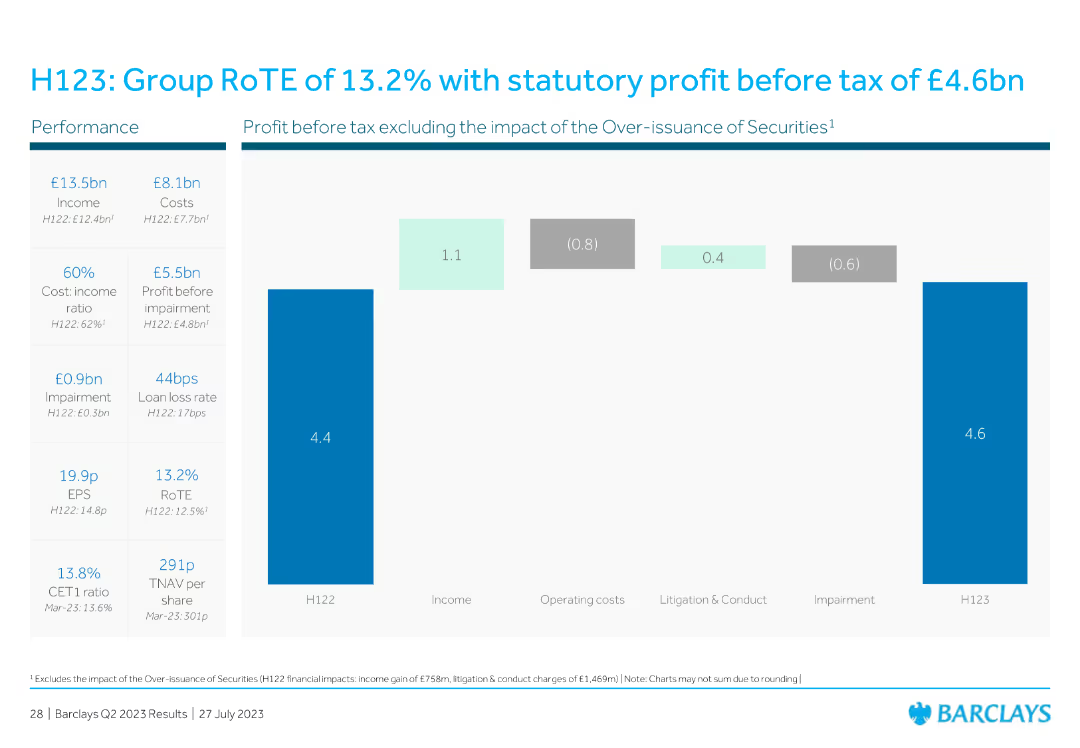
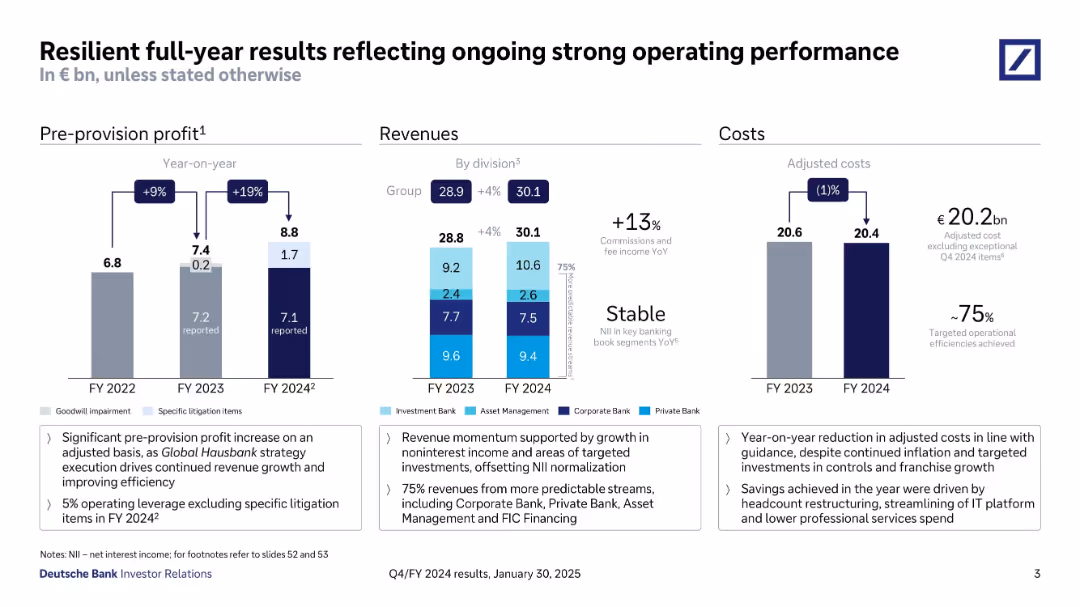
Three-column layout with bar charts showing pre-provision profit, revenues by division, and adjusted costs; annotations and callouts below.
Financial Performance
Financial Services
Deutsche Bank’s FY2024 performance summary: revenues rose 4% YoY to €30.1bn, pre-provision profit reached €8.8bn, and adjusted costs were €20.4bn. Highlights include strong noninterest income and improved efficiency metrics.
Deutsche Bank, FY24, revenue, cost, profit, performance, efficiency, investor relations
false
Financial Performance
Financial Services
Multiple Chart
Deutsche Bank
Add to my slides
Remove from favorites
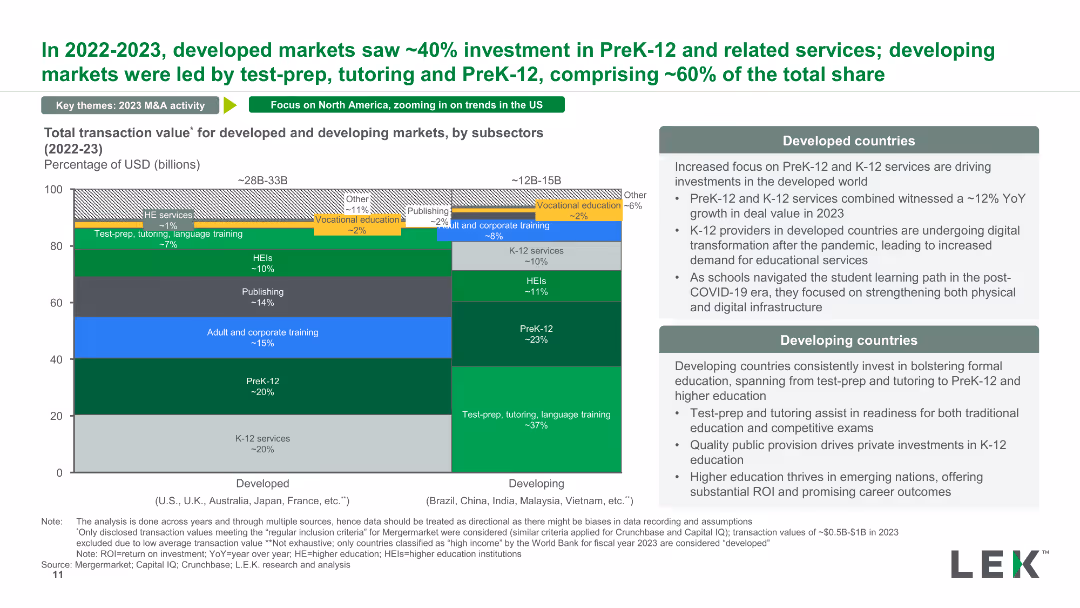
A horizontal bar chart showing the total transaction value for developed and developing markets, broken down by educational subsectors for the years 2022-23. Highlights include specific regions and their contributions.
Market Analysis and Trends
Education & Training
The slide compares transaction values between developed and developing markets, highlighting investment trends in various educational subsectors and differences in regional focus and growth.
developed markets, developing markets, transaction value, education subsectors, regional trends
false
Market Analysis and Trends
Education & Training
Mixed Chart
LEK
Add to my slides
Remove from favorites
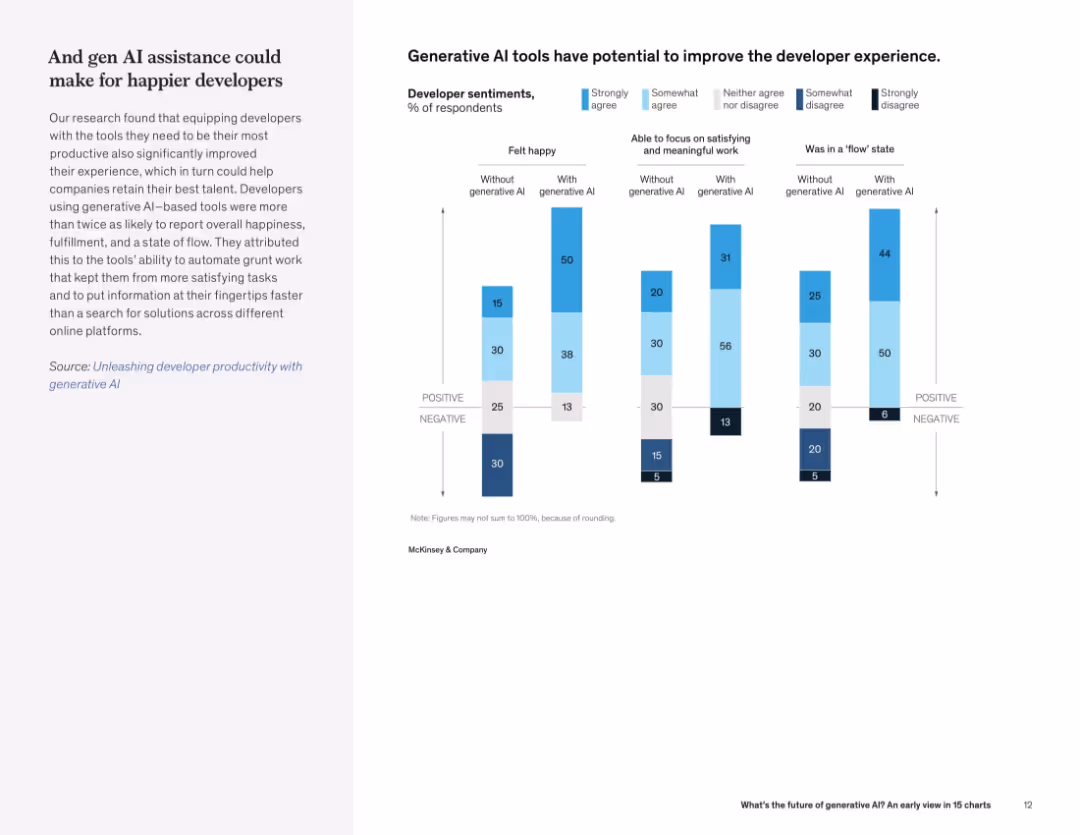
Text on left, and a grouped bar chart on right showing developer sentiment improvements (e.g., happiness, focus, flow state) with and without generative AI.
Human Resources and Talent Management
Technology & Software
Developers using generative AI tools report higher levels of happiness, focus, and "flow" compared to those who don’t. The data highlights gen AI’s potential to enhance the developer experience.
developer experience, generative AI, productivity, flow state, job satisfaction, retention
false
Human Resources and Talent Management
Technology & Software
Mixed Chart
McKinsey
Add to my slides
Remove from favorites
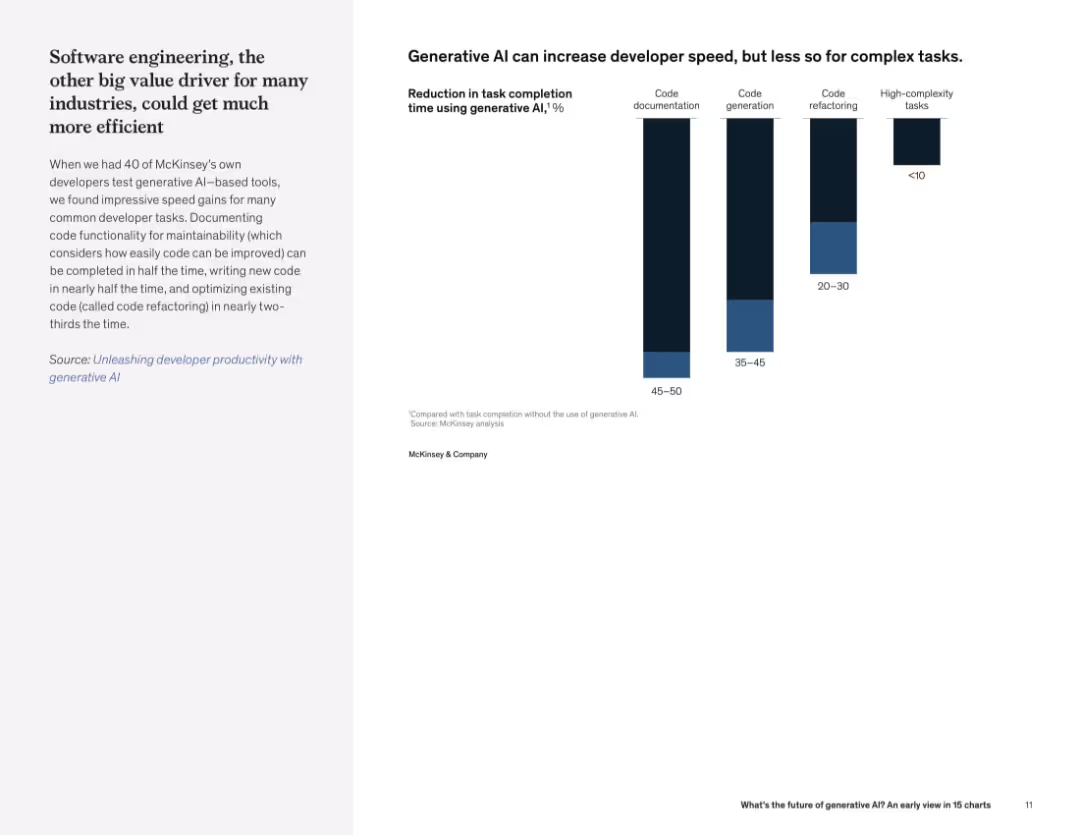
Two-column layout with text on left and vertical bar chart on right showing reduction in task completion time for various software tasks.
Operational Efficiency
Technology & Software
This slide outlines the efficiency improvements generative AI brings to software development, particularly in documentation and code generation. Gains are more limited for complex tasks.
developer productivity, generative AI, code documentation, code refactoring, software efficiency, task reduction
false
Operational Efficiency
Technology & Software
Mixed Chart
McKinsey
Add to my slides
Remove from favorites
The slide features a circular flow chart with the text "Developer Focus" at the center. Surrounding elements include "API", "Trading Execution", and "Loans and Deposits". Icons represent corporations, institutions, and individuals.
Technology and Digital Transformation
Technology & Software
Showcasing Goldman Sachs' focus on serving developers by providing APIs and emphasizing the importance of technology in the financial sector. Services such as transaction banking and the Marcus platform are highlighted, illustrating a client-centric approach.
developers, APIs, banking, technology, Marcus
false
Technology and Digital Transformation
Technology & Software
Diagram
Goldman Sachs
Add to my slides
Remove from favorites
Contains a detailed flow diagram of the Odyssey tool chain, showing stages from planning to release, including tools like Jira, Subversion, Jenkins, and SonarQube.
Technology and Digital Transformation
Technology & Software
This slide presents the Odyssey tool chain, an integrated developer tool chain used across IT areas, highlighting the stages and specific tools involved in the development process.
developer tools, Odyssey, IT areas, technology estate, planning, coding, building, testing, releasing, integration
false
Technology and Digital Transformation
Technology & Software
Linear Flow
Credit Suisse
Add to my slides
Remove from favorites
Featuring a text description of development finance objectives and a column chart on the left that illustrates the geographical distribution of investments, the slide also includes an image of a corporate initiative in Africa on the right.
Financial Performance
Financial Services
This slide details JPMorgan Chase's strategy for development finance, focusing on geographical investment distributions to foster global economic growth. The image supports the narrative by showcasing a corporate initiative, possibly indicating the firm's on-ground impact. It's likely used in discussions about international investment strategies and their outcomes.
development finance, investment, global, economic growth, geographic distribution, JPMorgan Chase
false
Financial Performance
Financial Services
Mixed Chart
JP Morgan
Add to my slides
Remove from favorites
Features a gauge chart and a bar chart detailing the percentage of organizations investing in managerial development programs across various sectors. Charts are clearly labeled and easy to interpret.
Human Resources and Talent Management
Professional Services
Highlights investment in managerial development across different sectors, useful for HR strategic planning and assessing competitive practices.
development, investment, managers, HR
false
Human Resources and Talent Management
Professional Services
Multiple Chart
PwC/Strategy&
Add to my slides
Remove from favorites
The slide is data-focused, containing several statistics and data points highlighted by blue markers. Icons are used to visually represent the different metrics, and there's a balance of text and imagery to keep the viewer engaged.
Strategic Planning
Technology & Software
This slide presents compelling data points to showcase the importance of next-generation software development capabilities. It seems aimed at decision-makers, underscoring the strategic benefits such as faster development and deployment, as well as AI's role in testing and maintenance.
Development, Leadership, Strategy, Software, AI, Capabilities, Testing, Deployment
false
Strategic Planning
Technology & Software
Header Horizontal
McKinsey
Add to my slides
Remove from favorites
This slide features four images, each representing a different development project, with corresponding cost estimates and timelines from 2022 to 2035. The images have an 'artist impression' label, indicating they are conceptual representations. There is also a footnote about the manager's monitoring of development under contract compliance with regulations.
Strategic Planning
Real Estate & Construction
Depicts a timeline of major construction projects within a real estate portfolio, showing investment in development projects currently underway or in planning stages.
Development Pipeline, Real Estate Projects, Construction Investment, Projected Costs, Timeline, Regulatory Compliance
false
Strategic Planning
Real Estate & Construction
Image
Morgan Stanley
Add to my slides
Remove from favorites
Includes column charts showing population growth in more and less developed regions from 2020 to 2050, highlighting the significant growth expected in the least developed areas.
Market Analysis and Trends
Government & Public Sector
Discusses the distribution of future population growth with a specific focus on developing countries. It highlights the challenges and potential impacts on global development, poverty, and resource distribution.
development, population growth, poverty, resources, demographics
false
Market Analysis and Trends
Government & Public Sector
Multiple Chart
Roland Berger
Add to my slides
Remove from favorites
The slide is text-heavy, outlining the methods and progress of the firm's development target, with a column chart on the right depicting distribution of funds in various areas such as "Green", "Community Development", and "Development Finance".
Financial Performance
Financial Services
Discussing the strategic foundation and progress of JPMorgan Chase's sustainable development target, the slide offers insights into the allocation of funds and the company's overarching goals. The column chart visualizes the investment distribution, underlining the firm's commitment to supporting green initiatives and community development. Could be used to provide transparency about strategic decisions to investors or stakeholders.
development target, strategy, progress, investment, sustainability, green finance, community, JPMorgan Chase
false
Financial Performance
Financial Services
Uncategorized
JP Morgan
Add to my slides
Remove from favorites
The slide contains a line chart showing DEX to CEX spot trade volume (%) and a column chart showing DEX volume in billions. It has a clear blue and white color scheme with icons representing key points on the right side, which include self-custody of funds, lower barrier for issuers, regulations, and investor access.
Market Analysis and Trends
Financial Services
The slide discusses the growing market share of DEXs compared to CEXs, highlighting benefits like self-custody of funds, lower entry barriers for issuers, less stringent regulations, and increased investor access, supported by trade volume data.
DEX, CEX, market share, self-custody, regulations, investor access, trade volume
false
Market Analysis and Trends
Financial Services
Mixed Chart
EY
Add to my slides
Remove from favorites
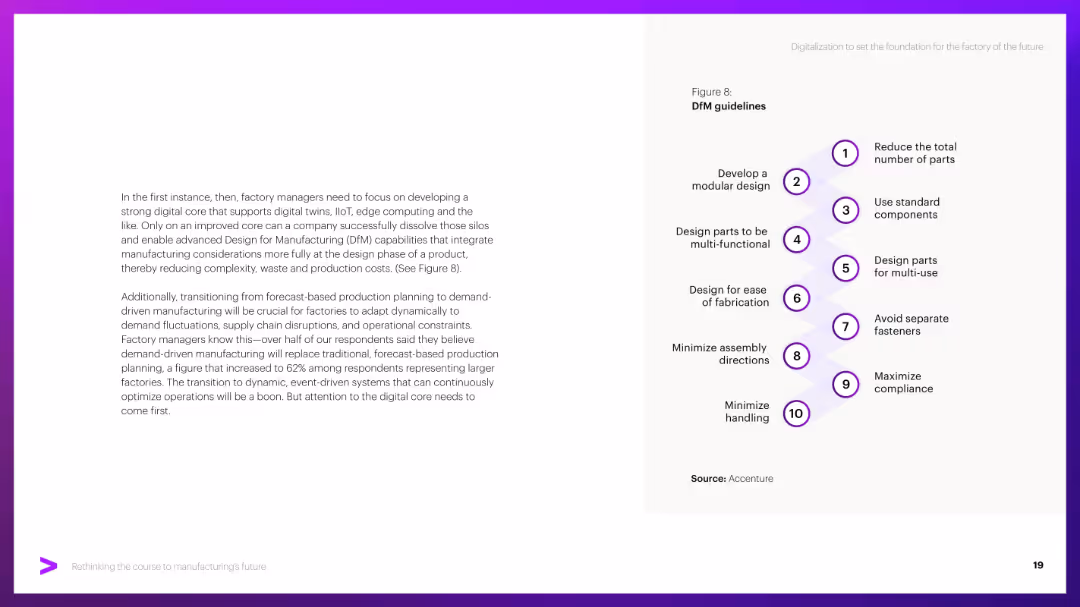
Left side narrative; right side features a vertical flow diagram with 10 numbered guidelines.
Operational Efficiency
Industrial & Manufacturing
Lists ten principles for Design for Manufacturing (DfM), such as minimizing parts and simplifying assembly. Emphasizes building a strong digital core to integrate IIoT, edge computing, and digital twins.
DfM, design guidelines, modular design, digital core, IIoT, simplification
false
Operational Efficiency
Industrial & Manufacturing
Vertical Flow
Accenture
Add to my slides
Remove from favorites
The slide features a three-part list comparing the progress of different DFS business models: pure-play fintechs, established financial services players, and digital banks. Each section has bullet points detailing strengths and weaknesses with corresponding symbols indicating their current state or trend.
Strategic Planning
Financial Services
Analysis of the development of various business models within digital financial services, highlighting specific strategies, operational strengths, and market challenges faced by each type of organization from fintechs to traditional financial institutions and emerging digital banks.
DFS, business models, fintechs, financial institutions, digital banks, progress, analysis
false
Strategic Planning
Financial Services
Header Vertical
Bain
Add to my slides
Remove from favorites
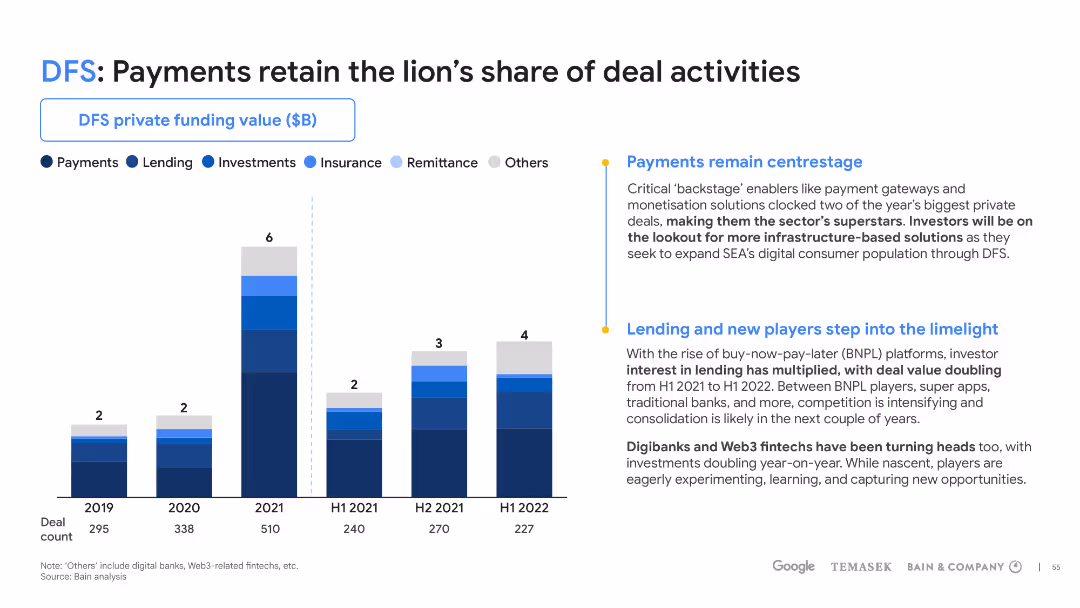
Column chart with detailed analysis in the sidebar, highlighting the distribution of deals across the DFS sector.
Market Analysis and Trends
Financial Services
Examines the distribution of deals within the DFS sector, emphasizing payments' dominance and spotlighting new players in lending.
DFS, deal activities, payments, lending, investment trends, SEA, column chart, market analysis
false
Market Analysis and Trends
Financial Services
Mixed Chart
Bain
Add to my slides
Remove from favorites
This slide includes multiple stacked bar charts differentiated by color coding to represent various sectors within private funding. Text boxes provide context for the data, and there's a visual distinction between historical data and forecasts.
Investment Analysis
Financial Services
Showcases the continued appeal of Digital Financial Services (DFS), noting a significant investment shift toward healthtech. It could serve as an analytical tool for investors and analysts to evaluate sectoral growth within private funding and the rising prominence of healthtech in the investment landscape.
DFS, e-commerce, investment, healthtech, growth
false
Investment Analysis
Financial Services
Single Chart
Bain
Add to my slides
Remove from favorites
A multi-segment column chart with a legend, representing the shift in private funding value across sectors in SEA.
Industry Overview
Financial Services
Depicts DFS overtaking e-commerce as SEA's top investment sector, with transactional data from 2019-2022.
DFS, e-commerce, investment sectors, SEA, private funding, sector shift, transactional data, column chart
false
Industry Overview
Financial Services
Single Chart
Bain
Add to my slides
Remove from favorites
The slide presents a series of column charts with varying shades of blue indicating different sectors such as DFS, E-commerce, and Transport. Each chart corresponds to a year from 2019 to H1 2022 and includes percentages and the private funding value in billions. The layout is well-organized with a clear legend and is titled in large, bold font.
Market Analysis and Trends
Financial Services
This slide analyzes the shift in private funding within various sectors from 2019 to the first half of 2022. DFS has overtaken e-commerce in terms of investment, highlighting significant industry dynamics and investment trends. It can be used for presenting market shifts and predicting future investment focus.
DFS, e-commerce, transport, investment, trends, market shift, funding, analysis, 2019-2022
false
Market Analysis and Trends
Financial Services
Single Chart
Bain
Add to my slides
Remove from favorites
This slide is data-rich, displaying column charts with varying shades of blue to represent different elements within the digital financial services sector. A clear structure and alignment of the elements enable an intuitive understanding of the data trends presented.
Financial Performance
Financial Services
Provides an analysis of how the pandemic accelerated growth in Digital Financial Services, with projections for 2025. Lending and investment growth figures are particularly highlighted, suggesting areas of focus for stakeholders in the financial sector. The slide is likely used to support strategic planning or investment decisions.
DFS, pandemic, growth, lending, investments
false
Financial Performance
Financial Services
Multiple Chart
Bain
Add to my slides
Remove from favorites
This slide shows a series of column charts and line graphs related to digital financial services like payments, remittance, investment, insurance, and lending. The design employs a consistent blue color palette with percentages indicating growth rates (CAGR). The layout is clean, with each chart clearly labeled and easy to interpret.
Investment Analysis
Financial Services
This slide offers insights into the expected growth in various segments of digital financial services. It illustrates where the most significant advancements are likely to occur, making it a useful tool for presentations on financial market trends or investment opportunities.
DFS, payments, remittance, investment, insurance, lending, CAGR, growth, financial services
false
Investment Analysis
Financial Services
Multiple Chart
Bain
Add to my slides
Remove from favorites
This slide features a series of column charts against a blue and white background, illustrating the steep growth projections for digital financial services in the Philippines across four categories: digital payments, digital lending, digital insurance, and digital wealth. The layout is clean, with each category distinctly separated and annotated to show the projected growth rate from 2021 to 2030.
Investment Analysis
Financial Services
The slide outlines the projections for steep growth in digital financial services in the Philippines, indicating significant opportunities for investment and development within digital payments, lending, insurance, and wealth sectors. It is intended for financial service professionals, investors, and market analysts to gauge the potential for expansion in the Philippines' digital finance sector.
DFS, Philippines, Digital Payments, Lending, Insurance, Wealth, Growth, Projections, Investment, Analysis
false
Investment Analysis
Financial Services
Multiple Chart
Bain
Add to my slides
Remove from favorites
This slide features a blue and red color scheme with four column charts, each representing a different aspect of digital financial services (DFS) growth in Thailand, specifically digital payments, digital lending, digital insurance, and digital wealth. Each chart shows the projected growth from 2021 to 2030 with labels and annotations. The layout is well-structured, displaying each sector's growth in a clear and distinguishable manner.
Market Analysis and Trends
Financial Services
The slide analyzes projected growth trends for various digital financial services in Thailand over the next decade. It suggests that regulatory focus on underserved segments will bolster this growth, providing insights into potential market strategies for digital payment platforms, lending services, insurance, and wealth management sectors.
DFS, Thailand, Digital Payments, Digital Lending, Insurance, Wealth, CAGR, Projection, Regulators, Growth
false
Market Analysis and Trends
Financial Services
Multiple Chart
Bain
Add to my slides
Remove from favorites
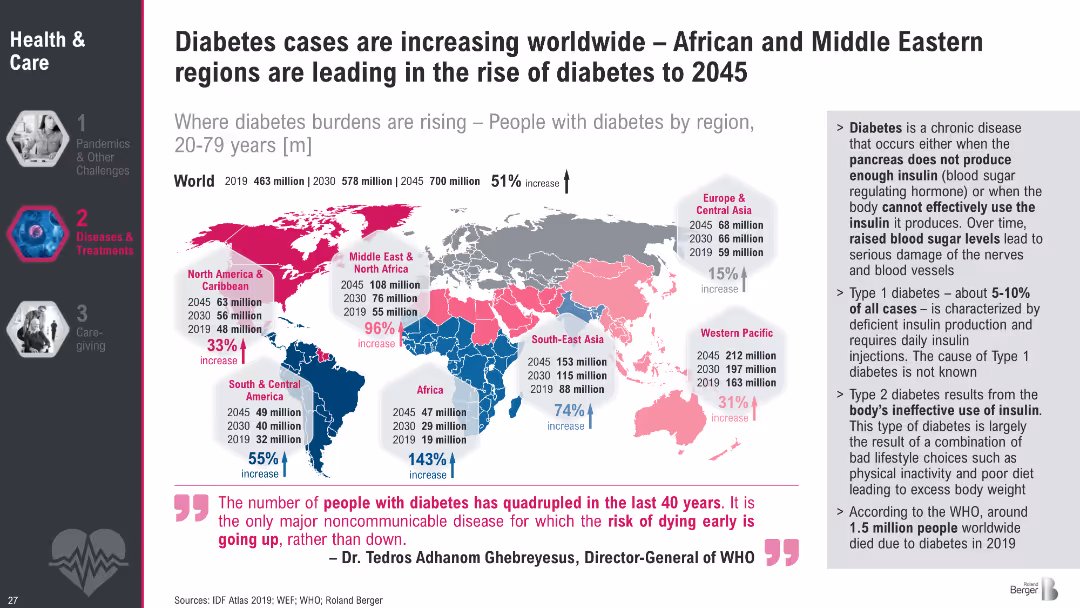
Global map with bar charts showing diabetes case projections by region (2019–2045); includes percentage increase
Market Analysis and Trends
Healthcare & Pharmaceuticals
The slide tracks rising diabetes prevalence worldwide, noting the largest increases in Africa and the Middle East by 2045. It breaks down data by region and emphasizes Type 2 diabetes as the primary driver of this surge.
diabetes, regional trends, WHO, chronic disease, prevalence, projections, noncommunicable, global health, insulin resistance
false
Market Analysis and Trends
Healthcare & Pharmaceuticals
Graphic
Roland Berger
Add to my slides
Remove from favorites
Column chart displaying the percentage of respondents planning to increase investment/capacity in various clinical services over the next three years.
Market Analysis and Trends
Healthcare & Pharmaceuticals
This slide shows a survey of hospitals planning to increase investment in clinical services, highlighting diagnostic imaging and primary care.
Diagnostic imaging, investment, clinical services, healthcare, survey
false
Market Analysis and Trends
Healthcare & Pharmaceuticals
Single Chart
LEK
Add to my slides
Remove from favorites
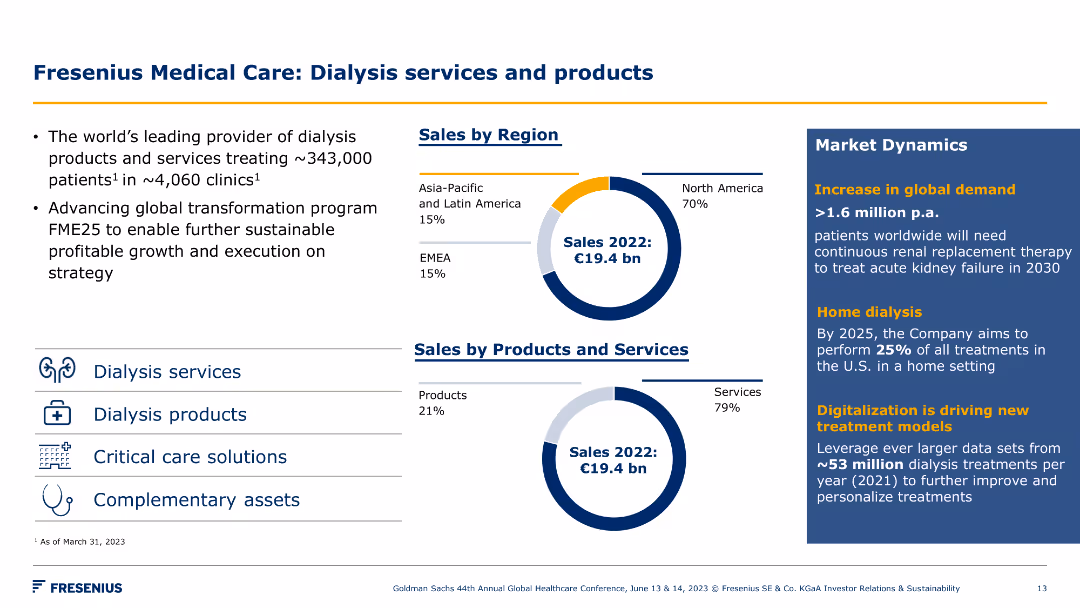
Two pie charts showing sales by region and by product/service, along with market dynamics. Visuals include icons for dialysis-related services.
Product and Service Analysis
Healthcare & Pharmaceuticals
This slide details Fresenius Medical Care's global dialysis services and products, highlighting sales distribution and market trends in the healthcare sector.
dialysis, healthcare, sales, products, services, market dynamics, Fresenius Medical Care, strategy, growth, region
false
Product and Service Analysis
Healthcare & Pharmaceuticals
Multiple Chart
Goldman Sachs
Add to my slides
Remove from favorites
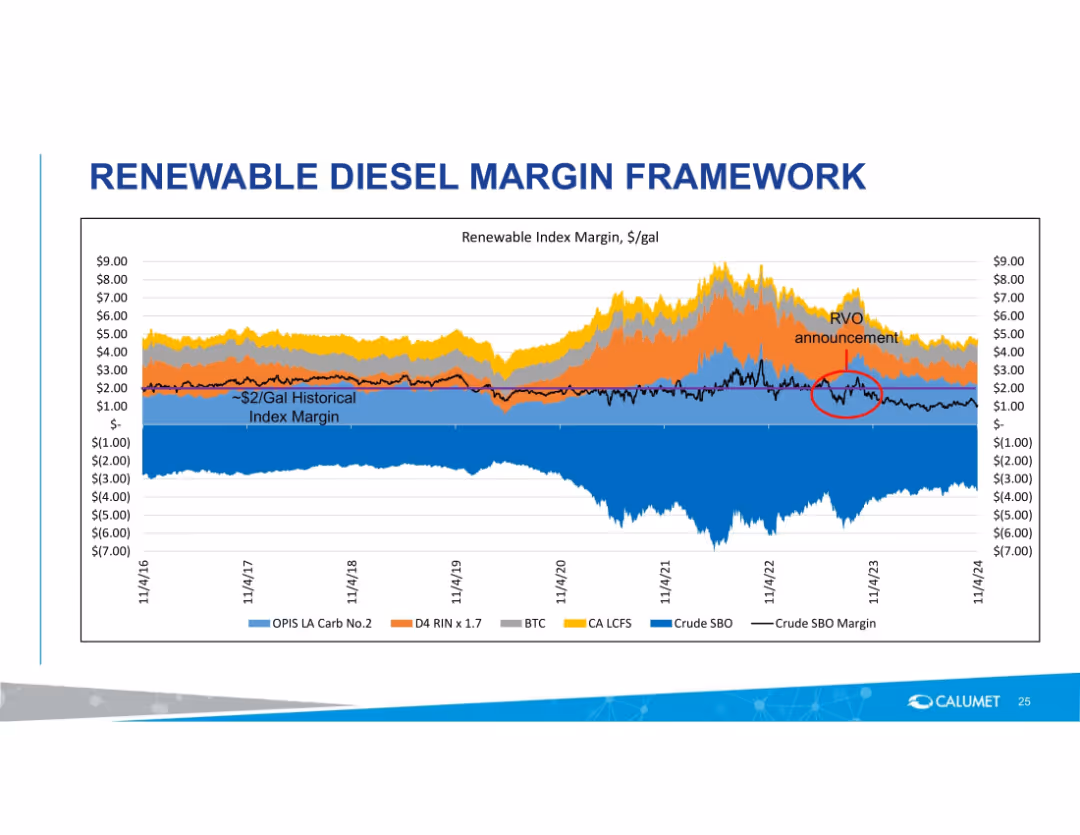
Area chart with multiple margin components and historical pricing trends from 2016–2024.
Pricing Strategies
Energy & Utilities
Illustrates historical renewable diesel index margins with breakdowns by regulatory and market components. Marks impact of RVO announcement and shows fluctuations in margins relative to various inputs like crude SBO and LCFS.
diesel margin, renewable fuel, index margin, OPIS, RVO, historical trend, LCFS, BTC, pricing framework
false
Pricing Strategies
Energy & Utilities
Single Chart
Goldman Sachs
Add to my slides
Remove from favorites
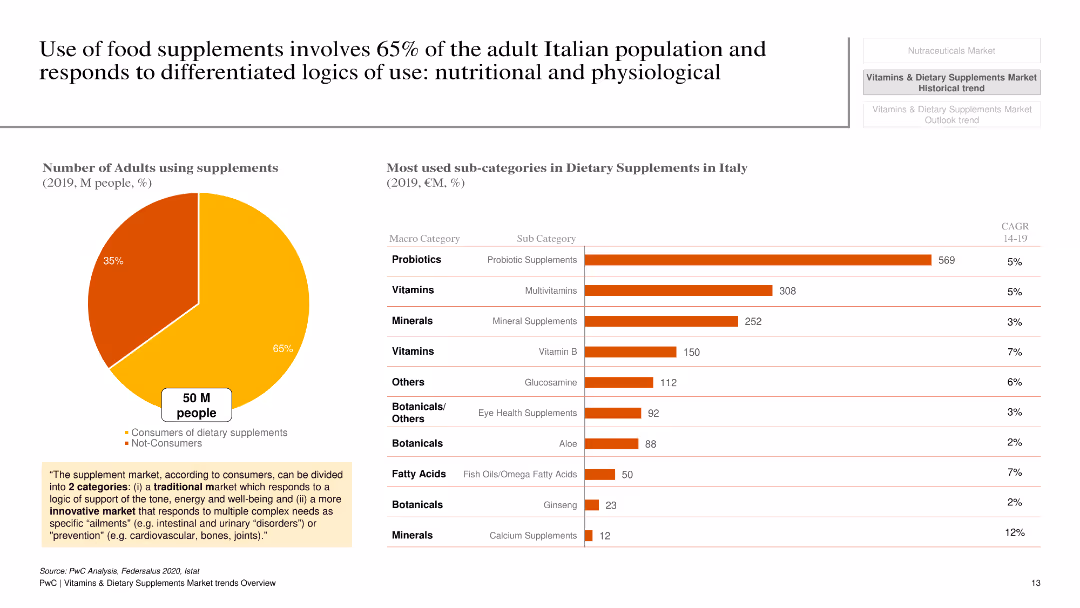
The slide features a pie chart and a column chart. The pie chart shows the percentage of adults using supplements, and the column chart lists the most used sub-categories in dietary supplements in Italy, with bars representing the value in million euros.
Market Analysis and Trends
Healthcare & Pharmaceuticals
The slide highlights that 65% of adults in Italy use dietary supplements and shows the most popular sub-categories of supplements with their respective market values in 2019. It provides insights into consumer behavior and market segmentation within the dietary supplement industry.
dietary supplements, Italy, consumer behavior, market segmentation, probiotics, vitamins, minerals
false
Market Analysis and Trends
Healthcare & Pharmaceuticals
Multiple Chart
PwC/Strategy&
Add to my slides
Remove from favorites
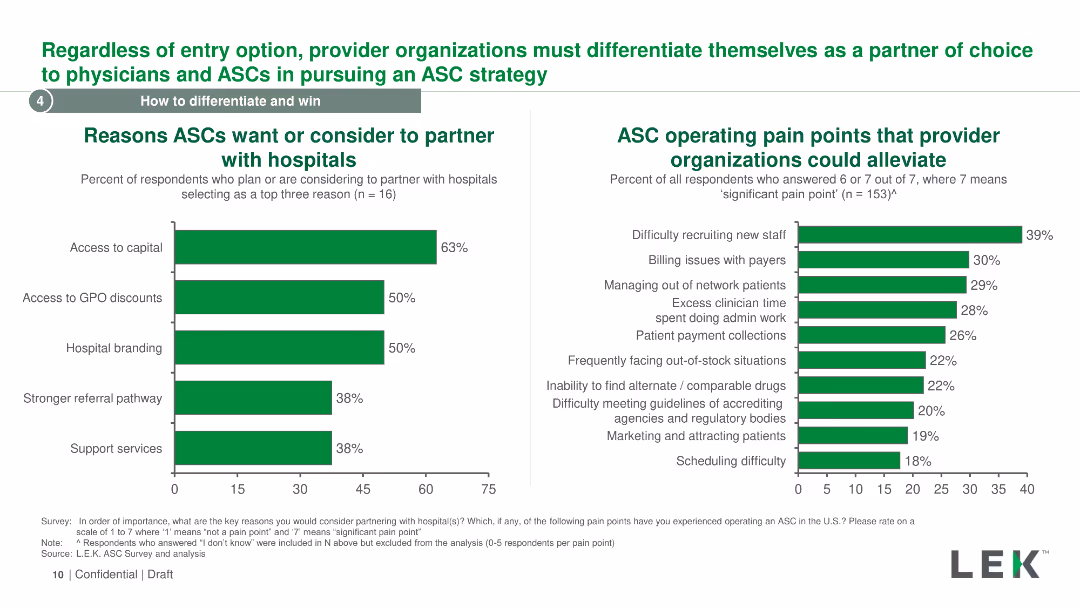
The slide contains two column charts with green bars and lists reasons for ASC partnerships with hospitals and operating pain points for ASC organizations.
Strategic Planning
Healthcare & Pharmaceuticals
It provides reasons why ASCs partner with hospitals and the pain points that provider organizations can alleviate, focusing on strategic differentiation and improvements.
differentiation, ASC, hospitals, pain points, strategy
false
Strategic Planning
Healthcare & Pharmaceuticals
Multiple Chart
LEK
Add to my slides
Remove from favorites
A text-centric slide, it lists competitive advantages and guiding principles with minimal graphical elements.
Strategic Planning
Financial Services
The slide highlights the unique market position and strategic principles of a financial institution, aiming to convey its competitive edge and operational philosophy to stakeholders and potential partners.
differentiation, strategy, principles, competitive advantage, technology
false
Strategic Planning
Financial Services
Table
Goldman Sachs
Add to my slides
Remove from favorites
This slide is structured with a header and five icons representing different strategic areas such as culture and creativity, each followed by a short descriptive text.
Competitive Landscape
Energy & Utilities
It emphasizes unique aspects of the company compared to competitors, focusing on culture, creativity, relationships, reliability, and solutions, intended to persuade potential clients or partners of the company's superior approach.
differentiators, strategy, culture, creativity, relationships
false
Competitive Landscape
Energy & Utilities
Table
Barclays
Add to my slides
Remove from favorites
Circle chart and bar charts showing perceptions of difficulty in succeeding despite hard work in SEA.
Market Analysis and Trends
Financial Services
The slide shows that a majority of respondents find it harder to succeed despite working hard, highlighting regional variations.
difficulty, success, hard work, SEA, perceptions
false
Market Analysis and Trends
Financial Services
Multiple Chart
IPSOS
Add to my slides
Remove from favorites
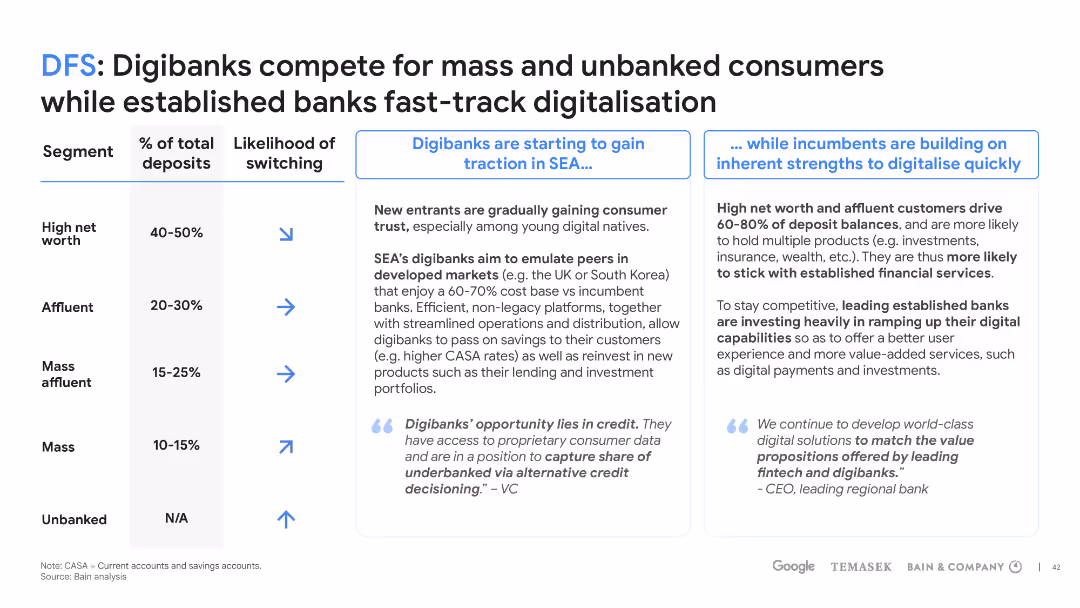
The slide includes a table with segments of net worth categories, percentages of deposits, likelihood of switching to digibanks, and two comparative analyses focusing on the traction of digibanks in SEA and established banks' digitalisation efforts. Symbols and color codes indicate trends or states for each segment.
Market Analysis and Trends
Financial Services
The slide compares the market strategies of digibanks and established banks, detailing the deposit percentages across different wealth segments, their propensity to switch to digital banking, and the differing approaches to capturing the mass and unbanked consumer markets.
digibanks, established banks, digitalisation, market strategy, consumer banking, SEA
false
Market Analysis and Trends
Financial Services
Table
Bain
Add to my slides
Remove from favorites
A data chart highlights the percentage of the population aged 15-35 and the unbanked/underbanked percentage in various countries, along with a qualitative 'right to win' indicator for digibanks. The slide has a clear, organized layout with country flags, statistics, and a legend for understanding the 'right to win' levels.
Market Analysis and Trends
Financial Services
Assessing the potential uptake of digibanks in different countries, this slide correlates the percentage of the young population with the unbanked demographics and evaluates the digital maturity of incumbent banks, giving insights into market opportunities for digibanks.
digibanks, unbanked, population, market analysis, digital maturity, incumbent banks
false
Market Analysis and Trends
Financial Services
Table
Bain
Add to my slides
Remove from favorites
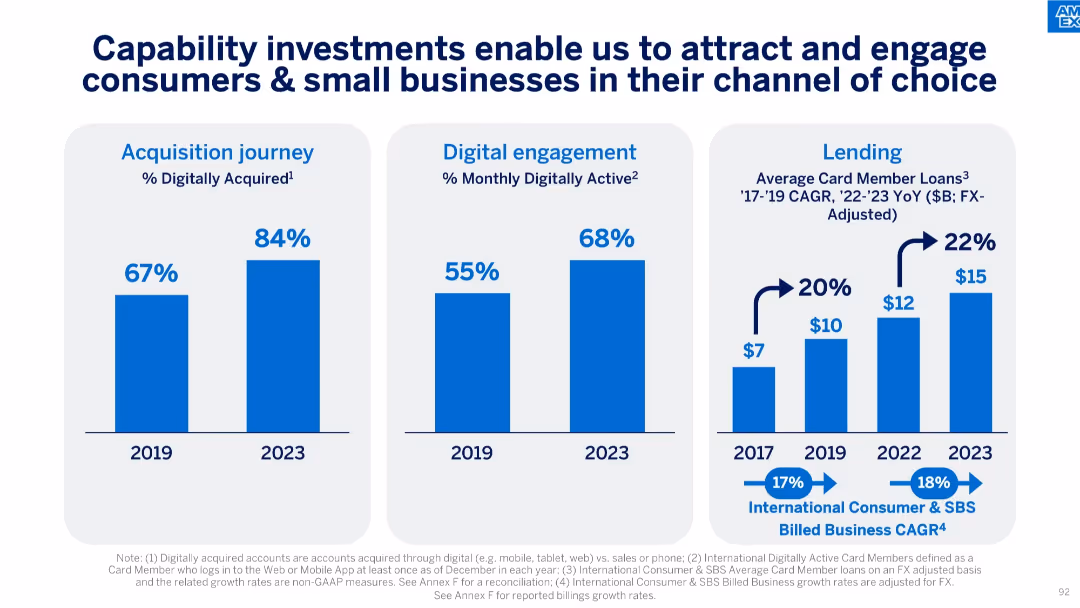
Three vertical bar charts showing trends in digital acquisition, engagement, and lending from 2017–2023.
Technology and Digital Transformation
Financial Services
The slide emphasizes improvements in digital engagement and lending as a result of capability investments. It shows increasing digital acquisition and activity, as well as growth in average card member loans over time.
Digital Acquisition, Lending, Engagement, Growth, Technology Investment, Card Members, CAGR, Loans
false
Technology and Digital Transformation
Financial Services
Multiple Chart
McKinsey
Add to my slides
Remove from favorites
The slide features two column charts comparing data from 2018 and 2019 with annotations, along with a text block providing additional context.
Operational Efficiency
Financial Services
Showcases the impact of digital account openings on customer acquisition and the resultant decrease in marketing costs, underlining the effectiveness of digital strategies in finance.
Digital Acquisition, Marketing Costs, Finance, Account Openings, Cost Efficiency
false
Operational Efficiency
Financial Services
Multiple Chart
JP Morgan
Add to my slides
Remove from favorites
The slide displays a bar chart illustrating the awareness of different online activities by sector, accompanied by a headline and explanatory note.
Market Analysis and Trends
Technology & Software
It discusses the low awareness of various digital activities among consumers in tier 2 and 3 cities, suggesting potential untapped markets.
digital activities, awareness, e-commerce, ride-hailing, food delivery, Indonesia, tier cities
false
Market Analysis and Trends
Technology & Software
Single Chart
Kearney
Add to my slides
Remove from favorites
Previous
Next
You don't have any favorites yet.
Please wait loading your favorites slides...
Create a FREE account to continue browsing
Receive Instant Access to 1,000+ slides from companies like McKinsey, Google, and Goldman Sachs
First Name
Last Name
Email
Password
I agree to all
Terms & Privacy Policy
Thank you! Your submission has been received!
Oops! Something went wrong while submitting the form.
Have an account?
Sign in
Upgrade to PRO to Save slides
Advanced Search and Filters
Access to 15,000+ slides
Access to Category Pages
Save/Bookmark Slides
PowerPoint Template Library
Pick a Plan
MONTHLY
$12/month
Billed every month, Cancel anytime.
YEARLY
$9/year
Billed $108 annually, Cancel anytime.
Checkout for $12/month
Checkout for $108/yr
Secured by Stripe | AES-256 bit encryption