My Account
My Slides
Search by Category
Companies
Slide Type
Use Case
Industry
Pricing
Templates
View All Templates
Download Template Slides
✦ AI
AI Prompt Library
AI Search
Feedback
Login
Logout
Get Started
Browse all Slides
Browse all Slides
Create a FREE Account
Instant access to 1,000+ real slides from top companies like McKinsey, BCG, Goldman Sachs, Google and many more!
First Name
Last Name
Email
Password
I agree to all
Terms & Privacy Policy
Thank you! Your submission has been received!
Oops! Something went wrong while submitting the form.
Have an account?
Sign in
Saved Slides
Total No. of slides saved
0
↻ Refresh
✖ Clear all
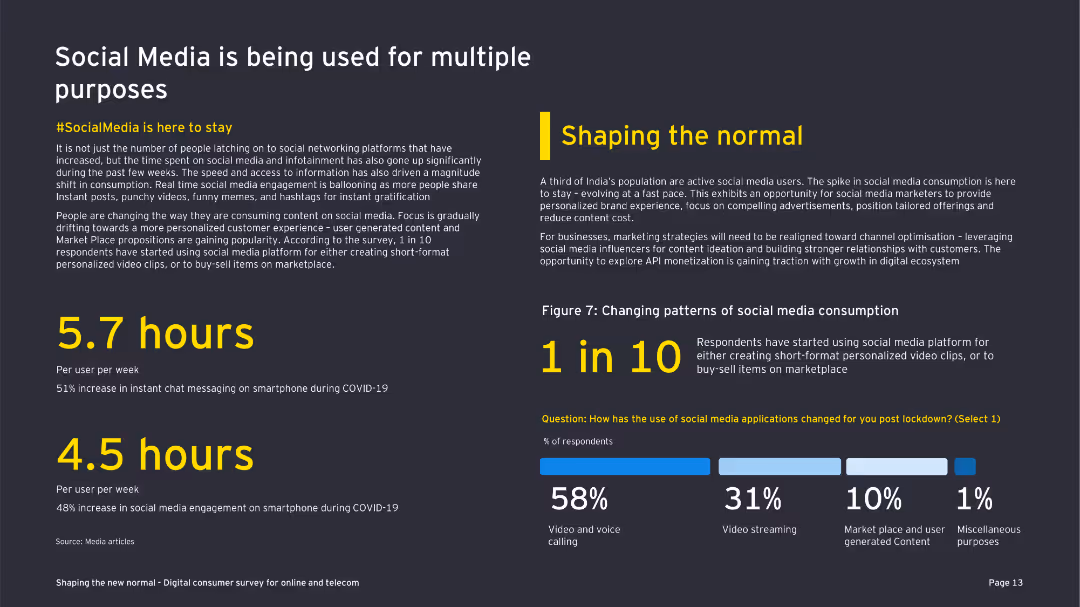
The slide features bar charts showing risks and opportunities percentages. Text boxes detail risks and opportunities, and a summary box highlights key takeaways.
Market Analysis and Trends
Technology & Software
It shows the survey results on digitalization risks and opportunities, emphasizing the need for corporate functions to reposition to exploit new technologies as enablers.
Digitalization, risks, opportunities, survey, functions, technology, enablers
false
Market Analysis and Trends
Technology & Software
Multiple Chart
Roland Berger
Add to my slides
Remove from favorites
The slide pairs icons representing different industries with a concise list of digitalization use cases. The layout is clean, utilizing space efficiently to connect each industry with its digital imperative.
Technology and Digital Transformation
Technology & Software
Offers a comprehensive view on how various industries require digital skills for transformation. This slide could be used to argue for a broad-based approach to digital talent acquisition across sectors to facilitate digitalization.
digitalization, skills, industries, talent acquisition, transformation
false
Technology and Digital Transformation
Technology & Software
Header Vertical
Kearney
Add to my slides
Remove from favorites
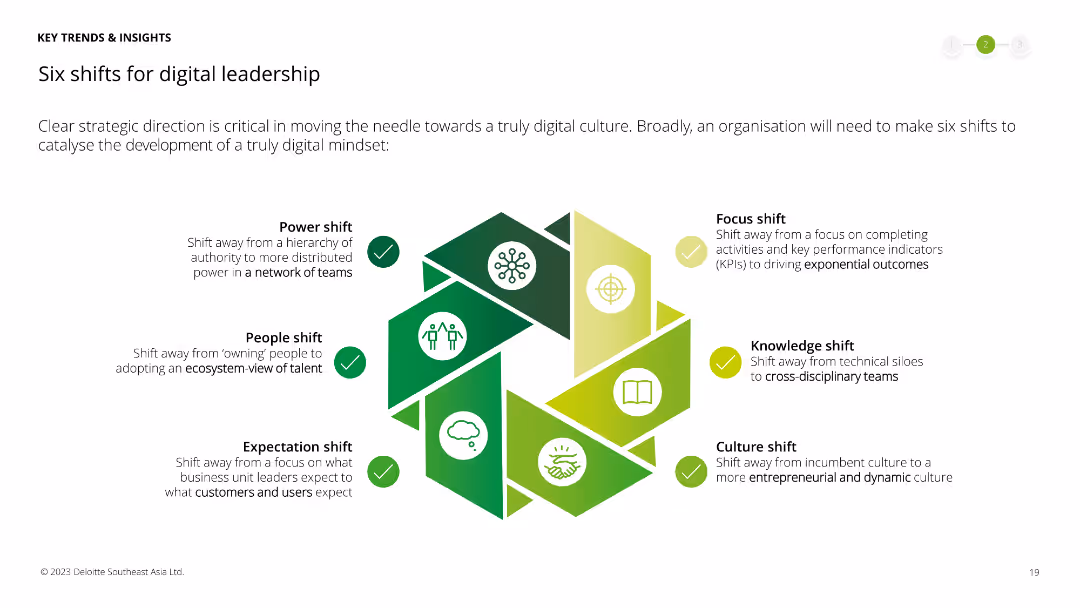
Visual representation of six shifts for digital leadership, each represented by an icon and a brief description within a hexagon, forming a hexagonal layout.
Operational Efficiency
Technology & Software
Outlines six critical shifts necessary for digital leadership, including power, people, expectation, focus, knowledge, and culture shifts to achieve a truly digital mindset.
digital leadership, power shift, people shift, expectation shift, focus shift, knowledge shift, culture shift, digital
false
Operational Efficiency
Technology & Software
Framework
Deloitte
Add to my slides
Remove from favorites
Contains a large column chart split between SMB and consumer lending, followed by in-depth textual analysis on the state of digital lending and associated risks.
Risk Assessment and Management
Financial Services
Explores the challenges faced by the digital lending sector, such as credit quality concerns and non-performing loans, while offering a glimpse into the government's mitigating actions and future growth.
Digital Lending, Credit Quality, NPLs, Future Growth
false
Risk Assessment and Management
Financial Services
Mixed Chart
Bain
Add to my slides
Remove from favorites
This slide presents a column chart showing digital lending outstanding balance with a projection for 2025, growth percentage callouts, and a side text block providing additional context. Color-coded for SME and consumer segments.
Market Analysis and Trends
Financial Services
The slide details the significant growth in digital lending, supported by low non-performing loans and economic recovery, with a forecast for 2025. It mentions the uptick in lending due to government interventions and emerging trends like buy-now-pay-later services, especially in developing economies.
digital lending, economic rebound, NPLs, buy-now-pay-later, growth
false
Market Analysis and Trends
Financial Services
Mixed Chart
Bain
Add to my slides
Remove from favorites
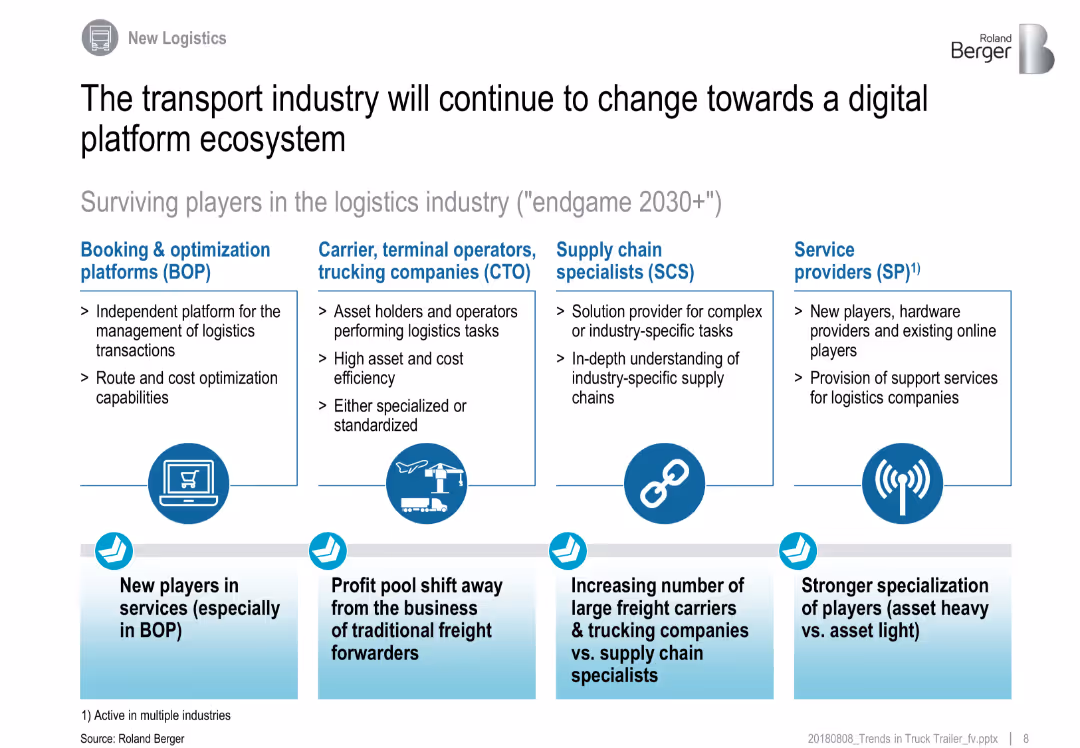
Four-category layout with icon headers, bullet points, and takeaway boxes at the bottom
Technology and Digital Transformation
Transportation & Logistics
The slide outlines how digital transformation is reshaping the logistics sector. It categorizes key players—platforms, operators, specialists, and providers—and highlights structural shifts in profit pools, specialization, and roles in the emerging logistics ecosystem.
digital logistics, platform economy, transport industry, freight forwarding, supply chain specialists, BOP, SP
false
Technology and Digital Transformation
Transportation & Logistics
Pillar
Roland Berger
Add to my slides
Remove from favorites
Depicts twelve key activities grouped under four categories with simple icons and text, laid out evenly across the slide. The design is clean and facilitates easy comprehension of the information.
Operational Efficiency
Media & Entertainment
Discusses twelve key digital marketing activities considered across various maturity stages, categorized under data-driven targeting, automated activation, measurement & attribution, and organizational collaboration. This is valuable for enhancing operational efficiency in digital marketing initiatives.
digital marketing, activities, data-driven targeting, automated activation, measurement, organizational collaboration, operational efficiency, maturity
false
Operational Efficiency
Media & Entertainment
Pillar
BCG
Add to my slides
Remove from favorites
Slide features column chart comparing digital advertising spending growth to offline channels, highlighting trends in key performance indicators across industries.
Market Analysis and Trends
Media & Entertainment
Analyzes trends in digital advertising investments, emphasizing the effectiveness of different advertising mediums and strategies in engaging customers across various sectors.
digital marketing, advertising, engagement, investment trends, media
false
Market Analysis and Trends
Media & Entertainment
Mixed Chart
Bain
Add to my slides
Remove from favorites
Contains three pie charts comparing digital marketing maturity between APAC, India, and Europe. The layout is simple and clean, focusing on the comparative data.
Market Analysis and Trends
Media & Entertainment
Compares digital marketing maturity scores across APAC, India, and Europe, indicating similar levels of maturity and highlighting best practices among leading brands. This slide is useful for understanding regional differences and identifying areas of improvement in digital marketing strategies.
digital marketing, APAC, India, Europe, maturity comparison, best practices, regional analysis, improvement areas, pie chart, marketing strategies
false
Market Analysis and Trends
Media & Entertainment
Multiple Chart
BCG
Add to my slides
Remove from favorites
Features a column chart displaying percentages of brands in different maturity stages, using varying shades of green. The design is straightforward, highlighting key data points effectively.
Market Analysis and Trends
Media & Entertainment
Analyzes the digital marketing maturity of Asia Pacific brands, showing only 2% are at the 'Multi-moment' maturity stage. It provides insights into the distribution of digital marketing maturity among these brands, useful for benchmarking and strategic planning in marketing initiatives.
digital marketing, Asia Pacific, brand maturity, multi-moment, marketing analysis, strategic planning, benchmarking, maturity distribution, column chart
false
Market Analysis and Trends
Media & Entertainment
Single Chart
BCG
Add to my slides
Remove from favorites
Utilizes a stacked bar chart to compare digital marketing maturity across multiple industries. The design is clear, using shades of green to differentiate maturity levels.
Market Analysis and Trends
Media & Entertainment
Evaluates digital marketing maturity across various industries in Asia Pacific, showcasing a significant range of maturity levels. This slide helps in identifying industry-specific trends and planning targeted marketing strategies.
digital marketing, Asia Pacific, industry comparison, maturity levels, marketing trends, targeted strategies, stacked bar chart, industry-specific analysis
false
Market Analysis and Trends
Media & Entertainment
Single Chart
BCG
Add to my slides
Remove from favorites
Consists of a gradient green scale illustrating levels of digital marketing maturity from Nascent to Multi-moment. The layout is straightforward with circular nodes and connecting lines.
Market Analysis and Trends
Media & Entertainment
This slide assesses various brands on their digital marketing maturity, categorizing them from nascent to multi-moment stages. It highlights the progression and maturity in digital marketing practices among brands, useful for understanding market positions and planning marketing strategies.
digital marketing, brand assessment, maturity scale, nascent, multi-moment, marketing strategies, market analysis, progression, technology, engagement
false
Market Analysis and Trends
Media & Entertainment
Linear Flow
BCG
Add to my slides
Remove from favorites
Column chart showing average views on official accounts, image of smartphone usage
Market Analysis and Trends
Media & Entertainment
Discusses the effectiveness of brand accounts on WeChat for engaging consumers
Digital Marketing, Brand Engagement, WeChat, Views
false
Market Analysis and Trends
Media & Entertainment
Single Chart
BCG
Add to my slides
Remove from favorites
Comprises a single line chart depicting the trend of digital marketing budget increases over the past decade with annotations for key data points.
Market Analysis and Trends
Professional Services
This slide outlines the historical growth and future expectations for digital marketing budgets, highlighting a steady rise in investment.
digital marketing, budgets, growth, trends
false
Market Analysis and Trends
Professional Services
Single Chart
Deloitte
Add to my slides
Remove from favorites
Presents column charts comparing business goals in digital transformation efforts among companies.
Technology and Digital Transformation
Technology & Software
Analyzes the shift in focus from cost-cutting to customer-centric goals in digital transformation strategies.
digital marketing, business transformation, customer-centric, innovation, digital
false
Technology and Digital Transformation
Technology & Software
Mixed Chart
BCG
Add to my slides
Remove from favorites
Slide has a line chart showing the trend of digital marketing contribution to company performance over time, paired with insights in text.
Performance Metrics and KPIs
Professional Services
Evaluates the changing impact of digital marketing on company performance over the past 18 months, suggesting strategic shifts.
digital marketing, company performance, trend analysis, strategic impact, line graph
false
Performance Metrics and KPIs
Professional Services
Mixed Chart
Deloitte
Add to my slides
Remove from favorites
Displays a column chart illustrating the perceived contribution of digital marketing to company performance over two years. The slide is organized with data clearly labeled and an insights box explaining the significance of the trends. The design is minimalist, focusing on clarity and ease of interpretation.
Market Analysis and Trends
Professional Services
This slide examines the impact of digital marketing on business performance, showing a decline in perceived contribution. It is useful for strategic reviews and planning, providing a basis for reallocating marketing budgets or redesigning digital strategies based on industry-specific performance metrics.
digital marketing, company performance, trend analysis, strategic planning, budget allocation
false
Market Analysis and Trends
Professional Services
Mixed Chart
Deloitte
Add to my slides
Remove from favorites
Pie charts displaying time allocation across various media, accompanied by an image of a person using a smartphone at a concert.
Market Analysis and Trends
Media & Entertainment
The slide discusses the distribution of consumer attention across various digital and traditional media, highlighting the dominance of mobile usage.
digital marketing, consumer attention, media time allocation, mobile usage
false
Market Analysis and Trends
Media & Entertainment
Multiple Chart
PwC/Strategy&
Add to my slides
Remove from favorites
This slide features a column chart showing the percentage of brands in different stages of digital marketing maturity, with statistical data on each stage.
Market Analysis and Trends
Professional Services
Discusses the low percentage of brands in Australia and New Zealand that fully utilize data-driven marketing techniques.
digital marketing, data-driven, Australia, New Zealand, brands, statistics, analysis
false
Market Analysis and Trends
Professional Services
Single Chart
BCG
Add to my slides
Remove from favorites
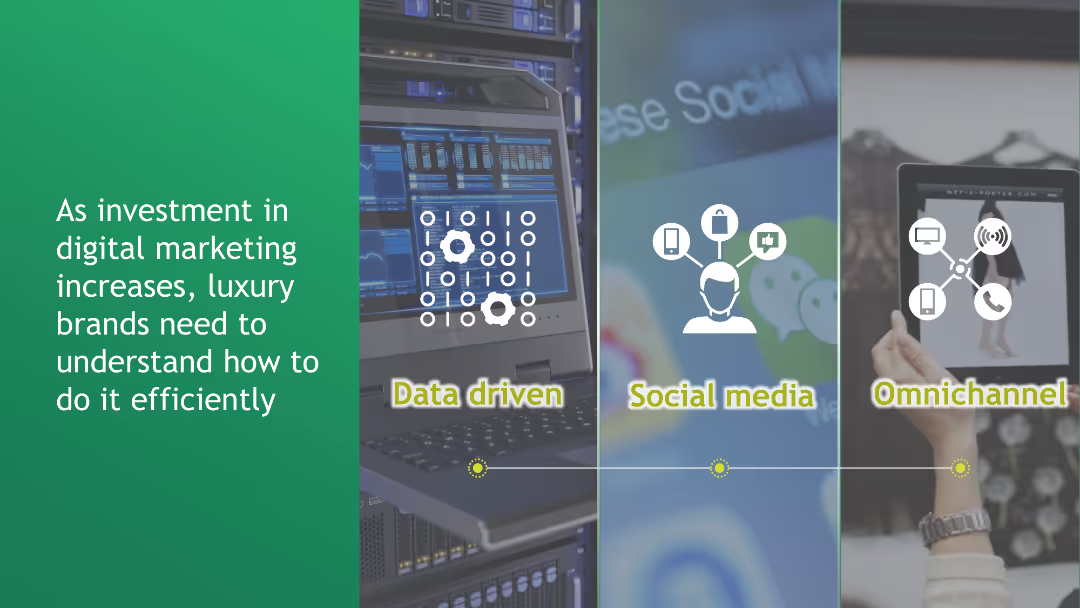
The slide includes images and text discussing data-driven, social media, and omnichannel strategies for efficient digital marketing in the luxury sector.
Technology and Digital Transformation
Media & Entertainment
The slide emphasizes the need for luxury brands to adopt efficient digital marketing strategies, focusing on data-driven approaches, social media engagement, and omnichannel marketing to maximize their impact and reach.
digital marketing, data-driven, social media, omnichannel, luxury brands
false
Technology and Digital Transformation
Media & Entertainment
Pillar
BCG
Add to my slides
Remove from favorites
Contains a vertical column chart depicting the advantages of digital commerce channels, and doughnut charts indicating challenges. Accompanied by text boxes with detailed explanations.
Strategic Planning
Consumer Goods
The slide presents survey results showing the perceived advantages and challenges of digital commerce channels, focusing on marketing capabilities, cost reduction, and customer service.
digital marketing, e-commerce, survey, operational cost, customer service, marketing capabilities, channel conflict
false
Strategic Planning
Consumer Goods
Multiple Chart
Deloitte
Add to my slides
Remove from favorites
Diagrams and icons showcasing various components of a digital financial platform labeled 'Marcus by Goldman Sachs'.
Technology and Digital Transformation
Technology & Software
Describes the various digital marketing strategies and product offerings within the 'Marcus by Goldman Sachs' platform.
digital marketing, financial platform, Marcus, Goldman Sachs, banking-as-a-service, direct marketing, tools app
false
Technology and Digital Transformation
Technology & Software
Boxed
Goldman Sachs
Add to my slides
Remove from favorites
The slide presents a detailed framework using icons and numbering for different aspects of digital marketing across data targeting, activation, and collaboration.
Technology and Digital Transformation
Professional Services
Describes a framework for achieving digital marketing maturity through various technical and organizational strategies.
digital marketing, framework, activation, data, collaboration, measurement, technology
false
Technology and Digital Transformation
Professional Services
Pillar
BCG
Add to my slides
Remove from favorites
Features icon-based design with minimalist text describing industries and regions. The slide is clean, using a map to indicate regions involved, and various industry icons representing sectors.
Market Analysis and Trends
Media & Entertainment
This slide presents a global study on digital marketing maturity, highlighting participation from 180 leading brands across various industries in the Asia Pacific region. It focuses on sectors such as automotive, retail, financial services, and more, illustrating a broad engagement in advancing digital marketing practices.
digital marketing, global study, Asia Pacific, industry participation, automotive, retail, financial services, technology, marketing trends, brand engagement
false
Market Analysis and Trends
Media & Entertainment
Graphic
BCG
Add to my slides
Remove from favorites
Vertical bar chart displaying investment priorities in digital marketing areas such as AI, customer relationship management, and analytics.
Customer and Market Segmentation
Retail & E-commerce
Highlights the strong focus on digital marketing investments in areas critical to enhancing consumer engagement and data analysis capabilities.
digital marketing, investment, AI, customer relationship, analytics, strategic planning, consumer engagement, data analysis
false
Customer and Market Segmentation
Retail & E-commerce
Single Chart
Deloitte
Add to my slides
Remove from favorites
The slide features a green color scheme with a large column chart comparing the average maturity scores of brands with different levels of senior sponsorship. On the right, a quote in white text from a chairman of a Thailand-based company emphasizes the importance of digital marketing development.
Market Analysis and Trends
Media & Entertainment
This slide compares the maturity scores of brands with limited senior sponsorship and those with CEO sponsorship, illustrating a significant difference. A quotation from a travel company's chairman highlights leadership's role in digital marketing initiatives.
digital marketing, leadership, maturity, brands, sponsorship, Thailand, CEO
false
Market Analysis and Trends
Media & Entertainment
Mixed Chart
BCG
Add to my slides
Remove from favorites
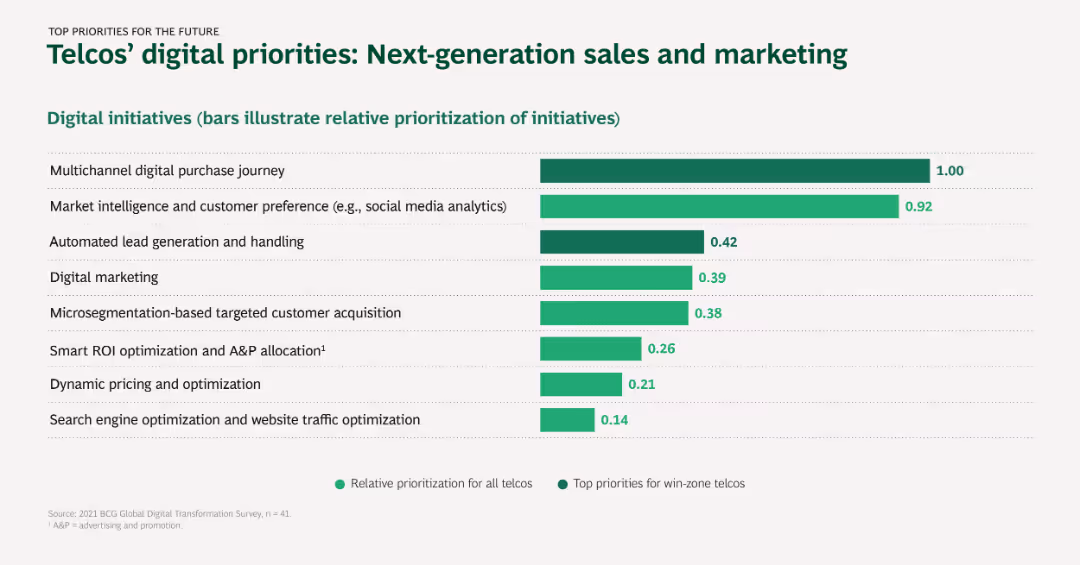
Horizontal bar chart showing the prioritization of digital initiatives in sales and marketing for telcos, with relative prioritization and top priorities highlighted.
Sales and Business Development
Telecommunications
The slide outlines telcos' focus on next-gen sales and marketing initiatives, including digital purchase journeys, market intelligence, and lead generation.
Digital marketing, Lead generation, Market intelligence, Sales optimization, Customer acquisition
false
Sales and Business Development
Telecommunications
Single Chart
BCG
Add to my slides
Remove from favorites
The slide presents a curved line chart showing the stages of digital marketing maturity from nascent to multi-moment, labeled with descriptions of each stage.
Market Analysis and Trends
Professional Services
Describes the assessment of brands' digital marketing maturity through stages, highlighting the progression from nascent to multi-moment maturity.
digital marketing, maturity, brands, assessment, progression, nascent, connected, multi-moment
false
Market Analysis and Trends
Professional Services
Linear Flow
BCG
Add to my slides
Remove from favorites
Displays a circular diagram divided into six sections, each representing a key factor in digital marketing maturity. The diagram is supported by icons and brief text labels.
Organizational Structure and Change
Media & Entertainment
Outlines six critical technical and organizational factors that support digital marketing maturity, such as strategic partnerships, connected data, and agile teaming. This slide is essential for organizations aiming to enhance their digital marketing capabilities through strategic and structural adjustments.
digital marketing, organizational factors, technical enablers, strategic partnerships, connected data, agile teaming, diagram, capability enhancement
false
Organizational Structure and Change
Media & Entertainment
Diagram
BCG
Add to my slides
Remove from favorites
Slide features a pie chart showing the distribution of digital marketing budget among paid, owned, and earned media, set against a digital-themed background.
Market Analysis and Trends
Professional Services
Discusses allocation of marketing budget across different types of digital media, highlighting the dominance of paid media in digital marketing strategies.
digital marketing, paid media, budget allocation, marketing strategies, pie chart
false
Market Analysis and Trends
Professional Services
Single Chart
Deloitte
Add to my slides
Remove from favorites
Contains five images with captions related to digital advertising, retail partnerships, consumer value, and economic factors like currency headwinds. Each image is connected by arrows, indicating a flow of strategy.
Operational Efficiency
Consumer Goods
Discusses Clorox's strategic adaptations in the consumer packaged goods sector, focusing on digital marketing, retail growth, consumer value, and operational efficiency against economic challenges. Useful for strategy review meetings.
digital marketing, retail growth, consumer value, strategy, Clorox
false
Operational Efficiency
Consumer Goods
Pillar
Barclays
Add to my slides
Remove from favorites
This slide contains column charts showing potential future revenue increases from digital marketing, contrasting current and potential impacts. The layout is clear with direct comparisons highlighted.
Financial Performance
Media & Entertainment
Discusses the revenue impact of digital marketing on brands at different maturity levels, suggesting that more mature brands anticipate higher revenue increases. This slide is crucial for financial planning and strategic decision-making in digital marketing investments.
digital marketing, revenue impact, maturity levels, financial planning, strategic decision-making, column chart, revenue increases, investment planning
false
Financial Performance
Media & Entertainment
Multiple Chart
BCG
Add to my slides
Remove from favorites
This slide is divided into three sections colored in shades of green, detailing organizational, technical, and connection-building steps towards digital marketing maturity. Icons and checklists summarize the actions required at each stage of maturity, from nascent to multi-moment levels.
Market Analysis and Trends
Media & Entertainment
Provides a structured roadmap for brands to enhance their digital marketing effectiveness, highlighting steps like ensuring C-suite sponsorship, leveraging partnerships, and embedding a 'data-first' mindset. The slide is a practical guide for developing a comprehensive digital marketing strategy.
digital marketing, roadmap, strategy, C-suite, partnerships, data, maturity
false
Market Analysis and Trends
Media & Entertainment
Linear Flow
BCG
Add to my slides
Remove from favorites
Contains multiple data visualizations: icons comparing digital and traditional interactions across platforms for the year 2021, and a column chart showing the percentage growth in digital core product sales from 2016 to 2021. The slide is designed with clarity, using color coding to differentiate between digital and traditional sales methods effectively.
Financial Performance
Financial Services
Analyzes the bank's marketing and sales strategies by illustrating the growth in digital interactions and product sales. It provides insights into the effectiveness of digital versus traditional sales approaches, emphasizing the bank’s strong distribution network and its impact on enhancing customer engagement and sales performance.
digital marketing, sales growth, customer engagement, cross-selling
false
Financial Performance
Financial Services
Mixed Chart
Deutsche Bank
Add to my slides
Remove from favorites
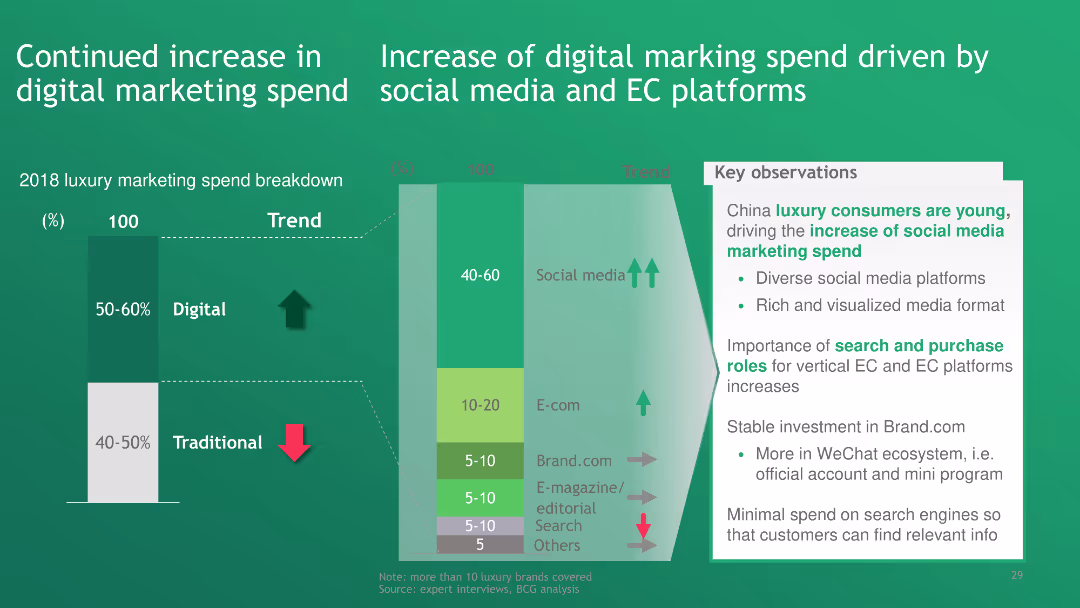
The slide includes a bar chart showing the breakdown of luxury marketing spend, highlighting the increase in digital marketing driven by social media and E-commerce platforms.
Technology and Digital Transformation
Media & Entertainment
The slide highlights a continued increase in digital marketing spend, particularly driven by social media and E-commerce platforms, showcasing the shift from traditional to digital marketing methods in the luxury industry.
digital marketing, social media, E-commerce platforms, luxury marketing, marketing spend
false
Technology and Digital Transformation
Media & Entertainment
Multiple Chart
BCG
Add to my slides
Remove from favorites
Bar charts showing the percentage of marketing budgets allocated to digital across various company sizes and sectors.
Technology and Digital Transformation
Professional Services
Focuses on digital marketing spending across different sectors, particularly highlighting high investments in tech and media. Useful for digital strategy planning and understanding sector-specific digital adoption.
digital, marketing, spending, technology, media, strategy, investment, sectors
false
Technology and Digital Transformation
Professional Services
Multiple Chart
Deloitte
Add to my slides
Remove from favorites
Slide displays multiple bar charts detailing digital marketing spending as a percentage of total budgets, divided by company attributes and sectors with highlighted key data points.
Market Analysis and Trends
Professional Services
The slide analyzes digital marketing expenditures across various business demographics and sectors, identifying trends and differences in spending patterns.
digital marketing, spending, trends, analysis
false
Market Analysis and Trends
Professional Services
Multiple Chart
Deloitte
Add to my slides
Remove from favorites
This slide illustrates a circular diagram with six sectors, each representing a factor critical to successful digital marketing strategies.
Strategic Planning
Professional Services
Describes six key factors, both technical and organizational, essential for success in digital marketing.
digital marketing, success factors, technical, organizational, strategy, key factors
false
Strategic Planning
Professional Services
Diagram
BCG
Add to my slides
Remove from favorites
This slide uses multiple icons to visually represent different facets of digital marketing proficiency, such as 'Test & Iterate' and 'Integrate Digital Data'. Each category has a corresponding percentage, clearly displayed in a simplistic, easy-to-understand format. The design is clean, using a consistent color theme and structured layout.
Technology and Digital Transformation
Technology & Software
Showcasing areas where digital marketing efforts are excelling, this slide provides a snapshot of current practices and their effectiveness. It's particularly useful for presentations on digital transformation strategies, helping identify strengths and potential areas for further development in marketing technology.
digital marketing, tech proficiency, strategy, performance metrics, transformation
false
Technology and Digital Transformation
Technology & Software
Header Vertical
Deloitte
Add to my slides
Remove from favorites
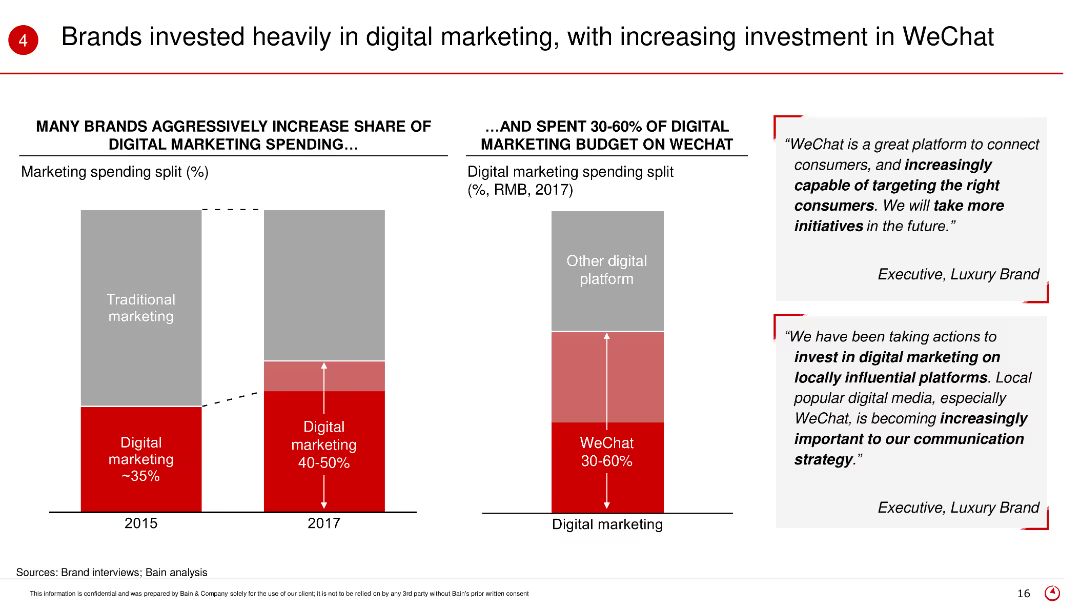
The slide shows bar charts comparing traditional and digital marketing spending in 2015 and 2017, and the proportion of digital marketing budget spent on WeChat. Text boxes include quotes from executives.
Market Analysis and Trends
Retail & E-commerce
This slide highlights the shift in marketing strategies among brands towards digital marketing, particularly emphasizing the significant investment in WeChat as a key platform for engagement.
Digital marketing, WeChat, marketing investment, traditional marketing, brand strategies
false
Market Analysis and Trends
Retail & E-commerce
Multiple Chart
Bain
Add to my slides
Remove from favorites
Displays a scatter plot graph analyzing digital maturity against age demographics, highlighting countries with strong digital performance.
Market Analysis and Trends
Technology & Software
Examines the digital maturity levels of various countries and discusses the potential influence of digitally adept consumers in global markets.
digital maturity, consumer influence, demographics, market trends, technology adoption, global markets, segmentation, strategic analysis
false
Market Analysis and Trends
Technology & Software
Single Chart
Accenture
Add to my slides
Remove from favorites
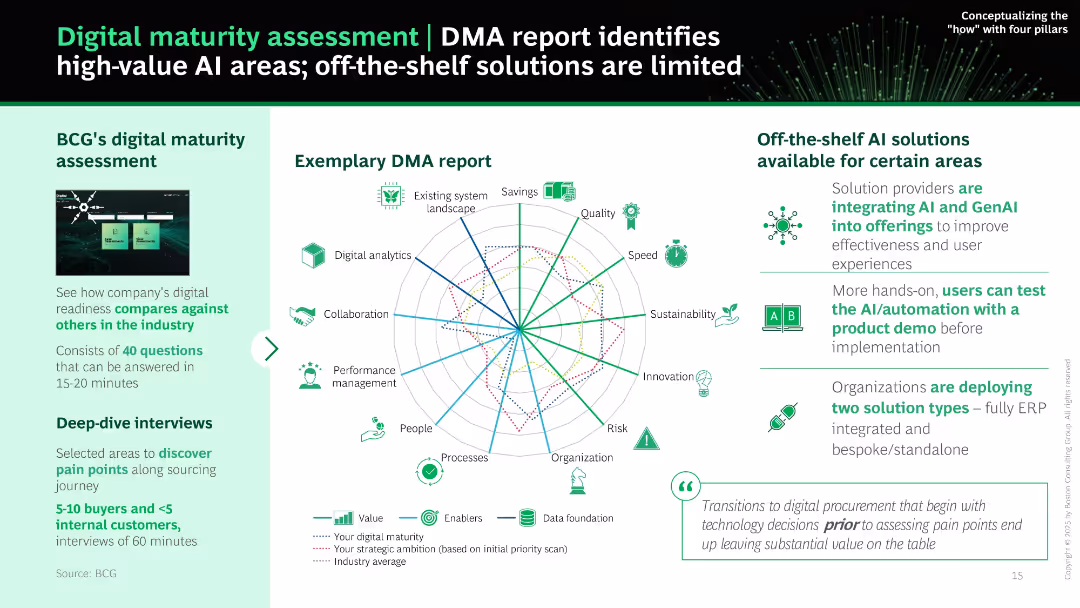
Radar chart at center with multiple axes and legend. Sidebars explain DMA assessment approach and available solutions. Balanced layout using green color palette.
Performance Metrics and KPIs
Technology & Software
Explains how BCG’s DMA report benchmarks an organization's digital maturity across procurement functions. Visual radar chart compares maturity with ambition and industry averages. Also discusses off-the-shelf AI tools and implementation insights.
digital maturity, DMA, assessment, AI, analytics, sourcing, procurement, benchmarking
false
Performance Metrics and KPIs
Technology & Software
Mixed Chart
BCG
Add to my slides
Remove from favorites
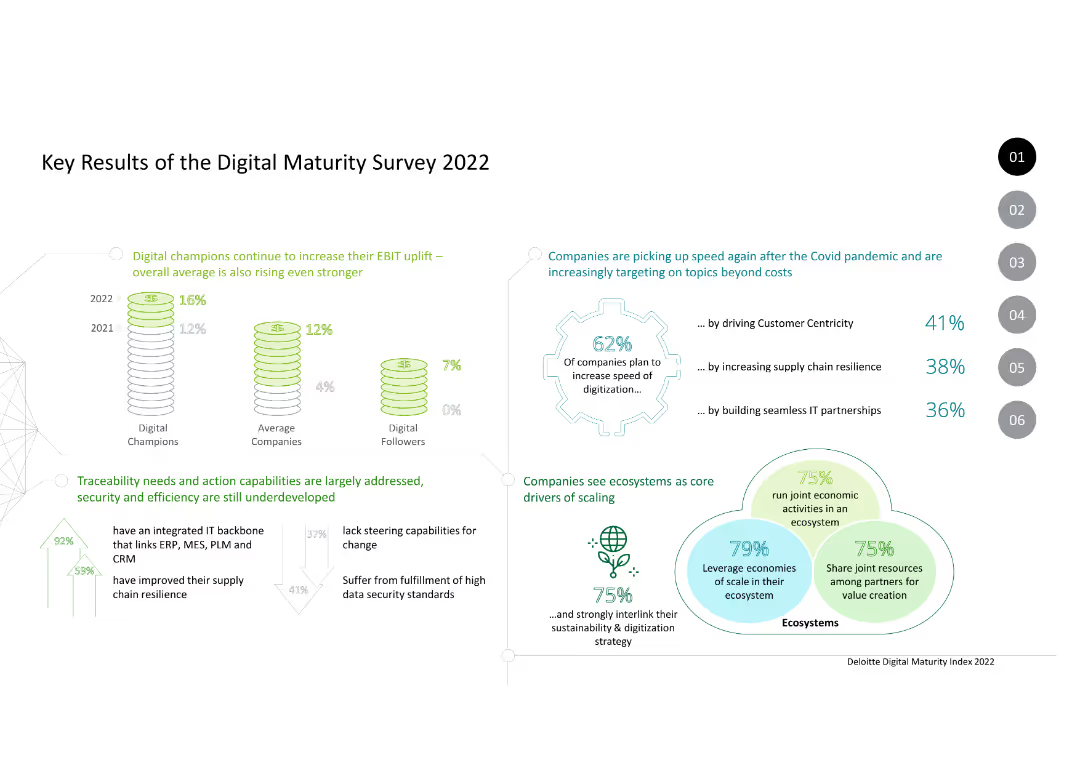
Column charts and text. Data on EBIT uplift, digitization speed, ecosystem drivers, and digital maturity levels of companies.
Market Analysis and Trends
Technology & Software
Summarizes the key results of the Digital Maturity Survey 2022, highlighting trends in digital transformation and ecosystem scaling among companies.
digital maturity, EBIT uplift, digitization, ecosystem, trends, survey, 2022, companies, technology
false
Market Analysis and Trends
Technology & Software
Mixed Chart
Deloitte
Add to my slides
Remove from favorites
Includes a pie chart, a column chart and a couple of bar charts detailing digital maturity levels in financial sectors across regions.
Technology and Digital Transformation
Financial Services
Analysis of digital maturity in the financial sector, comparing firms across regions and types.
digital maturity, financial, sector, leadership, transformation
false
Technology and Digital Transformation
Financial Services
Multiple Chart
Deloitte
Add to my slides
Remove from favorites
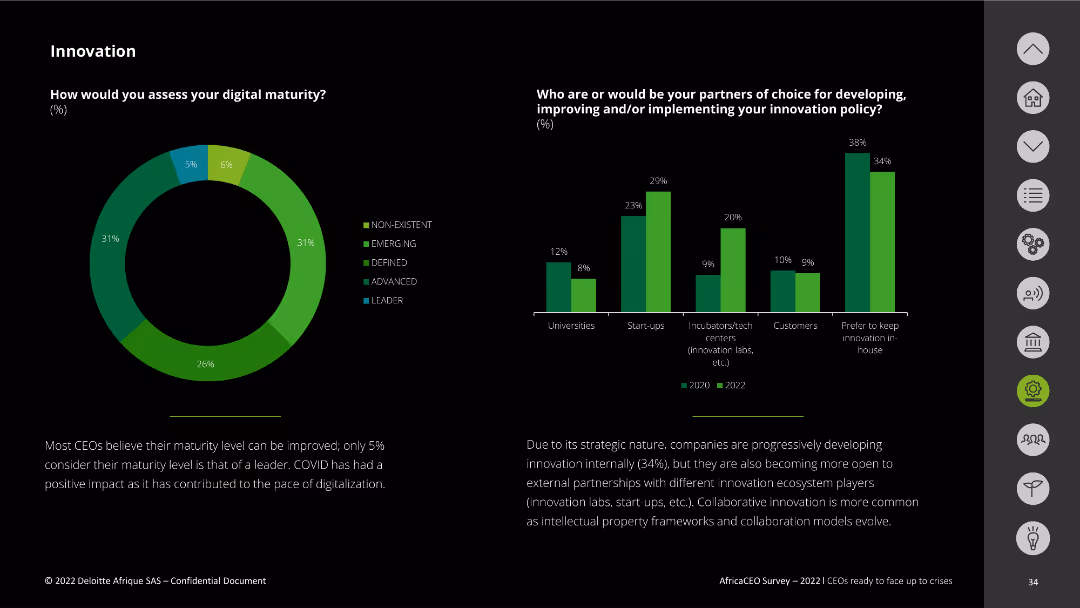
The slide features a pie chart showing the assessment of digital maturity levels among companies. It also includes a bar chart comparing the preferred partners for innovation in 2020 and 2022. Text explanations are provided at the bottom.
Technology and Digital Transformation
Technology & Software
This slide evaluates digital maturity levels within companies and compares preferred innovation partners over two years. It highlights the strategic importance of digital maturity and the shift towards partnerships with start-ups and incubators.
digital maturity, innovation partners, assessment, comparison, technology strategy
false
Technology and Digital Transformation
Technology & Software
Multiple Chart
Deloitte
Add to my slides
Remove from favorites
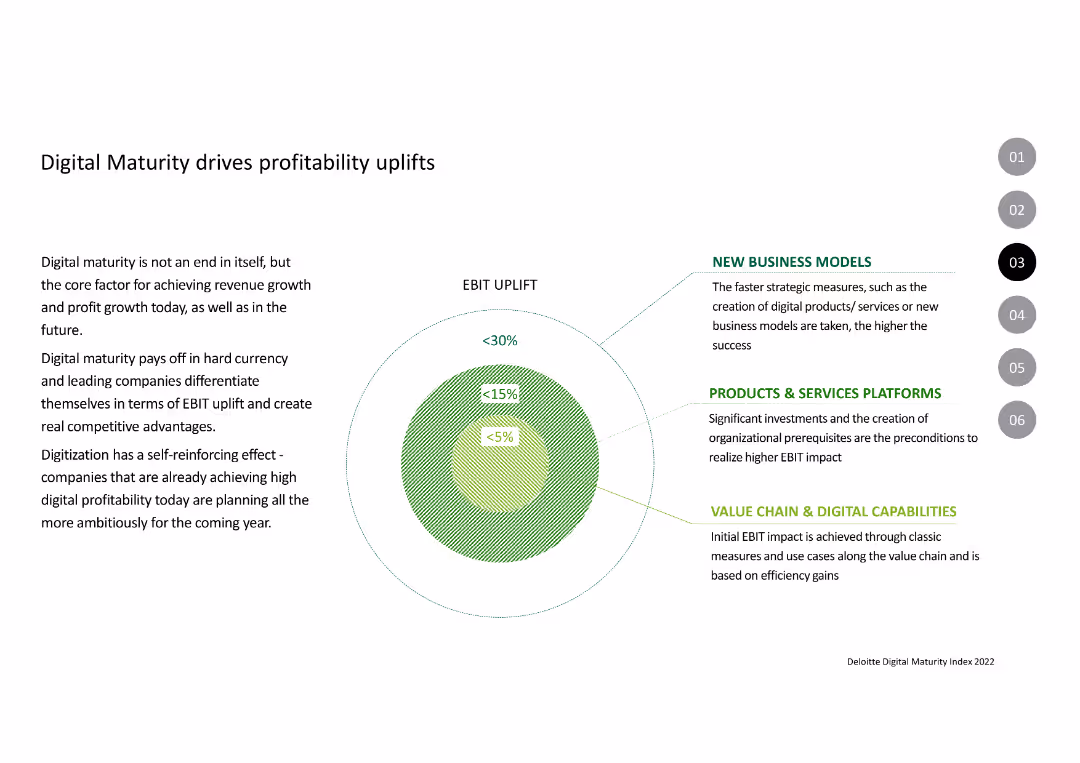
The slide features a concentric circle chart indicating levels of EBIT uplift (<5%, <15%, <30%) and accompanying text outlining factors like new business models, platforms, and digital capabilities.
Financial Performance
Financial Services
The slide explains the impact of digital maturity on profitability, highlighting strategic measures like new business models, platforms, and value chain capabilities.
Digital Maturity, Profitability, EBIT, Business Models, Platforms, Digital Capabilities
false
Financial Performance
Financial Services
Mixed Chart
Deloitte
Add to my slides
Remove from favorites
The slide displays a structured path divided into organizational and technical steps from nascent to multi-moment stages of digital marketing maturity.
Strategic Planning
Professional Services
Outlines steps for brands to achieve digital maturity, emphasizing the importance of integrating data and fostering an agile, data-driven culture.
digital maturity, strategy, marketing, path, integration, data, agility, brand development
false
Strategic Planning
Professional Services
Linear Flow
BCG
Add to my slides
Remove from favorites
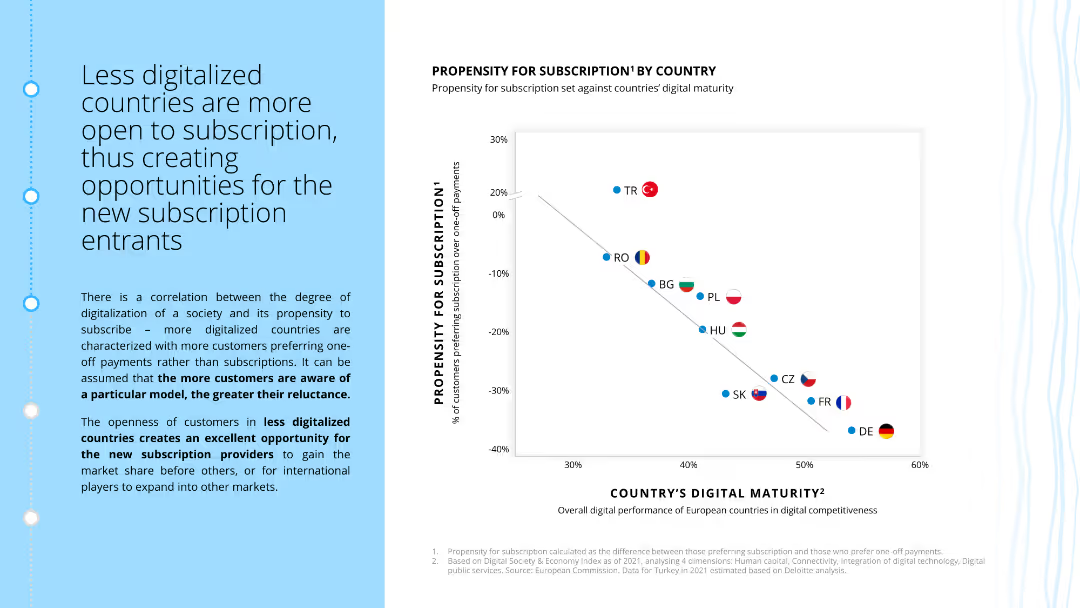
The slide contains a scatter plot showing the correlation between countries' digital maturity and their propensity for subscriptions. It includes a descriptive text box on the implications of this correlation.
Market Analysis and Trends
Consumer Goods
The slide analyzes how digital maturity impacts the likelihood of customers subscribing, with more digitalized countries showing less propensity for subscriptions. It highlights opportunities for new market entrants.
digital maturity, subscriptions, market analysis, country comparison, customer behavior, ecommerce, retail
false
Market Analysis and Trends
Consumer Goods
Mixed Chart
Deloitte
Add to my slides
Remove from favorites
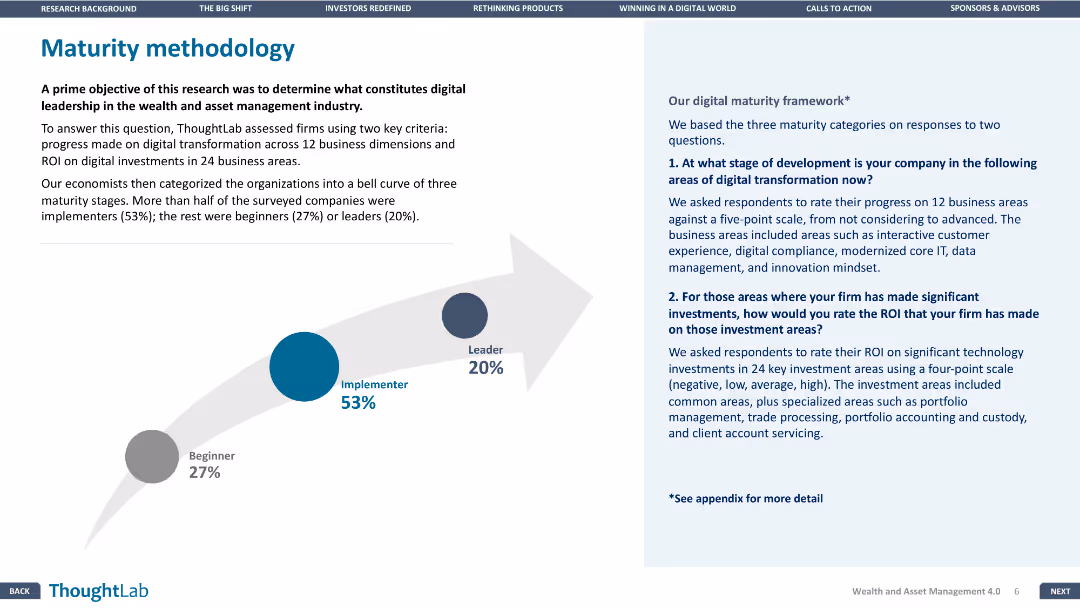
The slide features a bell curve with three maturity stages: Beginner (27%), Implementer (53%), Leader (20%). Text on the right explains the methodology.
Strategic Planning
Financial Services
The slide outlines a framework to categorize firms into three stages of digital maturity based on digital transformation progress and ROI.
Digital maturity, Transformation, ROI, Financial Services, Methodology
false
Strategic Planning
Financial Services
Mixed Chart
Deloitte
Add to my slides
Remove from favorites
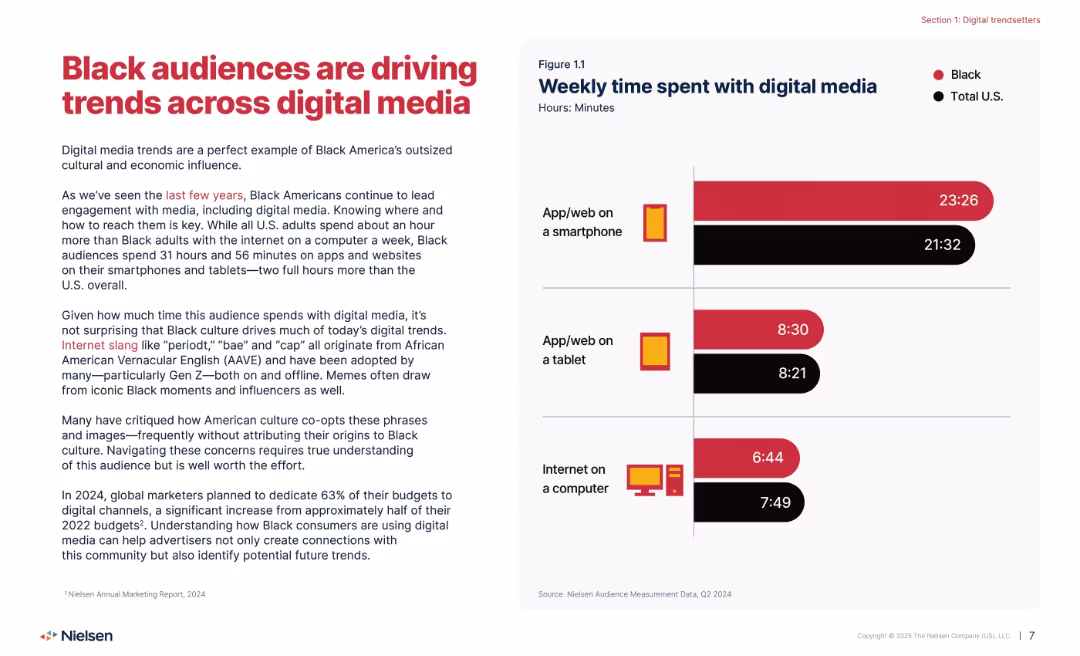
Left-aligned text with stats and insights; right side has a bar chart comparing digital usage.
Market Analysis and Trends
Media & Entertainment
Highlights how Black Americans are trendsetters in digital media consumption, spending more time on smartphones and tablets than the U.S. average. Emphasizes cultural influence, social slang origins, and marketing implications for reaching this audience effectively.
digital media, Black audiences, culture, consumption, engagement
false
Market Analysis and Trends
Media & Entertainment
Mixed Chart
Nielsen
Add to my slides
Remove from favorites
A bar chart depicting the perceived effectiveness of digital paid channels like email, search, and social media. Each bar is segmented by confidence levels among marketers, similar to the previous slide.
Market Analysis and Trends
Media & Entertainment
This slide provides insights into marketers' confidence in the effectiveness of various digital paid media channels. It includes data on channels like email, search, and social media, showing how marketers rate their effectiveness.
Digital, Media, Effectiveness, Channels, Confidence
false
Market Analysis and Trends
Media & Entertainment
Mixed Chart
Nielsen
Add to my slides
Remove from favorites
A structured layout with four numbered sections, each comprising bold headings and subtext. The sections are neatly arranged and use contrasting colors for readability. No charts or images are present.
Market Analysis and Trends
Technology & Software
Provides a glimpse into the future of digital commerce, detailing the norms of digital merchants. This slide is informative for discussions on the evolution of e-commerce and business strategies.
Digital Merchant, 2030, SEA, Online, Digital Payment, BNPL, Digital Tools, Operational Efficiency
false
Market Analysis and Trends
Technology & Software
Linear Flow
Bain
Add to my slides
Remove from favorites
The slide presents data via column charts and mobile app screenshots. It shows a trend from 2019 to 2022 in digital payments, mobile engagement, and use of the Chase app.
Market Analysis and Trends
Financial Services
Demonstrates customer trends in digital and mobile banking. Highlights the shift to digital payments and increase in mobile app usage for financial management with statistical data and representative imagery.
digital, mobile engagement, banking, app usage, payment trends, financial management, statistical data, Chase, user interface, market shift
false
Market Analysis and Trends
Financial Services
Multiple Chart
JP Morgan
Add to my slides
Remove from favorites
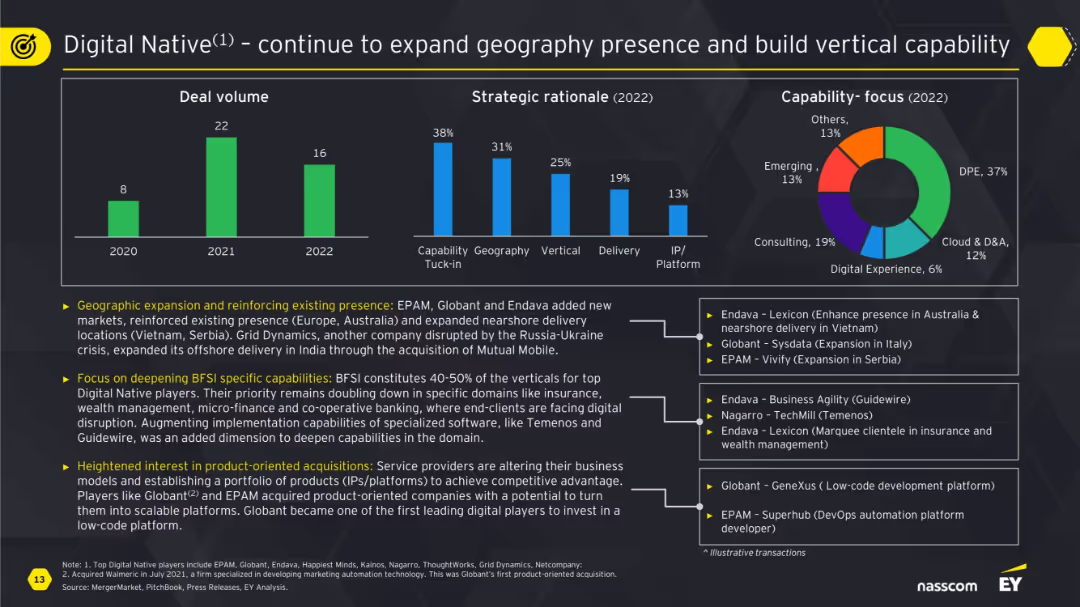
Similar to 16177 with bar and pie charts but focused on digital native firms; includes yellow-highlighted insight boxes with acquisition examples.
Technology and Digital Transformation
Technology & Software
This slide analyzes M&A behavior among digital-native companies like EPAM and Globant. Key focus areas include geographic expansion, vertical specialization (especially in BFSI), and acquiring product-oriented companies. The visual data and examples demonstrate a deliberate move toward strategic differentiation and domain leadership.
digital native, M&A, vertical, BFSI, geography, product acquisition
false
Technology and Digital Transformation
Technology & Software
Multiple Chart
EY
Add to my slides
Remove from favorites
The slide shows a series of stacked column charts comparing the maturity levels of digital native brands versus traditional brands across four categories.
Market Analysis and Trends
Professional Services
Analyzes the digital marketing maturity of digital native brands compared to traditional brands, indicating varied levels of maturity.
digital natives, maturity, marketing, comparison, brands, traditional, analysis
false
Market Analysis and Trends
Professional Services
Single Chart
BCG
Add to my slides
Remove from favorites
The slide contains multiple pie charts showing the division of advertising revenues between digital and non-digital formats for Asia Pacific (excluding Mainland China), Mainland China, and Hong Kong from 2016 and projecting to 2025. It includes percentages and a color-coded system to distinguish between digital and non-digital revenues, alongside text boxes summarizing key insights.
Market Analysis and Trends
Media & Entertainment
Analyzes the transition in advertising revenue streams from non-digital to digital formats in Hong Kong versus other regions. It highlights that despite the shift towards digital, non-digital advertising still dominates Hong Kong's market, contrary to the faster digital adoption seen in Mainland China and the broader Asia Pacific region. The slide discusses factors influencing these trends, such as technological adoption and market maturity.
digital, non-digital, advertising, Hong Kong, Asia Pacific, 2025, revenue shares
false
Market Analysis and Trends
Media & Entertainment
Multiple Chart
PwC/Strategy&
Add to my slides
Remove from favorites
Featuring four sets of column charts, this slide shows the projected growth in Singapore's digital offerings in payments, lending, insurance, and wealth management. It uses shades of blue with annotations for metrics.
Strategic Planning
Financial Services
This slide focuses on the growth potential of Singapore's traditional financial institutions in digital offerings. It's particularly useful for financial strategists and investors analyzing growth opportunities in the digital finance landscape.
Digital Offerings, Financial Services, Growth, Singapore, Strategic Planning
false
Strategic Planning
Financial Services
Multiple Chart
Bain
Add to my slides
Remove from favorites
The slide features two large pie charts showing the percentage increase in digital and mobile customers, and a line chart comparing consumer loans sold digitally in different regions. There's also a check-list on the left highlighting key digital strategies.
Operational Efficiency
Financial Services
This slide emphasizes the impact of digital strategies on sales and product launches, showing significant customer growth and the increase of digital loan transactions. Suitable for demonstrating the results of digital transformation in banking.
Digital Onboarding, Digital Sales, Consumer Loans, Growth, Digital Transformation, BBVA Wallet, Mobile Customers
false
Operational Efficiency
Financial Services
Multiple Chart
Morgan Stanley
Add to my slides
Remove from favorites
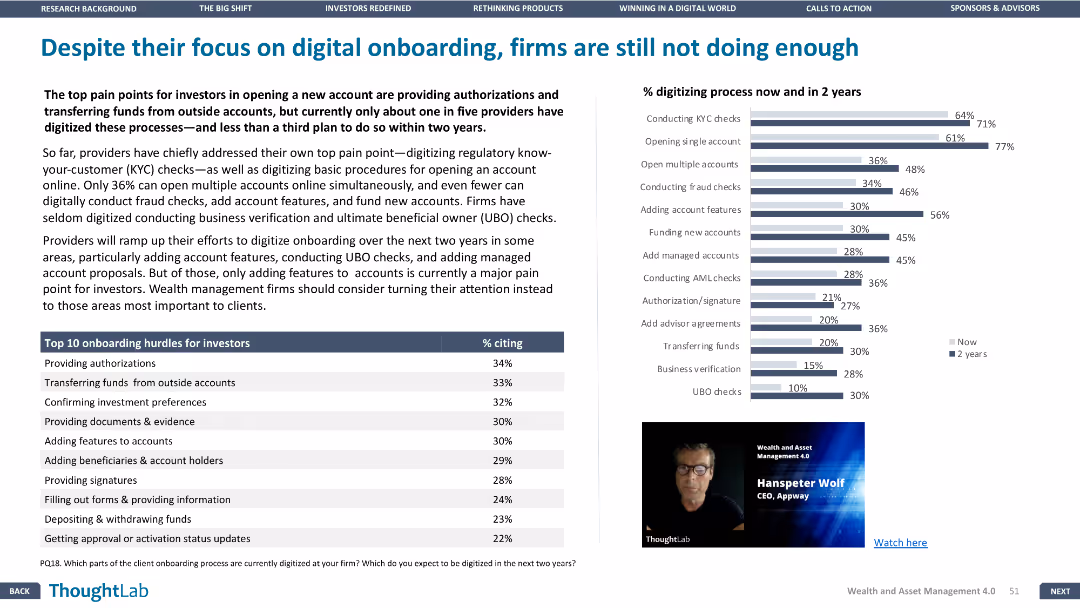
This slide features a column chart and a table. The layout is dense, with detailed data on the digitization of onboarding processes and the top onboarding hurdles for investors.
Technology and Digital Transformation
Financial Services
The slide points out that firms, despite investing in digital onboarding, are falling short in certain areas, with a focus on the percentage of firms digitizing various processes now and in two years.
Digital onboarding, digitization, investor hurdles, KYC, AML
false
Technology and Digital Transformation
Financial Services
Mixed Chart
Deloitte
Add to my slides
Remove from favorites
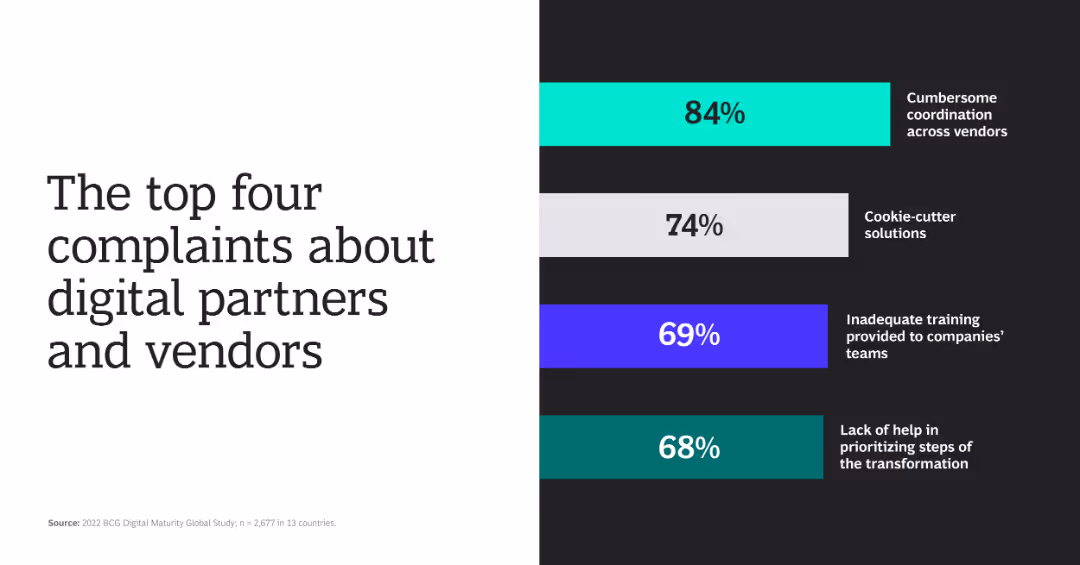
The slide has horizontal bar charts with percentages showing the top four complaints about digital partners and vendors.
Customer and Market Segmentation
Professional Services
The slide lists and quantifies the top complaints about digital partners, including coordination and inadequate training.
digital partners, complaints, vendors, coordination, training
false
Customer and Market Segmentation
Professional Services
Mixed Chart
BCG
Add to my slides
Remove from favorites
This slide features two column charts showing yearly comparisons, and text boxes with bullet points highlight key statistics. There is a balance of graphics and explanatory text.
Operational Efficiency
Financial Services
Illustrates growth in digital and debit transactions compared to cash and checks, emphasizing the increased use of digital banking capabilities by customers.
Digital Payments, Banking, Customer Engagement, Transaction Trends, Growth
false
Operational Efficiency
Financial Services
Multiple Chart
JP Morgan
Add to my slides
Remove from favorites
This slide features text and a pie chart illustrating preferences for digital payment channels. The visual elements are informative and well-organized.
Technology and Digital Transformation
Telecommunications
The slide examines the shift towards digital payments during COVID-19, focusing on consumer preferences and the impact on telecom operators.
digital payments, COVID-19, consumer preferences, telecom, mobile wallets, internet banking, cashless economy, digital channels
false
Technology and Digital Transformation
Telecommunications
Mixed Chart
EY
Add to my slides
Remove from favorites
The slide features two graphs and a quote. The first graph showcases the growth of digital payments in tier 2 and tier 3 markets, and the second depicts the expected market size.
Market Analysis and Trends
Financial Services
This slide provides a graphical representation of the growth trajectory in digital payments and market size projections. It includes customer commentary on the ease of use, suggesting a shift towards mainstream digital payment acceptance. It's used for analyzing trends in cashless payment adoption and regulatory impact.
Digital Payments, Market Size, Growth, Cashless, Consumer Experience, Regulation
false
Market Analysis and Trends
Financial Services
Mixed Chart
Kearney
Add to my slides
Remove from favorites
The slide features a header image of a person using a contactless payment system, with two columns of text and small images below the text.
Technology and Digital Transformation
Retail & E-commerce
Discusses the rise of digital payments, highlighting mobile payments, crypto, smartwatches, and the impact on retailers.
Digital Payments, Mobile, Crypto, Smartwatches, Retail, AmazonGo, Convenience, Online Stores, Payment Methods, Checkout
false
Technology and Digital Transformation
Retail & E-commerce
Multiple Chart
Deloitte
Add to my slides
Remove from favorites
Features column charts depicting the Gross Transaction Value of different payment methods, contrasting them with a sub-section of related narrative insights.
Market Analysis and Trends
Financial Services
Analyzes the persistence of digital payments, showing transaction value distribution among various payment methods and predicting the decline of cash in favor of e-wallets.
Digital Payments, Transaction Value, Payment Methods, Trend
false
Market Analysis and Trends
Financial Services
Mixed Chart
Bain
Add to my slides
Remove from favorites
Has stacked column charts detailing the share of Gross Transaction Value (GTV) by payment methods, showing trends over time.
Market Analysis and Trends
Financial Services
Analyzes the shift in payment method preferences, emphasizing the growth of digital payments and the decline of cash usage. It is relevant for payment processors and fintech companies looking to understand consumer behavior trends and capitalize on digital payment solutions.
Digital Payments, Trends, GTV
false
Market Analysis and Trends
Financial Services
Mixed Chart
Bain
Add to my slides
Remove from favorites
The slide presents a bubble chart comparing digital penetration rates across various luxury sectors, such as personal goods, cars, and wine, with key insights.
Technology and Digital Transformation
Consumer Goods
Provides an overview of digital adoption in different luxury sectors, highlighting the leading role of personal luxury goods and the potential for growth in others.
Digital penetration, Luxury sectors, Technology adoption
false
Technology and Digital Transformation
Consumer Goods
Multiple Chart
Bain
Add to my slides
Remove from favorites
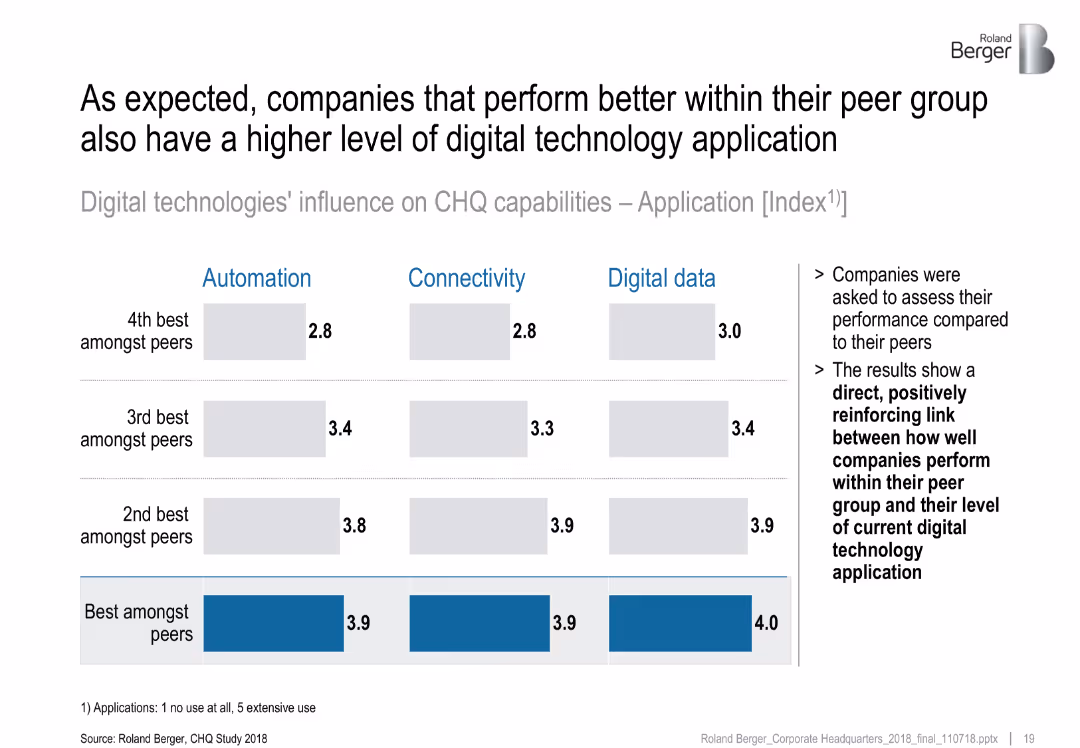
Matrix-style bar chart comparing application levels of digital technologies across peer performance groups
Strategic Planning
Professional Services
This slide shows that top-performing companies have higher levels of digital technology application across automation, connectivity, and data. It reinforces a positive correlation between tech adoption and peer-relative performance.
digital performance, peer comparison, tech application, CHQ, strategy
false
Strategic Planning
Professional Services
Multiple Chart
Roland Berger
Add to my slides
Remove from favorites
The slide has two main sections separated by a vertical line. The left side features a large blue font stating "49mm Active digital customers" and two column charts showing an increase from 7% to 8% over three years. The right side includes three bar charts with incremental increases in customer satisfaction, card spend, and multiple lines of business (LOB) relationships.
Market Analysis and Trends
Financial Services
This slide showcases growth in digital customer engagement, presenting statistical comparisons to emphasize increased customer satisfaction, spending, and deeper relationships with the bank's services over time. It is used to highlight the success of the digital platform in customer retention and engagement strategies.
digital platform, customers, engagement, satisfaction, growth
false
Market Analysis and Trends
Financial Services
Multiple Chart
JP Morgan
Add to my slides
Remove from favorites
Uses three columns with bold headers to outline building blocks, platforms, and outcomes, accompanied by a supportive narrative below in a clean, structured layout.
Technology and Digital Transformation
Technology & Software
Highlights the strategic importance of transitioning to platform-based operations in finance and technology, explaining the building blocks, specific platforms, and expected outcomes of the initiative.
digital platforms, client engagement, technology strategy, API, cloud, Goldman Sachs, customer experience, revenue growth, operational efficiency, partnerships
false
Technology and Digital Transformation
Technology & Software
Linear Flow
Goldman Sachs
Add to my slides
Remove from favorites
The slide features percentage statistics in a column chart format with explanatory text beside each chart. Color coding is used to differentiate between the likelihood of increasing or maintaining usage.
Strategic Planning
Technology & Software
Focuses on the technological readiness of digital merchants in the Philippines and their anticipated adoption of digital platforms and financial services in the future.
Digital platforms, Financial services, Technological adoption, Future trends
false
Strategic Planning
Technology & Software
Multiple Chart
Bain
Add to my slides
Remove from favorites
The slide contains a simple title section and a central list with circular icons connected by a vertical line, representing areas of improvement. There's a blue and teal color scheme with additional icons, and the design is clean with a balanced use of space.
Market Analysis and Trends
Retail & E-commerce
This slide reviews areas for enhancement within digital platforms, pinpointing the need for more promotions, lower fees, and better customer engagement. By identifying these top areas, the slide provides actionable insights for platform improvement and growth, catering to merchant feedback and emphasizing cost-effectiveness and user experience enhancements as pivotal.
digital platforms, improvement, promotions, transaction fees, user engagement, merchant feedback
false
Market Analysis and Trends
Retail & E-commerce
Vertical Flow
Bain
Add to my slides
Remove from favorites
With a large title and a brief descriptive text, the slide features a bar graph showing levels of merchant satisfaction with digital platforms. A scale from 0 to 10 indicates the likelihood of recommendation, and the graph is color-coded to represent different response ranges. The Net Promoter Score is mentioned at the bottom.
Customer and Market Segmentation
Retail & E-commerce
This slide portrays the satisfaction levels of digital merchants with their platforms and the likelihood of recommending them to peers. It highlights the simplicity of use, transaction ease, customer base, and trustworthiness of platforms as key factors. This is relevant for understanding merchant engagement with digital services.
digital platforms, merchant satisfaction, recommendation likelihood, Net Promoter Score, engagement, trust
false
Customer and Market Segmentation
Retail & E-commerce
Single Chart
Bain
Add to my slides
Remove from favorites
This slide is a split layout with a title section, a left-hand bullet list, and a right-hand bar chart with a 0-10 scale. The color scheme includes blue, yellow, and green. There is a balance of textual information and visual data, with a clear presentation of the Net Promoter Score.
Market Analysis and Trends
Retail & E-commerce
The slide communicates merchants' satisfaction with digital platforms and their likelihood to recommend these platforms to peers, backed by a bar chart visualizing Net Promoter Score (NPS). It highlights the top reasons for merchant satisfaction, such as simplicity, ease of transaction, and customer base, serving as a persuasive data point for platform reliability.
digital platforms, merchants, satisfaction, NPS, ease of transaction, customer base, simplicity
false
Market Analysis and Trends
Retail & E-commerce
Mixed Chart
Bain
Add to my slides
Remove from favorites
Utilizes a split design with data on the left, a column chart in the center and an image of a user interface on the right. There's a notable use of blue tones and digital motifs.
Operational Efficiency
Technology & Software
Outlines the firm's digital portal features, its revenue impact, and the upcoming developer tools designed to enhance user experience and connectivity.
Digital portal, revenue growth, developer tools, user interface, API, technology, financial services, user experience
false
Operational Efficiency
Technology & Software
Mixed Chart
JP Morgan
Add to my slides
Remove from favorites
The slide uses a structured three-column layout with icons, bullet points, and a case study scenario header. It highlights the client's background and requirements on the left, with the provided solutions on the right. The design is clean and organized, ensuring focus on content.
Client Case Studies
Technology & Software
Showcasing a client case study, the slide details how a quick-service restaurant built a digital presence through a comprehensive mobile solution and payment system, illustrating the effectiveness of digital solutions in enhancing customer service and operational efficiency.
digital presence, client case study, mobile solutions, payment systems, customer loyalty, security, transaction processing, order-ahead
false
Client Case Studies
Technology & Software
Boxed
JP Morgan
Add to my slides
Remove from favorites
This slide features a two-column layout with bulleted lists and percentage statistics. Icons are used to represent different concepts like growth and automation. The design is moderate, utilizing whitespace effectively for a clean and balanced appearance.
Industry Overview
Financial Services
The slide contrasts current business environmental assessments with adaptation strategies to the on-demand world. It is used for understanding key areas of focus in digital commerce and customer service improvements.
digital presence, customer needs, online demand, digital commerce, consumer expectations, convenience, adaptation, mobile spending, data
false
Industry Overview
Financial Services
Boxed
JP Morgan
Add to my slides
Remove from favorites
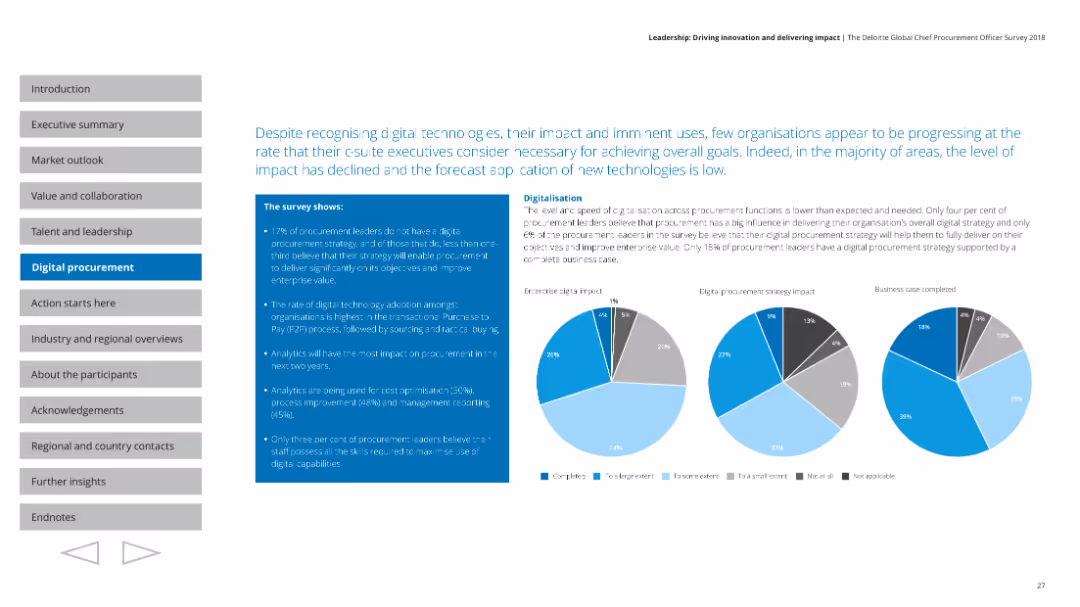
The slide includes column charts and pie charts, visually dense with key data points and statistics on digital procurement strategies and their impact.
Technology and Digital Transformation
Professional Services
Highlights the lack of digital procurement strategies among leaders, the adoption rates of digital technology, and key areas of digital impact.
Digital procurement, analytics, adoption, strategy, impact
false
Technology and Digital Transformation
Professional Services
Multiple Chart
Deloitte
Add to my slides
Remove from favorites
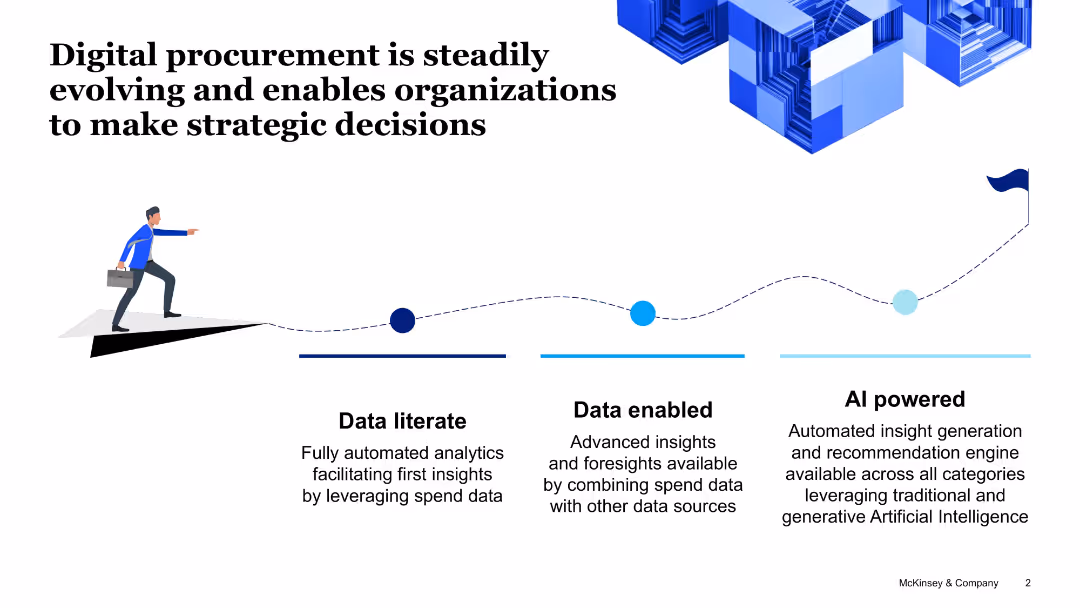
Clean white background with a progressive illustration showing a businessperson moving forward; text and three segments below (Data Literate, Data Enabled, AI Powered).
Technology and Digital Transformation
Professional Services
This slide outlines the maturity stages of digital procurement—from leveraging spend data for initial insights to combining it with other sources, culminating in AI-powered automation and recommendations.
Digital procurement, data literate, data enabled, AI, analytics, insights, automation, strategy
false
Technology and Digital Transformation
Professional Services
Linear Flow
McKinsey
Add to my slides
Remove from favorites
Slide displays bar graphs, text sections, and percentage changes. Colors differentiate various elements, with clear labels for each data set.
Product and Service Analysis
Financial Services
Highlights the growth of digital products and installment lending customers. Could be used in strategic presentations or business development discussions.
digital products, installment lending, customer growth, pay-over-time solutions
false
Product and Service Analysis
Financial Services
Table
JP Morgan
Add to my slides
Remove from favorites
Three columns each with an icon at the top, detailing challenges and solutions in content distribution, advertising, and digital subscriptions.
Technology and Digital Transformation
Media & Entertainment
Discusses how digital advancements are reshaping publisher strategies in content distribution, advertising capabilities, and digital subscriptions.
digital, publishers, content distribution, advertising, subscriptions, first-party data, innovation, strategy, online
false
Technology and Digital Transformation
Media & Entertainment
Pillar
Accenture
Add to my slides
Remove from favorites
Utilizes a combination of bar graphs and numerical data to display the trend of digital purchasing in ASEAN. It contrasts the years 2016 and 2021, with a side text summarizing the data's implications. The design is simple with a focus on clarity and contrast.
Customer and Market Segmentation
Technology & Software
This slide provides statistics on the growth of online shopping in ASEAN and its influence on the demand for digital talent, linking increased digital purchases with a need for specialized skills in e-commerce and digital services.
digital purchasing, ASEAN, trends, e-commerce, market segmentation
false
Customer and Market Segmentation
Technology & Software
Multiple Chart
Kearney
Add to my slides
Remove from favorites
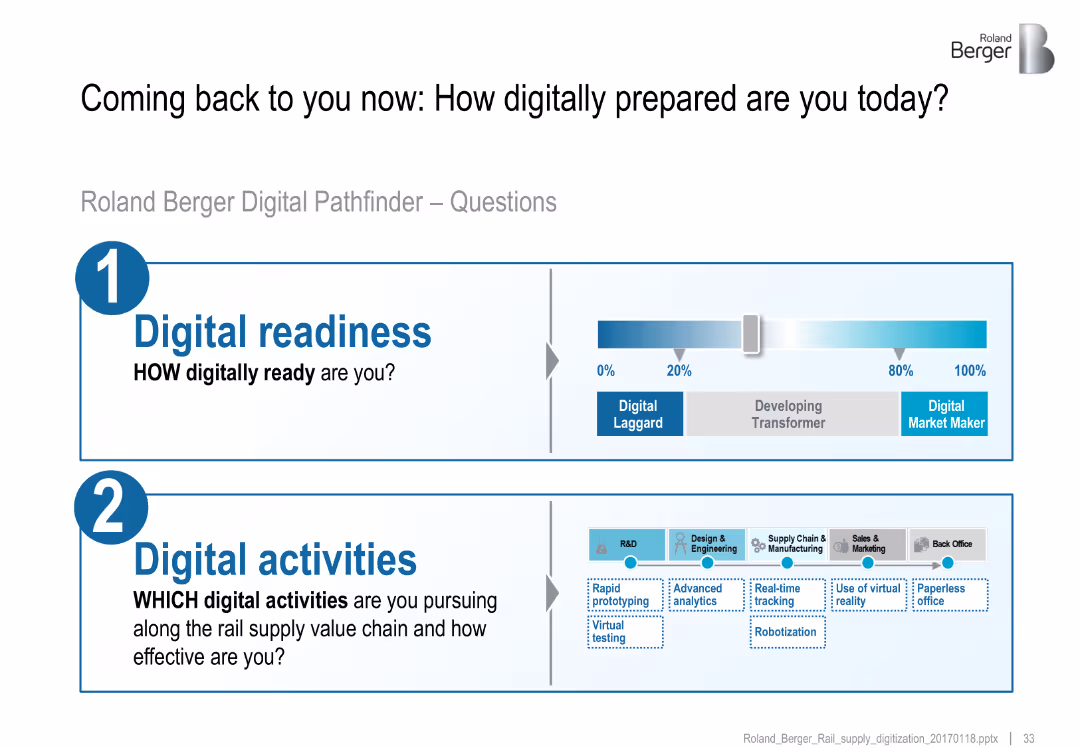
Split layout with readiness scale and digital activity icons across value chain
Technology and Digital Transformation
Transportation & Logistics
Introduces Roland Berger's Digital Pathfinder assessment with two key questions: evaluating current digital readiness and mapping digital activities across the supply chain.
digital readiness, digital activities, value chain, virtual testing, analytics, robotization
false
Technology and Digital Transformation
Transportation & Logistics
Mixed Chart
Roland Berger
Add to my slides
Remove from favorites
The slide presents a series of column charts with percentage values, supplemented with descriptive text beside each set of data. Color differentiation highlights various aspects of technology adoption.
Strategic Planning
Technology & Software
Explores the preparedness of Singapore's digital merchants for future technological adoption, particularly in digital platforms and financial services, projecting growth and usage trends.
Digital readiness, Tech adoption, Financial services, Growth trends
false
Strategic Planning
Technology & Software
Multiple Chart
Bain
Add to my slides
Remove from favorites
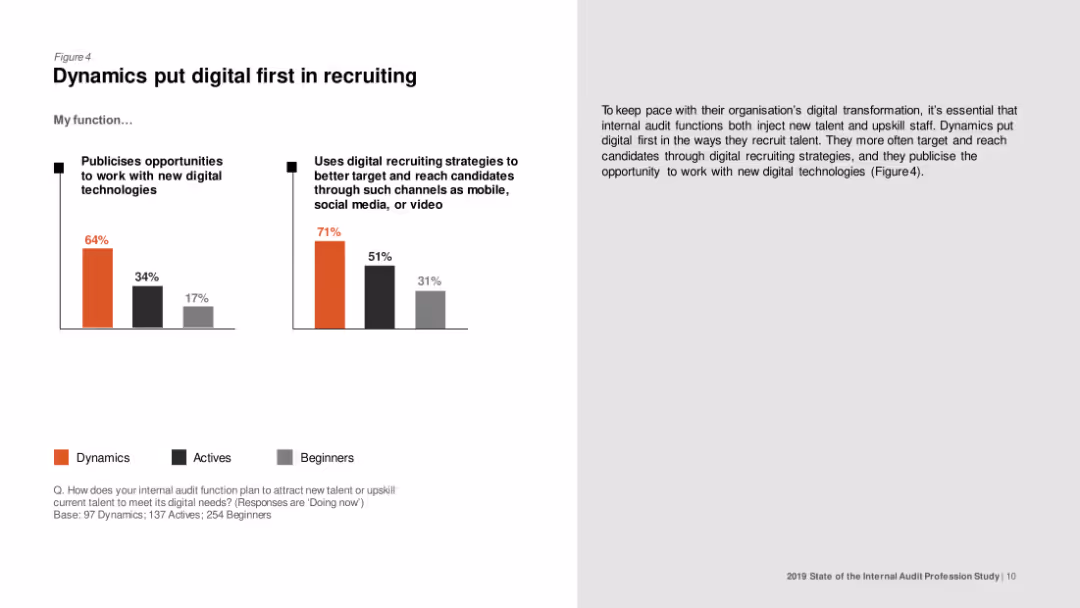
Column chart comparing the use of digital recruiting strategies and publicizing opportunities to work with new digital technologies among Dynamics, Actives, and Beginners.
Human Resources and Talent Management
Professional Services
The slide examines how internal audit functions are using digital strategies to recruit talent, showing higher adoption in Dynamics compared to Actives and Beginners.
Digital recruiting, internal audit, talent acquisition, Dynamics, Actives
false
Human Resources and Talent Management
Professional Services
Multiple Chart
PwC/Strategy&
Add to my slides
Remove from favorites
Presents a column chart showing the increase in app downloads for digital remittance services, paired with descriptive text detailing the significance and future expectations.
Market Analysis and Trends
Financial Services
Highlights the uptick in digital remittance users, underpinned by the rise in app downloads and regulatory support, and predicts the long-term impact up to 2025.
Digital Remittance, User Growth, Apps, Predictions
false
Market Analysis and Trends
Financial Services
Mixed Chart
Bain
Add to my slides
Remove from favorites
Presents dual line charts tracking global digital vs. non-digital entertainment & media revenues from 2016 to 2025, supplemented by a digital disruption infographic.
Market Analysis and Trends
Media & Entertainment
Analyzes the shift towards digital in the entertainment and media revenues, predicting stronger growth for digital revenues up to 2025.
digital revenue, non-digital, growth trend, 2025 forecast, media industry, digital shift, market trend
false
Market Analysis and Trends
Media & Entertainment
Mixed Chart
PwC/Strategy&
Add to my slides
Remove from favorites
Text-based slide with bullet points on cyber threats and required cyber resilience capabilities, supported by statistics and icons.
Risk Assessment and Management
Technology & Software
This slide details the increasing cybersecurity threats and the essential capabilities organizations need to develop for enhancing cyber resilience and reducing digital risk.
digital risk, cybersecurity, resilience, threats, capabilities
false
Risk Assessment and Management
Technology & Software
Table
BCG
Add to my slides
Remove from favorites
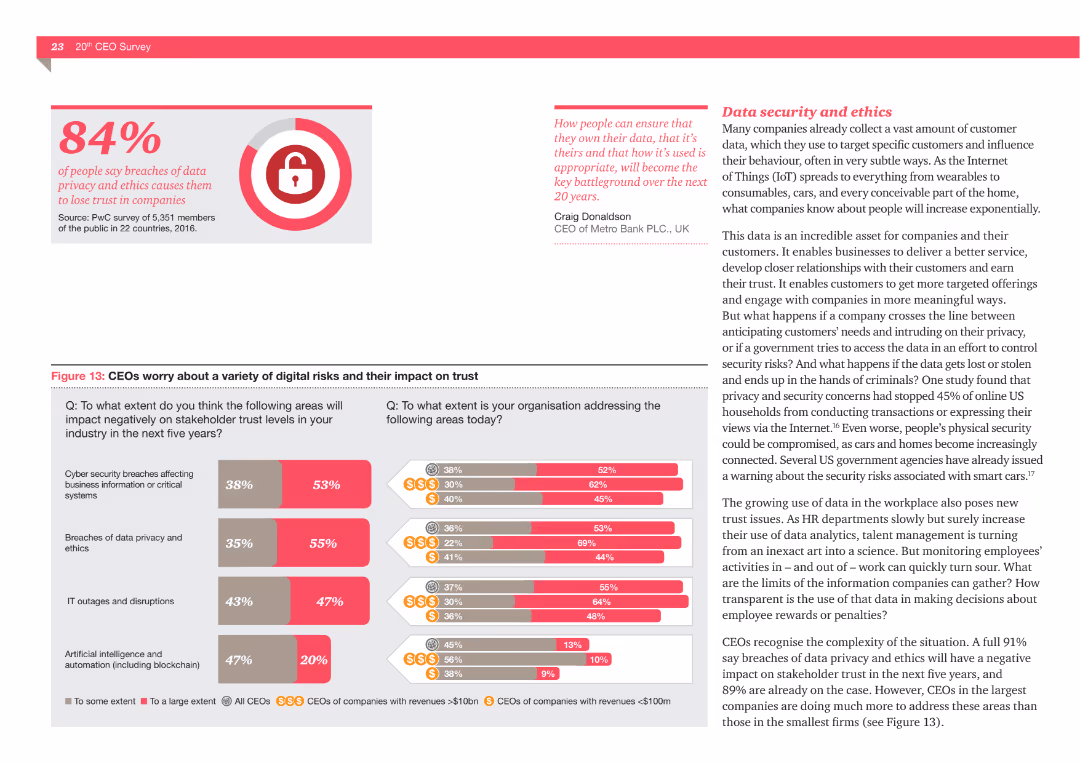
The slide includes a bar chart detailing CEOs' concerns about digital risks like cybersecurity breaches and IT outages, and their impact on stakeholder trust. It shows the extent to which these risks are being addressed.
Risk Assessment and Management
Technology & Software
This slide addresses the digital risks that concern CEOs, such as cybersecurity breaches, data privacy issues, and IT outages, and how these risks impact stakeholder trust. It also highlights the efforts made to address these risks.
Digital risks, cybersecurity, data privacy, IT outages, stakeholder trust, CEOs
false
Risk Assessment and Management
Technology & Software
Multiple Chart
PwC/Strategy&
Add to my slides
Remove from favorites
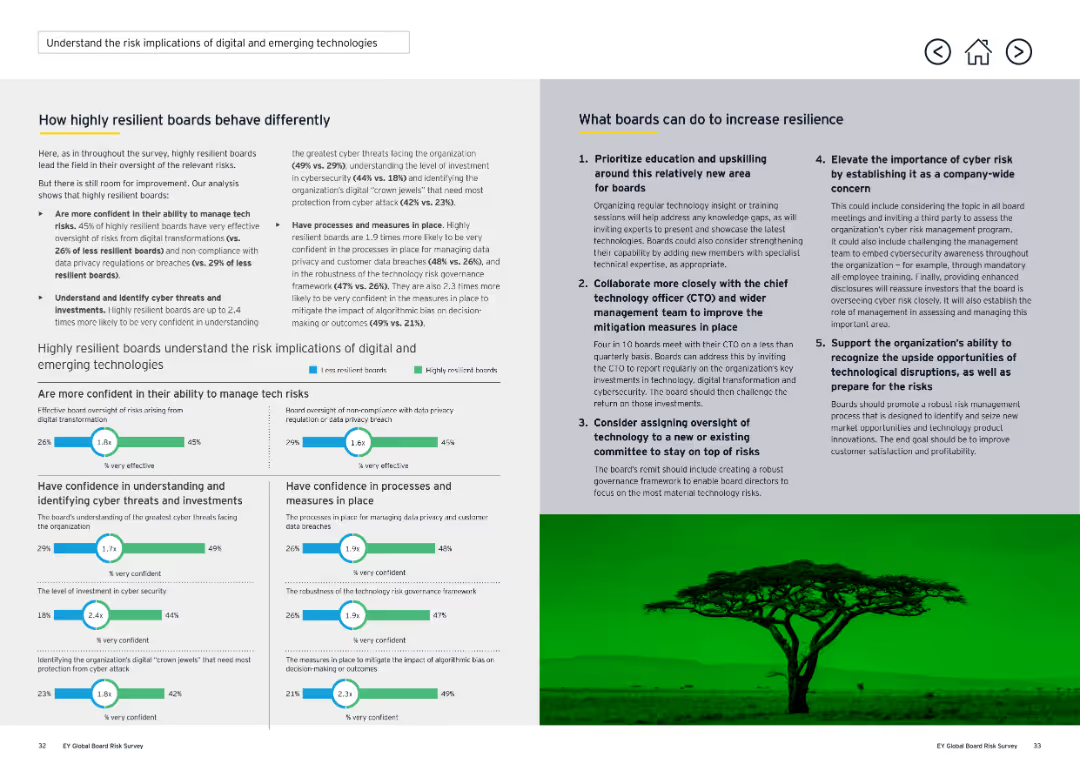
A two-column slide with a large image of a lion on the left, a title with a yellow number "5" in a box, and text with statistics and a bar chart on the right. The slide is visually moderate with a mix of text, image, and a column chart.
Risk Assessment and Management
Technology & Software
The slide emphasizes the importance for boards to understand the risks associated with digital transformations, citing a survey about board confidence and effective oversight. It suggests measures to improve resilience, like education and collaboration with CTOs.
Digital, Risk, Technology, Board, Survey, Confidence
false
Risk Assessment and Management
Technology & Software
Mixed Chart
EY
Add to my slides
Remove from favorites
This two-column slide contains detailed text on both sides, with a horizontal line separating sections. It includes several comparative statistics and recommendations. The visual complexity is moderate.
Risk Assessment and Management
Technology & Software
The slide details how highly resilient boards manage tech risks better and what boards can do to increase resilience. It compares the confidence levels of different boards in managing technology risks and provides strategies for improvement, such as prioritizing education and upskilling.
Digital, Risk, Technology, Resilience, Boards
false
Risk Assessment and Management
Technology & Software
Multiple Chart
EY
Add to my slides
Remove from favorites
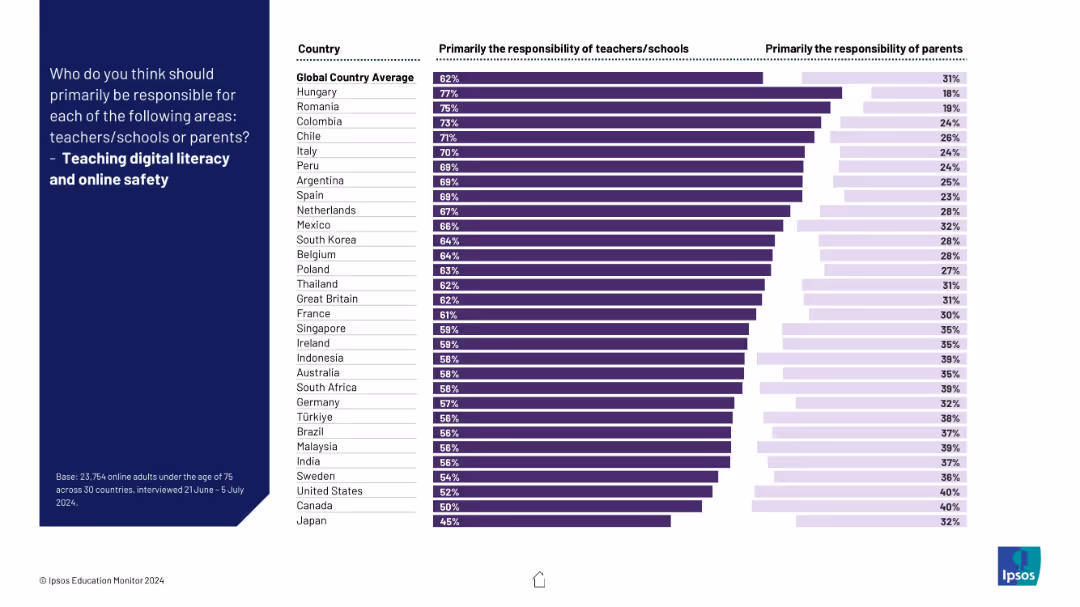
Similar dual-bar layout showing teacher/school vs parent responsibility; visual hierarchy based on country.
Technology and Digital Transformation
Education & Training
It depicts perceptions around who should teach digital literacy and online safety. Opinions are divided, with varying emphasis by country on institutional vs parental roles.
digital safety, online, literacy, responsibility, education, parents, schools, Ipsos, tech literacy, children
false
Technology and Digital Transformation
Education & Training
Mixed Chart
IPSOS
Add to my slides
Remove from favorites
The slide presents multiple column charts for different countries indicating consumer interest levels in online buying, contactless sales, and service with dealers. Each country's response is shown in contrasting colors, representing different levels of interest.
Market Analysis and Trends
Transportation & Logistics
Evaluates global consumer interest in digital and contactless automotive sales and services, focusing on preferences across multiple countries and detailing the percentage of engaged consumers.
digital sales, contactless services, consumer interest, global survey, automotive industry
false
Market Analysis and Trends
Transportation & Logistics
Multiple Chart
McKinsey
Add to my slides
Remove from favorites
The slide features a client scenario with bullet points on the left and a "Start your journey" section on the right, describing the journey to digital sales growth during the pandemic.
Client Case Studies
Retail & E-commerce
A case study on increasing digital sales during the pandemic by implementing omnichannel strategies, suitable for discussions on digital transformation and retail adaptation.
digital sales, pandemic, omnichannel strategy, retail adaptation, case study
false
Client Case Studies
Retail & E-commerce
Boxed
JP Morgan
Add to my slides
Remove from favorites
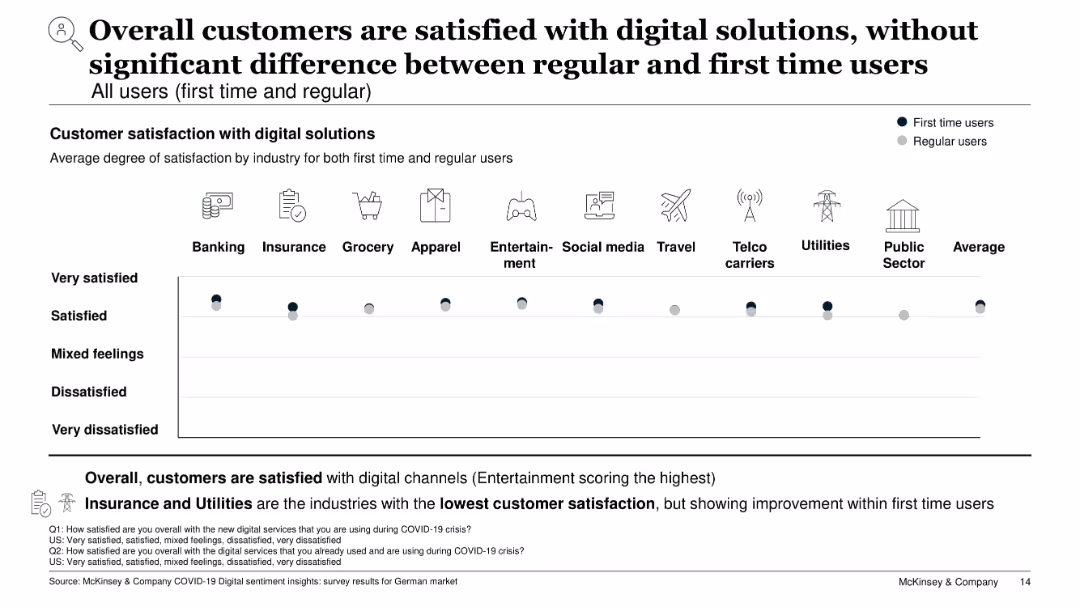
Dot chart showing satisfaction levels across industries; two tones represent regular vs. first-time users
Customer and Market Segmentation
Technology & Software
This slide compares satisfaction levels with digital channels between first-time and regular users. Across industries, satisfaction is generally high, with Entertainment showing the highest scores. The chart reveals minimal difference between the two user groups, indicating strong onboarding and usability.
digital satisfaction, first-time users, regular users, customer experience, usability, entertainment, industry comparison
false
Customer and Market Segmentation
Technology & Software
Single Chart
McKinsey
Add to my slides
Remove from favorites
Several bar graphs depict the percentage of internet users who use various digital services, highlighting the continued growth in adoption rates.
Market Analysis and Trends
Technology & Software
This slide indicates the steady and robust adoption of digital services in 2021, with food delivery experiencing the highest increase.
digital service adoption, internet users, 2021 trends, food delivery, market penetration
false
Market Analysis and Trends
Technology & Software
Single Chart
Bain
Add to my slides
Remove from favorites
Includes a column chart with blue and yellow columns, labeled with percentages and SEA country flags at the bottom.
Market Analysis and Trends
Technology & Software
Shows the proportion of new digital service consumers in SEA countries, highlighting how COVID-19 has affected digital adoption.
digital service, consumers, SEA, COVID-19, adoption
false
Market Analysis and Trends
Technology & Software
Single Chart
Bain
Add to my slides
Remove from favorites
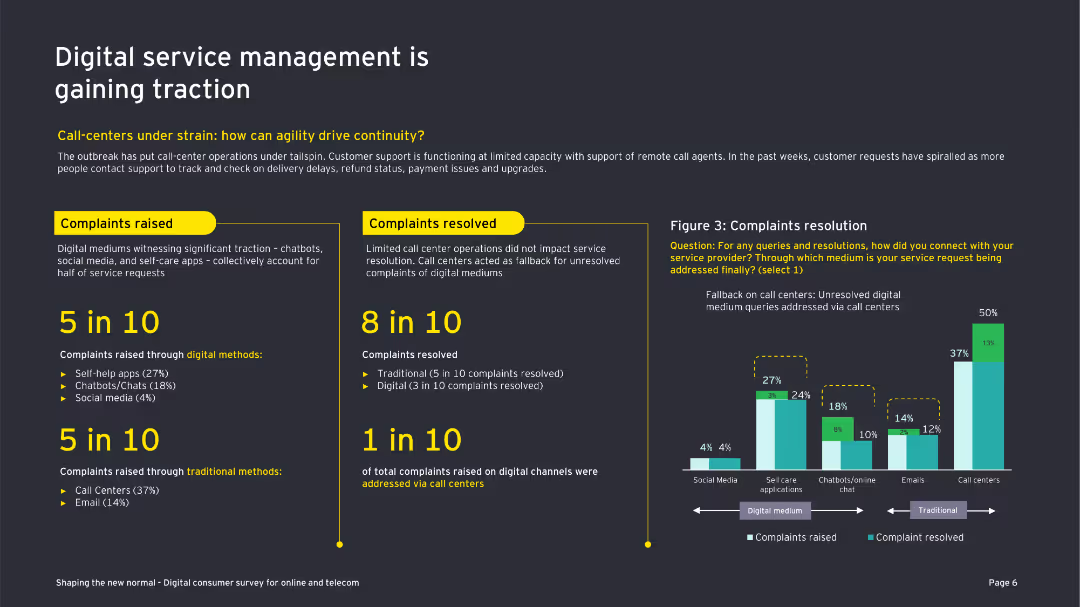
This slide features a combination of text and a column chart showing complaint resolution data. The design is detailed with clear segmentation.
Market Analysis and Trends
Telecommunications
The slide discusses the increasing importance of digital service management in the telecom sector, focusing on customer complaints and resolutions.
digital service, customer support, complaints, resolutions, telecom, COVID-19, call centers, digital channels, self-care applications
false
Market Analysis and Trends
Telecommunications
Mixed Chart
EY
Add to my slides
Remove from favorites
The slide showcases a complex multi-column chart detailing digital service adoption percentages across different consumer groups. The chart is accompanied by explanatory notes and uses a color gradient of blue to differentiate between consumer segments.
Customer and Market Segmentation
Technology & Software
Presenting digital adoption percentages for various consumer demographics, this slide reveals patterns in the uptake of digital services, such as e-commerce and gaming. It’s a valuable resource for understanding the behaviors of affluent users versus other demographic groups, and for tailoring digital offerings to match these behaviors.
digital services, consumer behavior, adoption rates, affluent users, young natives, digital natives, comparative chart
false
Customer and Market Segmentation
Technology & Software
Table
Bain
Add to my slides
Remove from favorites
This slide has a light background with text and five icons representing the top reasons why consumers switch brands, which include a thumbs-up, a tag, a smile, a checkmark, and a wallet. There's a title on top and footnotes at the bottom, indicating sources and explanatory notes.
Strategic Planning
Retail & E-commerce
The slide outlines key factors like selection, pricing, and experience that influence consumers to stay or switch brands in digital services. It's useful for strategic planning, highlighting essential aspects that digital merchants should focus on to meet consumer expectations and thrive in the competitive online marketplace.
digital services, consumer choices, brand loyalty, strategy, competitive pricing, purchase experience, convenience
false
Strategic Planning
Retail & E-commerce
Pillar
Bain
Add to my slides
Remove from favorites
Previous
Next
You don't have any favorites yet.
Please wait loading your favorites slides...
Create a FREE account to continue browsing
Receive Instant Access to 1,000+ slides from companies like McKinsey, Google, and Goldman Sachs
First Name
Last Name
Email
Password
I agree to all
Terms & Privacy Policy
Thank you! Your submission has been received!
Oops! Something went wrong while submitting the form.
Have an account?
Sign in
Upgrade to PRO to Save slides
Advanced Search and Filters
Access to 15,000+ slides
Access to Category Pages
Save/Bookmark Slides
PowerPoint Template Library
Pick a Plan
MONTHLY
$12/month
Billed every month, Cancel anytime.
YEARLY
$9/year
Billed $108 annually, Cancel anytime.
Checkout for $12/month
Checkout for $108/yr
Secured by Stripe | AES-256 bit encryption