My Account
My Slides
Search by Category
Companies
Slide Type
Use Case
Industry
Pricing
Templates
View All Templates
Download Template Slides
✦ AI
AI Prompt Library
AI Search
Feedback
Login
Logout
Get Started
Browse all Slides
Browse all Slides
Create a FREE Account
Instant access to 1,000+ real slides from top companies like McKinsey, BCG, Goldman Sachs, Google and many more!
First Name
Last Name
Email
Password
I agree to all
Terms & Privacy Policy
Thank you! Your submission has been received!
Oops! Something went wrong while submitting the form.
Have an account?
Sign in
Saved Slides
Total No. of slides saved
0
↻ Refresh
✖ Clear all
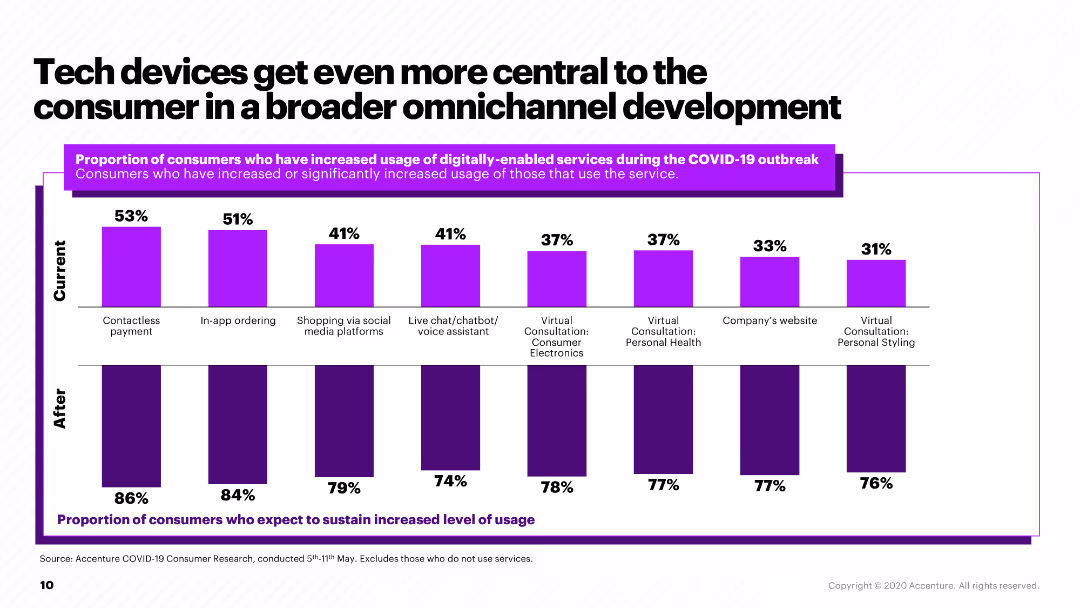
The slide features a column chart showing the increase in usage of various digitally-enabled services during and after the COVID-19 outbreak.
Market Analysis and Trends
Retail & E-commerce
The slide highlights the growth in the use of digital services, such as contactless payments and in-app ordering, during the COVID-19 pandemic and projected continuation.
digital services, COVID-19, consumer electronics, omnichannel, tech adoption
false
Market Analysis and Trends
Retail & E-commerce
Multiple Chart
Accenture
Add to my slides
Remove from favorites
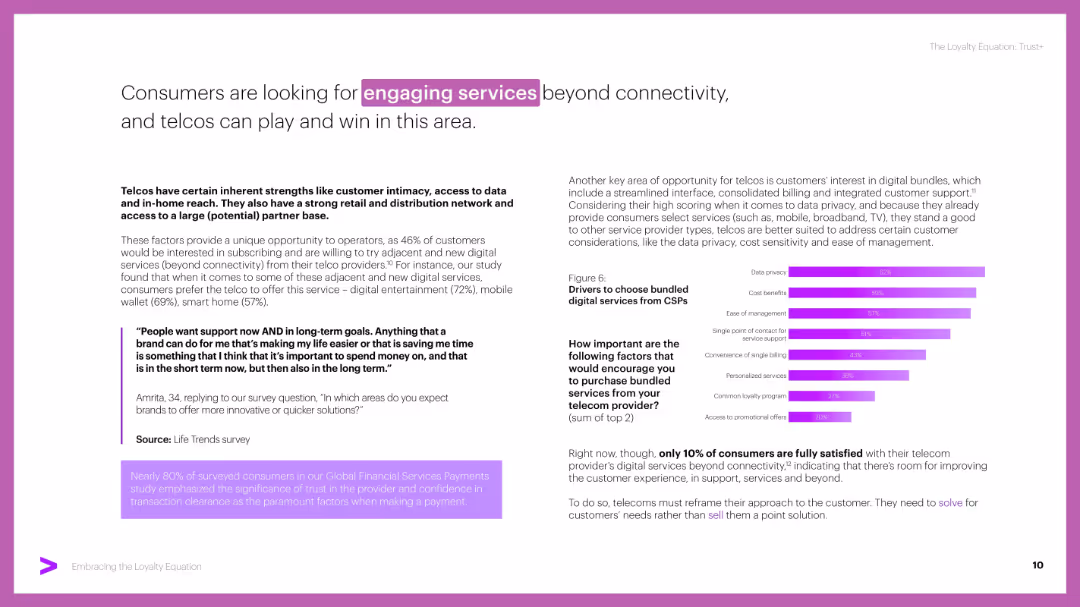
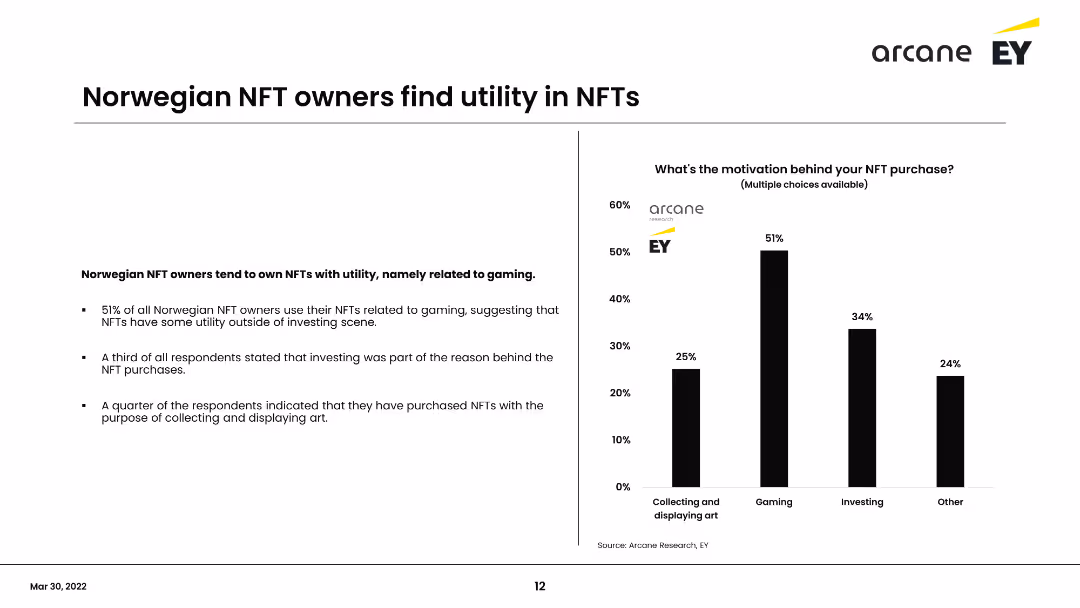
Two-column layout with bold headers, a quote in a purple box, and a horizontal bar chart on the right. Purple accent colors and highlighted keywords add emphasis.
Customer and Market Segmentation
Telecommunications
Highlights consumers’ demand for engaging services like digital entertainment, mobile wallets, and smart home devices. Emphasizes trust and bundled digital services as key drivers, with data from customer surveys and usage preferences.
digital services, CSPs, telco, bundling, trust, engagement, loyalty, privacy
false
Customer and Market Segmentation
Telecommunications
Mixed Chart
Accenture
Add to my slides
Remove from favorites
Slide contains charts and visual elements that illustrate the enhancement of digital services.
Technology and Digital Transformation
Financial Services
Discusses the role of digital transformation in enhancing service delivery, focusing on customer experience and operational efficiency.
Digital, Services, Enhancement, Technology
false
Technology and Digital Transformation
Financial Services
Single Chart
Barclays
Add to my slides
Remove from favorites
Features a column chart with percentages, blue columns, SEA country flags, and a title on top.
Market Analysis and Trends
Technology & Software
Provides predictions on the continued use of digital services by new consumers in SEA countries post-COVID-19.
digital services, future predictions, SEA, post-COVID-19, consumers
false
Market Analysis and Trends
Technology & Software
Single Chart
Bain
Add to my slides
Remove from favorites
Several column charts are used to demonstrate current trends and forecasts in digital financial services, with a focus on payments and investments.
Risk Assessment and Management
Financial Services
It offers a forward-looking analysis of digital financial services, predicting sustained growth and highlighting lending and remittance as key areas.
digital services, growth forecast, lending, remittance, investment trends, financial analysis
false
Risk Assessment and Management
Financial Services
Multiple Chart
Bain
Add to my slides
Remove from favorites
Contains multiple column charts for different digital financial service sectors, highlighting growth rates and future projections.
Market Analysis and Trends
Financial Services
Offers an overview of the flourishing digital financial services sector, with a special focus on the exponential growth in digital lending. It serves as a vital tool for financial service providers and investors to understand market trends and identify investment opportunities.
Digital Services, Lending, Growth
false
Market Analysis and Trends
Financial Services
Multiple Chart
Bain
Add to my slides
Remove from favorites
A bar graph illustrates the retention rate of new digital service users, with consistent high percentages across multiple service categories.
Market Analysis and Trends
Technology & Software
Illustrates the longevity of digital service adoption among new users, indicating a low likelihood of market retraction post-pandemic.
digital services, long-term adoption, user retention, market stability, service categories, post-pandemic
false
Market Analysis and Trends
Technology & Software
Single Chart
Bain
Add to my slides
Remove from favorites
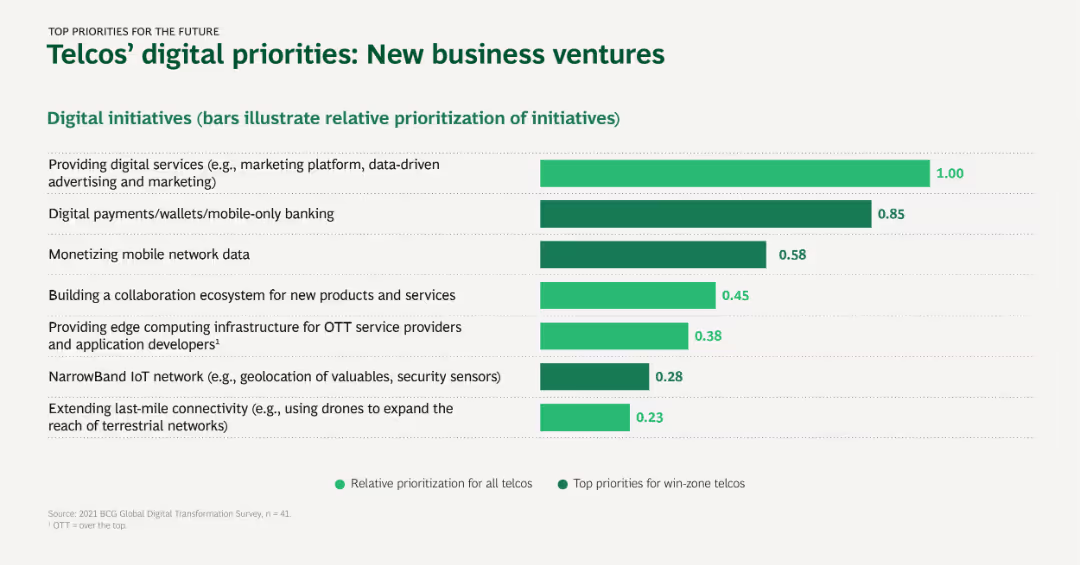
Horizontal bar chart representing the prioritization of digital initiatives for new business ventures in telcos, with a focus on top and relative priorities.
Market Analysis and Trends
Telecommunications
This slide details the digital initiatives telcos are prioritizing for new business ventures, including digital services, mobile banking, and IoT networks.
Digital services, Mobile banking, Network data, IoT, Business ventures
false
Market Analysis and Trends
Telecommunications
Single Chart
BCG
Add to my slides
Remove from favorites
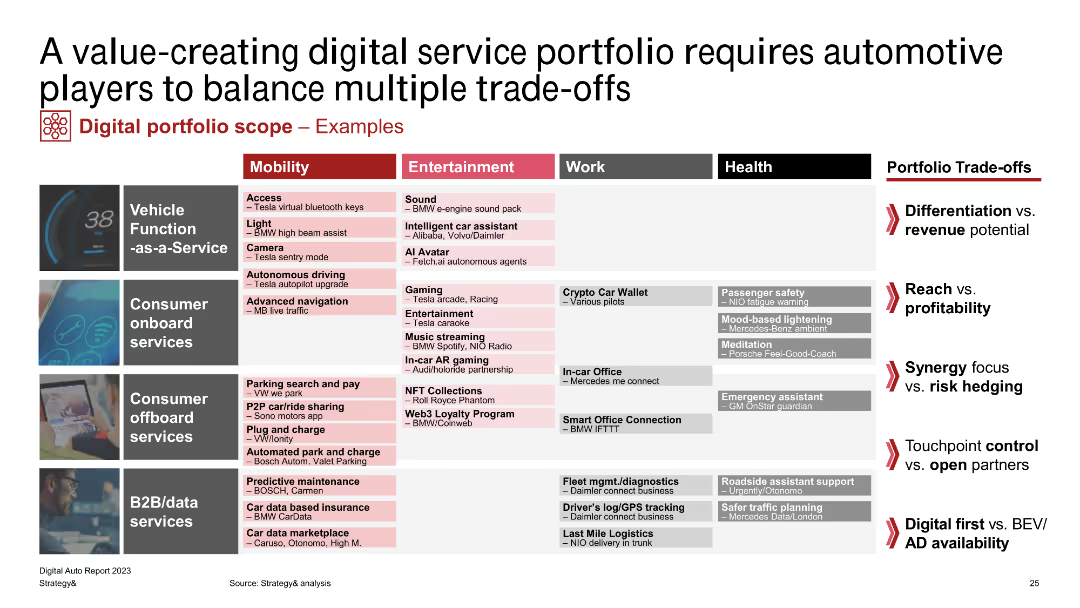
A detailed table showing digital service portfolios across mobility, entertainment, work, and health, highlighting trade-offs.
Technology and Digital Transformation
Transportation & Logistics
Explains the balance automotive players must achieve in creating digital service portfolios, addressing differentiation, reach, and control.
digital services, portfolio, trade-offs, automotive, mobility
false
Technology and Digital Transformation
Transportation & Logistics
Table
PwC/Strategy&
Add to my slides
Remove from favorites
The slide features a bar chart with categories labeled as Groceries, Beauty, Apparel, Electronics, Food delivery, Music, and Video. It uses blue and green to differentiate reasons for continued use. There's a title on top, three callouts on the right, and a legend at the bottom.
Market Analysis and Trends
Retail & E-commerce
The slide presents data on why SEA consumers continue using digital services, with the focus on convenience and routine. This slide is useful for analyzing market trends and consumer behavior, particularly in e-commerce, and for strategies to maintain customer engagement in digital services.
digital services, SEA, e-commerce, consumer behavior, market trends, convenience, routine, bar chart
false
Market Analysis and Trends
Retail & E-commerce
Single Chart
Bain
Add to my slides
Remove from favorites
Flow diagram showing the online and offline activities of shoppers within non-essential categories.
Customer and Market Segmentation
Retail & E-commerce
Depicts how digital shoppers alternate between online and offline channels through their shopping journey.
digital shoppers, online shopping, offline channels, consumer journey, retail
false
Customer and Market Segmentation
Retail & E-commerce
Header Vertical
Bain
Add to my slides
Remove from favorites
The slide is densely packed with text and includes a digital skill matrix, career pathways, and job description with skills required. Each section is color-coded and contains bullet points. It is visually complex, incorporating various text blocks and a flow diagram that outlines career progression. The overall layout is systematic but crowded.
Operational Efficiency
Technology & Software
This slide maps the digital skill and career roadmap for Singapore, depicting key areas such as Data & AI, Infrastructure, Software, and Strategy & Governance. It offers an in-depth view into the specific job roles, required skills, and potential career pathways within the ICT sector, serving as a guide for workforce upskilling strategies and educational planning.
Digital Skills, Career Roadmap, Singapore, ICT, Job Descriptions, Skills Matrix, Data & AI, Software Engineering, Strategy & Governance, Upskilling
false
Operational Efficiency
Technology & Software
Header Horizontal
Kearney
Add to my slides
Remove from favorites
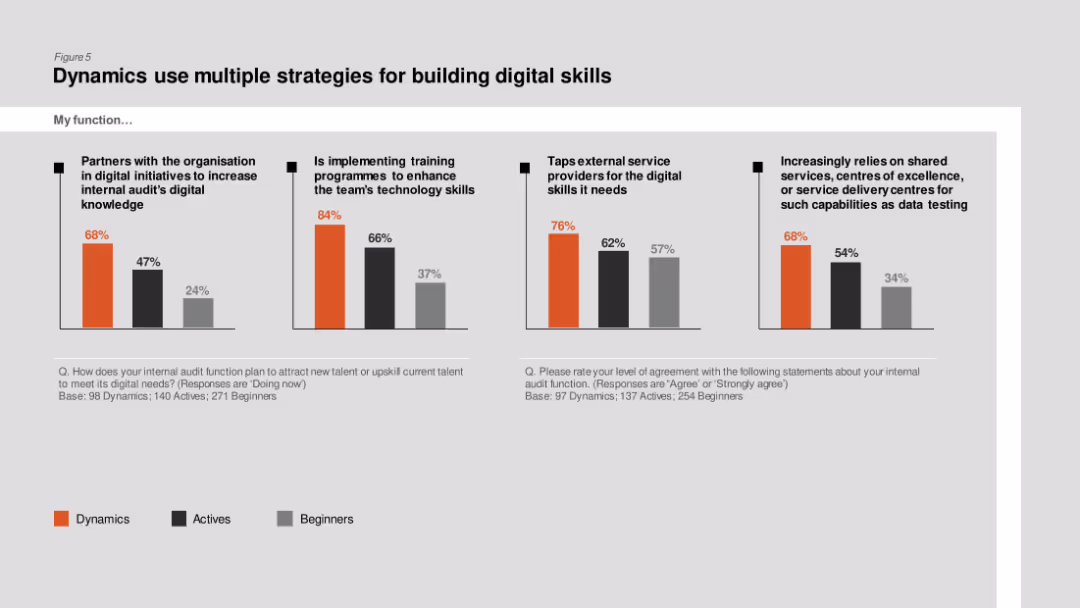
Column charts comparing strategies like partnerships, training programs, and external service providers for building digital skills among Dynamics, Actives, and Beginners.
Human Resources and Talent Management
Professional Services
The slide details various strategies used by internal audit functions to enhance digital skills, showing higher implementation of training programs and partnerships in Dynamics.
Digital skills, training programs, internal audit, partnerships, Dynamics
false
Human Resources and Talent Management
Professional Services
Multiple Chart
PwC/Strategy&
Add to my slides
Remove from favorites
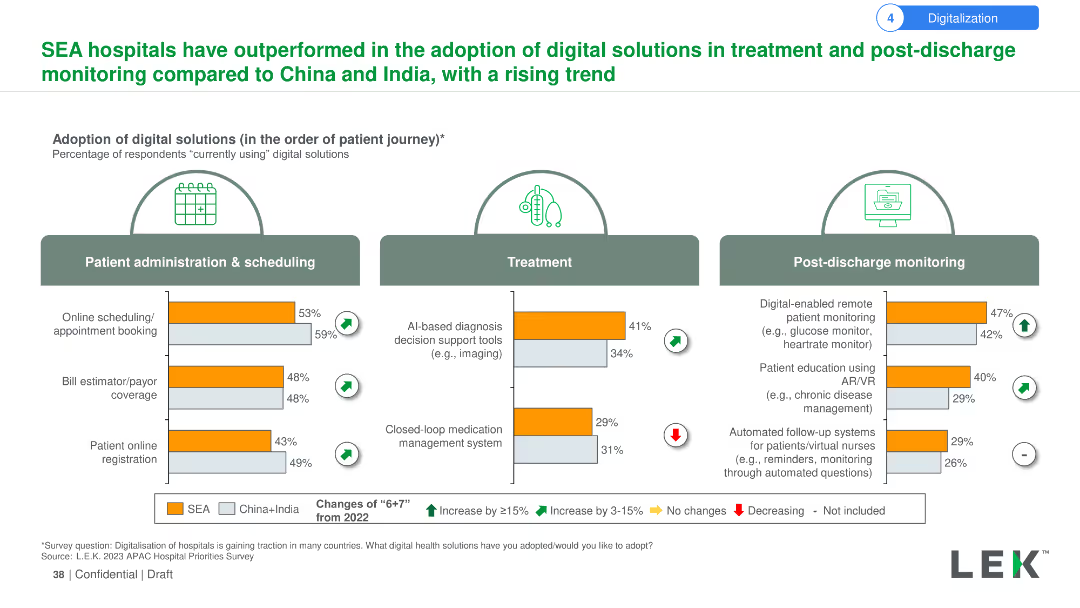
The slide uses column charts to show the adoption rates of digital solutions in patient administration, treatment, and post-discharge monitoring among hospitals in SEA compared to China and India. Indicators show the changes from 2022 in adoption rates.
Market Analysis and Trends
Healthcare & Pharmaceuticals
The slide highlights SEA hospitals' superior adoption rates of digital solutions in patient administration, treatment, and post-discharge monitoring compared to China and India. It also indicates the percentage changes from 2022 in these areas.
Digital solutions, adoption, SEA, hospitals, patient administration, treatment, post-discharge, China, India, comparison
false
Market Analysis and Trends
Healthcare & Pharmaceuticals
Multiple Chart
LEK
Add to my slides
Remove from favorites
This slide features graphics showing digital solutions like e-wallet and self-setup for collections, with icons and diagrams that illustrate the flow of operations and processes.
Operational Efficiency
Financial Services
Describes solutions to improve Limpa Nome's collection process, including e-wallet integrations and self-setup modules to expedite and streamline operations.
Digital solutions, e-wallet, finance
false
Operational Efficiency
Financial Services
Linear Flow
Barclays
Add to my slides
Remove from favorites
Column chart detailing the adoption of digital solutions in patient administration, treatment, and post-discharge monitoring in SEA hospitals.
Technology and Digital Transformation
Healthcare & Pharmaceuticals
This slide highlights the higher adoption of digital solutions in SEA hospitals for patient management, treatment, and post-discharge monitoring.
Digital solutions, SEA hospitals, patient management, treatment, monitoring
false
Technology and Digital Transformation
Healthcare & Pharmaceuticals
Multiple Chart
LEK
Add to my slides
Remove from favorites
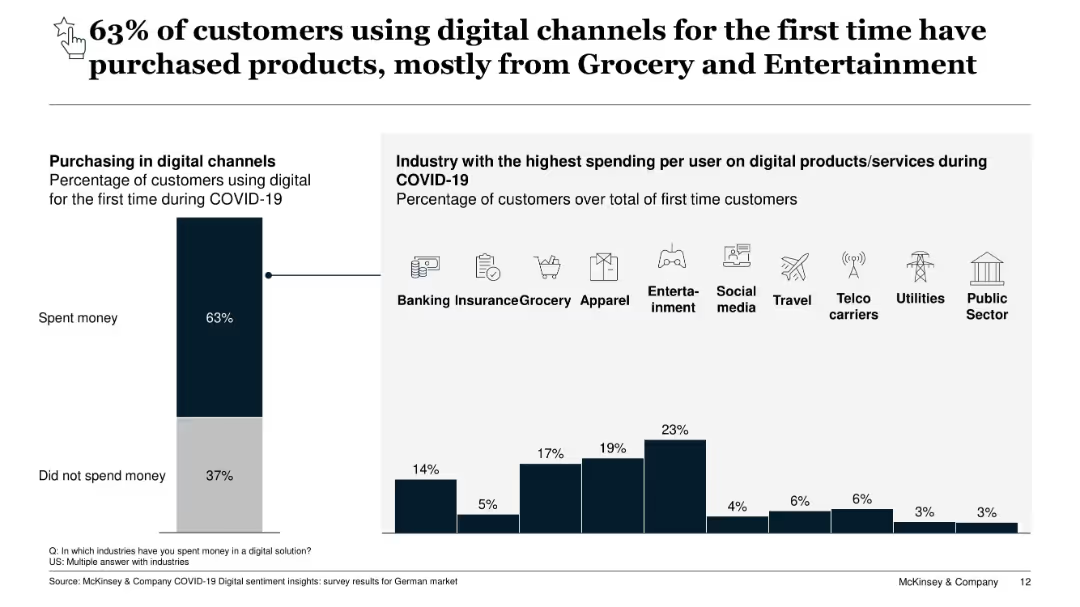
Vertical bar charts showing % of first-time digital spenders and highest spending industries; clean white layout
Market Analysis and Trends
Technology & Software
The slide reports that 63% of customers used digital channels for the first time during COVID-19 to make purchases, with Entertainment and Grocery leading in spending. A simple graph illustrates digital spending trends by industry, identifying where first-time engagement was most monetized.
digital spending, first-time users, e-commerce, COVID-19, entertainment, grocery, customer acquisition, industry breakdown, McKinsey
false
Market Analysis and Trends
Technology & Software
Single Chart
McKinsey
Add to my slides
Remove from favorites
Minimalist title slide with large, bold text and a colorful background. Includes the logos of BCG and Google.
Market Analysis and Trends
Retail & E-commerce
This title slide indicates a report or presentation on digital consumer spending in India, signaling a significant market opportunity.
Digital Spending, India, Market Opportunity, Consumer Behavior, E-commerce, Technology, Investment, Trend Analysis
false
Market Analysis and Trends
Retail & E-commerce
Title
BCG
Add to my slides
Remove from favorites
The slide presents a side-by-side comparison of digital spending across various sectors, represented through colored horizontal bars, contrasting online spenders among internet users in India, China, and the US.
Market Analysis and Trends
Financial Services
It compares the percentage of internet users engaging in digital spending across different sectors such as e-commerce, travel & hotel, and financial services in three countries, highlighting the evolution of digital consumer behavior.
Digital spending, internet users, e-commerce, travel, financial services
false
Market Analysis and Trends
Financial Services
Single Chart
BCG
Add to my slides
Remove from favorites
Slide with bullet points and icons, contrasting implications for different stakeholders in the digital ecosystem.
Strategic Planning
Technology & Software
Addresses the roles and adjustments necessary for various players in the digital transformation landscape.
digital, stakeholders, transformation, policy, investors, digital natives
false
Strategic Planning
Technology & Software
Header Vertical
Bain
Add to my slides
Remove from favorites
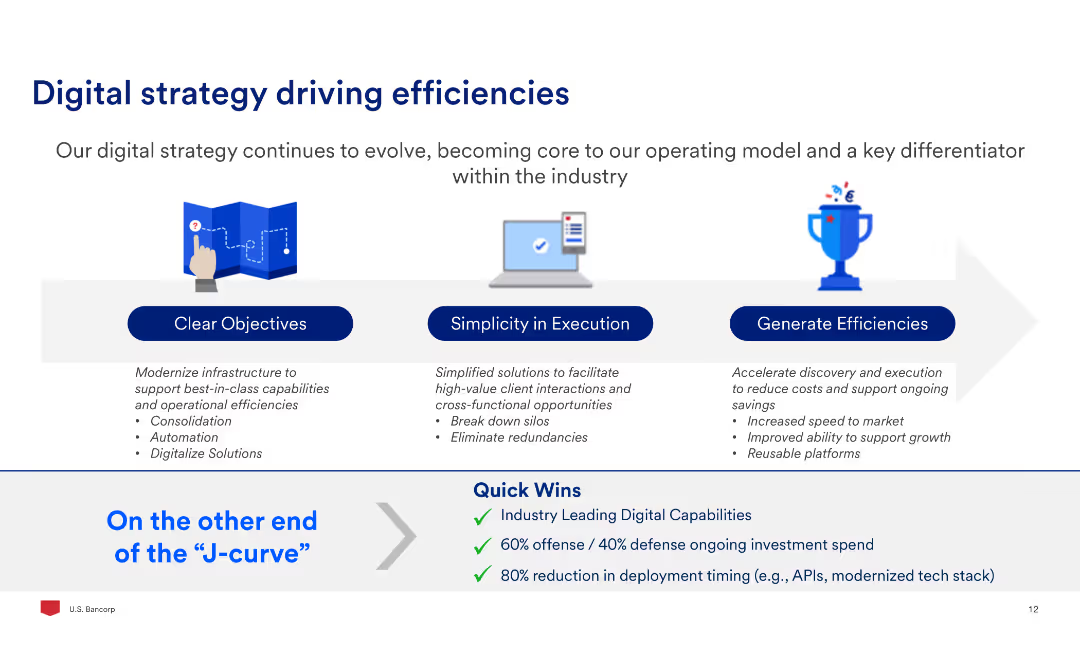
The slide features a process flow with three main sections: Clear Objectives, Simplicity in Execution, and Generate Efficiencies, supported by a list of key actions and quick wins.
Strategic Planning
Financial Services
The slide outlines the digital strategy focusing on modernizing infrastructure, simplifying execution, and generating efficiencies, highlighting the key actions and expected quick wins.
Digital, Strategy, Efficiency, Execution, Objectives, Planning
false
Strategic Planning
Financial Services
Pillar
Barclays
Add to my slides
Remove from favorites
This slide features a simple color-coded design to showcase digital imperative achievements by different countries. Each country is represented with a flag, followed by bullet points outlining key initiatives and progress in digital infrastructure, talent, and other areas. There are no complex graphics, just organized, concise text descriptions.
Industry Overview
Technology & Software
It outlines key digital strategy achievements of various countries, like Thailand's network strategy and Estonia's e-governance. Each section lists specific initiatives, reflecting on how these countries are advancing their digital infrastructures and capabilities, investing in talent, and integrating ICT into education systems to keep pace with global technological imperatives.
Digital Strategy, Global, Thailand, Australia, Estonia, Malaysia, Singapore, South Korea, ICT, Education, Infrastructure, Talent
false
Industry Overview
Technology & Software
Header Vertical
Kearney
Add to my slides
Remove from favorites
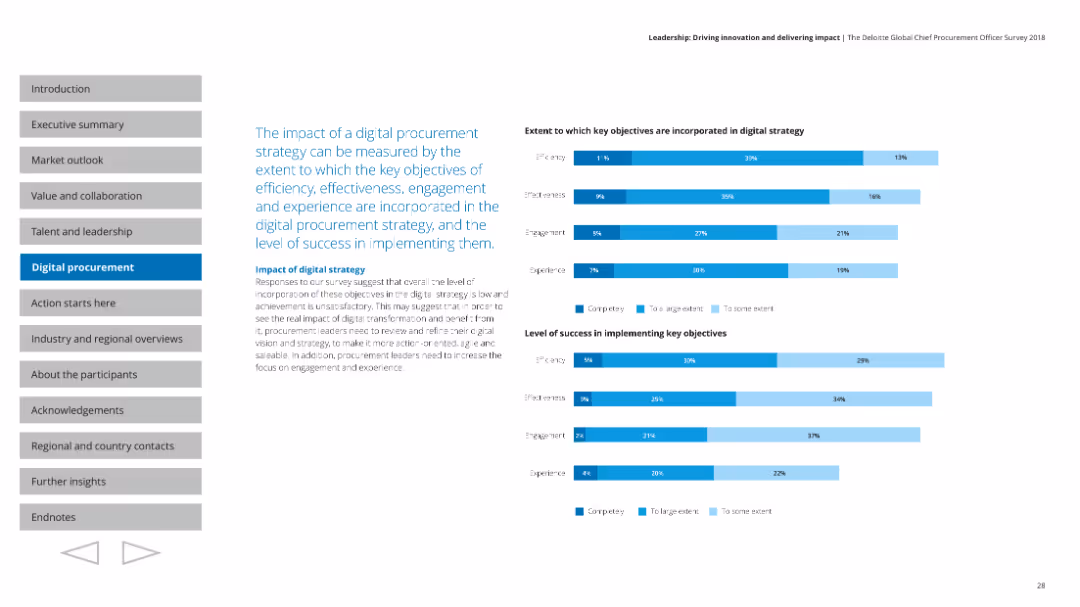
Features multiple column charts showing the extent to which key objectives are incorporated into digital strategy and the success level of implementation.
Technology and Digital Transformation
Professional Services
Measures the impact of digital procurement strategy, covering efficiency, effectiveness, engagement, and experience in implementation success.
Digital strategy, impact, objectives, efficiency, success
false
Technology and Digital Transformation
Professional Services
Multiple Chart
Deloitte
Add to my slides
Remove from favorites
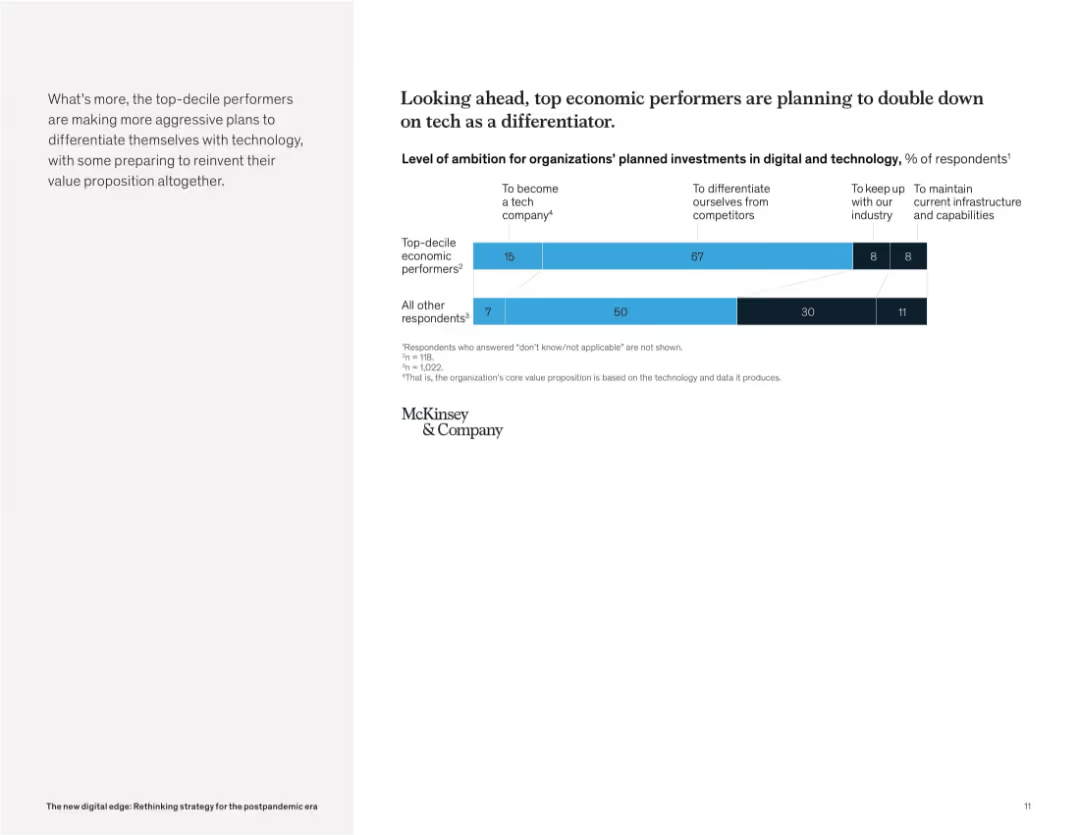
Clean layout with bar chart on the right and narrative paragraph on the left. Categories show ambition levels for tech investment.
Strategic Planning
Technology & Software
This slide reveals that top-performing companies are more likely to pursue aggressive technology strategies. The majority aim to differentiate themselves with tech or even become tech companies, unlike others who prioritize infrastructure maintenance.
digital strategy, tech differentiation, future investment, ambition, business transformation, technology leaders, innovation, McKinsey
false
Strategic Planning
Technology & Software
Mixed Chart
McKinsey
Add to my slides
Remove from favorites
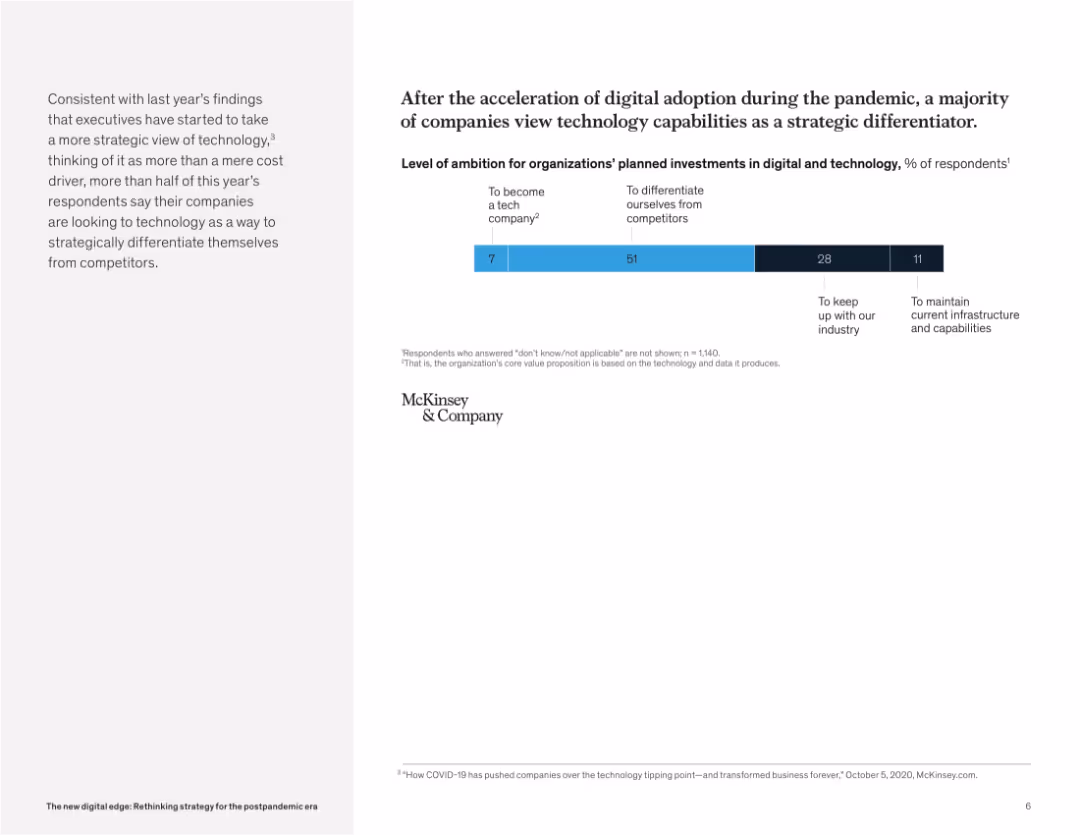
Horizontal bar chart layout showing organizations' digital investment ambitions. Accompanied by explanatory text to the left.
Technology and Digital Transformation
Technology & Software
The slide illustrates that over half of organizations aim to use digital investments to strategically differentiate from competitors. A minority aim to become full tech companies, highlighting diverse strategic intents for tech post-pandemic.
digital strategy, tech investment, competitive differentiation, transformation goals, technology ambition, post-pandemic planning
false
Technology and Digital Transformation
Technology & Software
Mixed Chart
McKinsey
Add to my slides
Remove from favorites
Features a bar chart showing the percentage of users subscribing to various digital services, with video and music streaming being the most popular.
Market Analysis and Trends
Media & Entertainment
Evaluates the market penetration of different digital subscription types, highlighting the niche status of several despite the dominance of streaming.
digital subscriptions, market analysis, streaming services, niche markets, consumer trends
false
Market Analysis and Trends
Media & Entertainment
Single Chart
Deloitte
Add to my slides
Remove from favorites
A clear org chart is presented for different HR teams, highlighting a separate team for digital talents, accompanied by benefits on the right.
Human Resources and Talent Management
Technology & Software
Suggests a specialized HR team for managing digital talent in large firms, outlining benefits of such an approach.
digital talent, HR, management, recruitment, interview, performance
false
Human Resources and Talent Management
Technology & Software
Diagram
Kearney
Add to my slides
Remove from favorites
A two-axis graph distinguishes between technical and non-technical skills, with role titles plotted along the spectrum. The background is split between dark blue and white.
Human Resources and Talent Management
Technology & Software
This slide analyzes the skill spectrum for digital talent, highlighting the scarcity in roles that balance technical and soft skills, for HR and recruitment planning.
digital talent, skill spectrum, technical skills, soft skills, talent scarcity, recruitment planning
false
Human Resources and Talent Management
Technology & Software
Text Only
Kearney
Add to my slides
Remove from favorites
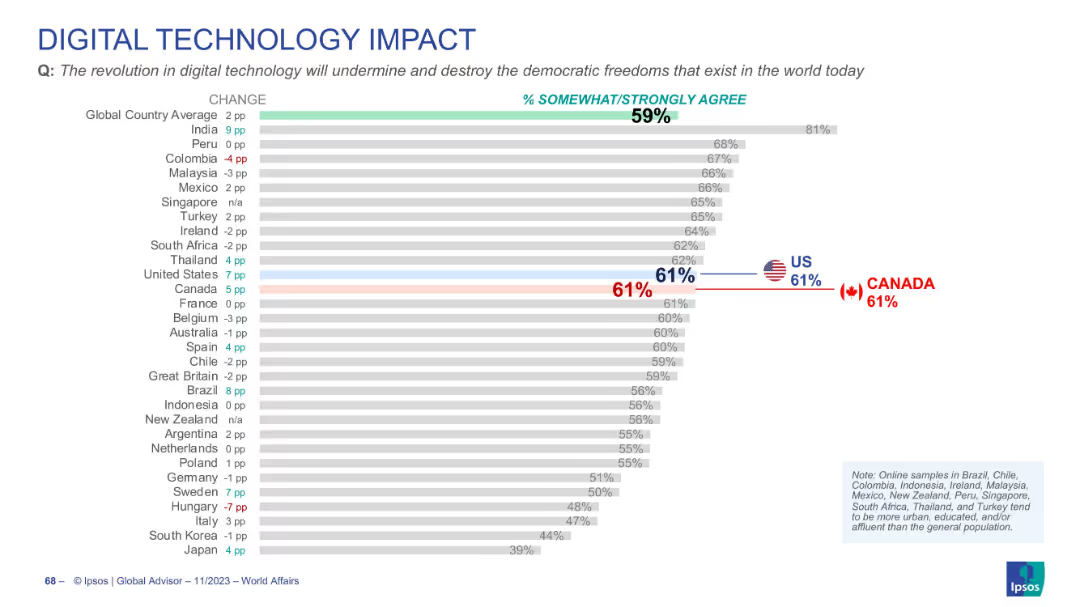
Similar bar chart format with % change and agreement levels; US and Canada marked in color; minimalistic icons and layout.
Risk Assessment and Management
Technology & Software
Survey responses indicating agreement that digital technology may undermine democratic freedoms. Global average is 59%, with the US and Canada both at 61%. The chart captures trends and shifts in public concern over digital governance.
digital tech, democracy, freedom, global opinion, risk, survey, Ipsos
false
Risk Assessment and Management
Technology & Software
Single Chart
IPSOS
Add to my slides
Remove from favorites
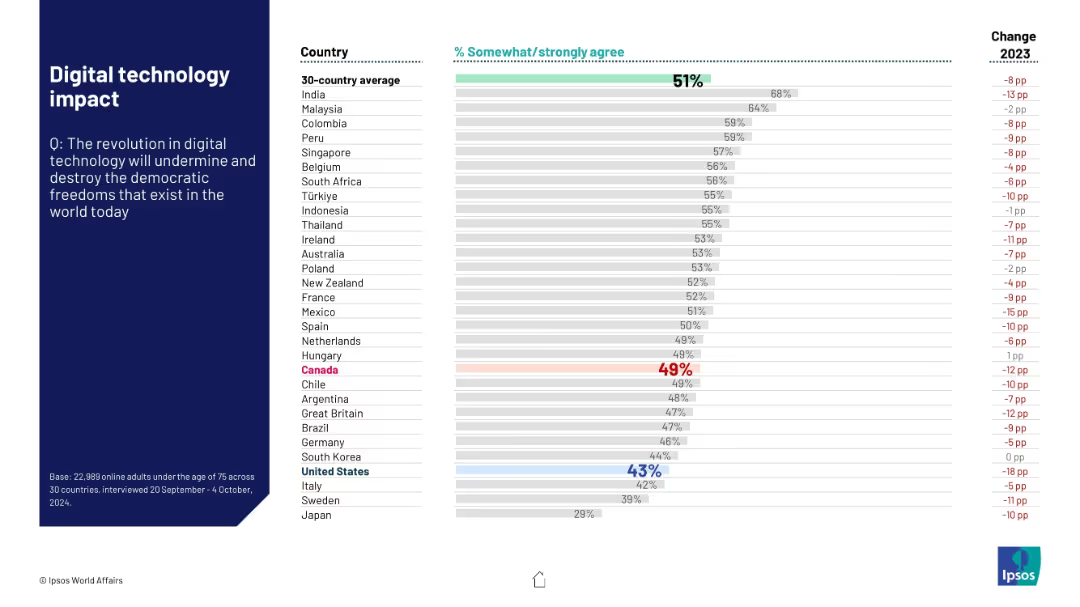
Horizontal bar chart showing concern that digital tech undermines democratic freedoms, with country rankings and trend changes since 2023.
Risk Assessment and Management
Technology & Software
This slide ranks countries by agreement that digital technology threatens democracy. The global average is 51%. Canada, U.S., and Sweden are among the least concerned, while India and Malaysia express the highest concern.
digital technology, democracy, surveillance, global opinion, freedom
false
Risk Assessment and Management
Technology & Software
Mixed Chart
IPSOS
Add to my slides
Remove from favorites
Pie chart contrasts the views of companies on digital technology as disruptive versus sustaining.
Technology and Digital Transformation
Technology & Software
Assesses how companies perceive the impact of digital technology on their business models.
digital technology, disruption, business model, digital impact, sustaining
false
Technology and Digital Transformation
Technology & Software
Single Chart
BCG
Add to my slides
Remove from favorites
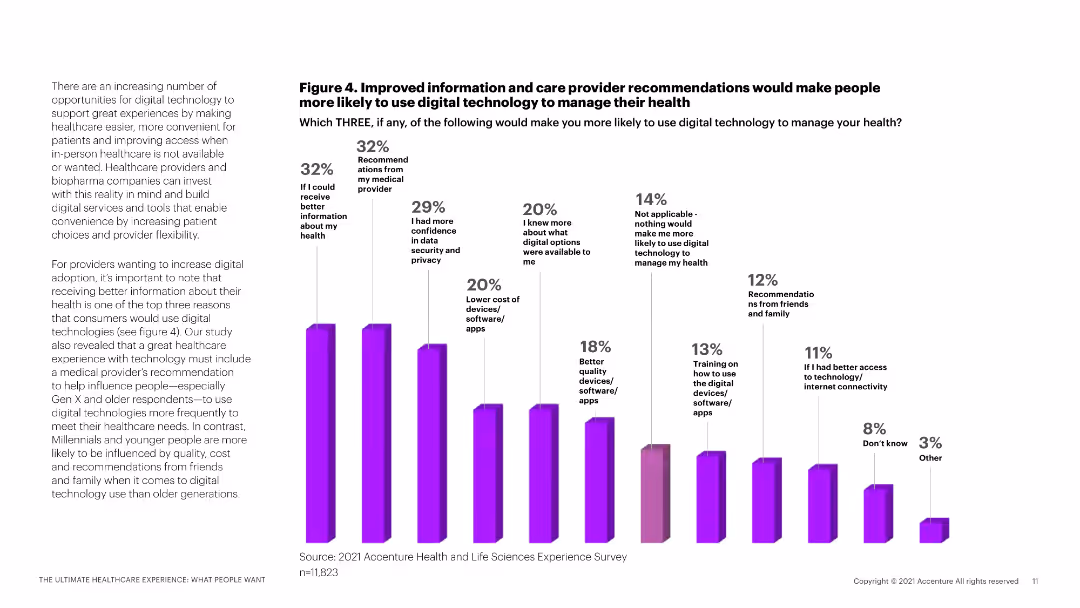
A column chart detailing factors that would encourage the use of digital health technologies, with accompanying text on the left.
Market Analysis and Trends
Healthcare & Pharmaceuticals
This slide explores the factors that would increase the likelihood of patients using digital health technologies to manage their health.
digital technology, healthcare management, patient recommendations, data security, provider recommendations
false
Market Analysis and Trends
Healthcare & Pharmaceuticals
Mixed Chart
Accenture
Add to my slides
Remove from favorites
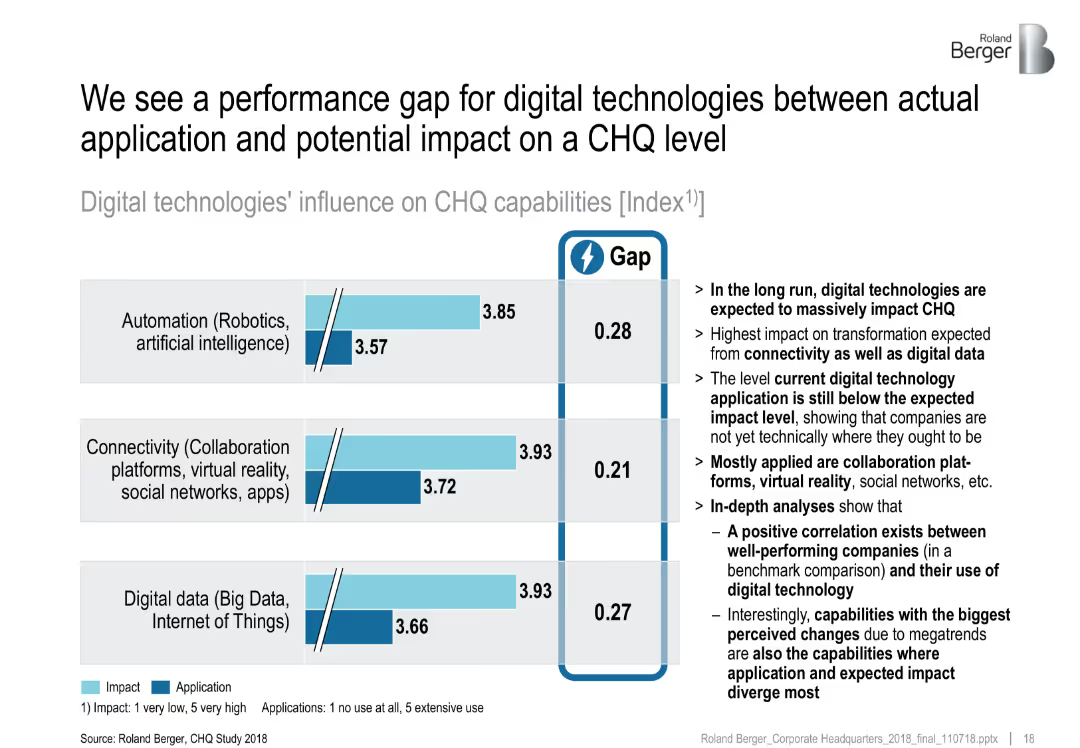
Bar chart comparing potential impact vs. current application for three tech areas; includes "gap" highlight
Performance Metrics and KPIs
Technology & Software
This slide illustrates a gap between the expected impact and actual application of digital technologies (automation, connectivity, and data) in CHQ. Despite high potential, current usage lags, signaling unrealized value.
digital technology, performance gap, automation, connectivity, CHQ impact
false
Performance Metrics and KPIs
Technology & Software
Mixed Chart
Roland Berger
Add to my slides
Remove from favorites
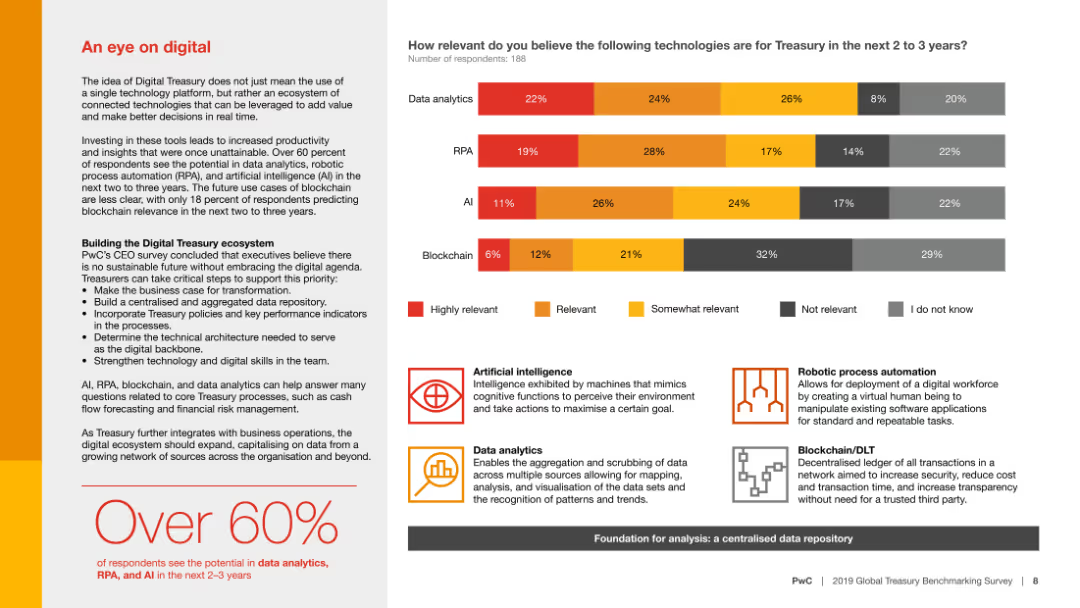
Column chart showing relevance of technologies like data analytics, RPA, AI, and blockchain for treasury in the next 2-3 years, with detailed descriptions for each technology.
Technology and Digital Transformation
Financial Services
The slide discusses the potential impact of various digital technologies on treasury operations, emphasizing the importance of data analytics, RPA, and AI over the next few years.
Digital technology, treasury, data analytics, RPA, AI
false
Technology and Digital Transformation
Financial Services
Mixed Chart
PwC/Strategy&
Add to my slides
Remove from favorites
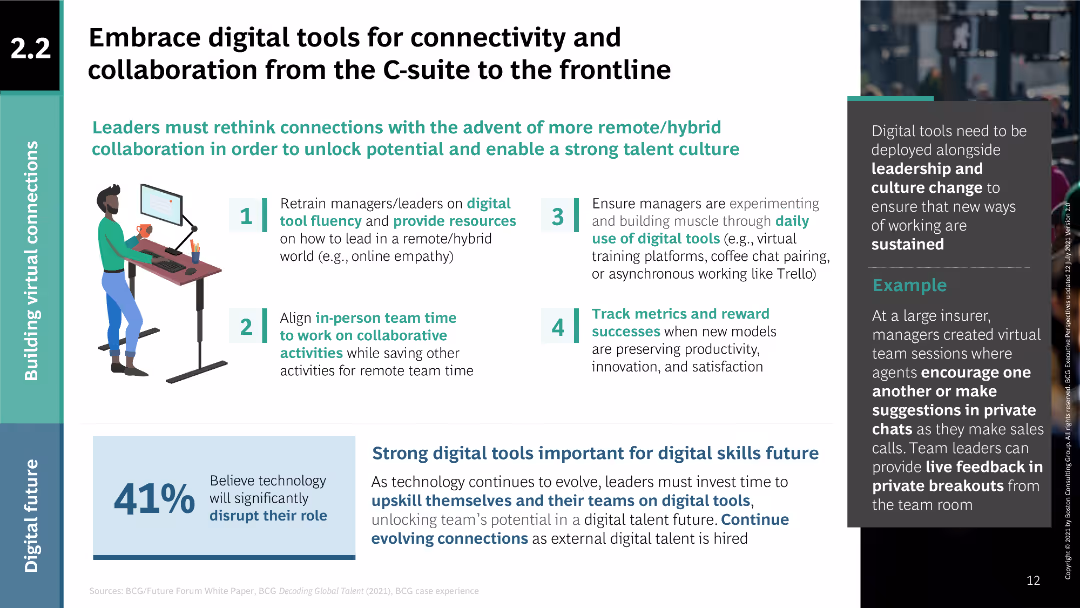
Diagram with four steps for leveraging digital tools; text discussing their importance for connectivity and collaboration.
Technology and Digital Transformation
Technology & Software
Promotes the use of digital tools to enhance connectivity and collaboration within organizations, from leadership to frontline workers, especially in remote/hybrid settings.
digital tools, connectivity, collaboration, remote work, hybrid work, leadership, team management, digital transformation
false
Technology and Digital Transformation
Technology & Software
Vertical Flow
BCG
Add to my slides
Remove from favorites
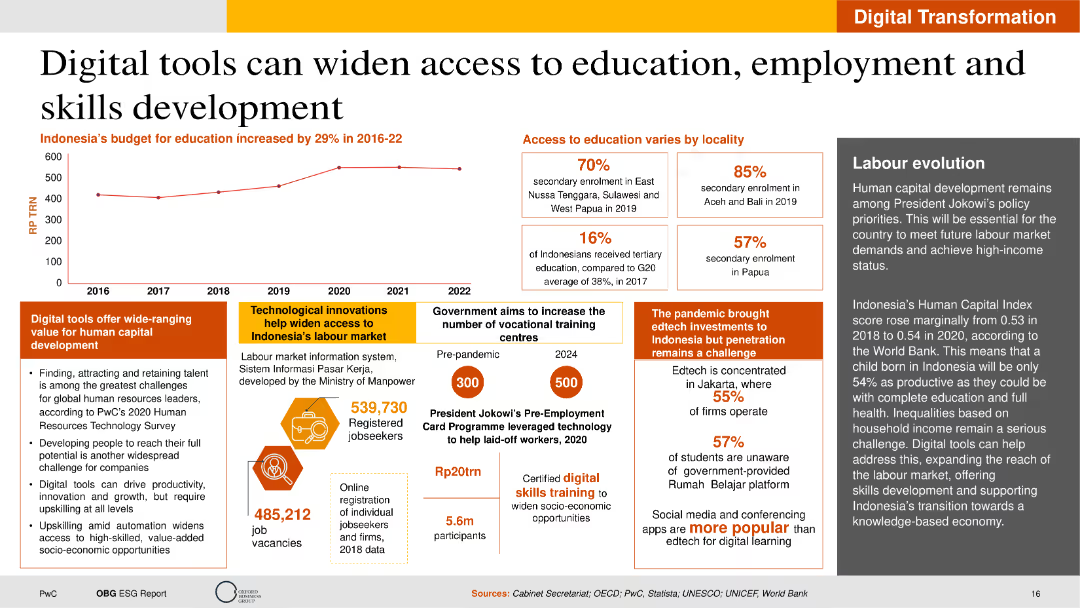
The slide includes text on digital tools, a line chart of education budget, and statistics on education access. The layout is structured to highlight key points with clear sections and supportive visual elements.
Technology and Digital Transformation
Education & Training
This slide highlights how digital tools can improve access to education and employment in Indonesia. It discusses technological innovations, government initiatives, and the impact of digital learning on human capital development.
Digital Tools, Education, Employment, Indonesia, Innovation
false
Technology and Digital Transformation
Education & Training
Mixed Chart
PwC/Strategy&
Add to my slides
Remove from favorites
Dominated by two sets of bar graphs, one for front-end and the other for back-end digital tools, the slide visually contrasts the anticipated increases in usage. It is color-coded in blue and beige, with a white background that aids readability.
Technology and Digital Transformation
Financial Services
This slide indicates the expected growth in the use of digital tools among merchants, focusing on marketing, website services, analytics, and various operational software. The information is crucial for those involved in technology strategy and digital transformation efforts within the financial services industry, highlighting the shift towards more technologically integrated operations.
Digital Tools, Merchants, Transformation, Marketing, Analytics, Operation Software, Growth, Technology Strategy, Financial Services, Integration
false
Technology and Digital Transformation
Financial Services
Mixed Chart
Bain
Add to my slides
Remove from favorites
Mix of text, data in a table and takeaway boxes showing statistics on digital adoption by advisors.
Operational Efficiency
Financial Services
Discusses how digital tools can enhance the productivity and capabilities of financial advisors.
digital tools, productivity, advisors, capabilities, financial services
false
Operational Efficiency
Financial Services
Table
Deloitte
Add to my slides
Remove from favorites
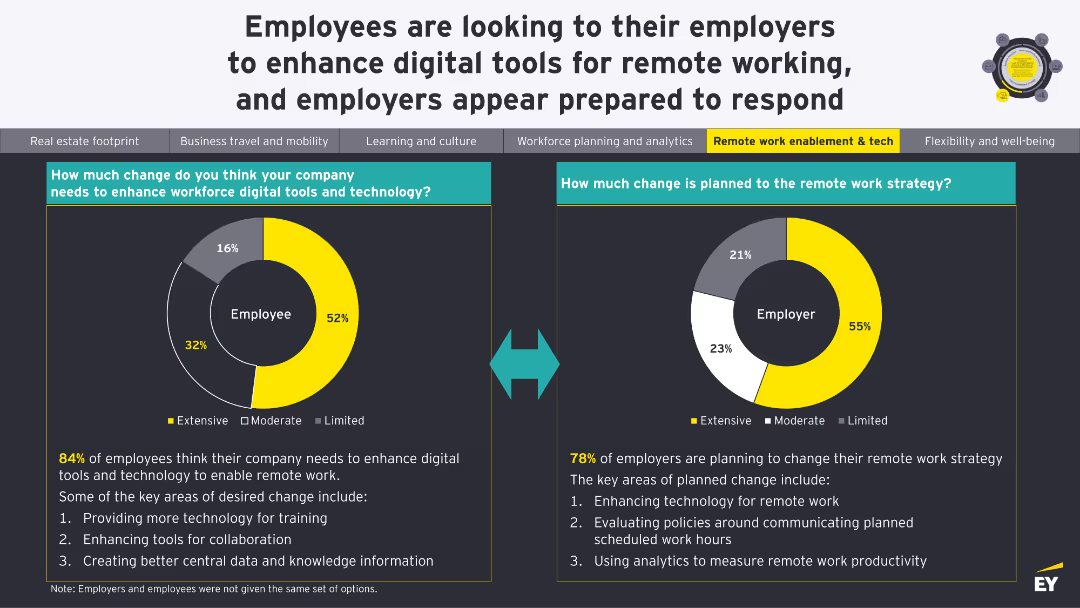
Two donut charts showing the extent of change needed in workforce digital tools and planned changes to remote work strategy.
Technology and Digital Transformation
Technology & Software
The slide compares the perceived need for digital tools among employees with the changes employers are planning for remote work strategies, highlighting key areas for enhancement.
Digital Tools, Remote Work, Change Management, Strategy, Technology
false
Technology and Digital Transformation
Technology & Software
Multiple Chart
EY
Add to my slides
Remove from favorites
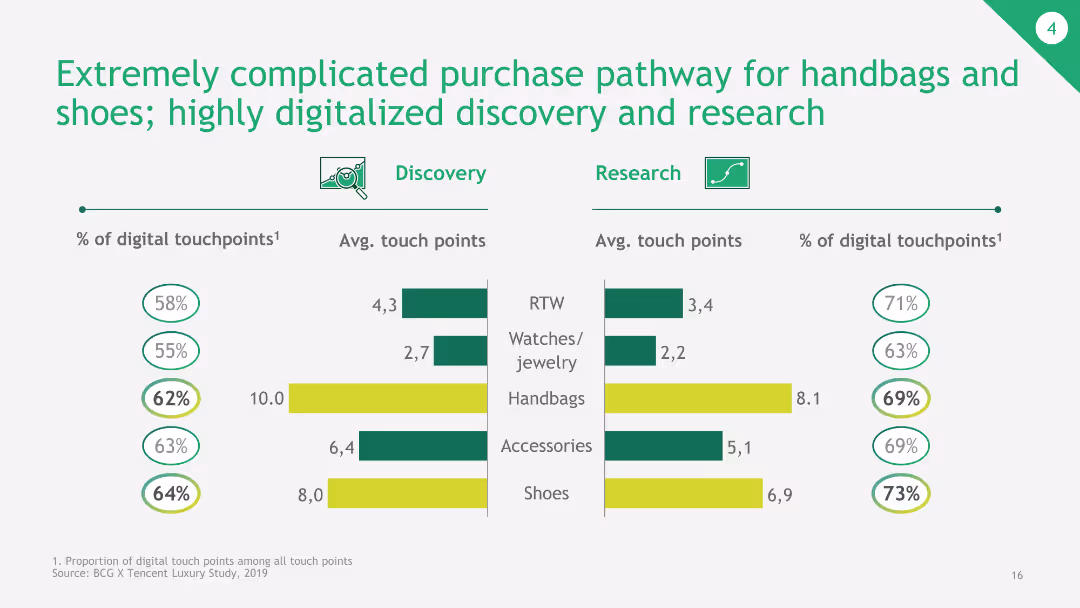
The slide features a column chart comparing discovery and research touchpoints for various product categories. Each bar represents average touch points and percentage of digital touchpoints.
Market Analysis and Trends
Retail & E-commerce
The slide shows the digital touchpoints and average touch points for discovery and research of various product categories like RTW, watches/jewelry, handbags, accessories, and shoes.
digital touchpoints, discovery, research, handbags, shoes
false
Market Analysis and Trends
Retail & E-commerce
Multiple Chart
BCG
Add to my slides
Remove from favorites
The slide presents layered blocks in gradient colors representing strategic interventions across different types of shoppers to drive growth in digital transactions.
Strategic Planning
Retail & E-commerce
This slide outlines strategic actions for digital transaction growth, targeting non-buyers, occasional, and frequent shoppers with tailored approaches such as simplification, attractive propositions, and loyalty incentives.
Digital transactions, growth strategies, e-commerce
false
Strategic Planning
Retail & E-commerce
Pillar
BCG
Add to my slides
Remove from favorites
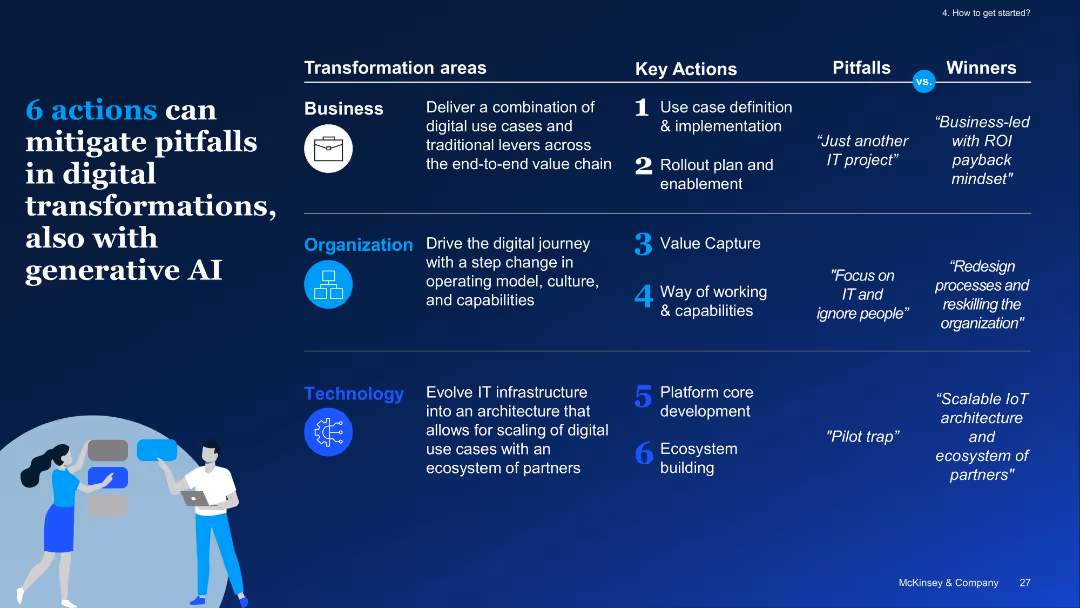
Tabular layout with transformation areas (Business, Organization, Technology), actions, pitfalls, and outcomes
Technology and Digital Transformation
Artificial Intelligence
The slide proposes six strategic actions across business, organization, and technology to mitigate transformation pitfalls. It includes examples of common issues (e.g., “pilot trap”) and how winners succeed using GenAI and digital tools effectively.
digital transformation, AI actions, pitfalls, winners, IT architecture, rollout, strategy
false
Technology and Digital Transformation
Artificial Intelligence
Vertical Flow
McKinsey
Add to my slides
Remove from favorites
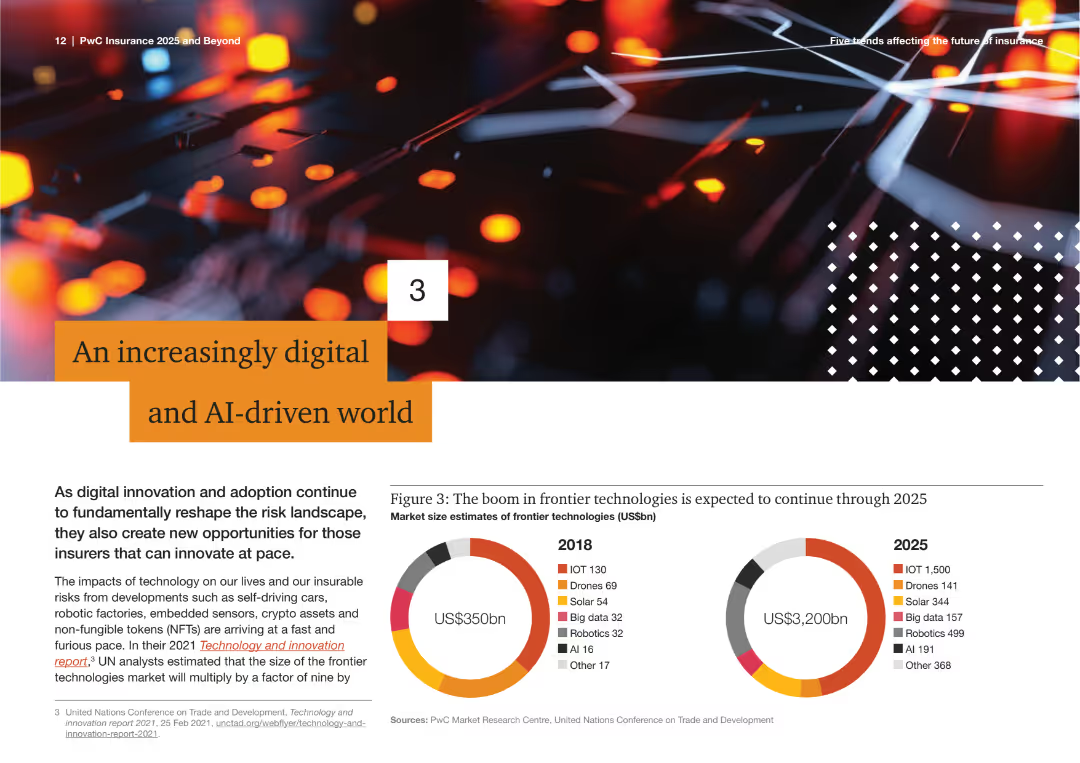
The slide shows a visually appealing graphic with a pie chart comparing market size estimates for frontier technologies in 2018 and 2025, including IoT, drones, solar, big data, robotics, AI, and other technologies.
Technology and Digital Transformation
Technology & Software
This slide discusses the rapid growth of digital and AI technologies, highlighting market size estimates for various frontier technologies from 2018 to 2025. It emphasizes the transformative impact of these technologies on the industry.
Digital Transformation, AI, Technology Growth, Market Size, Frontier Technologies, IoT, Drones, Robotics, Big Data, Solar
false
Technology and Digital Transformation
Technology & Software
Multiple Chart
PwC/Strategy&
Add to my slides
Remove from favorites
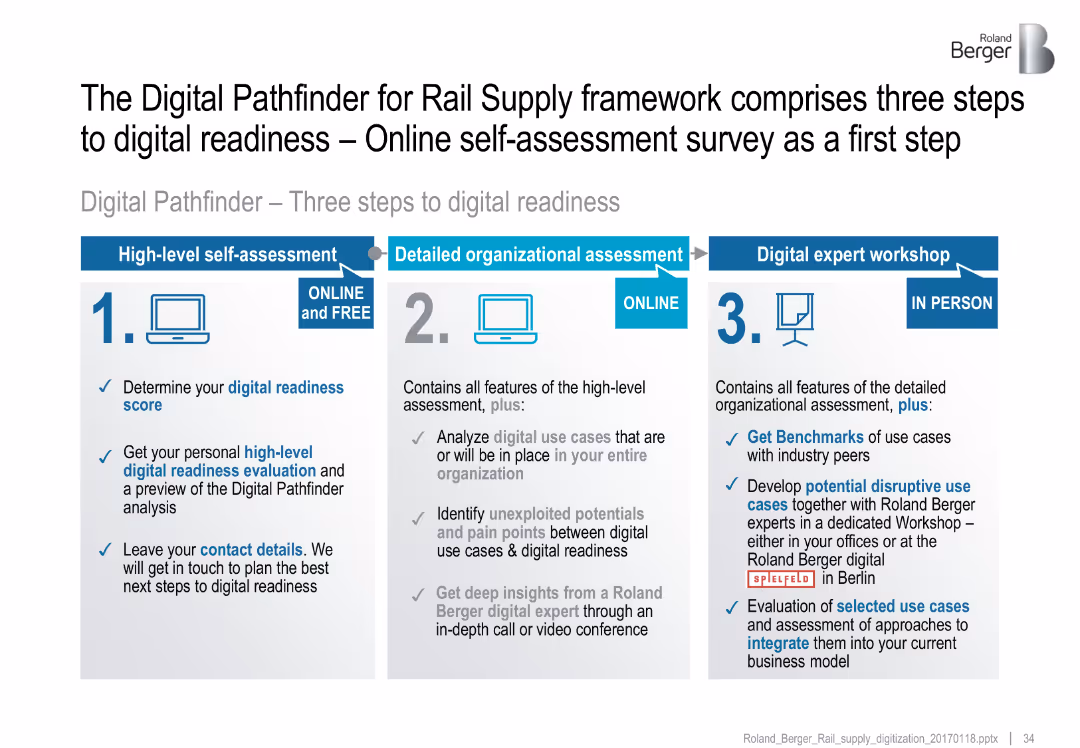
Three-column process flow; each column explains a step in the assessment from self-check to workshop
Technology and Digital Transformation
Transportation & Logistics
Outlines a three-step framework for assessing digital readiness in rail: self-assessment, organizational review, and expert workshop with benchmarks and disruptive use case planning.
digital transformation, assessment, Pathfinder, benchmarking, disruptive use cases
false
Technology and Digital Transformation
Transportation & Logistics
Linear Flow
Roland Berger
Add to my slides
Remove from favorites
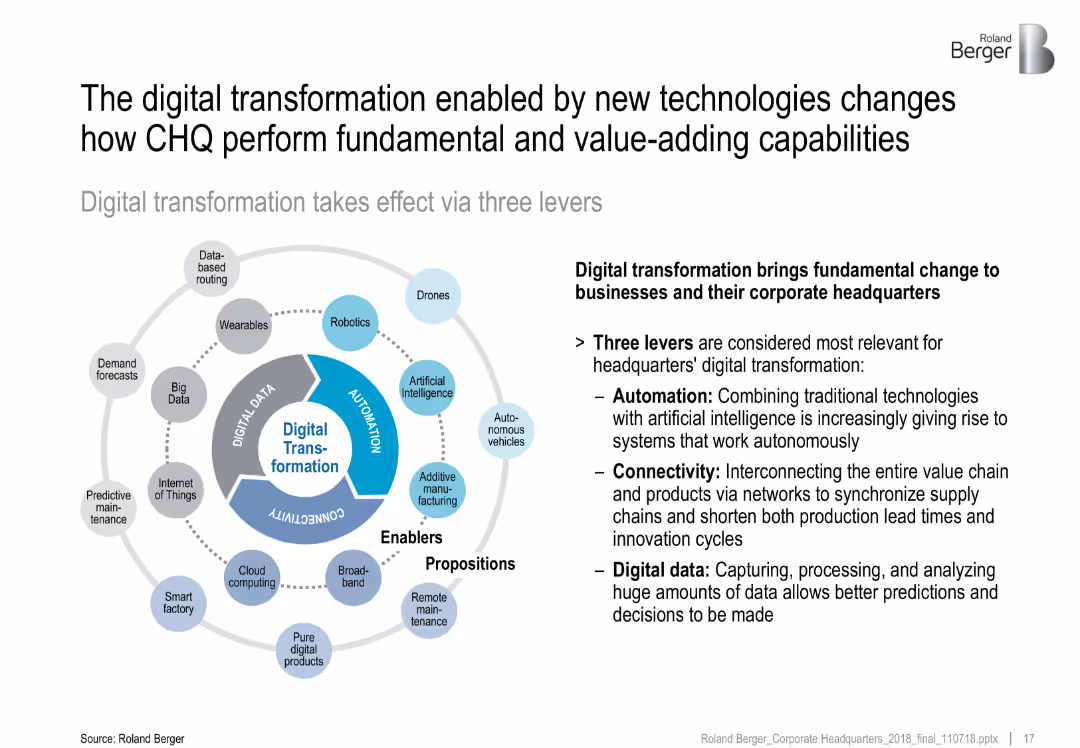
Circular infographic divided into three levers—Automation, Connectivity, Digital Data; surrounding icons represent technologies
Technology and Digital Transformation
Technology & Software
This slide explains the three levers of digital transformation—Automation, Connectivity, and Digital Data—that reshape CHQ functions. It highlights enabling technologies like AI, IoT, and cloud computing as drivers of efficiency, decision-making, and interconnectivity.
digital transformation, automation, connectivity, data, AI, IoT, CHQ
false
Technology and Digital Transformation
Technology & Software
Diagram
Roland Berger
Add to my slides
Remove from favorites
Pie chart and quotes illustrate the shift in digital transformation sponsorship from CIO/CTO to business leadership.
Strategic Planning
Technology & Software
Discusses the evolving role of business leadership in driving digital transformation, moving away from traditional IT-led models.
digital transformation, business leadership, CIO, CTO, sponsorship
false
Strategic Planning
Technology & Software
Mixed Chart
BCG
Add to my slides
Remove from favorites
The slide has a detailed table with three main categories: Business, Organization, and Technology, each with several subcategories and sample use cases.
Technology and Digital Transformation
Industrial & Manufacturing
The slide details various areas in which steel companies are scaling digital transformations, including revenue growth, cost reduction, and data infrastructure.
digital transformation, Business, Organization, Technology, steel
false
Technology and Digital Transformation
Industrial & Manufacturing
Multiple Chart
McKinsey
Add to my slides
Remove from favorites
Slide features purple and blue sections, icons for operational excellence, customer differentiation, and IT agility.
Technology and Digital Transformation
Technology & Software
Discusses how new technologies like GenAI enhance CSPs' ability to accelerate their tech transformation and gain a competitive edge, making them more likely to invest in updating their IT capabilities.
digital transformation, competitive advantage, GenAI, CSPs, IT investment
false
Technology and Digital Transformation
Technology & Software
Header Vertical
Accenture
Add to my slides
Remove from favorites
This slide includes text and a column chart on the right. The chart highlights the top constraints to digital transformation, with a percentage breakdown.
Technology and Digital Transformation
Financial Services
It discusses major constraints faced by banks in accelerating digital transformation, including scale of change, limited budgets, and technology challenges.
Digital transformation, constraints, scale of change, budgets, technology
false
Technology and Digital Transformation
Financial Services
Mixed Chart
EY
Add to my slides
Remove from favorites
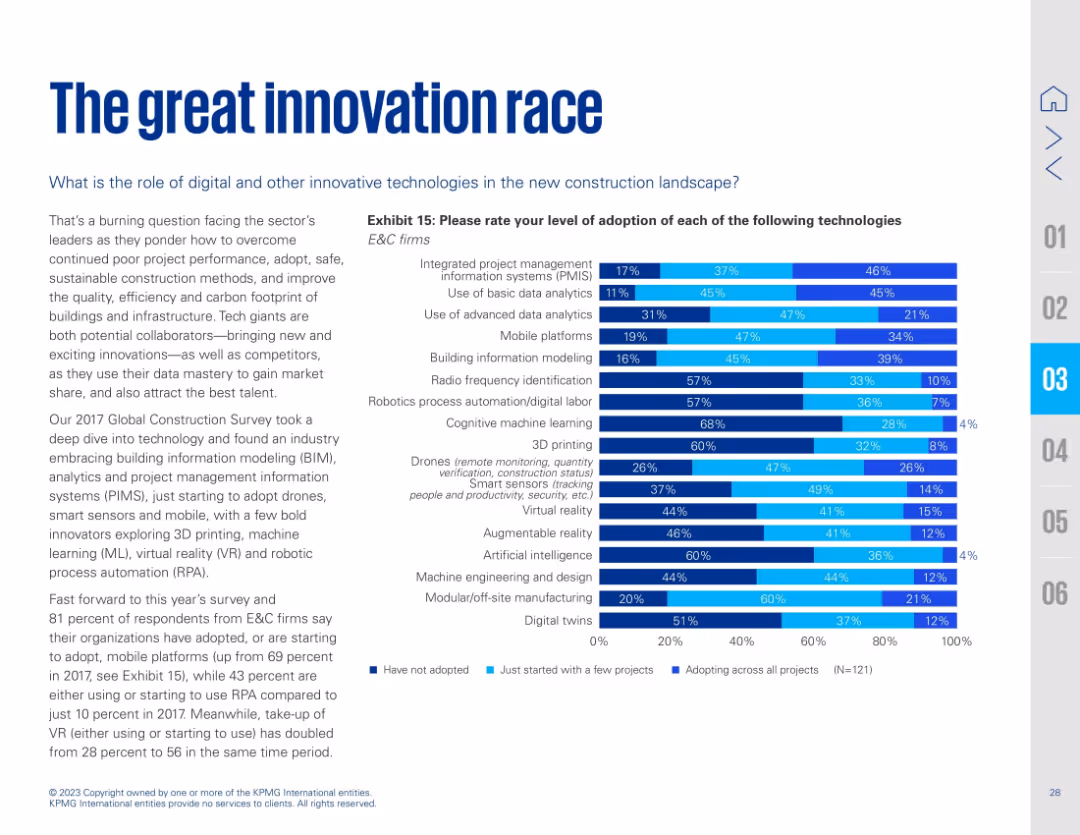
Bold blue title with introductory paragraph on left; large stacked bar chart (Exhibit 15) on right showing adoption of 15 digital technologies in E&C. Blue gradient indicates stages of adoption.
Technology and Digital Transformation
Technology & Software
This slide analyzes adoption rates of digital technologies in the E&C sector. It reveals significant growth in mobile platforms, VR, and robotics, with many firms now standardizing use of PMIS, analytics, and AI. The narrative frames innovation as a competitive advantage and necessity to overcome persistent industry challenges like inefficiency and sustainability.
digital transformation, construction tech, innovation, BIM, VR, robotics, AI, PMIS, analytics, E&C
false
Technology and Digital Transformation
Technology & Software
Mixed Chart
KPMG
Add to my slides
Remove from favorites
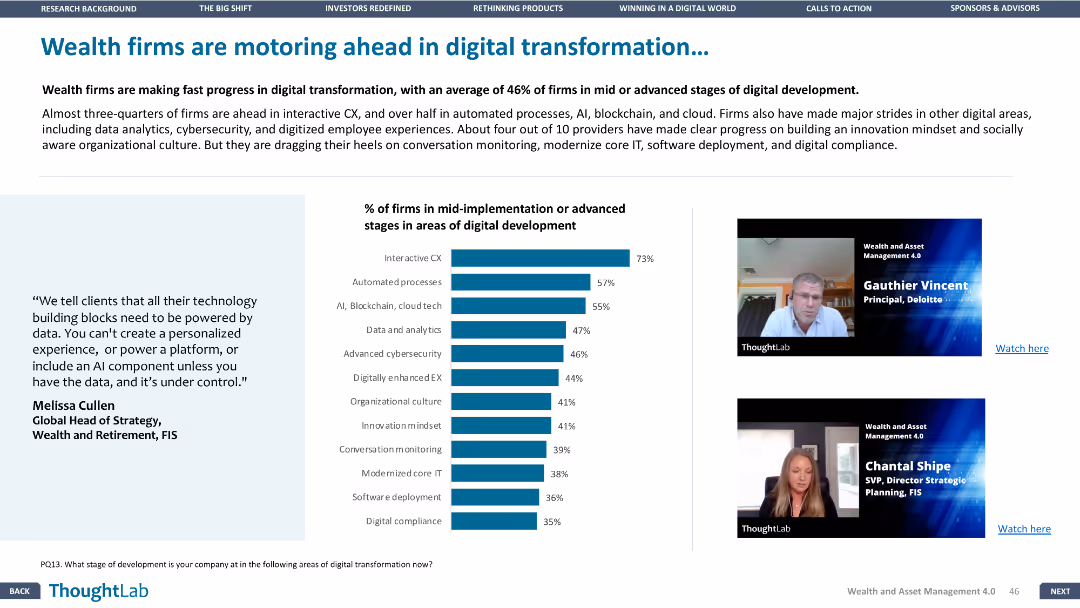
The slide includes a column chart and images of two speakers. The layout is moderately dense, with a focus on visual elements.
Technology and Digital Transformation
Financial Services
The slide details the progress of wealth firms in digital transformation, highlighting areas such as interactive customer experience, automated processes, and data analytics.
Digital transformation, customer experience, automation, analytics, wealth firms
false
Technology and Digital Transformation
Financial Services
Mixed Chart
Deloitte
Add to my slides
Remove from favorites
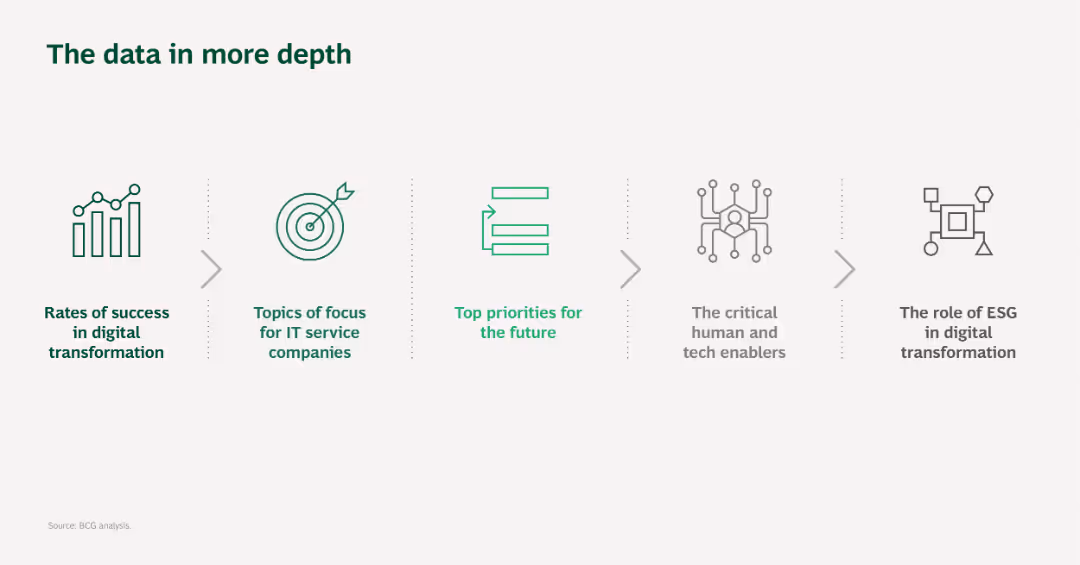
Simple layout with five icons representing different aspects of digital transformation data analysis.
Market Analysis and Trends
Telecommunications
This slide provides an overview of the topics covered in the presentation, including digital transformation success rates, IT service focus areas, and future priorities.
Digital transformation, Data analysis, IT services, Priorities, Topics overview
false
Market Analysis and Trends
Telecommunications
Pillar
BCG
Add to my slides
Remove from favorites
Includes a radial diagram and small charts, with detailed annotations regarding the potential value of digital initiatives in the electricity industry.
Technology and Digital Transformation
Energy & Utilities
Explores potential digital initiatives for the electricity industry, emphasizing their impact over the next decade on the industry and society.
digital transformation, electricity industry, future initiatives, societal impact, technology benefits, industry value
false
Technology and Digital Transformation
Energy & Utilities
Mixed Chart
Accenture
Add to my slides
Remove from favorites
Title, three columns each titled "Employment", "Sustainability", "Trust", icons, bullet points, and a clickable white paper download link.
Market Analysis and Trends
Environmental Services & Sustainability
Discusses the societal impacts of digital transformation focusing on employment, sustainability, and trust issues, highlighting both positive and negative outcomes.
digital transformation, employment, sustainability, trust, societal impacts
false
Market Analysis and Trends
Environmental Services & Sustainability
Pillar
Accenture
Add to my slides
Remove from favorites
The slide features a line chart tracking the shift from non-digital to digital in the E&M industry from 2015 to 2024. Digital revenue is represented in red, showing a steep upward trend, while non-digital revenue in yellow flattens, indicating stagnation. Annotations highlight pivotal changes.
Market Analysis and Trends
Media & Entertainment
Focuses on the digital transformation in the E&M sector, illustrating how digital revenue is poised to make up a significant portion of total E&M revenue by 2020. This slide is typically used to discuss strategic adaptations to digital growth, emphasizing investment opportunities and the declining relevance of traditional media formats.
digital transformation, E&M, revenue, trend
false
Market Analysis and Trends
Media & Entertainment
Mixed Chart
PwC/Strategy&
Add to my slides
Remove from favorites
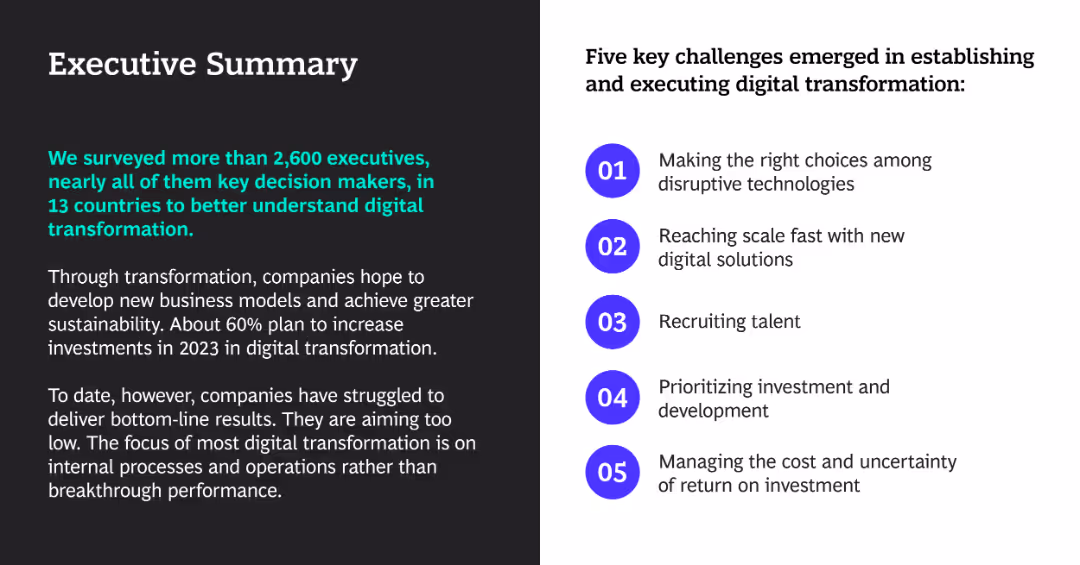
The slide is divided into two sections: a summary in text on the left and key challenges listed with icons on the right.
Strategic Planning
Professional Services
The slide summarizes a survey of executives on digital transformation and outlines five key challenges in implementation.
digital transformation, executives, challenges, summary, survey
false
Strategic Planning
Professional Services
Boxed
BCG
Add to my slides
Remove from favorites
This slide presents column charts comparing time allocation in finance tasks with desired changes due to digital transformation.
Technology and Digital Transformation
Financial Services
Discusses the gap between current and desired states in finance due to digital transformation challenges, emphasizing the need for improvement in support and efficiency.
digital transformation, finance challenges, time allocation, efficiency improvement, support needs
false
Technology and Digital Transformation
Financial Services
Multiple Chart
Deloitte
Add to my slides
Remove from favorites
Contains multiple pie charts with percentages illustrating common pitfalls in deploying digital finance transformations, such as task-focused approaches and fragmented processes.
Risk Assessment and Management
Financial Services
Addresses the challenges and common pitfalls that financial departments face when scaling digital transformation efforts, with statistics on failure rates and issues encountered.
digital transformation, finance, scaling, deployment, common pitfalls, fragmented processes, task-focused, statistics
false
Risk Assessment and Management
Financial Services
Mixed Chart
Deloitte
Add to my slides
Remove from favorites
A column chart compare time allocation between 'Current' and 'Future' across five categories: Transactional Processing, Close & Consolidate, Reporting & Analysis, Corporate Advisory. Highlighted shifts in time allocation are marked.
Operational Efficiency
Financial Services
Explores the expected shift in time resource allocation within finance teams due to digital transformation, emphasizing more strategic activities and less manual transactional work.
digital transformation, finance, time allocation, strategic activities, manual work, efficiency, future planning, resource management
false
Operational Efficiency
Financial Services
Single Chart
Deloitte
Add to my slides
Remove from favorites
Contains multiple year comparisons in column charts for the attractiveness of France for digital transformation investments, supplemented by industry opinions.
Technology and Digital Transformation
Technology & Software
Assesses France's evolving attractiveness for digital transformation projects from a multi-year perspective, highlighting governmental and infrastructural impacts.
digital transformation, France, investment attractiveness, technology, government
false
Technology and Digital Transformation
Technology & Software
Mixed Chart
Bain
Add to my slides
Remove from favorites
Features comparative bar graphs with annotations, indicating growth over time, using contrasting colors for clarity.
Market Analysis and Trends
Retail & E-commerce
Highlights the rapid growth of internet and smartphone users in India, suggesting a digitally transforming market. Important for digital strategy discussions.
Digital Transformation, India, Internet Users, Smartphone Adoption, Growth Analysis, Market Development, Technology Trends
true
Market Analysis and Trends
Retail & E-commerce
Multiple Chart
BCG
Add to my slides
Remove from favorites
Bar chart displaying the percentage of respondents by industry feeling an increased urgency for digital transformation due to COVID-19.
Market Analysis and Trends
Technology & Software
Provides a comparative analysis of how various industries perceive the urgency of digital transformation amidst the pandemic. Useful for strategic planning across sectors.
digital transformation, industries, COVID-19, urgency, strategy
false
Market Analysis and Trends
Technology & Software
Single Chart
BCG
Add to my slides
Remove from favorites
The slide features a detailed table with additional small bar charts and icons, representing different industries like Consumer, Automotive, and Energy. It includes textual content and a summary area.
Industry Overview
Technology & Software
This slide presents the potential value digital transformation could unlock across various industries by 2025, estimating the societal and industry-specific financial impacts, with additional insights on CO2 emissions reduction and job implications.
digital transformation, industry impact, CO2 emissions, job creation, financial analysis
true
Industry Overview
Technology & Software
Single Chart
Accenture
Add to my slides
Remove from favorites
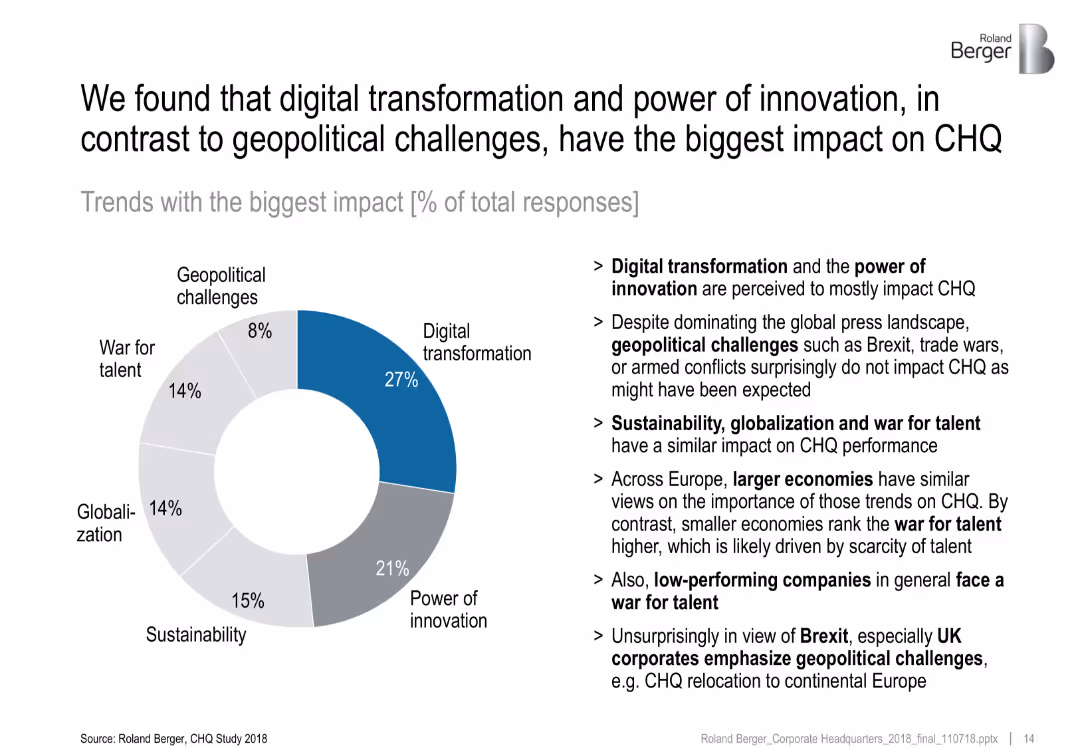
Donut chart with percentage shares of six megatrends; bullet points on the right provide insights
Market Analysis and Trends
Professional Services
This slide reveals survey results on which megatrends most impact CHQ. Digital transformation (27%) and innovation (21%) are dominant, while geopolitical issues score lowest (8%). Text insights interpret regional differences and performance-level correlations.
digital transformation, innovation, impact analysis, geopolitics, survey, CHQ
false
Market Analysis and Trends
Professional Services
Mixed Chart
Roland Berger
Add to my slides
Remove from favorites
Features a column chart showing areas for investment to support digital transformation in France, alongside a response impact chart regarding potential business development and job creation.
Technology and Digital Transformation
Technology & Software
Explores potential areas for French investment to aid digital transformation, highlighting business environment enhancements and support for entrepreneurship.
digital transformation, investment areas, France, business environment, job creation
false
Technology and Digital Transformation
Technology & Software
Multiple Chart
Bain
Add to my slides
Remove from favorites
Consists of textual analysis with pie charts reflecting survey data on modernization impact.
Strategic Planning
Financial Services
Discusses the advantages of digital transformation in investment firms and their future competitiveness.
digital transformation, investment, competitiveness, strategy, financial services
false
Strategic Planning
Financial Services
Mixed Chart
Deloitte
Add to my slides
Remove from favorites
The slide features a column chart with different colored sections representing the number of digital transformation projects. Another set of graphical rockets with different colors represents expected impacts of digital investments.
Market Analysis and Trends
Technology & Software
The slide examines how many digital transformation projects organizations have embarked on during the pandemic and the expected impacts of these investments.
digital transformation, investment, local market, projects, pandemic
false
Market Analysis and Trends
Technology & Software
Multiple Chart
EY
Add to my slides
Remove from favorites
Slide juxtaposes text blocks with graphics depicting digital tools and statistical data, highlighting the digital transformation in banking services.
Technology and Digital Transformation
Financial Services
Showcases the improvements in Barclays' digital delivery systems, such as enhancements to the iPortal and increased self-service capabilities, with a future focus on further integration and automation for operational efficiency.
digital transformation, iPortal, self-service, automation
false
Technology and Digital Transformation
Financial Services
Linear Flow
Barclays
Add to my slides
Remove from favorites
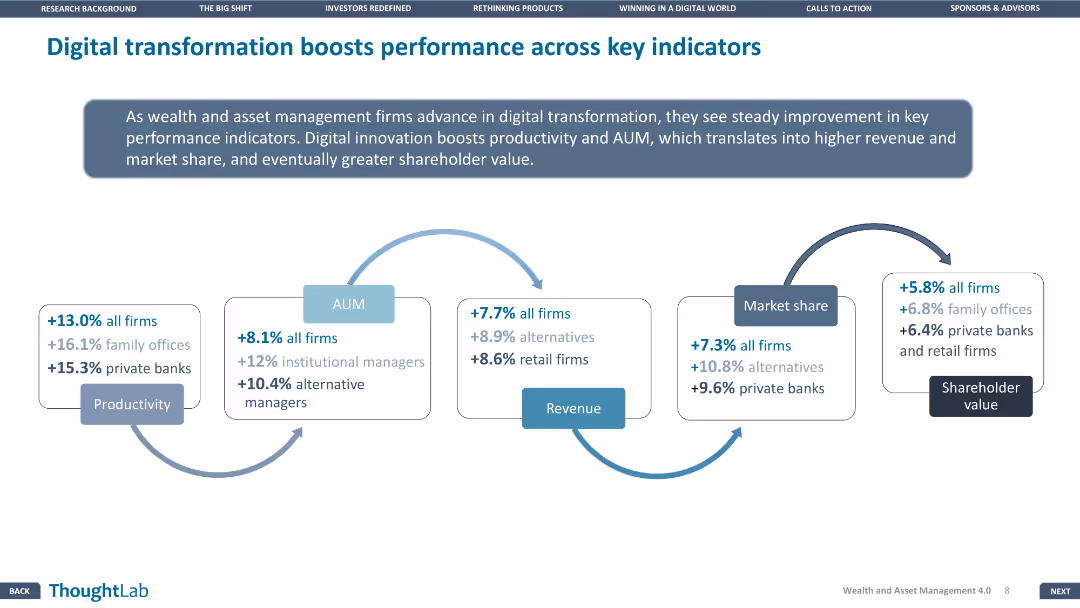
The slide uses a flow diagram to show the positive impact of digital transformation on key performance indicators like productivity, AUM, revenue, market share, and shareholder value.
Operational Efficiency
Financial Services
The slide demonstrates how digital transformation enhances performance in wealth and asset management through various key indicators.
Digital transformation, Key indicators, Financial Services, Performance, Productivity
false
Operational Efficiency
Financial Services
Linear Flow
Deloitte
Add to my slides
Remove from favorites
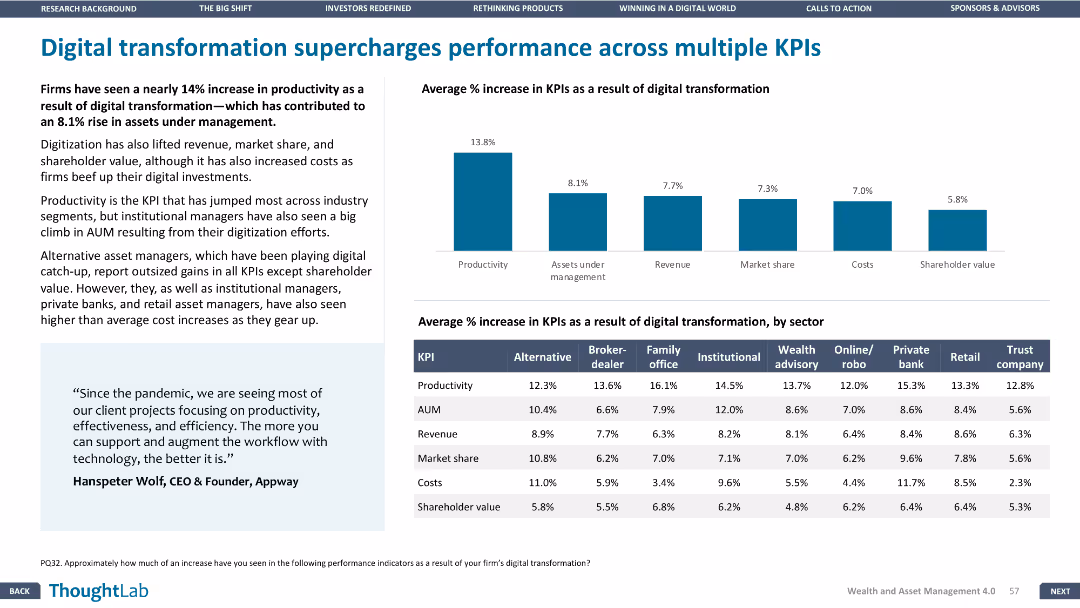
Column chart depicting average percentage increase in KPIs due to digital transformation across various sectors.
Performance Metrics and KPIs
Financial Services
Shows the impact of digital transformation on productivity, AUM, revenue, market share, costs, and shareholder value.
Digital, transformation, KPIs, performance, productivity
false
Performance Metrics and KPIs
Financial Services
Multiple Chart
Deloitte
Add to my slides
Remove from favorites
Features bar charts detailing the frequency of monitoring and reporting structures for digital transformation efforts.
Strategic Planning
Technology & Software
Highlights the significant role of executive leadership, especially CEOs, in overseeing digital transformation efforts.
digital transformation, leadership, CEO involvement, monitoring, reporting
false
Strategic Planning
Technology & Software
Multiple Chart
BCG
Add to my slides
Remove from favorites
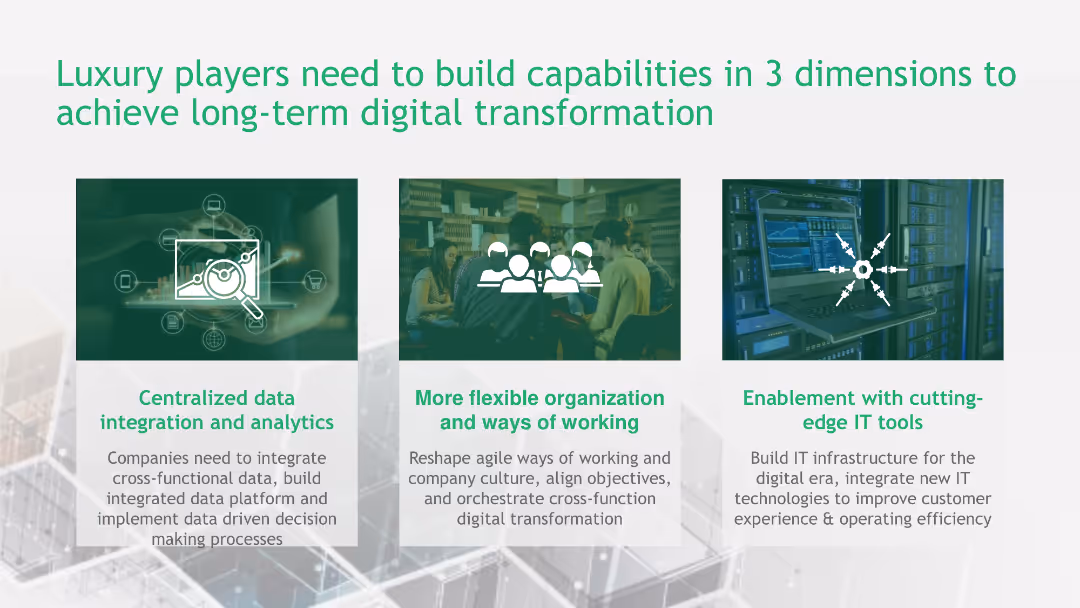
The slide presents a three-part framework for digital transformation in the luxury sector, covering data integration, organizational flexibility, and cutting-edge IT tools.
Technology and Digital Transformation
Consumer Goods
This slide outlines three essential capabilities luxury brands need for digital transformation: centralized data integration, organizational flexibility, and adoption of advanced IT tools.
digital transformation, luxury sector, data integration, organizational flexibility, IT tools
false
Technology and Digital Transformation
Consumer Goods
Pillar
BCG
Add to my slides
Remove from favorites
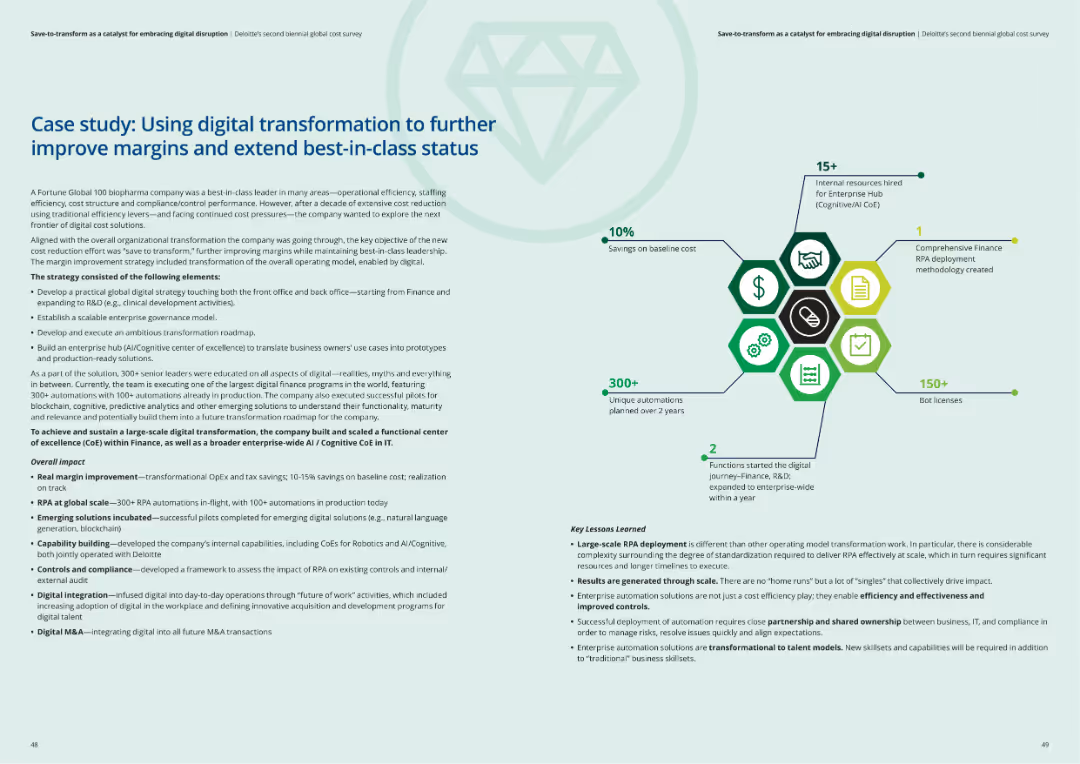
The slide uses a light blue background and a structured layout for presenting a case study. It includes icons representing various aspects of digital transformation and key metrics like savings and RPA deployments.
Technology and Digital Transformation
Healthcare & Pharmaceuticals
This case study highlights how a biopharma company used digital transformation to improve operational efficiency and margin improvement. It details the strategy, implementation, and key outcomes like savings and automation achievements.
digital transformation, margin improvement, biopharma, operational efficiency, RPA deployment
false
Technology and Digital Transformation
Healthcare & Pharmaceuticals
Diagram
Deloitte
Add to my slides
Remove from favorites
Slide shows multiple column charts with stages of digital transformation across two time points (last year and current), annotated with percentages.
Strategic Planning
Professional Services
Provides a snapshot of digital marketing transformation progress within companies, comparing past and present levels of integration.
digital transformation, marketing strategy, integration levels, progress tracking, bar chart
false
Strategic Planning
Professional Services
Multiple Chart
Deloitte
Add to my slides
Remove from favorites
Features screenshots of the 'Chase MyHome' app, lists its benefits, and has icons emphasizing the digital features. It has a blue and white color scheme with some green text for highlighting.
Operational Efficiency
Financial Services
Details the digital transformation of the mortgage process through the 'Chase MyHome' app, highlighting its transparency, connectivity, and convenience, and its impact on customer satisfaction and operational efficiency.
digital transformation, mortgage, app, customer experience, operational efficiency
false
Operational Efficiency
Financial Services
Header Horizontal
JP Morgan
Add to my slides
Remove from favorites
The slide features text on the left and a column chart on the right showing the rate of tech adoption before and during the pandemic.
Technology and Digital Transformation
Technology & Software
This slide discusses how the pandemic accelerated digital transformation, comparing the adoption rates of various technologies between two survey years.
digital transformation, pandemic, tech adoption, technology trends, survey data
false
Technology and Digital Transformation
Technology & Software
Mixed Chart
Accenture
Add to my slides
Remove from favorites
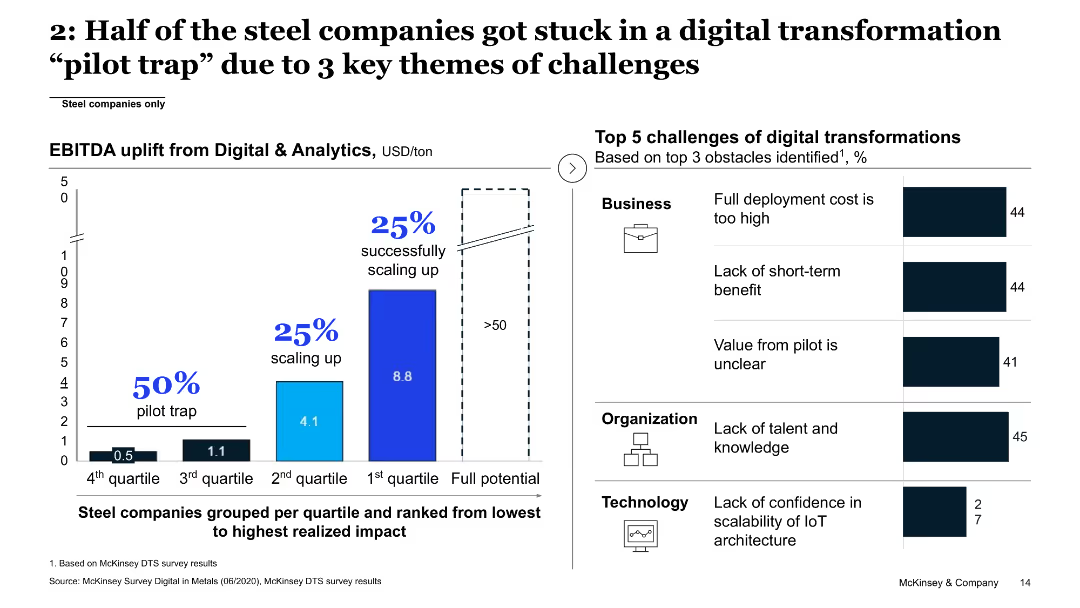
This slide features a column chart on the left showing EBITDA uplift from Digital & Analytics, and a list of top 5 challenges on the right.
Operational Efficiency
Industrial & Manufacturing
The slide explains how steel companies face challenges in digital transformation, highlighting issues in business, organization, and technology.
digital transformation, pilot trap, EBITDA, challenges, steel industry
false
Operational Efficiency
Industrial & Manufacturing
Pillar
McKinsey
Add to my slides
Remove from favorites
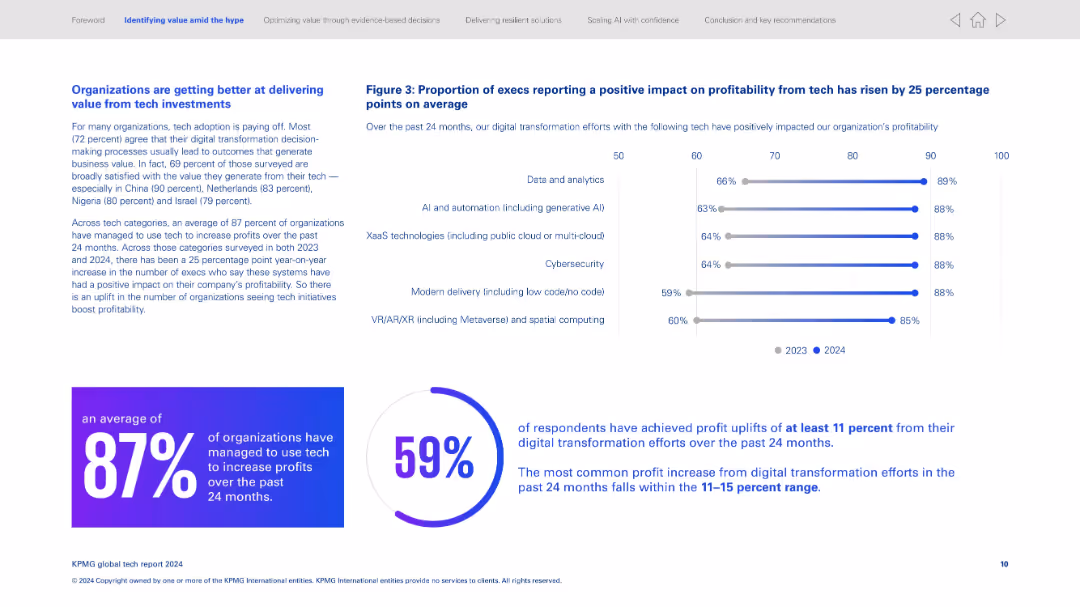
Split layout; left side has text-heavy content, right side has horizontal bar graph; bottom features two percentage callouts in circular design.
Strategic Planning
Technology & Software
Highlights how organizations are increasingly generating value from tech investments, especially digital transformation. Key statistics show 87% of organizations increased profits through tech, and 59% saw profit uplifts of at least 11%. The graph shows improved profitability across various tech domains from 2023 to 2024.
Digital transformation, profitability, AI adoption, data analytics, tech ROI, global survey, tech satisfaction, percentage uplift, cloud tech, VR/AR
false
Strategic Planning
Technology & Software
Multiple Chart
KPMG
Add to my slides
Remove from favorites
Contains a distinct title, text blocks, and a segmented illustration showing "Industry Impact" and "Societal Impact".
Regulatory and Compliance
Government & Public Sector
Details a framework for public-private collaboration to harness digital transformation's potential, aimed at realizing an estimated $100 trillion in value over the next decade.
digital transformation, public-private collaboration, societal impact, industry impact
false
Regulatory and Compliance
Government & Public Sector
Diagram
Accenture
Add to my slides
Remove from favorites
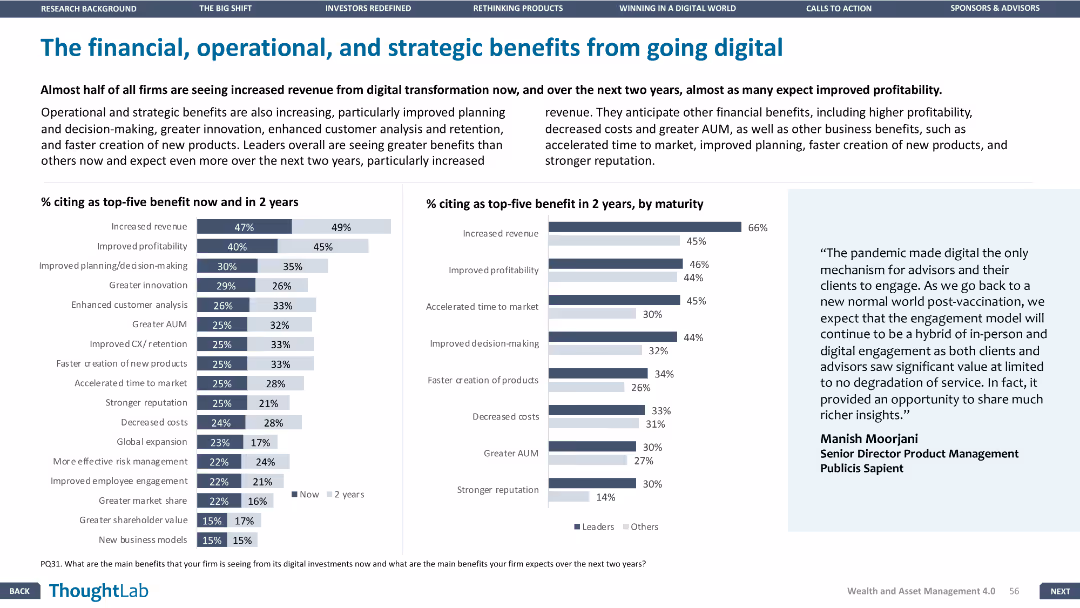
A column chart showing percentage citing top-five benefits now and in 2 years and another column chart by maturity.
Technology and Digital Transformation
Financial Services
Highlights the expected benefits from digital transformation over the next two years, emphasizing revenue increase and profitability.
Digital, transformation, revenue, benefits, strategy
false
Technology and Digital Transformation
Financial Services
Multiple Chart
Deloitte
Add to my slides
Remove from favorites
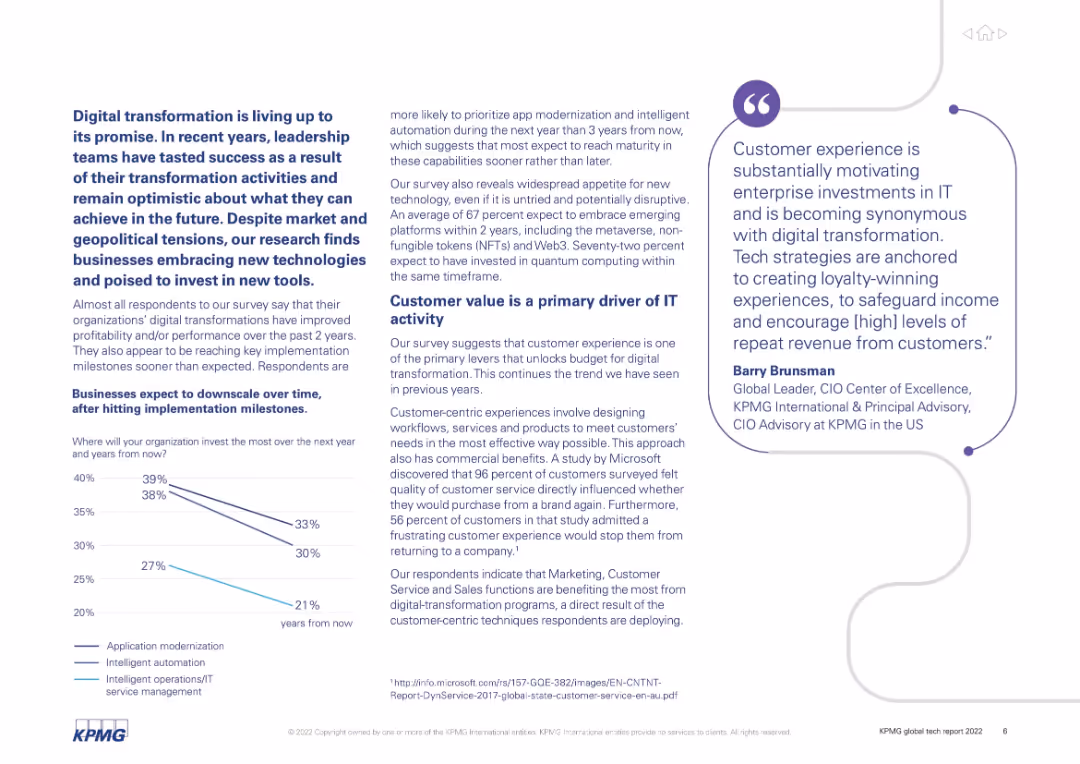
Text-heavy layout with supporting line chart. Focuses on business sentiment, priorities, and outcomes from digital transformation.
Technology and Digital Transformation
Technology & Software
Emphasizes the positive outcomes of digital transformation initiatives across organizations. Key findings include faster ROI, downscaling after milestones, and growing interest in emerging tech like AI, NFTs, and Web3. Highlights customer value as a major driver.
digital transformation, ROI, customer value, AI, Web3, automation, survey
false
Technology and Digital Transformation
Technology & Software
Mixed Chart
KPMG
Add to my slides
Remove from favorites
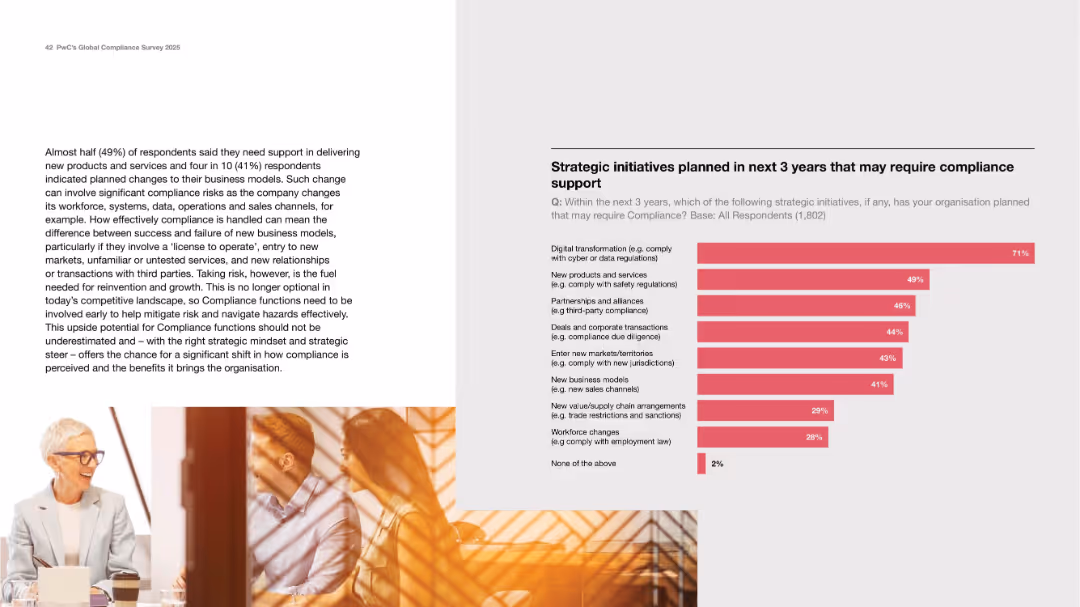
Two-column layout with narrative on left and ranked bar chart on right.
Strategic Planning
Professional Services
Shows which upcoming initiatives are expected to require compliance support, with digital transformation being the top area. Emphasizes the need for compliance involvement early in planning to mitigate risks. Highlights the growing strategic value of compliance as companies undergo transformation.
digital transformation, strategic planning, compliance support, risk
false
Strategic Planning
Professional Services
Mixed Chart
PwC/Strategy&
Add to my slides
Remove from favorites
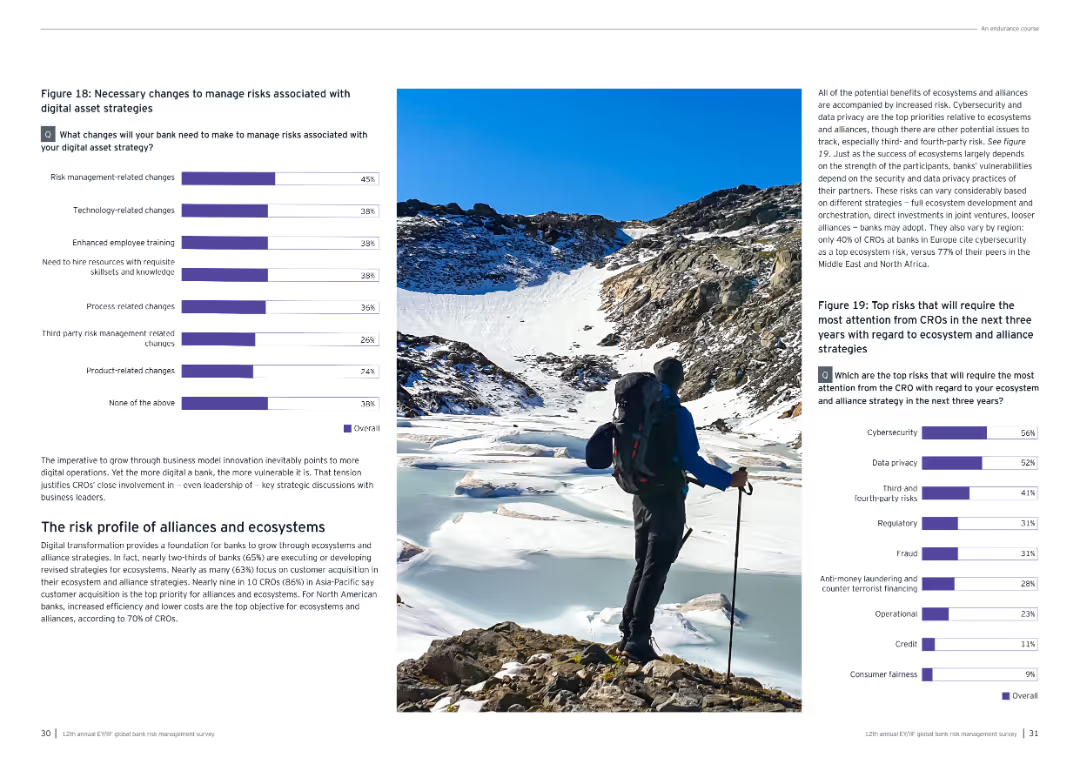
This slide contains a column chart showing the top ways banks plan to accelerate digital transformation in the next three years, with specific focus areas like modernizing core functions.
Technology and Digital Transformation
Technology & Software
The slide discusses key strategies banks will adopt to accelerate digital transformation, including modernizing core functions, enhancing customer insights, and adopting cloud migration and AI.
digital transformation, strategies, column chart, banks
false
Technology and Digital Transformation
Technology & Software
Multiple Chart
EY
Add to my slides
Remove from favorites
Slide includes a world map and pie charts displaying data on digital transformation leaders by region and industry.
Industry Overview
Technology & Software
Provides an overview of industries and global regions involved in digital transformation based on a survey of leaders.
digital transformation, survey, global, industry analysis, leaders
false
Industry Overview
Technology & Software
Header Vertical
BCG
Add to my slides
Remove from favorites
Features a woman with a laptop and a red, techy backdrop. The slide details strategies for organizations to tackle digital transformation challenges.
Technology and Digital Transformation
Professional Services
Presents actions for businesses to ensure digital transformation success, emphasizing talent strategy, learning systems, and operational model alignment.
digital transformation, talent strategy, learning systems, operational model, agility
false
Technology and Digital Transformation
Professional Services
Boxed
Bain
Add to my slides
Remove from favorites
Slide presents a summary of firms' stages in digital and technology process transformation in a table format with supplementary text explanations. It's detailed with visual elements that guide the viewer through the data.
Technology and Digital Transformation
Financial Services
Reviews the progression of financial firms in adopting digital and technological innovations, emphasizing the impact on operational efficiency and client engagement.
digital transformation, technology adoption, financial firms, operational efficiency, innovation
false
Technology and Digital Transformation
Financial Services
Table
Deloitte
Add to my slides
Remove from favorites
Icons and text blocks outlining key achievements and strategies for digital transformation and technology upgrades.
Technology and Digital Transformation
Technology & Software
Describes the initiatives and achievements in digital transformation at UBS, focusing on technology and culture.
Digital transformation, technology, agile, AI, automation, UBS, digital culture, client services
false
Technology and Digital Transformation
Technology & Software
Pillar
UBS
Add to my slides
Remove from favorites
The slide features a large image of a person in a digitally altered landscape, with the chapter title prominently displayed. There is minimal text, focusing on the chapter introduction.
Technology and Digital Transformation
Technology & Software
This slide introduces Chapter 2, which focuses on the importance of digital transformation and the internal pressures faced by organizations in implementing technological changes.
digital transformation, technology, chapter, landscape
false
Technology and Digital Transformation
Technology & Software
Multiple Chart
EY
Add to my slides
Remove from favorites
Three pie charts illustrating the popularity of technologies like Cloud Computing, Automation, and Business Intelligence & Analytics in digital transformations.
Technology and Digital Transformation
Financial Services
Discusses the importance of selecting practical technology solutions for digital transformation in finance, focusing on benefits such as cost reduction and improved efficiency.
digital transformation, technology, finance, cloud computing, automation, business intelligence, cost reduction, efficiency
false
Technology and Digital Transformation
Financial Services
Multiple Chart
Deloitte
Add to my slides
Remove from favorites
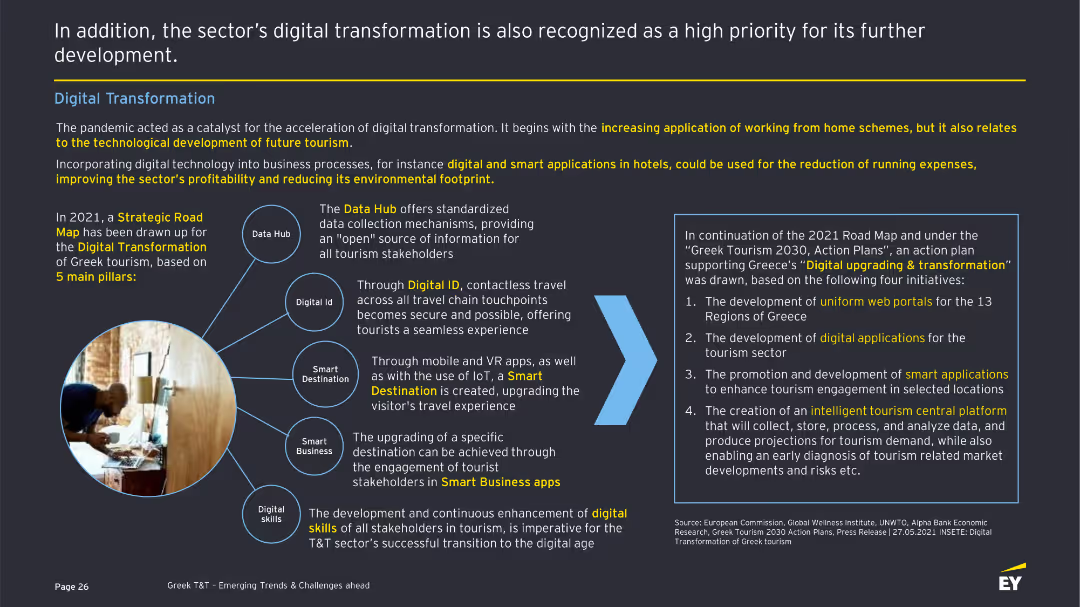
The slide showcases the digital transformation in the T&T sector with a diagram illustrating five pillars: Data Hub, Digital ID, Smart Destination, Smart Business, and Digital Skills. There are descriptions of each pillar and related initiatives.
Technology and Digital Transformation
Hospitality & Tourism
Highlights the acceleration of digital transformation in the Greek T&T sector, focusing on initiatives like Data Hub, Digital ID, and smart applications to improve profitability and reduce environmental impact. Details strategic goals and actions.
Digital transformation, Technology, T&T sector, Smart applications, Digital skills
false
Technology and Digital Transformation
Hospitality & Tourism
Framework
EY
Add to my slides
Remove from favorites
The slide showcases the digital transformation in the T&T sector with a diagram illustrating five pillars: Data Hub, Digital ID, Smart Destination, Smart Business, and Digital Skills. There are descriptions of each pillar and related initiatives.
Technology and Digital Transformation
Hospitality & Tourism
Highlights the acceleration of digital transformation in the Greek T&T sector, focusing on initiatives like Data Hub, Digital ID, and smart applications to improve profitability and reduce environmental impact. Details strategic goals and actions.
Digital transformation, Technology, T&T sector, Smart applications, Digital skills
false
Technology and Digital Transformation
Hospitality & Tourism
Mixed Chart
EY
Add to my slides
Remove from favorites
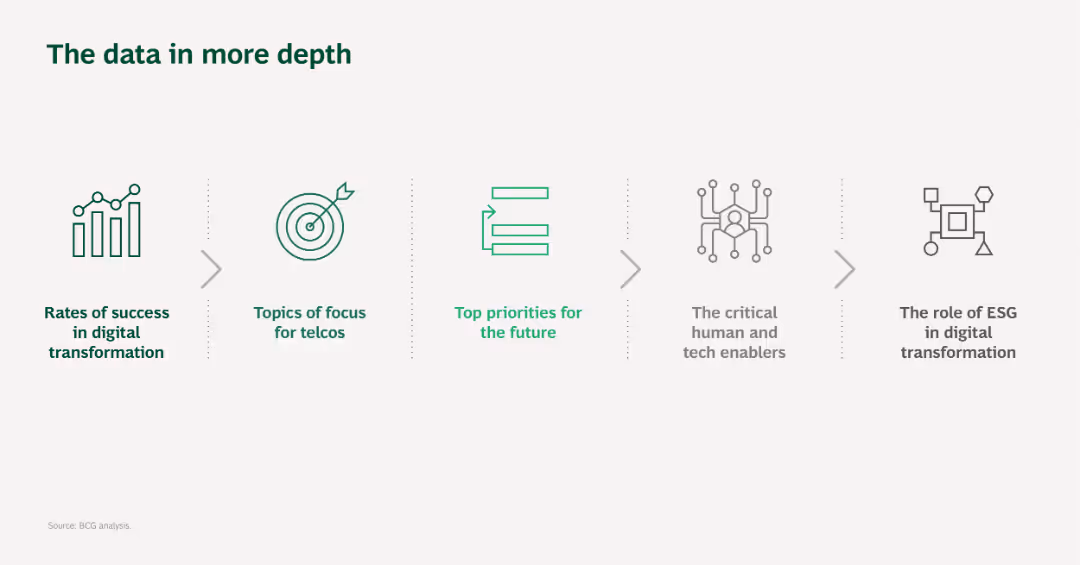
The slide uses a simple layout with five icons and brief text descriptions, visually connected by arrows, representing different focus areas in digital transformation for telcos.
Technology and Digital Transformation
Telecommunications
This slide provides an overview of the data topics covered in more detail later, focusing on digital transformation in the telecommunications sector.
Digital transformation, Telcos, Focus areas, Technology, Data analysis
false
Technology and Digital Transformation
Telecommunications
Pillar
BCG
Add to my slides
Remove from favorites
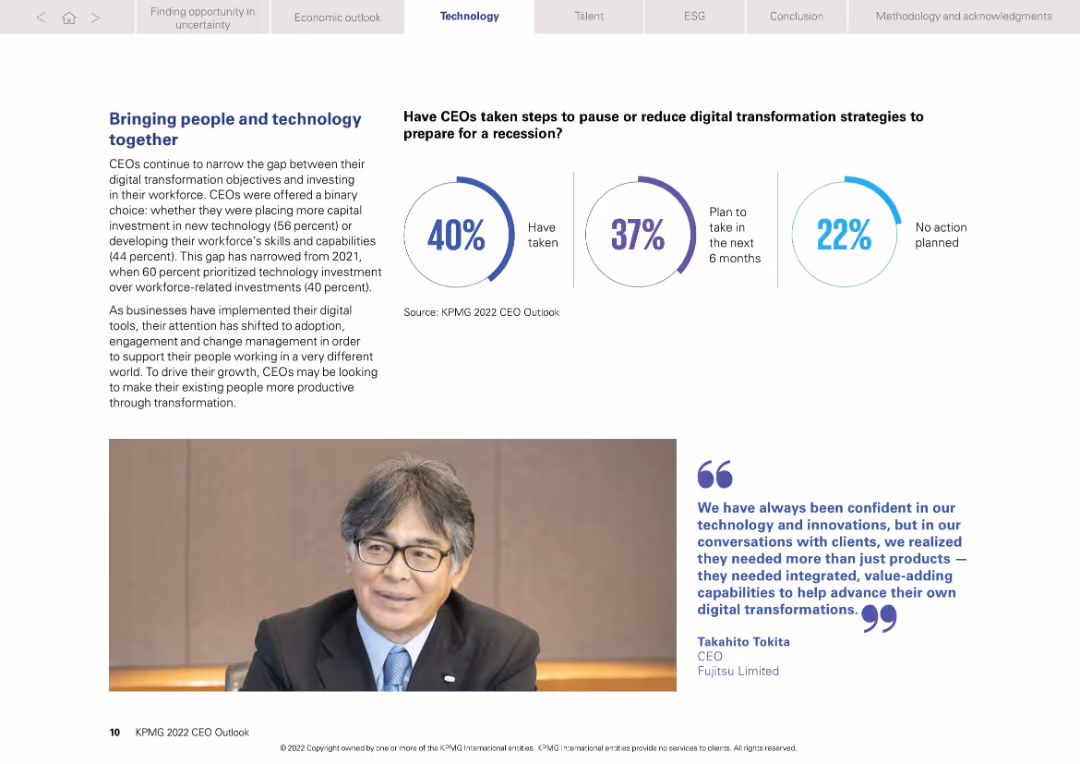
Left-aligned text with CEO quote and donut-style chart of strategic responses on right
Technology and Digital Transformation
Technology & Software
Emphasizes the narrowing gap between tech and workforce investment. Shows 40% of CEOs have paused digital initiatives due to economic conditions, with 37% planning future action. CEO commentary underscores the need for integrated, value-adding transformations.
Digital transformation, workforce, technology investment, CEO strategy
false
Technology and Digital Transformation
Technology & Software
Mixed Chart
KPMG
Add to my slides
Remove from favorites
The slide presents quantitative data via column charts and includes a photo of a branch and digital devices. Charts show trends over time with annotations for significant changes.
Technology and Digital Transformation
Financial Services
Depicts the bank's shift towards digital operations, emphasizing the reduction in physical branches and growth in digital transaction volumes, highlighting technological adoption in banking.
Digital Transition, Branches, Transactions
false
Technology and Digital Transformation
Financial Services
Multiple Chart
Goldman Sachs
Add to my slides
Remove from favorites
A split layout detailing strategies to adapt to digital consumer behavior on the left, and on the right, statistics on e-commerce growth are presented in column charts.
Market Analysis and Trends
Technology & Software
The slide discusses strategies for businesses to adapt to digital trends and consumer behaviors, with e-commerce statistics to back up claims. It could be used for market analysis and planning.
digital trends, consumer behavior, e-commerce growth, market analysis, business strategy
false
Market Analysis and Trends
Technology & Software
Boxed
JP Morgan
Add to my slides
Remove from favorites
Slide features multiple icons with annotations explaining digital impacts on decarbonization and decentralization.
Technology and Digital Transformation
Energy & Utilities
Discusses key digital trends impacting the electricity sector, focusing on decarbonization, decentralization, and technological growth.
digital trends, electricity industry, decarbonization, decentralization, technology impact, energy sector
false
Technology and Digital Transformation
Energy & Utilities
Header Horizontal
Accenture
Add to my slides
Remove from favorites
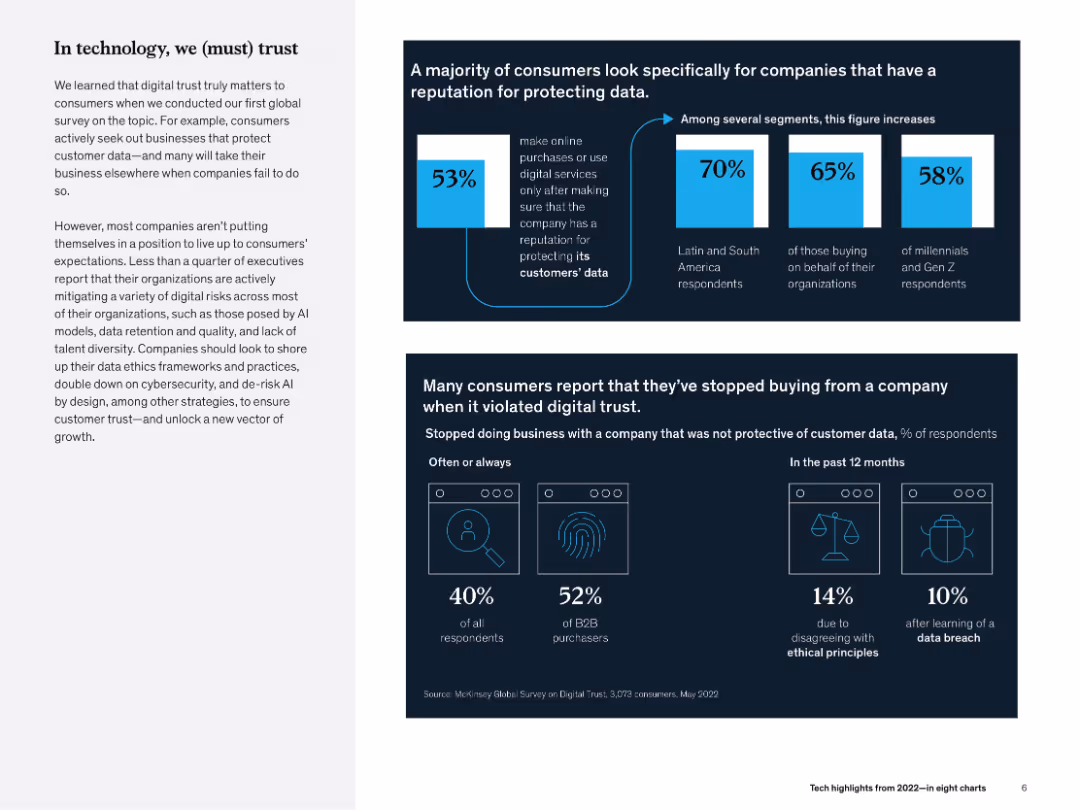
Dual-section layout: Top has a large stat box and bar comparisons; bottom has icons and text-based consumer behavior metrics.
Regulatory and Compliance
Technology & Software
The slide emphasizes the importance of digital trust, showing that many consumers stop buying from companies lacking data protection. Visuals display consumer responses across regions and behaviors linked to trust violations.
digital trust, consumer behavior, cybersecurity, ethics, McKinsey, data protection, customer loyalty
false
Regulatory and Compliance
Technology & Software
Mixed Chart
McKinsey
Add to my slides
Remove from favorites
Slide with images and bullet points in two columns, detailing how digital trust technologies impact different industries.
Technology and Digital Transformation
Financial Services
Examines how information technology, electronics, and financial services might be affected by digital trust technologies.
digital trust, industry impact, information technology, financial services, healthcare, consumer goods
false
Technology and Digital Transformation
Financial Services
Header Vertical
McKinsey
Add to my slides
Remove from favorites
Features a large central image with three text sections on the sides, focusing on challenges and discussions around digital trust.
Technology and Digital Transformation
Telecommunications
Details the debates regarding stakeholder expectations, data and privacy regulation, and risk area identification.
digital trust, stakeholder expectations, privacy regulation, risk identification
false
Technology and Digital Transformation
Telecommunications
Header Vertical
McKinsey
Add to my slides
Remove from favorites
Slide with three sections of bullet points discussing the balance of opportunities and pitfalls in digital trust.
Technology and Digital Transformation
Technology & Software
Highlights how digital trust can contribute to value creation despite the challenges and uncertainties in the technological landscape.
digital trust, value creation, risk management, strategic planning
false
Technology and Digital Transformation
Technology & Software
Header Horizontal
McKinsey
Add to my slides
Remove from favorites
Previous
Next
You don't have any favorites yet.
Please wait loading your favorites slides...
Create a FREE account to continue browsing
Receive Instant Access to 1,000+ slides from companies like McKinsey, Google, and Goldman Sachs
First Name
Last Name
Email
Password
I agree to all
Terms & Privacy Policy
Thank you! Your submission has been received!
Oops! Something went wrong while submitting the form.
Have an account?
Sign in
Upgrade to PRO to Save slides
Advanced Search and Filters
Access to 15,000+ slides
Access to Category Pages
Save/Bookmark Slides
PowerPoint Template Library
Pick a Plan
MONTHLY
$12/month
Billed every month, Cancel anytime.
YEARLY
$9/year
Billed $108 annually, Cancel anytime.
Checkout for $12/month
Checkout for $108/yr
Secured by Stripe | AES-256 bit encryption