My Account
My Slides
Search by Category
Companies
Slide Type
Use Case
Industry
Pricing
Templates
View All Templates
Download Template Slides
✦ AI
AI Prompt Library
AI Search
Feedback
Login
Logout
Get Started
Browse all Slides
Browse all Slides
Create a FREE Account
Instant access to 1,000+ real slides from top companies like McKinsey, BCG, Goldman Sachs, Google and many more!
First Name
Last Name
Email
Password
I agree to all
Terms & Privacy Policy
Thank you! Your submission has been received!
Oops! Something went wrong while submitting the form.
Have an account?
Sign in
Saved Slides
Total No. of slides saved
0
↻ Refresh
✖ Clear all
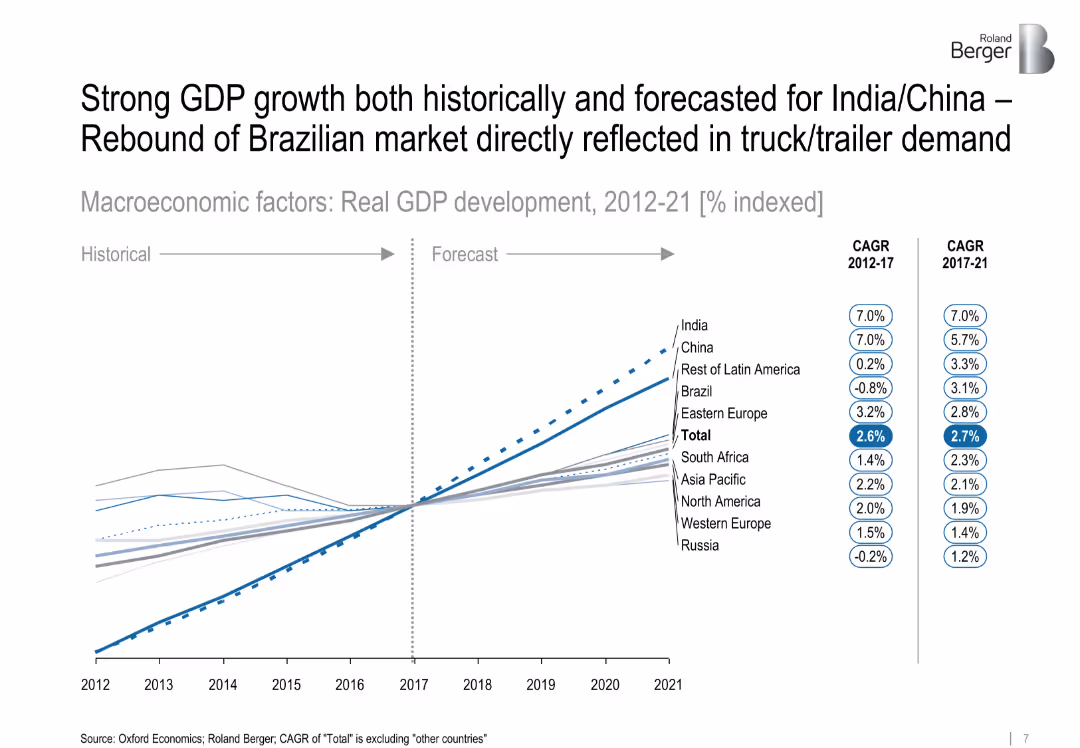
Line chart with CAGR data for regions and countries from 2012–2021
Market Analysis and Trends
Industrial & Manufacturing
This macroeconomic slide analyzes real GDP growth trends, emphasizing strong historic and projected growth in India and China, and a recovery in Brazil impacting industrial demand.
GDP, macroeconomics, Brazil, India, China, growth, forecast, industry
false
Market Analysis and Trends
Industrial & Manufacturing
Single Chart
Roland Berger
Add to my slides
Remove from favorites
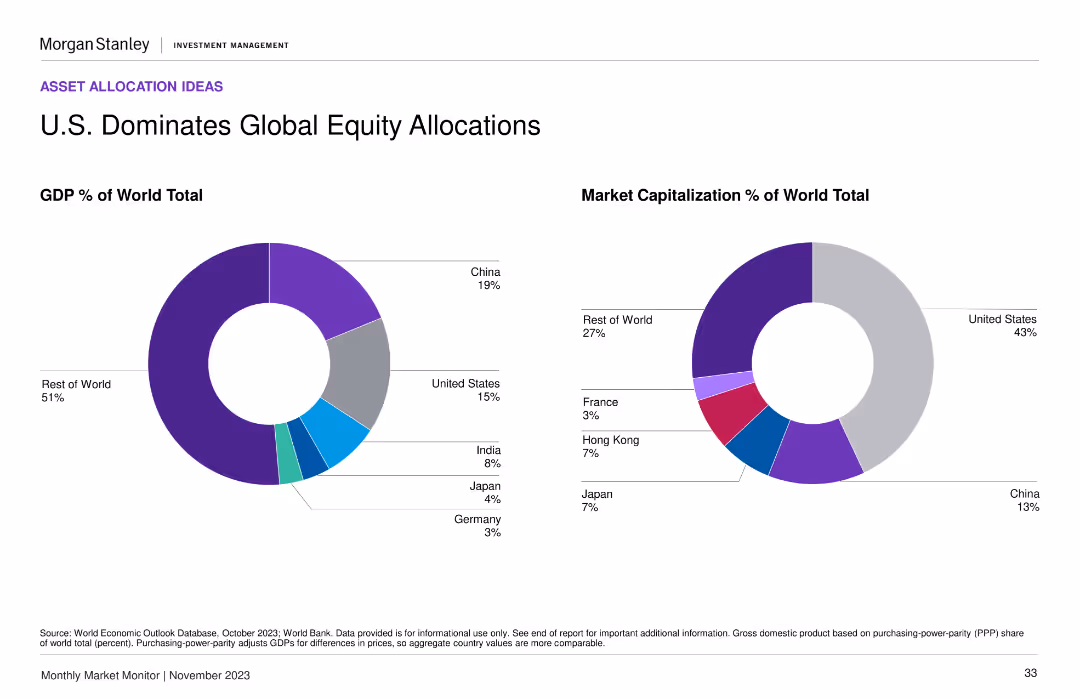
Two column charts showing GDP % and market capitalization % of world total, with segments for different regions and countries. The design is balanced and data-centric.
Market Analysis and Trends
Financial Services
This slide illustrates the dominant position of the U.S. in global equity allocations by GDP and market capitalization. It helps in understanding global market distributions.
GDP, market capitalization, global equity, U.S., China
false
Market Analysis and Trends
Financial Services
Multiple Chart
Morgan Stanley
Add to my slides
Remove from favorites
Slide includes multiple line graphs depicting real GDP growth for World, Eurozone, USA, and China from Q1 2019 to Q4 2021, with an adjacent table detailing GDP changes and expected recovery quarters.
Market Analysis and Trends
Financial Services
Exhibiting a muted recovery scenario, this slide illustrates the GDP growth trajectory under prolonged pandemic effects, useful for strategizing in uncertain economic climates.
GDP, muted recovery, economic trajectory, pandemic, uncertainty, Eurozone, USA, China, forecast
false
Market Analysis and Trends
Financial Services
Mixed Chart
McKinsey
Add to my slides
Remove from favorites
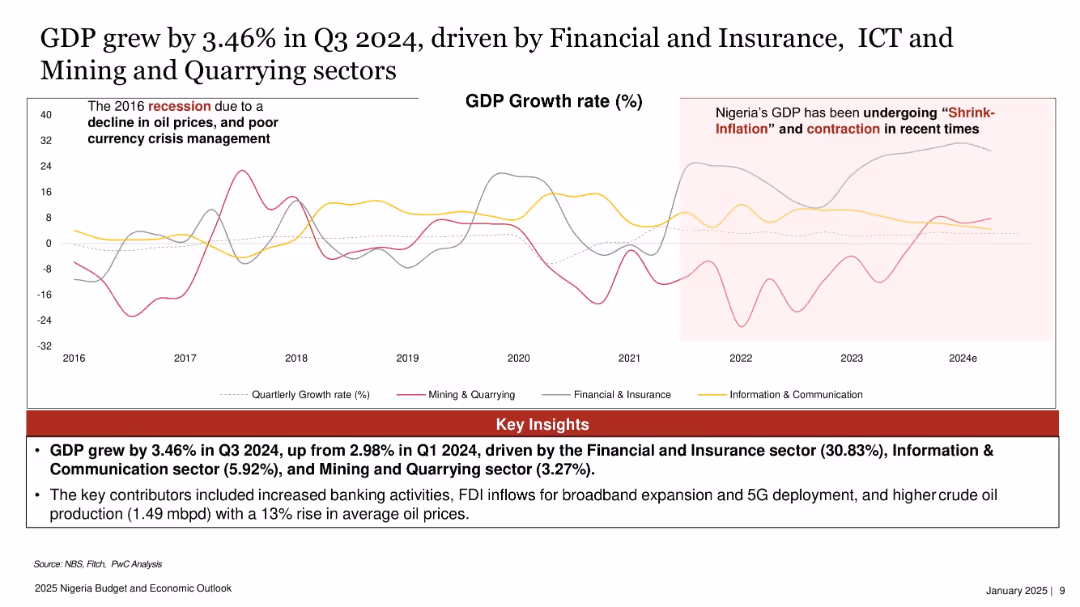
Line graph with three color-coded lines tracking sectoral GDP growth rates over time, with callouts and shaded highlights.
Market Analysis and Trends
Government & Public Sector
GDP in Nigeria grew by 3.46% in Q3 2024, driven primarily by Financial & Insurance (30.83%), ICT (5.92%), and Mining & Quarrying (3.27%). The slide shows sectoral trends since 2016, noting impacts from oil price fluctuations and currency crises.
GDP, Nigeria, sector growth, ICT, financial services, mining, quarterly growth, PwC
false
Market Analysis and Trends
Government & Public Sector
Mixed Chart
PwC/Strategy&
Add to my slides
Remove from favorites
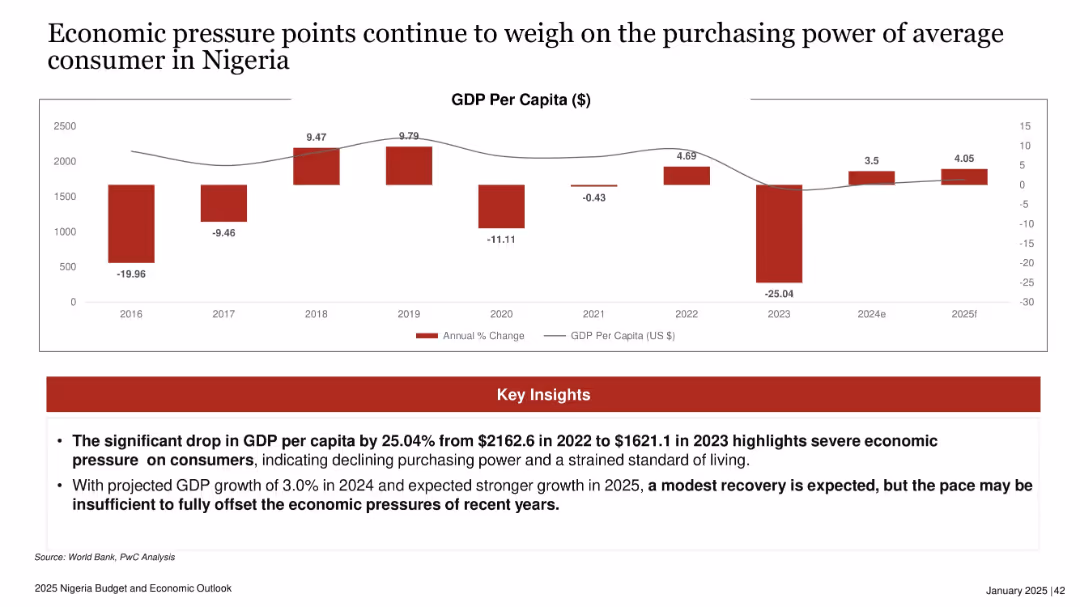
Bar graph of GDP per capita and annual % change from 2016–2025f; insights on drop in red box.
Performance Metrics and KPIs
Financial Services
Shows steep GDP per capita decline in 2023, with only modest projected recovery in 2024–2025. Indicates sustained economic pressure on consumers due to declining purchasing power and weak standard of living recovery.
GDP per capita, Nigeria, consumer pressure, economic downturn, recovery, 2025 forecast, standard of living
false
Performance Metrics and KPIs
Financial Services
Mixed Chart
PwC/Strategy&
Add to my slides
Remove from favorites
Features a world map highlighting the GDP PPP growth rates of specific countries and bar charts showing the share of global GDP PPP. Utilizes color differentiation for clear distinction among country groups.
Market Analysis and Trends
Financial Services
The slide presents real GDP PPP growth rates alongside the global share of GDP, useful for discussions on economic influence and forecasting global economic balances.
GDP PPP, economic forecasting, BRICS, global economy, growth rates
false
Market Analysis and Trends
Financial Services
Multiple Chart
Roland Berger
Add to my slides
Remove from favorites
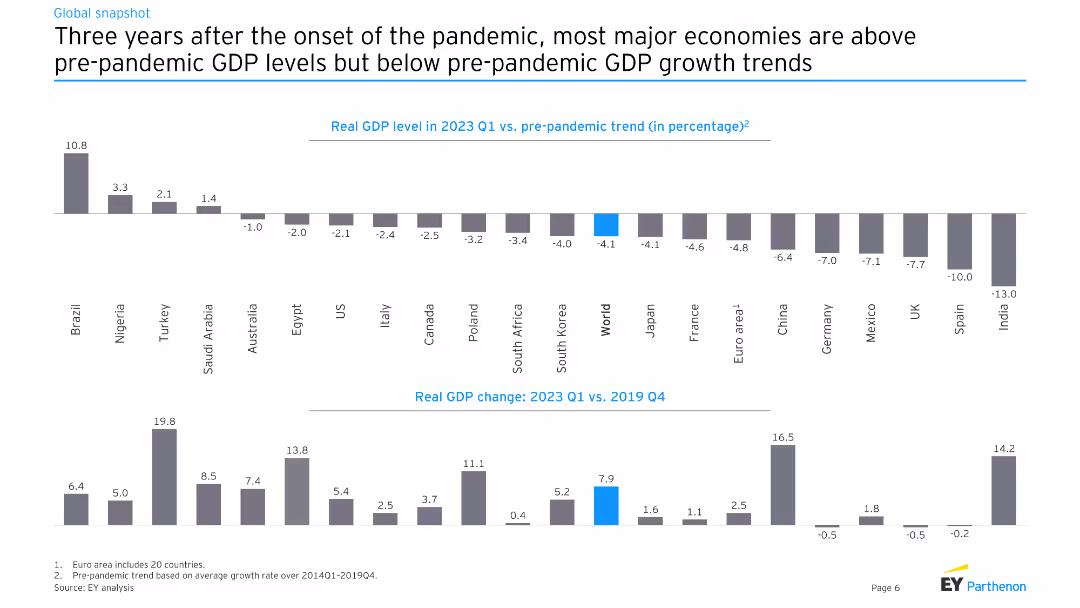
This slide features two charts: one showing the real GDP level in 2023 Q1 versus pre-pandemic trends for various countries, and another showing real GDP change from 2023 Q1 versus 2019 Q4.
Market Analysis and Trends
Financial Services
The slide compares real GDP levels and changes post-pandemic, analyzing how different economies have recovered relative to pre-pandemic trends, providing insights into economic resilience and recovery rates.
GDP, pre-pandemic, trend, recovery, economy, global
false
Market Analysis and Trends
Financial Services
Multiple Chart
EY
Add to my slides
Remove from favorites
The slide contains a line chart on the left showing private real estate returns and real GDP growth from 4Q78 to 1Q24. The right side features a column chart comparing private real estate returns in different inflationary regimes.
Market Analysis and Trends
Real Estate & Construction
The slide compares the returns of private real estate against real GDP growth over time, and shows the performance of real estate in various inflationary environments. It's useful for analyzing historical trends and the impact of inflation on real estate returns.
GDP, real estate, inflation, returns, historical trends, analysis, market performance
false
Market Analysis and Trends
Real Estate & Construction
Multiple Chart
JP Morgan
Add to my slides
Remove from favorites
Includes line graphs that project economic recovery trajectories under a scenario of virus recurrence with a strong global rebound, with detailed GDP indexes.
Financial Performance
Financial Services
Projects optimistic economic recovery scenarios following a possible recurrence of COVID-19, showing a robust rebound in major economies.
GDP, recovery, COVID-19, economic rebound, scenarios
false
Financial Performance
Financial Services
Single Chart
McKinsey
Add to my slides
Remove from favorites
Contains multiple line graphs depicting a hypothetical recurrent virus impact on GDP. Colored lines represent different regions.
Market Analysis and Trends
Financial Services
Discusses how a potential virus recurrence could impact GDP in various major economies, useful for strategic economic planning.
GDP, Recurrence, Virus, Economic impact, Planning
false
Market Analysis and Trends
Financial Services
Single Chart
McKinsey
Add to my slides
Remove from favorites
This slide is structured with a left side dedicated to graphical data regarding GDP contribution to growth, with a bar chart, and a right side presenting two line graphs depicting industrial production and retail trade. The design is clean and allows for direct comparison between different economic metrics.
Financial Performance
Financial Services
This slide reviews key economic contributors to Russia's GDP decline, presenting data on private consumption, inventories, and net trade. The information is strategically organized to highlight areas of economic stagnation, offering valuable insight for financial analysts and economic policymakers.
GDP, Russia, Private Consumption, Trade, Economic, Stagnation
false
Financial Performance
Financial Services
Multiple Chart
McKinsey
Add to my slides
Remove from favorites
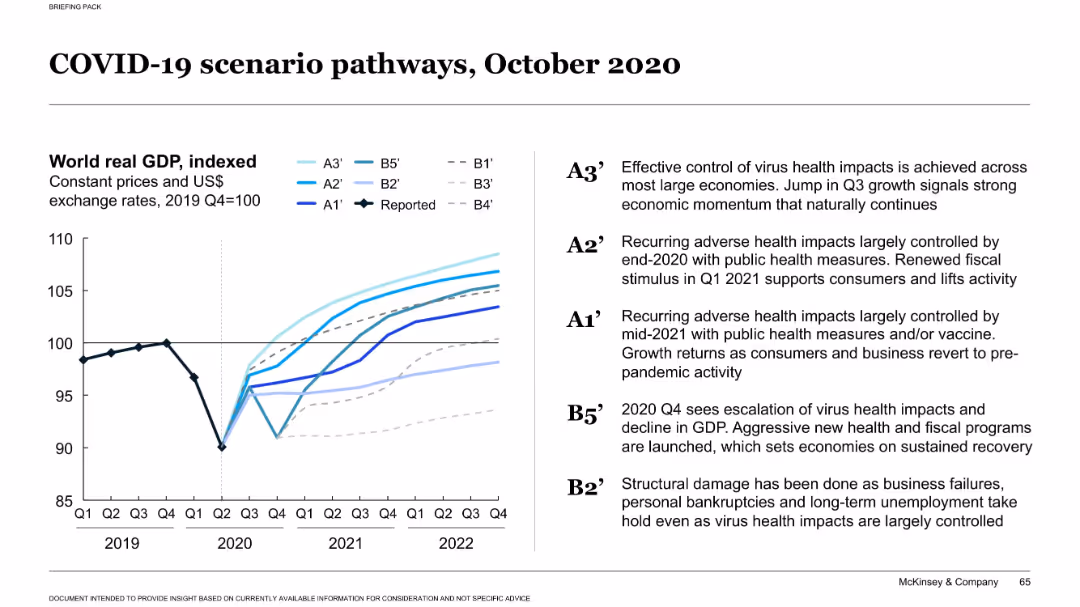
Left-aligned GDP line chart with 9 scenario curves and annotated legends; text explanations on right
Market Analysis and Trends
Financial Services
The slide outlines different COVID-19 economic recovery scenarios through 2022, highlighting various health and fiscal responses. Each pathway (A3’ to B2’) reflects different timelines and outcomes for world GDP recovery based on virus control and economic stimulus levels.
GDP, scenario planning, COVID-19, economic forecast, recovery models
false
Market Analysis and Trends
Financial Services
Mixed Chart
McKinsey
Add to my slides
Remove from favorites
Slide includes comparative line graphs for various GDP scenarios worldwide. Uses shades of blue for differentiation.
Market Analysis and Trends
Financial Services
This slide analyzes multiple global GDP scenarios, aiding in understanding potential economic futures based on virus impacts.
GDP, Scenarios, Global, Economy, Forecast
false
Market Analysis and Trends
Financial Services
Single Chart
McKinsey
Add to my slides
Remove from favorites
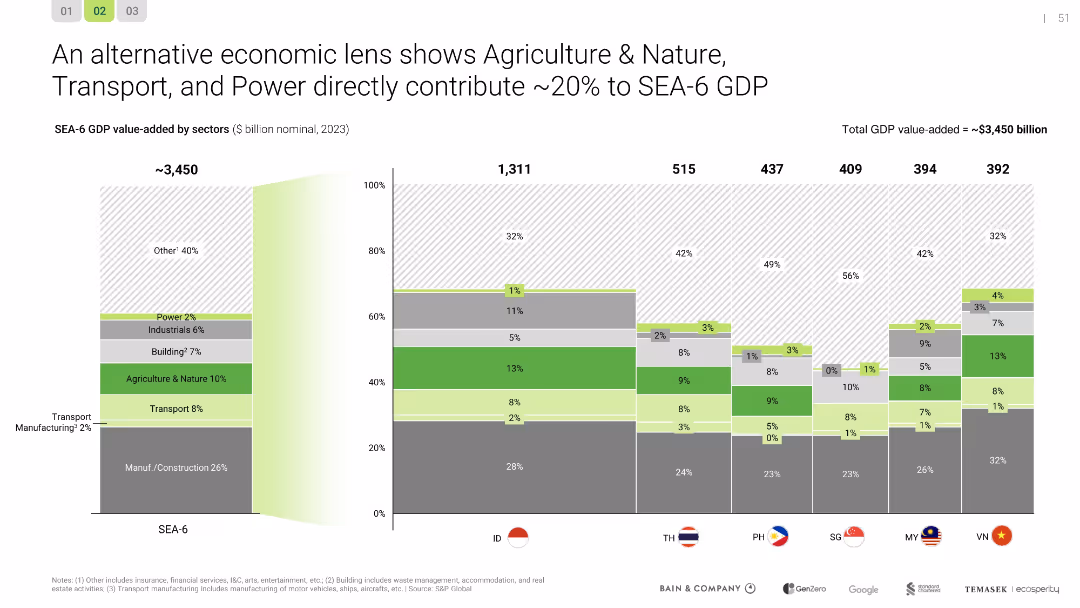
Stacked bar chart showing sectoral GDP contribution per SEA country; SEA-6 aggregated
Financial Performance
Agriculture & Food Production
The economic value of Agriculture & Nature, Power, and Transport is outlined as ~20% of SEA-6 GDP. The chart reveals the proportionate contributions by country, linking sectoral performance to strategic decarbonization priorities.
GDP, SEA, agriculture, transport, power, economy, sectoral analysis
false
Financial Performance
Agriculture & Food Production
Single Chart
Bain
Add to my slides
Remove from favorites
Slide features a pie chart in dark grey background. The chart details share of global GDP among services, emission-intensive industries, and all others.
Industry Overview
Energy & Utilities
This slide discusses the distribution of global GDP, emphasizing the smaller proportion held by emission-intensive industries, which might be seen as less competitive due to emissions constraints.
GDP, services, industries, emissions, competitiveness
false
Industry Overview
Energy & Utilities
Single Chart
BCG
Add to my slides
Remove from favorites
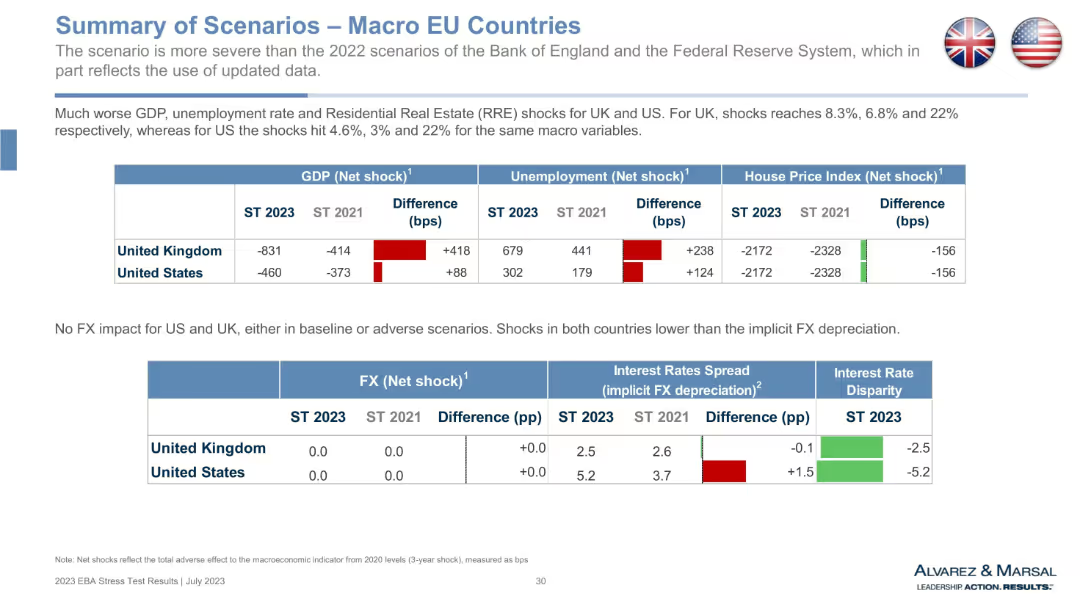
Continuation of macro table for UK and US, with added FX and interest rate spread metrics. Mix of bar graphs and tabular comparisons.
Market Analysis and Trends
Government & Public Sector
This slide presents a comparative macro stress scenario for the UK and US. It shows increased GDP and unemployment shocks in 2023 vs 2021, along with decreased house prices. Additional rows examine FX and interest rate spread impacts, providing a broader view of financial environment changes. Notably, the UK sees worse deterioration than the US under this stress test scenario.
GDP shock, FX spread, UK economy, US economy, macroeconomic comparison, unemployment, house price, interest rates, EBA stress test
false
Market Analysis and Trends
Government & Public Sector
Single Chart
Alvarez & Marsal
Add to my slides
Remove from favorites
The slide contains two line charts showing GDP size by region from 1992 to 2023, and a bar chart listing the 10 biggest economies in the world by nominal GDP in 2023.
Market Analysis and Trends
Financial Services
This slide presents data on GDP sizes and growth rates by region, and ranks the largest economies in the world, highlighting economic trends and projections.
GDP Size, Economic Growth, Regions, World Economies, Data Presentation
false
Market Analysis and Trends
Financial Services
Multiple Chart
JP Morgan
Add to my slides
Remove from favorites
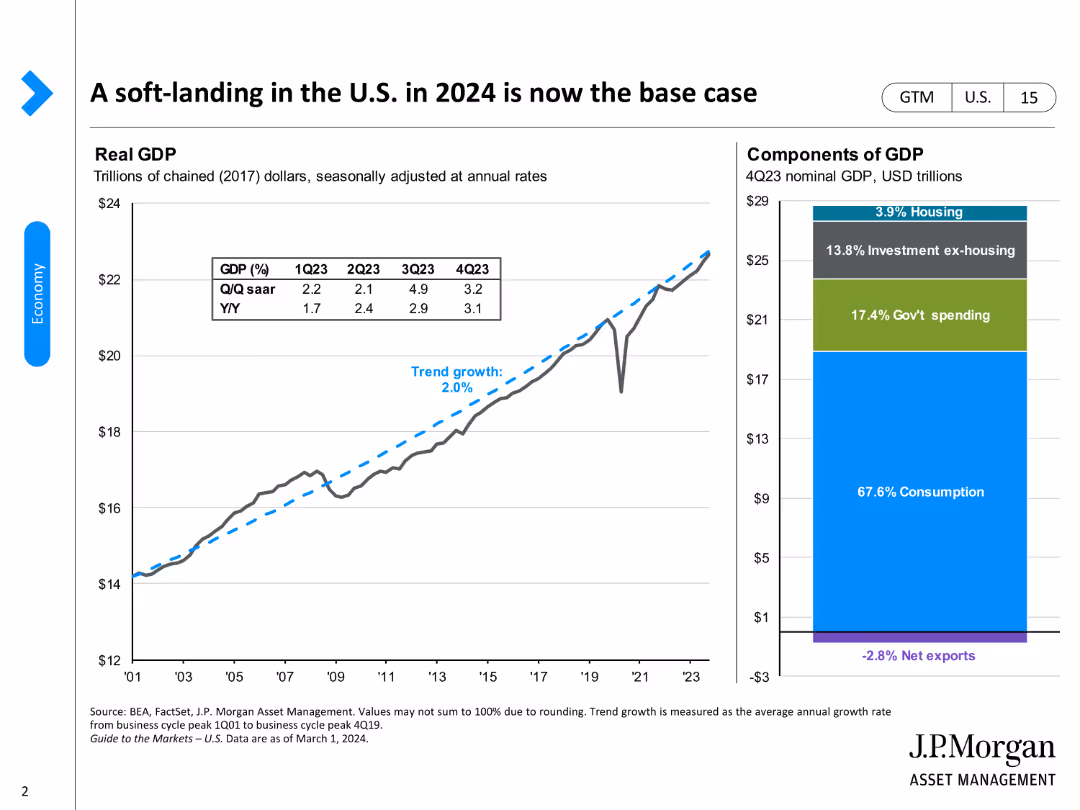
Includes a line chart showing real GDP growth trends and a stacked bar chart of GDP components for Q4 2023.
Market Analysis and Trends
Financial Services
Projects a soft-landing for the U.S. economy in 2024, based on real GDP growth trends and detailed components of GDP such as consumption, investment, and government spending.
GDP, soft-landing, U.S. economy, real GDP growth, components, consumption, investment, bar chart
false
Market Analysis and Trends
Financial Services
Multiple Chart
JP Morgan
Add to my slides
Remove from favorites
Contains a column chart comparing baseline and post-solar deployment MSME sales, projecting potential GDP increase.
Investment Analysis
Industrial & Manufacturing
Discusses potential economic benefits for Nigeria through increased MSME income from solar energy adoption, estimating a significant GDP uplift.
GDP, solar, MSMEs, economy, growth
false
Investment Analysis
Industrial & Manufacturing
Mixed Chart
BCG
Add to my slides
Remove from favorites
Two-column charts depicting the U.S. real GDP year-over-year changes and S&P 500 Price Index calendar year returns from 1947 to 2022.
Market Analysis and Trends
Financial Services
This slide shows the relationship between U.S. government configurations and the economy, highlighting real GDP changes and S&P 500 returns under different political scenarios.
GDP, S&P 500, stock market, government, economy
false
Market Analysis and Trends
Financial Services
Multiple Chart
JP Morgan
Add to my slides
Remove from favorites
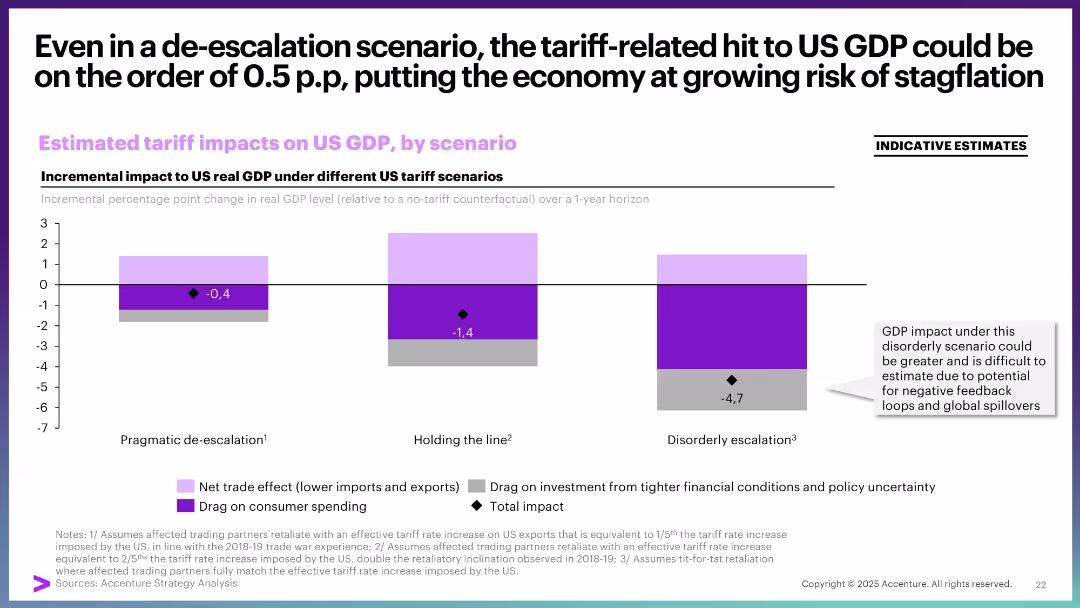
Three stacked bar graphs showing GDP impact under three tariff scenarios, using color-coded segments and a highlighted total impact point. Includes a side note and legend.
Market Analysis and Trends
Financial Services
This slide analyzes the estimated impact of tariffs on US GDP under three scenarios—pragmatic de-escalation, holding the line, and disorderly escalation. The visual emphasizes that even the mildest scenario could negatively impact GDP and highlights increased risk under more aggressive trade policies.
GDP, tariffs, US economy, stagflation, trade policy, scenarios, impact, de-escalation, escalation
false
Market Analysis and Trends
Financial Services
Single Chart
Accenture
Add to my slides
Remove from favorites
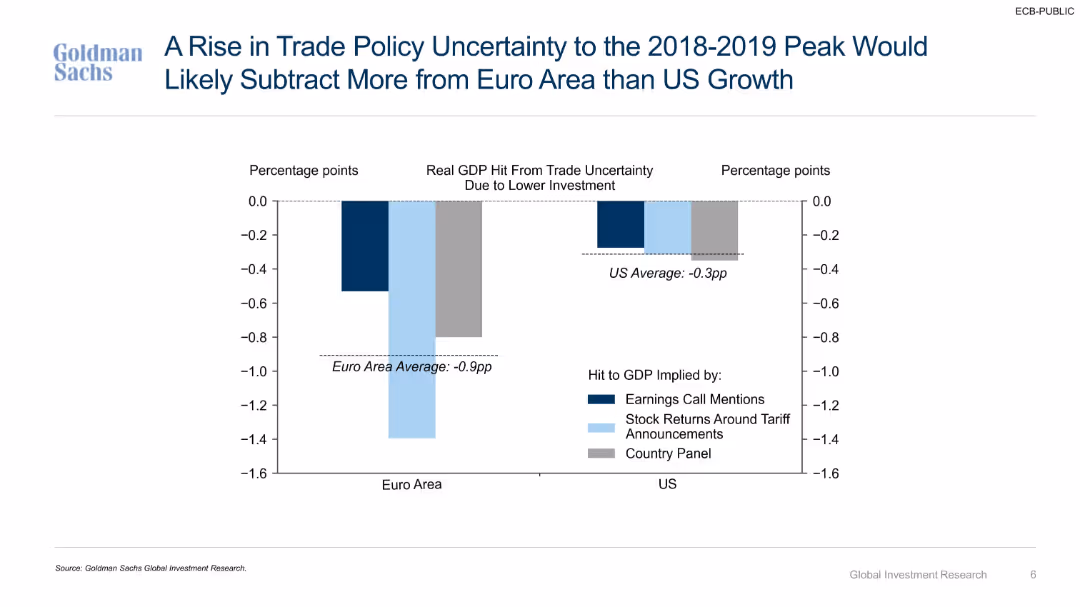
Bar chart comparisons of GDP impact implied by different estimation methods (calls, returns, panel data).
Risk Assessment and Management
Government & Public Sector
Projects GDP impact from a renewed spike in trade uncertainty similar to 2018–2019 levels. Suggests Euro Area would be more adversely affected due to investment sensitivity, based on multiple economic modeling approaches.
GDP, trade uncertainty, growth impact, Euro Area, US economy, investment, policy risk, earnings analysis, forecast modeling
false
Risk Assessment and Management
Government & Public Sector
Single Chart
Goldman Sachs
Add to my slides
Remove from favorites
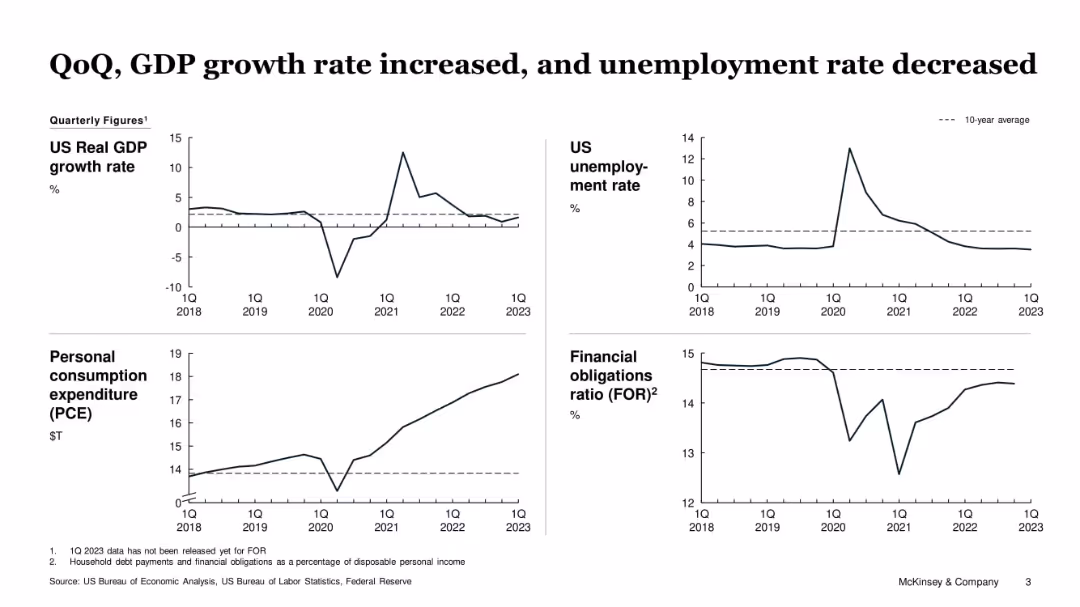
Four-line charts showing US Real GDP, unemployment, PCE, and financial obligations over time
Market Analysis and Trends
Government & Public Sector
This slide uses quarterly macroeconomic indicators to show improvement in US economic conditions. GDP growth rebounded, unemployment decreased, and personal consumption rose steadily. The financial obligations ratio remains slightly below the 10-year average, indicating household debt stability.
GDP, unemployment, consumption, obligations, macroeconomics, trends, US economy, PCE
false
Market Analysis and Trends
Government & Public Sector
Single Chart
McKinsey
Add to my slides
Remove from favorites
This slide contains multiple elements: column charts for GDP share per industry, a table for total NY private sector GDP and incremental UI claims. Each industry's impact on GDP and UI claims is detailed.
Market Analysis and Trends
Financial Services
The slide gives a detailed breakdown of New York's private sector GDP by industry in 2019, correlating it with unemployment insurance claims during the pandemic to show economic impact across sectors.
GDP, unemployment, NY private sector, industries, bar chart, pie chart, pandemic impact
false
Market Analysis and Trends
Financial Services
Single Chart
BCG
Add to my slides
Remove from favorites
A combination of a line chart and a stacked column chart. The line chart shows GDP per capita vs. urbanization. The stacked column chart shows middle-class growth contribution.
Market Analysis and Trends
Financial Services
The slide compares GDP per capita against urbanization ratios and forecasts the contribution of different regions to middle-class growth from 2024 to 2030.
GDP, urbanization, middle-class, growth, forecast, regions, contribution, financial trends, economic analysis, development
false
Market Analysis and Trends
Financial Services
Multiple Chart
JP Morgan
Add to my slides
Remove from favorites
Slide features multiple line graphs comparing real GDP growth across the World, Eurozone, USA, and China from Q1 2019 to Q4 2021, with annotations and a side table summarizing GDP changes and recovery times.
Market Analysis and Trends
Financial Services
This slide presents a scenario where the virus is contained and shows the indexed GDP growth across various regions. It is suitable for analyzing economic impacts and recovery timelines.
GDP, virus containment, economic impact, recovery, index, growth, comparison, Eurozone, USA, China
false
Market Analysis and Trends
Financial Services
Mixed Chart
McKinsey
Add to my slides
Remove from favorites
A split design features two comparison charts. On the left, a dual-line graph shows the trends for 'GEARING' and 'EQUITY RATIO,' crossing at strategic target levels. On the right, a combined line graph presents 'NET DEBT / ADJUSTED EBITDA RATIO' and 'INTEREST COVER RATIO,' converging towards the end of the observed period. Visual interest is added by images of people in various business and learning settings, connecting the financial data to real-world implications.
Strategic Planning
Financial Services
Demonstrates the company’s financial position in terms of gearing and debt ratios, significant for strategic planning and target assessments.
gearing ratio, equity ratio, net debt, EBITDA, interest cover, financial ratios, strategic targets, financial health, company performance
false
Strategic Planning
Financial Services
Multiple Chart
Goldman Sachs
Add to my slides
Remove from favorites
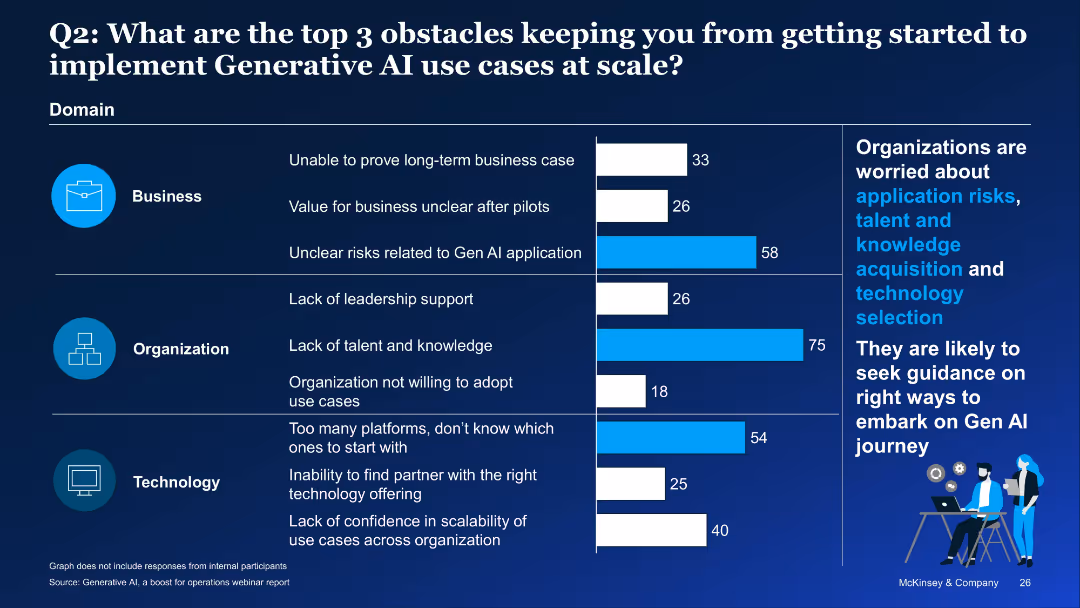
Bar chart by domain (Business, Organization, Technology), dark theme with callouts on right
Strategic Planning
Artificial Intelligence
This survey slide outlines the top three barriers to GenAI adoption: risk uncertainty, lack of talent, and platform complexity. It emphasizes organizations’ need for guidance on navigating these issues to scale AI effectively.
GenAI adoption, barriers, risks, talent shortage, tech selection, survey, scaling
false
Strategic Planning
Artificial Intelligence
Mixed Chart
McKinsey
Add to my slides
Remove from favorites
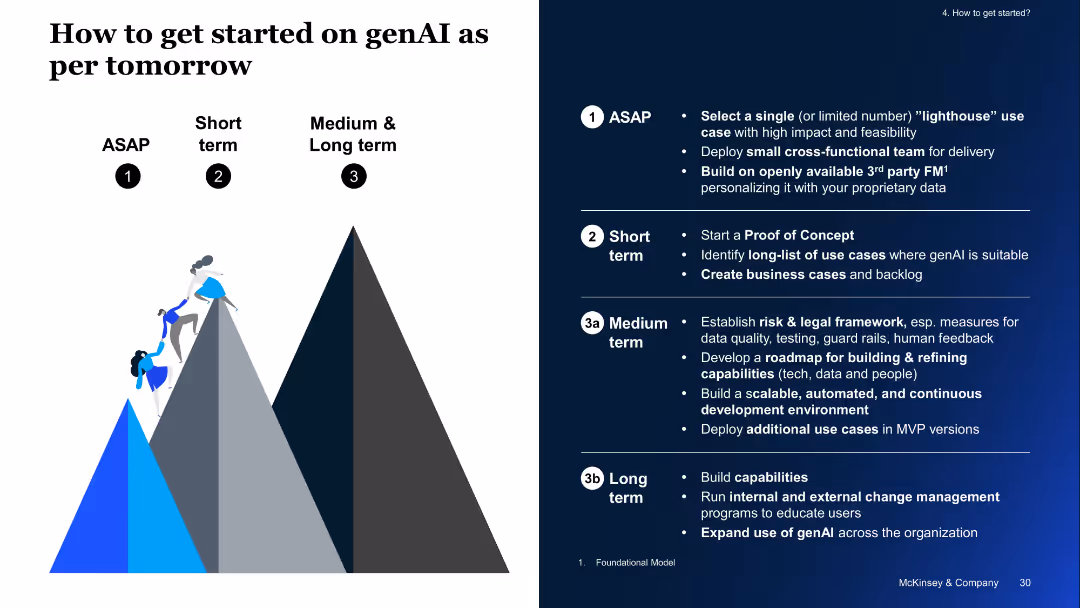
Pyramid visual shows immediate to long-term steps. Right side lists tactical actions for ASAP, short-term, medium-term, and long-term implementation.
Technology and Digital Transformation
Technology & Software
Roadmap outlining phased genAI adoption—starting with small use cases, then scaling through PoCs, legal frameworks, continuous deployment environments, and enterprise-wide rollouts.
genAI adoption, phased roadmap, PoC, legal, MVPs, strategy, capability building
false
Technology and Digital Transformation
Technology & Software
Vertical Flow
McKinsey
Add to my slides
Remove from favorites
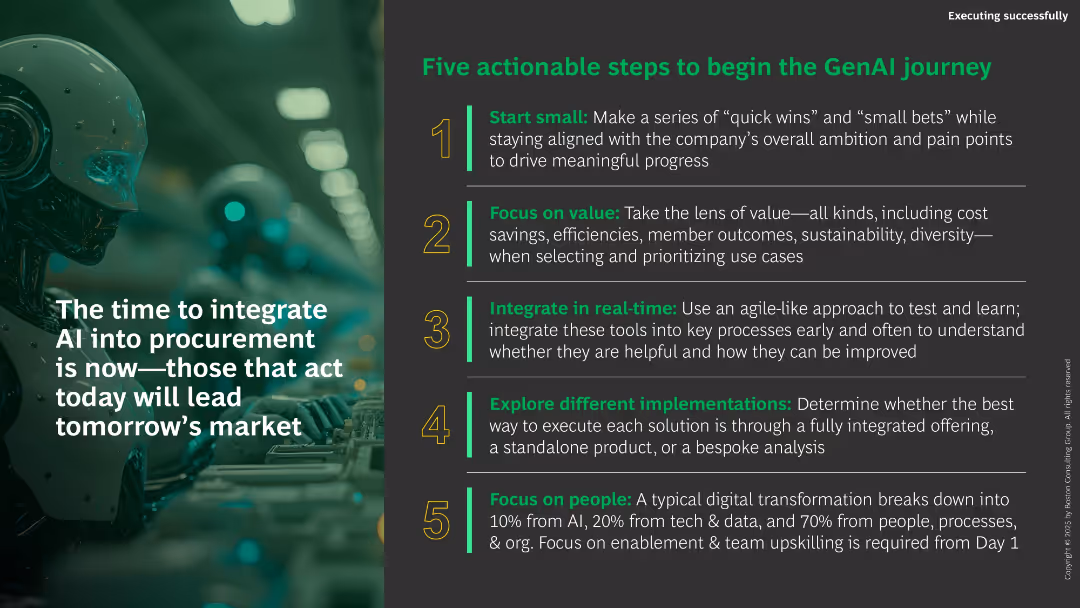
Split layout: left has large visual with quote overlay; right side has five numbered action steps with green-highlighted headers and detailed text.
Strategic Planning
Artificial Intelligence
The slide offers five actionable recommendations to integrate GenAI into procurement. It emphasizes starting small, focusing on value, real-time integration, implementation diversity, and team enablement. The left quote stresses urgency in adopting GenAI to stay ahead.
GenAI adoption, procurement, digital transformation, agile, people strategy, cost savings
false
Strategic Planning
Artificial Intelligence
Vertical Flow
BCG
Add to my slides
Remove from favorites
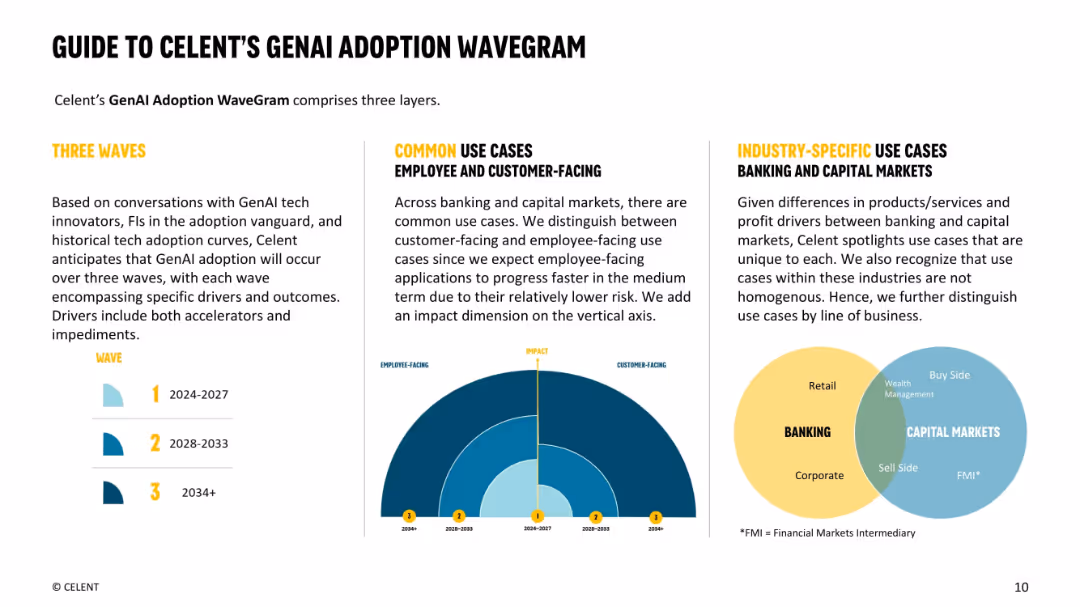
Three-column layout with WaveGram graphic and Venn diagram; text explains wave structure and industry breakdown
Technology and Digital Transformation
Artificial Intelligence
The slide outlines Celent's framework for GenAI adoption in financial institutions, split into three waves and categorized by use cases (employee-facing, customer-facing) and industry-specific needs.
GenAI, adoption waves, financial institutions, use cases, AI strategy, capital markets
false
Technology and Digital Transformation
Artificial Intelligence
Mixed Chart
Oliver Wyman
Add to my slides
Remove from favorites
Dark blue slide with white and blue text boxes stacked vertically, highlighting key agenda items
Strategic Planning
Artificial Intelligence
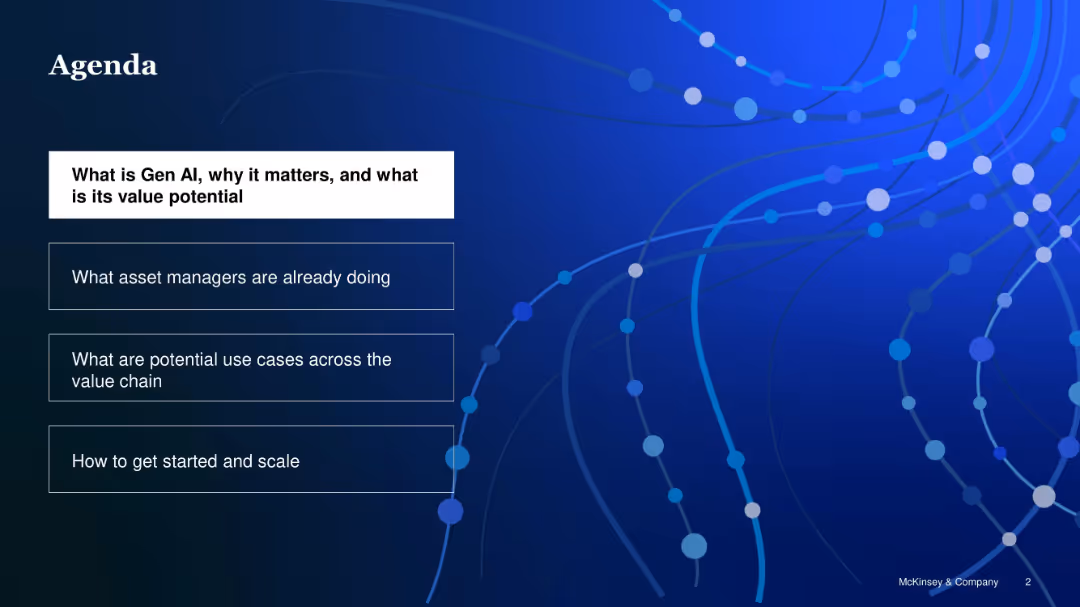
The agenda outlines the structure of the presentation: understanding Gen AI, examining asset manager practices, exploring use cases across the value chain, and guidance on implementation and scaling.
Gen AI, agenda, value chain, asset managers, implementation, scaling
false
Strategic Planning
Artificial Intelligence
Agenda
McKinsey
Add to my slides
Remove from favorites
Left side shows a table of GenAI high-level use cases with examples; right side has concentric rings showing relationship of AI → ML → NN → DL → GenAI.
Technology and Digital Transformation
Artificial Intelligence
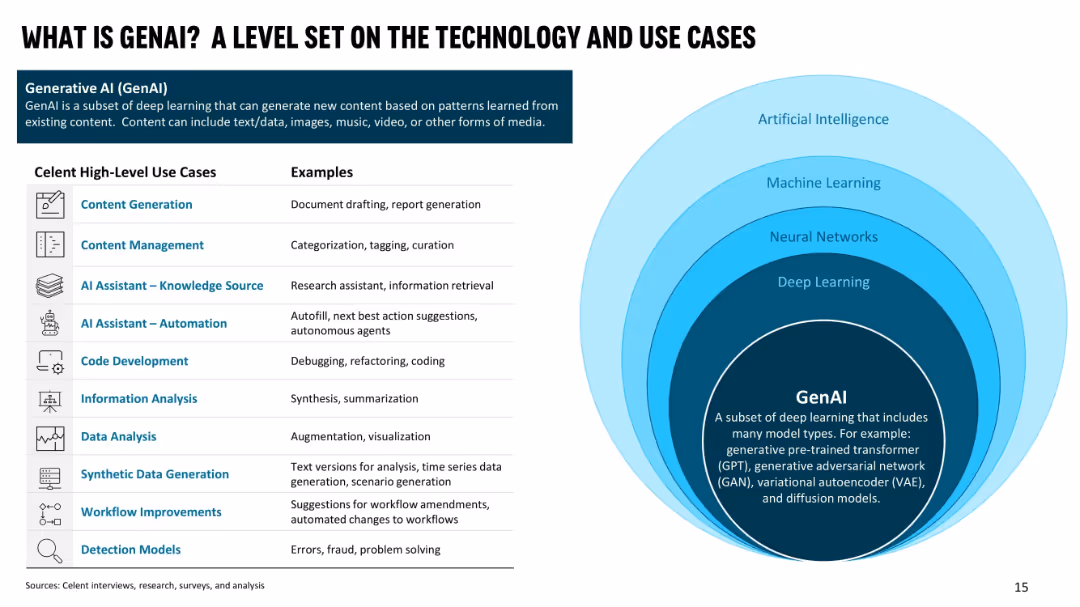
Defines Generative AI and places it within the broader AI ecosystem. Lists high-level use cases with real-world examples including content generation, automation, data analysis, and code development. The goal is to orient the audience to GenAI's capabilities and application relevance.
GenAI, AI hierarchy, use cases, content generation, automation, knowledge source, deep learning
false
Technology and Digital Transformation
Artificial Intelligence
Table
Oliver Wyman
Add to my slides
Remove from favorites
Horizontal bar chart of GenAI use cases across functions (e.g., customer service, R&D). Pie chart shows 86% of executives plan AI investment. Footer text emphasizes productivity and growth through GenAI.
Technology and Digital Transformation
Artificial Intelligence
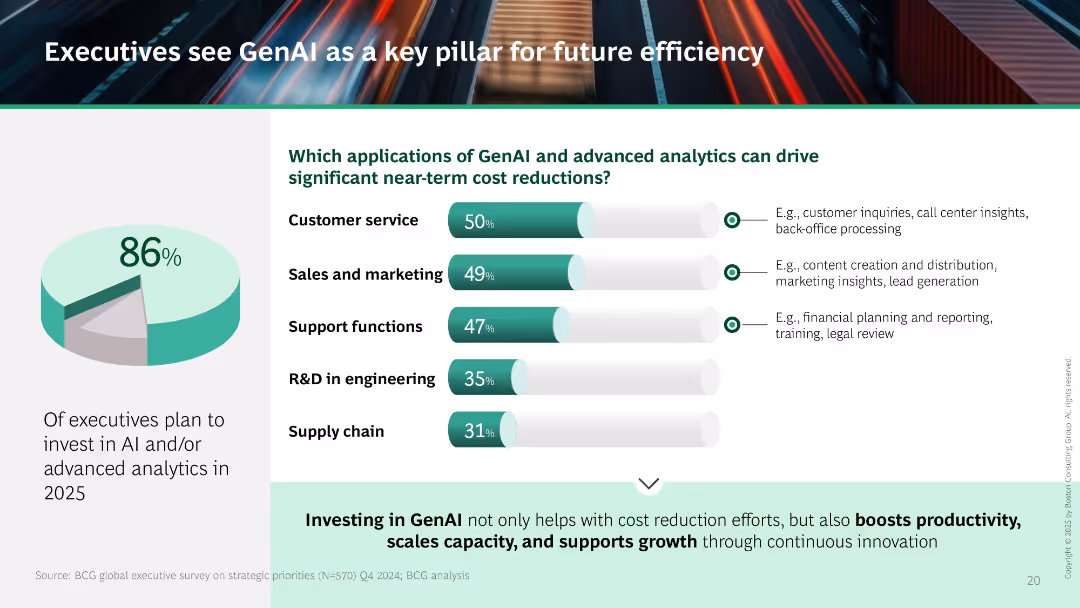
Highlights executive plans to use GenAI for near-term cost reductions in functions like customer service, marketing, and support. Emphasizes how AI enables efficiency, scalability, and innovation.
GenAI, AI investment, cost reduction, automation, analytics, customer service, innovation, efficiency
false
Technology and Digital Transformation
Artificial Intelligence
Multiple Chart
BCG
Add to my slides
Remove from favorites
Profile section with AI officer’s quote and regional analysis on left; bar chart showing GenAI adoption rates by region on right
Technology and Digital Transformation
Artificial Intelligence
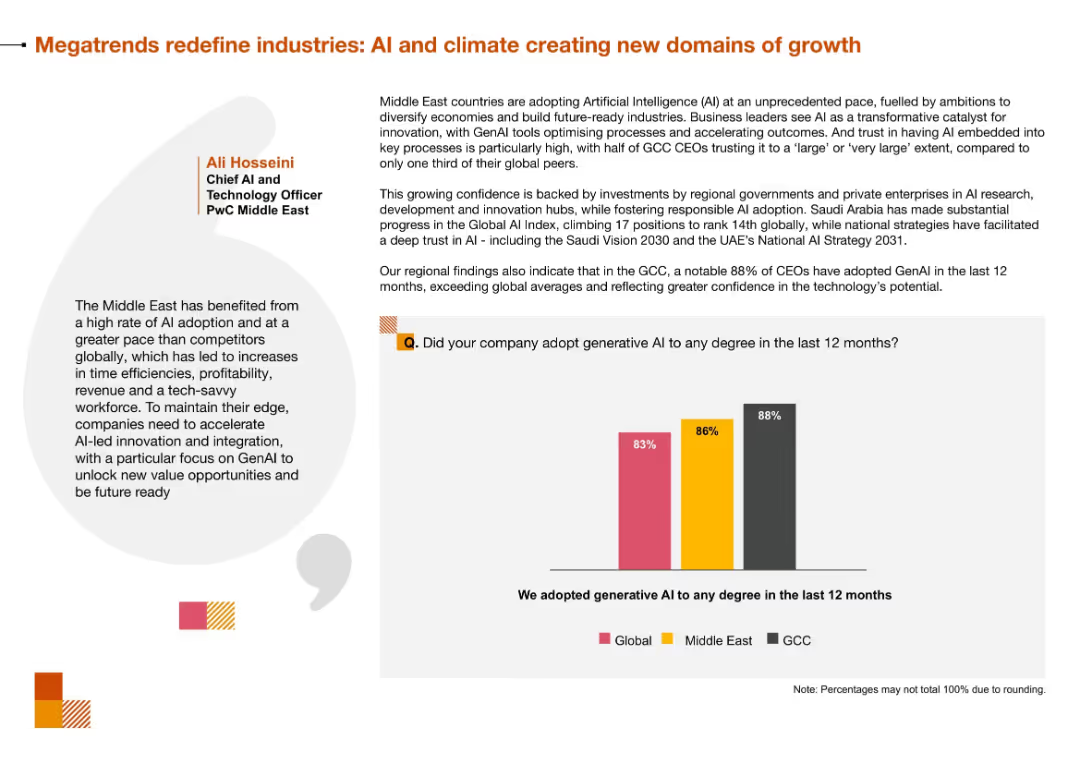
The slide emphasizes rapid adoption of GenAI in the Middle East, especially the GCC, where AI is seen as a transformative catalyst. It highlights regional confidence in AI and government-led initiatives to support growth.
GenAI, Artificial Intelligence, AI Adoption, Middle East, GCC, Innovation, Future Readiness
false
Technology and Digital Transformation
Artificial Intelligence
Mixed Chart
PwC/Strategy&
Add to my slides
Remove from favorites
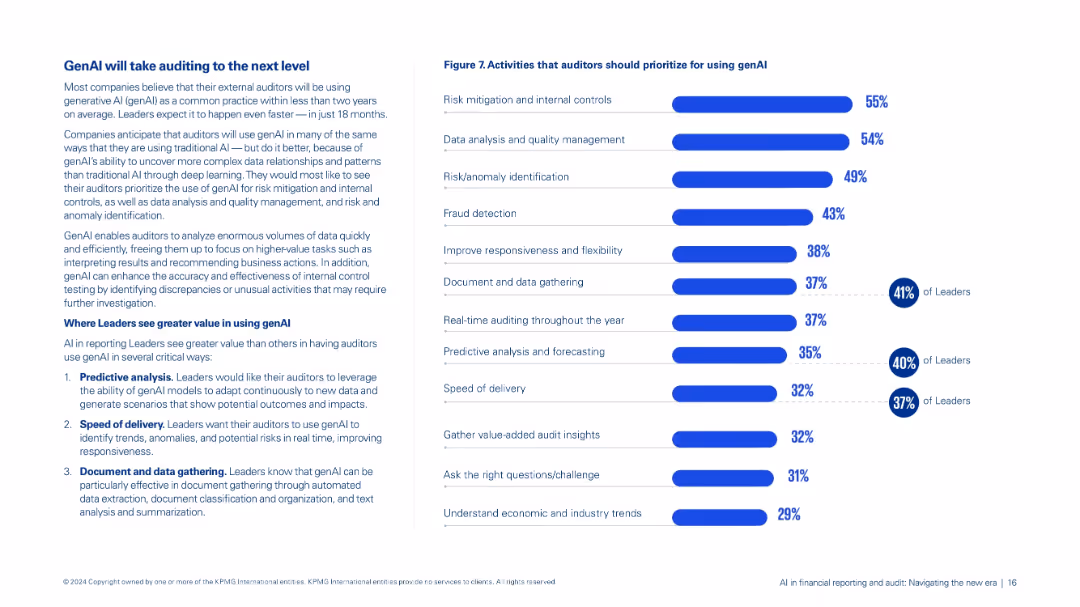
Two-column layout: left side contains detailed text; right side features a bar chart (Figure 7) with percentages. Blue tones and clean, modern font.
Technology and Digital Transformation
Financial Services
Highlights how generative AI (genAI) is expected to revolutionize external auditing by enhancing risk management, data analysis, and fraud detection. Includes leaders’ priorities and preferred genAI use cases in audit functions.
genAI, audit, risk management, data analysis, fraud detection, AI in finance
false
Technology and Digital Transformation
Financial Services
Mixed Chart
KPMG
Add to my slides
Remove from favorites
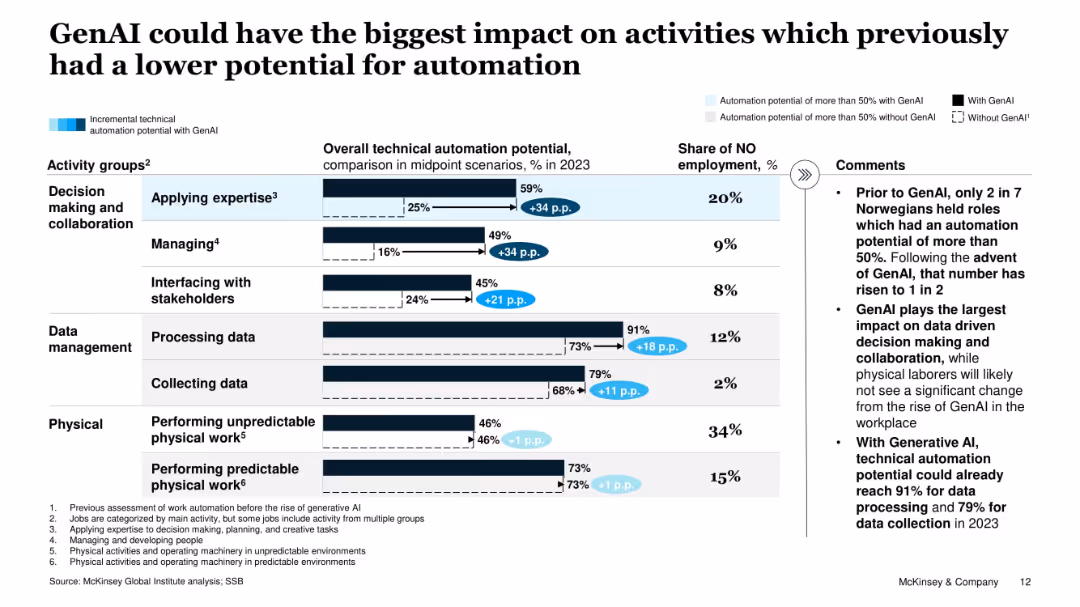
Bar chart categorizing work activities (e.g., data, decision-making, physical) by automation potential, with/without GenAI. Comments emphasize key insights.
Operational Efficiency
Artificial Intelligence
This slide emphasizes GenAI's greatest impact on previously low-automation tasks like decision-making and data management. It shows significant uplift in automation potential across several activity groups.
GenAI, automation, activity groups, data processing, decision-making, productivity, Norway
false
Operational Efficiency
Artificial Intelligence
Mixed Chart
McKinsey
Add to my slides
Remove from favorites
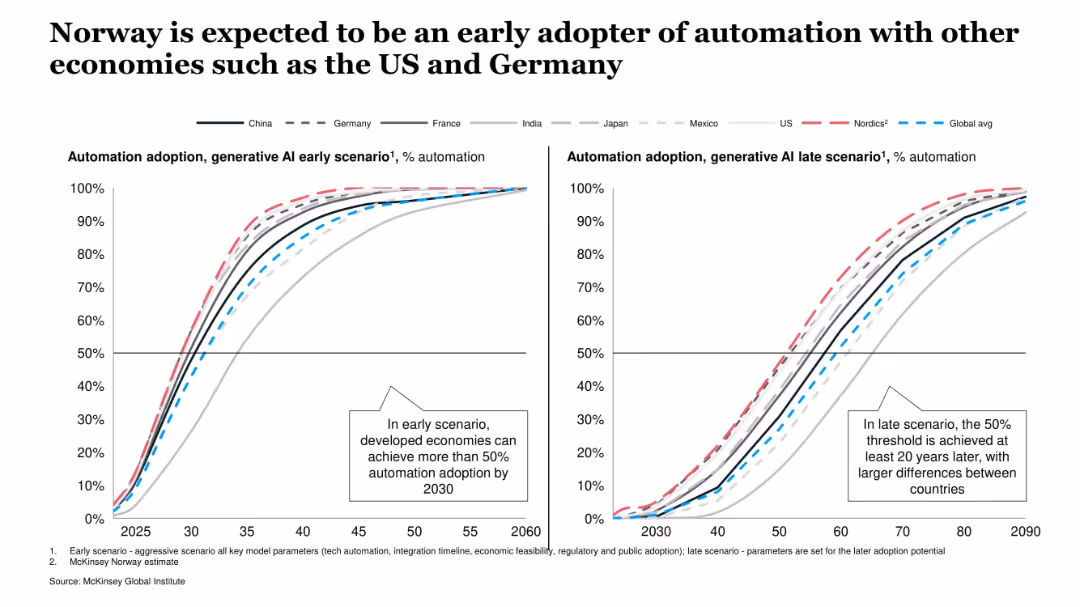
Side-by-side line charts showing AI adoption trajectories under early and late scenarios for various countries. Clear legend and scenario-based comparison.
Technology and Digital Transformation
Artificial Intelligence
This slide compares expected automation adoption under GenAI across multiple countries, showing that Norway and other developed nations are projected to lead adoption under both early and late scenarios.
GenAI, automation, adoption, Norway, early scenario, late scenario, global comparison, productivity
false
Technology and Digital Transformation
Artificial Intelligence
Multiple Chart
McKinsey
Add to my slides
Remove from favorites
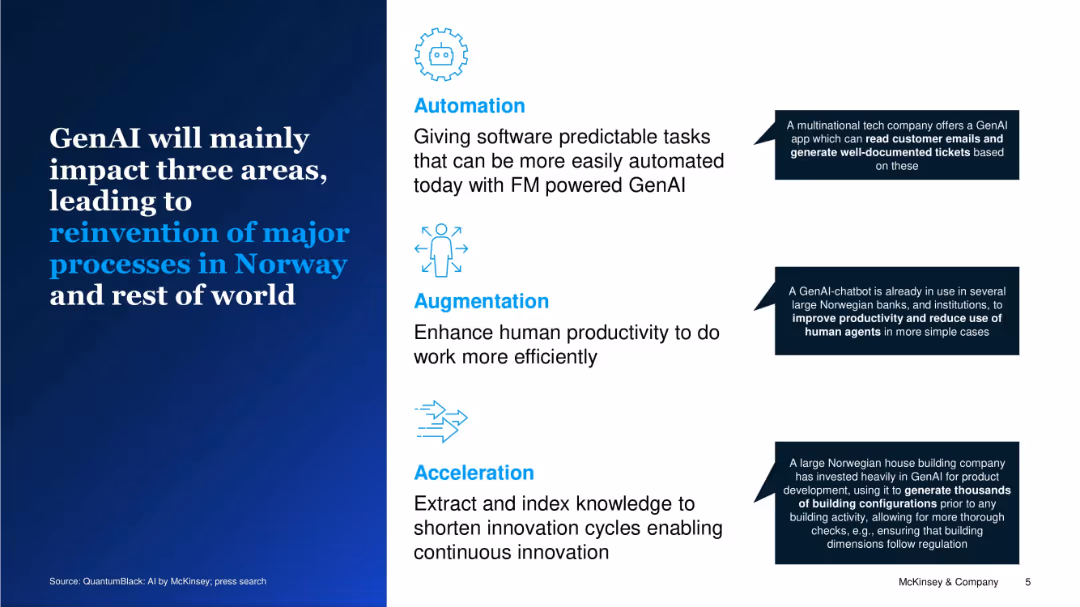
Split layout with bold headline on left and three illustrated blocks (Automation, Augmentation, Acceleration) on the right. Each block includes icons, brief descriptions, and callout examples.
Strategic Planning
Artificial Intelligence
The slide introduces the three major impact areas of GenAI—automation, augmentation, and acceleration—highlighting how it will transform business operations in Norway and globally, with examples of implementation.
GenAI, automation, augmentation, acceleration, Norway, productivity, transformation, FM, business impact
false
Strategic Planning
Artificial Intelligence
Vertical Flow
McKinsey
Add to my slides
Remove from favorites
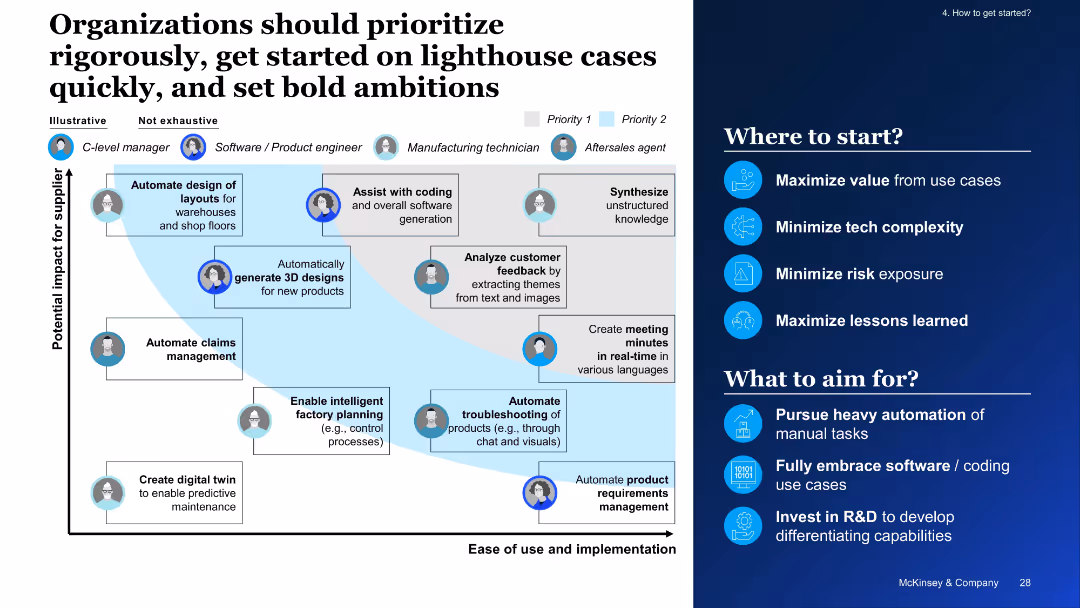
Left: Matrix with roles, use cases, and implementation potential. Right: Action-oriented bullet points on where to start and what to aim for.
Strategic Planning
Industrial & Manufacturing
Highlights how organizations can prioritize GenAI initiatives by balancing potential impact with implementation ease. Offers starting tips and strategic goals like automation and R&D investment.
genAI, automation, impact vs ease, prioritization, R&D, coding use cases, factory planning
false
Strategic Planning
Industrial & Manufacturing
Boxed
McKinsey
Add to my slides
Remove from favorites
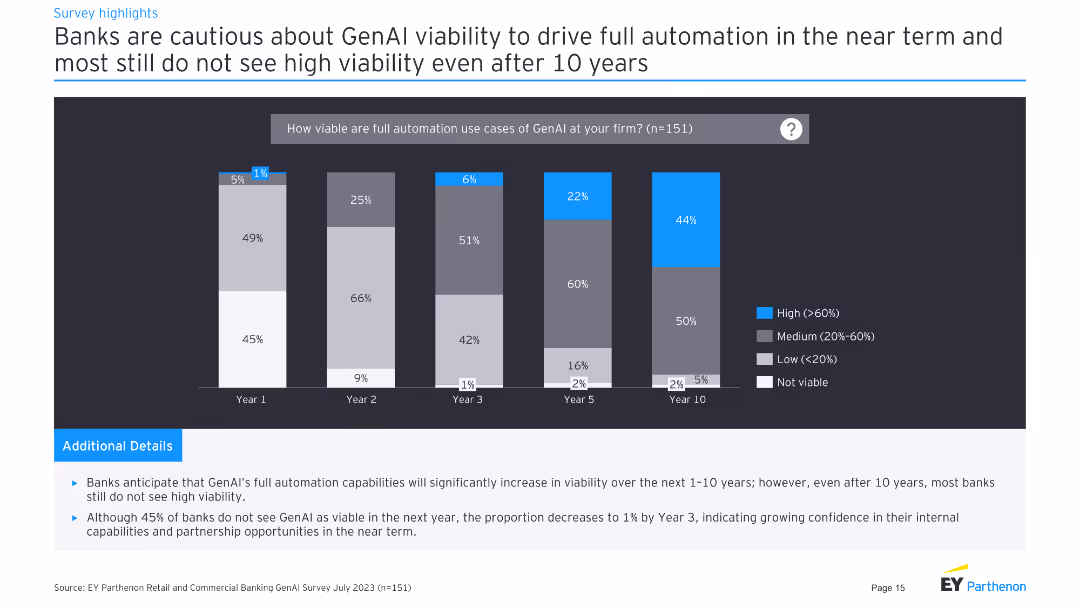
Column chart showing viability of GenAI for full automation over 10 years.
Risk Assessment and Management
Financial Services
Banks are cautious about GenAI viability for full automation, with low confidence even after 10 years.
GenAI, automation, viability, long-term, risk
false
Risk Assessment and Management
Financial Services
Mixed Chart
EY
Add to my slides
Remove from favorites
The slide includes column charts showing the level of interest in GenAI by deposit size and the primary drivers motivating banks to implement GenAI technologies, with a large textual summary.
Technology and Digital Transformation
Financial Services
The slide provides insights into the current investments in GenAI by banks of various sizes and the primary benefits they expect from these technologies, such as productivity enhancements and cost reductions.
GenAI, banks, investment, drivers, technology
false
Technology and Digital Transformation
Financial Services
Multiple Chart
EY
Add to my slides
Remove from favorites
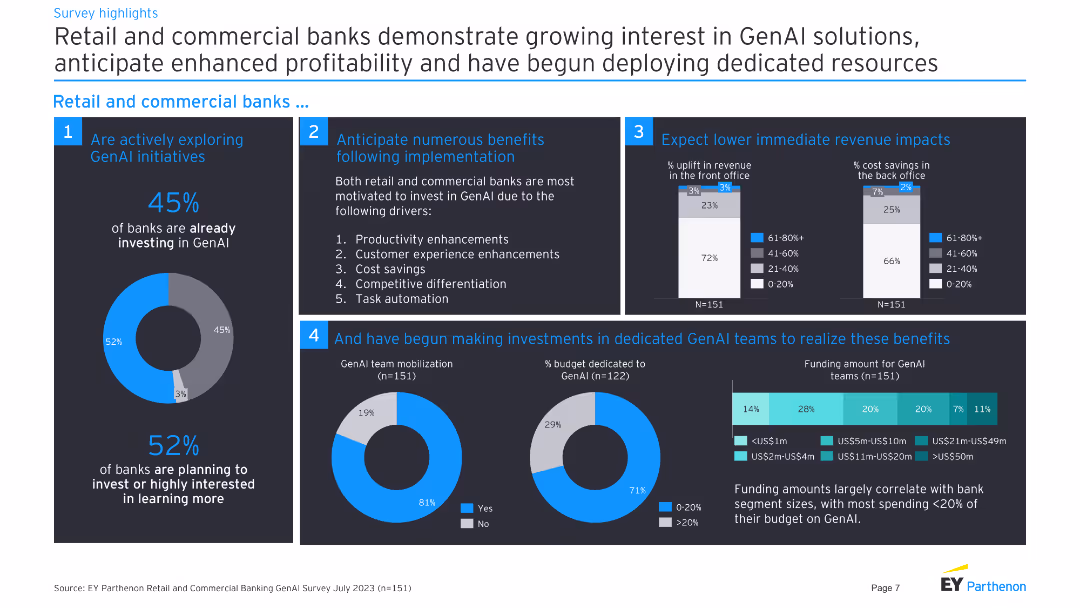
The slide features a combination of pie charts and column charts, along with textual points about the benefits and budget allocations for GenAI solutions in retail and commercial banks.
Technology and Digital Transformation
Financial Services
The slide highlights the growing interest of retail and commercial banks in GenAI technologies, detailing the anticipated benefits and current investment levels in these technologies.
GenAI, banks, profitability, investment, technology
false
Technology and Digital Transformation
Financial Services
Multiple Chart
EY
Add to my slides
Remove from favorites
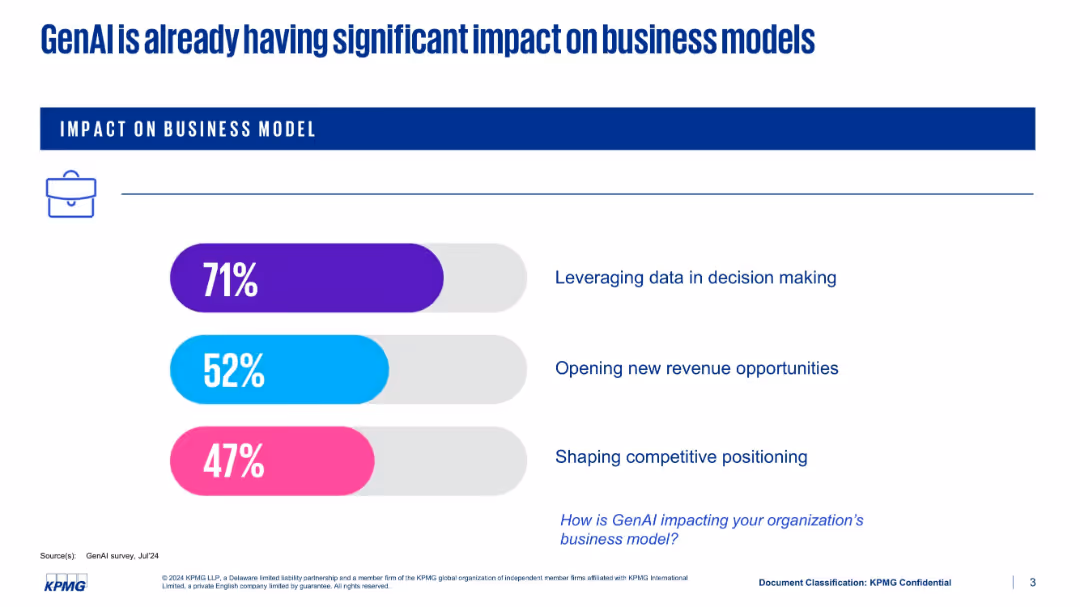
Minimalist slide with three horizontal bars in colored design elements showing percentage impacts; all content centers around business effects.
Product and Service Analysis
Artificial Intelligence
Communicates the transformational impact of GenAI on business models. Key areas include leveraging data in decision-making (71%), opening new revenue (52%), and competitive positioning (47%). It prompts the viewer to consider GenAI’s strategic implications.
GenAI, business models, data-driven decisions, new revenue, competitive positioning, transformation, AI impact
false
Product and Service Analysis
Artificial Intelligence
Single Chart
KPMG
Add to my slides
Remove from favorites
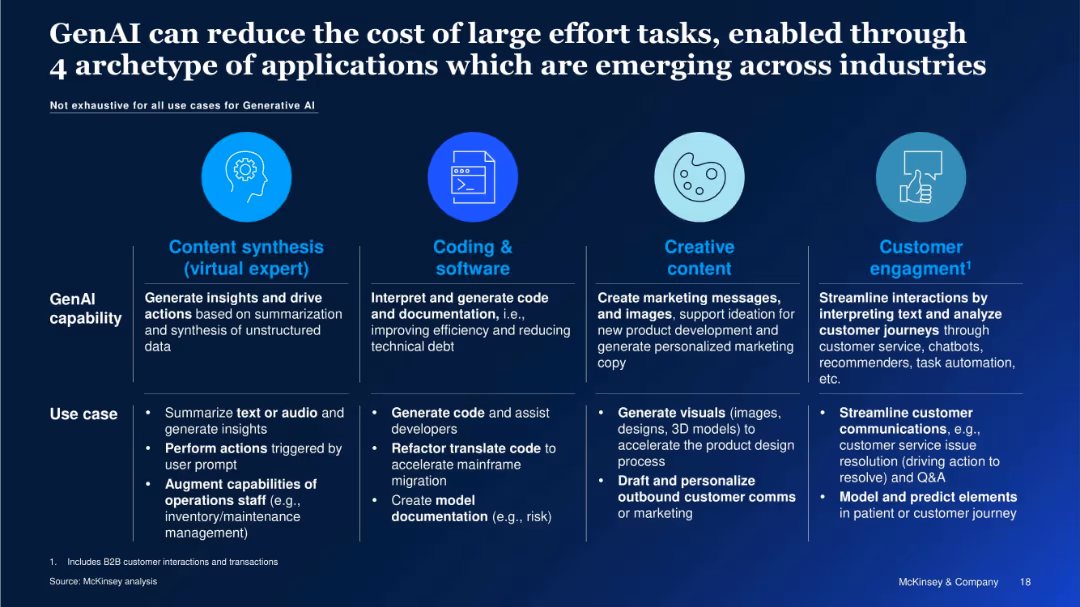
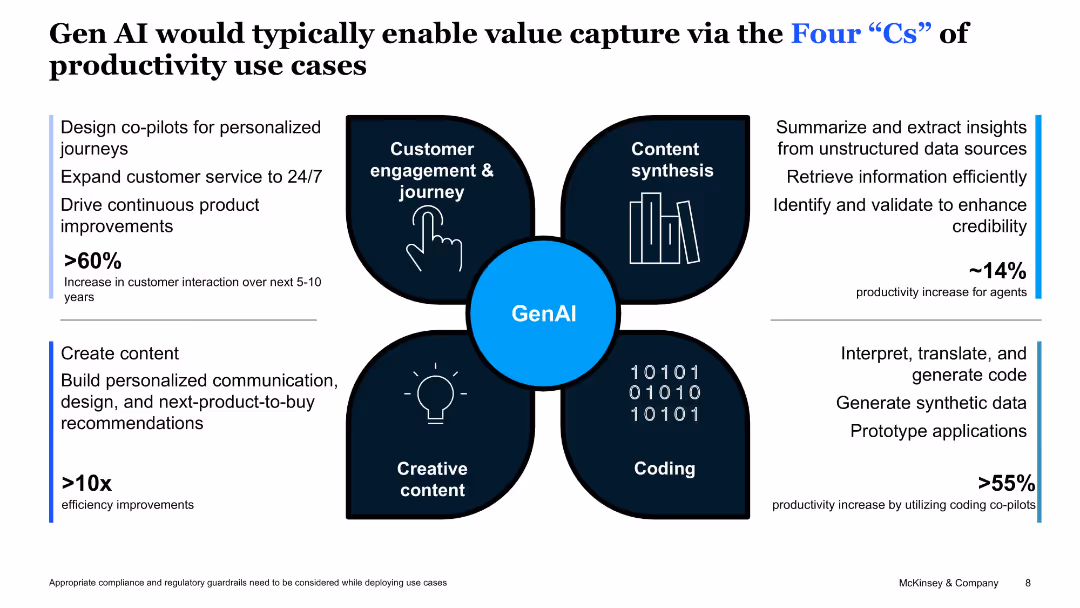
Horizontal layout with 4 circular icons and descriptions under headers: Content synthesis, Coding & software, Creative content, Customer engagement.
Technology and Digital Transformation
Artificial Intelligence
The slide outlines four major archetypes where GenAI adds value by reducing effort and cost: content synthesis, coding, content creation, and customer engagement. Each archetype includes examples and use cases such as automating code, summarizing data, and generating marketing content.
GenAI Capabilities, Content Automation, Code Generation, Marketing Automation, Customer Service, AI Use Cases, Industry Adoption
false
Technology and Digital Transformation
Artificial Intelligence
Table
McKinsey
Add to my slides
Remove from favorites
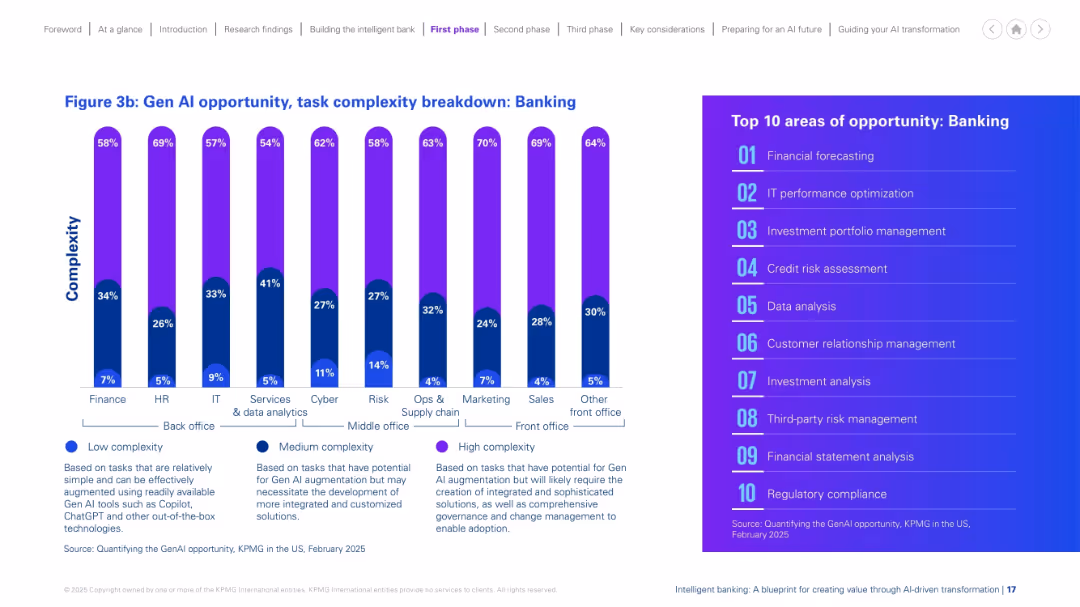
Vertical bar graph showing complexity levels across functions, categorized into low, medium, and high. Bright gradient colors and bold text, paired with a top 10 list on the right.
Market Analysis and Trends
Financial Services
The slide breaks down Gen AI task complexity across banking functions, categorizing tasks as low, medium, or high complexity. Finance, IT, and HR functions show varying levels of potential for augmentation. It also lists the top 10 AI opportunity areas, including forecasting, IT optimization, and risk assessment, highlighting where AI can add the most value.
Gen AI, complexity, functions, opportunity, forecasting, optimization, analysis
false
Market Analysis and Trends
Financial Services
Mixed Chart
KPMG
Add to my slides
Remove from favorites
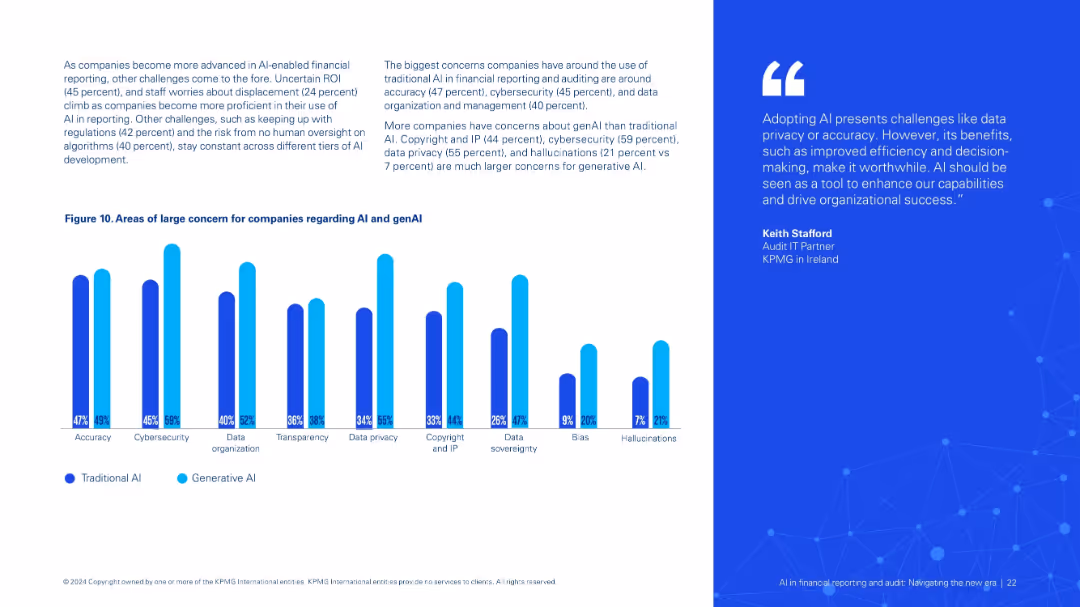
Two-part layout: top includes text on AI-related concerns, bottom features bar chart (Figure 10) comparing traditional AI vs genAI risks.
Risk Assessment and Management
Financial Services
Outlines top concerns for AI and genAI use in auditing, including data privacy, cybersecurity, hallucinations, and IP issues, showing that genAI poses more perceived risks than traditional AI in some areas.
genAI concerns, data privacy, cybersecurity, hallucinations, AI risk, IP
false
Risk Assessment and Management
Financial Services
Mixed Chart
KPMG
Add to my slides
Remove from favorites
Column chart comparing conversion rates of online channels with and without genAI enabled contact centers. Shows significant improvement with genAI integration.
Sales and Business Development
Financial Services
Demonstrates how genAI enabled customer centers significantly increase sales performance by improving conversion rates for online loan applications.
genAI, customer center, sales, conversion rates, online channel
false
Sales and Business Development
Financial Services
Multiple Chart
Kearney
Add to my slides
Remove from favorites
The slide features column charts identifying the departments across front and back office functions that are expected to realize the greatest time and cost savings from GenAI implementation, with a large image.
Customer and Market Segmentation
Financial Services
The slide identifies customer service, onboarding, risk management, and operations as the departments most impacted by GenAI, showing expected time and cost savings from its implementation.
GenAI, customer service, onboarding, risk management, operations
false
Customer and Market Segmentation
Financial Services
Multiple Chart
EY
Add to my slides
Remove from favorites
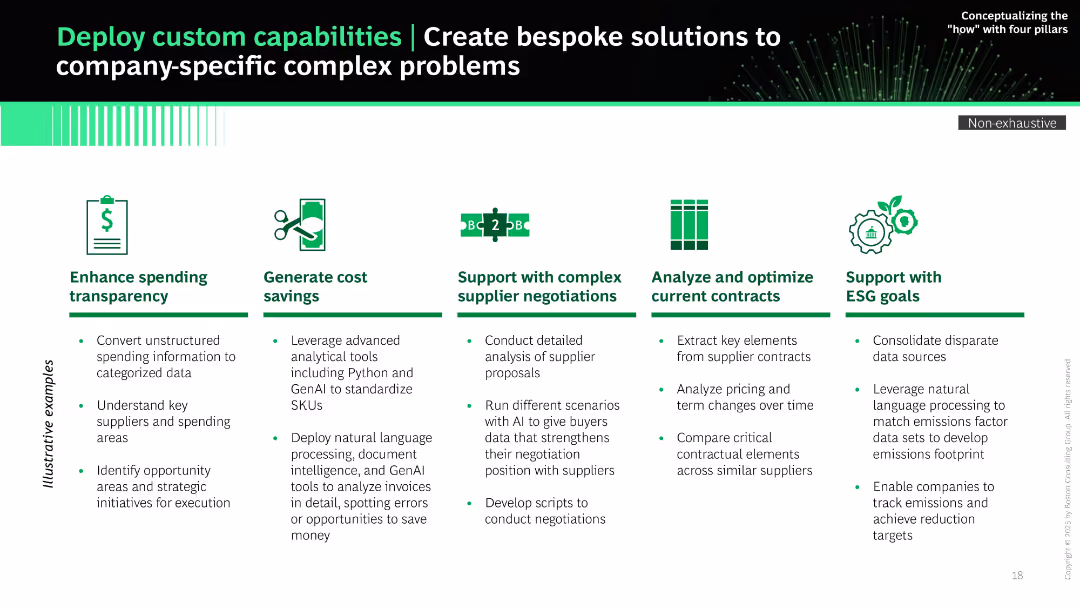
Horizontal layout with six icon-based segments; each column features a heading, icon, and bullet points under “Illustrative examples.” Green and black theme.
Product and Service Analysis
Technology & Software
The slide presents use cases for deploying custom capabilities using advanced analytics and GenAI to solve complex company-specific problems. It includes enhancing transparency, cost savings, supplier negotiation, contract optimization, and ESG goal support.
GenAI, custom solutions, supplier negotiations, ESG, analytics, Python, NLP, contract optimization
false
Product and Service Analysis
Technology & Software
Pillar
BCG
Add to my slides
Remove from favorites
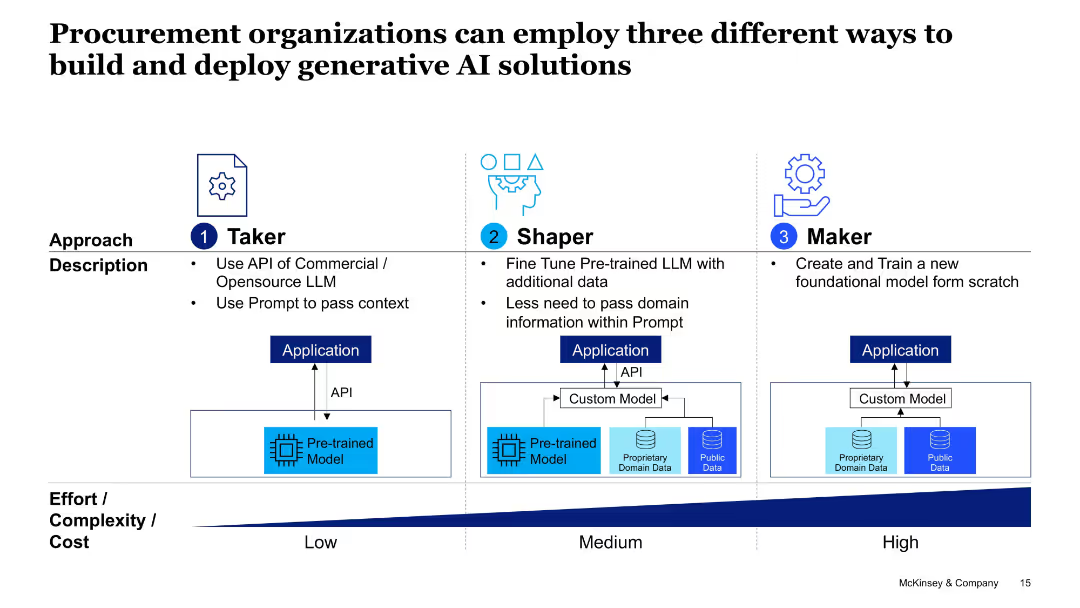
Visual comparison of 3 models (Taker, Shaper, Maker) using application flowcharts; effort/cost axis at bottom.
Technology and Digital Transformation
Professional Services
This slide categorizes three implementation strategies for Gen AI in procurement—using APIs (Taker), fine-tuning models (Shaper), and building models from scratch (Maker)—with increasing complexity and customizability.
GenAI deployment, Taker, Shaper, Maker, LLM, procurement, application model, complexity
false
Technology and Digital Transformation
Professional Services
Table
McKinsey
Add to my slides
Remove from favorites
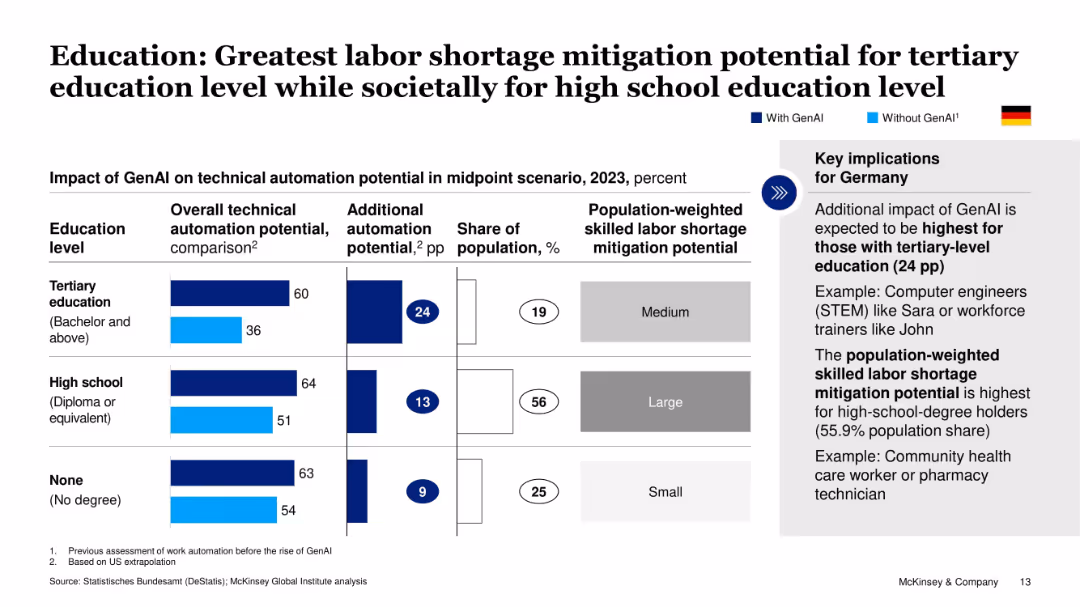
Bar chart and text comparing GenAI’s automation potential by education level (tertiary, high school, none), with implications for Germany.
Human Resources and Talent Management
Education & Training
This slide highlights GenAI’s potential to mitigate skilled labor shortages by education level. The greatest benefit is expected for tertiary-educated workers, though societal impact may be greater for high-school-educated populations.
GenAI, education levels, labor shortages, Germany, technical automation, tertiary education, McKinsey
false
Human Resources and Talent Management
Education & Training
Table
McKinsey
Add to my slides
Remove from favorites
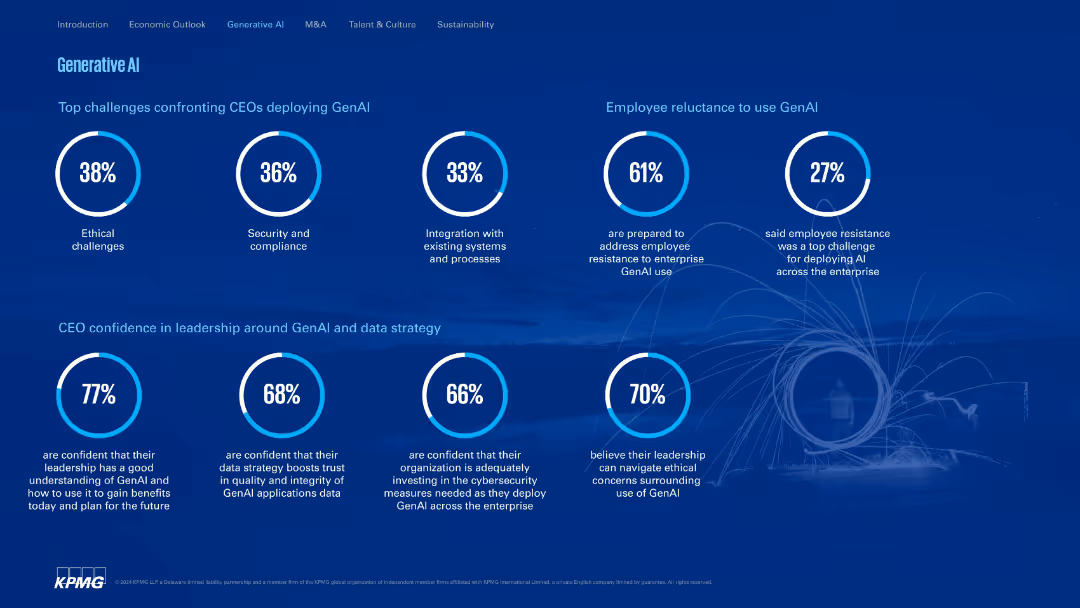
Clean, structured layout with donut charts and circular percentage visuals; dark blue background.
Technology and Digital Transformation
Artificial Intelligence
Addresses CEO concerns around GenAI deployment such as ethics, security, and employee resistance. Highlights leadership confidence in handling GenAI strategy and ethical navigation.
GenAI, ethics, compliance, integration, leadership, resistance, KPMG
false
Technology and Digital Transformation
Artificial Intelligence
Single Chart
KPMG
Add to my slides
Remove from favorites
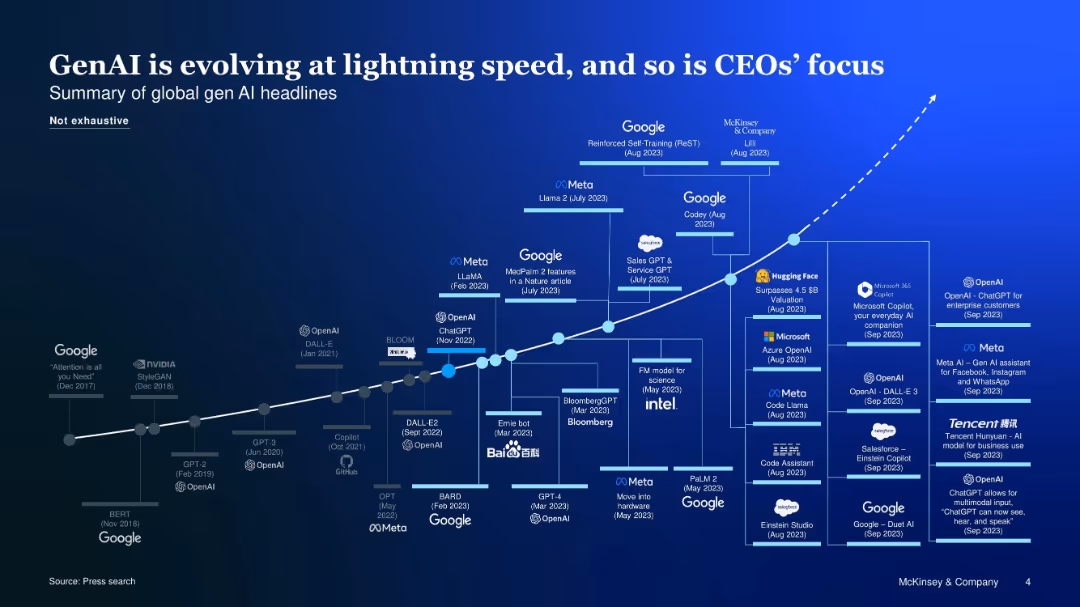
Curved timeline chart with logos and milestones showing GenAI evolution and corporate interest
Market Analysis and Trends
Artificial Intelligence
A visual timeline of key GenAI advancements and corporate initiatives, emphasizing rapid development and increased CEO attention toward AI-driven strategies.
GenAI evolution, timeline, CEOs, corporate focus, tech companies
false
Market Analysis and Trends
Artificial Intelligence
Uncategorized
McKinsey
Add to my slides
Remove from favorites
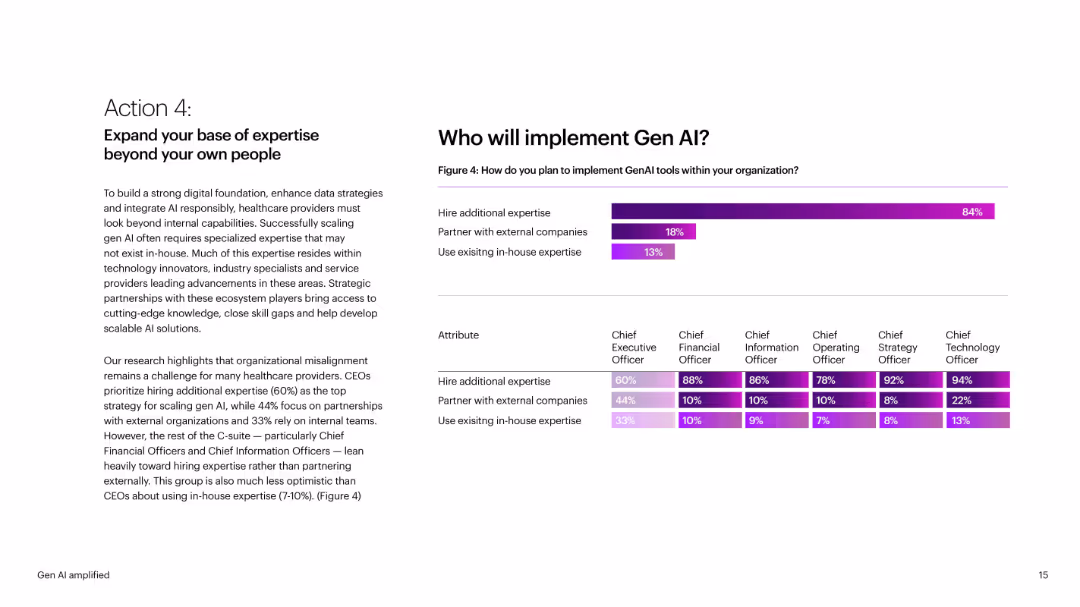
Left-aligned text block with strategic advice. Right side has bar chart and table segmented by C-suite role. Purple highlight bars and white background maintain consistency with brand theme.
Human Resources and Talent Management
Healthcare & Pharmaceuticals
Advises healthcare providers to expand expertise via hiring or partnerships. Provides stats showing that most plan to hire externally for GenAI implementation, with insights into CEO vs. CFO/CIO preferences. Highlights alignment challenges.
GenAI, expertise, hiring, partnerships, C-suite, healthcare, strategy
false
Human Resources and Talent Management
Healthcare & Pharmaceuticals
Mixed Chart
Accenture
Add to my slides
Remove from favorites
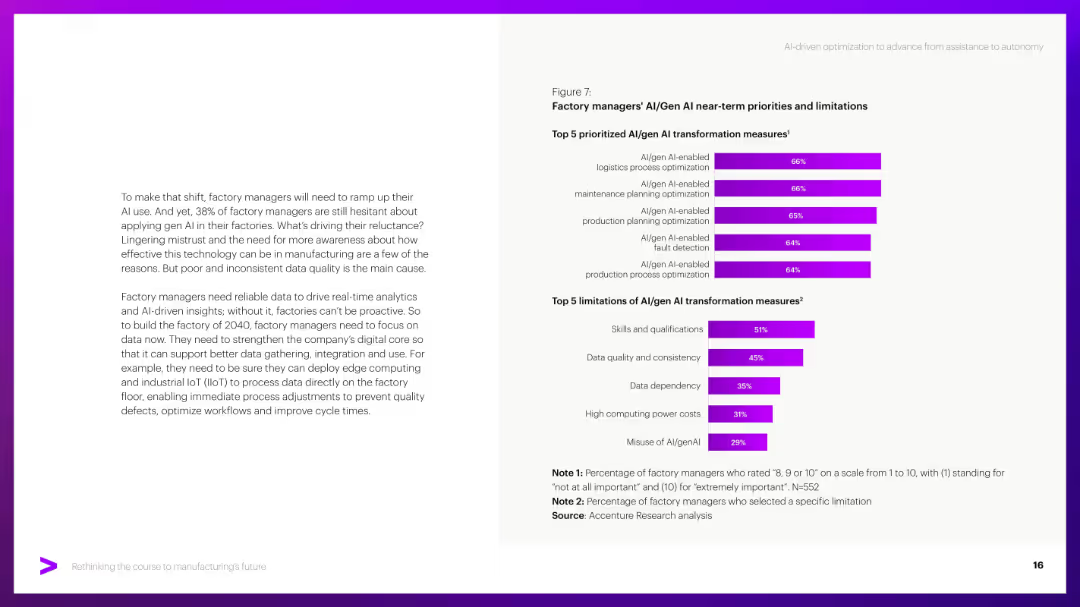
Similar layout to 15913; paragraph left, bar charts right. Focus on AI/Gen AI aspects.
Technology and Digital Transformation
Industrial & Manufacturing
Explores AI/Gen AI transformation priorities like logistics and maintenance optimization. Addresses challenges like data quality, skill gaps, and computing costs based on manager feedback.
Gen AI, factory AI, data quality, AI limitations, transformation
false
Technology and Digital Transformation
Industrial & Manufacturing
Mixed Chart
Accenture
Add to my slides
Remove from favorites
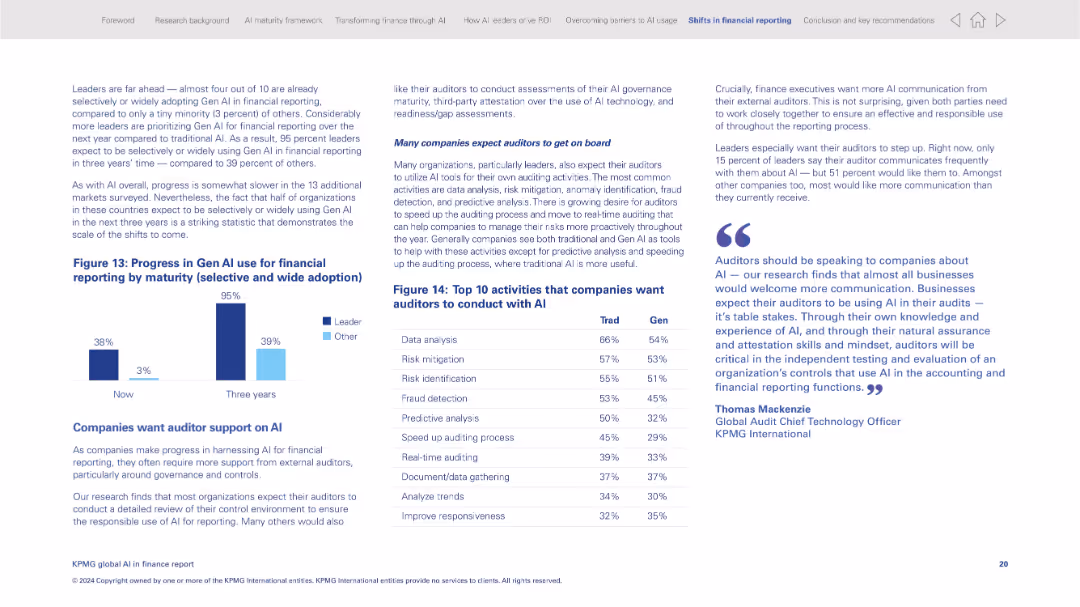
Twin bar graphs comparing adoption by leader vs. others; data table of top auditor activities with AI
Regulatory and Compliance
Financial Services
The slide explores how Gen AI is being adopted in financial reporting by maturity level, with leaders far ahead. It lists activities companies want auditors to conduct with AI tools, showing the intersection of AI and auditing practices.
Gen AI, financial reporting, auditors, regulatory compliance, AI adoption, maturity, AI tools
false
Regulatory and Compliance
Financial Services
Mixed Chart
KPMG
Add to my slides
Remove from favorites
The slide has three charts: one showing the mobilization of GenAI teams, another on funding sources, and a third on budget allocation. Text provides additional insights into survey responses regarding GenAI team mobilization and funding.
Technology and Digital Transformation
Financial Services
This slide highlights survey findings on the mobilization and funding of GenAI teams. It discusses sources of funding and budget allocation for GenAI initiatives within financial services firms.
GenAI, funding, budget allocation, team mobilization, financial services, survey, technology
false
Technology and Digital Transformation
Financial Services
Multiple Chart
EY
Add to my slides
Remove from favorites
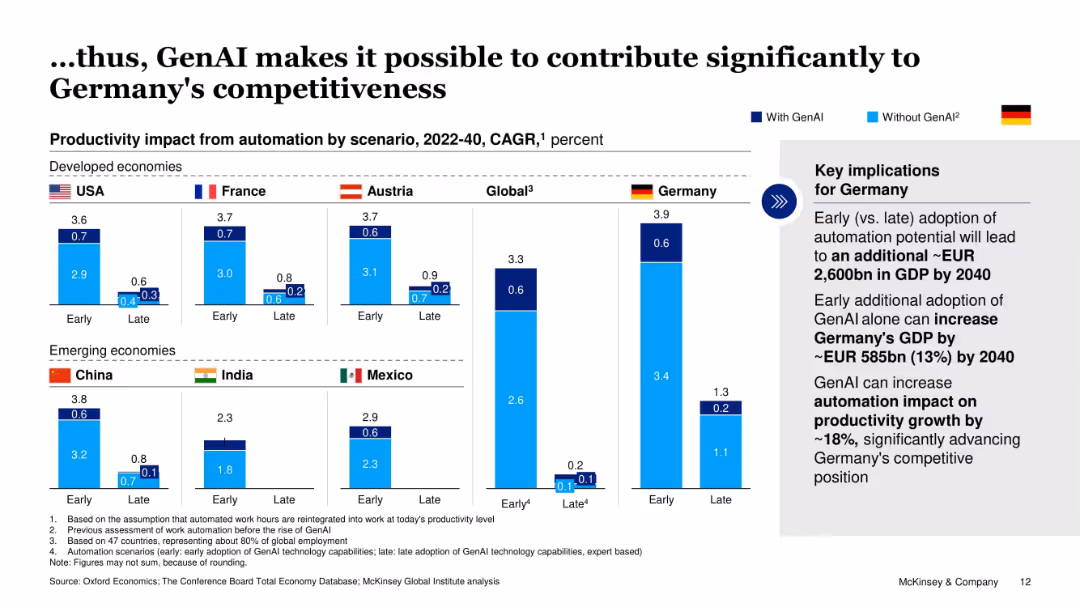
Clustered bar chart comparing productivity impact (CAGR) for early vs. late GenAI adoption across countries (USA, Germany, India, etc.).
Strategic Planning
Artificial Intelligence
This slide shows that early GenAI adoption can significantly boost productivity and GDP in both developed and emerging economies, especially Germany. Germany could gain €2.6 trillion by 2040 with early adoption.
GenAI, GDP growth, automation impact, early vs. late adoption, Germany, productivity, international comparison
false
Strategic Planning
Artificial Intelligence
Mixed Chart
McKinsey
Add to my slides
Remove from favorites
The slide features two column charts. The left chart shows levels of concern about GenAI governance among various respondents, and the right chart shows the status of governance/risk frameworks among firms.
Risk Assessment and Management
Financial Services
This slide presents survey results on the concerns and actions regarding governance and risk frameworks related to Generative AI, highlighting differences across various financial institutions.
GenAI, governance, risk, survey, financial services, framework, column charts, respondents, firms, actions
false
Risk Assessment and Management
Financial Services
Multiple Chart
EY
Add to my slides
Remove from favorites
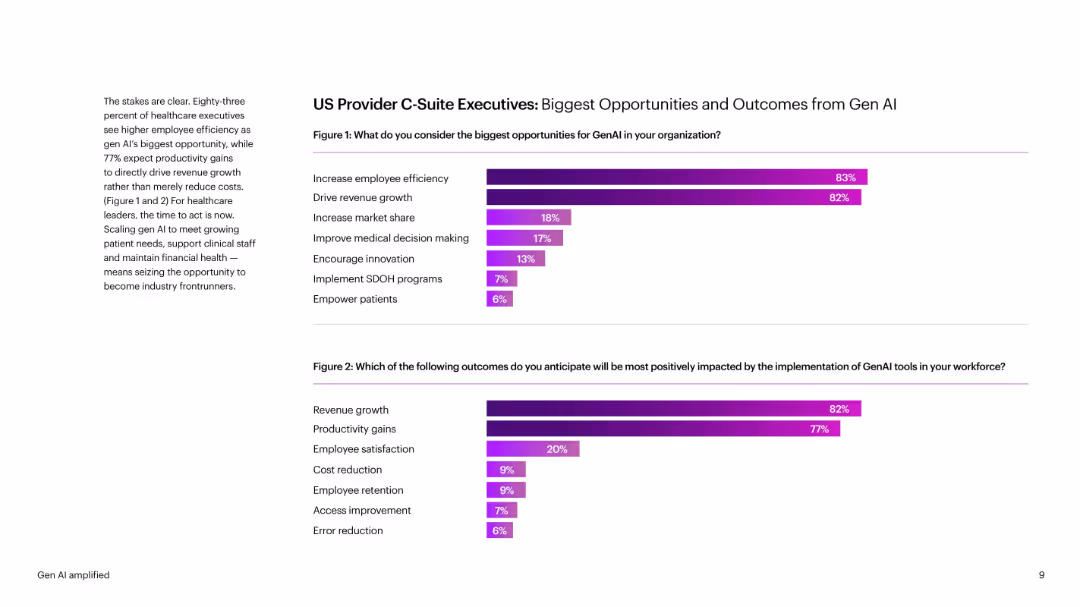
Side-by-side bar charts with percentages, purple gradient bars. Brief explanatory text on the left. Bold headings and clear labels enhance readability.
Technology and Digital Transformation
Healthcare & Pharmaceuticals
Shows healthcare executives’ views on GenAI benefits—primarily employee efficiency and revenue growth. Also shows anticipated outcomes like satisfaction and cost reduction. Provides quantitative survey data segmented by impact.
GenAI, healthcare, C-suite, productivity, revenue, satisfaction, decision-making
false
Technology and Digital Transformation
Healthcare & Pharmaceuticals
Multiple Chart
Accenture
Add to my slides
Remove from favorites
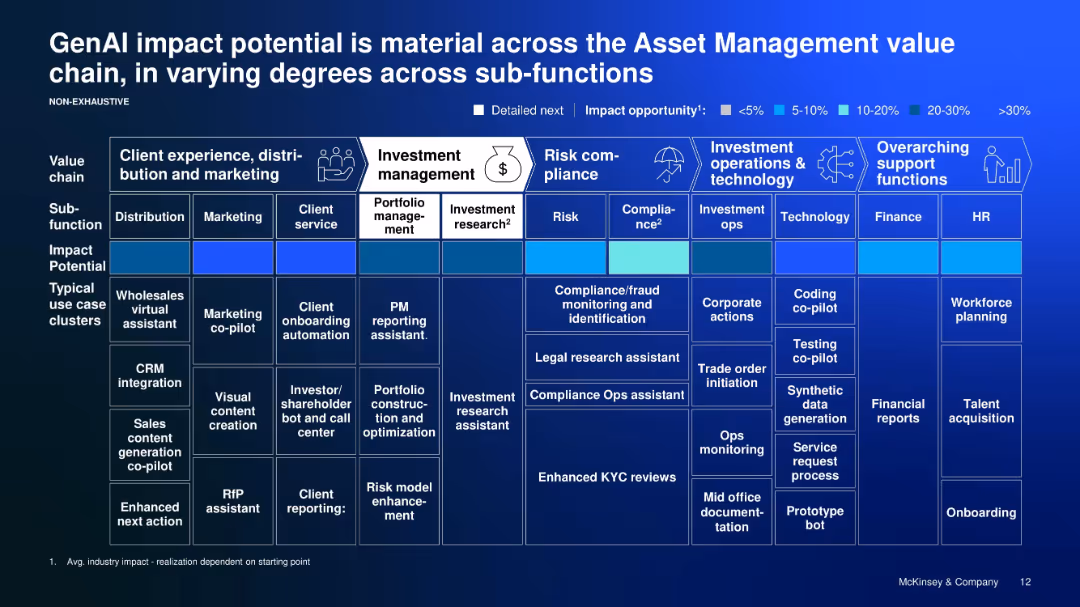
Matrix chart with color-coded impact scores across value chain sub-functions
Product and Service Analysis
Financial Services
Highlights specific GenAI use cases and their relative impact across asset management functions—from marketing and research to compliance and operations—using a color-coded grid for quick reference.
GenAI impact, asset management, use cases, sub-functions, color matrix
false
Product and Service Analysis
Financial Services
Table
McKinsey
Add to my slides
Remove from favorites
The slide includes a bar chart rating the impact of GenAI on various functions like client service, marketing, and compliance. Commentary at the bottom provides insights from different financial sectors.
Technology and Digital Transformation
Financial Services
This slide shows how Generative AI is expected to impact various business functions based on survey responses. It highlights significant changes anticipated in contact centers, client onboarding, and other areas.
GenAI, impact, business functions, client service, marketing, compliance, survey, financial services
false
Technology and Digital Transformation
Financial Services
Mixed Chart
EY
Add to my slides
Remove from favorites
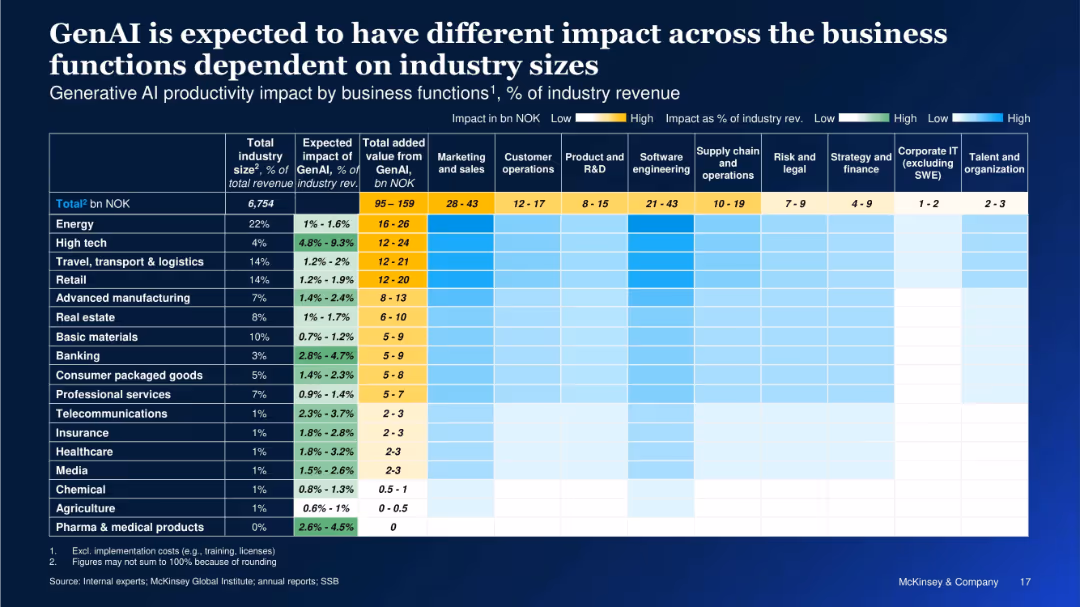
Heatmap and table showing GenAI impact across industries and functions, with percentages and value-added estimates in NOK.
Performance Metrics and KPIs
Artificial Intelligence
This slide quantifies the impact of GenAI across industries and business functions in terms of percentage of industry revenue and NOK value. It highlights where productivity gains are expected to be highest, with columns for different business areas like software engineering and marketing.
GenAI Impact, Industry Revenue, Business Functions, Value Creation, Productivity, Heatmap, Sector Comparison, NOK Value, Revenue Uplift
false
Performance Metrics and KPIs
Artificial Intelligence
Single Chart
McKinsey
Add to my slides
Remove from favorites
Left: column chart on stage of investment by deposit size. Right: bar chart on funding sources for GenAI teams.
Technology and Digital Transformation
Financial Services
Indicates that 61% of banks have launched or soft-launched GenAI applications, funded mainly by IT/tech budgets.
GenAI, investment, deployment, IT funding, banking
false
Technology and Digital Transformation
Financial Services
Multiple Chart
EY
Add to my slides
Remove from favorites
Two bar charts showing average annual capital and total factor productivity contributions to real potential GDP growth from 2020-25 and 2025-33, highlighting scenarios of trend, baseline, and optimistic growth.
Market Analysis and Trends
Financial Services
The slide highlights the potential boost to global economic growth from stronger investment and productivity growth driven by GenAI, with significant contributions expected across major economies.
GenAI, investment growth, productivity, GDP growth, economic forecast, 2025-33
false
Market Analysis and Trends
Financial Services
Multiple Chart
EY
Add to my slides
Remove from favorites
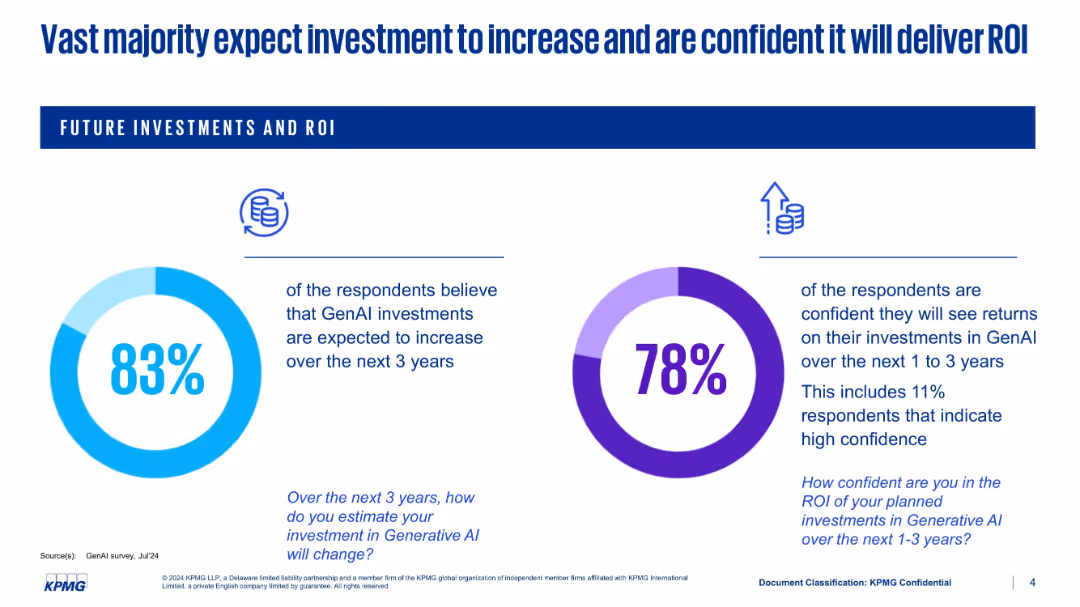
Dual pie chart-style graphics with brief explanations; simple layout with bold percentage visuals; header emphasizes future expectations.
Investment Analysis
Artificial Intelligence
Presents optimism surrounding GenAI investments. 83% believe investments will increase over 3 years; 78% are confident in achieving ROI. Shows growing strategic confidence in the value proposition of GenAI amid rising enterprise focus.
GenAI investment, ROI, future planning, strategic confidence, AI return, tech funding, survey results
false
Investment Analysis
Artificial Intelligence
Single Chart
KPMG
Add to my slides
Remove from favorites
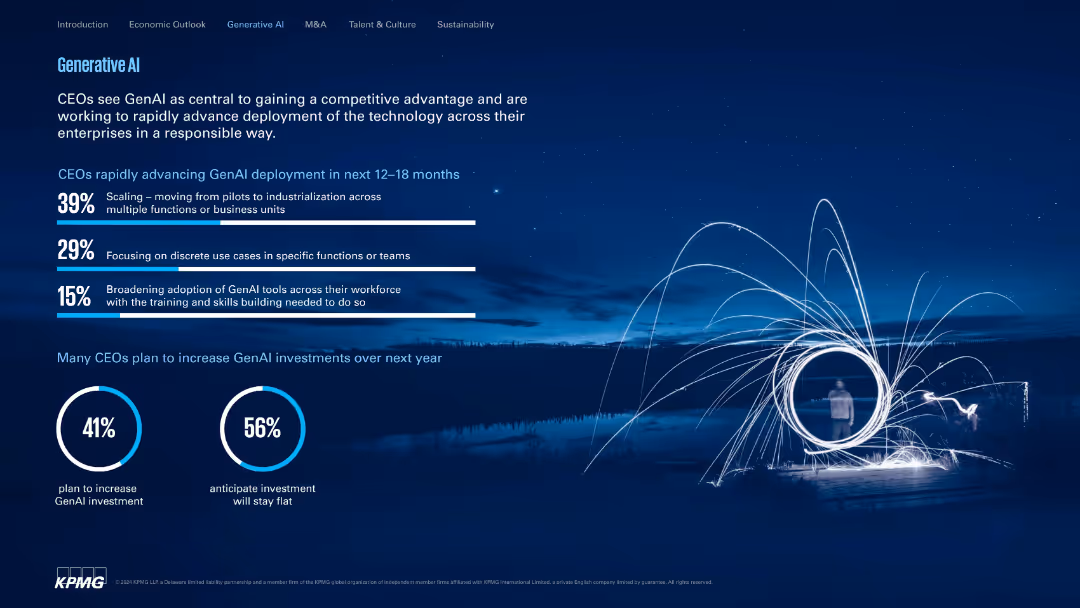
Blue-themed visual with a focus on bar graphs and circular stats. Stylized background image of light art.
Technology and Digital Transformation
Artificial Intelligence
CEOs see GenAI as a strategic advantage. The slide shows deployment priorities over the next 12–18 months, such as scaling and use case focus, alongside planned investment outlooks for the year.
GenAI, investment, scaling, enterprise, AI adoption, strategy
false
Technology and Digital Transformation
Artificial Intelligence
Multiple Chart
KPMG
Add to my slides
Remove from favorites
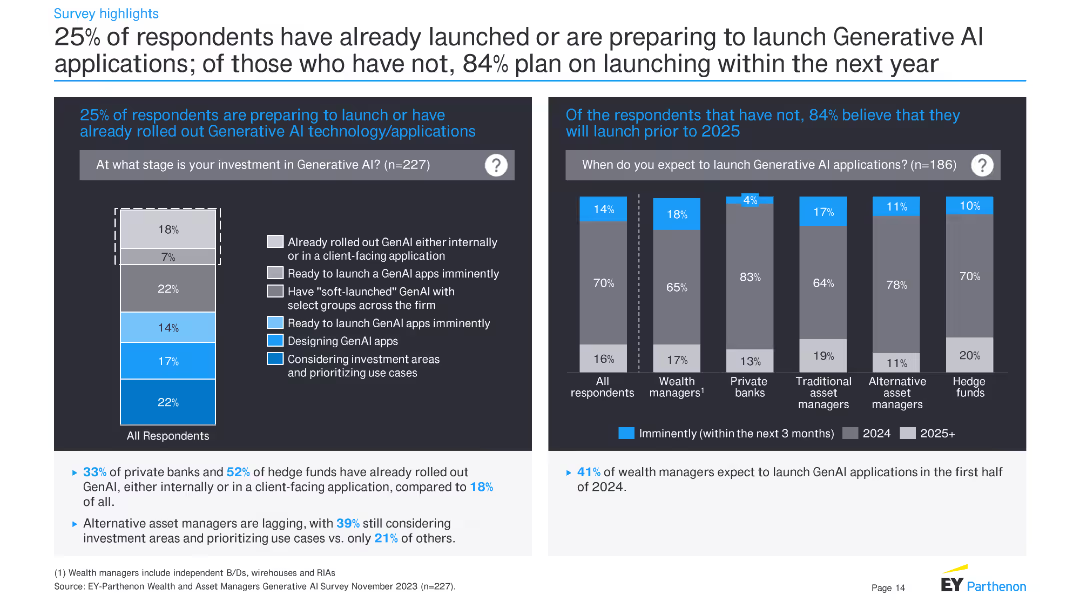
This slide contains two bar charts: one showing the stages of investment in GenAI applications and another on the expected timeline for launching GenAI applications. Text explains survey responses regarding investment and launch plans.
Technology and Digital Transformation
Financial Services
The slide presents survey data on the stages of investment in GenAI applications and expected timelines for launching these applications. It provides insights into the current state and future plans for GenAI adoption.
GenAI, investment, stages, launch plans, financial services, survey, technology, adoption
false
Technology and Digital Transformation
Financial Services
Multiple Chart
EY
Add to my slides
Remove from favorites
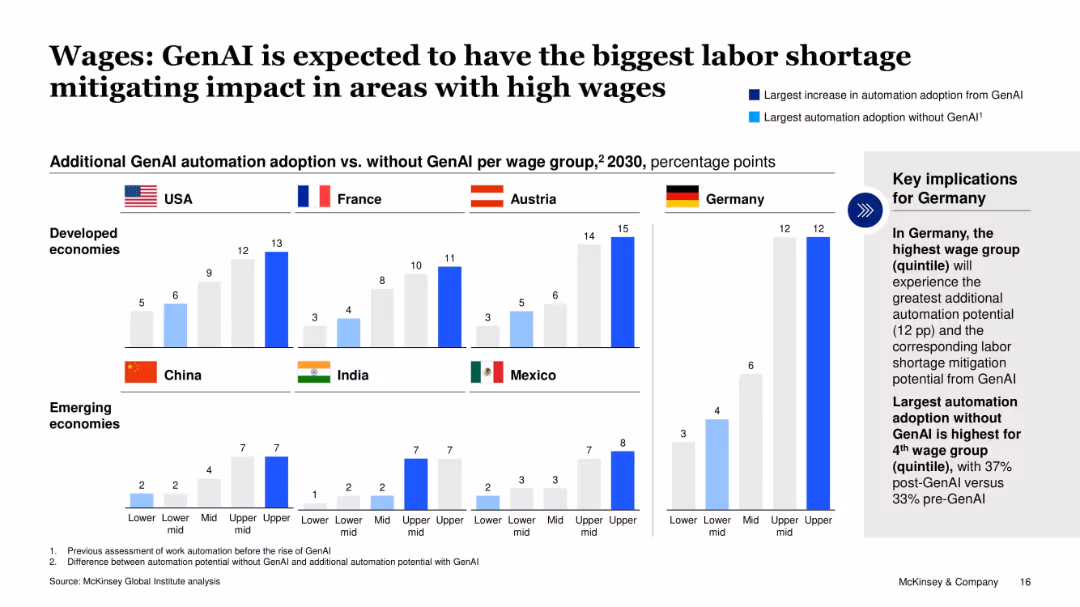
Comparative bar charts showing GenAI-driven automation adoption by wage group and country; includes key takeaway box for Germany.
Strategic Planning
Artificial Intelligence
The slide illustrates how GenAI adoption will disproportionately impact high-wage groups across various developed and emerging economies, particularly in Germany, by mitigating labor shortages. It contrasts automation potential with and without GenAI, showing significant gains in higher wage quintiles.
GenAI, labor shortage, automation, wage groups, Germany, high-income, workforce, 2030, impact
false
Strategic Planning
Artificial Intelligence
Mixed Chart
McKinsey
Add to my slides
Remove from favorites
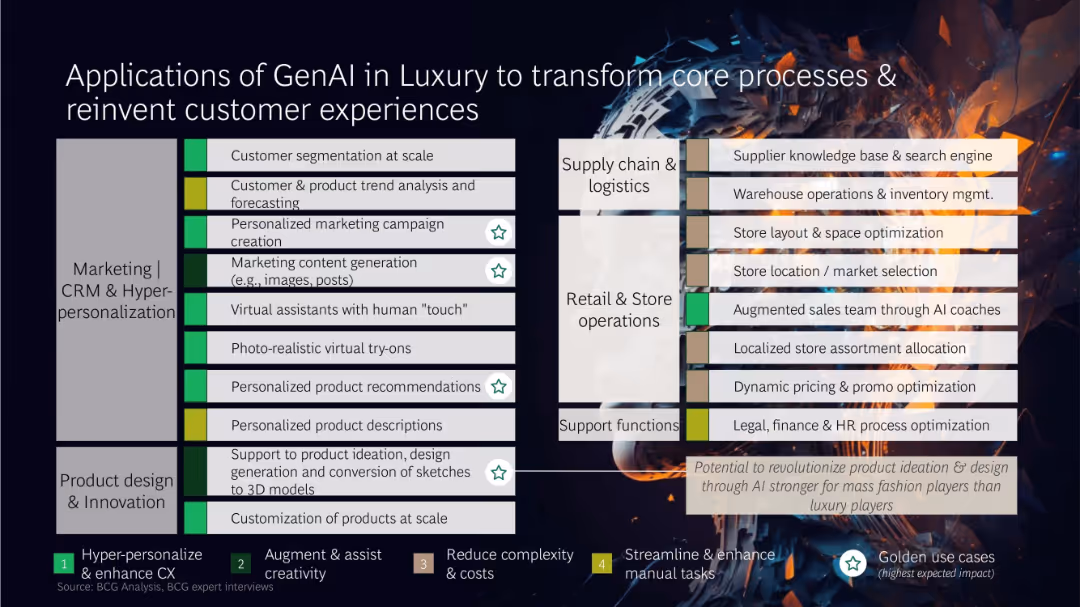
Matrix layout categorizing GenAI use cases across business functions, with color-coded impact labels and icons
Technology and Digital Transformation
Artificial Intelligence
This slide presents a comprehensive matrix of GenAI applications across marketing, product design, retail operations, supply chain, and support functions. High-impact use cases include dynamic pricing, AI-assisted sales, and virtual try-ons, transforming both front-end and back-end operations.
GenAI, luxury, CRM, product design, automation, customer experience, AI use cases
false
Technology and Digital Transformation
Artificial Intelligence
Table
BCG
Add to my slides
Remove from favorites
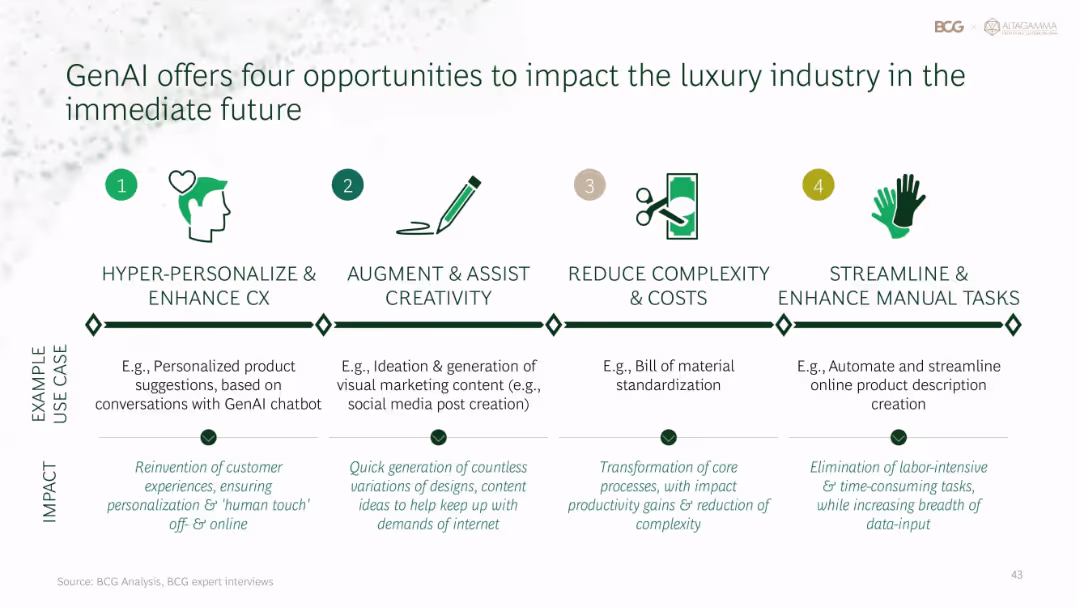
Four-column horizontal layout with icons, labels, examples, and impact text beneath each opportunity
Technology and Digital Transformation
Artificial Intelligence
GenAI can reshape luxury through: 1) hyper-personalized customer experience, 2) creativity augmentation, 3) process simplification, and 4) manual task automation. Use cases range from product recommendations to marketing content and e-commerce automation.
GenAI, luxury industry, personalization, automation, creativity, process improvement
false
Technology and Digital Transformation
Artificial Intelligence
Pillar
BCG
Add to my slides
Remove from favorites
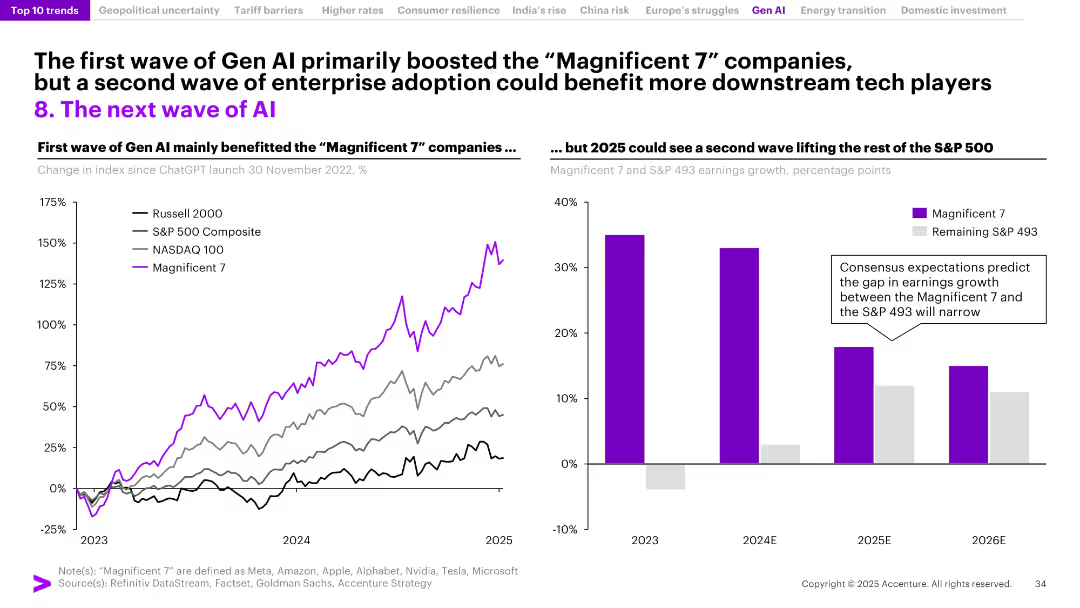
Two-part layout: left graph of index growth post-Gen AI launch; right bar chart comparing Magnificent 7 vs. S&P 493 earnings growth.
Technology and Digital Transformation
Artificial Intelligence
This slide contrasts the Gen AI-driven boom of the Magnificent 7 stocks with forecasts for broader adoption. It suggests that while early gains were concentrated in tech giants, enterprise AI adoption in 2025 may distribute benefits more evenly across the S&P 500.
Gen AI, Magnificent 7, S&P 500, earnings growth, stock indices, enterprise AI, adoption wave, technology sector, market trends
false
Technology and Digital Transformation
Artificial Intelligence
Multiple Chart
Accenture
Add to my slides
Remove from favorites
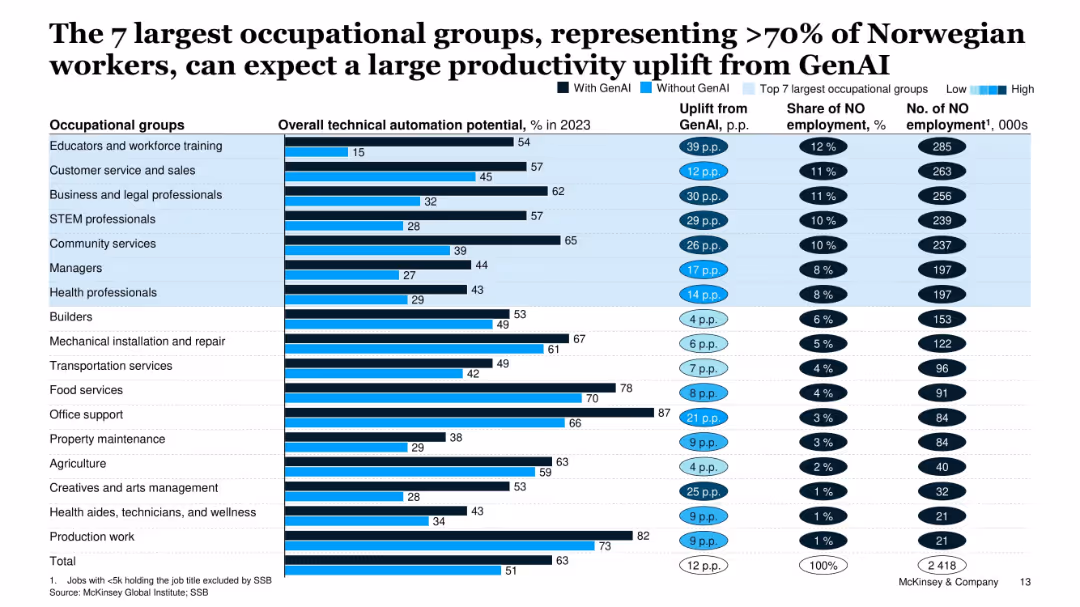
Extensive table layout showing automation potential uplift for major job groups, with % automation, employment share, and uplift from GenAI.
Human Resources and Talent Management
Artificial Intelligence
The slide evaluates the impact of GenAI on the top 7 occupational groups in Norway, which comprise over 70% of the workforce. It shows varying automation potentials and expected productivity gains.
GenAI, occupational groups, productivity uplift, automation, employment, Norway, workforce
false
Human Resources and Talent Management
Artificial Intelligence
Single Chart
McKinsey
Add to my slides
Remove from favorites
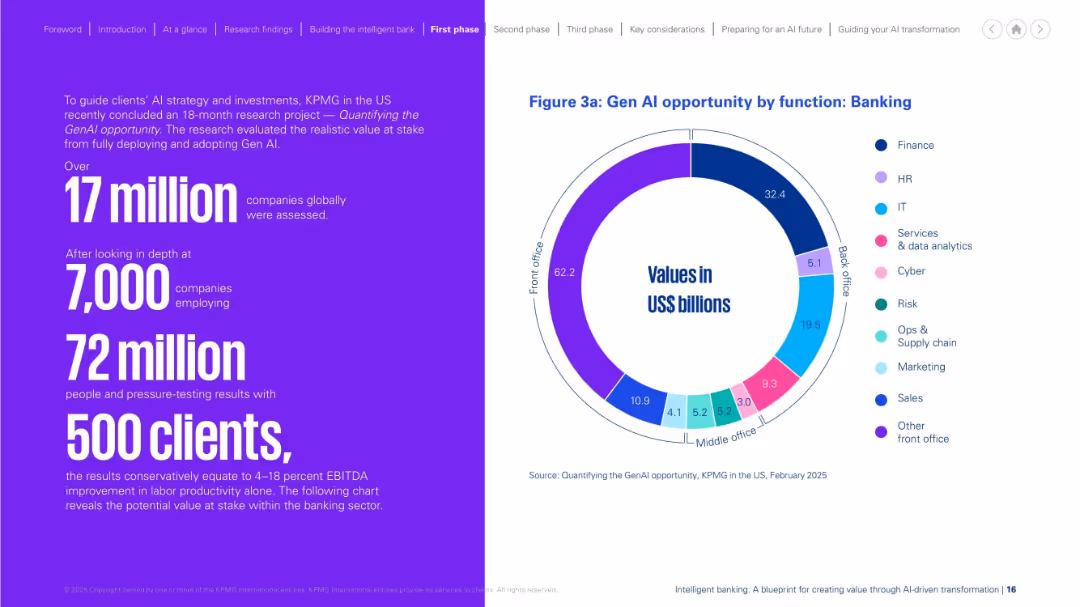
Left side presents research stats in large purple text. Right side includes a colorful circular chart showing value breakdown by banking functions. Neat bifurcation, vibrant colors.
Investment Analysis
Financial Services
This slide quantifies the opportunity of Gen AI in banking, based on KPMG research. It highlights potential value by function, with front-office roles offering the largest gains. The stats support significant productivity and financial impact, derived from analyzing over 17 million companies and thousands of clients globally.
Gen AI, opportunity, banking, productivity, front office, research, KPMG
false
Investment Analysis
Financial Services
Mixed Chart
KPMG
Add to my slides
Remove from favorites
Visual flower-petal-style quadrant illustrating Gen AI use cases: Customer Engagement, Content Synthesis, Creative Content, Coding.
Operational Efficiency
Artificial Intelligence
The slide illustrates four key use cases of Gen AI—enhancing customer interaction, content summarization, personalized content generation, and automated coding—with measurable productivity improvements in each domain.
GenAI, productivity, customer engagement, coding, content, value capture, use cases
false
Operational Efficiency
Artificial Intelligence
Framework
McKinsey
Add to my slides
Remove from favorites
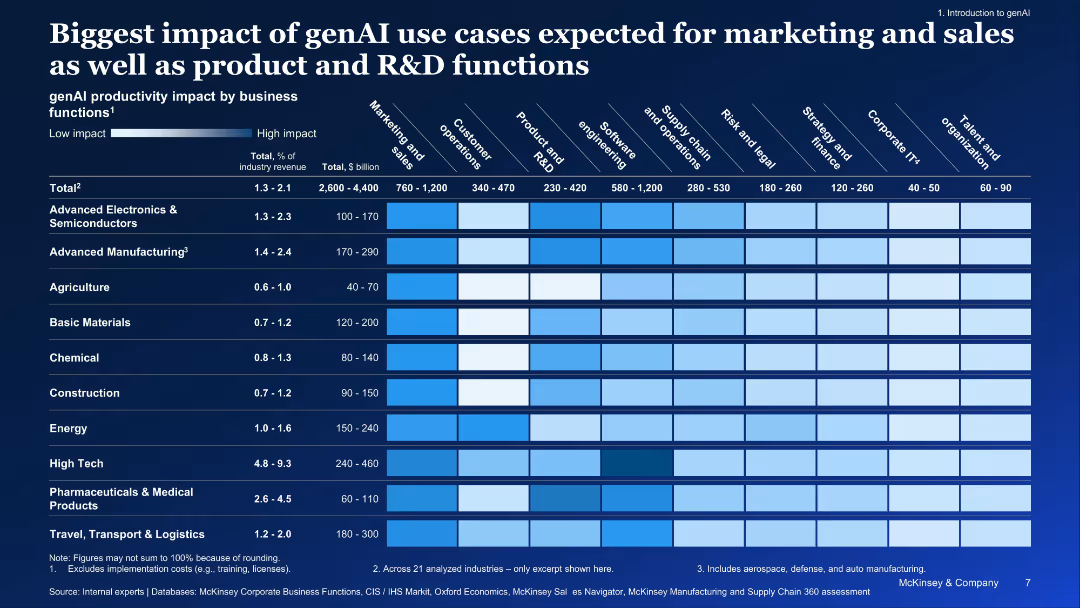
Detailed heatmap matrix showing industry-wise productivity impact across business functions
Performance Metrics and KPIs
Artificial Intelligence
Visualizes productivity impact of genAI across industries and business functions. Greatest impact is projected in marketing, sales, R&D, and software engineering for industries like High Tech and Manufacturing.
genAI, productivity, industry impact, business functions, heatmap, use cases
false
Performance Metrics and KPIs
Artificial Intelligence
Single Chart
McKinsey
Add to my slides
Remove from favorites
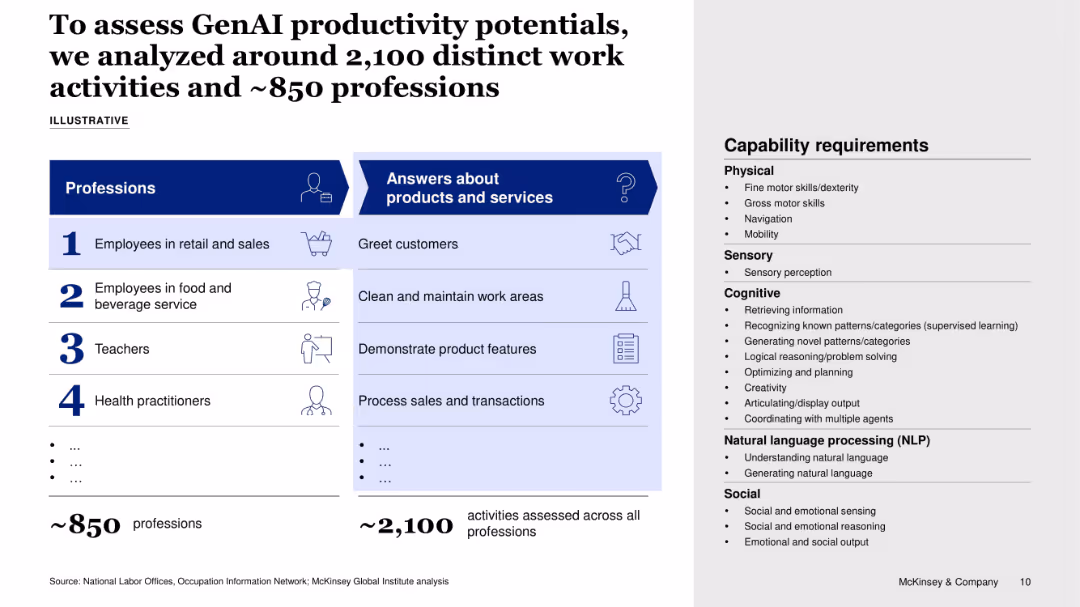
Two-part slide: left side shows professions and related work tasks; right side outlines required capabilities grouped into categories (Physical, Sensory, Cognitive, NLP, Social).
Technology and Digital Transformation
Artificial Intelligence
This slide presents a framework for evaluating GenAI’s productivity potential across ~850 professions and ~2,100 work activities, linking tasks like greeting customers or processing transactions to required physical, cognitive, and social capabilities.
GenAI, productivity, task automation, professions, capabilities, workforce analysis, McKinsey, skills taxonomy
false
Technology and Digital Transformation
Artificial Intelligence
Boxed
McKinsey
Add to my slides
Remove from favorites
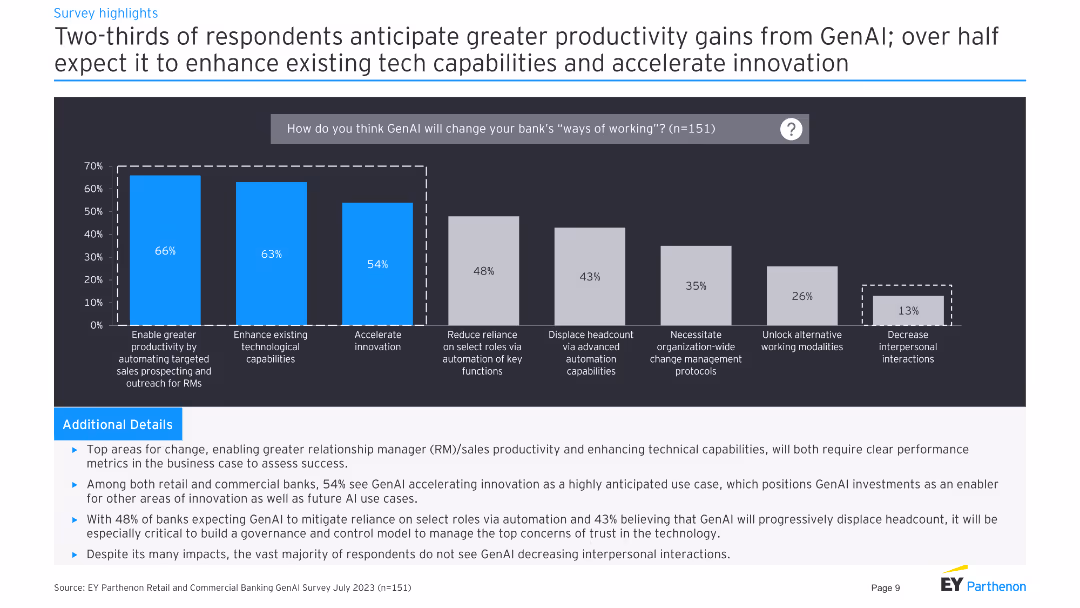
The slide features column charts showing anticipated changes in banks' working methods due to GenAI, focusing on productivity, technological capabilities, and innovation.
Technology and Digital Transformation
Financial Services
The slide discusses the anticipated productivity gains and technological advancements that banks expect from implementing GenAI solutions, based on a survey of respondents.
GenAI, productivity, technology, innovation, banks
false
Technology and Digital Transformation
Financial Services
Mixed Chart
EY
Add to my slides
Remove from favorites
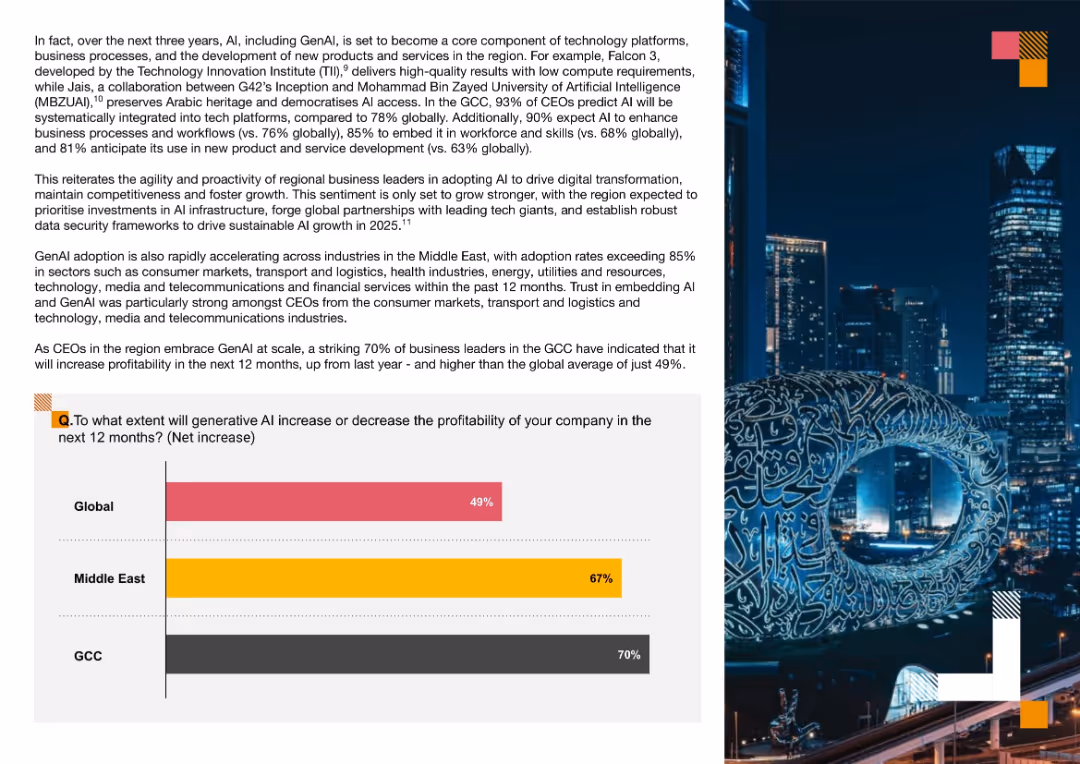
Bar chart comparing Global, Middle East, and GCC views on net increase in profitability from GenAI; dark background photo of cityscape
Financial Performance
Artificial Intelligence
This slide presents survey results showing that GCC CEOs are most optimistic about GenAI increasing profitability in the next year, with 70% projecting gains. The region outpaces global averages.
GenAI, Profitability, AI Optimism, GCC, Technology ROI, Digital Tools, Strategic Investment
false
Financial Performance
Artificial Intelligence
Mixed Chart
PwC/Strategy&
Add to my slides
Remove from favorites
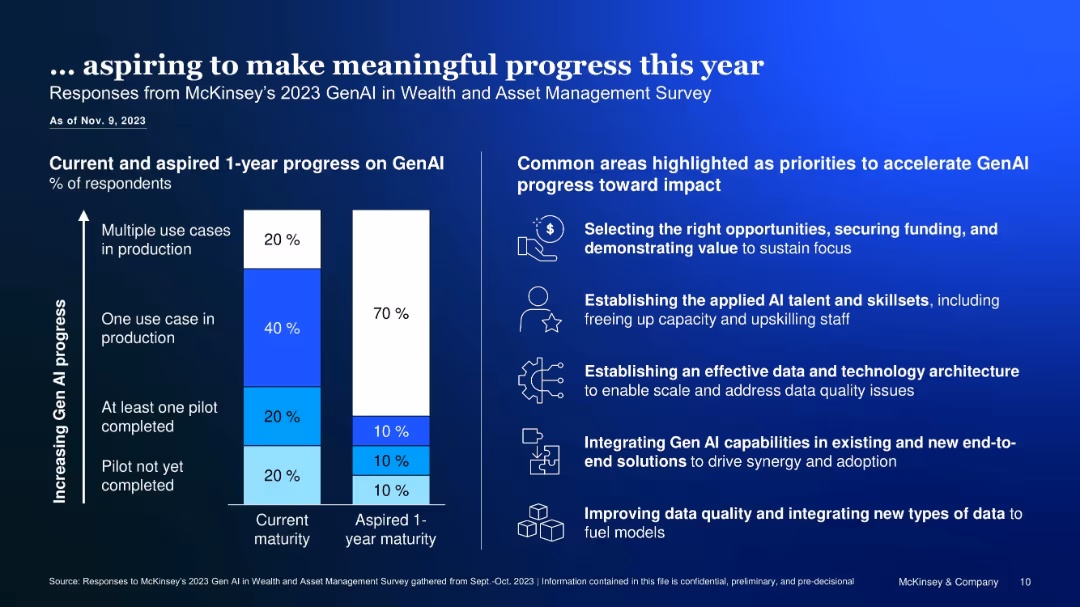
Bar chart with current vs. aspired GenAI progress, plus bullet list of acceleration priorities
Human Resources and Talent Management
Financial Services
Displays 2023 survey results on GenAI maturity in asset management. Identifies major organizational focus areas like talent, architecture, funding, and data to drive AI adoption and scale impact.
GenAI progress, maturity, survey, asset management, AI acceleration
false
Human Resources and Talent Management
Financial Services
Mixed Chart
McKinsey
Add to my slides
Remove from favorites
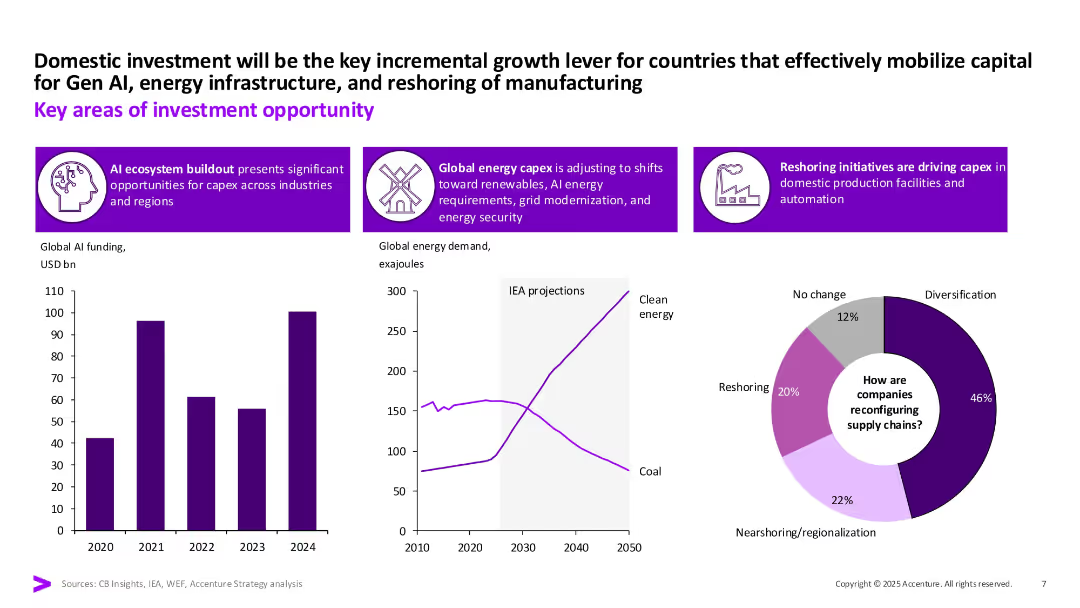
Three-part layout with icon-based headers, three data visualizations (bar chart, line graph, pie chart). Strong purple highlights and white space separate sections clearly.
Strategic Planning
Financial Services
Identifies domestic investment drivers such as GenAI, energy capex, and reshoring. Uses data visualizations to support claims around AI funding, clean energy demand, and supply chain diversification strategies.
GenAI, reshoring, clean energy, capex, investment, supply chains, diversification
false
Strategic Planning
Financial Services
Multiple Chart
Accenture
Add to my slides
Remove from favorites
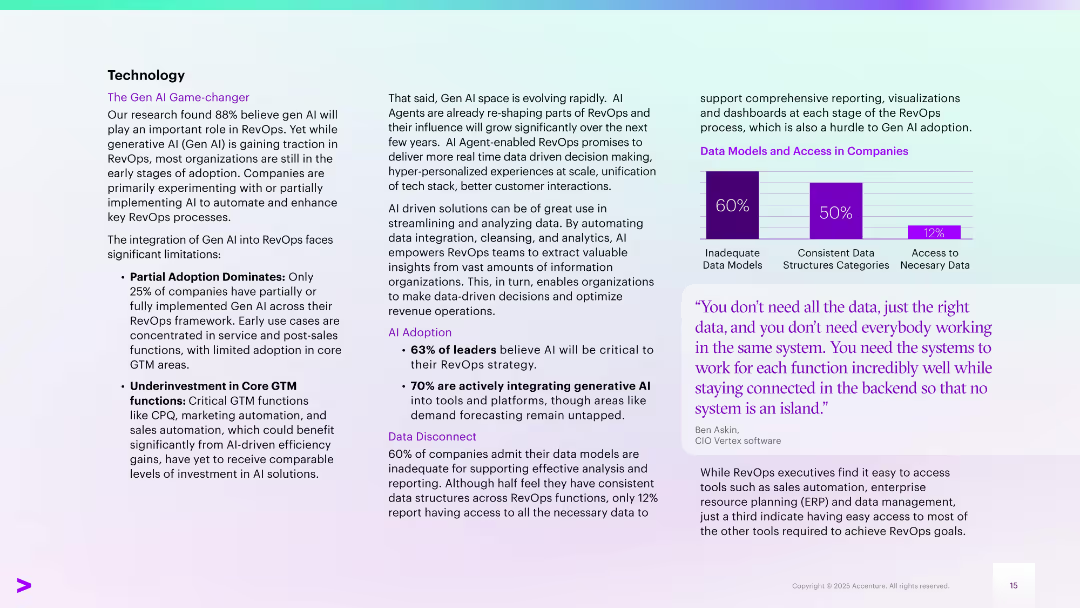
Two-column layout with bullet points on the left and highlighted stats and charts on the right. Includes a purple bar chart and a quote box. Uses purple and teal gradients.
Technology and Digital Transformation
Technology & Software
Discusses Gen AI adoption in RevOps, noting early-stage use, limited adoption in core GTM areas, and investment gaps. Highlights the growing role of AI agents and data integration issues. Features statistics on AI adoption and access to data, with a quote emphasizing the importance of system integration.
Gen AI, RevOps, automation, data models, AI adoption, GTM, integration
false
Technology and Digital Transformation
Technology & Software
Mixed Chart
Accenture
Add to my slides
Remove from favorites
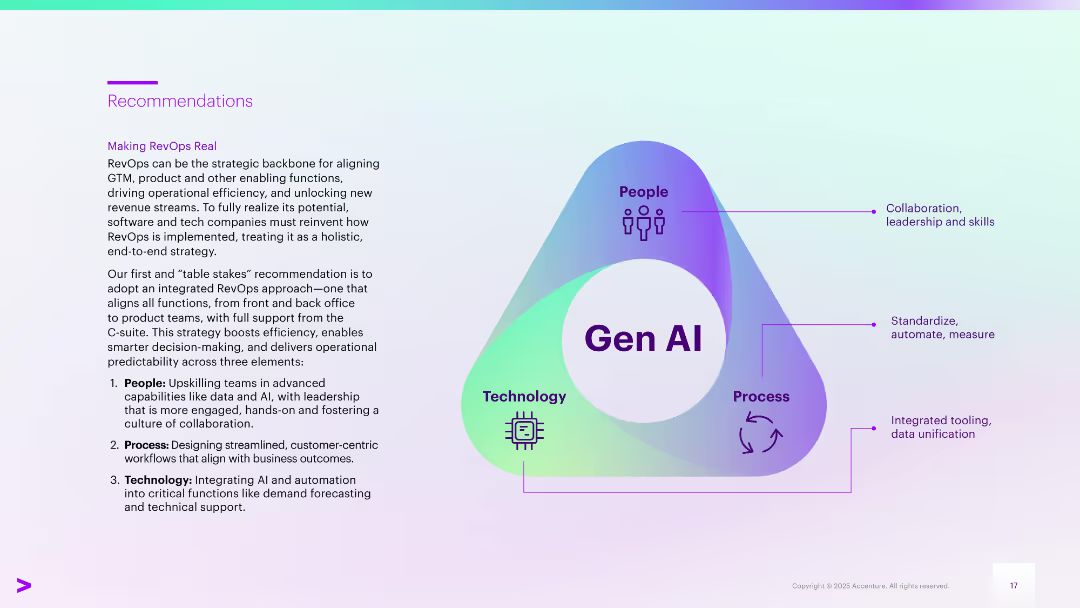
Left-aligned text next to a triangular infographic labeled “Gen AI” at the center, connecting People, Process, and Technology. Each point includes a brief description. Gradient background with purple and teal.
Strategic Planning
Technology & Software
Recommends a holistic, end-to-end RevOps approach leveraging Gen AI. Emphasizes integrating people (skills and leadership), process (workflow design), and technology (AI for automation and forecasting). Aims to enhance decision-making, efficiency, and alignment across business functions.
Gen AI, RevOps, strategic planning, collaboration, automation, upskilling
false
Strategic Planning
Technology & Software
Framework
Accenture
Add to my slides
Remove from favorites
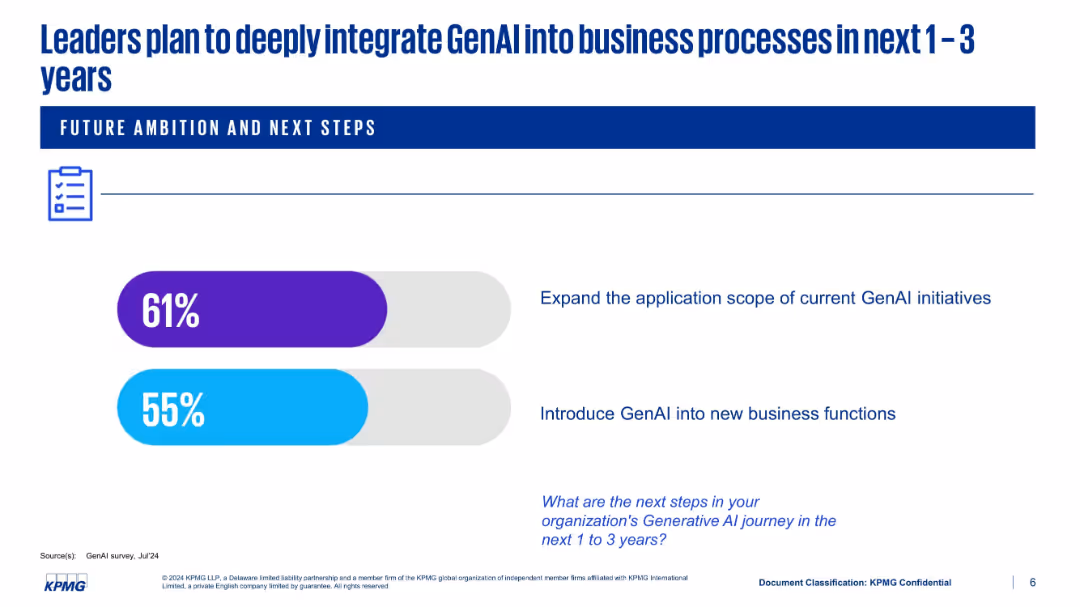
Simple layout with two horizontal progress bars showing future plans: expand scope and introduce into new functions
Strategic Planning
Artificial Intelligence
This slide outlines executive ambitions to scale GenAI integration over the next 1–3 years. 61% of leaders plan to expand current initiatives, while 55% aim to introduce GenAI to new business areas. The layout is minimalistic, focusing attention on the percentages and intended actions.
GenAI roadmap, expansion, business functions, KPMG, adoption, strategy
false
Strategic Planning
Artificial Intelligence
Single Chart
KPMG
Add to my slides
Remove from favorites
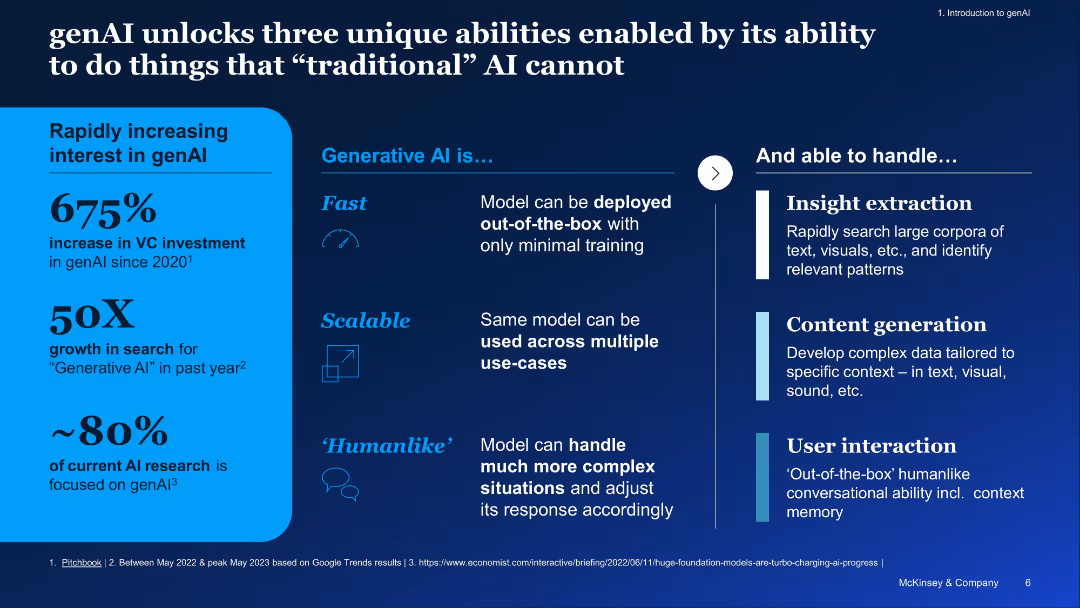
Two-column layout with stats on left and benefits/features on right, emphasizing generative AI’s unique strengths
Product and Service Analysis
Artificial Intelligence
Highlights generative AI’s key advantages (fast deployment, scalability, humanlike behavior) and rapidly increasing interest, including 675% VC investment growth and 80% research focus. Describes genAI’s applications like insight extraction.
genAI, scalability, AI research, VC investment, insight, content generation
false
Product and Service Analysis
Artificial Intelligence
Table
McKinsey
Add to my slides
Remove from favorites
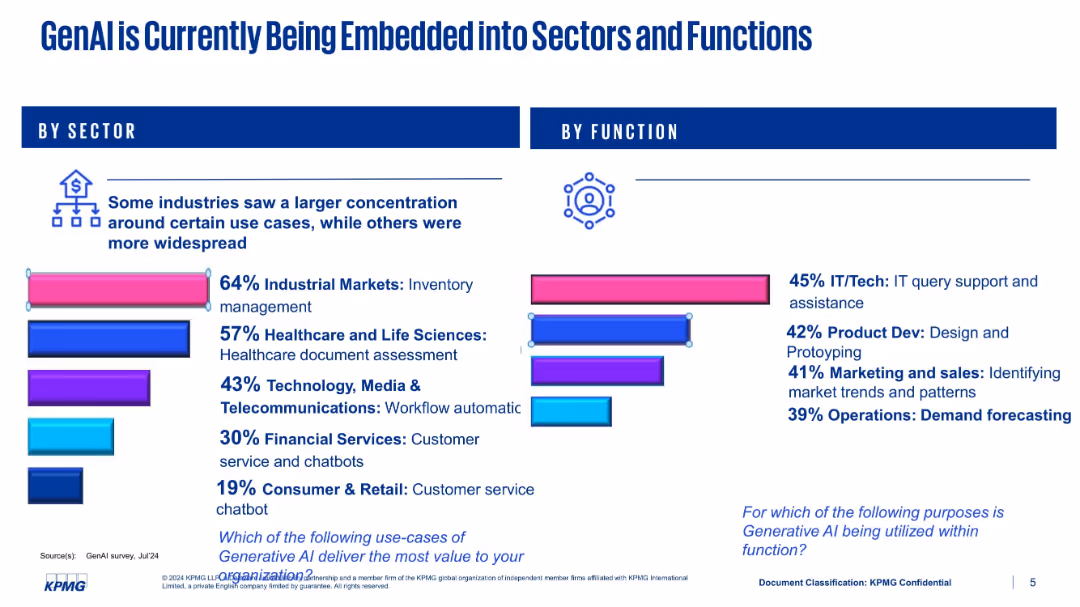
Two-column layout with horizontal bars showing % usage by sector (left) and function (right); icons and text explanations
Strategic Planning
Artificial Intelligence
This slide illustrates how Generative AI (GenAI) is being integrated across different sectors and functions. The left column breaks down usage by industry sector (e.g., Industrial, Healthcare), while the right column shows key functional applications such as IT support, marketing, and operations.
GenAI, sectors, functions, IT, healthcare, operations, KPMG, usage stats
false
Strategic Planning
Artificial Intelligence
Single Chart
KPMG
Add to my slides
Remove from favorites
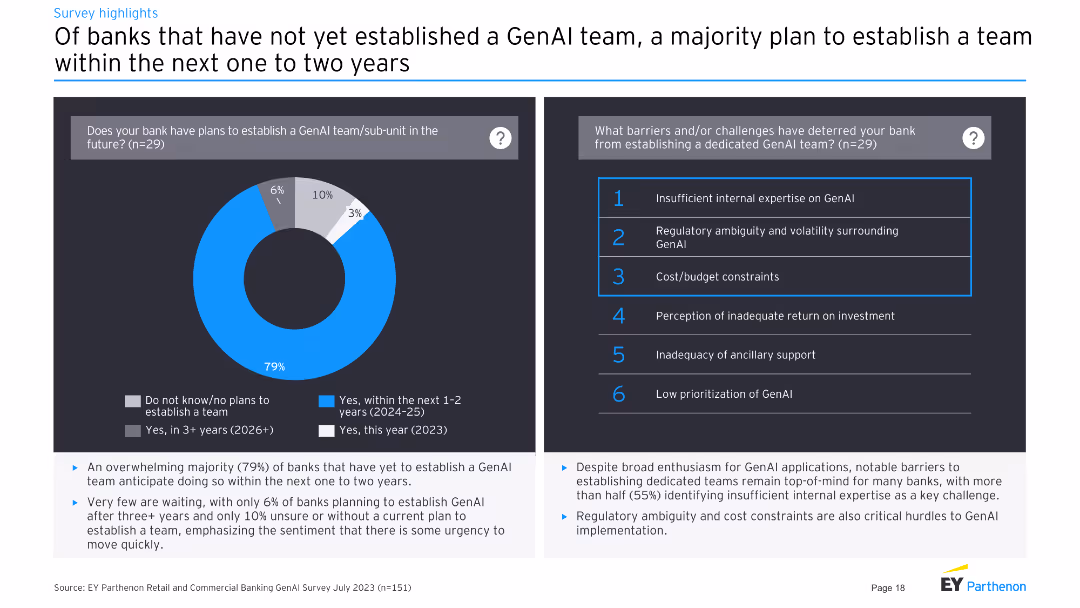
Left: pie chart on plans to establish GenAI teams. Right: list of barriers to establishing GenAI teams.
Human Resources and Talent Management
Financial Services
Majority of banks plan to establish a GenAI team within 1-2 years, facing barriers such as expertise and regulatory ambiguity.
GenAI team, establishment, barriers, expertise, regulation
false
Human Resources and Talent Management
Financial Services
Mixed Chart
EY
Add to my slides
Remove from favorites
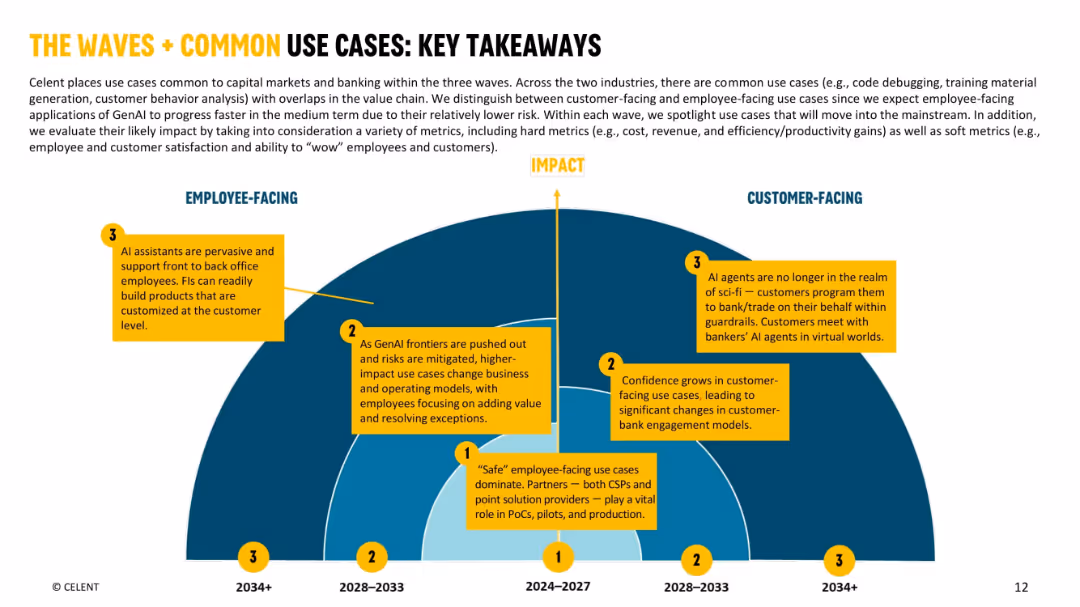
Split semi-circular timeline chart, split vertically into Employee-Facing and Customer-Facing sides. Each side shows three "waves" of AI use case adoption, spanning from 2024 to beyond 2034. Uses orange and yellow annotation boxes and labeled arrows.
Strategic Planning
Financial Services
The slide explains how AI use cases evolve across capital markets and banking from 2024 onward, divided into employee-facing and customer-facing tracks. Each wave indicates increasing complexity and impact. It outlines GenAI’s role in cost reduction, revenue improvement, and engagement by wave progression, highlighting differences between front and back-office transformations.
GenAI, timeline, employee-facing, customer-facing, AI adoption, financial institutions, transformation, impact, banking
false
Strategic Planning
Financial Services
Single Chart
Oliver Wyman
Add to my slides
Remove from favorites
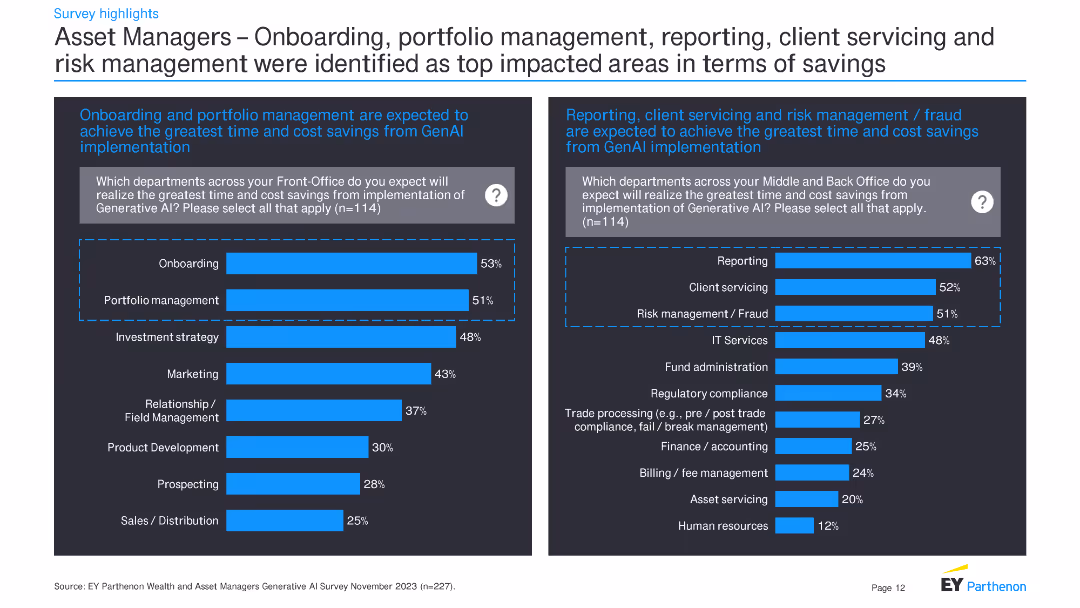
This slide contains two bar charts showing which departments in asset management expect the greatest time and cost savings from GenAI implementation. Additional text provides context and detailed survey findings.
Operational Efficiency
Financial Services
The slide presents survey data on anticipated time and cost savings in asset management from GenAI implementation. It focuses on departments like onboarding, portfolio management, and reporting.
GenAI, time savings, cost savings, asset management, onboarding, portfolio management, reporting, survey
false
Operational Efficiency
Financial Services
Multiple Chart
EY
Add to my slides
Remove from favorites
The slide features two bar charts showing which departments in wealth management expect the greatest time and cost savings from GenAI implementation. Text below provides further context and additional details on survey findings.
Operational Efficiency
Financial Services
This slide highlights survey results on time and cost savings expected in wealth management from GenAI implementation. It identifies client onboarding, marketing, and report generation as key areas of impact.
GenAI, time savings, cost savings, wealth management, client onboarding, marketing, report generation, survey
false
Operational Efficiency
Financial Services
Multiple Chart
EY
Add to my slides
Remove from favorites
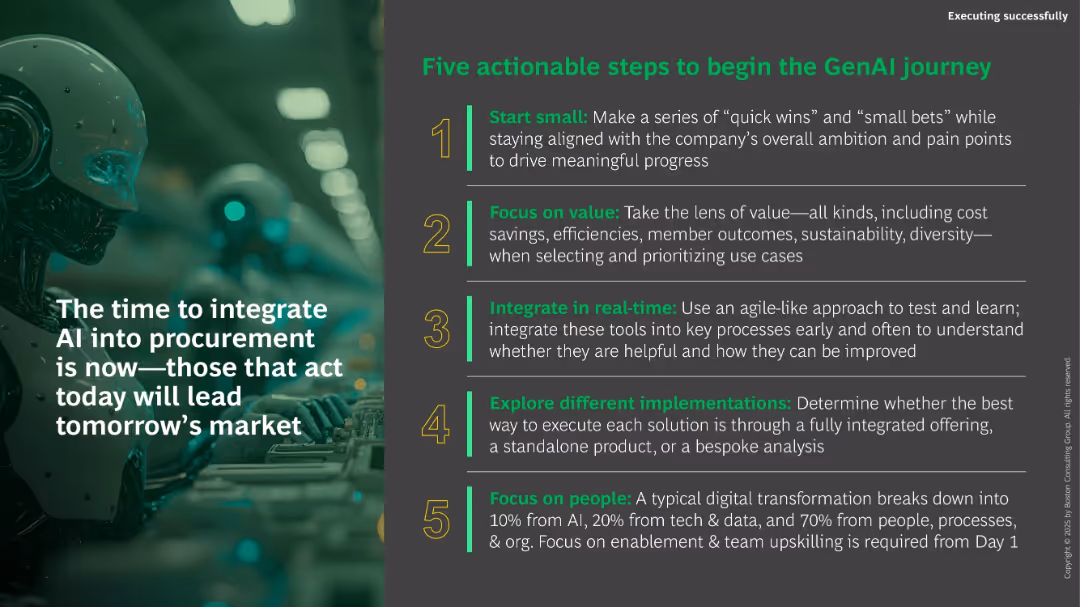
Dark background with large image of a robot. Right panel lists five numbered green/yellow-highlighted steps. Bold, motivational tone.
Strategic Planning
Technology & Software
This motivational closing slide presents five steps for starting a GenAI journey, including starting small, focusing on value, real-time integration, trying multiple approaches, and prioritizing people. It encourages immediate action to lead in tomorrow’s AI-enabled procurement market.
GenAI, transformation, procurement, roadmap, strategy, implementation, action steps, people focus
false
Strategic Planning
Technology & Software
Vertical Flow
BCG
Add to my slides
Remove from favorites
The slide includes two charts: one on the number of GenAI use cases identified, and the other on the viability of full automation with GenAI. Text details the survey responses and projections for automation in the next five years.
Technology and Digital Transformation
Financial Services
This slide discusses the number of identified GenAI use cases and the viability of full automation within firms. It presents data on current and future expectations of automation viability across various financial sectors.
GenAI, use cases, automation, viability, financial services, survey, projections, technology
false
Technology and Digital Transformation
Financial Services
Multiple Chart
EY
Add to my slides
Remove from favorites
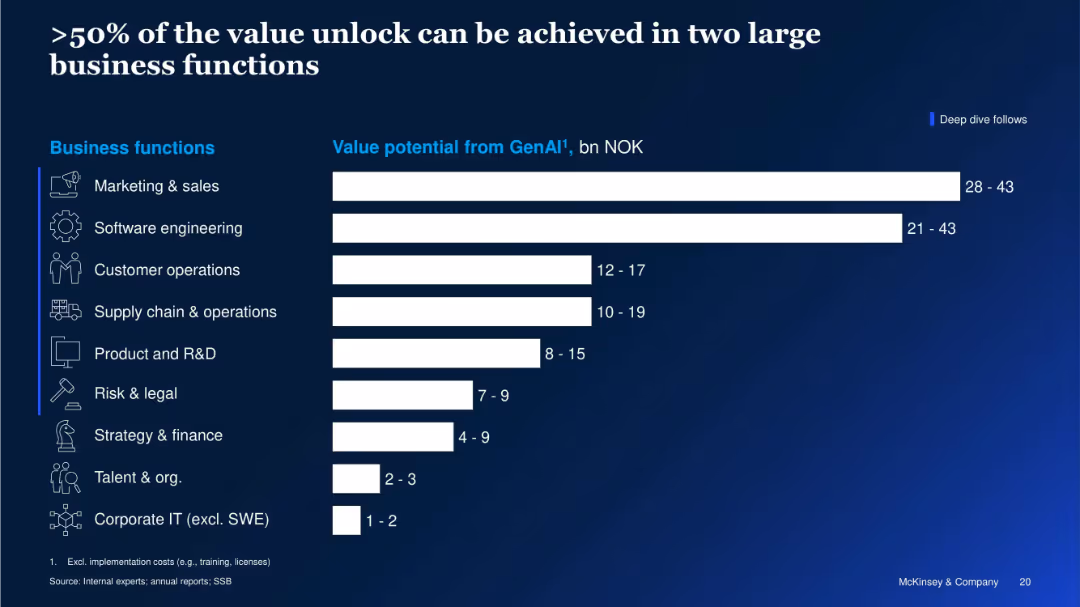
Horizontal bar chart showing GenAI value potential (in NOK) by business function. Icons accompany each function.
Strategic Planning
Artificial Intelligence
This slide shows that more than half of the GenAI value potential is concentrated in Marketing & Sales and Software Engineering. It quantifies value potential across various business functions, emphasizing where investments may yield the greatest returns.
GenAI Value, Business Functions, Marketing, Software Engineering, Strategic Value, Productivity, NOK Gains, McKinsey
false
Strategic Planning
Artificial Intelligence
Single Chart
McKinsey
Add to my slides
Remove from favorites
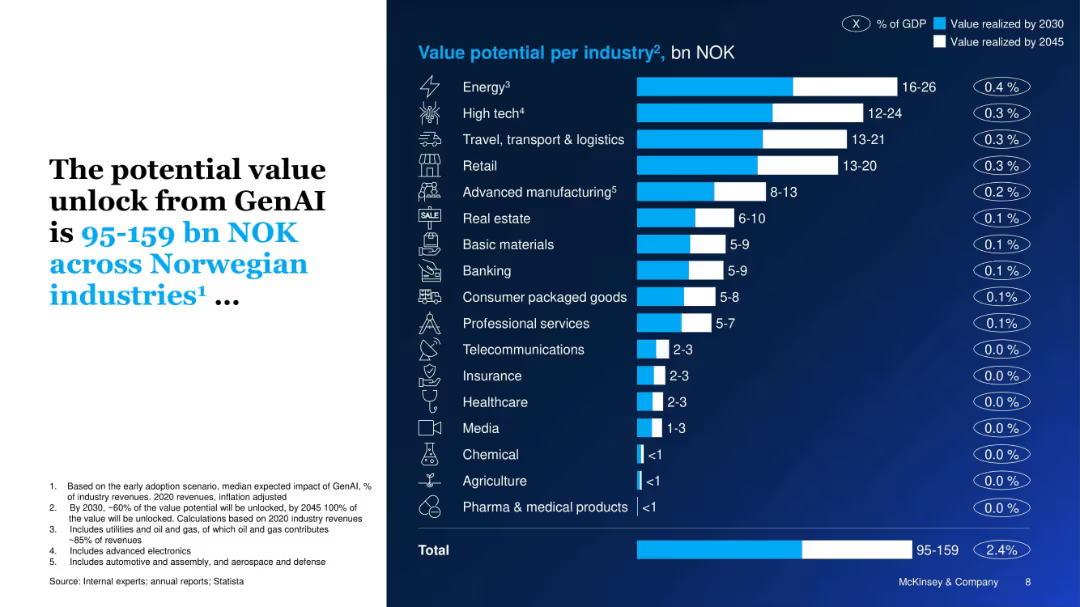
Horizontal bar chart showing GenAI value potential across industries, color-coded by realization year (2030 vs 2045). Text block on left provides context.
Investment Analysis
Artificial Intelligence
This slide quantifies the potential economic value GenAI could unlock across Norwegian industries, estimating a total of NOK 95–159 billion by 2045, with energy, high tech, and logistics leading.
GenAI, value creation, Norway, industries, economic impact, NOK, energy, manufacturing, adoption
false
Investment Analysis
Artificial Intelligence
Single Chart
McKinsey
Add to my slides
Remove from favorites
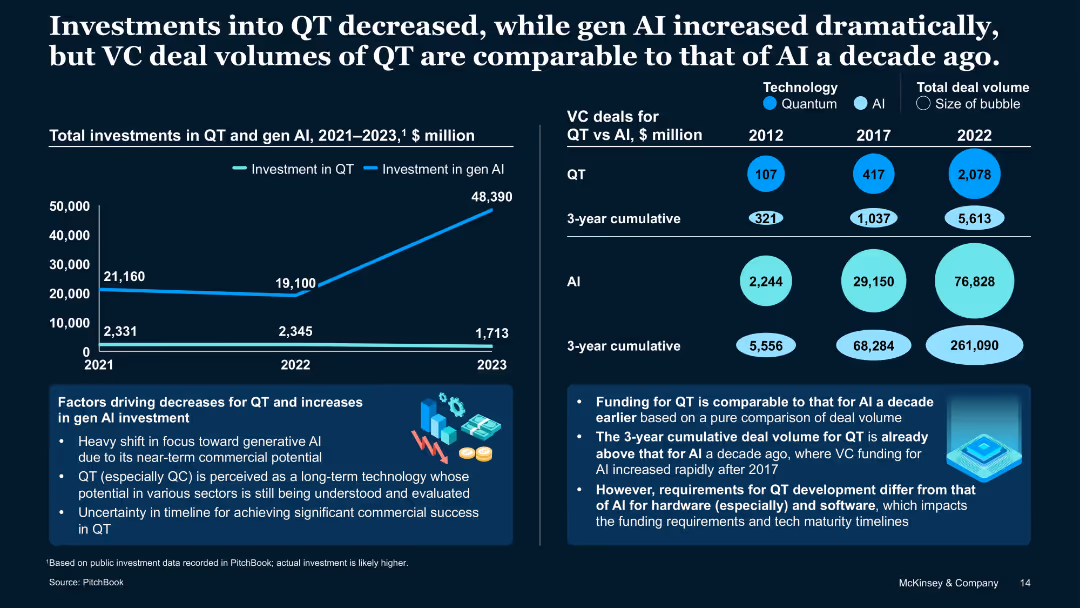
Dual-axis line and bubble charts with infographics and supporting analysis
Strategic Planning
Artificial Intelligence
Contrasts declining QT investment with surging Gen AI investment, highlighting a shift in investor focus. Shows QT VC deal volume today is similar to AI a decade ago. Notes differences in funding patterns due to maturity and hardware/software needs.
Gen AI, venture capital, QT deal volume, investment trend, deal history
false
Strategic Planning
Artificial Intelligence
Single Chart
McKinsey
Add to my slides
Remove from favorites
The slide has multiple charts and diagrams illustrating wealth and asset managers' growing interest in Generative AI (GenAI) solutions. It includes pie charts, bar charts, and text explaining the benefits and investment in GenAI.
Technology and Digital Transformation
Financial Services
The slide highlights survey findings on the adoption of GenAI solutions by wealth and asset managers. It details the benefits of GenAI, investment plans, and the anticipated impact on various aspects of financial services.
GenAI, wealth managers, asset managers, investment, benefits, AI adoption, financial services, survey, impact
false
Technology and Digital Transformation
Financial Services
Multiple Chart
EY
Add to my slides
Remove from favorites
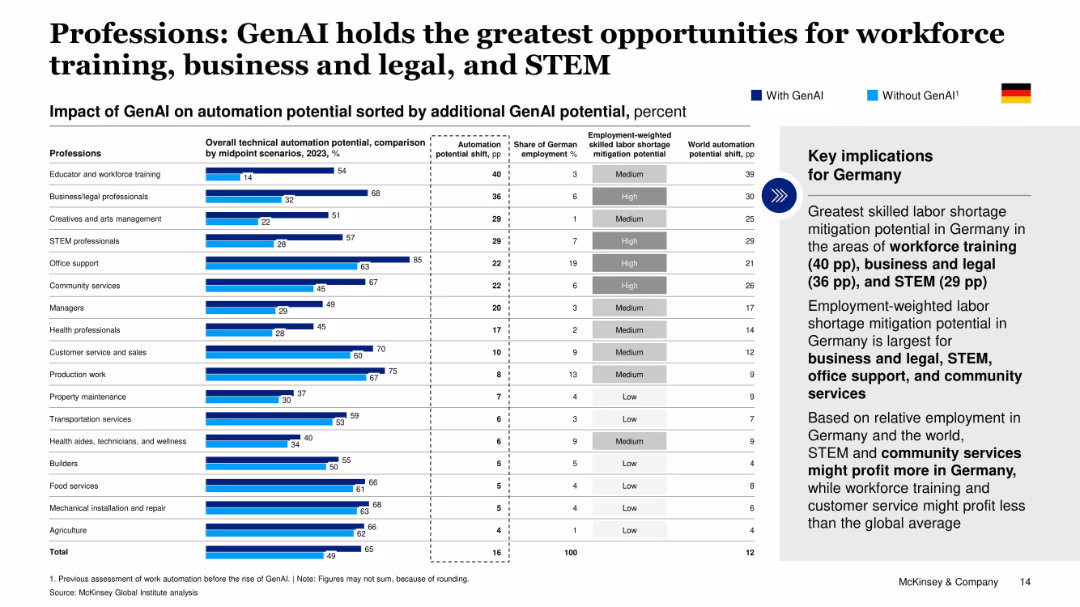
Ranked bar chart showing automation potential shift by profession, with GenAI vs. without GenAI comparison. Text panel outlines implications for Germany.
Human Resources and Talent Management
Artificial Intelligence
This slide ranks professions by additional GenAI-driven automation potential, spotlighting workforce training, legal/business, and STEM as top areas. It also assesses relative employment impact in Germany and globally.
GenAI, workforce automation, professions, labor shortage, Germany, STEM, training, business, McKinsey
false
Human Resources and Talent Management
Artificial Intelligence
Mixed Chart
McKinsey
Add to my slides
Remove from favorites
Includes column charts showing the expected impact of GenAI on workforce productivity and cost savings across front and back office functions, with a large textual explanation below the charts.
Operational Efficiency
Financial Services
The slide analyzes the expected impacts of GenAI on workforce productivity and cost savings, particularly highlighting the differences between front office and back office functions in banks.
GenAI, workforce, productivity, cost savings, banks
false
Operational Efficiency
Financial Services
Multiple Chart
EY
Add to my slides
Remove from favorites
Features a large, central orb with purple and blue fibrous threads radiating outward. This design element is set against a dark background with several areas highlighted with text such as "Lead and learn in new ways" and "Prepare workers".
Strategic Planning
Technology & Software
Discusses the role of generative AI in reshaping work and workforce management. It serves as a strategic overview for utilizing AI to optimize organizational structures and employee capabilities.
gen AI, workforce, strategic, organizational, optimization, capabilities, management, technology, innovation, AI potential
false
Strategic Planning
Technology & Software
Framework
Accenture
Add to my slides
Remove from favorites
Previous
Next
You don't have any favorites yet.
Please wait loading your favorites slides...
Create a FREE account to continue browsing
Receive Instant Access to 1,000+ slides from companies like McKinsey, Google, and Goldman Sachs
First Name
Last Name
Email
Password
I agree to all
Terms & Privacy Policy
Thank you! Your submission has been received!
Oops! Something went wrong while submitting the form.
Have an account?
Sign in
Upgrade to PRO to Save slides
Advanced Search and Filters
Access to 15,000+ slides
Access to Category Pages
Save/Bookmark Slides
PowerPoint Template Library
Pick a Plan
MONTHLY
$12/month
Billed every month, Cancel anytime.
YEARLY
$9/year
Billed $108 annually, Cancel anytime.
Checkout for $12/month
Checkout for $108/yr
Secured by Stripe | AES-256 bit encryption