My Account
My Slides
Search by Category
Companies
Slide Type
Use Case
Industry
Pricing
Templates
View All Templates
Download Template Slides
✦ AI
AI Prompt Library
AI Search
Feedback
Login
Logout
Get Started
Browse all Slides
Browse all Slides
Create a FREE Account
Instant access to 1,000+ real slides from top companies like McKinsey, BCG, Goldman Sachs, Google and many more!
First Name
Last Name
Email
Password
I agree to all
Terms & Privacy Policy
Thank you! Your submission has been received!
Oops! Something went wrong while submitting the form.
Have an account?
Sign in
Saved Slides
Total No. of slides saved
0
↻ Refresh
✖ Clear all
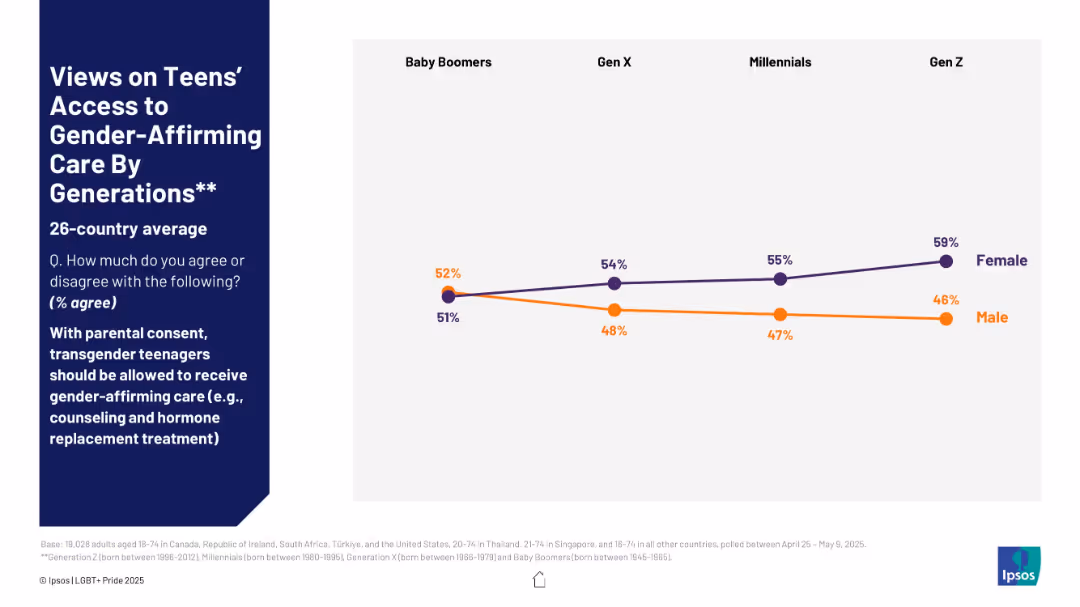
Line chart split by gender across Baby Boomers to Gen Z
Regulatory and Compliance
Government & Public Sector
This slide breaks down generational support for gender-affirming care for teens by gender. Female respondents show higher and growing support across generations, with Gen Z females at 59%. Male support is consistently lower and declines from Baby Boomers to Gen Z.
gender-affirming care, generations, male vs female, youth health rights, support trends, Ipsos
false
Regulatory and Compliance
Government & Public Sector
Mixed Chart
IPSOS
Add to my slides
Remove from favorites
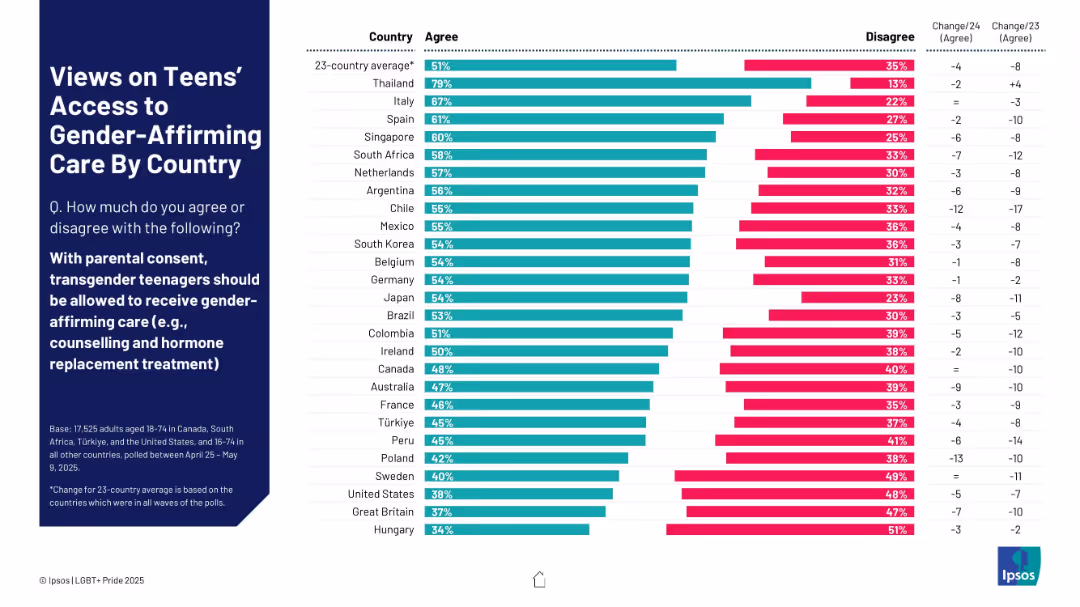
Horizontal bar chart by country; agree/disagree percentages with trend deltas
Regulatory and Compliance
Government & Public Sector
The slide explores global opinions on whether transgender teens should access gender-affirming care with parental consent. Thailand leads with 79% agreement, while Hungary ranks lowest at 34%. Opposition is substantial in several Western countries, with notable trend declines from 2023 to 2025.
gender-affirming care, transgender youth, healthcare, public opinion, parental consent, Ipsos, countries
false
Regulatory and Compliance
Government & Public Sector
Mixed Chart
IPSOS
Add to my slides
Remove from favorites
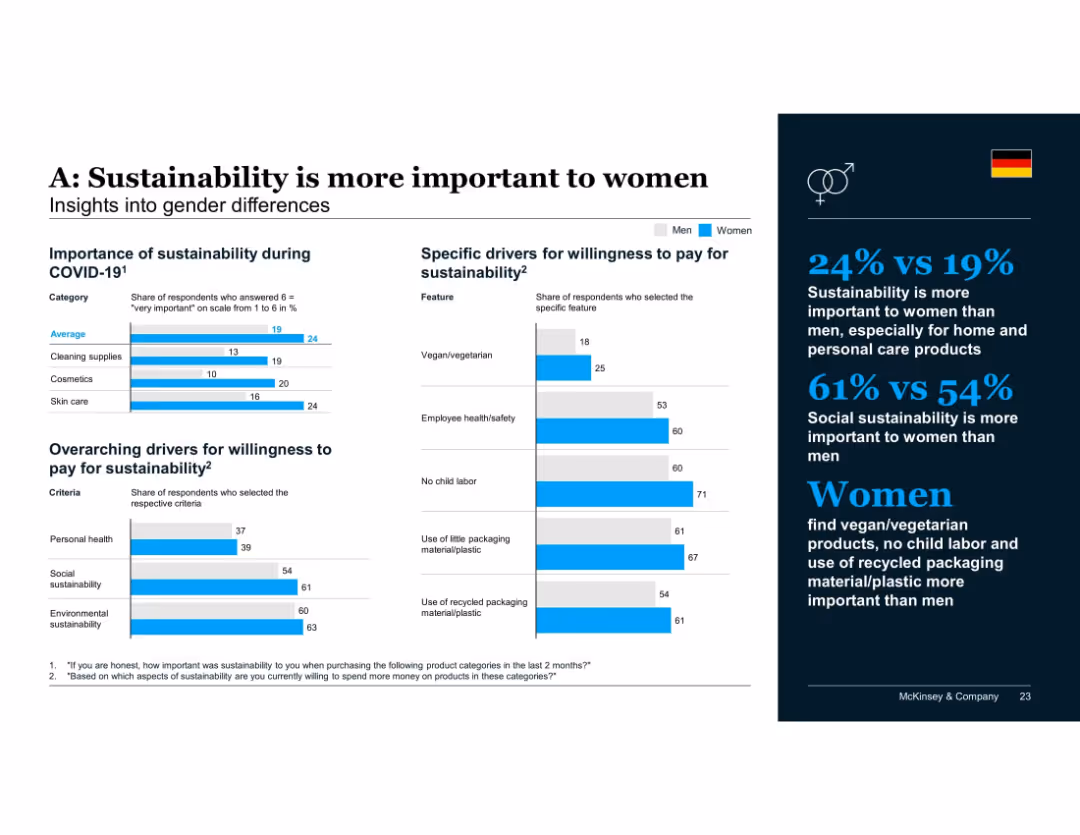
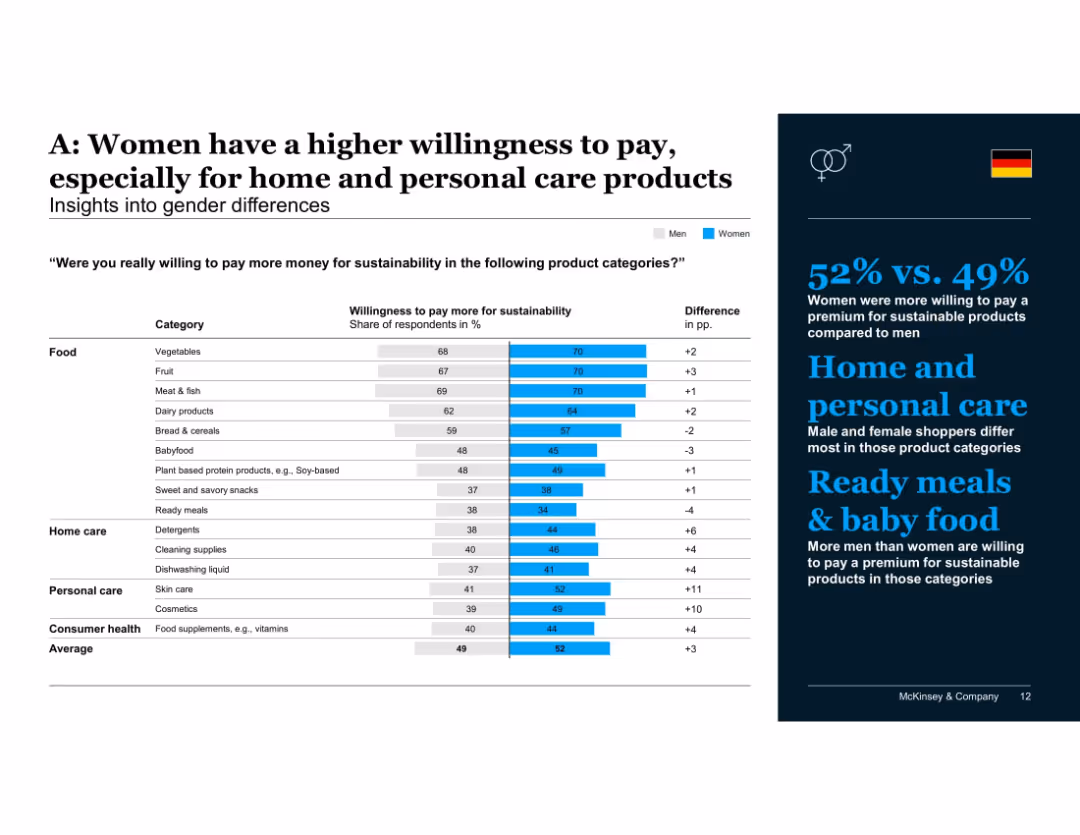
Gender comparison layout: bar charts showing male vs. female responses on sustainability importance and drivers; supporting stats on the right.
Customer and Market Segmentation
Consumer Goods
Women consistently rate sustainability as more important than men, particularly in home and personal care categories. Female respondents place more value on vegan/vegetarian products, no child labor, and recycled materials than their male counterparts.
gender analysis, sustainability, women, consumer segmentation, personal care, home care, ethical consumption
false
Customer and Market Segmentation
Consumer Goods
Mixed Chart
McKinsey
Add to my slides
Remove from favorites
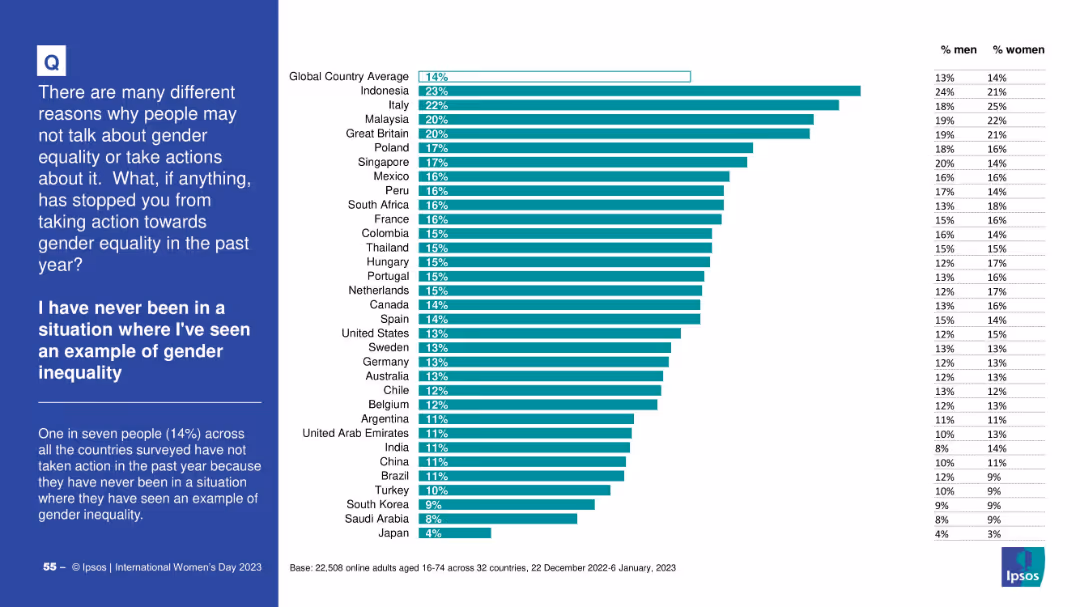
Horizontally ranked bar chart; global average marked at 14%; left-side text explaining data; right-hand gender split table.
Market Analysis and Trends
Government & Public Sector
This slide shows that 14% of global respondents did not take action on gender equality because they’ve never personally witnessed inequality. Indonesia and Italy rank highest. Gender breakdown indicates a relatively balanced perception.
gender awareness, exposure, inequality, personal experience, Ipsos, barriers
false
Market Analysis and Trends
Government & Public Sector
Mixed Chart
IPSOS
Add to my slides
Remove from favorites
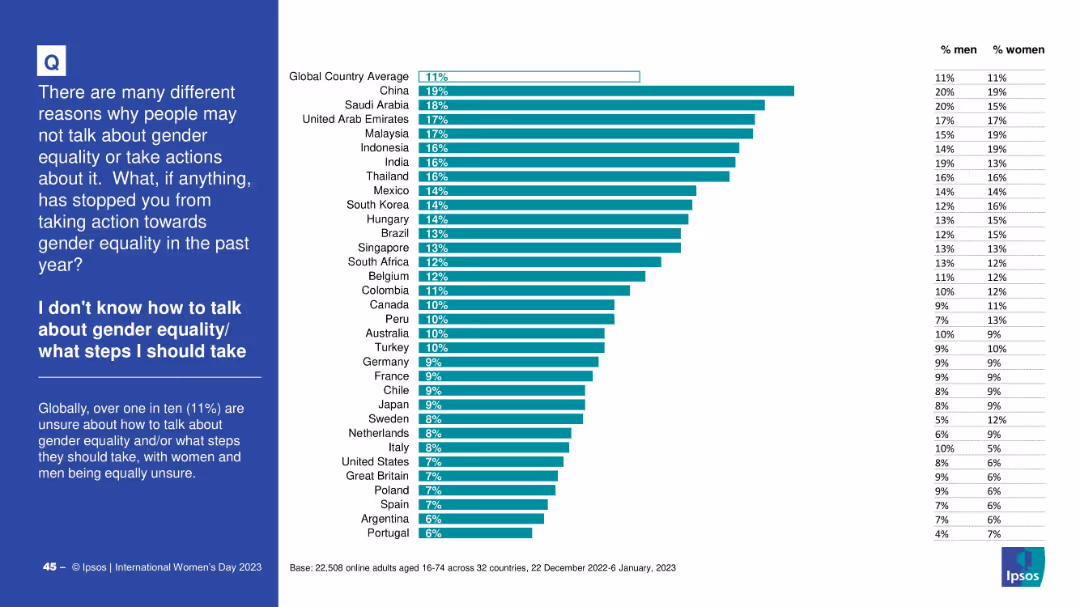
Consistent layout; bar chart showing percentage of people citing this as a reason for inaction by country and gender
Risk Assessment and Management
Government & Public Sector
This slide addresses a key barrier to engagement in gender equality: lack of knowledge or guidance. It presents comparative data by country and gender on people who feel unsure how to act or discuss the issue.
gender awareness, knowledge gap, equality action, educational need, Ipsos, barriers to action
false
Risk Assessment and Management
Government & Public Sector
Mixed Chart
IPSOS
Add to my slides
Remove from favorites
This slide presents a narrative scenario with a moderate visual complexity. It uses a balanced text layout to tell a story about gender diversity issues in a professional setting. Red highlights and silhouette icons emphasize key points. The design includes bullet points, two text blocks, and stylized graphic elements.
Technology and Digital Transformation
Professional Services
The slide narrates a scenario of gender bias in a multinational company, depicting the overlooked leadership potential of a female employee due to stereotypes. It serves to initiate discussions on gender diversity and inclusion within corporate environments, particularly in international mobility opportunities.
Gender bias, Leadership, Diversity, Inclusion, Multinational
false
Technology and Digital Transformation
Professional Services
Boxed
PwC/Strategy&
Add to my slides
Remove from favorites
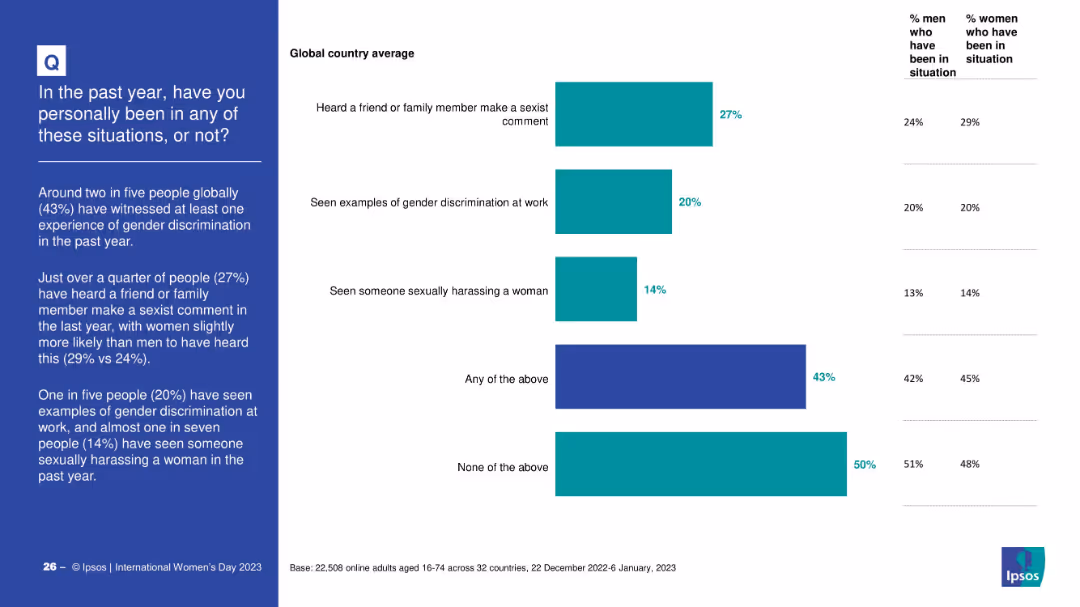
Horizontal bar chart displaying percentage of people who experienced or witnessed gender discrimination-related scenarios. Gender breakdown included. Left-aligned narrative explains key findings.
Risk Assessment and Management
Government & Public Sector
This slide reports global statistics on firsthand experiences of gender discrimination, including sexist comments, workplace discrimination, and sexual harassment. It notes a 43% incidence rate for any of these experiences and provides gender-specific comparisons.
gender bias, workplace discrimination, sexual harassment, global average, social behavior, lived experiences
false
Risk Assessment and Management
Government & Public Sector
Mixed Chart
IPSOS
Add to my slides
Remove from favorites
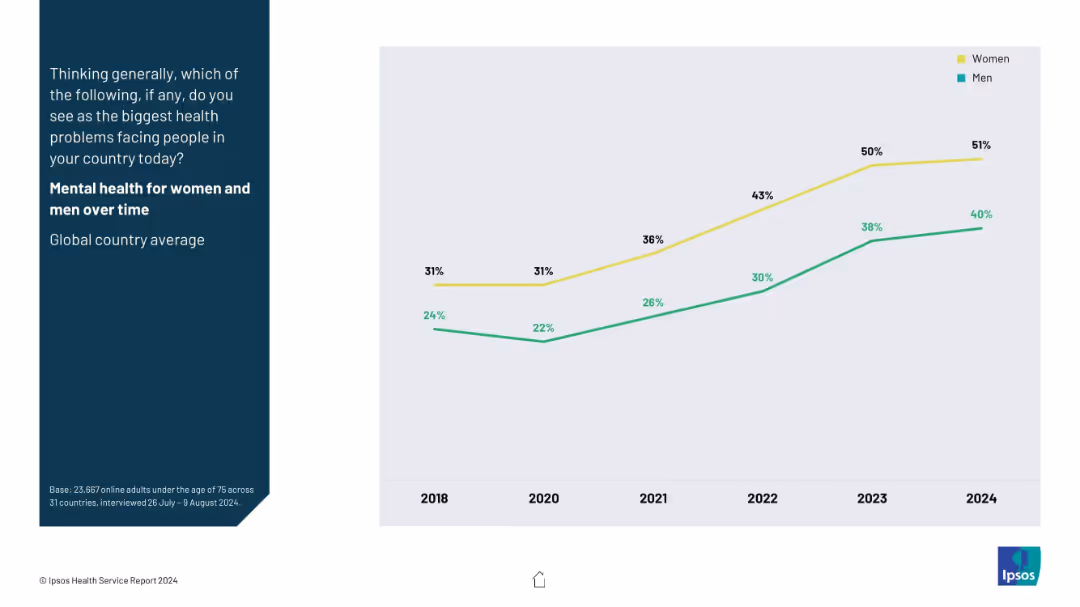
Line chart comparing mental health concern rates for women vs men, 2018–2024; two lines (yellow for women, green for men).
Market Analysis and Trends
Healthcare & Pharmaceuticals
This slide highlights gender differences in concern about mental health over time. It shows a consistent upward trend for both genders, with women showing higher levels of concern than men.
gender comparison, mental health, public sentiment, trend analysis, health disparitie
false
Market Analysis and Trends
Healthcare & Pharmaceuticals
Mixed Chart
IPSOS
Add to my slides
Remove from favorites
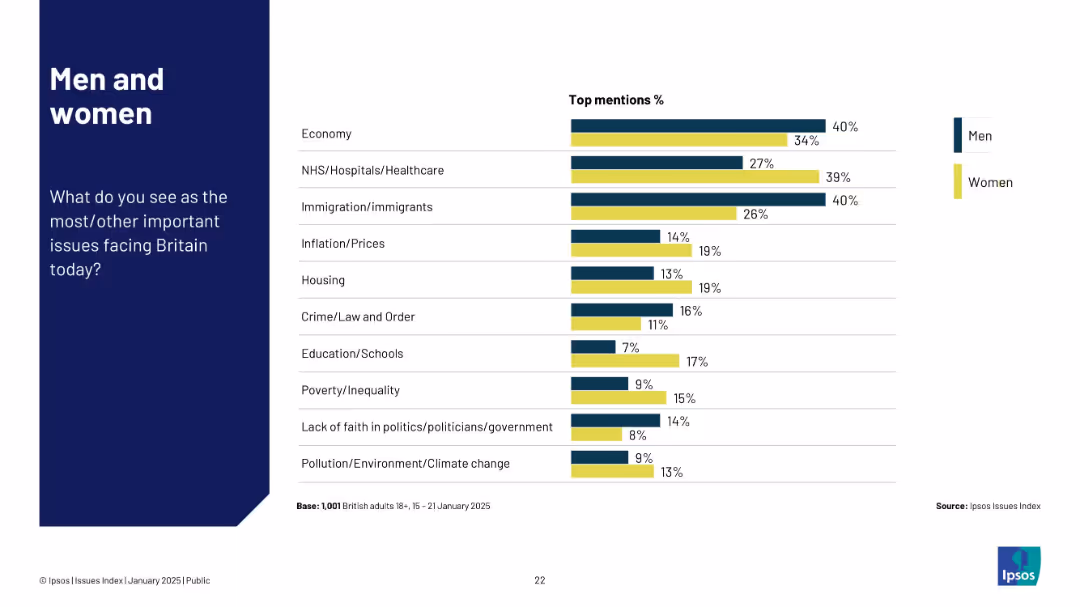
Horizontal bar chart segmented by gender (Men vs. Women) across multiple top issues.
Customer and Market Segmentation
Government & Public Sector
This slide contrasts men and women’s views on the most pressing issues in Britain. Men are more concerned with immigration and economy, while women prioritize NHS and education. Data is based on a January 2025 Ipsos survey.
gender, comparison, NHS, education, economy, Ipsos, top issues
false
Customer and Market Segmentation
Government & Public Sector
Mixed Chart
IPSOS
Add to my slides
Remove from favorites
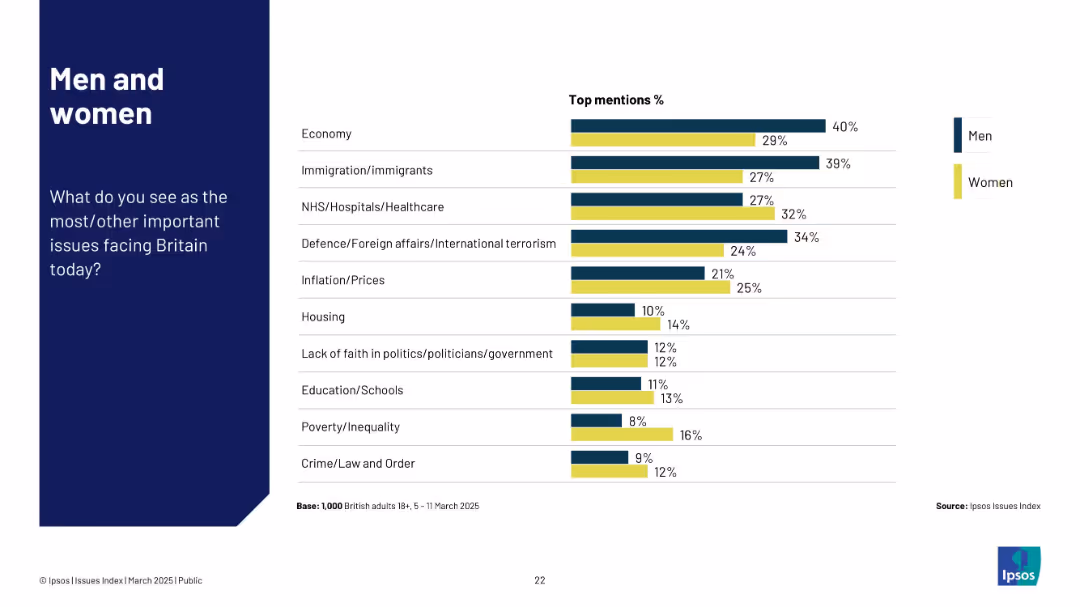
Horizontal bar chart segmented by gender; compares issue concern levels between men and women.
Customer and Market Segmentation
Government & Public Sector
Highlights gender differences in perceived top national issues. Men focus more on economy and foreign affairs, while women report higher concern for healthcare and inequality.
gender comparison, public opinion, economy, healthcare, Ipsos, men vs women, UK issues, segmentation
false
Customer and Market Segmentation
Government & Public Sector
Mixed Chart
IPSOS
Add to my slides
Remove from favorites
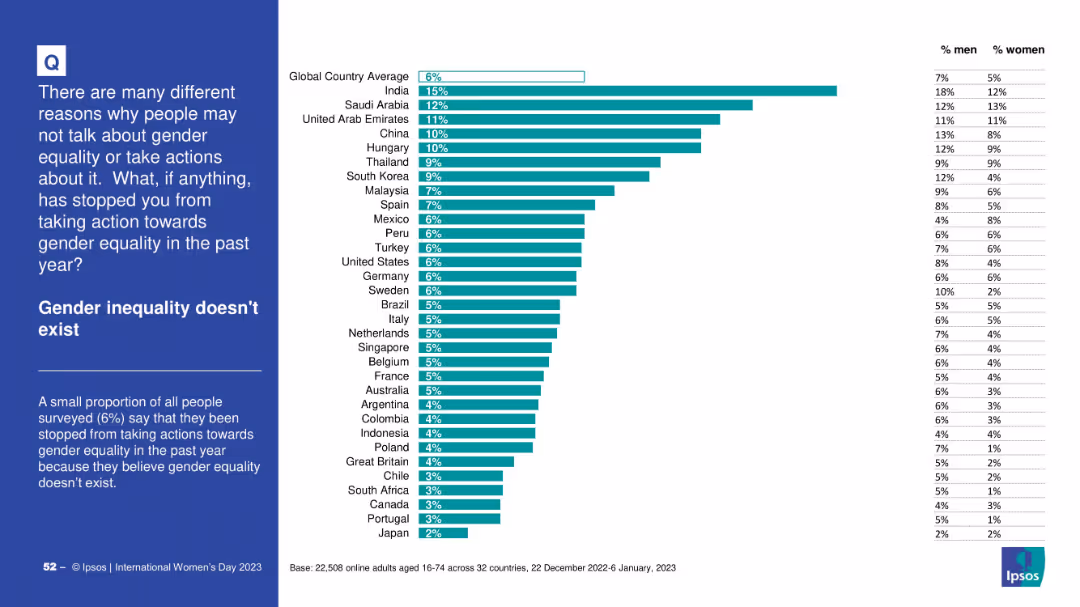
Bar chart showing denial of gender inequality as a barrier to action; countries ordered by response rates; contextual info on left in blue box.
Market Analysis and Trends
Government & Public Sector
The slide highlights the share of respondents who believe gender inequality doesn’t exist, with India showing the highest (15%). The global average is 6%. Gender-specific responses are also noted.
gender denial, survey data, awareness, equality, Ipsos, global differences
false
Market Analysis and Trends
Government & Public Sector
Mixed Chart
IPSOS
Add to my slides
Remove from favorites
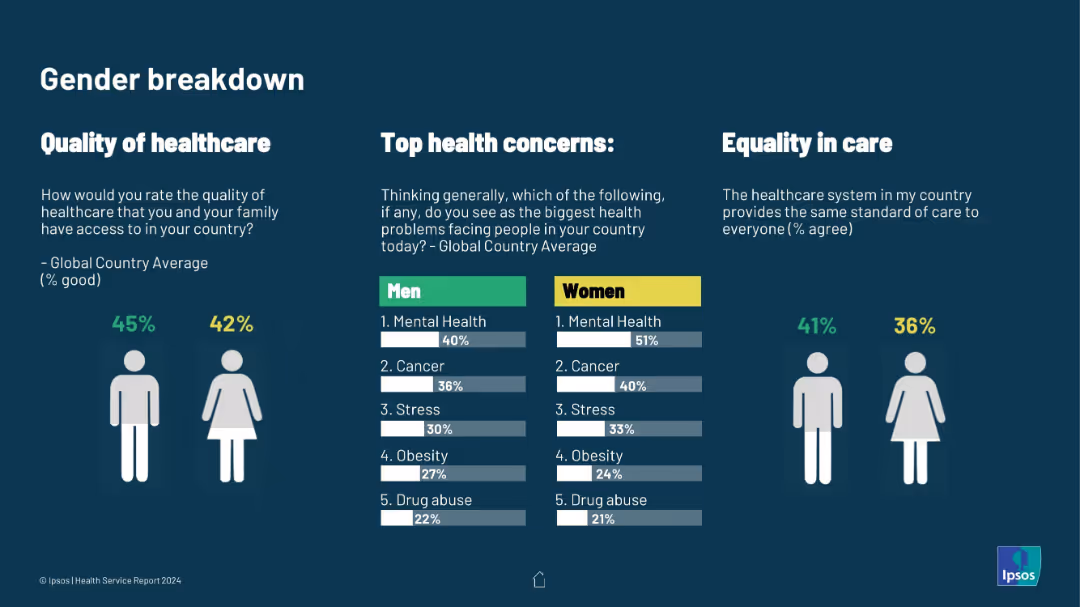
Clean infographic with male/female icons and horizontal bar charts. Covers quality perception, top health concerns, and care equality
Customer and Market Segmentation
Healthcare & Pharmaceuticals
Gender-specific breakdown of healthcare perception and concerns. Women more frequently cite mental health as a top concern; equality in care is also shown to be lower for women.
gender differences, healthcare quality, mental health, health priorities, care equity, Ipsos health data, public perception
false
Customer and Market Segmentation
Healthcare & Pharmaceuticals
Multiple Chart
IPSOS
Add to my slides
Remove from favorites
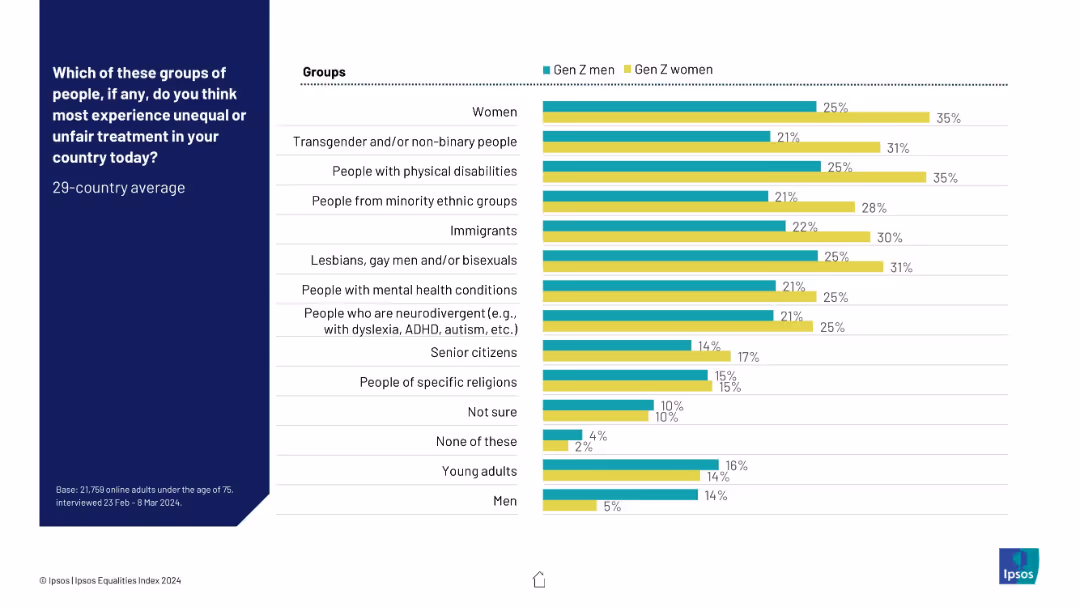
Bar chart comparing responses of Gen Z men vs. Gen Z women. Dual color-coded bars on right side, left-aligned group labels and title.
Market Analysis and Trends
Government & Public Sector
This slide illustrates Gen Z gender-specific perceptions of who faces the most inequality, highlighting that Gen Z women consistently rate higher concern across nearly all categories, especially for women, minorities, and LGBTQ+ individuals. It reflects awareness gaps and empathy differences between young men and women.
gender differences, inequality, Gen Z, women, minority groups, LGBTQ+, disability, survey, Ipsos
false
Market Analysis and Trends
Government & Public Sector
Mixed Chart
IPSOS
Add to my slides
Remove from favorites
Side-by-side bar chart comparing willingness to pay by product category for men and women; difference column included
Customer and Market Segmentation
Consumer Goods
Women show stronger preference for sustainable home and personal care products. Categories like skin care, cosmetics, and cleaning supplies reveal the biggest gender gaps. Baby food and ready meals show a slight male skew.
gender differences, product categories, personal care, home care, sustainability premium, willingness to pay, McKinsey, Germany
false
Customer and Market Segmentation
Consumer Goods
Mixed Chart
McKinsey
Add to my slides
Remove from favorites
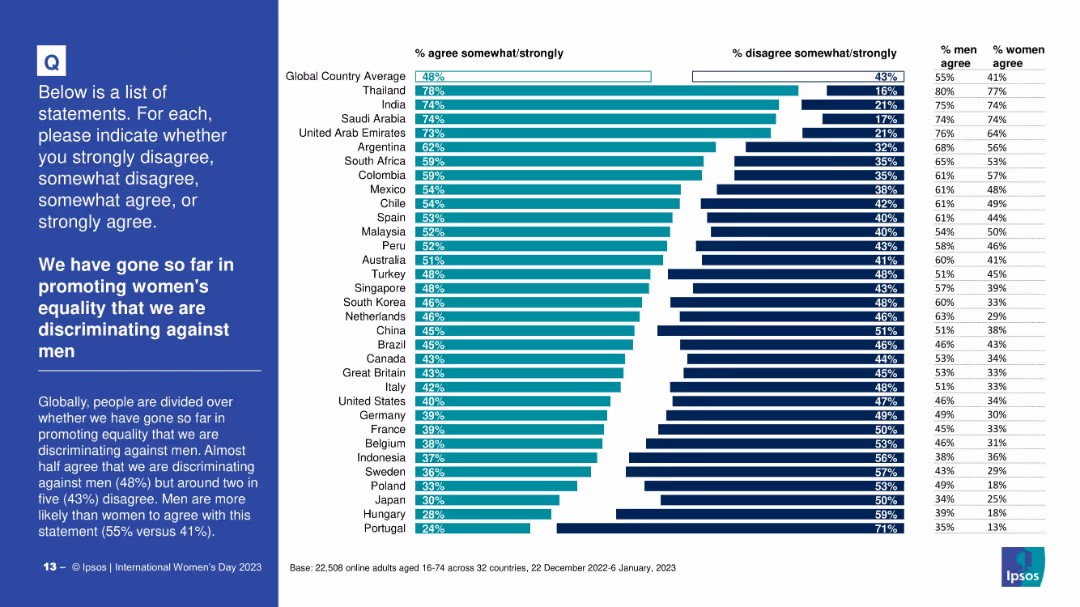
Horizontal bar chart with global and country-specific data; sidebar offers insights; includes gender-specific agreement levels
Market Analysis and Trends
Professional Services
This slide presents survey data on whether people believe efforts to promote women's equality have resulted in discrimination against men. It shows divided opinions across countries and provides male vs. female comparison statistics.
gender discrimination, equality, backlash, men, women, perceptions, countries, Ipsos, 2023 survey
false
Market Analysis and Trends
Professional Services
Mixed Chart
IPSOS
Add to my slides
Remove from favorites
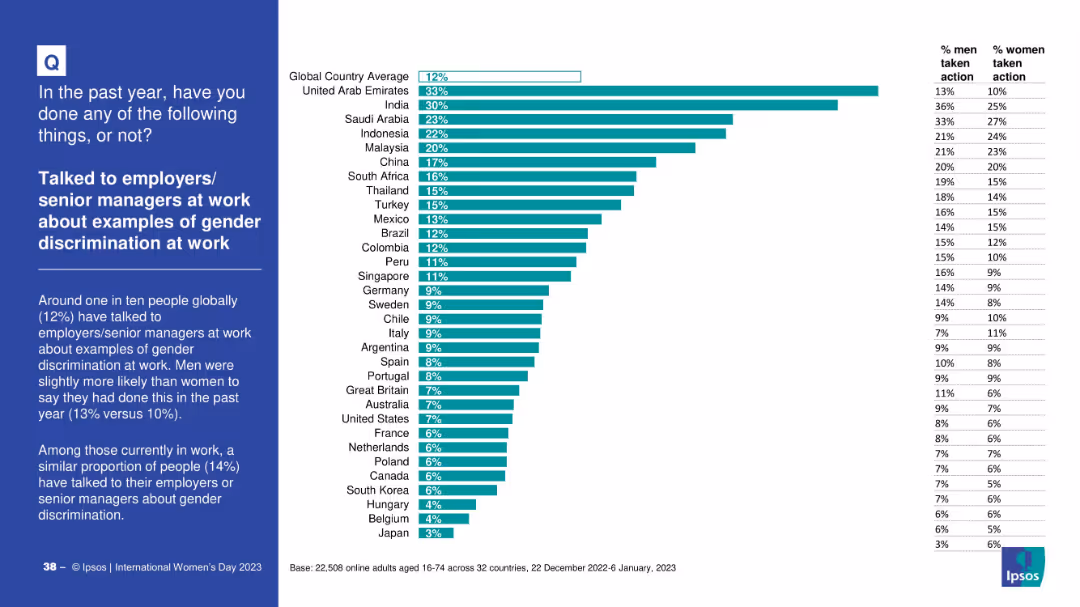
Standard Ipsos slide layout with bar chart and gender breakdown per country
Human Resources and Talent Management
Government & Public Sector
This slide explores how frequently people across countries discussed gender discrimination at work with managers. It highlights the overall low engagement rate and compares actions taken by men and women.
gender discrimination, workplace issues, senior management, HR, gender bias, Ipsos, employee voice
false
Human Resources and Talent Management
Government & Public Sector
Mixed Chart
IPSOS
Add to my slides
Remove from favorites
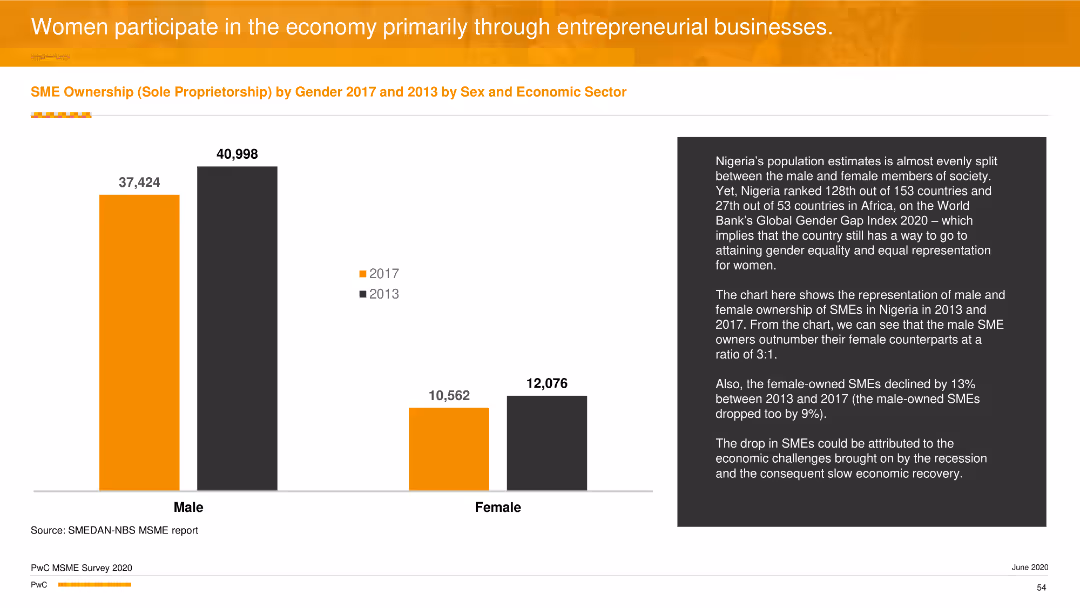
A column chart comparing male and female SME ownership between 2013 and 2017, with a notable gender gap. The bars are in orange and black, representing different years.
Industry Overview
Professional Services
The slide highlights the gender disparity in SME ownership in Nigeria, showing more male-owned businesses compared to female-owned, with data from 2013 and 2017.
gender disparity, SME ownership, professional services, column chart, industry overview
false
Industry Overview
Professional Services
Mixed Chart
PwC/Strategy&
Add to my slides
Remove from favorites
Contains bar charts showing disparities between gender in workplace satisfaction and promotion rates.
Human Resources and Talent Management
Professional Services
Examines gender disparities in workplace outcomes, crucial for developing diversity and inclusion policies.
Gender Disparity, Workplace Equality, HR Practices, Diversity Policies, Inclusion Strategies
false
Human Resources and Talent Management
Professional Services
Single Chart
PwC/Strategy&
Add to my slides
Remove from favorites
World map with gender breakdown stats by region; simple layout with numeric callouts and pie graphics
Human Resources and Talent Management
Professional Services
This slide presents a global view of KPMG’s gender distribution across regions. Out of 265,646 employees, 48.5% are women. It breaks down gender stats by region—Americas (49%), Asia Pacific (54%), EMA (46%)—reinforcing the firm's focus on inclusivity and global reporting.
gender distribution, global workforce, KPMG, headcount, women in workforce
false
Human Resources and Talent Management
Professional Services
Single Chart
KPMG
Add to my slides
Remove from favorites
Features a column chart comparing gender distribution across different ranking scales for applications.
Strategic Planning
Professional Services
Analyzes gender distribution by application rank, showing differences in the proportion of female to male applicants across ranking categories.
gender, distribution, ranking, applications, analysis
false
Strategic Planning
Professional Services
Single Chart
Accenture
Add to my slides
Remove from favorites
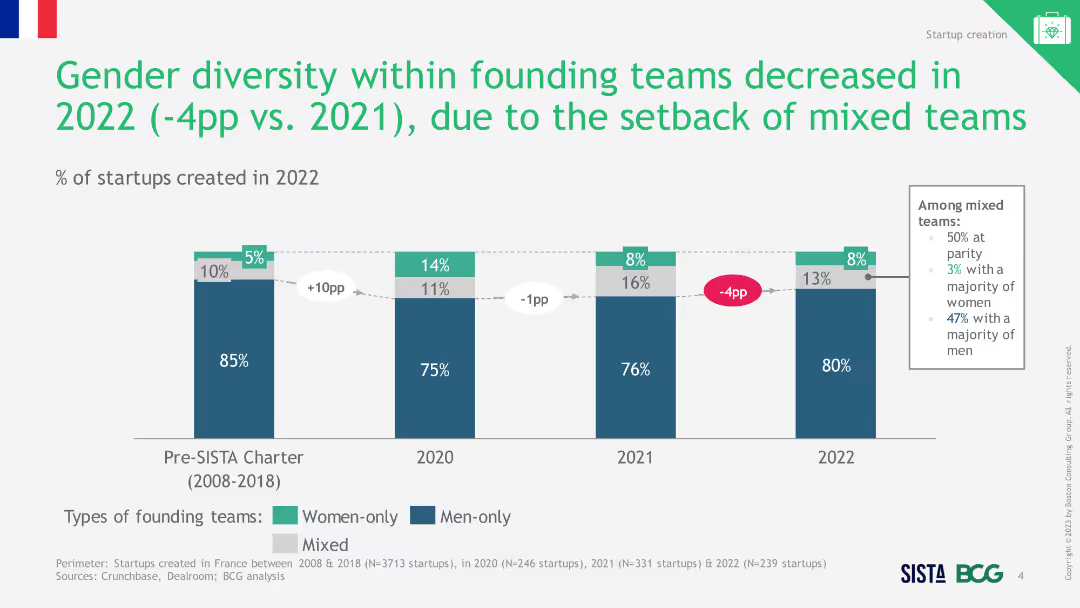
Two-column charts showing the split of men and women founders per team type from 2008 to 2022, highlighting the decrease in mixed teams in 2022.
Market Analysis and Trends
Professional Services
The slide shows a decline in gender-mixed founding teams in 2022, with both men and women partnering less with each other compared to previous years.
gender diversity, founding teams, mixed teams, 2022
false
Market Analysis and Trends
Professional Services
Single Chart
BCG
Add to my slides
Remove from favorites
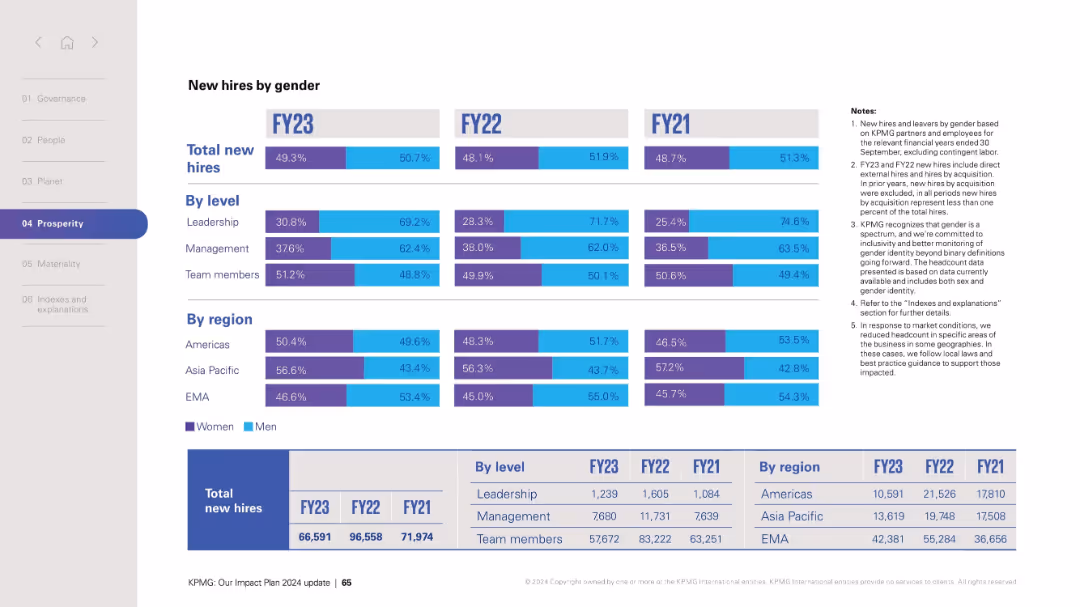
Matrix of horizontal bar charts segmented by FY and subcategories (level and region); notes on the right.
Human Resources and Talent Management
Professional Services
Provides gender distribution of new hires across leadership, management, and team levels as well as across regions (Americas, Asia Pacific, EMA) over three fiscal years. Includes raw numbers at the bottom and notes explaining definitions and methodology. Indicates a push for inclusivity and gender balance across the organization.
gender diversity, hiring, workforce, leadership, regions, inclusion, HR, FY metrics, equality, statistics
false
Human Resources and Talent Management
Professional Services
Mixed Chart
KPMG
Add to my slides
Remove from favorites
The slide contains a column chart comparing gender diversity percentages across various professional levels. It includes textual explanations and a footnote defining "women of color."
Human Resources and Talent Management
Professional Services
This slide presents statistics on gender diversity within investment professionals, emphasizing the underrepresentation of women and the higher burden of dependent care among female employees.
Gender diversity, Investment professionals, Women in VC, Dependent care, Diversity statistics
false
Human Resources and Talent Management
Professional Services
Mixed Chart
Deloitte
Add to my slides
Remove from favorites
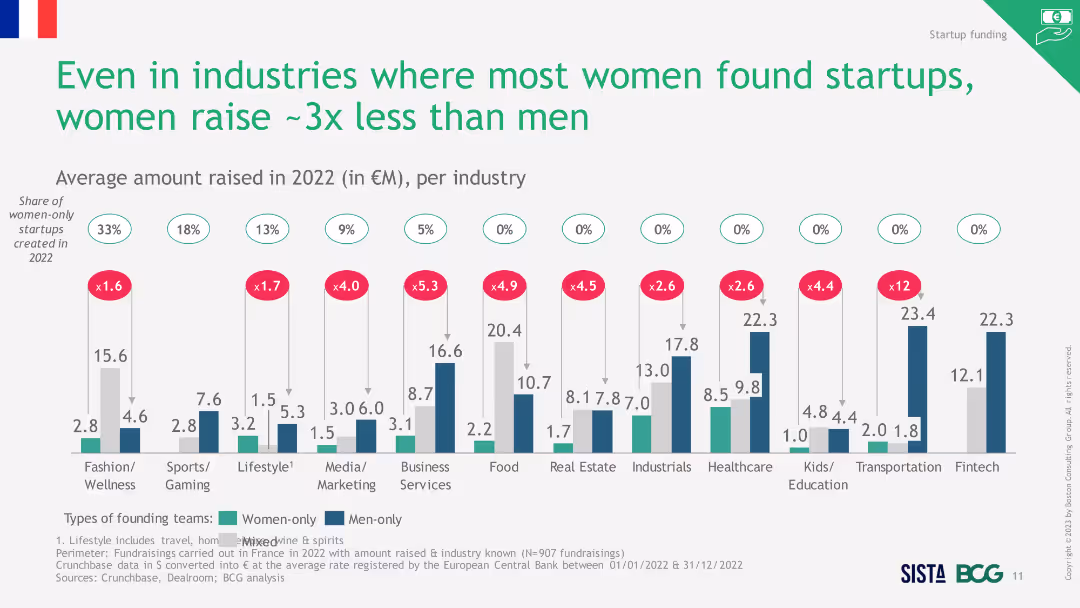
Column chart showing percentage of startups with women-only, men-only, and mixed founding teams from 2008 to 2022. Includes textual annotations.
Market Analysis and Trends
Professional Services
The slide depicts the decrease in gender diversity within founding teams of startups in 2022, highlighting a setback for mixed teams compared to 2021.
gender diversity, startups, founding teams, trends, 2022
false
Market Analysis and Trends
Professional Services
Single Chart
BCG
Add to my slides
Remove from favorites
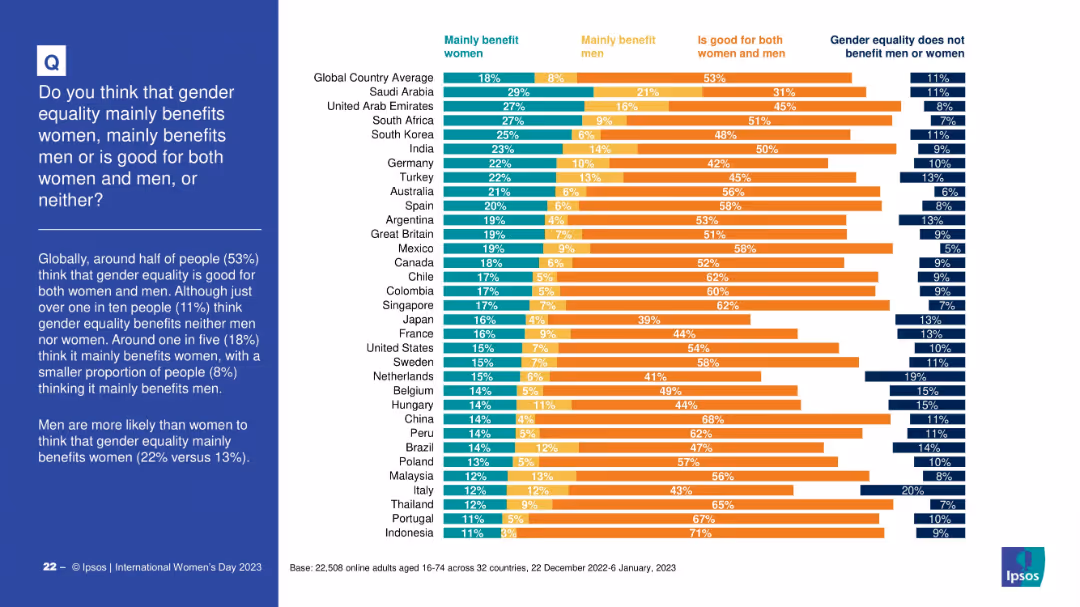
Stacked horizontal bar chart with four segments: benefits women, men, both, or neither; sorted by country
Customer and Market Segmentation
Professional Services
The slide categorizes public perceptions of who benefits from gender equality. While the majority believe it benefits both men and women, notable proportions think it mainly benefits women or neither. It highlights varied global perspectives.
gender equality benefits, perceptions, fairness, country-wise opinion, equality distribution, Ipsos
false
Customer and Market Segmentation
Professional Services
Mixed Chart
IPSOS
Add to my slides
Remove from favorites
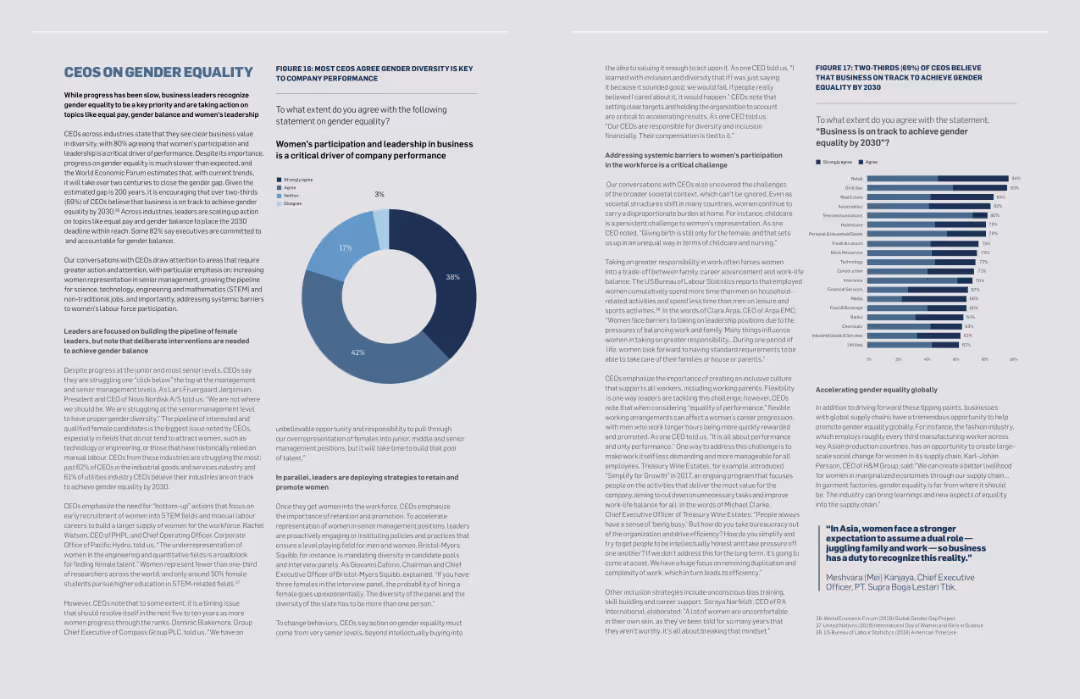
The slide contains text, a pie chart, and a column chart. The pie chart shows percentages of agreement on gender diversity's impact on business, while the column chart shows progress towards gender equality by 2030.
Market Analysis and Trends
Professional Services
The slide discusses the importance of gender equality in business, showing CEO opinions on its critical role in company performance and progress towards achieving gender equality by 2030.
Gender equality, CEOs, business performance, diversity, progress, gender balance, women's leadership, professional services, market trends, survey
false
Market Analysis and Trends
Professional Services
Multiple Chart
Accenture
Add to my slides
Remove from favorites
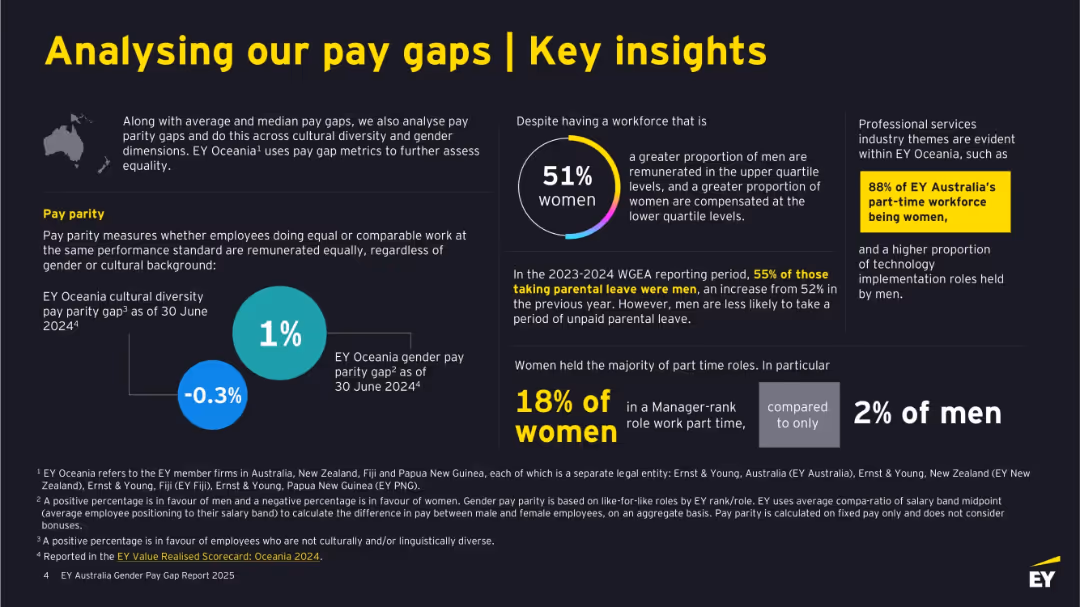
Multi-section layout on a dark background with white and yellow text. Includes infographic circles, text blocks, and callouts. Balanced left/right text and graphics.
Human Resources and Talent Management
Professional Services
This slide presents further analysis of pay gaps by highlighting gender and cultural diversity metrics, part-time work trends, and parental leave stats. It reveals workforce composition and roles by gender, emphasizing equity efforts and the professional services industry context. It also shows specific metrics like a 1% diversity gap and 88% women in part-time roles.
gender equality, diversity, pay parity, parental leave, part-time, workforce, EY Oceania, cultural inclusion
false
Human Resources and Talent Management
Professional Services
Mixed Chart
EY
Add to my slides
Remove from favorites
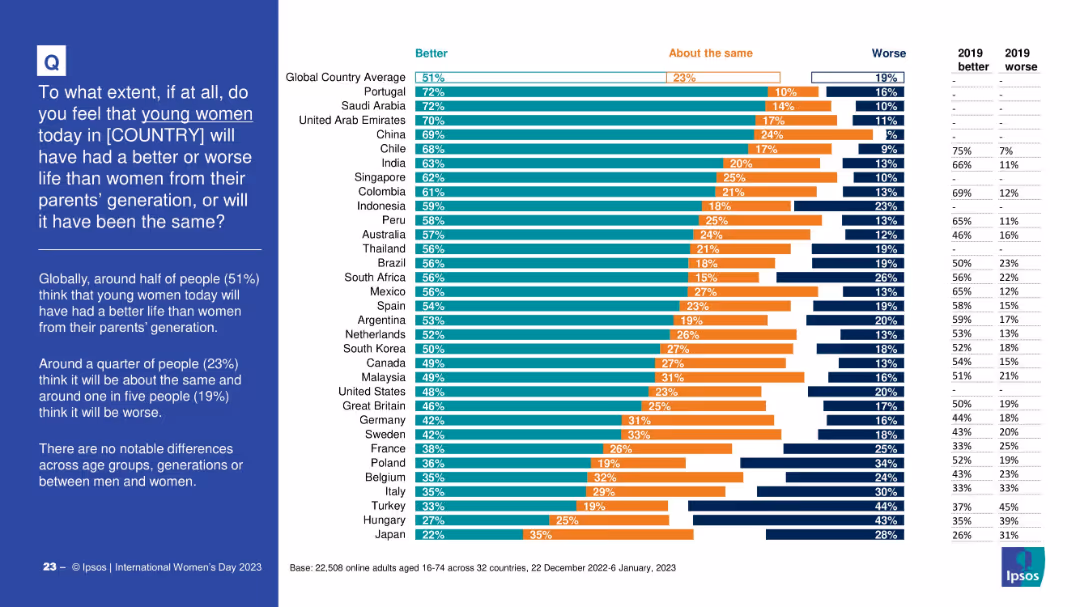
Bar chart comparing public opinion across countries on whether young women today will have a better, worse, or similar life to women from their parents’ generation. Includes three-part segmented bars per country and a data table for 2019 comparison. Left-aligned question and summary in blue box.
Market Analysis and Trends
Government & Public Sector
This slide presents global data on perceptions of how life outcomes for young women today compare to those of previous generations. It highlights that 51% globally think women’s lives will be better, with variations across countries. Historical comparison data from 2019 is included.
gender equality, generational trends, global survey, perception, young women, life improvement, societal progress, public opinion, Ipsos
false
Market Analysis and Trends
Government & Public Sector
Mixed Chart
IPSOS
Add to my slides
Remove from favorites
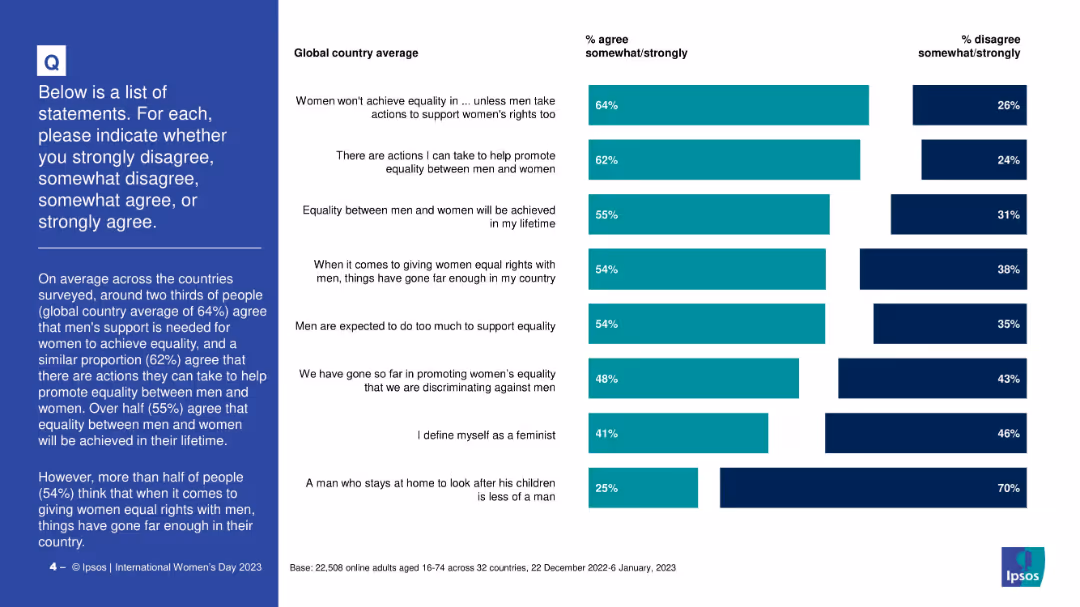
Split bar chart with 8 equality-related statements, showing % agree/disagree globally; blue and teal horizontal bars.
Human Resources and Talent Management
Government & Public Sector
This slide presents global attitudes on gender equality, including support for women’s rights, men's role in equality, and feminist identification, using agreement ratings.
gender equality, global attitudes, feminism, public opinion, support for women, equality metrics, Ipsos, societal views
false
Human Resources and Talent Management
Government & Public Sector
Mixed Chart
IPSOS
Add to my slides
Remove from favorites
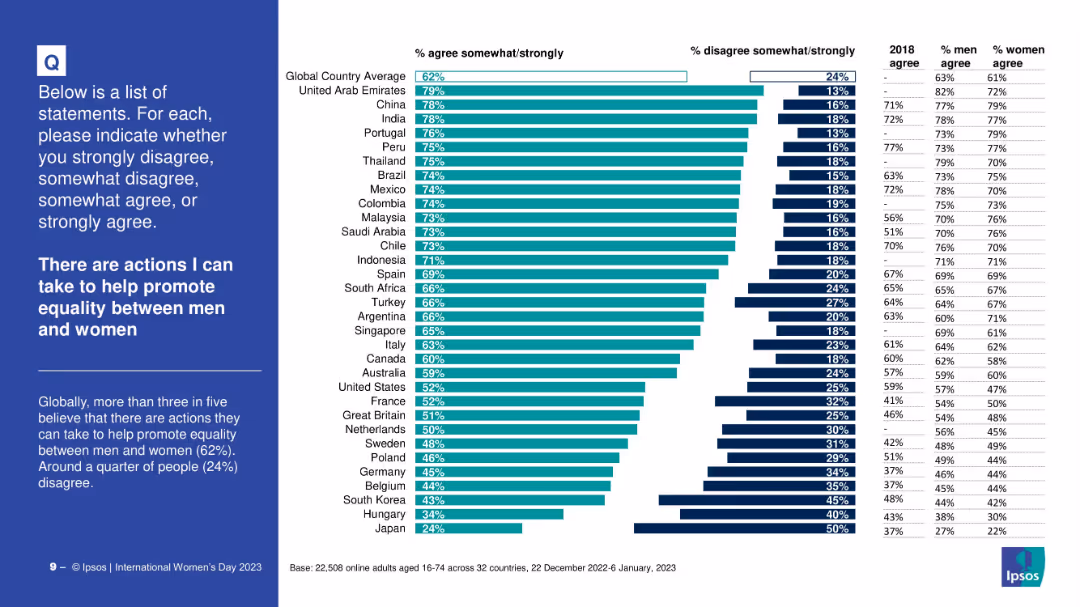
Bar chart ranking countries by % agreement; includes gender splits and historical data since 2018.
Human Resources and Talent Management
Government & Public Sector
Shows national support for the belief in personal agency in promoting gender equality; data broken down by gender and year for trend insights.
gender equality, individual action, social change, international attitudes, historical data, survey analysis, Ipsos
false
Human Resources and Talent Management
Government & Public Sector
Mixed Chart
IPSOS
Add to my slides
Remove from favorites
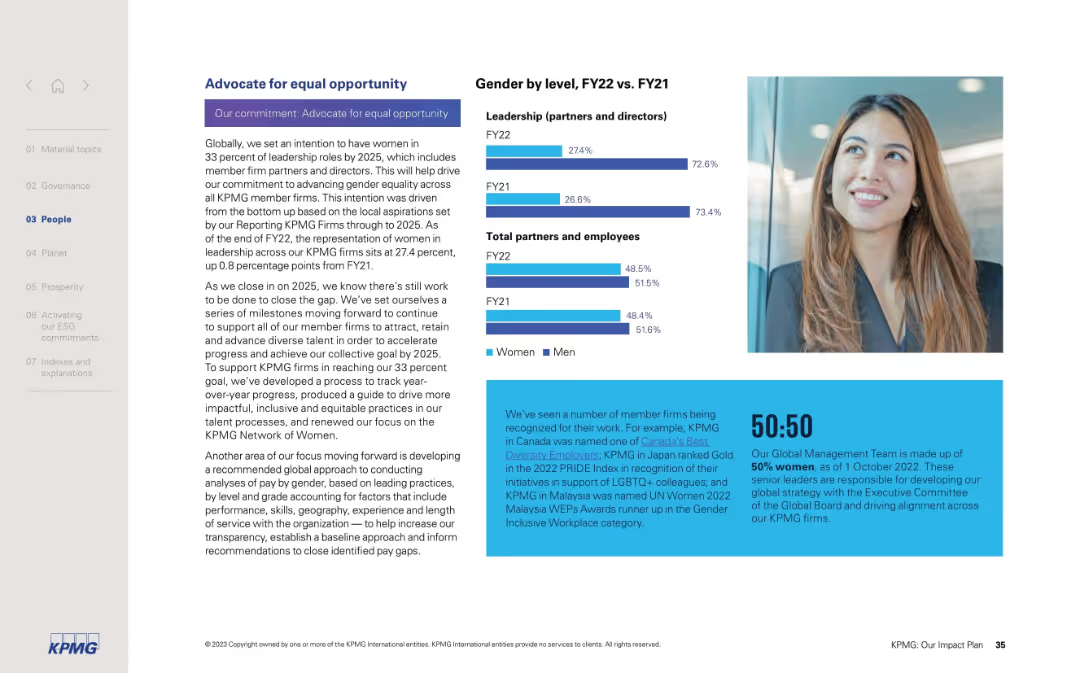
Text-heavy left section with gender equality stats on right; includes a photo and quote at bottom
Human Resources and Talent Management
Professional Services
This slide outlines KPMG's commitment to gender equality in leadership, aiming for 33% women by 2025. It compares FY22 vs FY21 gender stats and highlights initiatives to close the gender gap through leadership tracking and inclusive practices.
gender equality, leadership, KPMG, diversity, FY22 vs FY21, women
false
Human Resources and Talent Management
Professional Services
Mixed Chart
KPMG
Add to my slides
Remove from favorites
Slide presents circular graphical elements and textual data to compare Gender Equality Leaders with other organizations, using a large circle design on the right side.
Human Resources and Talent Management
Professional Services
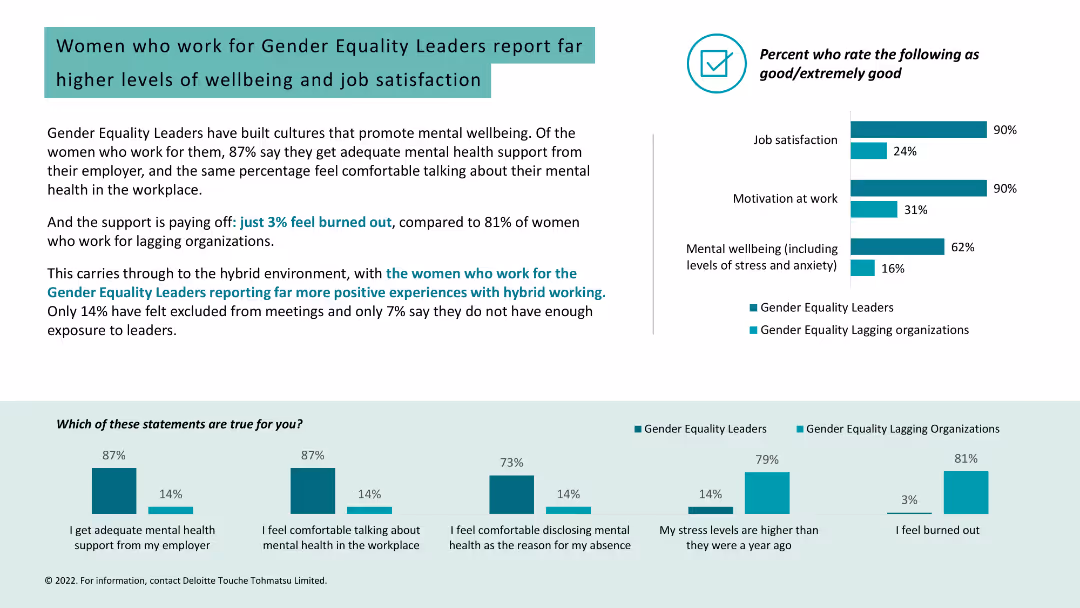
Highlights the positive workplace environment created by Gender Equality Leaders, showing benefits in job satisfaction and mental health support. This slide could be used to showcase the impact of leadership on employee well-being and satisfaction.
gender equality, leadership, well-being, job satisfaction
false
Human Resources and Talent Management
Professional Services
Single Chart
Deloitte
Add to my slides
Remove from favorites
Features column charts comparing the proportion of women in managerial positions across various regions and time periods, presented with clear labels and contrasting colors for easy comparison.
Market Analysis and Trends
Professional Services
Highlights the slow progress and continuing challenges in achieving gender parity in managerial roles globally, providing a basis for discussions on gender equity in professional settings.
gender equality, managerial roles, global, trends, workplace, diversity, equity, data, analysis
false
Market Analysis and Trends
Professional Services
Mixed Chart
Roland Berger
Add to my slides
Remove from favorites
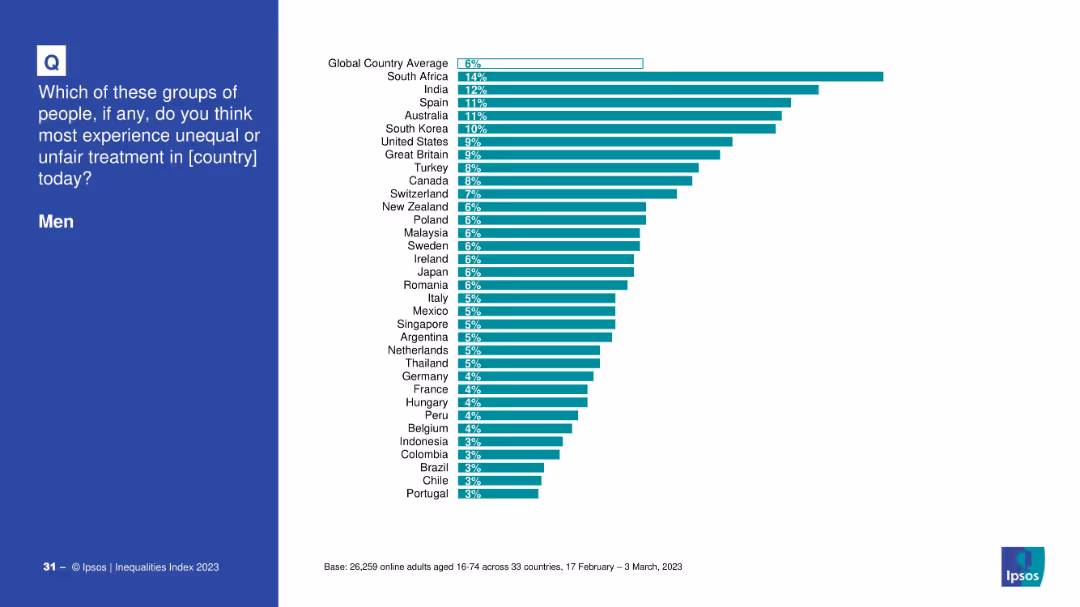
Bar chart ranking countries based on the share of respondents who believe men experience unequal treatment.
Customer and Market Segmentation
Government & Public Sector
This slide presents global country averages and individual country rankings of perceived unequal treatment of men, showing variations in perception with South Africa, India, and Spain at the top.
gender equality, men, unfair treatment, public opinion, international comparison
false
Customer and Market Segmentation
Government & Public Sector
Mixed Chart
IPSOS
Add to my slides
Remove from favorites
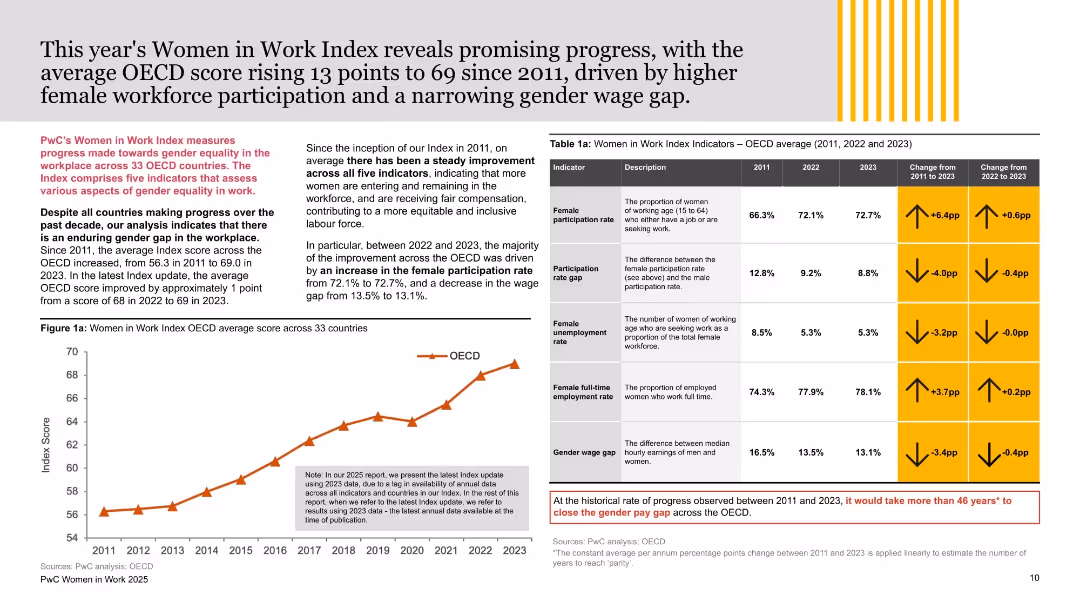
Dense text with a table on the right and a line graph on the bottom left; layout uses gray background with yellow accents for emphasis.
Performance Metrics and KPIs
Government & Public Sector
This slide summarizes the progress in gender equality across OECD nations using PwC’s Women in Work Index. It presents positive changes in female participation, wage gap reduction, and unemployment rates. However, it notes persistent disparities and the need for continued effort, supported by data from 2011 to 2023.
gender equality, OECD, PwC, workforce participation, wage gap, employment, index, women in work, labor market, metrics
false
Performance Metrics and KPIs
Government & Public Sector
Mixed Chart
PwC/Strategy&
Add to my slides
Remove from favorites
The slide combines text and circular graphical elements to showcase survey results regarding organizational commitments to gender equality.
Market Analysis and Trends
Professional Services
Examines skepticism toward organizations’ commitments to gender equality and its implications for workplace culture and employer branding. This slide is useful for presentations advocating for tangible actions towards gender equality in the workplace.
gender equality, organizations, commitment, survey
false
Market Analysis and Trends
Professional Services
Multiple Chart
Deloitte
Add to my slides
Remove from favorites
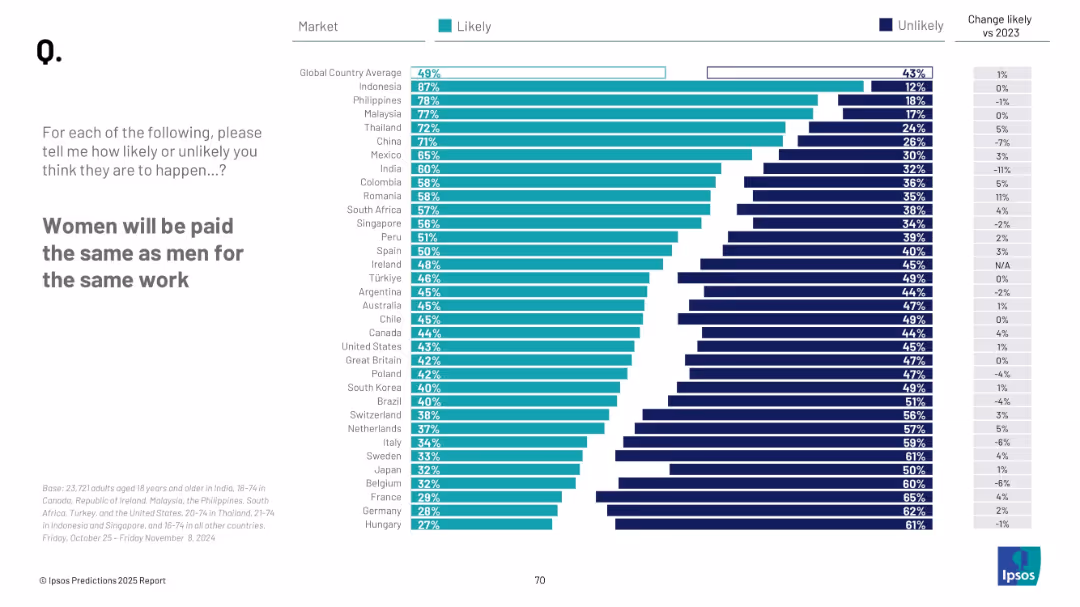
Horizontal bar chart ranking countries by Likely response; change vs. 2023 shown; global average marked.
Human Resources and Talent Management
Professional Services
This slide explores public belief in gender pay equality becoming reality by 2025. Indonesia is most optimistic, while Hungary and Germany are least. Global average is at 49%, a marginal increase from the previous year.
gender equality, pay gap, public opinion, Ipsos, HR trends, country comparison, 2025 expectations, workplace fairness
false
Human Resources and Talent Management
Professional Services
Mixed Chart
IPSOS
Add to my slides
Remove from favorites
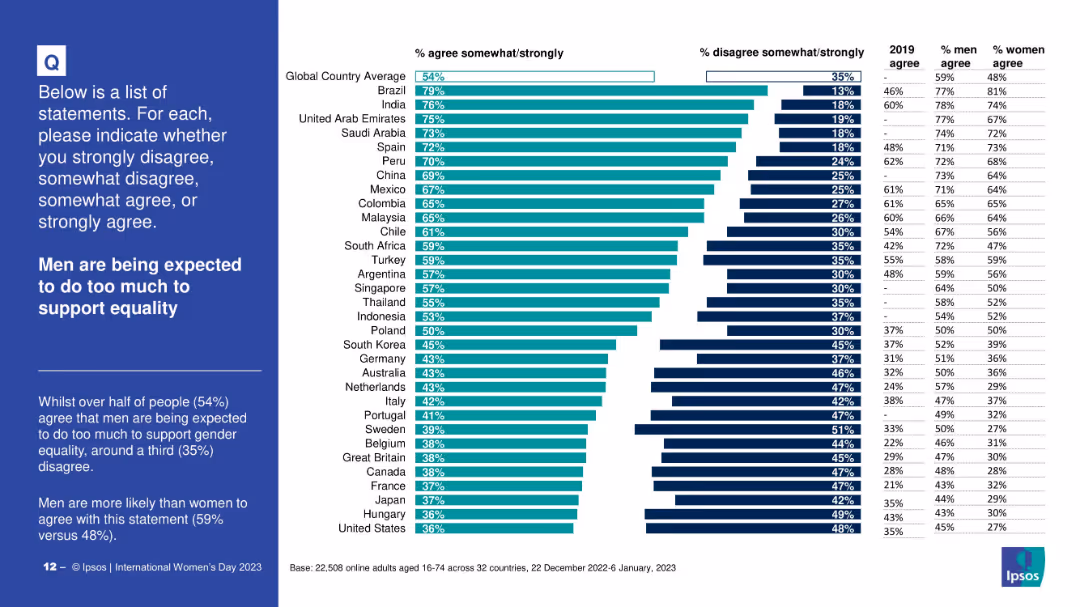
Horizontal bar chart with country-wise responses; sidebar includes summary insights and gender comparison; layout is clean and data-heavy
Market Analysis and Trends
Professional Services
The slide shows the percentage of people in various countries who agree or disagree that men are being expected to do too much to support gender equality. It highlights global and national sentiments and includes a gender-based breakdown.
gender equality, perceptions, expectations, men, global opinions, country comparison, Ipsos, International Women’s Day, 2023, attitudes
false
Market Analysis and Trends
Professional Services
Mixed Chart
IPSOS
Add to my slides
Remove from favorites
Slide displays bar graphs detailing the representation of women in national parliaments over time, complemented by clear textual annotations and visual elements emphasizing changes and trends.
Market Analysis and Trends
Government & Public Sector
Discusses the trends and disparities in women's political participation globally, highlighting both progress and areas needing improvement, aimed at fostering discussions on gender equality in governance.
gender equality, politics, global, data, trends, women, parliament, comparison, progress, equity
false
Market Analysis and Trends
Government & Public Sector
Multiple Chart
Roland Berger
Add to my slides
Remove from favorites
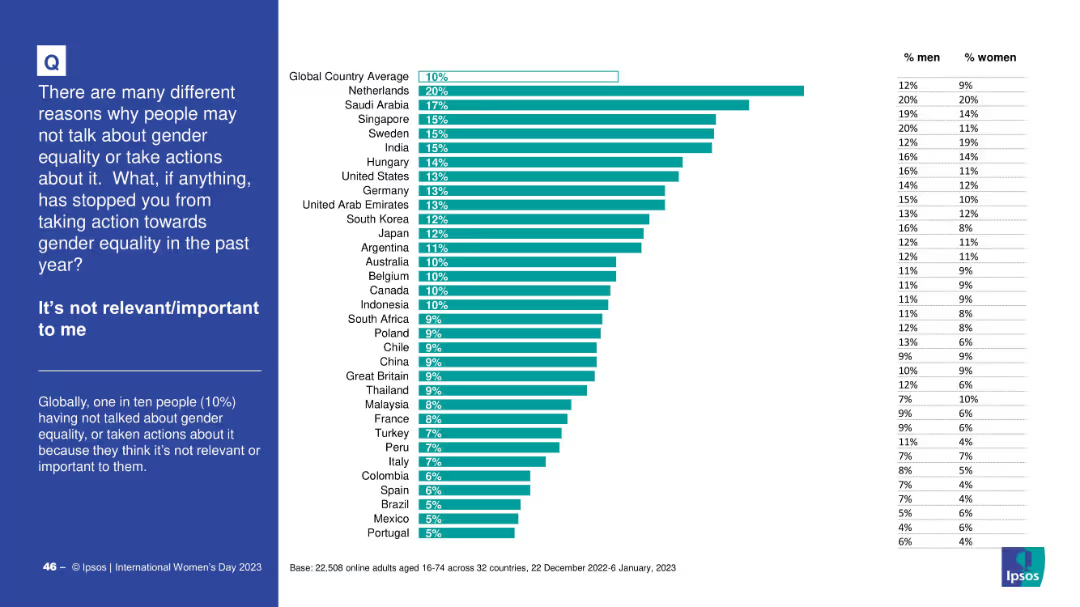
Bar chart with horizontal bars ranked by country, placed on a clean white background; explanatory text and title in a blue left-hand panel.
Market Analysis and Trends
Government & Public Sector
The slide visualizes the percentage of people in different countries who did not act on gender equality because they felt it was not relevant to them. The global average is 10%, with country-specific breakdowns and gender splits on the right side.
gender equality, relevance, global average, country comparison, survey, Ipsos, men vs women, attitudes, public opinion
false
Market Analysis and Trends
Government & Public Sector
Mixed Chart
IPSOS
Add to my slides
Remove from favorites
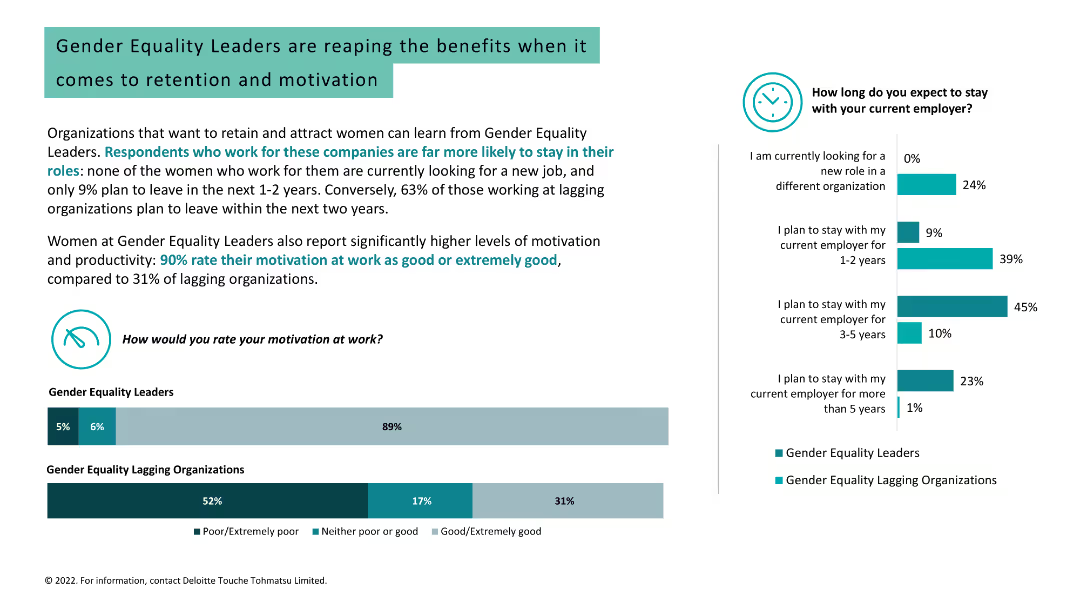
Column charts, text, and image. Data on motivation, retention, and job search intentions among women in gender equality leader vs. lagging organizations.
Human Resources and Talent Management
Professional Services
Highlights the higher retention and motivation levels among women working for gender equality leaders compared to lagging organizations.
gender equality, retention, motivation, job search, women, workplace, leadership, engagement, organization
false
Human Resources and Talent Management
Professional Services
Multiple Chart
Deloitte
Add to my slides
Remove from favorites
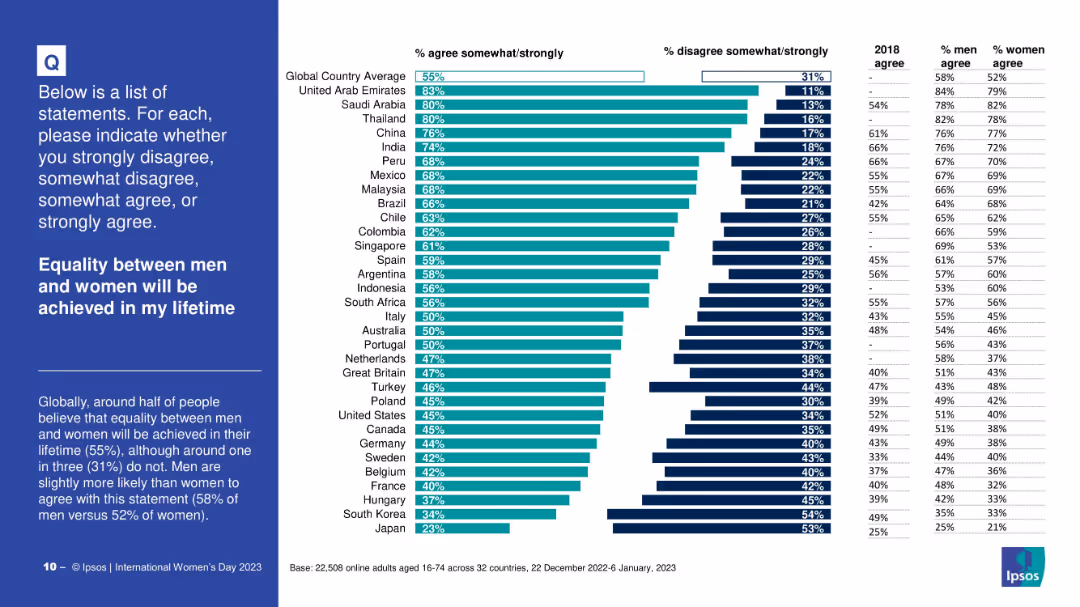
Country-ranked bar chart of % agreeing; includes gender breakdown and historical context.
Human Resources and Talent Management
Government & Public Sector
Depicts belief levels by country on achieving gender equality within one’s lifetime; men generally express more optimism than women.
gender equality timeline, optimism, future vision, gender differences, international comparison, Ipsos
false
Human Resources and Talent Management
Government & Public Sector
Mixed Chart
IPSOS
Add to my slides
Remove from favorites
Column charts, text, and image. Data on wellbeing, job satisfaction, and mental health support for women in gender equality leader organizations.
Human Resources and Talent Management
Professional Services
Showcases the positive impact of working for gender equality leader organizations on women's wellbeing, job satisfaction, and mental health.
gender equality, wellbeing, job satisfaction, mental health, support, women, workplace, leadership, engagement
false
Human Resources and Talent Management
Professional Services
Multiple Chart
Deloitte
Add to my slides
Remove from favorites
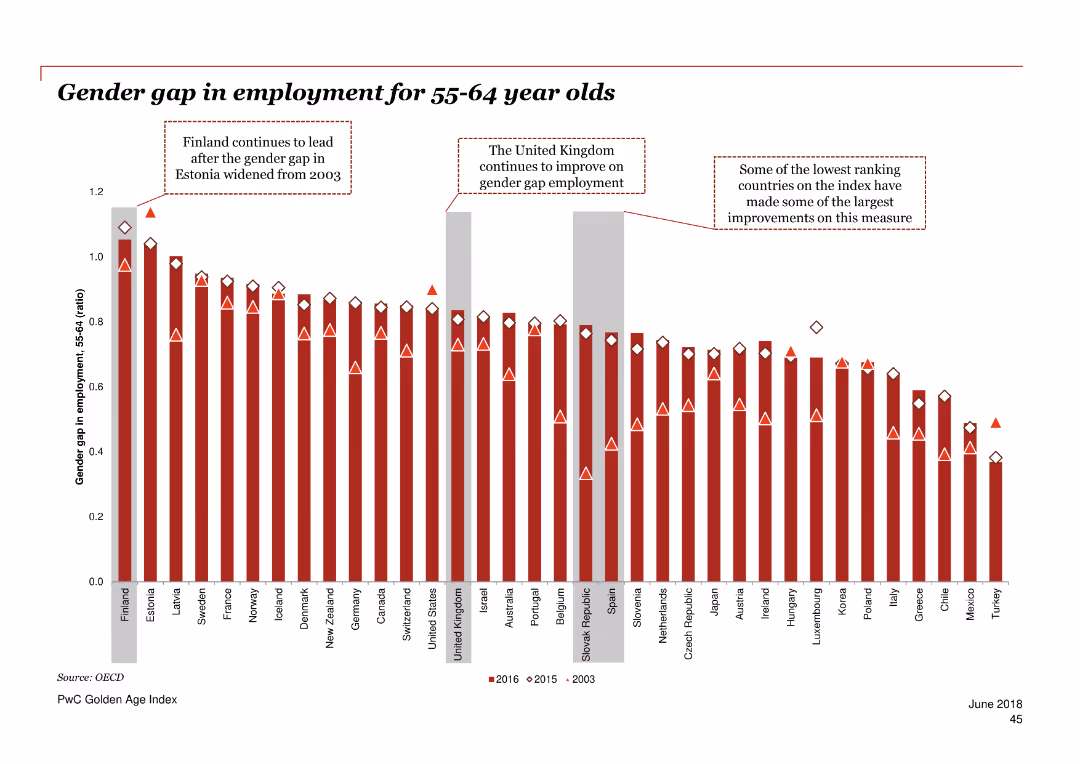
Column chart showing gender gap in employment (ratio) for 55-64 year olds across various countries, with three years' data compared.
Market Analysis and Trends
Professional Services
The slide analyzes the gender gap in employment for older adults across different countries over three periods (2003, 2015, 2016).
gender gap, employment, 55-64, OECD, trend
false
Market Analysis and Trends
Professional Services
Single Chart
PwC/Strategy&
Add to my slides
Remove from favorites
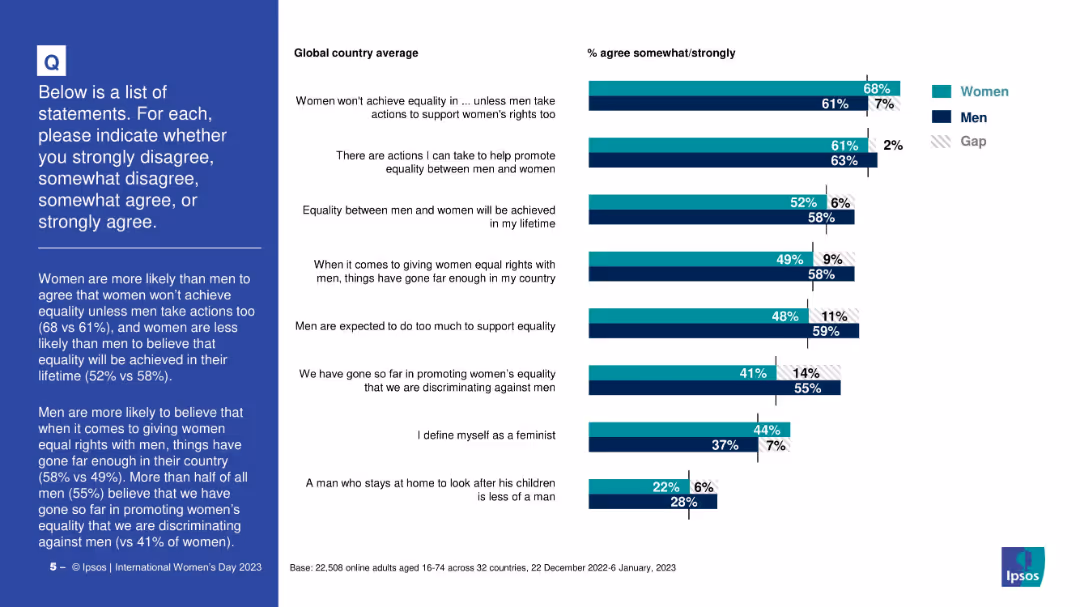
Stacked bar chart comparing responses of men and women on same gender equality questions; includes % gap annotations.
Human Resources and Talent Management
Government & Public Sector
This slide contrasts male and female perspectives on gender equality, highlighting gender gaps in support and beliefs around feminism and equal rights actions.
gender gap, equality, male allyship, feminism, public survey, men vs women, Ipsos, opinion split, gender roles
false
Human Resources and Talent Management
Government & Public Sector
Mixed Chart
IPSOS
Add to my slides
Remove from favorites
Line chart by generation and gender (male/female), showing % agreement with transgender access to gendered facilities. Simple layout with chart right-aligned.
Regulatory and Compliance
Government & Public Sector
The slide presents generational trends in support for transgender individuals using gendered facilities. It highlights agreement levels across Baby Boomers, Gen X, Millennials, and Gen Z, broken down by gender, showing a consistent gender gap.
gender gap, generational trends, Gen Z, Baby Boomers, gender identity, transgender rights, survey, access, restrooms, opinion trends
false
Regulatory and Compliance
Government & Public Sector
Mixed Chart
IPSOS
Add to my slides
Remove from favorites
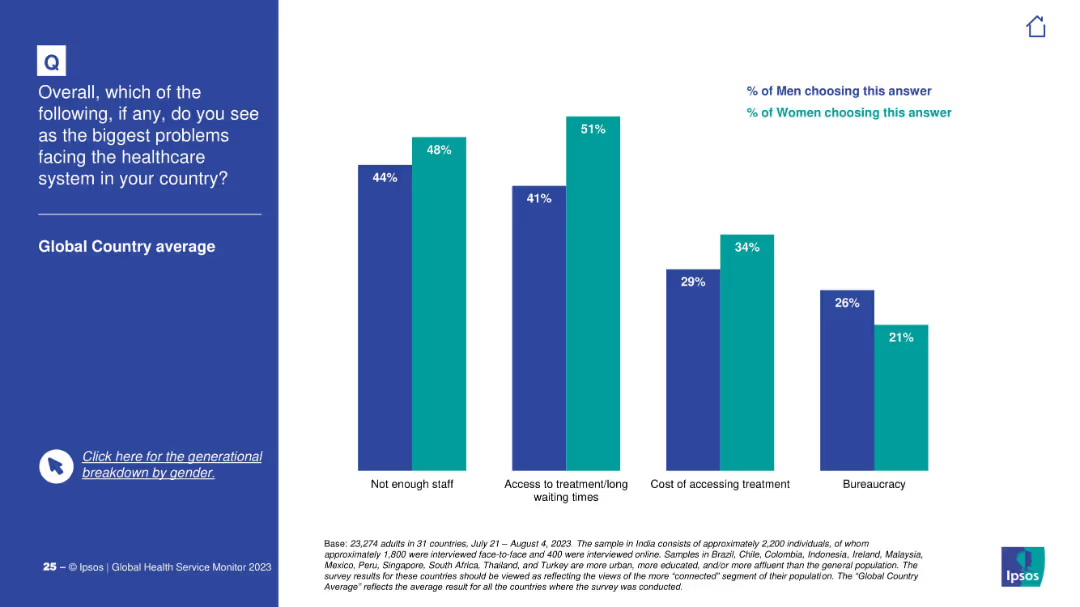
Side-by-side vertical bar chart comparing male vs. female responses; blue background on the left side.
Market Analysis and Trends
Healthcare & Pharmaceuticals
This slide shows gender-based differences in the perception of major healthcare system problems. Women report higher concern than men across all top four categories: staffing, treatment access, cost, and bureaucracy.
gender gap, healthcare issues, perceptions, survey
false
Market Analysis and Trends
Healthcare & Pharmaceuticals
Mixed Chart
IPSOS
Add to my slides
Remove from favorites
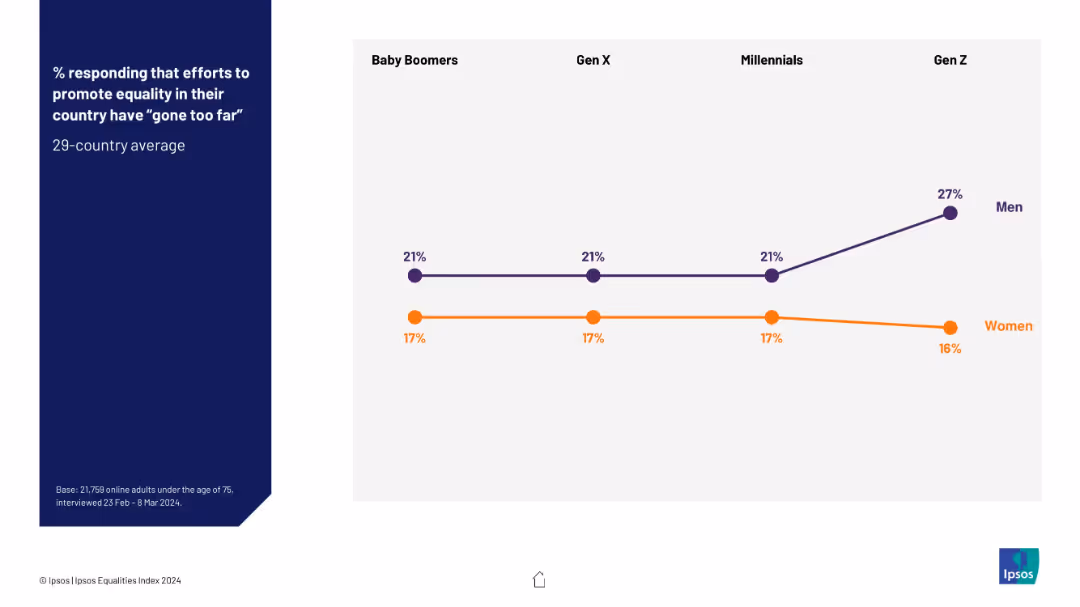
Line chart split by gender and generation; men and women plotted separately with distinct colors; Gen Z shows a rise among men.
Regulatory and Compliance
Government & Public Sector
The chart reveals generational and gender divides in the view that equality efforts have overreached. Notably, Gen Z men report significantly higher agreement that actions “have gone too far” compared to women.
gender gap, overreach, equality backlash, Gen Z, Ipsos data, public sentiment, demographic trends
false
Regulatory and Compliance
Government & Public Sector
Mixed Chart
IPSOS
Add to my slides
Remove from favorites
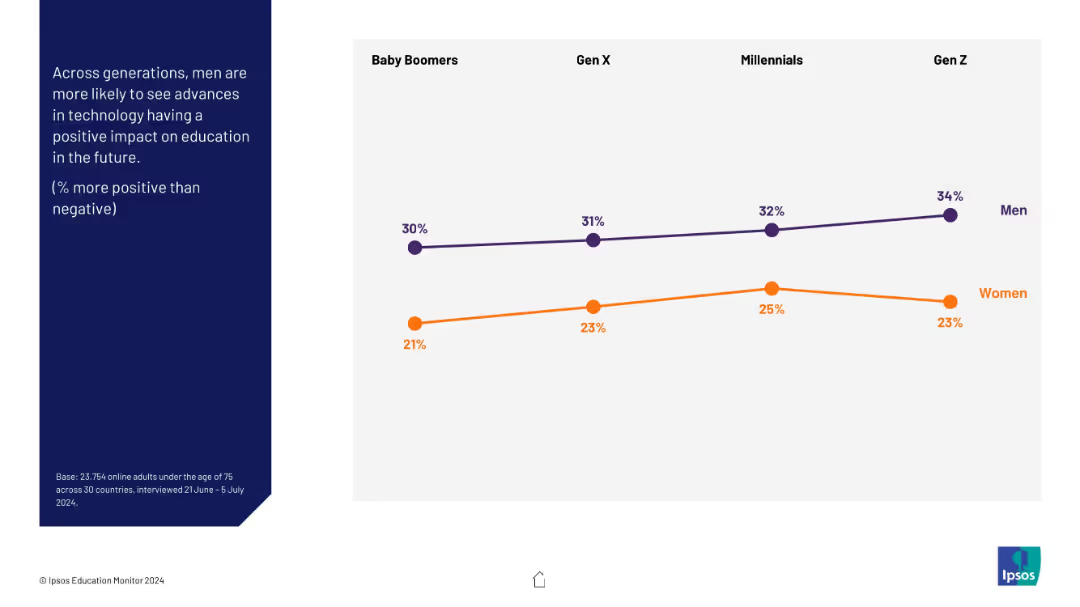
Line graph comparing men vs women across generations (Baby Boomers to Gen Z); question on left in blue
Market Analysis and Trends
Education & Training
The slide shows gender differences in optimism about technology’s impact on education. Men across all generations consistently show more optimism than women, with Gen Z men the most positive.
gender gap, perception, technology, education, AI, optimism, generations
false
Market Analysis and Trends
Education & Training
Mixed Chart
IPSOS
Add to my slides
Remove from favorites
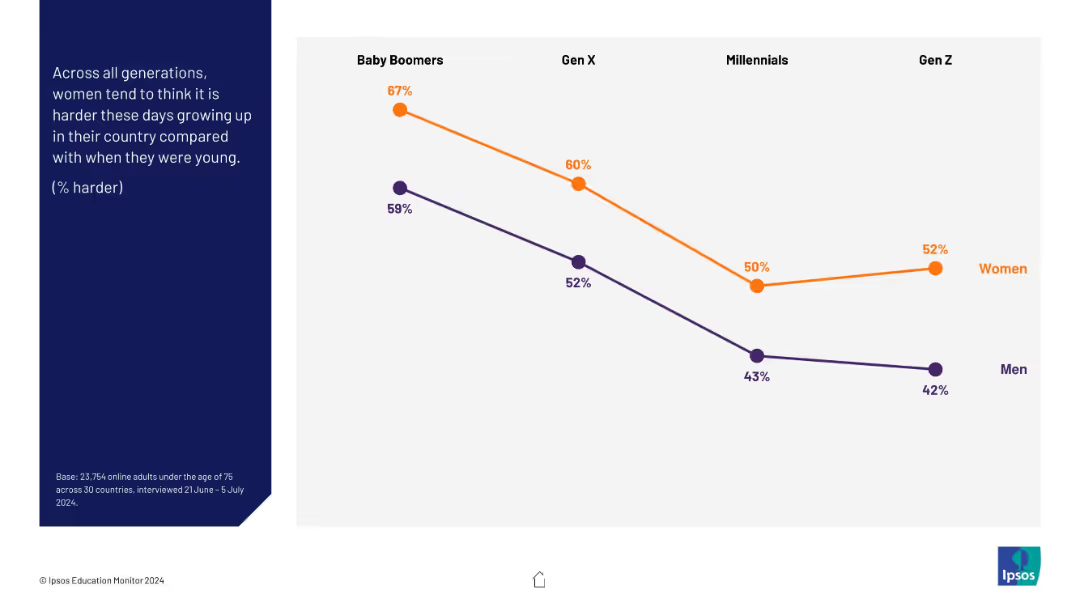
Line graph comparing responses by gender across four generations (Baby Boomers to Gen Z) on whether growing up is harder now. Orange line represents women; purple line represents men.
Human Resources and Talent Management
Education & Training
This slide visualizes gender-based perceptions on childhood difficulty. Across all generations, women are more likely than men to say growing up is harder today, indicating potentially higher sensitivity to modern societal pressures.
gender, generations, growing up, difficulty, perception, Ipsos, education
false
Human Resources and Talent Management
Education & Training
Mixed Chart
IPSOS
Add to my slides
Remove from favorites
A bar chart details the proportion of female and male graduates in various fields of study between 2010-2019, using two different shades to distinguish genders.
Market Analysis and Trends
Education & Training
Reviews the gender distribution among tertiary graduates in various fields from 2010 to 2019, emphasizing the dominance of women in fields like education and health and their underrepresentation in STEM fields.
gender, graduates, fields, STEM, distribution
false
Market Analysis and Trends
Education & Training
Mixed Chart
Roland Berger
Add to my slides
Remove from favorites
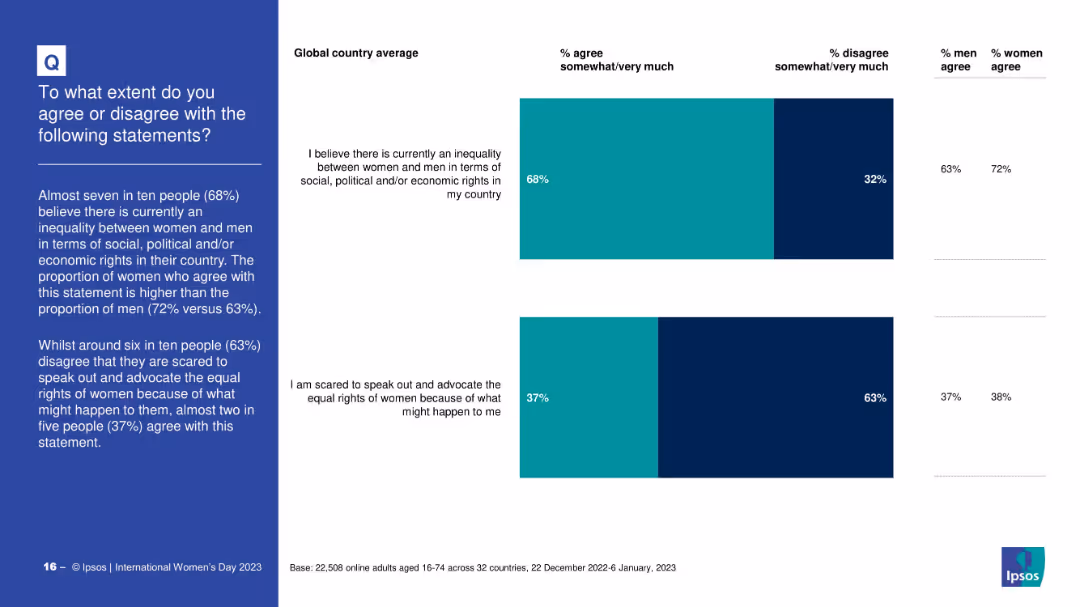
Two stacked bar graphs with global averages; bold sidebar text; compares agreement/disagreement on inequality and fear of advocating for women’s rights
Market Analysis and Trends
Professional Services
The slide features two questions: belief in current gender inequality, and fear of advocating women's rights. It shows global agreement and disagreement rates, along with gender differences in perceptions.
gender inequality, advocacy, fear, rights, global average, survey, social justice, Ipsos
false
Market Analysis and Trends
Professional Services
Mixed Chart
IPSOS
Add to my slides
Remove from favorites
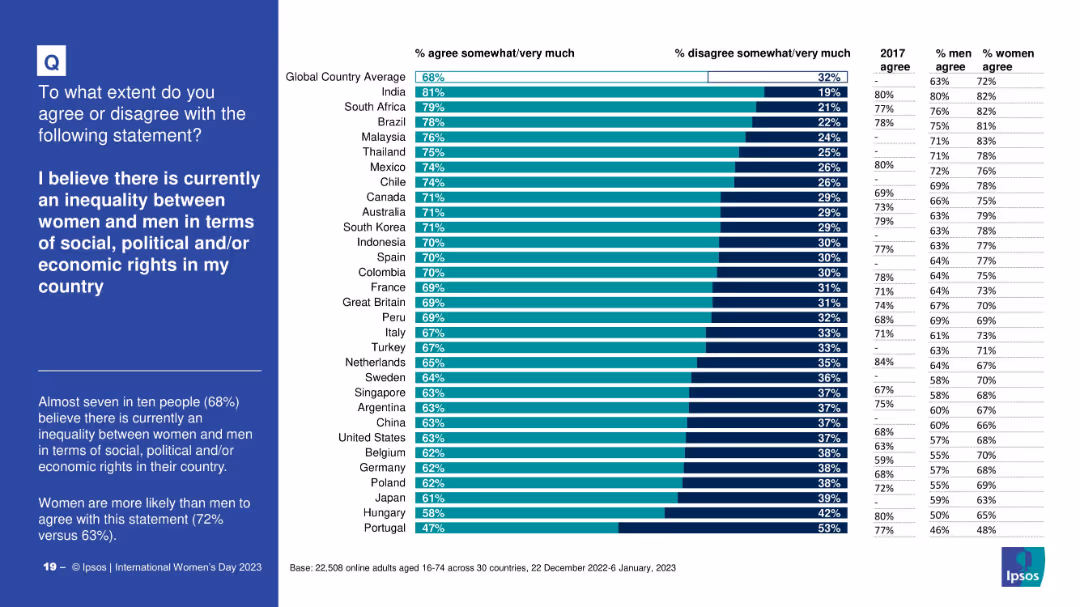
Horizontal bar chart showing country-specific agreement levels; includes 2017 data, gender-specific agreement, and global averages
Market Analysis and Trends
Professional Services
This slide visualizes public belief in current gender inequality across countries, comparing agreement/disagreement rates, gender-specific stats, and previous data from 2017. Women consistently agree more than men.
gender inequality, perception, country analysis, 2023 survey, global opinion, historical comparison
false
Market Analysis and Trends
Professional Services
Mixed Chart
IPSOS
Add to my slides
Remove from favorites
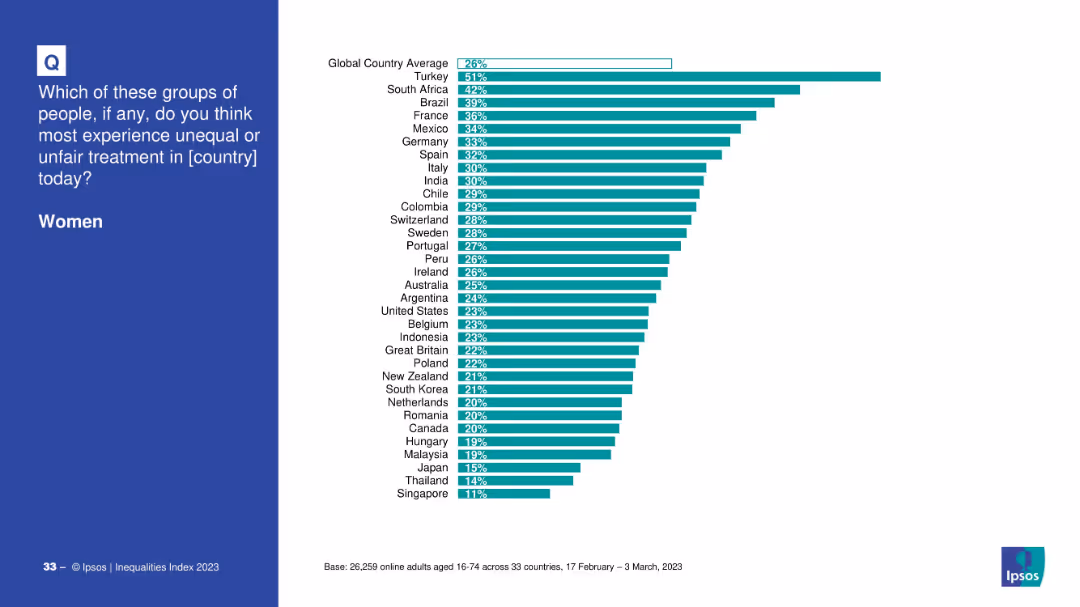
Country-level bar chart showing the perceived unfair treatment of women.
Customer and Market Segmentation
Government & Public Sector
This slide ranks countries based on how many believe women experience unfair treatment. Turkey, South Africa, and Brazil top the list, while countries like Singapore and Japan are at the lower end of perception.
gender inequality, women, unfair treatment, international comparison, discrimination
false
Customer and Market Segmentation
Government & Public Sector
Mixed Chart
IPSOS
Add to my slides
Remove from favorites
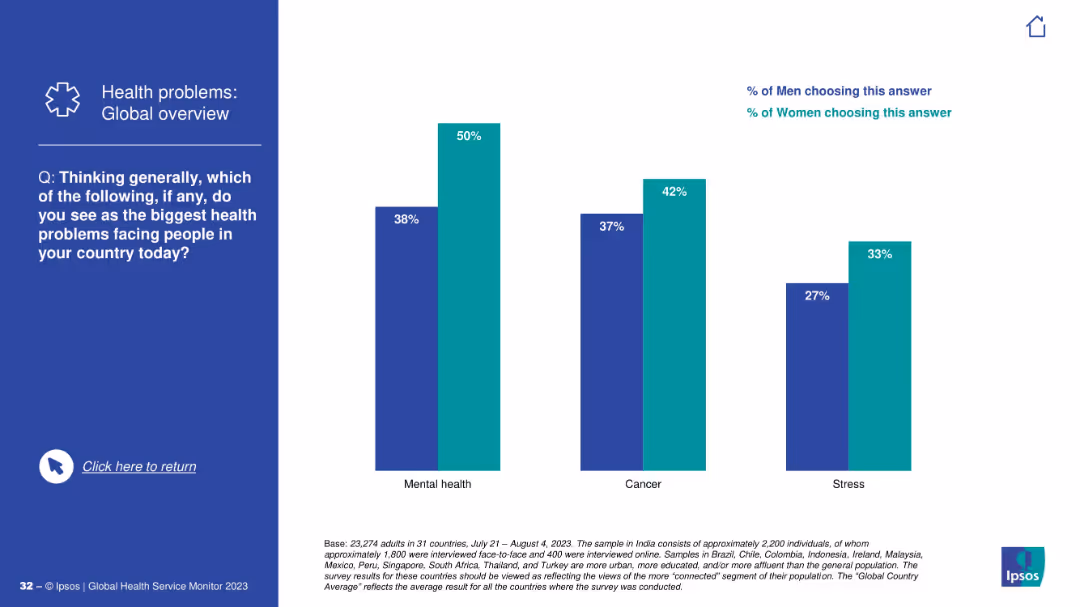
Vertical bar chart comparing gender responses; light blue for women, dark blue for men.
Customer and Market Segmentation
Healthcare & Pharmaceuticals
Gender-specific data reveals that women are significantly more concerned than men about mental health, cancer, and stress, highlighting notable differences in health perception.
gender insights, health concerns, survey data
false
Customer and Market Segmentation
Healthcare & Pharmaceuticals
Mixed Chart
IPSOS
Add to my slides
Remove from favorites
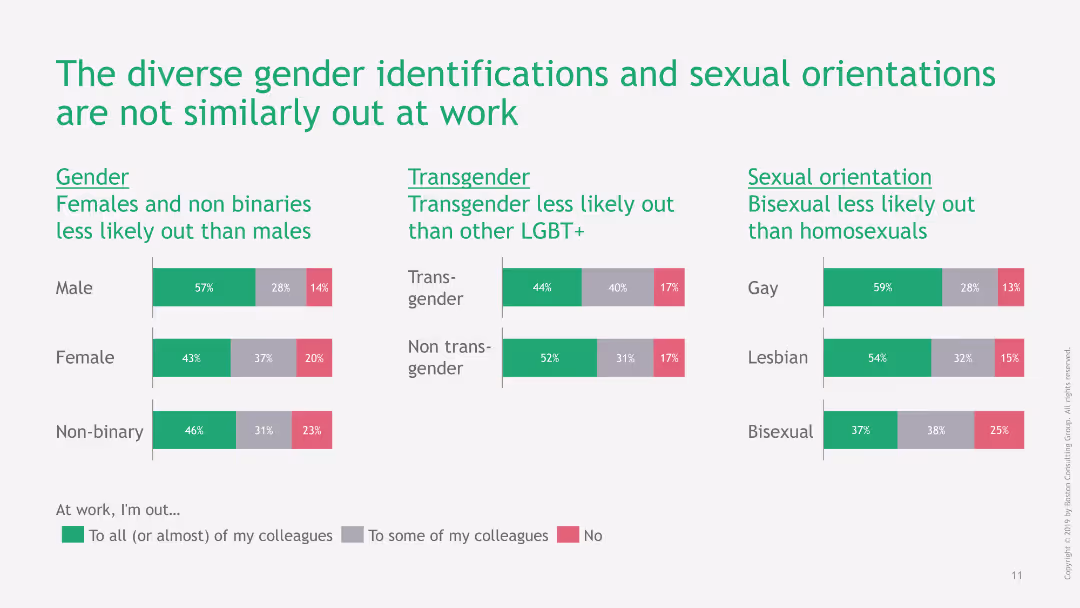
The slide features multiple bar charts comparing the percentages of people who are out at work based on gender, transgender status, and sexual orientation. The bars are horizontal and color-coded to show levels of openness among colleagues.
Organizational Structure and Change
Professional Services
This slide provides data on how different gender identities and sexual orientations are represented at work in terms of being out. It highlights that females and non-binaries are less likely to be out compared to males.
Gender, LGBT+, Workplace, Openness, Diversity, Inclusion
false
Organizational Structure and Change
Professional Services
Multiple Chart
BCG
Add to my slides
Remove from favorites
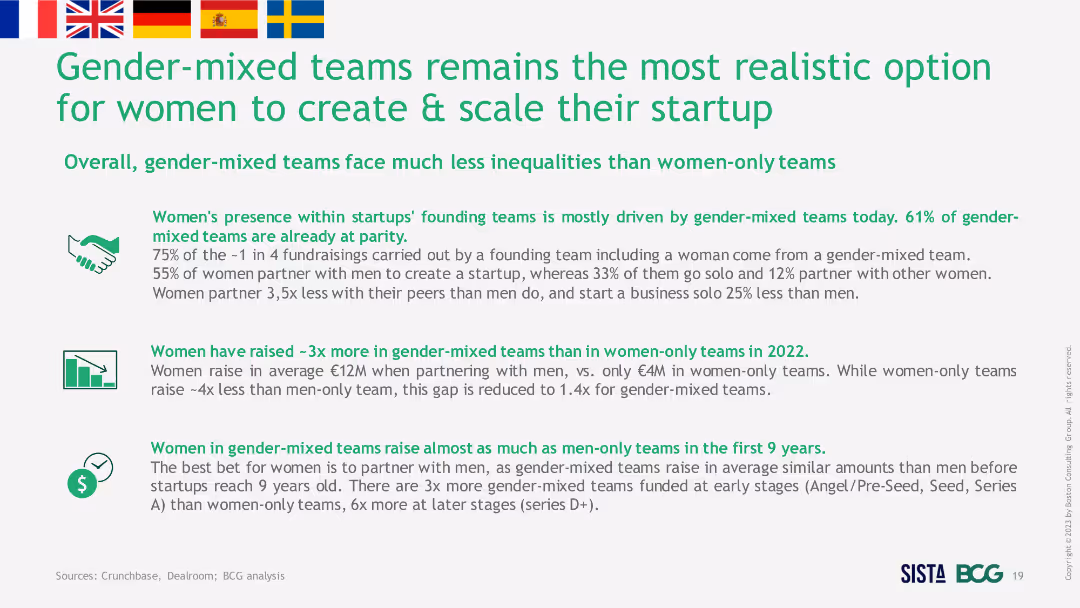
Text-heavy slide with bullet points and icons. Discusses the advantages of gender-mixed teams in startups, supported by statistics on fundraising and team formation.
Strategic Planning
Professional Services
This slide outlines how gender-mixed teams offer a more realistic option for women to create and scale startups. It provides statistics on fundraising success and team composition, highlighting the benefits of mixed-gender teams.
Gender-mixed, Teams, Startups, Women, Fundraising
false
Strategic Planning
Professional Services
Header Vertical
BCG
Add to my slides
Remove from favorites
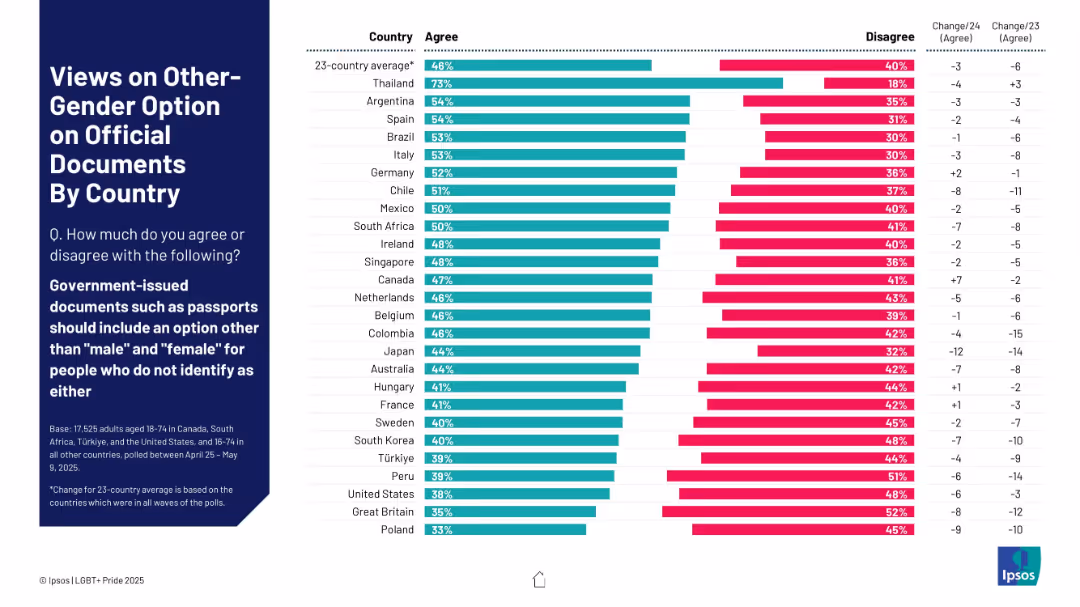
Horizontal bar chart showing country-by-country agreement/disagreement on third gender option for documents. Color-coded, with year-over-year change indicators.
Regulatory and Compliance
Government & Public Sector
This slide analyzes public sentiment in 23 countries on allowing a gender option other than "male" or "female" on official documents. It compares agreement and disagreement rates and provides context on changes since previous surveys.
gender options, nonbinary, legal documents, public opinion, transgender rights, third gender, country comparison, Ipsos, passport ID
false
Regulatory and Compliance
Government & Public Sector
Mixed Chart
IPSOS
Add to my slides
Remove from favorites
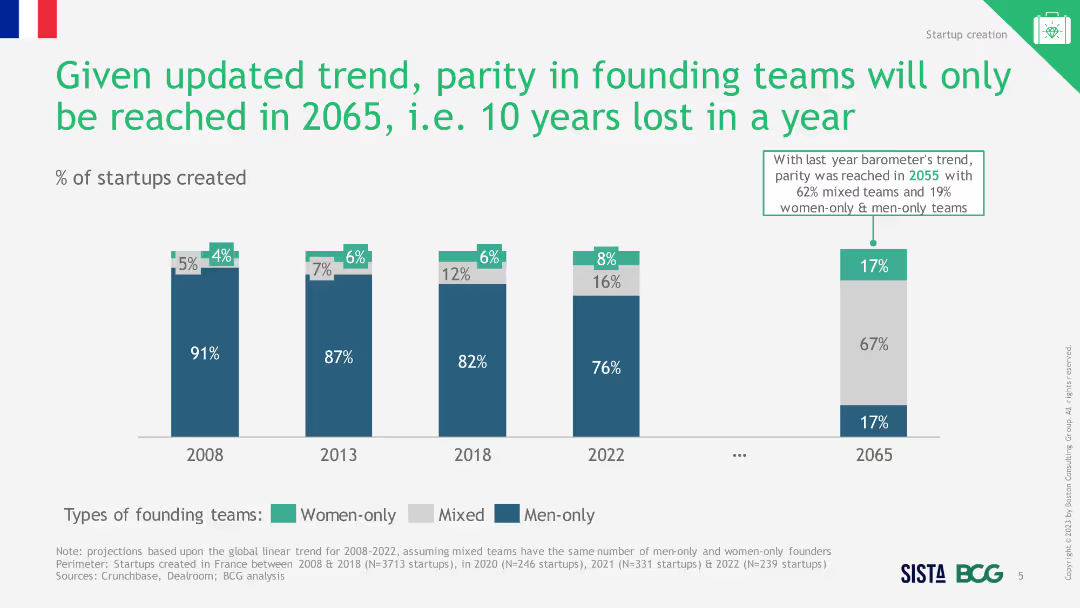
Column chart showing percentage of startups with different types of founding teams from 2008 to 2022, with a projection for 2065.
Market Analysis and Trends
Professional Services
The slide forecasts gender parity in startup founding teams by 2065, showing the trend from 2008 to 2022 and the potential delay in achieving parity.
gender parity, startups, projections, trends, 2065
false
Market Analysis and Trends
Professional Services
Single Chart
BCG
Add to my slides
Remove from favorites
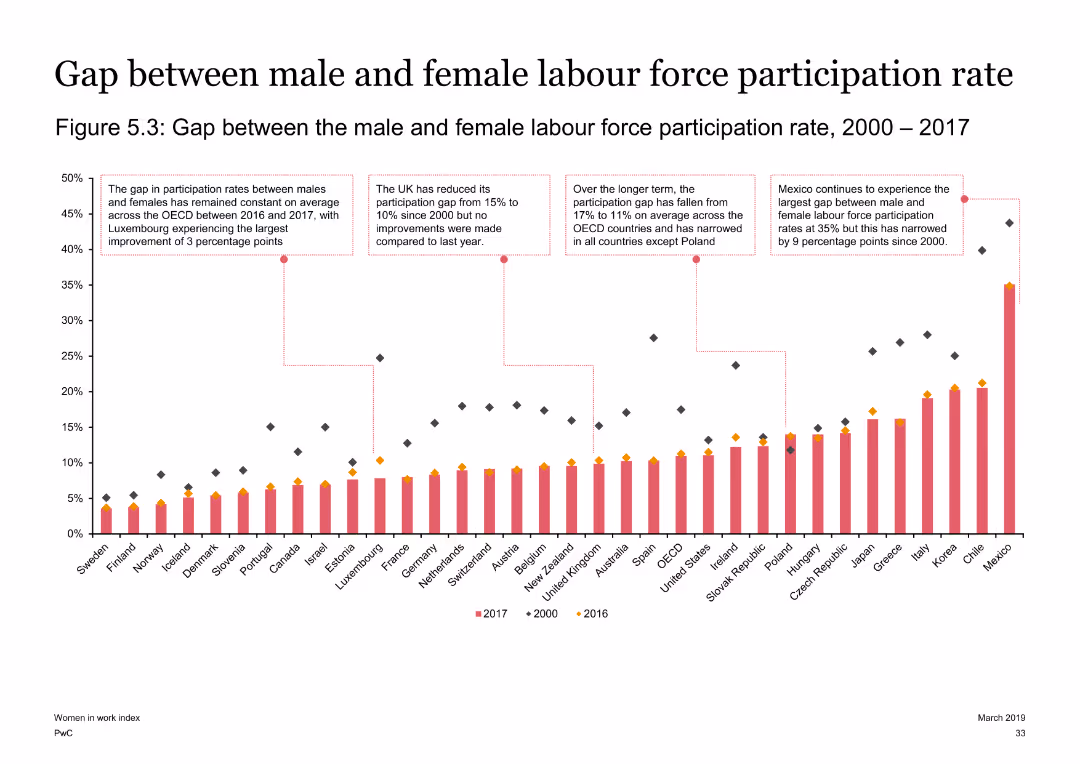
Displays a column chart showing the gap between male and female labor force participation rates across OECD countries from 2000 to 2017. The slide includes detailed annotations and visual comparisons.
Market Analysis and Trends
Government & Public Sector
Discusses the gap between male and female labor force participation rates across OECD countries, highlighting the reductions in the gap over time, with specific improvements in Luxembourg and Mexico.
gender participation gap, OECD, labor force, Luxembourg, Mexico
false
Market Analysis and Trends
Government & Public Sector
Single Chart
PwC/Strategy&
Add to my slides
Remove from favorites
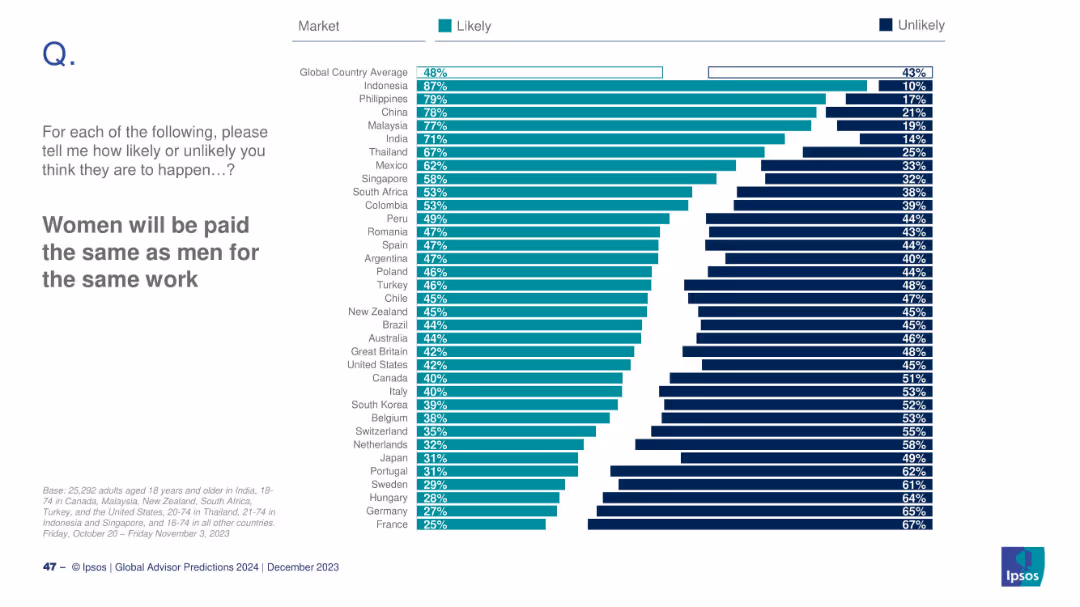
Horizontal bar chart of countries; teal (Likely) and dark blue (Unlikely) bars; global average included.
Human Resources and Talent Management
Professional Services
This slide presents public opinion on gender pay equality. Indonesia (87%) and the Philippines (79%) show the highest optimism. The global average is 48%. Western countries like Germany and France are more skeptical.
gender pay gap, equality, labor market, women in work, global perception, Ipsos, 2024, HR, workplace equity, international sentiment
false
Human Resources and Talent Management
Professional Services
Mixed Chart
IPSOS
Add to my slides
Remove from favorites
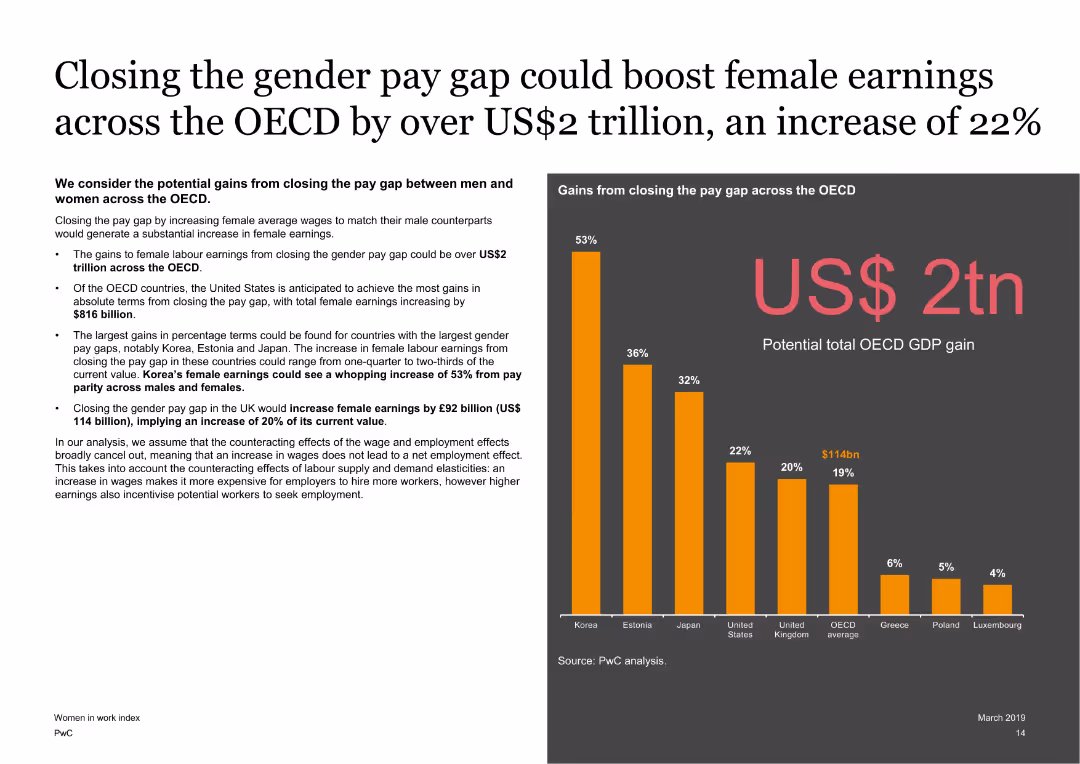
This slide features text on the left and a column chart on the right. The column chart shows gains from closing the gender pay gap across the OECD. The slide is moderately dense with detailed analysis.
Market Analysis and Trends
Government & Public Sector
Examines the potential gains from closing the gender pay gap between men and women across the OECD, highlighting significant gains in female earnings and economic benefits for various countries, especially the US and Korea.
gender pay gap, female earnings, OECD, economic impact, wage equality
false
Market Analysis and Trends
Government & Public Sector
Mixed Chart
PwC/Strategy&
Add to my slides
Remove from favorites
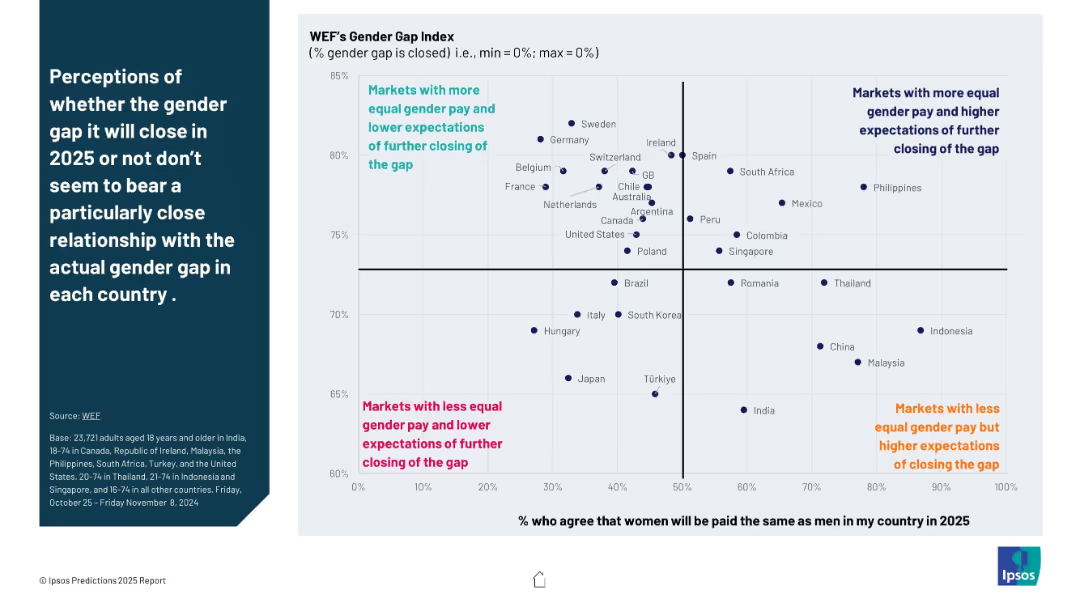
Scatterplot comparing % who agree gender pay will equalize vs. actual gender pay gap (from WEF data); four quadrant groups annotated; data points labeled by country.
Human Resources and Talent Management
Professional Services
This slide juxtaposes actual gender pay parity levels with public expectations of closing the gap. Quadrants distinguish high/low equality and expectations. Key insight: perception often doesn’t match statistical reality.
gender pay gap, perception vs reality, scatterplot, Ipsos, equality, workforce trends, WEF index, HR insights
false
Human Resources and Talent Management
Professional Services
Mixed Chart
IPSOS
Add to my slides
Remove from favorites
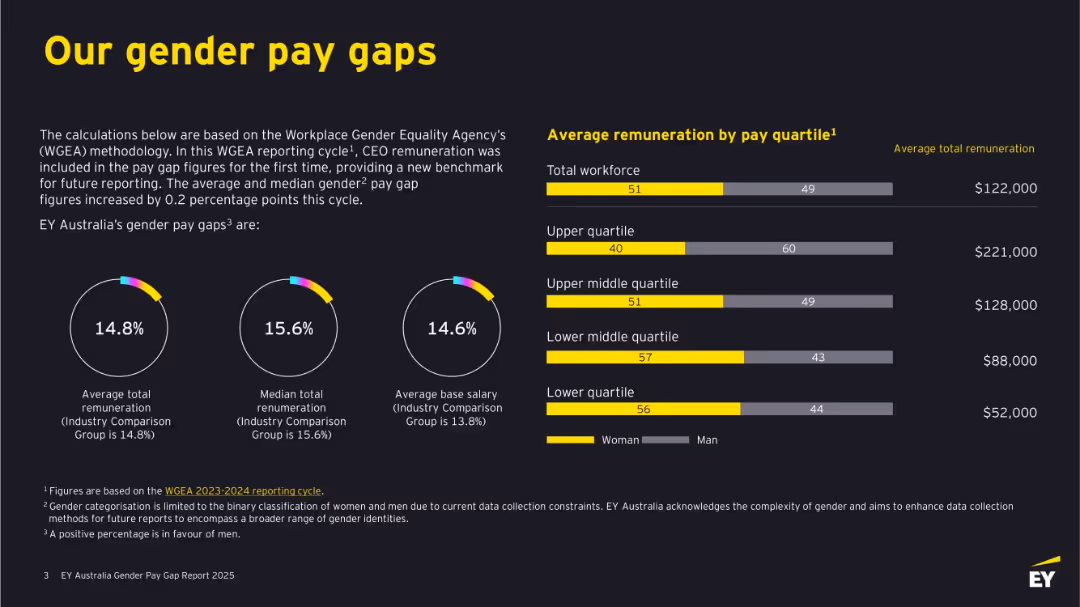
Dark background with bold yellow and white text. Features circular graphs, bar charts, and figures. Clearly divided into left-side text explanations and right-side remuneration bars by quartile.
Human Resources and Talent Management
Professional Services
This slide outlines EY Australia's gender pay gaps based on WGEA methodology, including total and median remuneration and base salary differences. It shows visual comparisons by gender across pay quartiles, revealing gaps in compensation and detailing where discrepancies occur. It emphasizes benchmarking against industry standards.
gender pay gap, remuneration, WGEA, EY Australia, salary, pay quartiles, workforce, diversity, women, equality
false
Human Resources and Talent Management
Professional Services
Multiple Chart
EY
Add to my slides
Remove from favorites
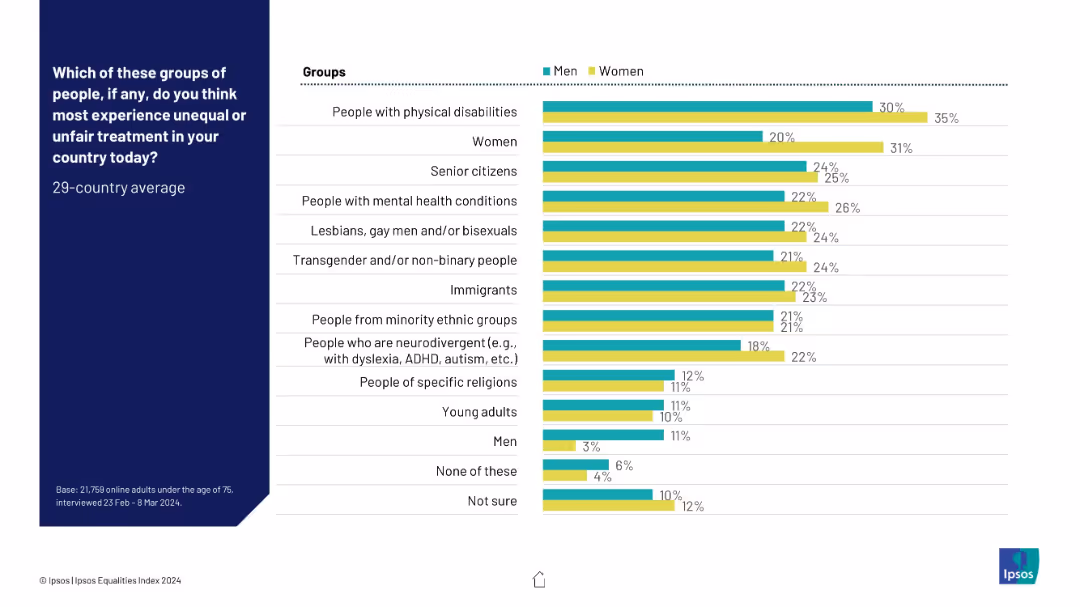
Dual bar chart comparing men and women responses by group; turquoise for men, yellow for women; visual parity shown.
Risk Assessment and Management
Government & Public Sector
This slide explores gender differences in the perception of unfair treatment toward various groups. Across nearly all categories, women report higher perceived inequality than men.
gender perception, unfair treatment, Ipsos, inequality awareness, men vs women, comparative chart
false
Risk Assessment and Management
Government & Public Sector
Mixed Chart
IPSOS
Add to my slides
Remove from favorites
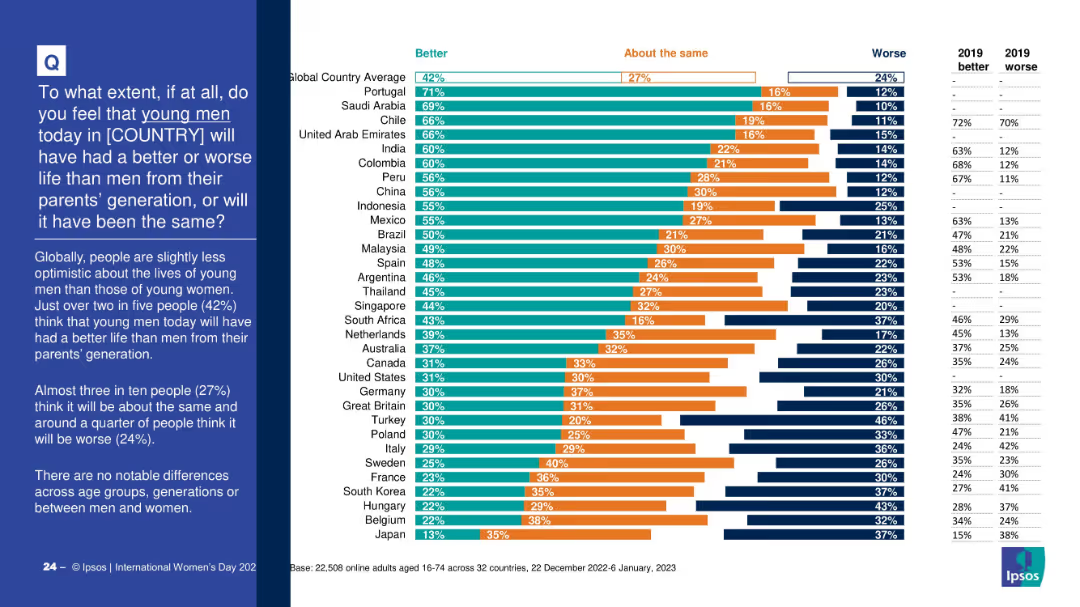
Similar format to Slide 19411, showing segmented bar chart by country and 2019 data. The left column provides a summary and highlights global opinions on young men's future.
Market Analysis and Trends
Government & Public Sector
This slide examines perceptions of young men’s life outcomes compared to previous generations. Globally, 42% believe life will be better for young men. Slightly lower optimism is shown compared to young women, with detailed breakdowns by country.
gender perception, young men, generational comparison, life outlook, international survey, Ipsos, societal progress
false
Market Analysis and Trends
Government & Public Sector
Mixed Chart
IPSOS
Add to my slides
Remove from favorites
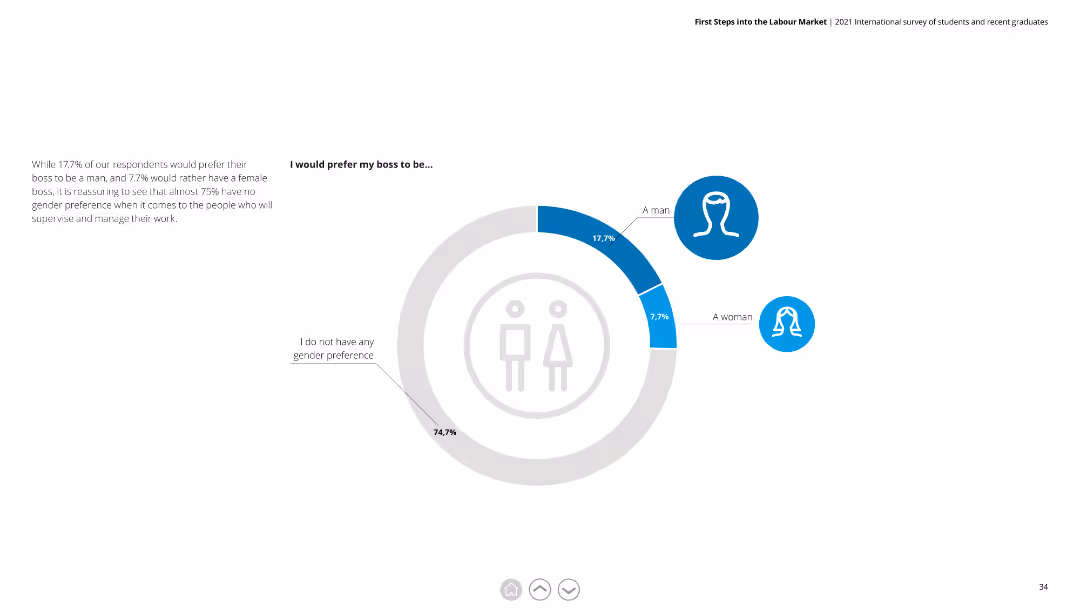
Donut chart showing gender preferences for bosses among respondents, with detailed text explaining the lack of strong gender preference for supervisors.
Human Resources and Talent Management
Education & Training
This slide presents preferences for the gender of bosses among respondents, highlighting a significant majority with no gender preference in choosing their boss.
gender preference, boss, supervisor, managerial preferences, young professionals
false
Human Resources and Talent Management
Education & Training
Mixed Chart
Deloitte
Add to my slides
Remove from favorites
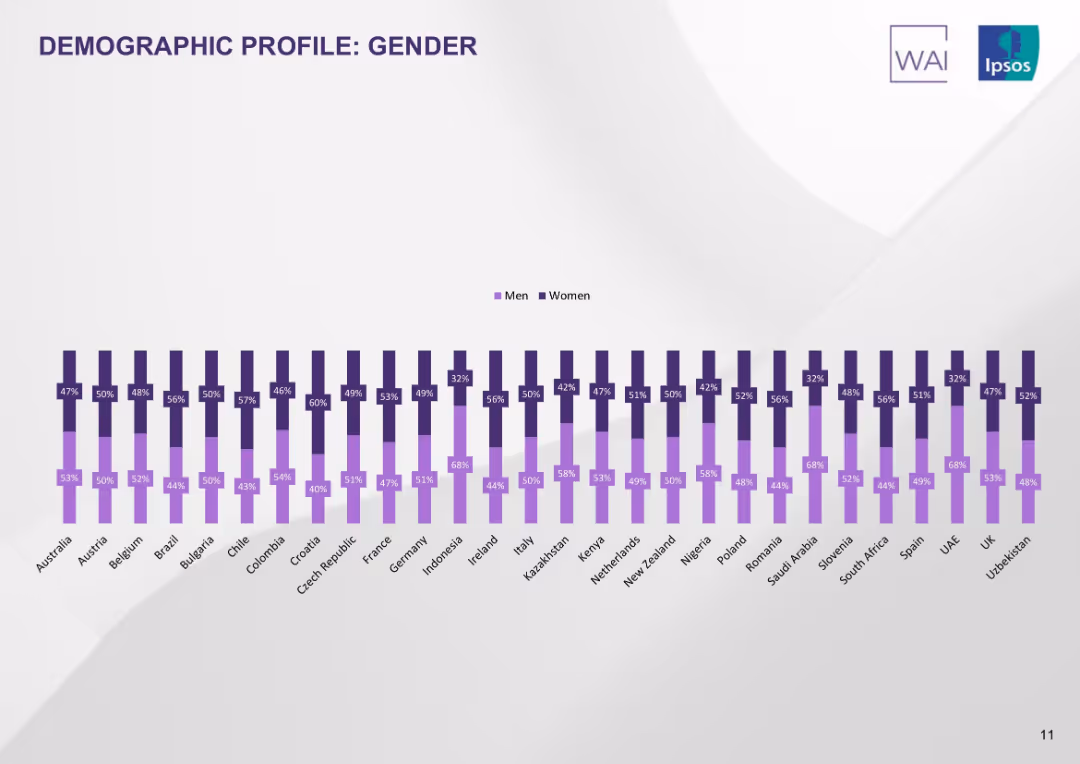
Double vertical bar chart showing male/female participation rates per country. Purple color scheme on white background.
Customer and Market Segmentation
Healthcare & Pharmaceuticals
The slide displays gender distribution of survey respondents per country. Most countries have near-equal participation, though some (e.g., Saudi Arabia, UAE) have a female majority.
gender profile, demographics, country comparison, male vs female, survey base, tobacco study, Ipsos
false
Customer and Market Segmentation
Healthcare & Pharmaceuticals
Single Chart
IPSOS
Add to my slides
Remove from favorites
Features line graphs comparing the sex ratio at birth (SRB) across various countries from 1970 to 2017, highlighting trends and disparities.
Market Analysis and Trends
Government & Public Sector
Discusses the implications of gender ratio imbalances in selected countries, exploring the causes and long-term impacts of skewed sex ratios. It provides a historical perspective on how policies and cultural factors have shaped these trends.
gender ratio, demographics, policy, cultural impact, trends
false
Market Analysis and Trends
Government & Public Sector
Mixed Chart
Roland Berger
Add to my slides
Remove from favorites
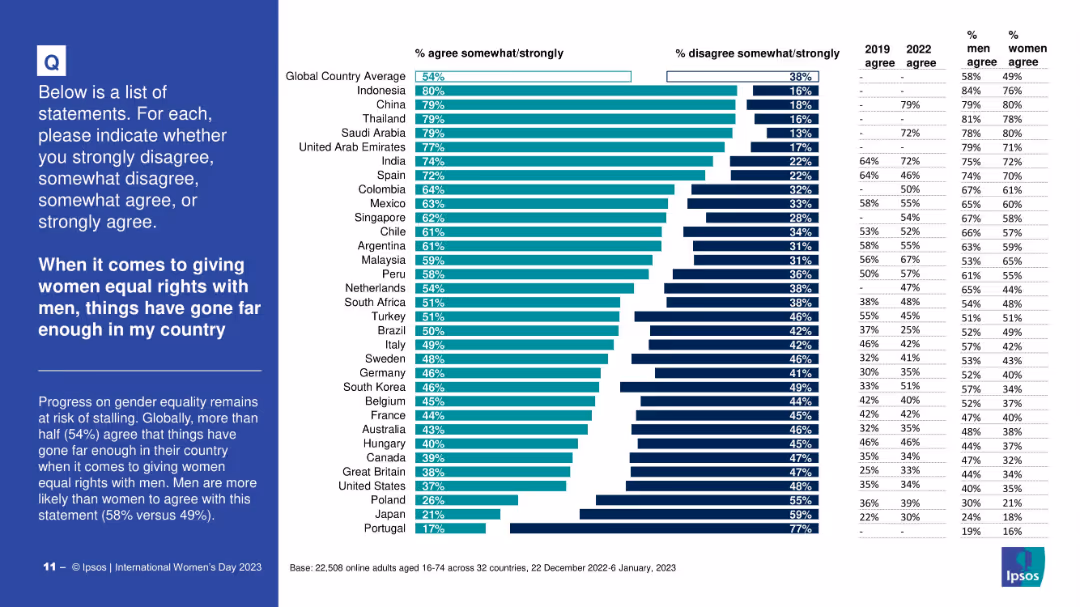
Country bar chart showing agreement levels; includes gender splits and comparison to previous years.
Human Resources and Talent Management
Government & Public Sector
Highlights where public opinion sees the gender equality debate as complete or excessive, indicating a plateau or pushback in perceived progress.
gender rights, equality plateau, public opinion, country comparison, male vs female views, Ipsos
false
Human Resources and Talent Management
Government & Public Sector
Mixed Chart
IPSOS
Add to my slides
Remove from favorites
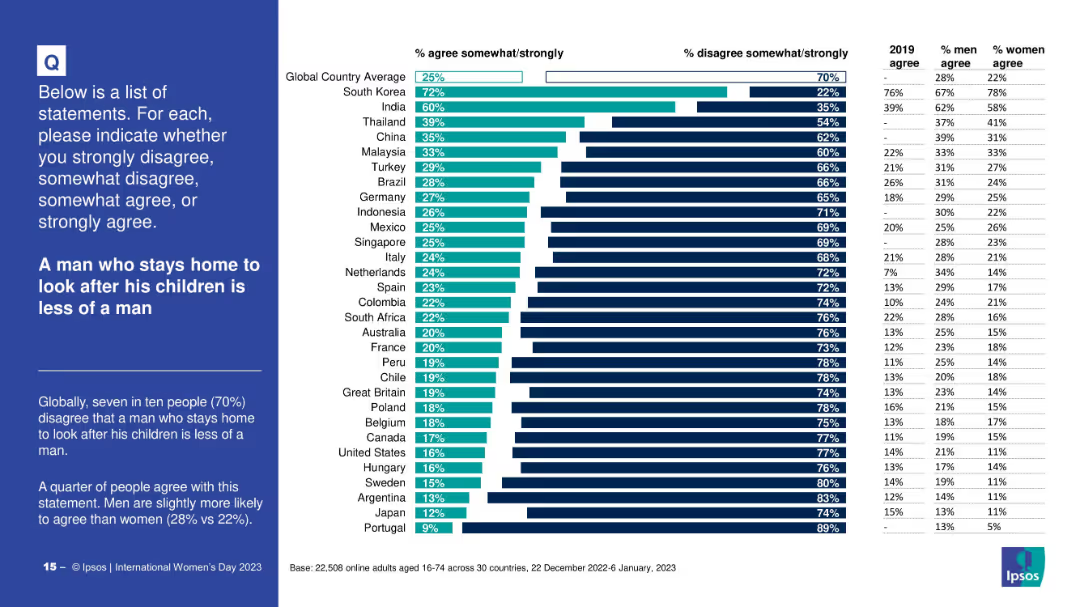
Horizontal bar chart with country-wise agreement/disagreement; includes 2019 data and gender breakdown; bold title on the left
Market Analysis and Trends
Professional Services
The slide assesses societal attitudes toward stay-at-home fathers. Most people globally disagree with the notion that caregiving reduces masculinity, though a significant minority agrees. The slide breaks down data by country and gender.
gender roles, masculinity, caregiving, parenting, perception, survey, cultural differences, Ipsos
false
Market Analysis and Trends
Professional Services
Mixed Chart
IPSOS
Add to my slides
Remove from favorites
Contains three stacked bar charts comparing openness about gender and sexual orientation in the workplace.
Human Resources and Talent Management
Professional Services
Discusses visibility and openness about gender and sexual orientation at work, offering insights into workplace diversity challenges.
gender, sexual orientation, workplace, diversity, inclusion
false
Human Resources and Talent Management
Professional Services
Multiple Chart
BCG
Add to my slides
Remove from favorites
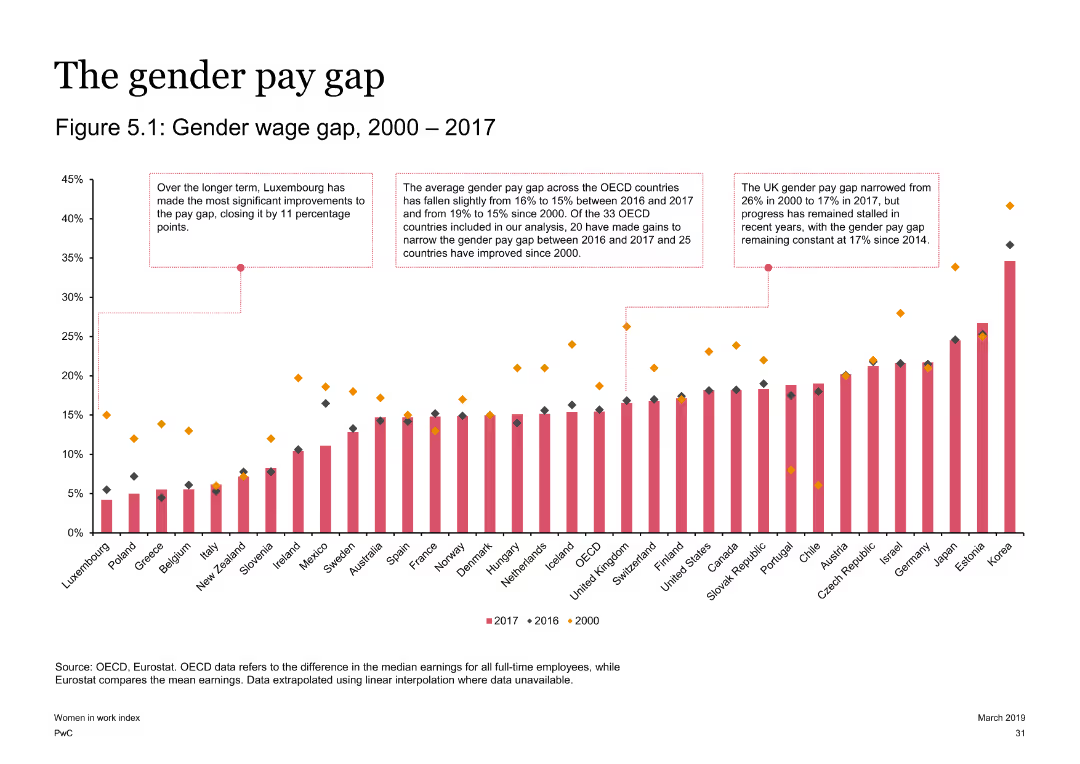
Features a column chart showing gender wage gaps across OECD countries from 2000 to 2017. The slide includes annotations highlighting key points and trends. The slide is visually engaging with detailed data.
Market Analysis and Trends
Government & Public Sector
Analyzes the gender wage gap trends across OECD countries, highlighting improvements in Luxembourg and the overall reduction in the gap since 2000. The slide provides a clear visual representation of the data over time.
gender wage gap, OECD, wage trends, Luxembourg, data analysis
false
Market Analysis and Trends
Government & Public Sector
Single Chart
PwC/Strategy&
Add to my slides
Remove from favorites
Two-column layout comparing somatic and germline gene editing, detailing the processes, risks, next generation impact, and consensus for each.
Technology and Digital Transformation
Healthcare & Pharmaceuticals
The slide compares somatic and germline gene editing, outlining the potential benefits, risks, and ethical considerations associated with each. It highlights the significant promises and ongoing research in the field of genetic editing, particularly focusing on the CRISPR technology.
Gene Editing, CRISPR, Somatic, Germline
false
Technology and Digital Transformation
Healthcare & Pharmaceuticals
Table
Roland Berger
Add to my slides
Remove from favorites
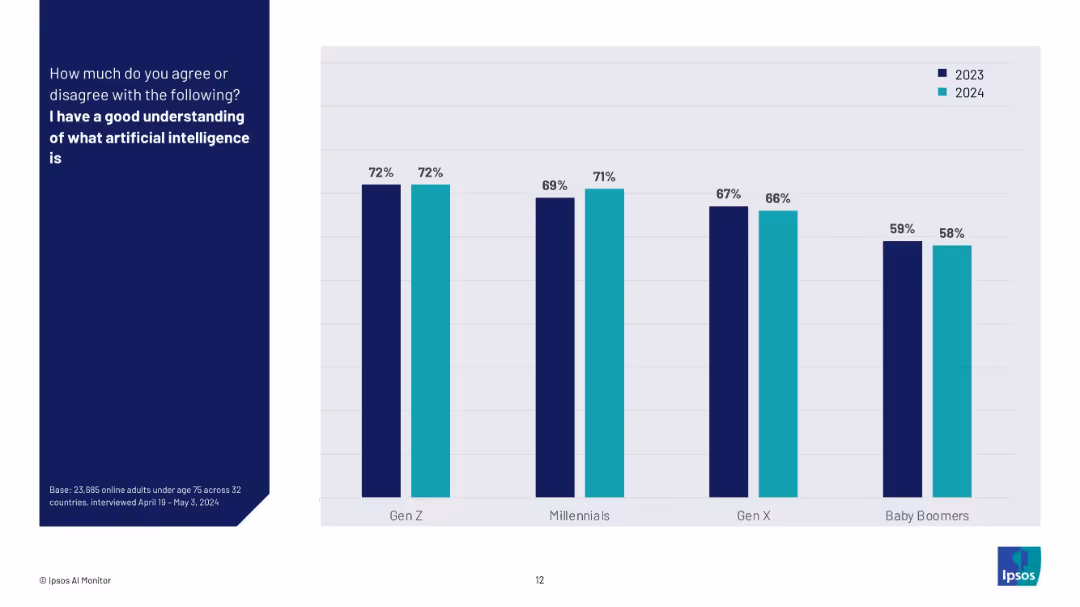
Bar chart comparing generational responses to "I have a good understanding of AI" between 2023 and 2024.
Technology and Digital Transformation
Artificial Intelligence
This slide highlights generational perspectives (Gen Z, Millennials, Gen X, Baby Boomers) on their understanding of AI over two years. It shows consistently higher confidence among younger generations and little change year over year.
generational AI knowledge, AI understanding, trend comparison, Gen Z, Millennials, Baby Boomers, Ipsos, survey, confidence in AI
false
Technology and Digital Transformation
Artificial Intelligence
Mixed Chart
IPSOS
Add to my slides
Remove from favorites
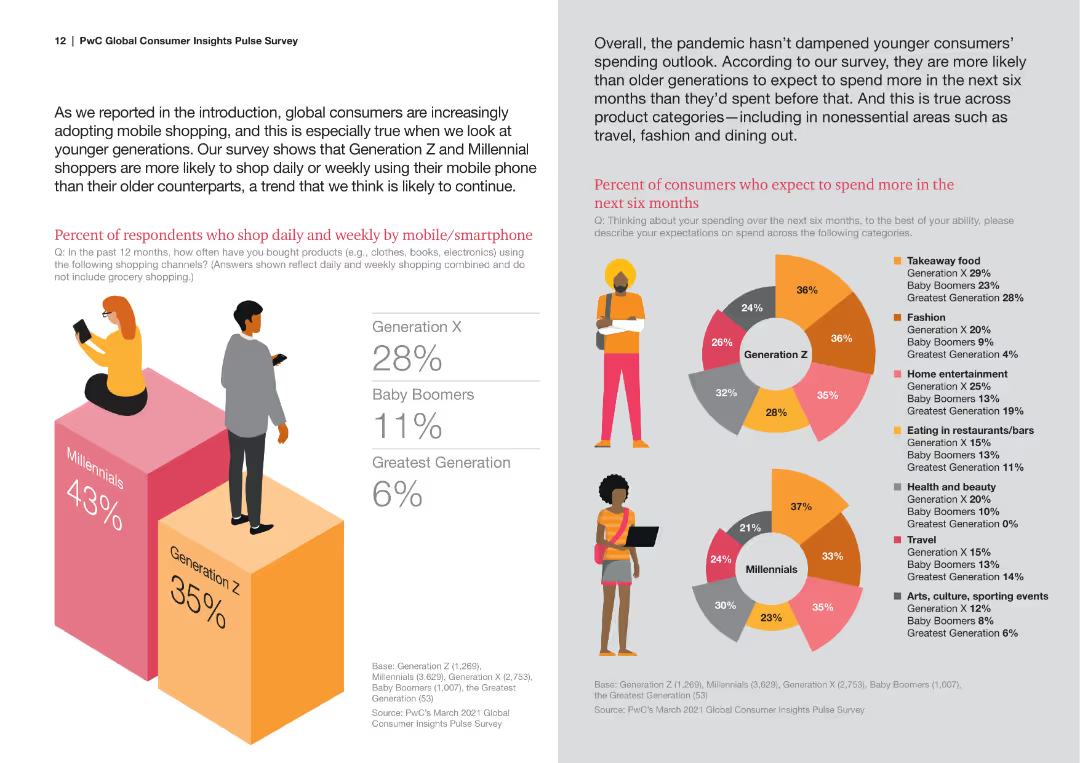
This slide contains text blocks, a large percentage bar chart, and icons representing different generations. The layout is colorful with a clear division of sections.
Market Analysis and Trends
Retail & E-commerce
It provides insights into shopping habits of different generations, particularly focusing on mobile shopping and future spending expectations, segmented by generations.
Generational Analysis, Mobile Shopping, Spending Habits, Market Segmentation, Consumer Insights
false
Market Analysis and Trends
Retail & E-commerce
Multiple Chart
PwC/Strategy&
Add to my slides
Remove from favorites
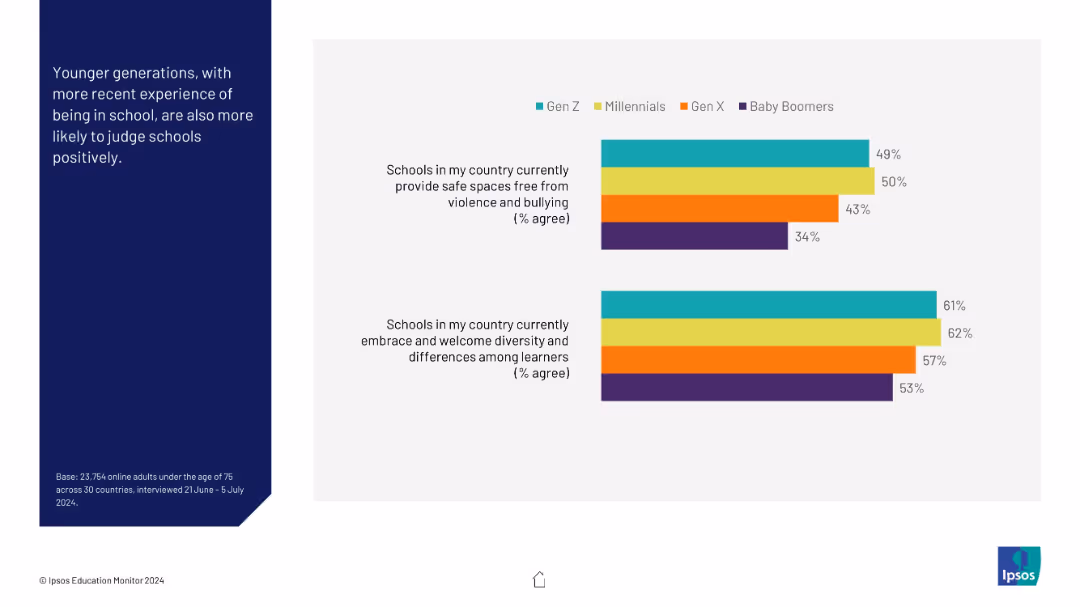
Two horizontal bar charts comparing Gen Z, Millennials, Gen X, and Boomers on school safety and diversity perceptions; color-coded by generation.
Market Analysis and Trends
Education & Training
This visual reveals generational differences in perceptions of school environments. Younger generations, especially Gen Z and Millennials, rate schools more positively than Gen X and Baby Boomers.
generational analysis, schools, diversity, education, safety, perceptions, Gen Z, Millennials, comparison
false
Market Analysis and Trends
Education & Training
Mixed Chart
IPSOS
Add to my slides
Remove from favorites
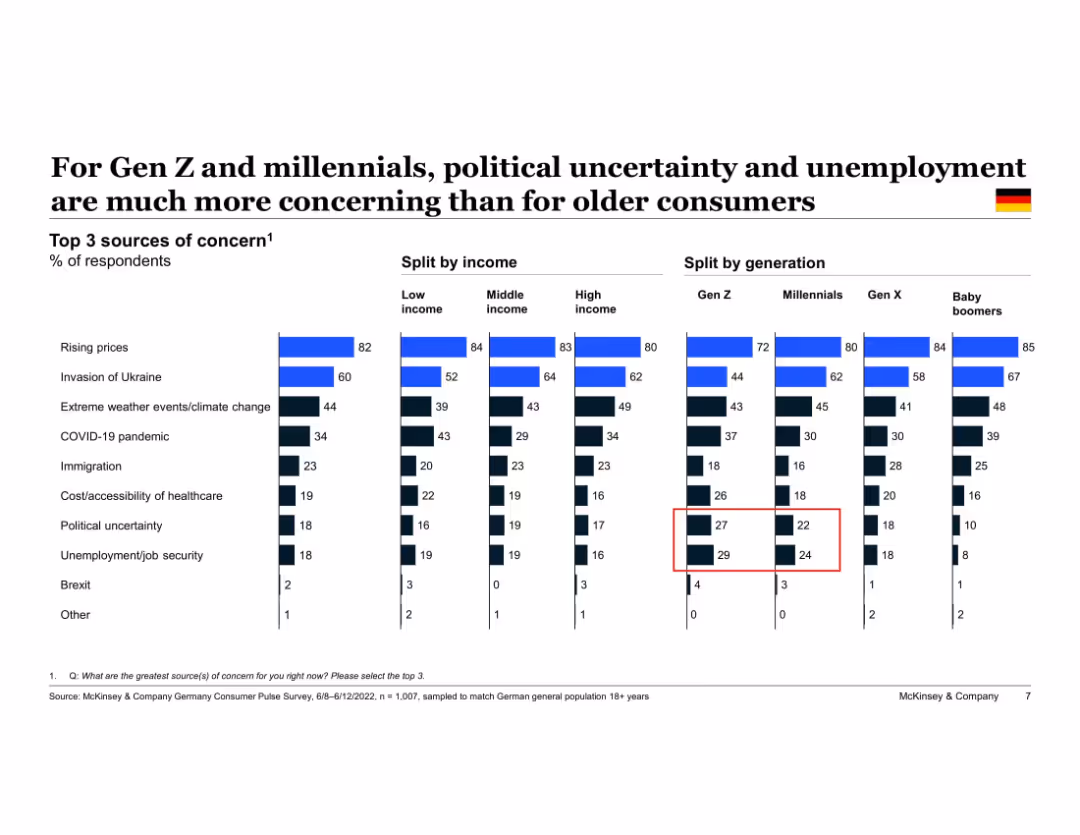
Vertical bar charts segmented by income and generation. Red boxes highlight key data points. Dark-themed with blue accent colors.
Customer and Market Segmentation
Consumer Goods
The slide highlights generational and income-level differences in consumer concerns. Gen Z and millennials show higher concern for political uncertainty and unemployment, while older generations focus more on inflation and geopolitical risks.
generational analysis, unemployment, political uncertainty, inflation, consumer segmentation, income levels, youth perspectives
false
Customer and Market Segmentation
Consumer Goods
Single Chart
McKinsey
Add to my slides
Remove from favorites
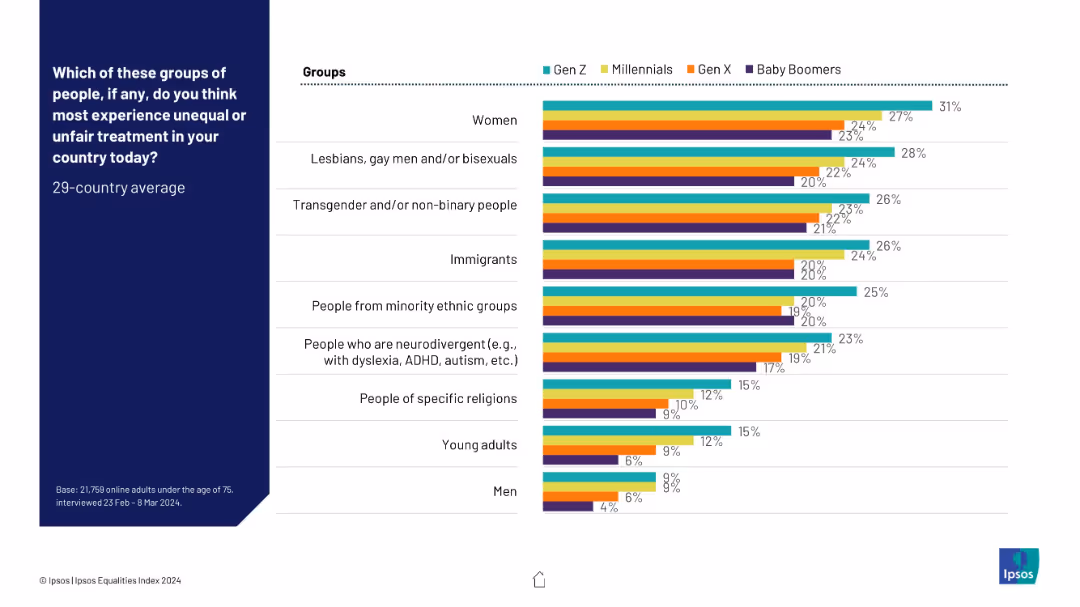
Multi-colored bar chart comparing generational views (Gen Z, Millennials, Gen X, Boomers); horizontal alignment by group type.
Risk Assessment and Management
Government & Public Sector
Generational views on who suffers the most inequality are compared here. Gen Z consistently rates higher concern for several minority groups, while Baby Boomers rate them lower across the board.
generational attitudes, inequality perception, discrimination awareness, Ipsos, group disparities
false
Risk Assessment and Management
Government & Public Sector
Mixed Chart
IPSOS
Add to my slides
Remove from favorites
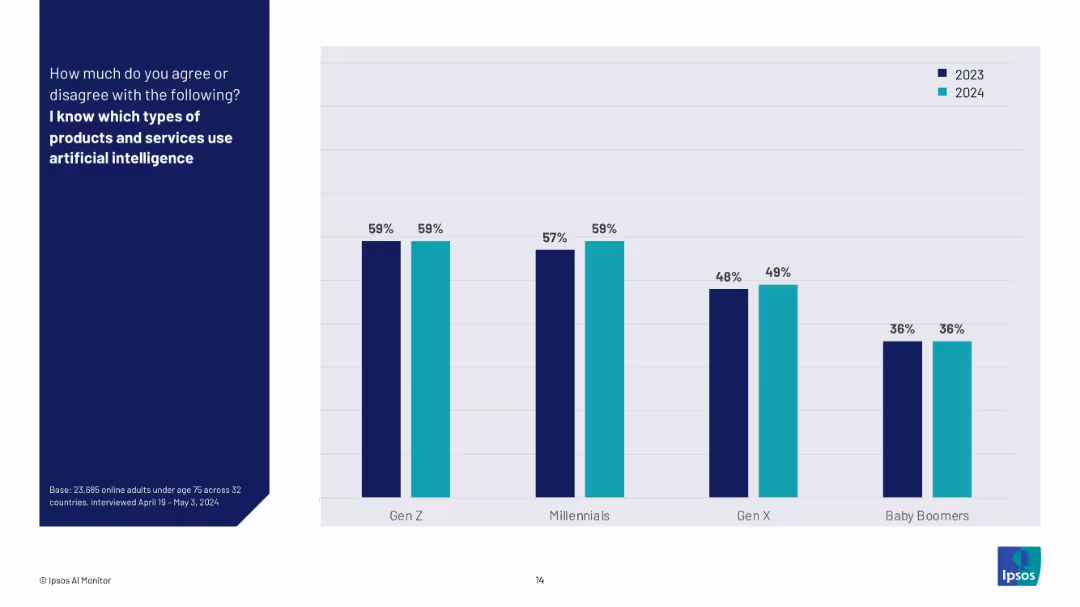
Vertical bar chart showing generational comparison on knowledge of AI-enabled products (2023 vs 2024).
Technology and Digital Transformation
Artificial Intelligence
This slide compares generational awareness of AI-enabled products between 2023 and 2024. Gen Z and Millennials consistently report the highest levels of awareness, while Baby Boomers show the lowest and most stagnant understanding.
generational awareness, AI products, survey results, year comparison, Gen Z, Millennials, Ipsos, AI understanding, tech knowledge
false
Technology and Digital Transformation
Artificial Intelligence
Mixed Chart
IPSOS
Add to my slides
Remove from favorites
Table displaying generational comparison of reasons for switching retailers; color-coded differences from average and German flag included
Customer and Market Segmentation
Retail & E-commerce
This slide breaks down the generational drivers for switching grocery retailers in Germany. All generations cite price and value as key drivers. Baby boomers prioritize accessibility and promotions, while Gen Z is more influenced by values and ethical stances. The Ukraine conflict was least influential across all groups.
generational comparison, price sensitivity, retailer switching, value for money, promotions, Gen Z, baby boomers, Germany
false
Customer and Market Segmentation
Retail & E-commerce
Multiple Chart
McKinsey
Add to my slides
Remove from favorites
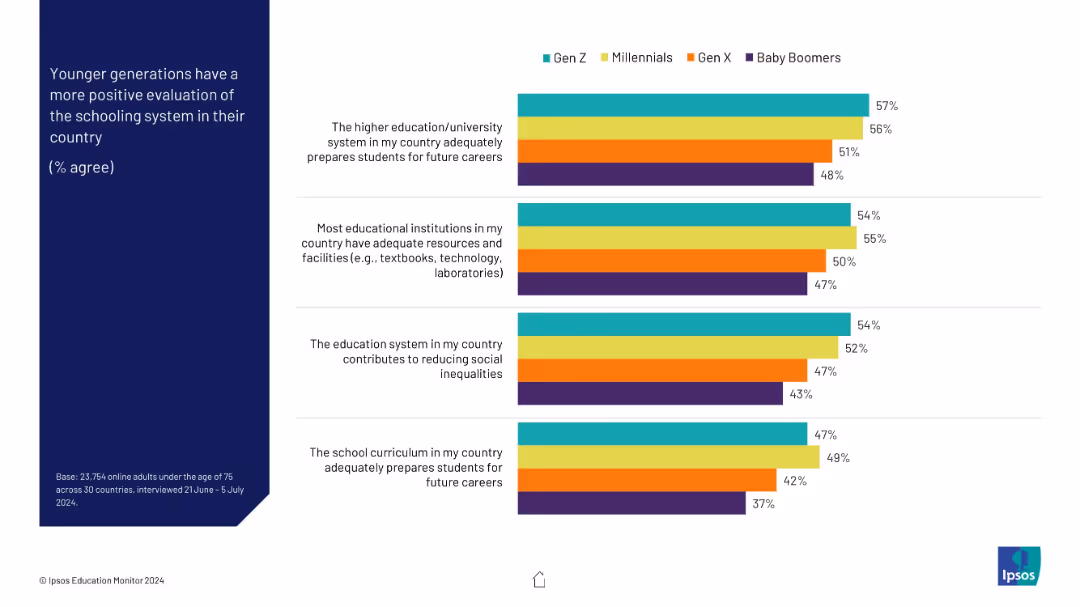
Four grouped bar charts by generation (Gen Z to Boomers), each with color-coded bars for agreement on schooling quality. Layout is clean and segmented by row.
Customer and Market Segmentation
Education & Training
The slide shows generational differences in agreement with positive statements about their country's education system. Younger generations (Gen Z, Millennials) express higher levels of satisfaction than older ones (Gen X, Boomers), especially on career preparation and infrastructure.
generational comparison, youth perception, schooling evaluation, Gen Z, education quality, survey
false
Customer and Market Segmentation
Education & Training
Mixed Chart
IPSOS
Add to my slides
Remove from favorites
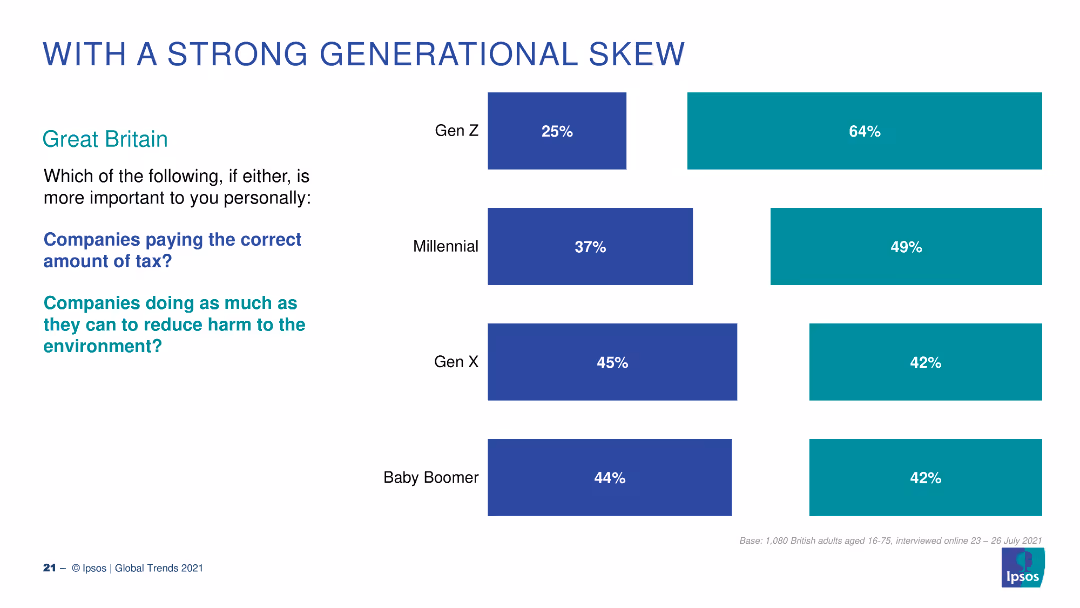
This slide features horizontal bar charts showing generational preferences for companies' responsibilities regarding tax payments versus reducing environmental harm. The charts are color-coded to distinguish between generations.
Market Analysis and Trends
Professional Services
The slide highlights generational differences in prioritizing corporate responsibilities, with Gen Z and Millennials more likely to value environmental actions over tax payments. This can be used for market segmentation, understanding generational values, and informing corporate social responsibility strategies.
generational differences, corporate responsibility, environmental actions, tax payments, public opinion
false
Market Analysis and Trends
Professional Services
Multiple Chart
IPSOS
Add to my slides
Remove from favorites
This slide contains pie charts and a table comparing goals and views between Gen Y & Z and Boomer/Silent generations regarding their financial expectations and preferences. The layout is organized to highlight generational differences in financial priorities.
Market Analysis and Trends
Financial Services
Discusses differing financial priorities and expectations between younger and older generations, highlighting the need for tailored financial services to engage these distinct groups effectively.
generational differences, financial services, investment priorities, Gen Y, Baby Boomers
false
Market Analysis and Trends
Financial Services
Mixed Chart
Deloitte
Add to my slides
Remove from favorites
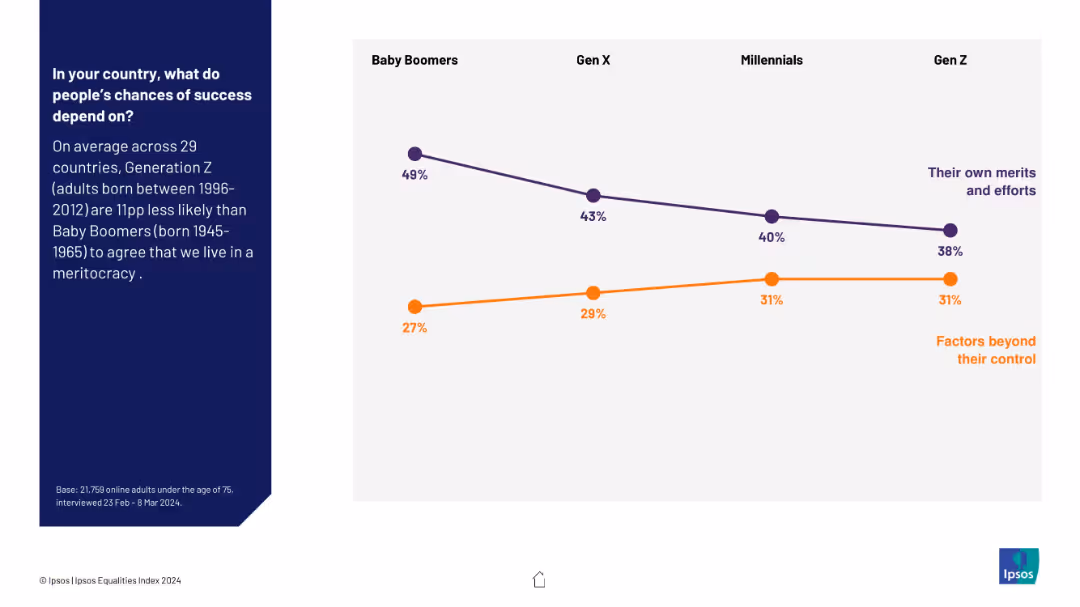
Line chart showing generational comparison (Boomers to Gen Z) regarding belief in merit-based success vs external factors
Market Analysis and Trends
Education & Training
The slide shows declining belief in meritocracy across generations, with Gen Z least likely to think success is based on individual merit. This reveals a shifting perspective on societal fairness over time.
generational differences, meritocracy, public perception, social belief, generational attitudes, societal structure, Ipsos
false
Market Analysis and Trends
Education & Training
Mixed Chart
IPSOS
Add to my slides
Remove from favorites
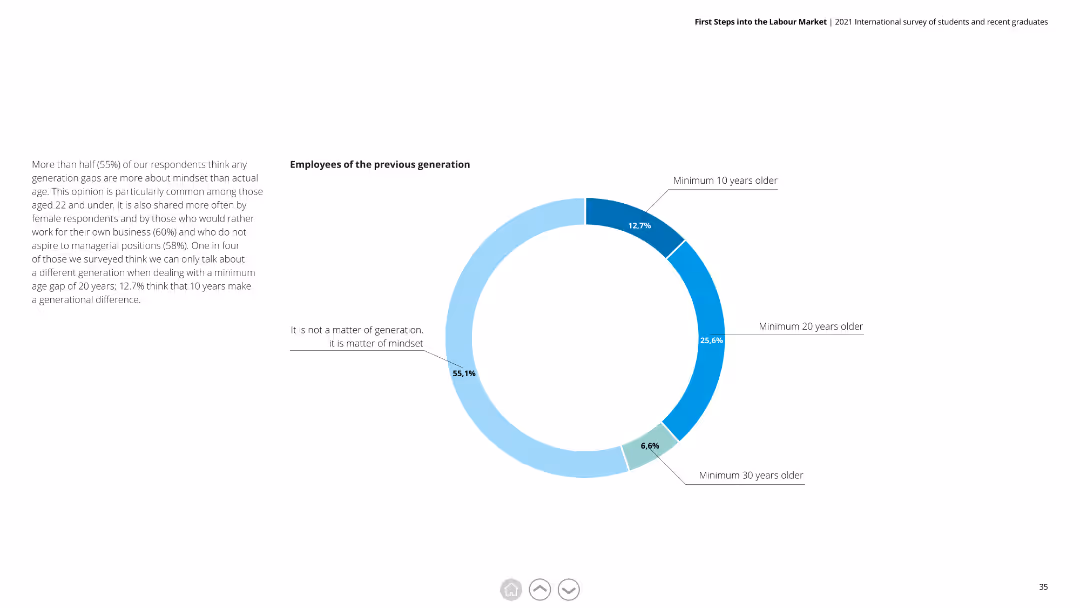
Donut chart showing opinions on generational differences among employees, with detailed text discussing the impact of mindset over age.
Human Resources and Talent Management
Education & Training
This slide examines views on generational differences in the workplace, noting that mindset is seen as more important than age, especially among younger employees.
generational differences, mindset, workplace diversity, age gap, young employees
false
Human Resources and Talent Management
Education & Training
Mixed Chart
Deloitte
Add to my slides
Remove from favorites
Contains a column chart segmented by generations, shown in grayscale and green, discussing resale considerations when buying luxury items.
Market Analysis and Trends
Retail & E-commerce
Evaluates generational differences in considering resale value when purchasing luxury goods, suggesting a trend towards sustainability in buying.
generational differences, resale value, luxury goods, sustainability, buying behavior
false
Market Analysis and Trends
Retail & E-commerce
Multiple Chart
BCG
Add to my slides
Remove from favorites
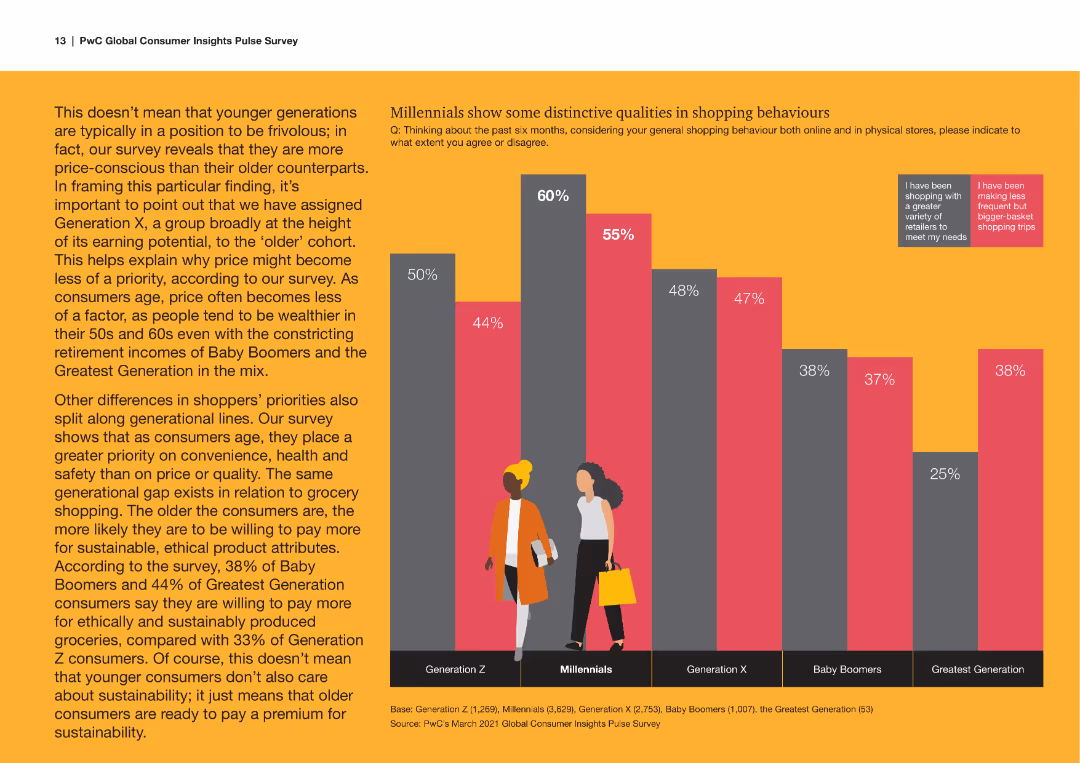
The slide uses a bright yellow background with large text blocks and a column chart comparing generations. Simple illustrations of people are included for visual appeal.
Market Analysis and Trends
Consumer Goods
This slide highlights the shopping priorities of different generations, showing how Millennials and Generation Z prioritize convenience, health, and eco-friendly products.
Generational Differences, Shopping Behavior, Consumer Priorities, Sustainability, Health
false
Market Analysis and Trends
Consumer Goods
Mixed Chart
PwC/Strategy&
Add to my slides
Remove from favorites
This slide continues with the theme of empowerment and skills, presenting bar charts that compare responses about job impact and training concerns between different generations, specifically Gen Z and Baby Boomers.
Market Analysis and Trends
Education & Training
This slide provides insight into generational differences concerning job security and the impact of technology. It highlights concerns among younger workers about their roles being replaced by technology and their worries about not receiving adequate training.
generational differences, technology impact, training concerns, job security
false
Market Analysis and Trends
Education & Training
Multiple Chart
PwC/Strategy&
Add to my slides
Remove from favorites
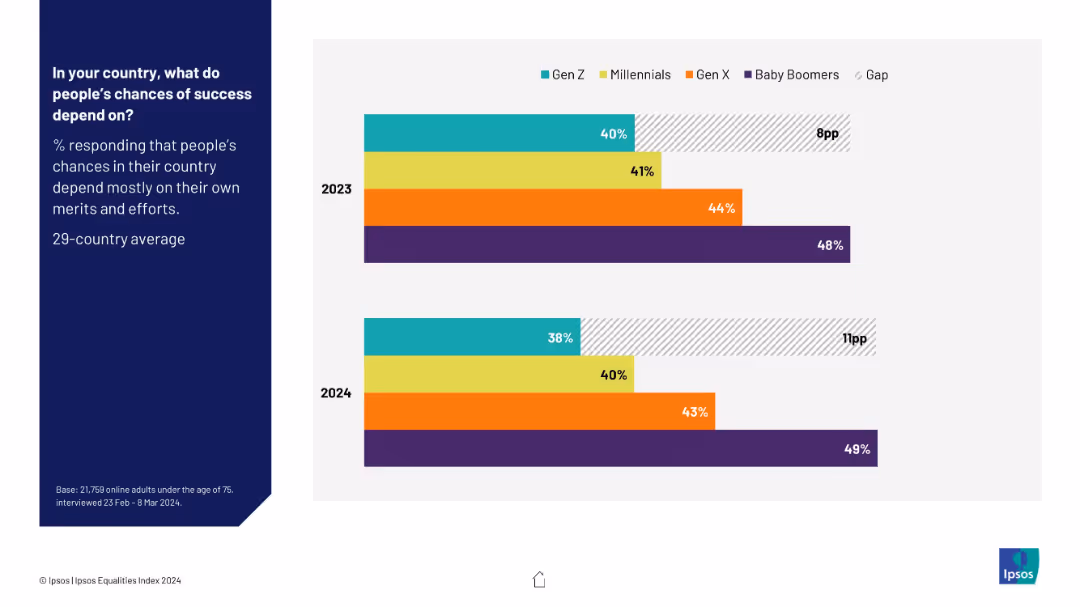
Horizontal bar chart split by generation, comparing belief in success via merit (2023 vs 2024)
Market Analysis and Trends
Education & Training
The slide tracks year-over-year trends in generational belief in meritocracy. Gen Z's agreement dropped from 40% to 38%, widening the gap with Baby Boomers. It visualizes shifts in trust in fairness across age groups.
generational gap, merit-based success, 2023 vs 2024, social belief, public opinion, Ipsos, youth perception
false
Market Analysis and Trends
Education & Training
Mixed Chart
IPSOS
Add to my slides
Remove from favorites
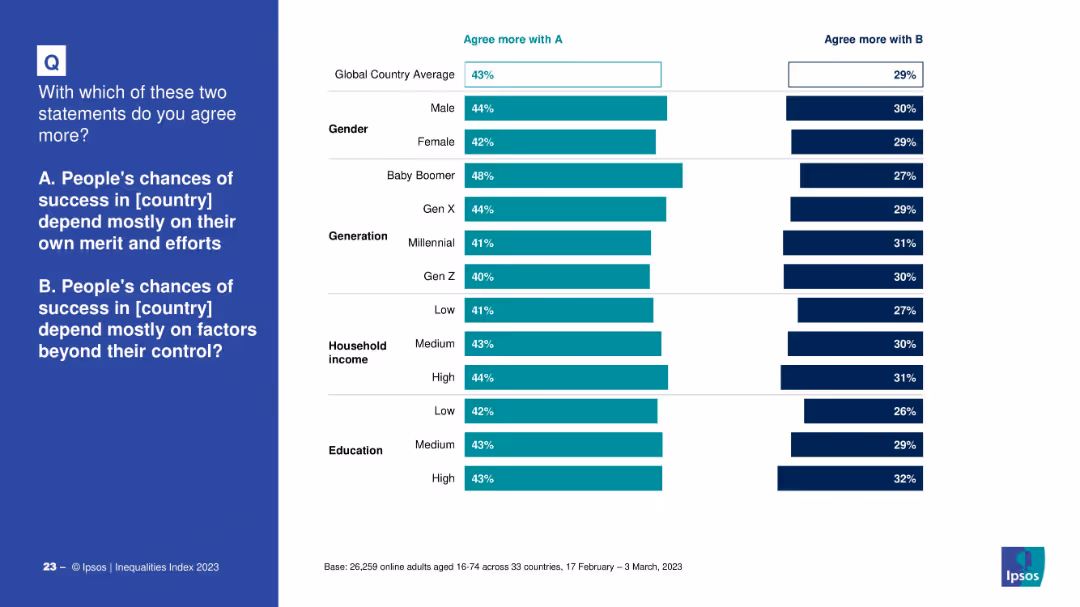
Vertical bar comparison by gender, generation, income, and education. Contrasts agreement with "success depends on own effort" vs. "depends on external factors." Uses a similar color scheme and format to Slide 19768.
Market Analysis and Trends
Government & Public Sector
This slide breaks down belief in meritocracy across demographic lines. Older generations and higher-income/educated individuals are more likely to believe success is based on effort, while younger generations and lower-income groups are more divided.
generational gap, success, meritocracy, demographics, education, income, Ipsos, social mobility
false
Market Analysis and Trends
Government & Public Sector
Mixed Chart
IPSOS
Add to my slides
Remove from favorites
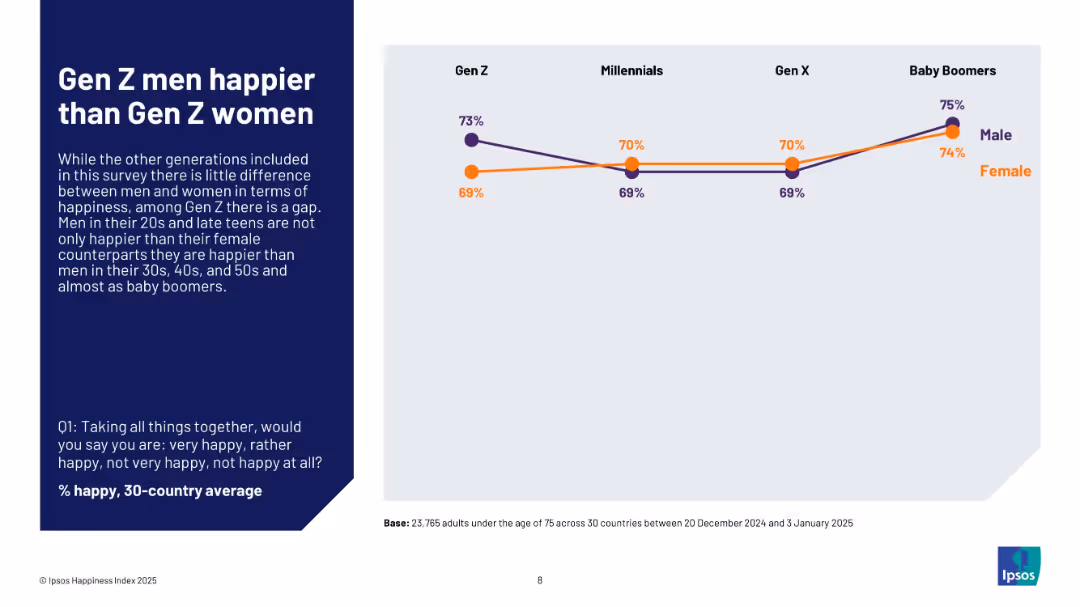
Line chart comparing happiness levels of men and women across generational cohorts; simple design with male/female legend and dark blue text box.
Customer and Market Segmentation
Professional Services
The slide explores generational and gender-based happiness differences. It reveals that Gen Z men are notably happier than Gen Z women, a disparity not observed in other generations. Baby Boomers show similar levels of happiness between genders, with Gen Z males ranking highest in happiness across all groups.
generational happiness, gender gap, Gen Z, Baby Boomers, emotional well-being, Ipsos, male vs female, survey
false
Customer and Market Segmentation
Professional Services
Mixed Chart
IPSOS
Add to my slides
Remove from favorites
The slide shows bar charts comparing concerns of different generations about technology impacting their jobs and the adequacy of training provided by employers.
Market Analysis and Trends
Professional Services
Examines generational differences in perceptions of technology's impact on job security and training adequacy. It serves to inform HR strategies to address specific concerns and training needs across different age groups, promoting a more inclusive approach to technology adoption in the workplace.
generational impact, technology training, job security, HR strategies, workforce development
false
Market Analysis and Trends
Professional Services
Multiple Chart
PwC/Strategy&
Add to my slides
Remove from favorites
Slide contains stacked column charts detailing luxury market size by generation from 2019 to 2025F.
Market Analysis and Trends
Retail & E-commerce
Analyzes the generational shift in the luxury goods market, projecting significant growth driven by Gen Y and Gen Z from 2019 to 2025.
generational, luxury, market, 2025, growth
false
Market Analysis and Trends
Retail & E-commerce
Mixed Chart
Bain
Add to my slides
Remove from favorites
Two column charts depict the luxury goods market consumption by generation for 2017 and 2018, highlighting Gen Y and Gen Z's contributions.
Market Analysis and Trends
Retail & E-commerce
Focuses on the 2018 market growth driven by younger generations, emphasizing the shift in consumer demographics within the luxury sector.
generational marketing, consumer analysis, luxury goods, market growth, Gen Y, Gen Z
false
Market Analysis and Trends
Retail & E-commerce
Multiple Chart
Bain
Add to my slides
Remove from favorites
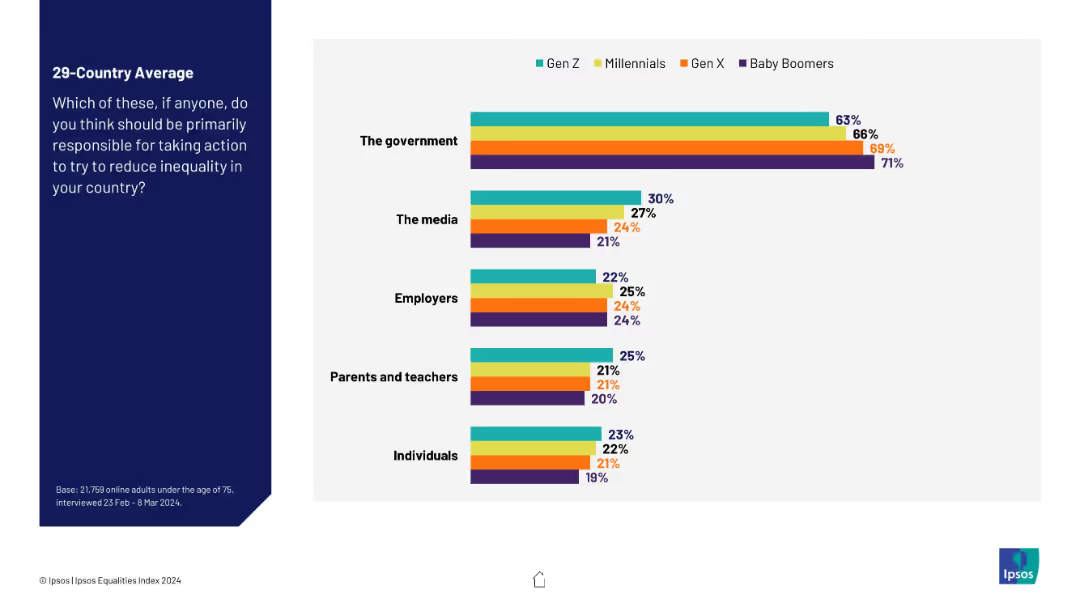
Bar chart showing perspectives by generation (Gen Z to Baby Boomers) on which entities should act. Five categories shown in grouped bars. Simple horizontal layout.
Strategic Planning
Government & Public Sector
This slide compares generational views on who should reduce inequality. While the government is seen as the primary actor across all age groups, support declines with younger respondents. Gen Z is more likely than older groups to assign responsibility to media and individuals.
generational opinion, inequality responsibility, policy, survey, Ipsos, media, government, activism
false
Strategic Planning
Government & Public Sector
Mixed Chart
IPSOS
Add to my slides
Remove from favorites
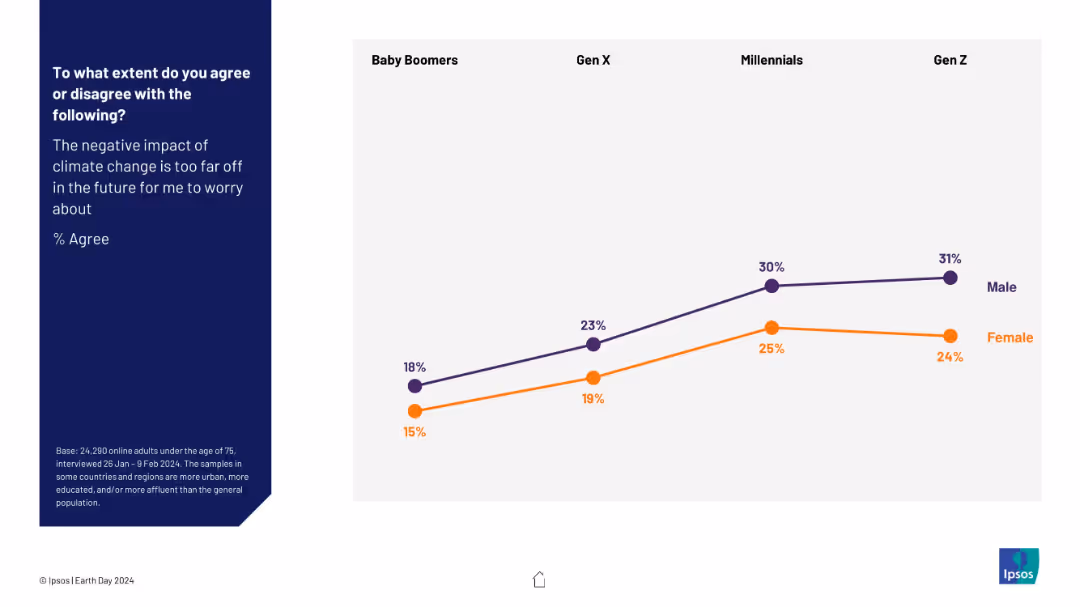
Line chart showing generational and gender breakdown of those who think climate change is a distant concern.
Risk Assessment and Management
Environmental Services & Sustainability
This visual highlights differences by age and gender in underestimating the immediacy of climate change. Gen Z males show highest levels of future deferral.
generational perception, climate delay, gender trends, urgency gap, Ipsos, Earth Day, belief systems
false
Risk Assessment and Management
Environmental Services & Sustainability
Mixed Chart
IPSOS
Add to my slides
Remove from favorites
Contains a line graph comparing generational spending, and a column chart showing the growth of new accounts. The visual elements are clearly labeled and contrasted by colors.
Market Analysis and Trends
Financial Services
Focuses on credit card spending across generations and acquisition growth. Useful in marketing strategy or generational market analysis discussions.
generational spending, market acquisition, credit cards, Millennials, Gen Z
false
Market Analysis and Trends
Financial Services
Multiple Chart
JP Morgan
Add to my slides
Remove from favorites
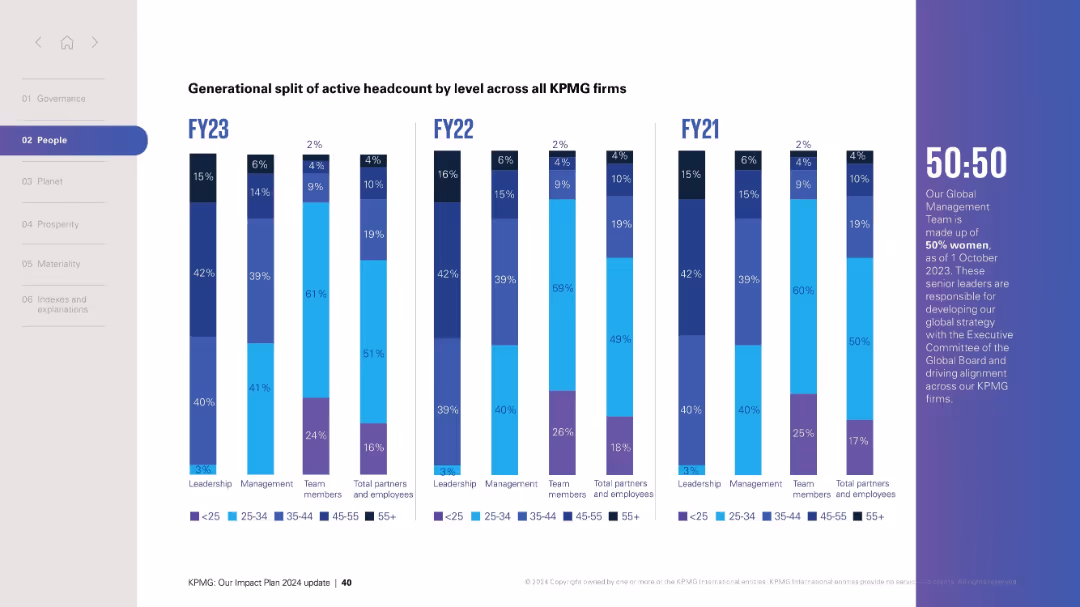
Vertical bar charts grouped by year (FY21–FY23) showing generational split by role. Right sidebar emphasizes 50:50 gender leadership.
Human Resources and Talent Management
Professional Services
Displays generational breakdown of workforce at KPMG over three fiscal years by leadership, management, and team roles, with emphasis on gender equity at leadership level.
generational split, age groups, workforce trends, gender parity, leadership
false
Human Resources and Talent Management
Professional Services
Mixed Chart
KPMG
Add to my slides
Remove from favorites
Line chart showing generational support trends, separated by gender, with a focus on Gen Z to Baby Boomers.
Regulatory and Compliance
Government & Public Sector
This slide shows generational differences in support for transgender athletes competing by gender identity. The data is segmented by gender and highlights increasing support among younger generations, especially among Gen Z females.
generational support, transgender athletes, Gen Z, gender identity, sports, gender split, LGBTQ+ survey, opinion by age
false
Regulatory and Compliance
Government & Public Sector
Mixed Chart
IPSOS
Add to my slides
Remove from favorites
Previous
Next
You don't have any favorites yet.
Please wait loading your favorites slides...
Create a FREE account to continue browsing
Receive Instant Access to 1,000+ slides from companies like McKinsey, Google, and Goldman Sachs
First Name
Last Name
Email
Password
I agree to all
Terms & Privacy Policy
Thank you! Your submission has been received!
Oops! Something went wrong while submitting the form.
Have an account?
Sign in
Upgrade to PRO to Save slides
Advanced Search and Filters
Access to 15,000+ slides
Access to Category Pages
Save/Bookmark Slides
PowerPoint Template Library
Pick a Plan
MONTHLY
$12/month
Billed every month, Cancel anytime.
YEARLY
$9/year
Billed $108 annually, Cancel anytime.
Checkout for $12/month
Checkout for $108/yr
Secured by Stripe | AES-256 bit encryption


![[No explicit title — inferred: KPMG Global Headcount and Gender Breakdown]](https://cdn.prod.website-files.com/654e70fb59937215cac87b19/6899a5cafd39817aca95be63_IHeY0-Za7zddaCnBSsa2T5PNexwmr9BwHpIsN_eug5M.avif)