My Account
My Slides
Search by Category
Templates
Leave Feedback
Login
Logout
Get Started
Browse all Slides
Browse all Slides
Create a FREE Account
Instant access to 1,000+ real slides from top companies like McKinsey, BCG, Goldman Sachs, Google and many more!
First Name
Last Name
Email
Password
I agree to all
Terms & Privacy Policy
Thank you! Your submission has been received!
Oops! Something went wrong while submitting the form.
Have an account?
Sign in
Saved Slides
Three pie charts with color-coded segments for geographic loan distribution and loan composition in ICG, PBWM, and Legacy Franchises sectors, with column charts below detailing components.
Financial Performance
Financial Services
Compares credit portfolios across regions and business segments, illustrating geographical distribution and loan type composition, showing the global reach and diversity in financial services.
Credit Portfolio, Geographic Distribution, Loan Composition, ICG, PBWM, Legacy Franchises, Financial Services, Comparative Analysis, Global Reach
Multiple Chart
Citigroup
Saved
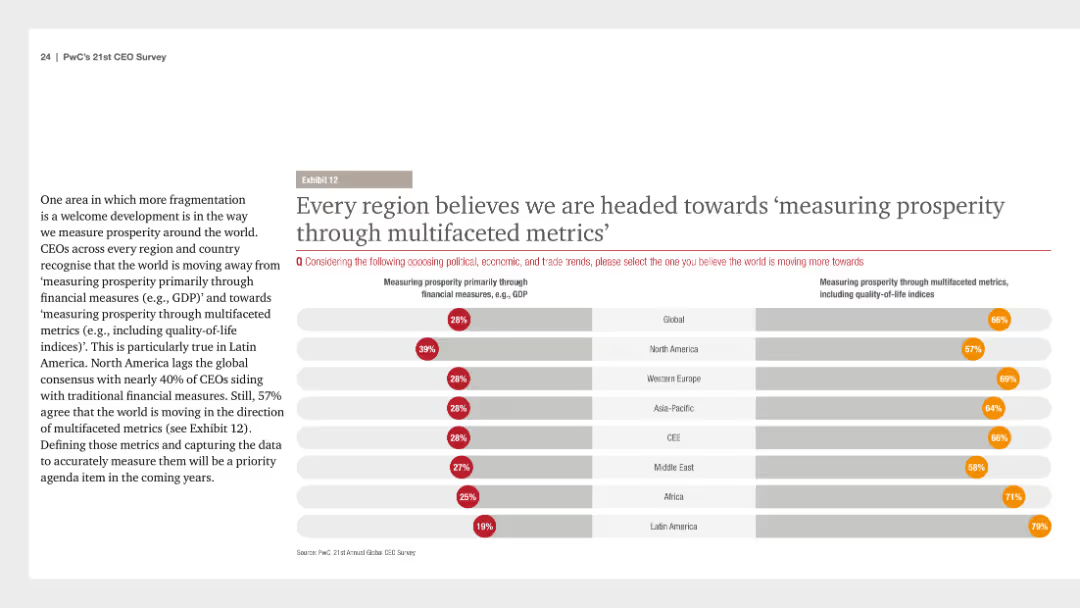
A column chart depicting regional perspectives on measuring prosperity through multifaceted metrics versus financial measures. Text provides context about global CEO opinions.
Market Analysis and Trends
Financial Services
CEOs across regions believe that measuring prosperity is moving towards multifaceted metrics including quality-of-life indices. The chart shows the percentage split between traditional financial measures and multifaceted metrics.
prosperity, metrics, CEOs, financial, regional
Multiple Chart
PwC/Strategy&
Saved
Depicts a stacked column chart showing international arrivals by destination with Europe highlighted against the rest of the world.
Market Analysis and Trends
Hospitality & Tourism
Highlights Europe's dominant position in global tourism, showing the distribution of international arrivals with specific emphasis on top European destinations.
Tourism, Europe, Global arrivals, Market analysis, Travel industry
Multiple Chart
Bain
Saved
The slide features bar graphs depicting e-commerce, online travel, transport & food, and online media sectors. Use of blue shades, minimalistic design.
Market Analysis and Trends
Technology & Software
This slide illustrates the growth in various sectors of Singapore’s economy post-2020, highlighting a healthy surge with future projections.
Growth, Sectors, Singapore, Projections, eCommerce, Travel, Food, Media, 2025, Recovery
Multiple Chart
Bain
Saved
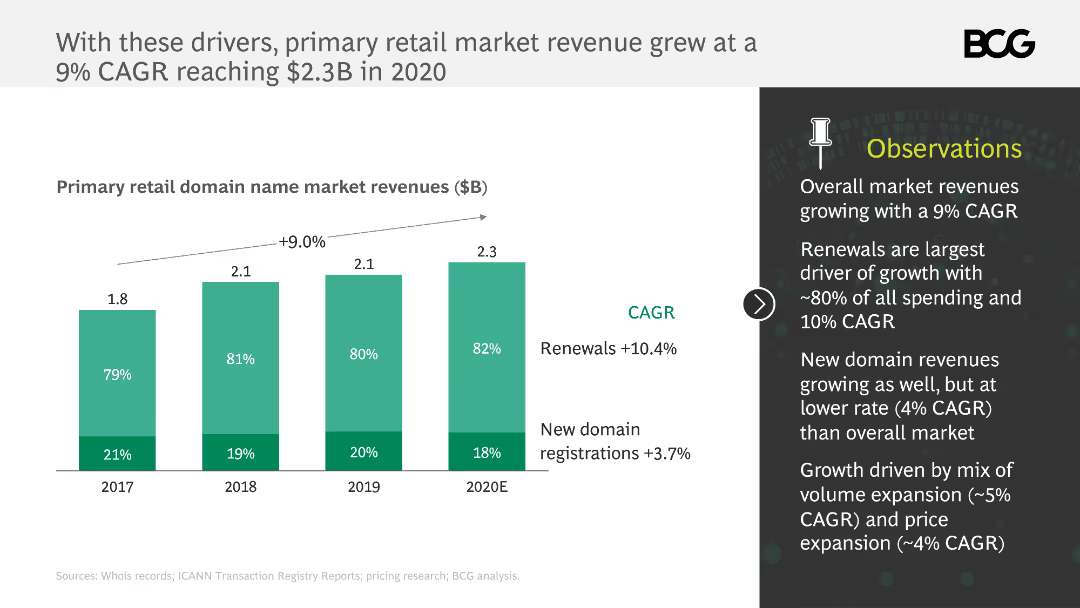
The slide contains a column chart depicting primary retail domain name market revenues from 2017 to 2020E, with a trend line showing a 9% CAGR. Observations are listed on the right.
Market Analysis and Trends
Retail & E-commerce
The slide highlights the growth in the primary retail market revenue, driven by renewals and new domain registrations. It explains the contribution of each factor to the overall market.
CAGR, domain, retail, revenue, renewals, growth, market
Mixed Chart
BCG
Saved
Detailed roadmap timeline outlining key milestones from Q4 2020 to the end of 2021 for vaccine distribution under various scenarios.
Regulatory and Compliance
Healthcare & Pharmaceuticals
Analyzes the projected timeline for widespread COVID-19 vaccine distribution in the U.S., including pre-conditions and milestones.
distribution, vaccine, timeline, COVID-19
Mixed Chart
BCG
Saved
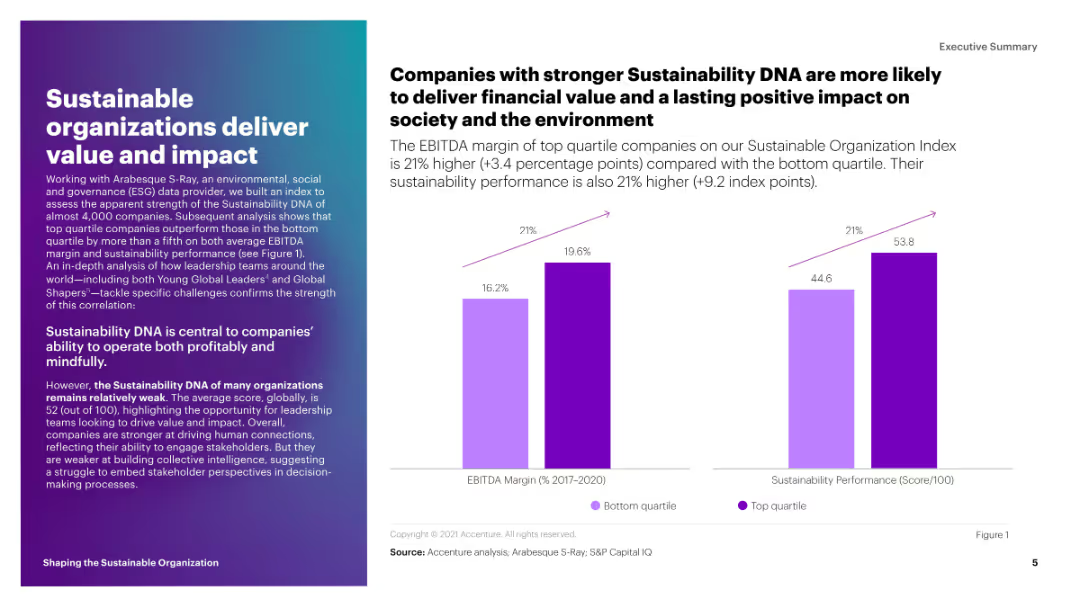
This slide includes a column chart comparing the EBITDA margin and sustainability performance score of top quartile companies to those in the bottom quartile. The bars are in shades of purple.
Strategic Planning
Environmental Services & Sustainability
The slide shows that companies with stronger sustainability DNA have higher EBITDA margins and sustainability performance scores. It emphasizes the financial and societal benefits of sustainability.
sustainability, EBITDA, performance, impact, top quartile
Mixed Chart
Accenture
Saved
This slide visually separates Macquarie's business activities into annuity-style and markets-facing activities, each with its net profit contribution. The information is presented using colored sections, clear text hierarchy, and minimal icons. The design is clean, focused, and easy to follow.
Financial Performance
Financial Services
The slide offers an overview of Macquarie's business divisions and their contributions to net profit, illustrating the company's diversified revenue streams. It can be used to convey Macquarie’s business model and profitability across various sectors, crucial for investor and stakeholder presentations.
Macquarie, business overview, net profit contribution, annuity-style activities, markets-facing activities, revenue streams, financial services
Multiple Chart
Morgan Stanley
Saved
This slide presents column charts on Singapore's digital economy, segmented into e-commerce, travel, food, and online media. Key metrics are annotated, and the layout is similar to slide 1812 but with a different color theme.
Market Analysis and Trends
Technology & Software
The slide predicts Singapore's digital economy growth by 2025, with travel and e-commerce being significant sectors. It's suitable for stakeholders in the digital economy to understand market trajectories and plan for future investments.
Digital Economy, E-commerce, Travel, Growth, Forecast, Singapore, Column Chart
Multiple Chart
Bain
Saved
Contains graphical data on smartphone prices and data tariffs, employing color contrasts and icons for a clear representation.
Market Analysis and Trends
Retail & E-commerce
This slide presents the driving forces behind the growth in digital consumption, including price drops and tariff reductions. Crucial for market strategy planning.
Smartphone Prices, Data Tariffs, Market Forces, India, Digital Growth, Technology Trends, Price Analysis, Economic Factors
Multiple Chart
BCG
Saved
A timeline chart tracking market trends from 1985 to 2025, using graphical representations of pyramids to depict segments like "Aspirational" and "Accessible".
Market Analysis and Trends
Consumer Goods
Analyzes the diminishing relevance of traditional market segmentation in the luxury goods industry over time, highlighting major shifts and consumer growth metrics.
Market Trends, Luxury, Segments
Single Chart
Bain
Saved
Column chart comparing economic expectations of study respondents for 2018 and 2019, with categories for upturn, boom, downturn, and recession.
Market Analysis and Trends
Financial Services
The slide analyzes the shifting economic expectations of participants in the 10th Operations Efficiency Radar, comparing sentiments from 2018 and 2019. It highlights the growing anticipation of an economic downturn among respondents, reflecting changes in business confidence and economic outlook.
Economic Expectations, Operations Efficiency, Downturn
Mixed Chart
Roland Berger
Saved
Bar chart showing various savings goals among Canadians pre-COVID-19. Bars indicate the percentage of respondents with 'Yes', 'No', and 'Not applicable' responses for each savings goal. Dense text at the top explains the context.
Market Analysis and Trends
Financial Services
The slide presents data on the savings goals of Canadian investors before COVID-19, highlighting the percentage contributing to goals such as retirement, travel, and education. It notes gender differences and the high proportion of younger investors saving for these goals.
Savings, Goals, Canadians, Retirement, Travel, Education
Mixed Chart
IPSOS
Saved
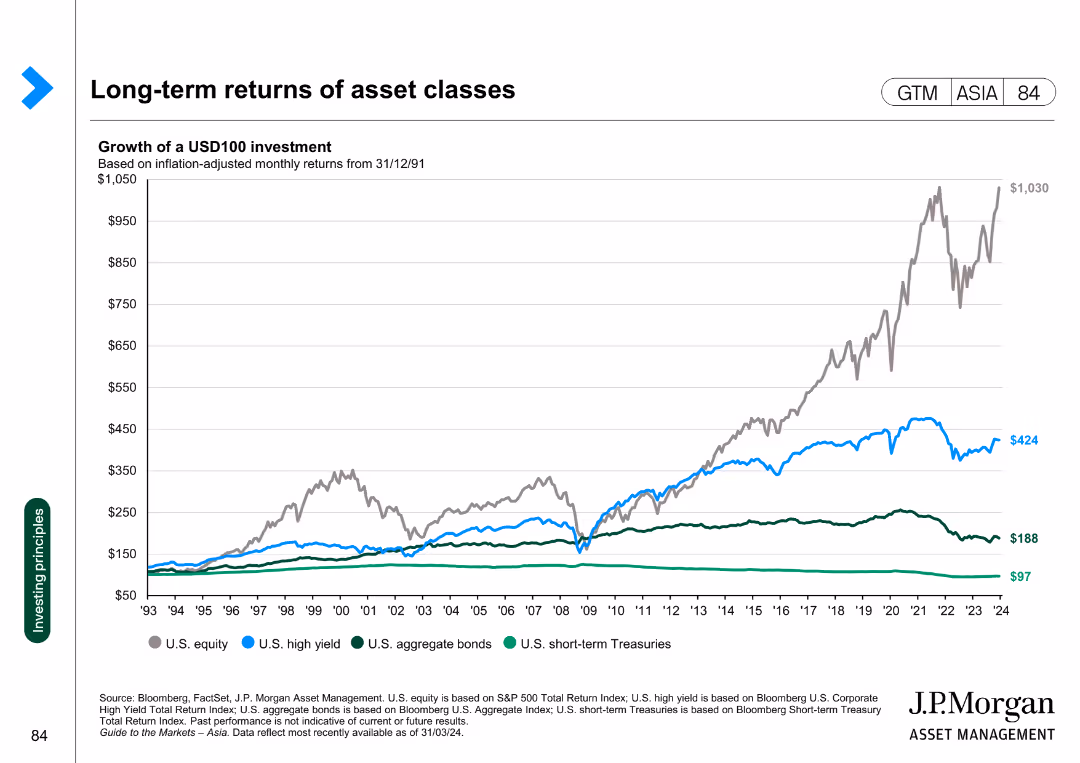
Line chart showing the growth of a USD100 investment in various asset classes, adjusted for inflation, from 1993 to 2024.
Investment Analysis
Financial Services
This slide presents the long-term returns of different asset classes, illustrating the growth of a USD100 investment over time across various asset categories.
asset classes, returns, investment, inflation, growth
Single Chart
JP Morgan
Saved
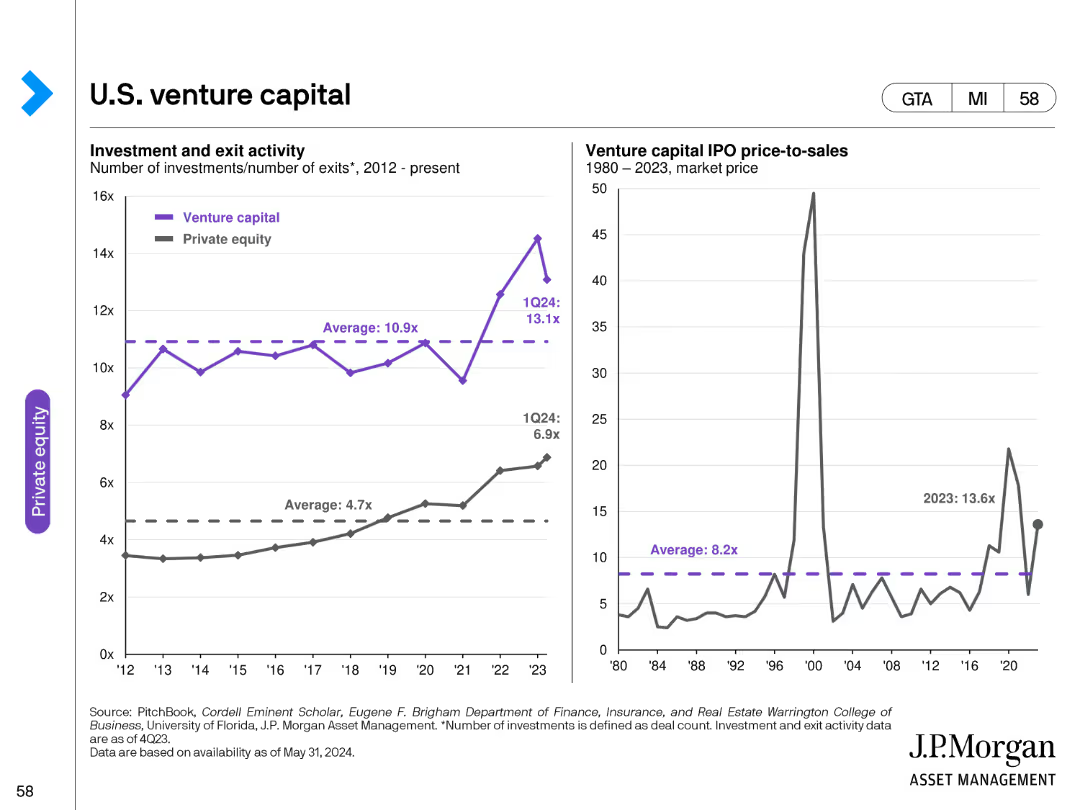
The slide features two line charts: one showing venture capital investment and exit activity, and the other depicting IPO price-to-sales ratios over time.
Investment Analysis
Financial Services
It provides a detailed analysis of U.S. venture capital activities, highlighting investment and exit trends as well as IPO price-to-sales ratios.
venture capital, U.S., investments, exits, IPO, price-to-sales, trends, financial, data analysis
Multiple Chart
JP Morgan
Saved
Text, percentage circles, and horizontal bar chart illustrating employee empowerment and primary reasons for job changes, such as pay and career growth.
Human Resources and Talent Management
Professional Services
This slide discusses employee expectations in a tight labor market, focusing on empowerment, likelihood of leaving, and primary reasons for considering new job offers, including pay and career advancement.
Employee expectations, empowerment, job change reasons, pay, career growth, labor market
Mixed Chart
EY
Saved
Multiple column charts detailing material inflation and commodity price trends over 5 years. Includes World Bank data, focus on crude palm, soybean oil, and Brent crude. Blue and red bars/columns to show price trends and inflation.
Risk Assessment and Management
Consumer Goods
Evaluates the impact of rising commodity prices on Unilever's operations, focusing on strategies to manage cost inflation and its effects on profitability. Highlights the urgency of managing operational costs in volatile market conditions.
Cost Inflation, Commodity Prices, Risk Management, Operational Costs, Profitability
Multiple Chart
Deutsche Bank
Saved
Contains a mix of text and bar charts, detailing reasons for job satisfaction and factors that attract Gen Zs and millennials to employers.
Human Resources and Talent Management
Professional Services
The slide discusses strategies for employers to attract and retain Gen Z and millennial talent, focusing on key factors like work-life balance, learning opportunities, and salary. It includes supporting bar charts showing the importance of these factors.
Talent retention, job satisfaction, employers, Gen Z, millennials
Mixed Chart
Deloitte
Saved
Column charts for industry performance, country performance, and new orders index
Market Analysis and Trends
Financial Services
The slide analyzes the performance of the Asia-Pacific region, highlighting consumer-focused sectors and growth momentum.
Asia-Pacific, regional outlook, industry performance, growth momentum, new orders
Multiple Chart
Accenture
Saved
This slide divides the content into multiple sections, each discussing different market challenges and proposed actions to accelerate the transition to green technologies in SEA.
Market Analysis and Trends
Environmental Services & Sustainability
Provides a detailed analysis of various market challenges and specific actions needed to unlock green opportunities in SEA, emphasizing regulatory and market access improvements to facilitate sustainable practices and investments.
Green Solutions, Market Access, Regulatory Framework, SEA, Sustainability
Header Horizontal
Bain
Saved
This slide displays a complex line and column chart showing the VaR and sVaR levels over multiple quarters, with annotations explaining key peaks and trends in trading risk.
Risk Assessment and Management
Financial Services
Analyzes trading risk within the bank's portfolio, highlighting Value-at-Risk and stressed scenarios over time. Key for risk management teams to monitor and adjust strategies based on trading volatility and market conditions. Useful in financial planning and risk mitigation efforts.
VaR, sVaR, trading risk, portfolio management, market conditions, risk mitigation, financial planning
Single Chart
Deutsche Bank
Saved
The slide displays a table of contents in a clear, structured layout with bold blue headers. It is designed to direct the viewer to different sections of the presentation, which are clickable for ease of navigation.
Market Analysis and Trends
Financial Services
This slide organizes the main topics covered in the credit market report, facilitating easy access to specific analyses and data. This is typically used to orient the audience at the beginning of a detailed financial presentation.
Contents, Topics, Navigation, Report
Agenda
Morgan Stanley
Saved
Features a column chart presenting the Net Promoter Score (NPS) for France as an investment location, with commentary from executives.
Investment Analysis
Professional Services
This slide assesses the willingness of American investors to recommend France as an investment destination, including insights from corporate leaders.
Investment, NPS, Business Climate, Regulatory Challenges, CSR
Mixed Chart
Bain
Saved
Uses a purple and blue gradient color scheme with a line graph displaying revenue growth. Graph markers indicate key financial milestones.
Market Analysis and Trends
Healthcare & Pharmaceuticals
Illustrates the revenue growth trajectory of Experian Health, aiming for a target beyond US$1 billion. Suitable for strategic presentations to investors or internal stakeholders focusing on growth in the healthcare sector.
revenue growth, healthcare market, Experian Health, financial targets
Single Chart
Barclays
Saved
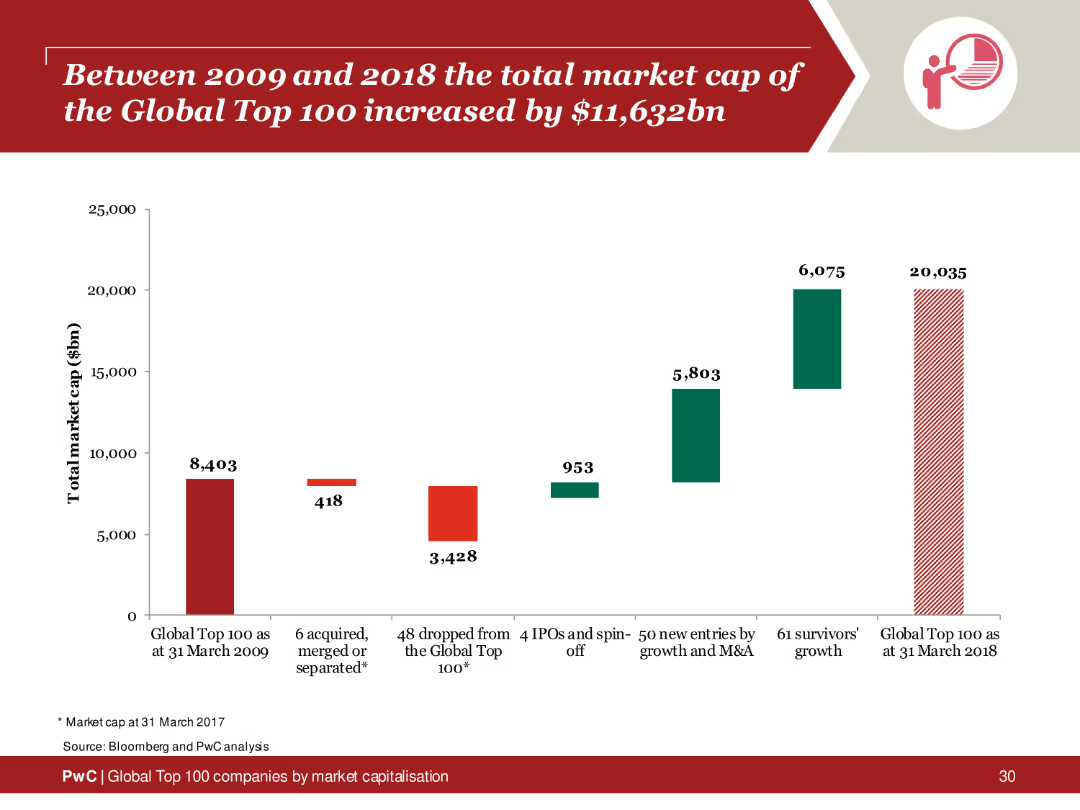
Column chart depicting the total market cap increase of the Global Top 100 companies from 2009 to 2018, highlighting growth areas and key contributors.
Financial Performance
Financial Services
Analysis of the market cap increase of the Global Top 100 companies over a decade, emphasizing significant growth and contributing factors.
market cap, global top 100, 2009, 2018, increase
Single Chart
PwC/Strategy&
Saved
Previous
Next
If nothing, comes up, please save your slides first
Create a FREE account to continue browsing
Receive Instant Access to 1,000+ slides from companies like McKinsey, Google, and Goldman Sachs
First Name
Last Name
Email
Password
I agree to all
Terms & Privacy Policy
Thank you! Your submission has been received!
Oops! Something went wrong while submitting the form.
Have an account?
Sign in
Column Chart
Heatmap
Chevron
Org Chart
Infographic
Callouts
Timeline
List
Graphic
Picture
Process Flow
Diagram
Paragraph
Map
Table
Framework
Subtitle
Takeaway Box
Icon
Other Chart
Radar Chart
Waterfall Chart
Mekko Chart
Pie Chart
Scatter Plot
Line Chart
Bar chart
Bullet points