My Account
My Slides
Search by Category
Templates
View All Templates
Download Template Slides
✦ AI Search
Feedback
Login
Logout
Get Started
Browse all Slides
Browse all Slides
Create a FREE Account
Instant access to 1,000+ real slides from top companies like McKinsey, BCG, Goldman Sachs, Google and many more!
First Name
Last Name
Email
Password
I agree to all
Terms & Privacy Policy
Thank you! Your submission has been received!
Oops! Something went wrong while submitting the form.
Have an account?
Sign in
Saved Slides
The slide shows bar graphs comparing Booz Allen's dividend growth to peer average, alongside textual information.
Financial Performance
Financial Services
Highlights the company's quarterly dividend growth compared to peers, reflecting on Booz Allen's strong performance. Used in investment analysis or shareholder presentations.
Dividend, Growth, Comparison, Performance, Market
Single Chart
Booz Allen Hamilton
Saved
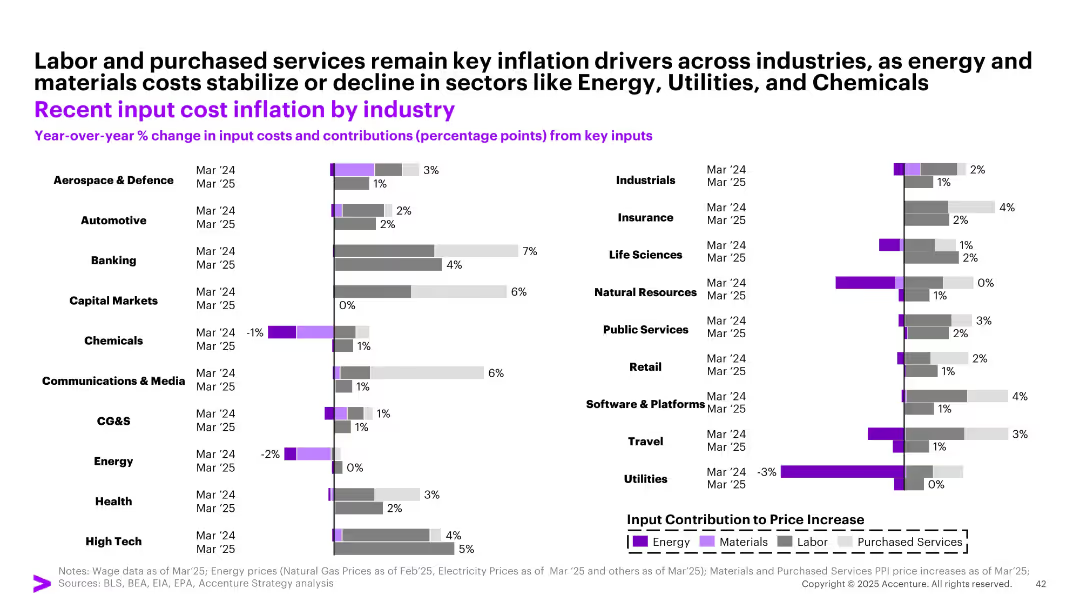
Horizontal bar chart segmented by industry and key cost drivers (Energy, Materials, Labor, Services); two bars per industry (Mar ‘24/’25)
Operational Efficiency
Industrial & Manufacturing
The slide details year-over-year changes in input costs for different industries as of March 2024 and March 2025. Key inflation drivers such as labor and purchased services remain dominant, while energy and materials costs have declined in sectors like Utilities, Chemicals, and Energy.
input costs, inflation, labor, services, industries, 2025, chemicals, utilities, manufacturing
Single Chart
Accenture
Saved
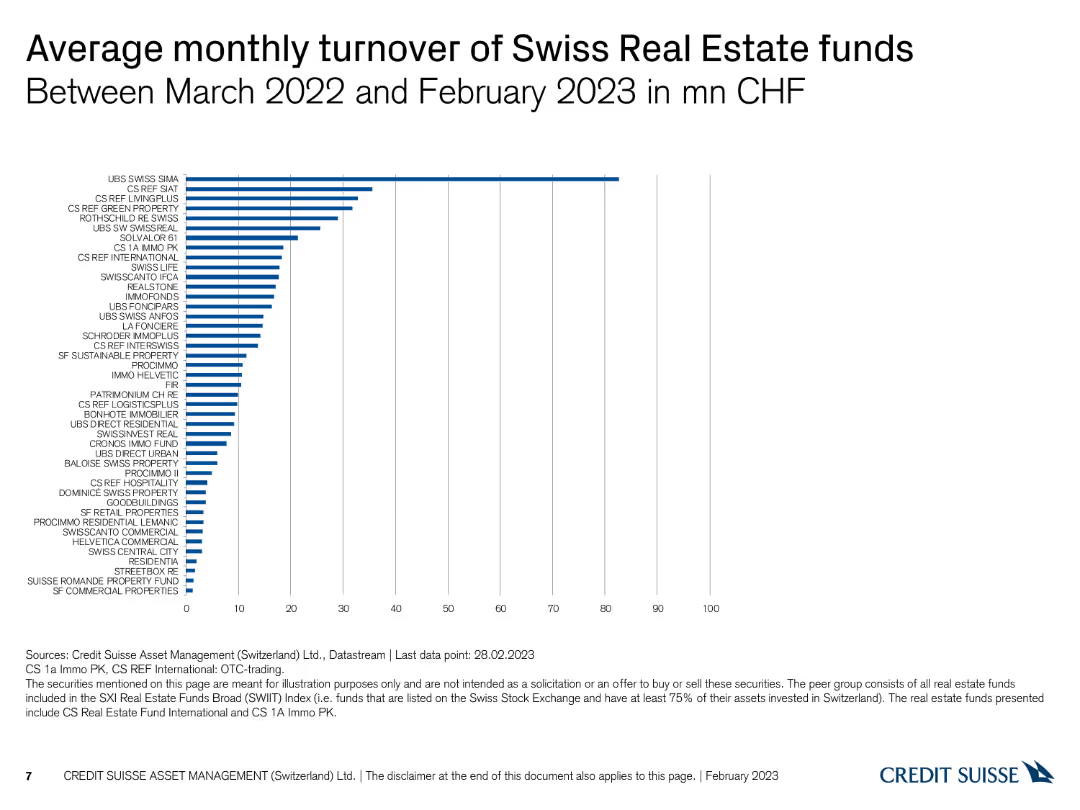
The slide includes a column chart displaying the average monthly turnover of Swiss real estate funds in million CHF.
Financial Performance
Real Estate & Construction
This slide reports the average monthly turnover of various Swiss real estate funds from March 2022 to February 2023, measured in million CHF.
Swiss real estate, turnover, monthly turnover, column chart, CHF
Single Chart
Credit Suisse
Saved
The slide features a hierarchical chart with two main columns differentiated by color. On the left, a blue column lists the supervisory board's structure, and on the right, a darker blue column outlines the general partners' responsibilities.
Organizational Structure and Change
Industrial & Manufacturing
This slide illustrates the governance structure of Michelin, detailing the roles and relationships between the supervisory board and general partners. It can be used to explain company management and oversight practices.
Governance, Structure, Roles, Oversight, Partners, Liability, Management
Diagram
Morgan Stanley
Saved
Comprised of bullet-pointed information on green energy investment and icons representing partnerships, this slide details the activities of the Green Investment Group with visual emphasis on key figures.
Regulatory and Compliance
Financial Services
Showcases the scale of green energy investments and partnerships of the Green Investment Group. It emphasizes the group's commitment to the green transition, serving as a reference for sustainability-focused discussions.
Green Energy, Investment, Partnerships, Sustainability, Transition
Pillar
Morgan Stanley
Saved
Features bar graphs displaying the percentage of online spending by platform for the years 2020, 2021, and 2022 with clear, labeled sections and percentages.
Market Analysis and Trends
Retail & E-commerce
Highlights the dominance of eCommerce marketplaces in digital shopping space and shows a year-by-year comparison of online spend allocation by platform.
online, marketplaces, e-commerce, shopping, digital, spend allocation, comparison, dominance, platform
Multiple Chart
Bain
Saved
This slide has two columns with text on the left and a table on the right. The table uses shades of gray and purple to highlight different temperatures' impacts.
Market Analysis and Trends
Environmental Services & Sustainability
Discusses the key consequences of +1.5°C and +2.0°C global warming by 2100 on various factors such as sea level rise, biodiversity losses, and coral reef decline.
Global warming, ecosystems, biodiversity, sea level, temperature
Table
Kearney
Saved
A title slide with a deep blue abstract background. Prominently features the Citi logo, title for the 'Earnings Results Presentation', and the date 'Third Quarter 2023'.
Industry Overview
Financial Services
Introduces Citigroup's earnings results for the third quarter of 2023, setting the stage for a detailed financial review and analysis to follow in the presentation.
Citi, earnings report, Q3 2023, financial services, presentation title, abstract background, company logo, date.
Title
Citigroup
Saved
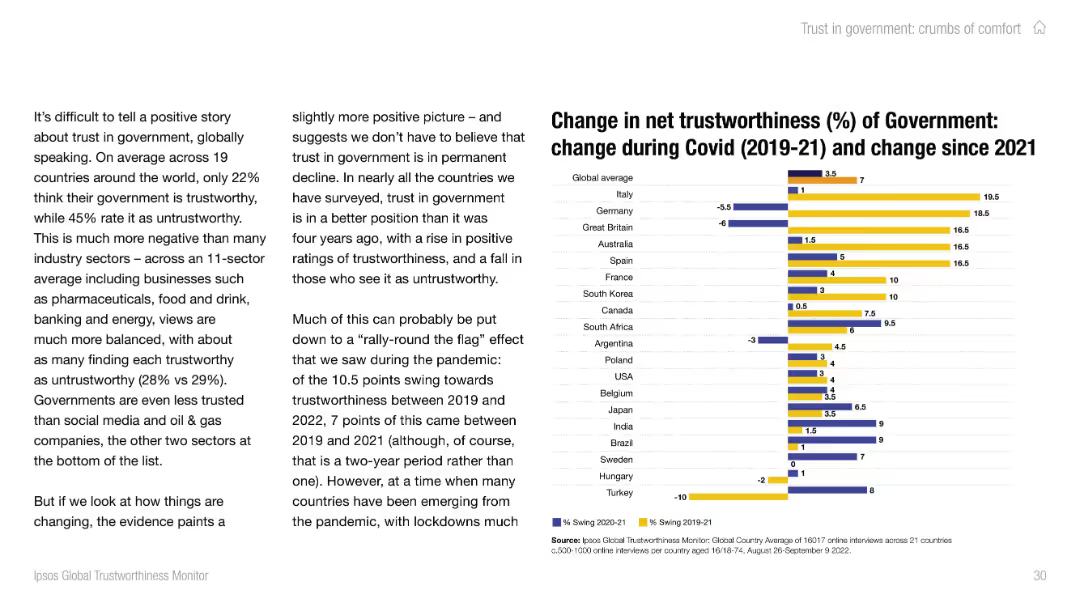
Left-aligned text with dual-bar chart on the right showing trust change during Covid and since 2021. Uses yellow and blue bars with global average reference.
Risk Assessment and Management
Government & Public Sector
This slide tracks how trust in government shifted during and after Covid. While trust initially rose during the pandemic, it has declined in some countries post-2021. The data shows varying national trajectories and a fragile trust recovery.
government, trust, covid, perception, Ipsos, pandemic, regulation, trends
Mixed Chart
IPSOS
Saved
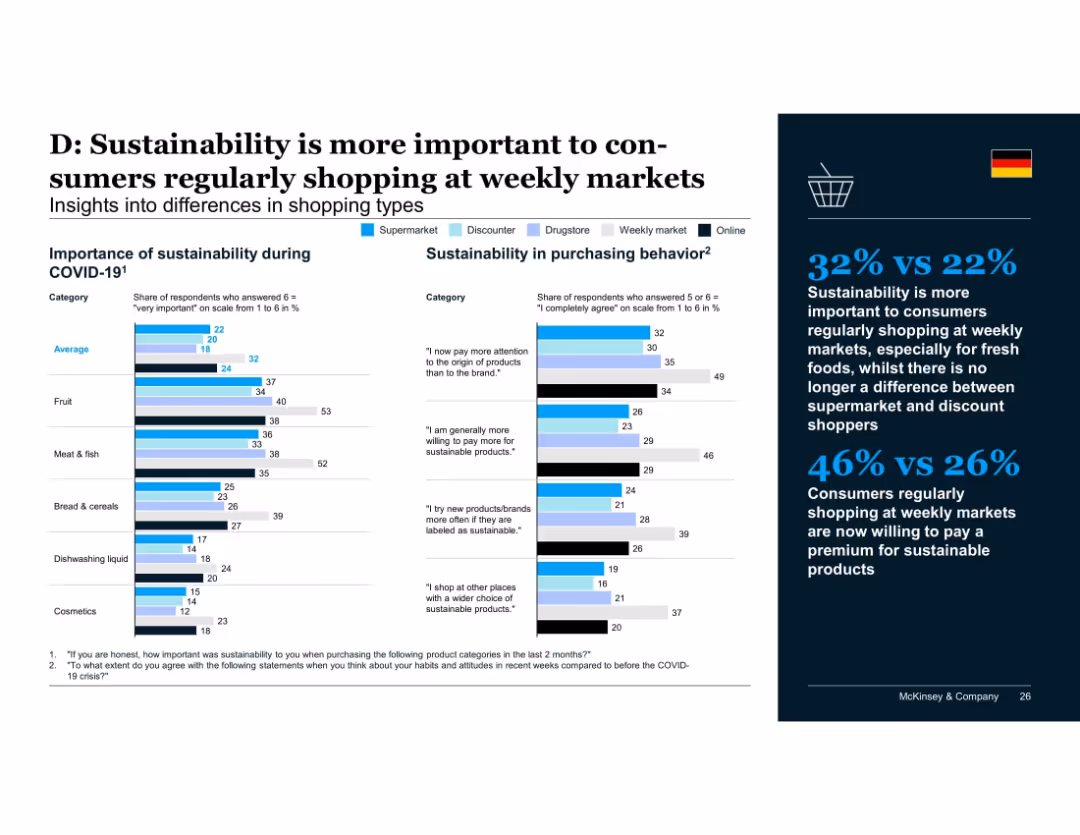
Multi-category comparison chart with different shopper types (supermarket, discounter, drugstore, weekly market, online) shown via color-coded bars across product categories; insights panel on the right.
Customer and Market Segmentation
Retail & E-commerce
Consumers who regularly shop at weekly markets value sustainability more, especially for fresh food categories. They also exhibit higher willingness to pay premiums, unlike discount and supermarket shoppers where differentiation has diminished.
shopping types, weekly markets, sustainability, fresh produce, consumer segmentation, willingness to pay
Mixed Chart
McKinsey
Saved
A global map highlighted in purple shades with yield percentages for various countries prominently displayed, facilitates a geographical comparison of equity yields.
Market Analysis and Trends
Financial Services
This visual slide displays global equity yields, simplifying the comparison of investment returns across countries, which can guide international investment strategies.
global, equity yields, investment returns, geographical comparison, countries, map, strategy, finance
Graphic
Morgan Stanley
Saved
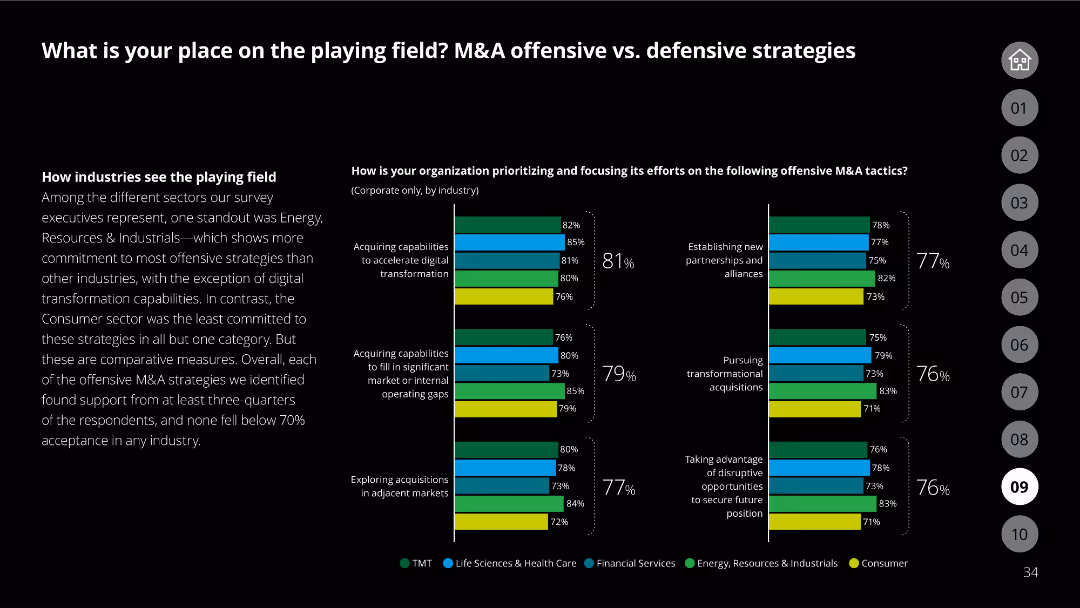
Slide with column charts detailing defensive M&A strategies by industry, focusing on aspects like cash flow and rapid turnaround situations.
Strategic Planning
Financial Services
Highlights survey results on defensive M&A strategies, showing the importance of liquidity, turnaround situations, and synergies from recent acquisitions.
M&A, defensive strategies, industry, cash flow, turnaround, synergies, survey, column chart
Multiple Chart
Deloitte
Saved
This slide presents a matrix layout, comparing different strategic approaches to innovation within companies. It utilizes contrasting colors to differentiate between 'model', 'buy', and 'partner' approaches, and includes both text explanations and simple iconography.
Market Analysis and Trends
Technology & Software
The slide discusses various methods of building capabilities through partnerships and acquisitions, and how companies choose based on their focus on innovation. It's useful for strategic planning and investment decisions.
Innovation, Partnerships, Acquisition, Ecosystems, Venture Capital, Startups, Technology, Strategy, Investment, Engagement
Pillar
BCG
Saved
This slide features a paragraph of text on the left and a graph on the right. The graph shows percentages corresponding to practices supporting continuous reinvention, using a blue to purple gradient. The imagery suggests a dynamic and ongoing transformation process.
Strategic Planning
Professional Services
It discusses the need for companies to continuously reinvent by reprioritizing initiatives and driving impactful actions. This slide could be instrumental in implementing strategic planning sessions focused on innovation and adaptability.
Continuous Reinvention, Strategic Priorities, Business Impact, Innovation, Reprioritizing, Initiative Management, Transformation Process, Impactful Actions
Single Chart
Accenture
Saved
This slide features arrows ranking five spending priorities in descending order, with annotations on budget allocation percentages and specific focus areas like old age grants.
Regulatory and Compliance
Government & Public Sector
Outlines the government's top financial priorities and the strategic allocation of funds to these areas.
Financial priorities, budget allocation, strategic planning
Linear Flow
PwC/Strategy&
Saved
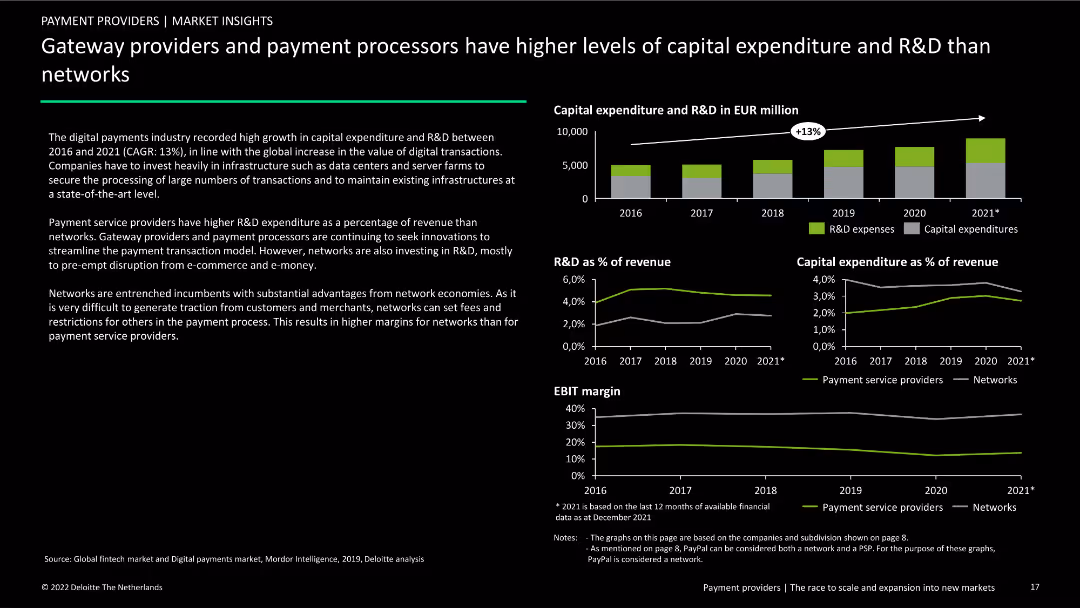
Contains three column charts and three line charts showing capital expenditure and R&D trends from 2016 to 2021. Includes text explaining differences between payment providers and networks.
Market Analysis and Trends
Financial Services
Analysis of capital expenditure and R&D trends in the digital payments industry, comparing gateway providers and payment processors to networks from 2016 to 2021.
capital expenditure, R&D, payment processors, gateway providers, networks, financial services, market analysis, trends, comparative analysis
Multiple Chart
Deloitte
Saved
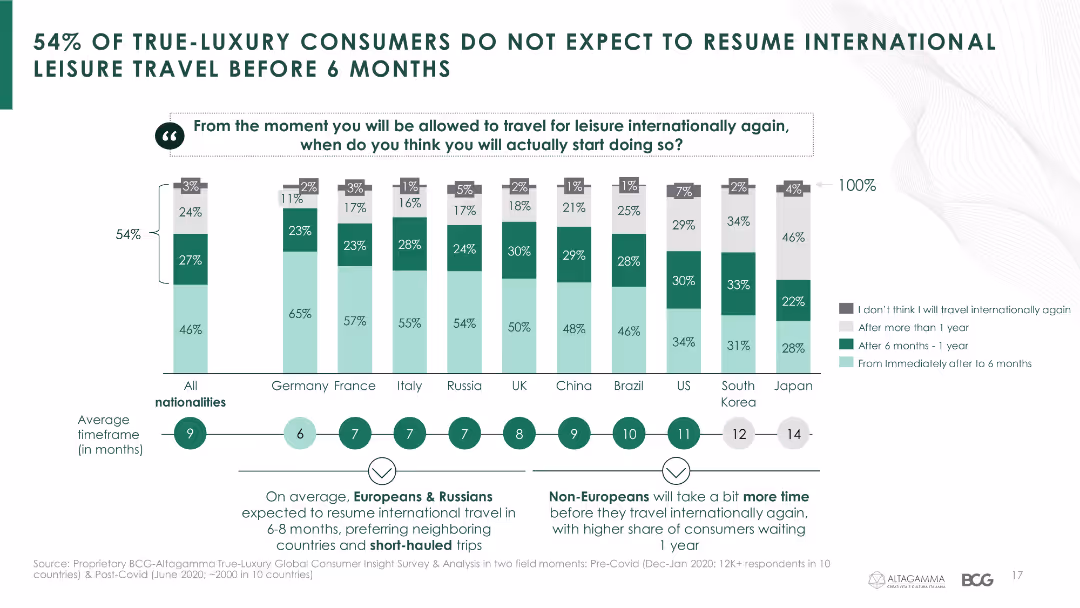
The slide features a column chart indicating the expected timelines for resuming international leisure travel among luxury consumers from various countries.
Market Analysis and Trends
Hospitality & Tourism
It provides insights into luxury consumers' expectations on when they will resume international travel, showing a significant delay due to the pandemic.
leisure travel, luxury consumers, travel expectations, COVID-19, international travel, country comparison
Mixed Chart
BCG
Saved
A stacked column chart compare the market share of different generations in the true luxury goods market from 2019 to projections for 2026.
Market Analysis and Trends
Consumer Goods
Analyzes the impact of Millennials and Gen Z on the luxury goods market, highlighting their growing market share and influence. Useful for understanding demographic shifts in consumer behavior within the luxury sector.
luxury, market, Millennials, Gen Z, trends
Multiple Chart
BCG
Saved
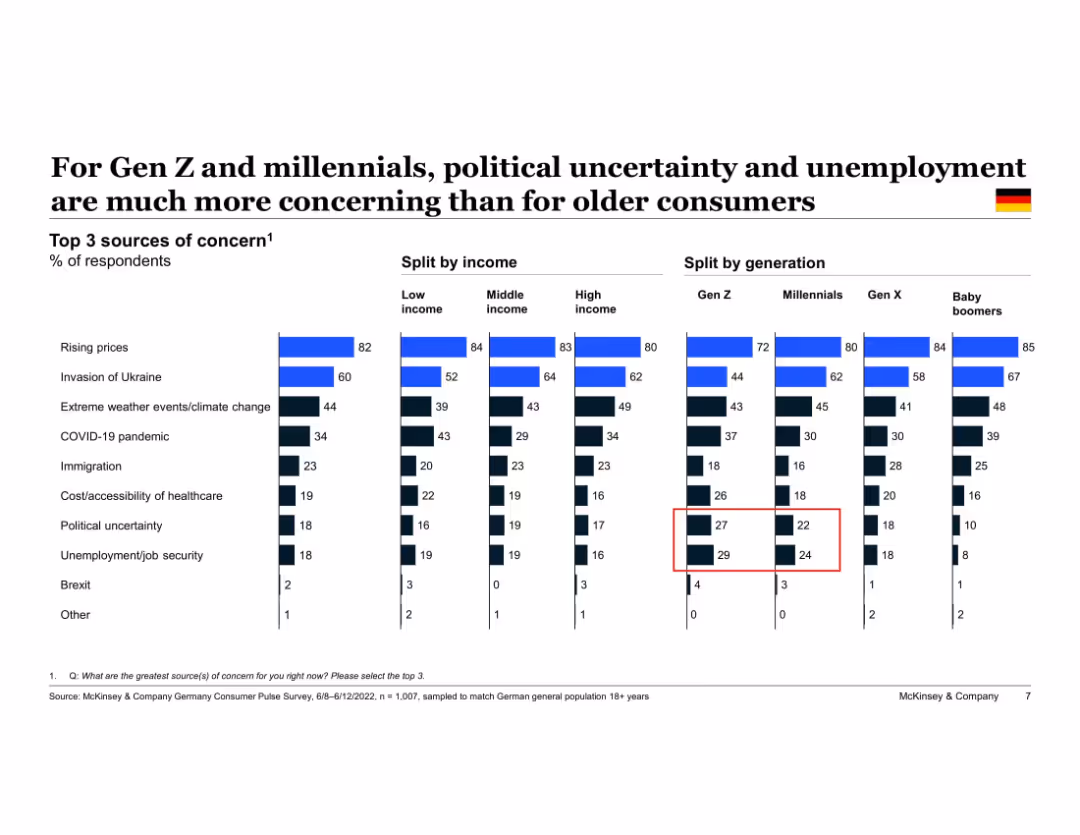
Vertical bar charts segmented by income and generation. Red boxes highlight key data points. Dark-themed with blue accent colors.
Customer and Market Segmentation
Consumer Goods
The slide highlights generational and income-level differences in consumer concerns. Gen Z and millennials show higher concern for political uncertainty and unemployment, while older generations focus more on inflation and geopolitical risks.
generational analysis, unemployment, political uncertainty, inflation, consumer segmentation, income levels, youth perspectives
Single Chart
McKinsey
Saved
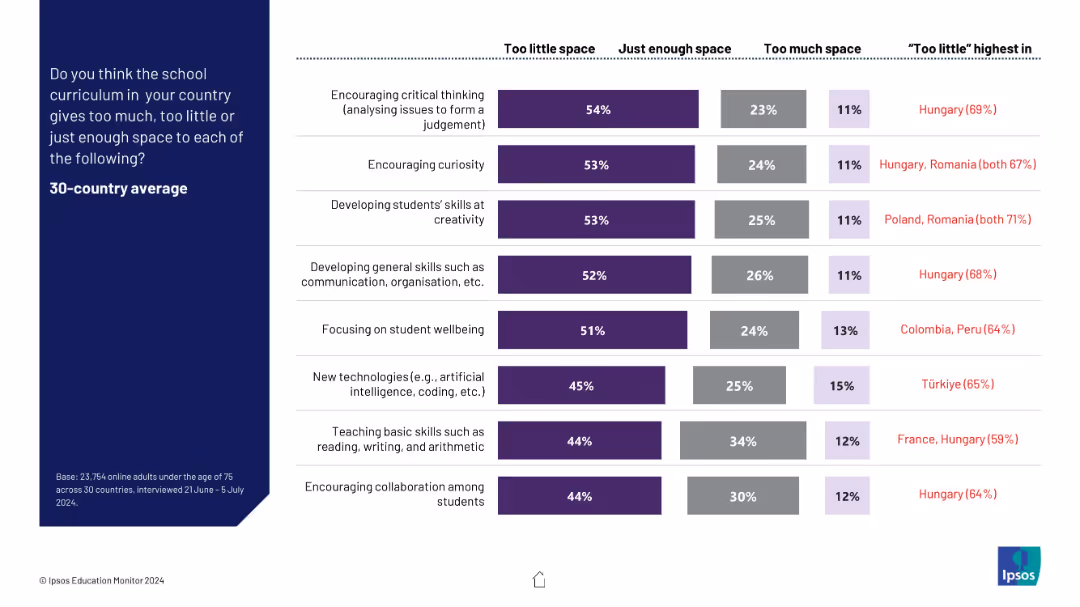
Stacked bar chart for each curriculum area, segmented by “Too little,” “Just enough,” and “Too much.” Highlights “Too little” leaders.
Product and Service Analysis
Education & Training
This slide captures public opinion on the sufficiency of space dedicated to various educational priorities in the curriculum. Most respondents feel areas like critical thinking, curiosity, and creativity receive too little attention.
curriculum content, critical thinking, skill development, public opinion, education design
Mixed Chart
IPSOS
Saved
This slide features a title at the top, four separate sections with icons and percentages, and various charts. Each section highlights different statistics about consumer behavior related to sustainability, including bar charts and descriptive text blocks.
Market Analysis and Trends
Consumer Goods
This slide shows various statistics on consumer shifts towards sustainability in their purchasing habits during COVID-19. It covers areas such as increased buying of sustainable products, organic foods, and reusable items, emphasizing a shift in consumer priorities and awareness due to the pandemic.
sustainability, consumer behavior, COVID-19, market trends, organic products, recycling, environmental impact, data visualization
Boxed
BCG
Saved
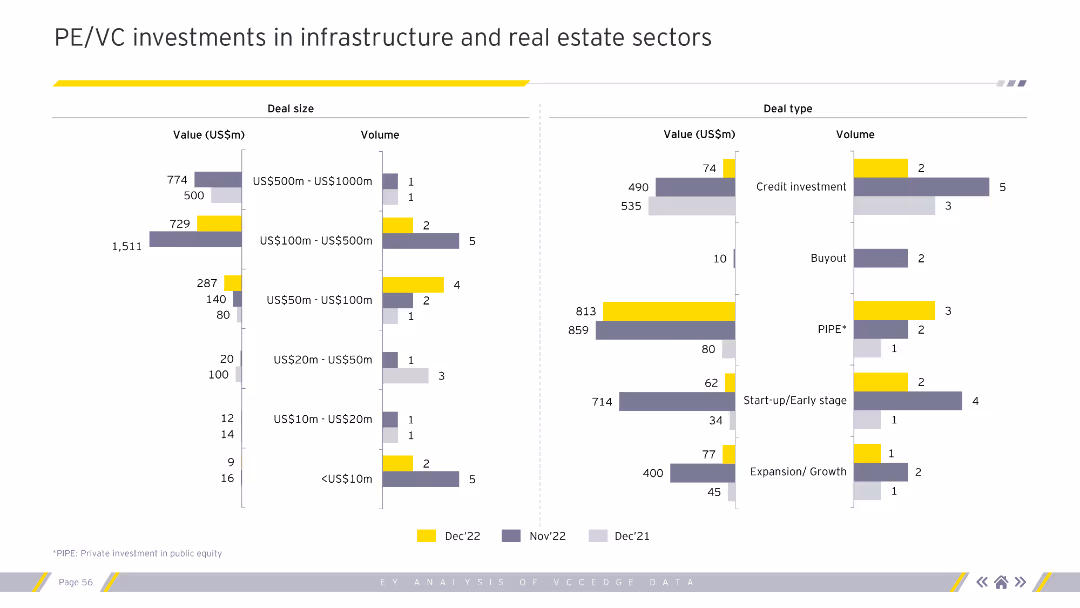
The slide features two bar charts. The left bar chart shows deal sizes by value and volume. The right bar chart shows deal types by value and volume.
Investment Analysis
Real Estate & Construction
This slide compares the PE/VC investments in infrastructure and real estate sectors based on deal size and type.
PE, VC, infrastructure, real estate, investments, deal size, deal type, volume, value
Multiple Chart
EY
Saved
Contains pie charts and a sector diagram to showcase sales distribution and operating margins by business group. Rich in visual data and structured layout.
Competitive Landscape
Transportation & Logistics
Highlights Faurecia's global leadership and sales figures across different business groups, demonstrating its strong market position and development potential within the automotive sector.
global leadership, sales, market position, automotive, development
Multiple Chart
Deutsche Bank
Saved
Displays three orange vertical bars representing SACU receipts over three fiscal years, with values labeled clearly atop each bar.
Regulatory and Compliance
Government & Public Sector
The slide shows past, estimated, and projected SACU receipts, helping in financial assessment and future budgeting within the government sector.
SACU, receipts, financial review, projection, government, budgeting, past, estimate, fiscal, finance
Single Chart
PwC/Strategy&
Saved
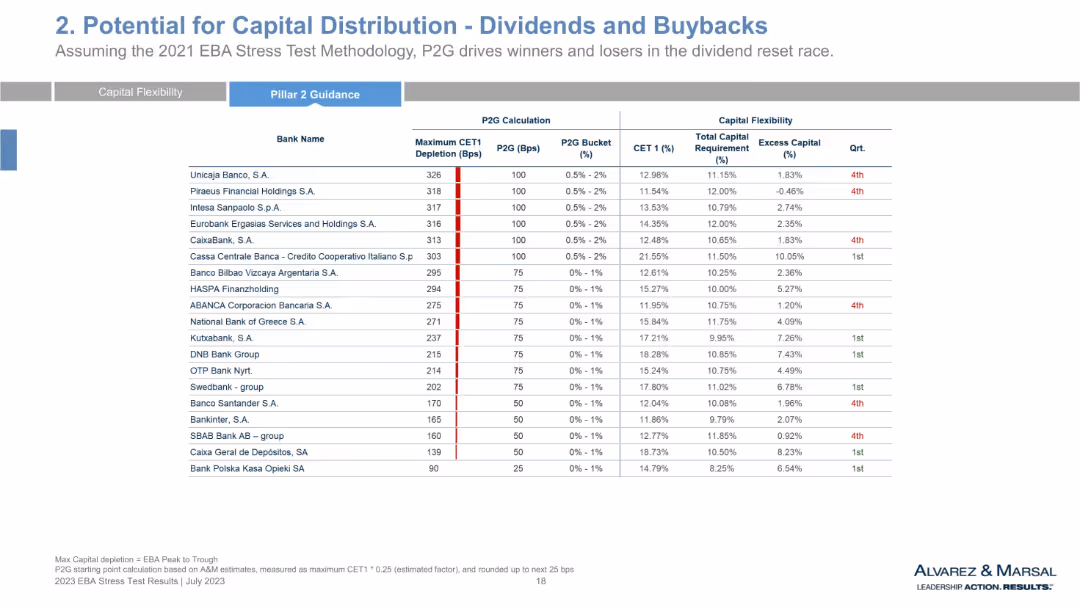
Final set of banks in same tabular format, concluding comparative data series across banks’ CET1 ratios, P2G, and capital flexibility.
Regulatory and Compliance
Financial Services
This slide wraps up the full list of banks assessed for potential capital distributions post-EBA stress test. It reinforces the framework from earlier slides, evaluating regulatory expectations against actual capital positions. The slide also reflects on the implications of P2G for dividends and buffer requirements.
ECB guidance, stress scenario, capital planning, CET1 levels, excess capital, resilience analysis, risk buffer
Single Chart
Alvarez & Marsal
Saved
Previous
Next
If nothing, comes up, please save your slides first
Create a FREE account to continue browsing
Receive Instant Access to 1,000+ slides from companies like McKinsey, Google, and Goldman Sachs
First Name
Last Name
Email
Password
I agree to all
Terms & Privacy Policy
Thank you! Your submission has been received!
Oops! Something went wrong while submitting the form.
Have an account?
Sign in
Column Chart
Heatmap
Chevron
Org Chart
Infographic
Callouts
Timeline
List
Graphic
Picture
Process Flow
Diagram
Paragraph
Map
Table
Framework
Subtitle
Takeaway Box
Icon
Other Chart
Radar Chart
Waterfall Chart
Mekko Chart
Pie Chart
Scatter Plot
Line Chart
Bar chart
Bullet points