My Account
My Slides
Search by Category
Templates
View All Templates
Download Template Slides
✦ AI Search
Feedback
Login
Logout
Get Started
Browse all Slides
Browse all Slides
Create a FREE Account
Instant access to 1,000+ real slides from top companies like McKinsey, BCG, Goldman Sachs, Google and many more!
First Name
Last Name
Email
Password
I agree to all
Terms & Privacy Policy
Thank you! Your submission has been received!
Oops! Something went wrong while submitting the form.
Have an account?
Sign in
Saved Slides
The slide is text-heavy with quotes and detailed analysis, alongside bar charts showing survey results on AI's risks in corporate communications.
Risk Assessment and Management
Technology & Software
Analyzes the potential risks associated with AI in corporate communications, highlighting issues like misinformation and loss of human touch in messages.
AI risks, corporate communications, survey results, risk management, misinformation
Mixed Chart
IPSOS
Saved
Dual-box layout describing framework components; includes simple quadrant chart showing priority area based on two axes.
Investment Analysis
Environmental Services & Sustainability
This slide introduces the framework used to assess and prioritize investment ideas. Abatement potential and deployability are the key axes—factors like emissions scope, reduction potential, and financial benefits determine scoring. A visual matrix emphasizes high-priority ideas at the top right.
investment framework, deployability, emissions reduction, abatement, priority scoring, environmental impact
Mixed Chart
Bain
Saved
Three donut charts showing diversification by source, remaining maturity, and currency, providing a detailed breakdown of the funding structure.
Financial Performance
Financial Services
Detailed view of UBS's long-term wholesale funding diversification across different sources, maturities, and currencies.
Diversification, funding, sources, maturity, currency
Multiple Chart
UBS
Saved
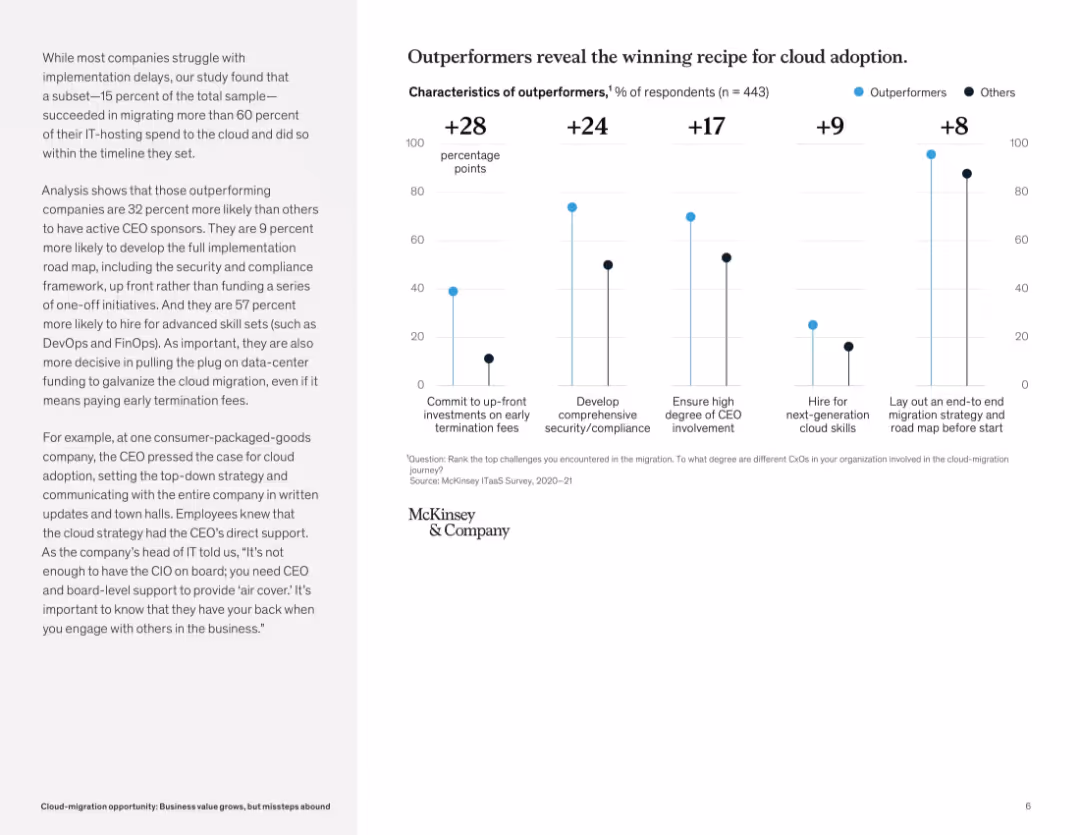
Vertical bar chart layout comparing outperformers and others across five cloud adoption success factors. Left-aligned narrative explanation.
Strategic Planning
Technology & Software
This slide identifies the traits of cloud migration outperformers, including executive sponsorship, comprehensive planning, and talent investment. Companies that commit to upfront investments and structured strategy are significantly more successful.
cloud adoption, best practices, CEO involvement, security, strategy, digital leadership, early investment, outperformers, migration success
Mixed Chart
McKinsey
Saved
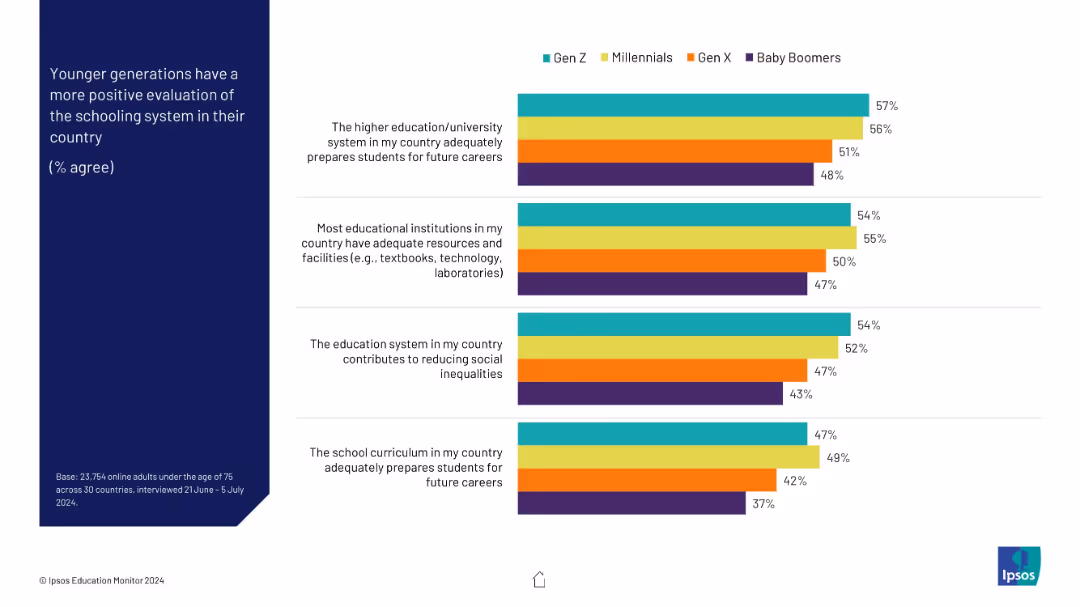
Four grouped bar charts by generation (Gen Z to Boomers), each with color-coded bars for agreement on schooling quality. Layout is clean and segmented by row.
Customer and Market Segmentation
Education & Training
The slide shows generational differences in agreement with positive statements about their country's education system. Younger generations (Gen Z, Millennials) express higher levels of satisfaction than older ones (Gen X, Boomers), especially on career preparation and infrastructure.
generational comparison, youth perception, schooling evaluation, Gen Z, education quality, survey
Mixed Chart
IPSOS
Saved
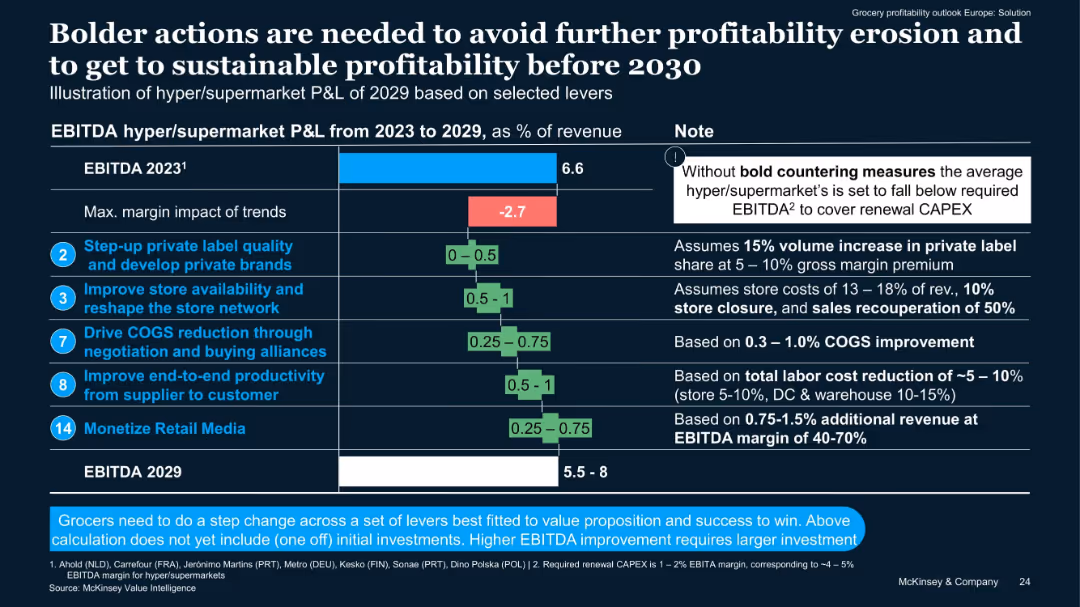
Horizontal bar chart with margin impacts, accompanied by numeric and note columns. Blue, green, and red color-coded bars.
Financial Performance
Retail & E-commerce
Shows projected EBITDA changes for hyper/supermarkets from 2023 to 2029 based on five key levers. Highlights a -2.7% margin trend risk without bold action, and outlines the potential upside of selected strategic initiatives.
EBITDA, private label, store network, COGS, productivity, retail media
Mixed Chart
McKinsey
Saved
The slide contains a column chart displaying revenues from 2020 to 2025 and profitability percentages, with text discussing organic growth and CAGR projections.
Financial Performance
Financial Services
It projects revenue and profitability growth for Ipsos by 2025, showing detailed financial data and growth assumptions.
revenues, growth, projections, CAGR, Ipsos
Single Chart
IPSOS
Saved
Divided into three columns with text anda table, illustrating the benefits of digital innovation over time
Technology and Digital Transformation
Financial Services
Discusses the strategic, operational, and financial benefits of digital innovation in wealth management firms.
digital innovation, strategic planning, operational efficiency, financial benefits
Table
Deloitte
Saved
Diagram showcasing five components of an integrated customer experience toolkit, involving digital and organizational elements.
Technology and Digital Transformation
Professional Services
Details a toolkit for enhancing customer experience through digital transformation, emphasizing the integration of feedback loops and digital interactions.
Customer Experience, Digital, Strategy
Linear Flow
Bain
Saved
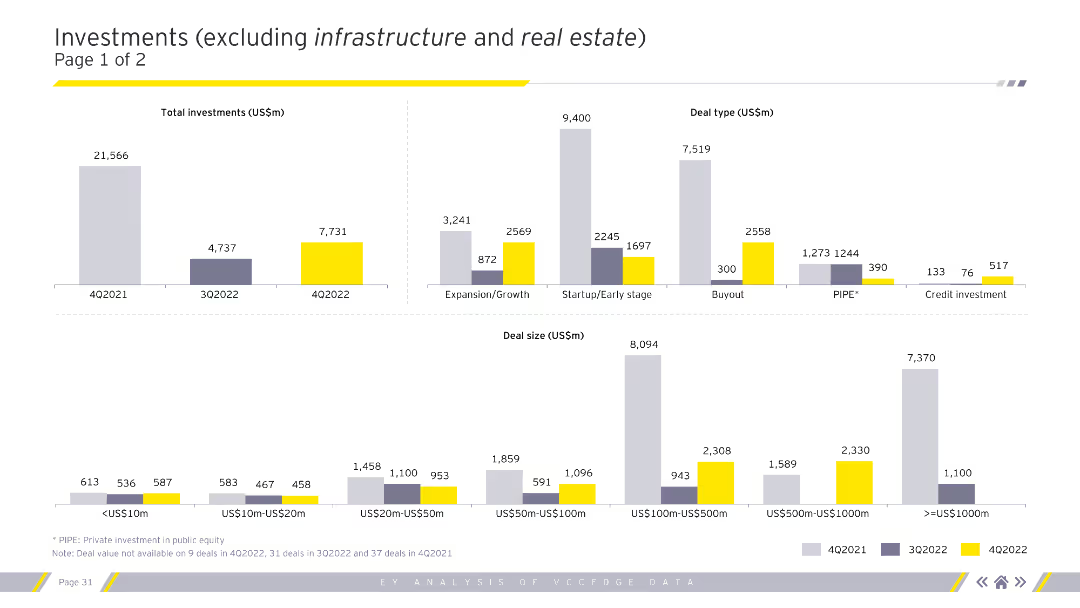
The slide features multiple column charts displaying total investments, deal types, and deal sizes for various quarters. The charts are color-coded to represent different time periods.
Market Analysis and Trends
Financial Services
This slide focuses on investments excluding infrastructure and real estate, showing detailed breakdowns by deal type and size, aiding in understanding specific investment trends.
Investments, deal types, deal sizes, quarterly data
Multiple Chart
EY
Saved
Various charts including a column chart for integration cost timing and a breakdown of cost categories, presented in a clear, visual format.
Mergers and Acquisitions
Professional Services
Provides a case study on the integration costs of a successful merger, detailing the cost breakdown and timing of expenses.
case study, integration, merger, costs, financial breakdown, cost timing, professional services
Multiple Chart
Deloitte
Saved
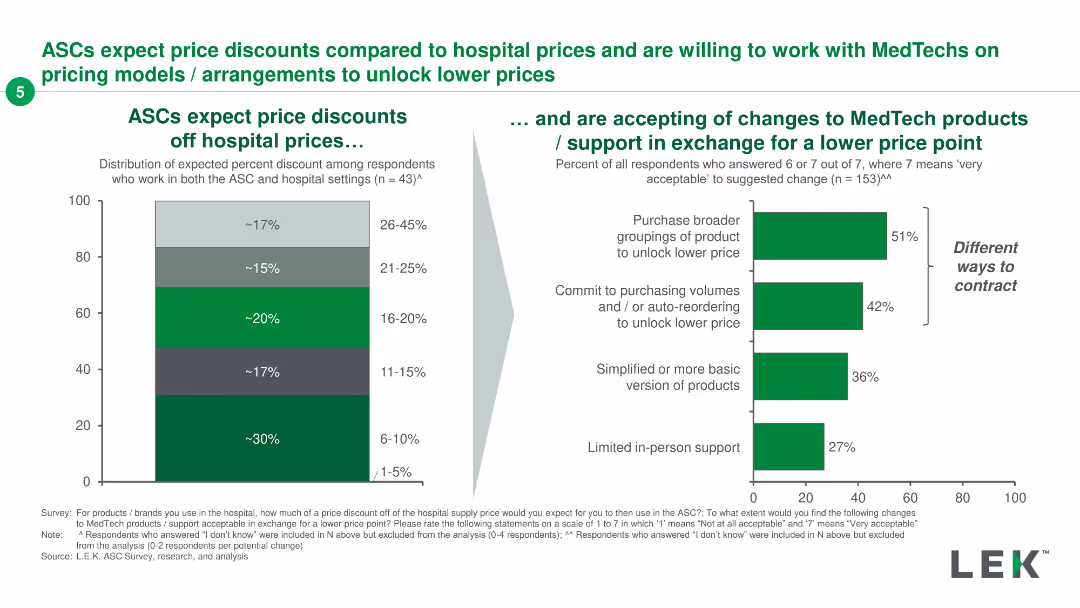
Two-part slide with a column chart showing expected price discounts off hospital prices and a horizontal bar chart detailing acceptability of changes for a lower price point.
Pricing Strategies
Healthcare & Pharmaceuticals
The slide shows expected price discounts ASCs want off hospital prices and the acceptance of changes in MedTech products/support for lower prices, emphasizing different contracting methods.
ASCs, MedTech, pricing models, discounts, price point
Multiple Chart
LEK
Saved
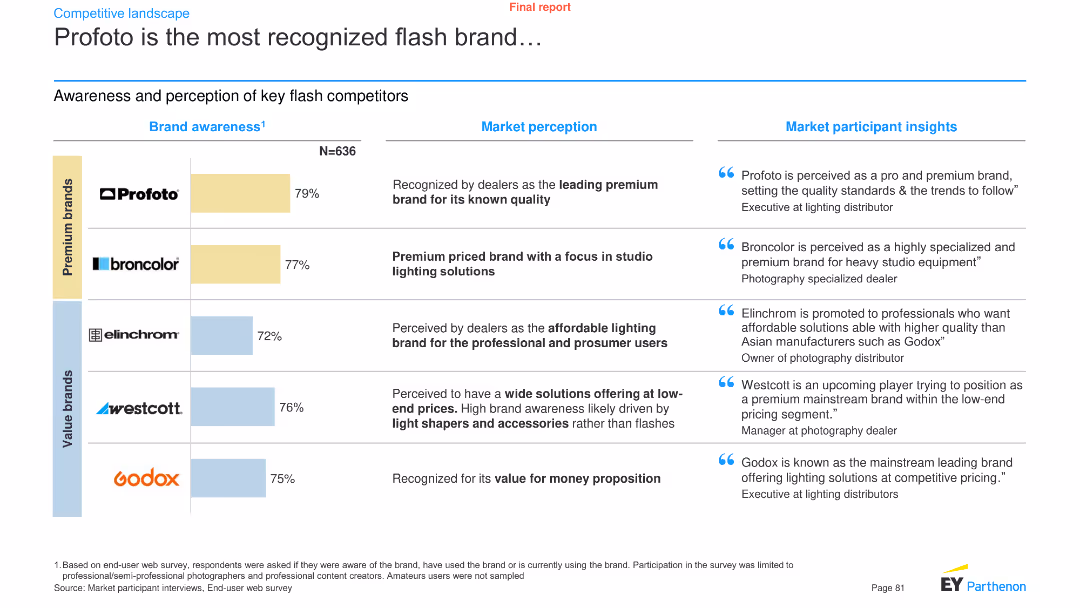
A combination of a bar chart and text boxes presents brand awareness data for key flash competitors, along with market perception and participant insights.
Pricing Strategies
Media & Entertainment
It showcases the brand awareness levels of key flash brands like Profoto, Broncolor, Elinchrom, Westcott, and Godox, with market perception and insights.
Brand awareness, flash brands, Profoto, market perception, participant insights, media, entertainment, analysis, trends
Mixed Chart
EY
Saved
Donut chart showing market share by country/region in the ICT industry for 2021, alongside a column chart projecting global ICT spending from 2021 to 2023.
Technology and Digital Transformation
Technology & Software
The slide highlights the importance of a mature ICT industry as a foundation for technological innovation. It shows the market share of different regions in the ICT sector and projects an increase in global ICT spending, emphasizing the role of ICT in economic development.
ICT Industry, Market Share, Global Spending
Multiple Chart
Roland Berger
Saved
Contains multiple data visualizations: icons comparing digital and traditional interactions across platforms for the year 2021, and a column chart showing the percentage growth in digital core product sales from 2016 to 2021. The slide is designed with clarity, using color coding to differentiate between digital and traditional sales methods effectively.
Financial Performance
Financial Services
Analyzes the bank's marketing and sales strategies by illustrating the growth in digital interactions and product sales. It provides insights into the effectiveness of digital versus traditional sales approaches, emphasizing the bank’s strong distribution network and its impact on enhancing customer engagement and sales performance.
digital marketing, sales growth, customer engagement, cross-selling
Mixed Chart
Deutsche Bank
Saved
This slide uses multiple color-coded column charts to depict podcast ad revenue share by industry category between 2021 and 2022. Each industry's revenue share is represented by two bars (for each year), with annotations for percentages.
Market Analysis and Trends
Media & Entertainment
Highlights the diversity in podcast ad revenue distribution by industry, showing growth in sectors like retail and stability in others. Useful for market analysis and understanding industry-specific advertising trends.
Podcast Advertising, Industry Distribution, Revenue Trends, Media
Mixed Chart
PwC/Strategy&
Saved
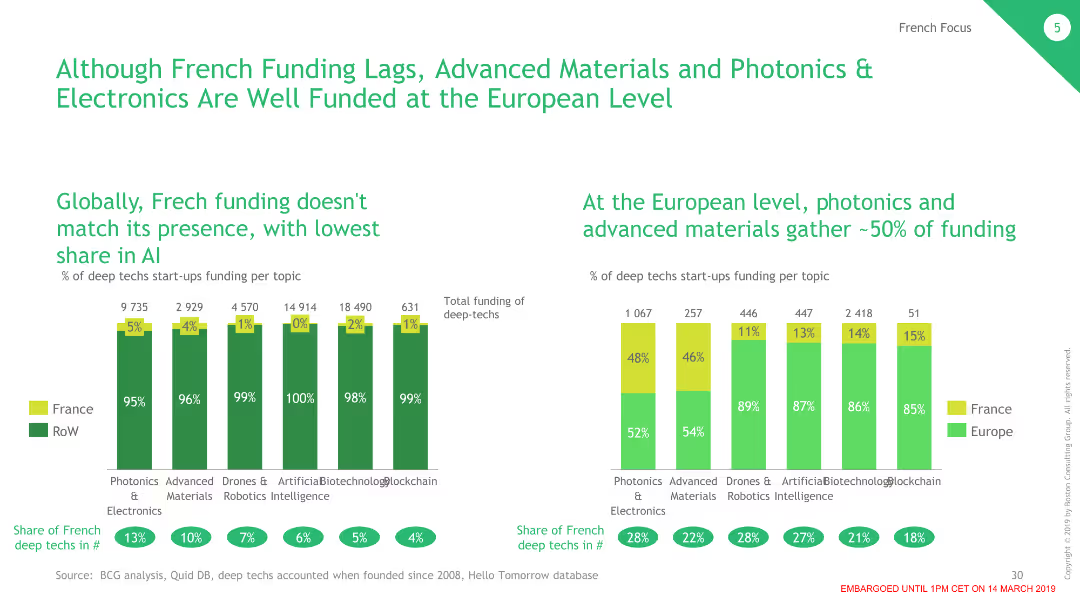
The slide contains two column charts. The left chart shows the percentage of French deep tech startups funding by category, and the right chart compares the funding shares between France and Europe.
Investment Analysis
Technology & Software
This slide discusses the disparity in funding for deep tech startups in France, noting strong funding in advanced materials and photonics & electronics, but overall lower investment compared to Europe.
Funding, France, Deep Tech, Investment, Comparison
Multiple Chart
BCG
Saved
The slide uses column charts to compare labor availability issues in France from 2022 to 2023 across all industries, with contextual insights from industry professionals about regional recruitment challenges.
Human Resources and Talent Management
Professional Services
Explores the labor shortage crisis in France, detailing sector-specific challenges and geographic disparities in labor availability, and assessing the impact on industries such as logistics and high-tech.
labor shortage, France, industry impact, recruitment challenges, regional analysis
Mixed Chart
Bain
Saved
The slide includes a bar chart and a pie chart illustrating the demographics, gender split, and other characteristics of young people.
Customer and Market Segmentation
Education & Training
The slide presents an analysis of young people's demographics, highlighting gender, ethnicity, educational background, and various socio-economic factors.
demographics, gender split, young people, ethnicity, socio-economic
Multiple Chart
EY
Saved
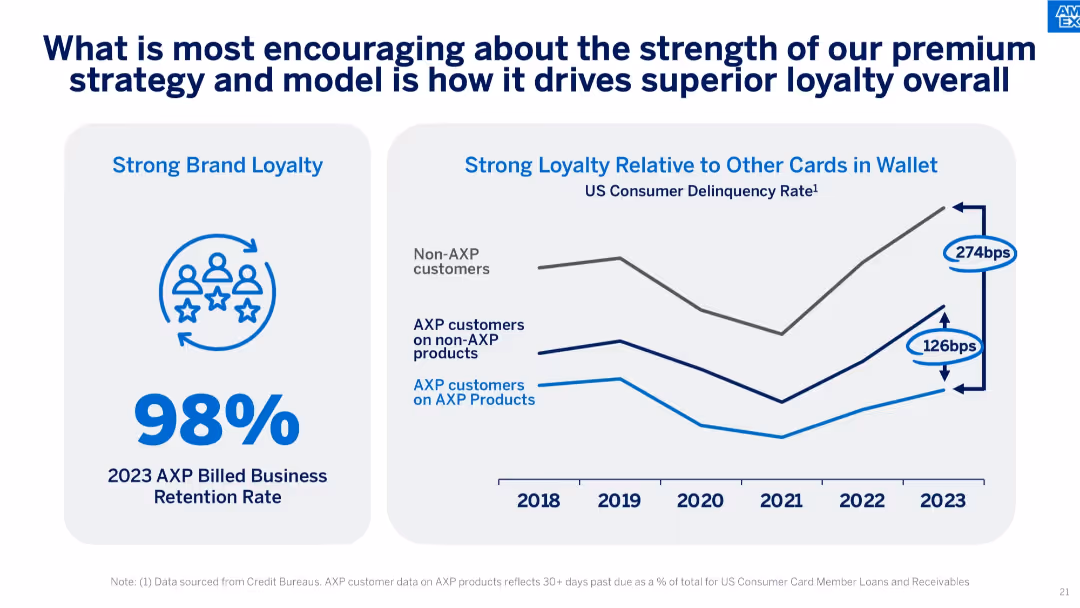
Split layout with retention rate on the left and delinquency rate trends by customer group on the right.
Customer and Market Segmentation
Financial Services
Illustrates brand loyalty through a 98% retention rate and lower delinquency rates for AXP product users compared to others, underscoring customer engagement strength.
brand loyalty, customer retention, delinquency, AXP customers, credit performance, consumer segmentation
Mixed Chart
McKinsey
Saved
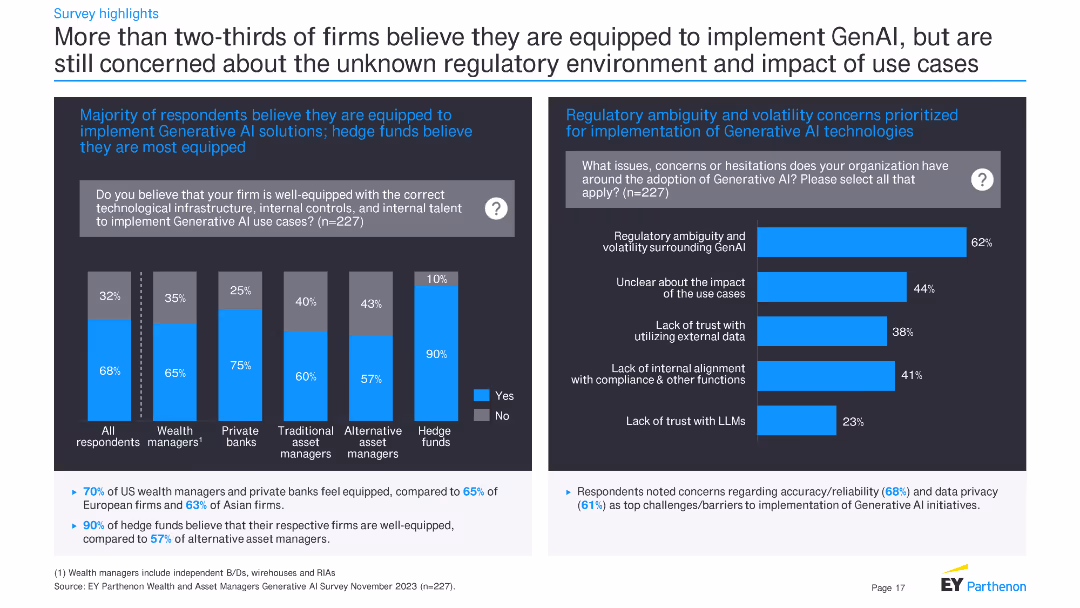
The slide features a column chart on the left and a bar chart on the right. The column chart shows the percentage of firms across different financial sectors that believe they are well-equipped to implement GenAI. The bar chart on the right highlights concerns related to regulatory ambiguity and other issues.
Risk Assessment and Management
Financial Services
The slide indicates that more than two-thirds of firms believe they are equipped to implement Generative AI, with hedge funds being the most confident. It also highlights major concerns like regulatory ambiguity, impact of use cases, and lack of trust with external data.
Generative AI, financial firms, regulatory concerns, implementation, survey results, hedge funds, technological readiness, data trust
Multiple Chart
EY
Saved
A line chart displaying trends in GDP per capita from 2011 to 2016 for several US metro areas, each represented by a different colored line, with highlighted points for areas like San Francisco and Washington DC.
Financial Performance
Transportation & Logistics
Analyzes economic growth in U.S. metropolitan areas through GDP per capita over time, highlighting regions with significant changes. Useful for economic planning and assessment.
GDP, economic growth, metro areas, US, trends, financial analysis
Single Chart
BCG
Saved
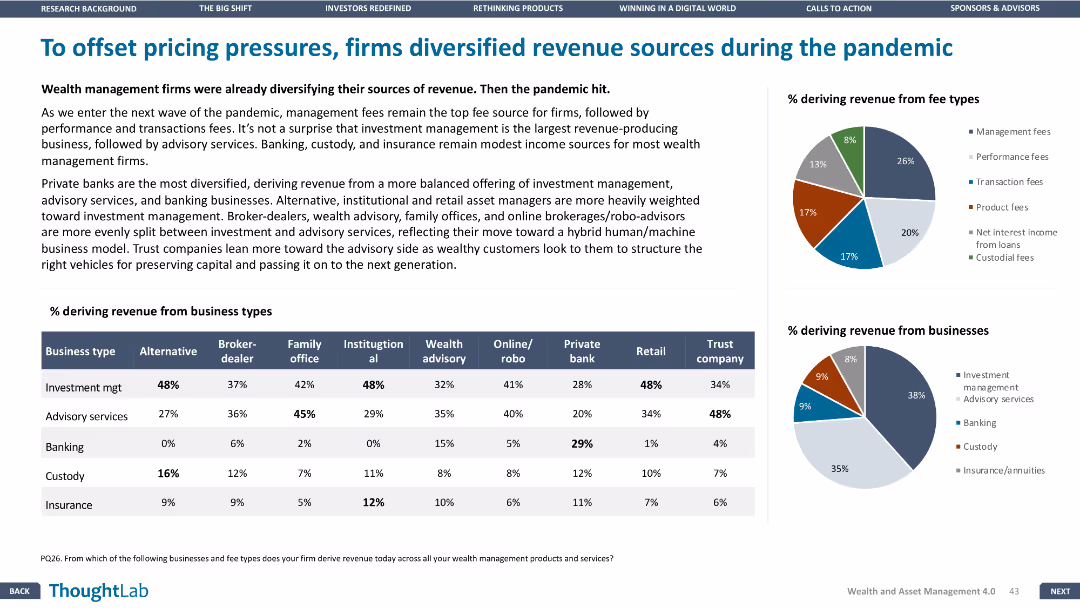
This slide has a column chart, pie charts, and a table. The layout is dense with multiple visual elements and minimal white space.
Strategic Planning
Financial Services
The slide discusses how wealth management firms diversified their revenue sources during the pandemic, with data showing the percentage of revenue from different business types and fee types.
Revenue, diversification, pandemic, wealth management, business types, fee types
Multiple Chart
Deloitte
Saved
The slide contains a column chart showing market concentration levels across different access modes using an alternative approach, which considers outlet homepages within the last 5 steps and excludes subsequent visits. Annotations provided.
Market Analysis and Trends
Media & Entertainment
This slide examines market concentration levels (HHI) by access mode using an alternative approach that includes outlet homepages within the last 5 steps before reaching news articles and excludes subsequent visits, offering insights into media concentration.
Alternative Approach, Market Concentration, HHI, Column Chart, Access Mode
Single Chart
IPSOS
Saved
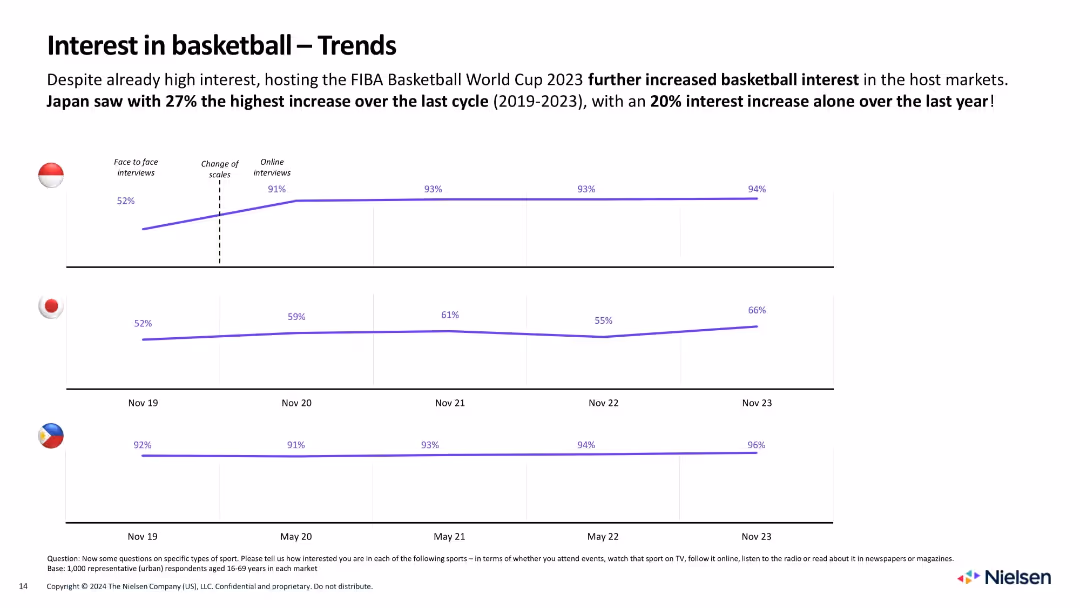
Time series line graphs for 3 countries showing change in basketball interest from 2019–2023
Market Analysis and Trends
Media & Entertainment
Tracks rising interest in basketball across Indonesia, Japan, and the Philippines. Japan had the highest 4-year growth at 27%, with 20% gain in 2023 alone.
trend, basketball, time series, Indonesia, Japan, Philippines, fan interest, growth, Nielsen, 2023
Single Chart
Nielsen
Saved
Previous
Next
If nothing, comes up, please save your slides first
Create a FREE account to continue browsing
Receive Instant Access to 1,000+ slides from companies like McKinsey, Google, and Goldman Sachs
First Name
Last Name
Email
Password
I agree to all
Terms & Privacy Policy
Thank you! Your submission has been received!
Oops! Something went wrong while submitting the form.
Have an account?
Sign in
Column Chart
Heatmap
Chevron
Org Chart
Infographic
Callouts
Timeline
List
Graphic
Picture
Process Flow
Diagram
Paragraph
Map
Table
Framework
Subtitle
Takeaway Box
Icon
Other Chart
Radar Chart
Waterfall Chart
Mekko Chart
Pie Chart
Scatter Plot
Line Chart
Bar chart
Bullet points