My Account
My Slides
Search by Category
Templates
View All Templates
Download Template Slides
✦ AI Search
Feedback
Login
Logout
Get Started
Browse all Slides
Browse all Slides
Create a FREE Account
Instant access to 1,000+ real slides from top companies like McKinsey, BCG, Goldman Sachs, Google and many more!
First Name
Last Name
Email
Password
I agree to all
Terms & Privacy Policy
Thank you! Your submission has been received!
Oops! Something went wrong while submitting the form.
Have an account?
Sign in
Saved Slides
The slide features a colorful index grid titled 'MGI Sector Digitization Index' comparing various sectors in terms of digital assets, usage, and labor. Accompanying the grid is a legend explaining the degree of digitization.
Market Analysis and Trends
Technology & Software
The slide provides an analysis of digitization levels across different sectors using an index that evaluates digital assets, usage, and labor. Each sector is color-coded to indicate its relative degree of digitization. This serves as a strategic tool to understand where digitization is most advanced and where there is potential for growth, aiding in decision-making for digital transformation initiatives.
Digitization Index, Sectors, Assets, Usage, Labor, ICT, Media, Finance, Manufacturing, Services, B2B, Technology Adoption
Mixed Chart
McKinsey
Saved
A structured layout with icons and bullet points, highlighting key financial opportunities and industry capabilities enabled by connectivity.
Investment Analysis
Telecommunications
Discusses the monetization opportunities and new capabilities for industries created by advanced connectivity.
Connectivity, Monetization, Industry, Telecom, B2B, Devices, IoT
Header Horizontal
McKinsey
Saved
Slide displays 4 critical management practices as icons with descriptions below each. Blue and black color scheme.
Organizational Structure and Change
Professional Services
Explains critical management practices for evaluating organizational health during transformation. Helps in management training.
transformation, management, health, practices, organizational
Linear Flow
McKinsey
Saved
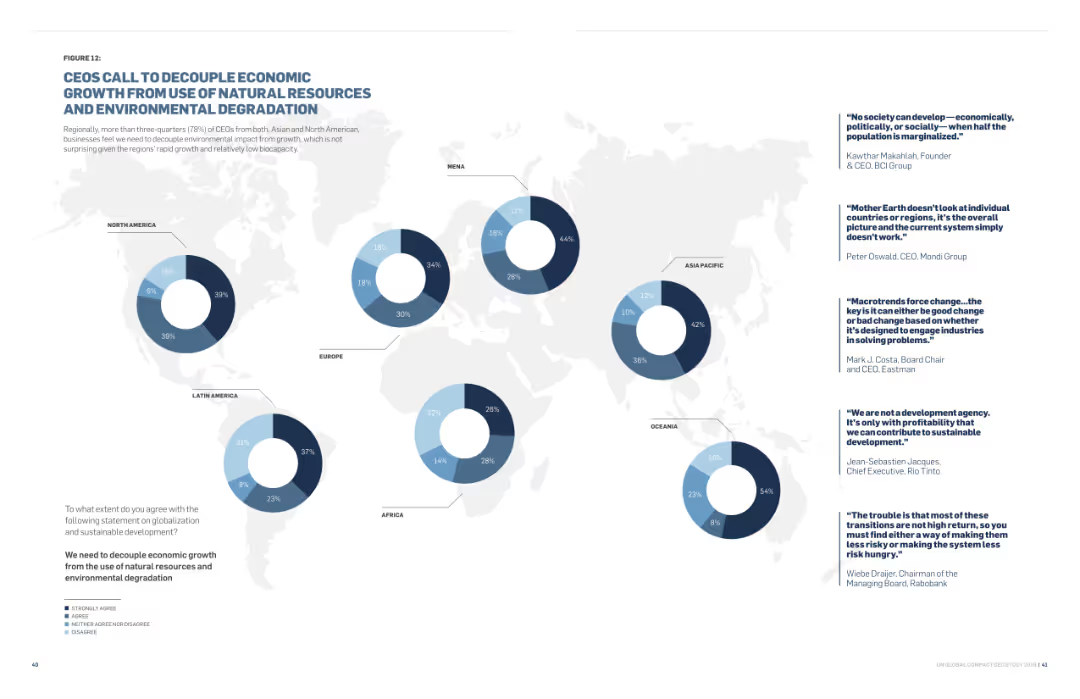
The slide features text and a world map with pie charts showing regional survey data. Quotes from various CEOs are also included.
Regulatory and Compliance
Environmental Services & Sustainability
This slide discusses CEOs' calls to decouple economic growth from environmental degradation, highlighting regional perspectives and CEO quotes on sustainability.
Economic Growth, Natural Resources, Environmental Degradation, Regional Data, Sustainability, CEOs
Multiple Chart
Accenture
Saved
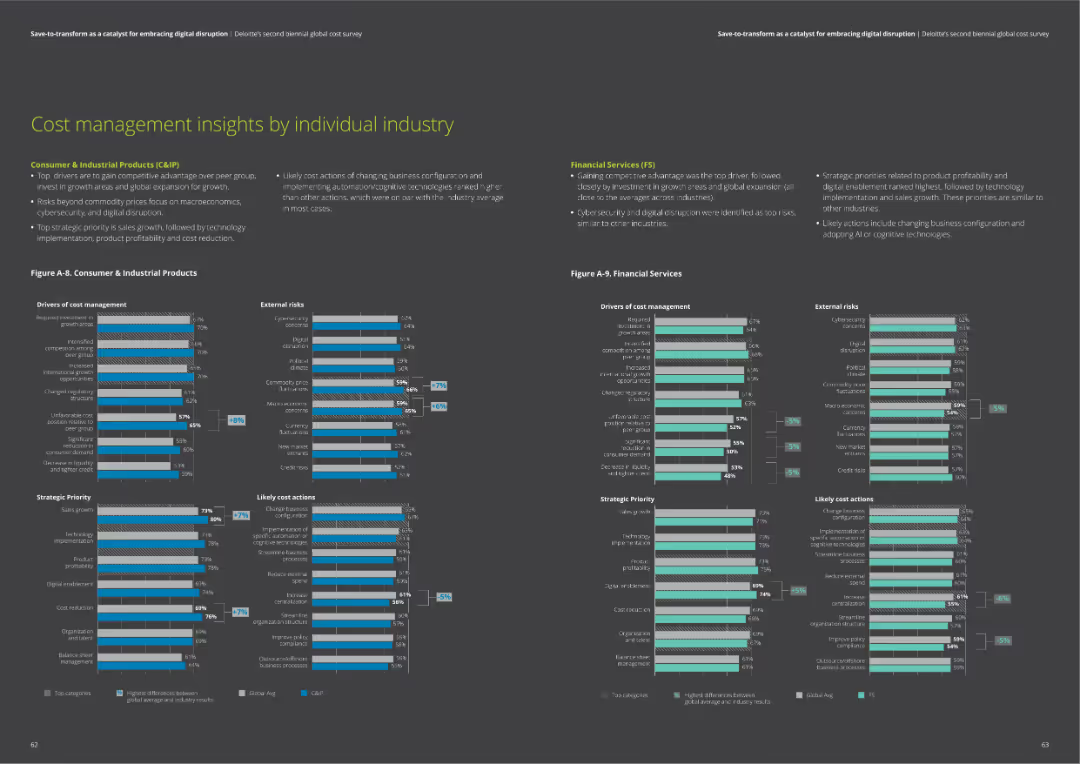
The slide contains two column charts comparing drivers of cost management, external risks, strategic priorities, and likely cost actions for Consumer & Industrial Products and Financial Services sectors.
Market Analysis and Trends
Financial Services
Insights on cost management, including drivers, risks, priorities, and actions for Consumer & Industrial Products and Financial Services. Helps understand industry-specific trends.
cost management, industry insights, risks, priorities, actions
Multiple Chart
Deloitte
Saved
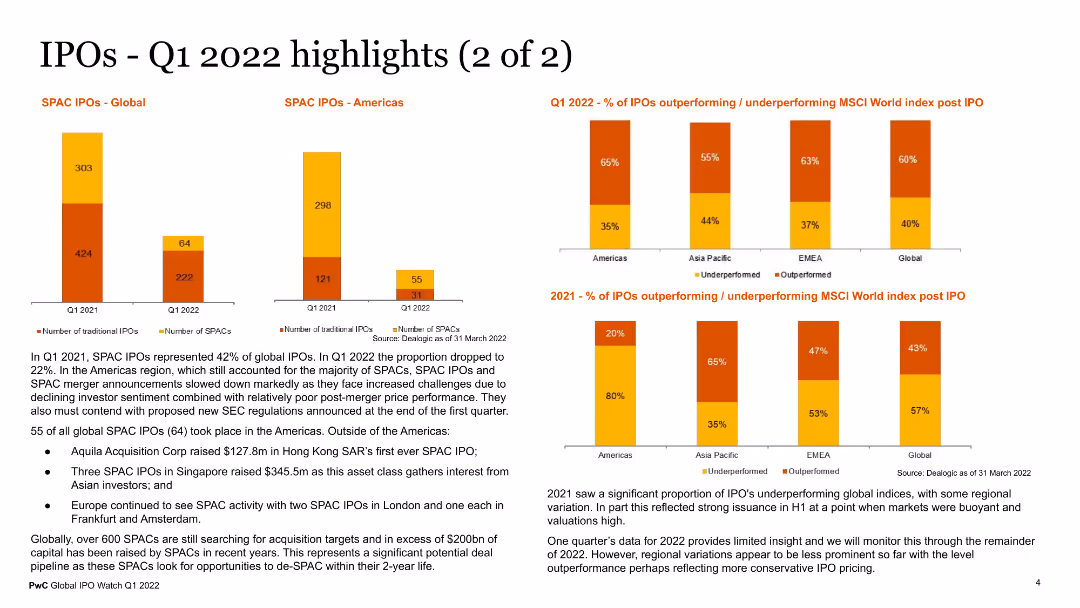
The slide includes visual elements such as a column chart for SPAC IPOs globally and in the Americas, and a bar chart showing the percentage of IPOs outperforming or underperforming MSCI World Index post IPO. The charts use different colors for clarity. Text sections provide additional context on SPAC activities and IPO performance trends.
Market Analysis and Trends
Financial Services
This slide provides additional highlights of IPO activities in Q1 2022, focusing on SPAC IPOs and performance metrics against the MSCI World Index. It offers insights into the performance and trends of SPACs and traditional IPOs, useful for financial analysts and investors.
SPAC IPOs, Q1 2022, IPO performance, MSCI World Index, financial trends
Multiple Chart
PwC/Strategy&
Saved
The slide features a column chart showing the liquidity coverage ratio over quarters and a doughnut chart displaying asset composition. The layout is balanced with clear labels and minimal text.
Financial Performance
Financial Services
This slide provides an overview of liquidity coverage ratios and the composition of high-quality liquid assets, highlighting key figures for 2Q23.
liquidity, coverage ratio, assets, financial, stability, UBS, 2Q23, high-quality, liquid, stress testing
Multiple Chart
UBS
Saved
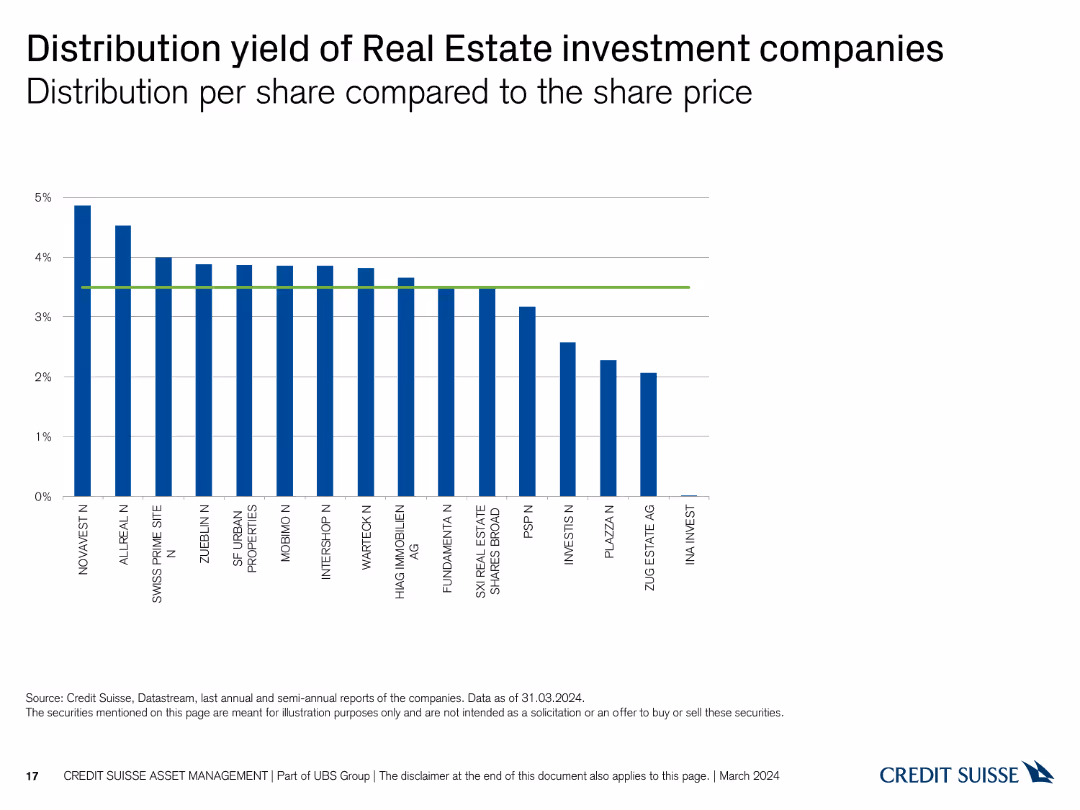
A column chart showing the distribution yield per share of various real estate investment companies. The X-axis lists companies, and the Y-axis represents distribution yield percentages up to 5%.
Financial Performance
Real Estate & Construction
This slide compares the distribution yield per share across different real estate investment companies, highlighting those with the highest and lowest yields.
distribution, yield, real estate, investment, companies, comparison, financial, performance, yield percentage, analysis
Single Chart
Credit Suisse
Saved
Comprises bullet points with accompanying icons describing characteristics of future organizational models designed for efficiency and adaptability.
Organizational Structure and Change
Professional Services
Discusses the evolution of organizational structures that prioritize speed, flexibility, and cross-functional collaboration to adapt to rapidly changing markets.
organizational change, flexibility, speed, adaptability, structure
Header Horizontal
McKinsey
Saved
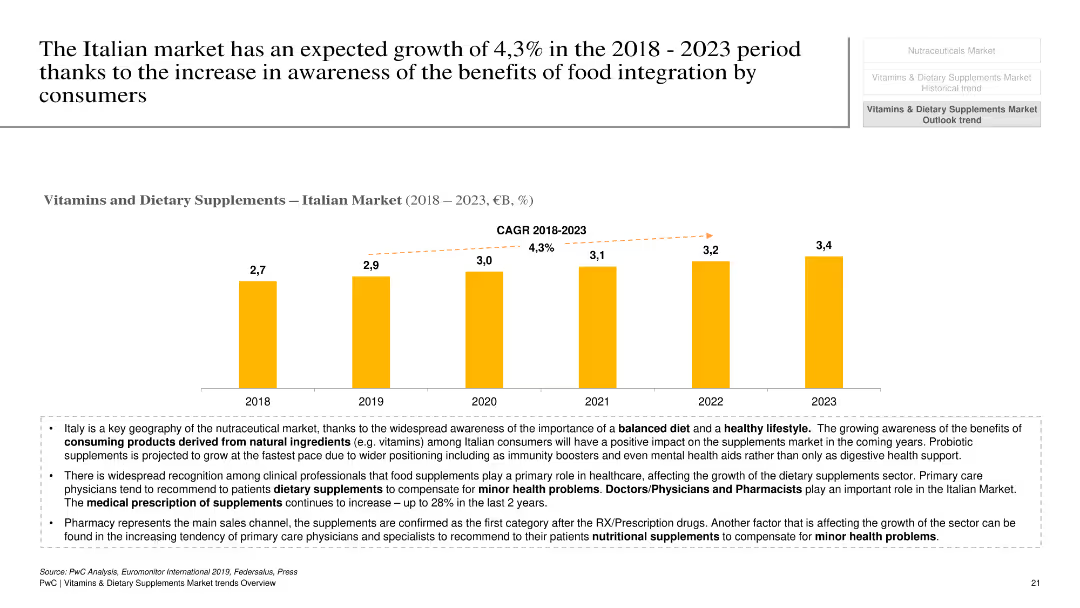
This slide features a column chart showing the growth of the Italian vitamins and dietary supplements market from 2018 to 2023, with a projected CAGR of 4.3%. Text boxes below the chart provide additional context and factors driving this growth.
Market Analysis and Trends
Healthcare & Pharmaceuticals
The slide presents the growth forecast for the Italian market for vitamins and dietary supplements, highlighting the projected CAGR and key factors contributing to this growth. It emphasizes the impact of increased consumer awareness and the role of healthcare professionals in recommending supplements.
Italian market, vitamins, dietary supplements, growth forecast, consumer awareness
Mixed Chart
PwC/Strategy&
Saved
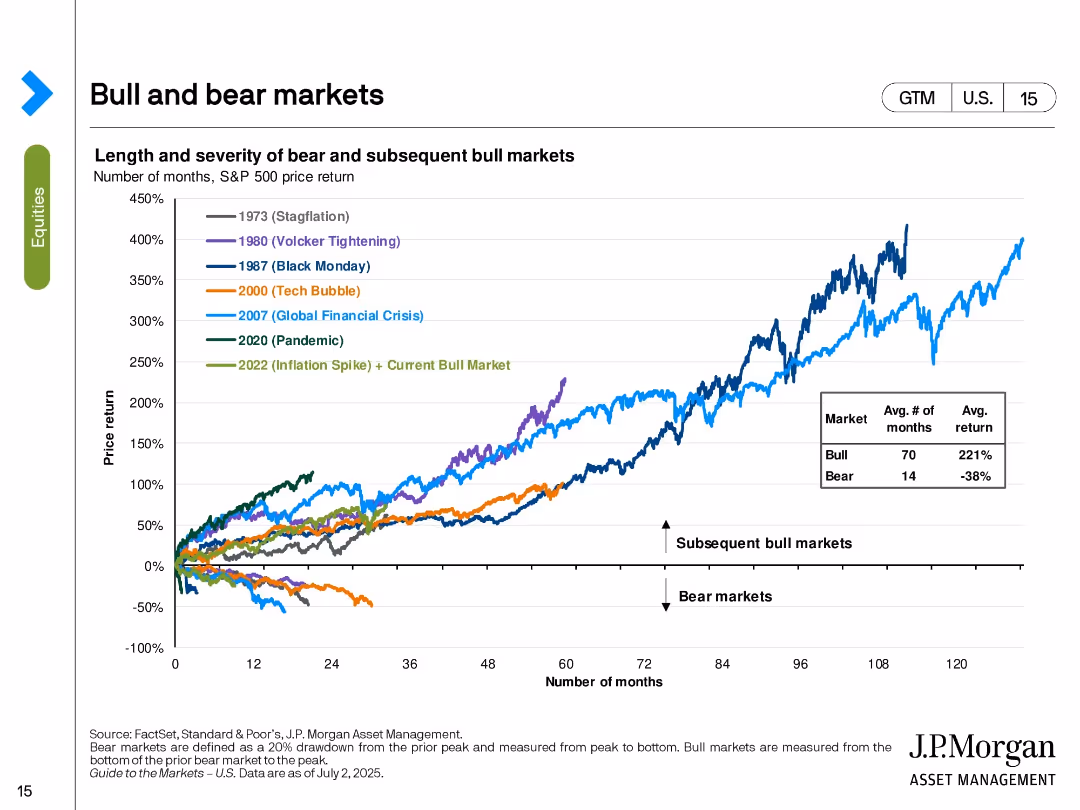
Line chart tracking the S&P 500’s performance in various historical bull and bear markets. Color-coded by major economic events.
Strategic Planning
Financial Services
The slide shows the price return trajectories of the S&P 500 in different market cycles including stagflation, tech bubble, GFC, and pandemic. It contrasts the length and return of bear vs. bull markets, with bull markets averaging 70 months and 221% return. The current bull market (since 2022) is included.
bull markets, bear markets, S&P 500, historical returns, market cycles, investment strategy, macroeconomic events, recovery
Single Chart
JP Morgan
Saved
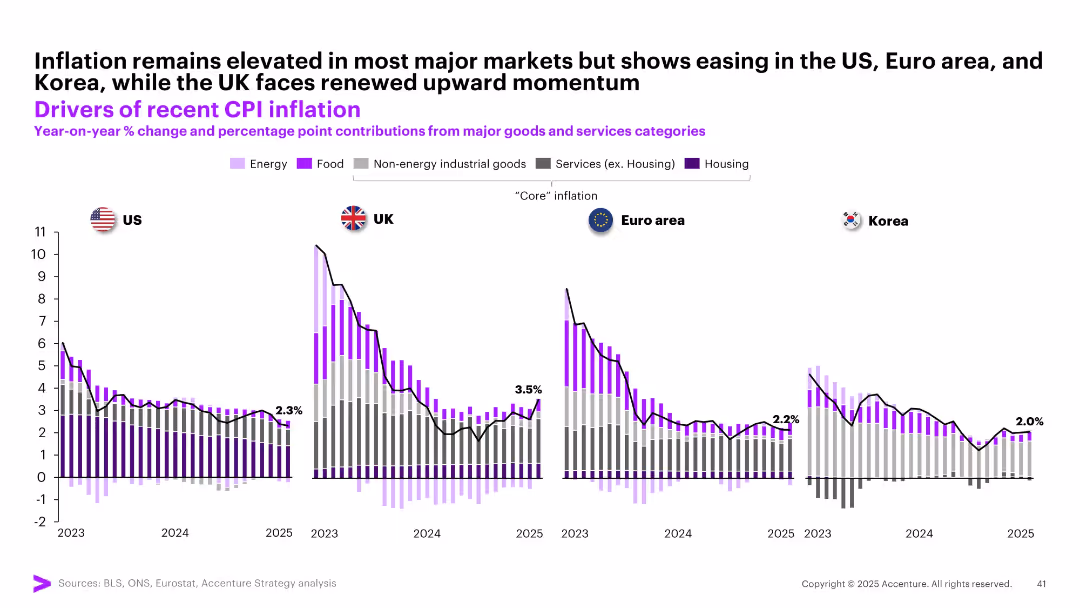
Four-panel comparative bar chart with overlaid trend lines; country flags as labels (US, UK, Euro area, Korea); stacked bars with colors
Market Analysis and Trends
Financial Services
This slide shows year-on-year CPI inflation across the US, UK, Euro area, and Korea from 2023 to 2025. It breaks down contributions to inflation by category (e.g., energy, food, services) and shows easing trends in most regions except the UK, which faces renewed inflationary pressures.
CPI, inflation, US, UK, Korea, Euro area, food, energy, services, core inflation
Multiple Chart
Accenture
Saved
This slide includes flow diagrams, a column chart, and textual explanations to describe the factors influencing system-wide deposit levels and their interaction.
Financial Performance
Financial Services
It illustrates the impact of quantitative tightening and the reverse repurchase agreement operations on deposit levels, along with customer behavior patterns.
quantitative tightening, deposit levels, reverse repurchase agreements, customer behavior, flow diagram, column chart, financial system
Mixed Chart
JP Morgan
Saved
Contains a world map color-coded to show levels of water scarcity by country, ranging from abundant water resources to severe scarcity.
Regulatory and Compliance
Environmental Services & Sustainability
Provides a global view of water scarcity, helping in understanding geographical disparities in water availability. This slide is essential for discussions on water management policies and international aid allocation.
water scarcity, global, resources, policy, management
Graphic
Roland Berger
Saved
Contains two column charts detailing the impact of increased solar penetration on electricity generation and GHG emissions from household fuel generators. Each chart is complemented by annotations and a decrease marker, highlighting the reductions in emissions and fuel usage.
Regulatory and Compliance
Energy & Utilities
This slide quantifies the impact of solar adoption on reducing reliance on household fuel generators in Nigeria by 2030. It demonstrates a notable decrease in both electricity generated from these generators and associated GHG emissions, underscoring solar's environmental and health benefits.
solar, impact, electricity, generators, GHG emissions, reduction, 2030, Nigeria, energy
Multiple Chart
BCG
Saved
Features bar graphs depicting reasons for not reporting workplace behaviors, complemented by a circular design element that frames the right side of the slide.
Risk Assessment and Management
Professional Services
Discusses perceptions of microaggressions' seriousness and their impact on reporting behaviors. This slide is pertinent for analyzing the psychological barriers to reporting workplace issues and could be used in diversity and inclusion training.
microaggressions, seriousness, reporting, HR
Table
Deloitte
Saved
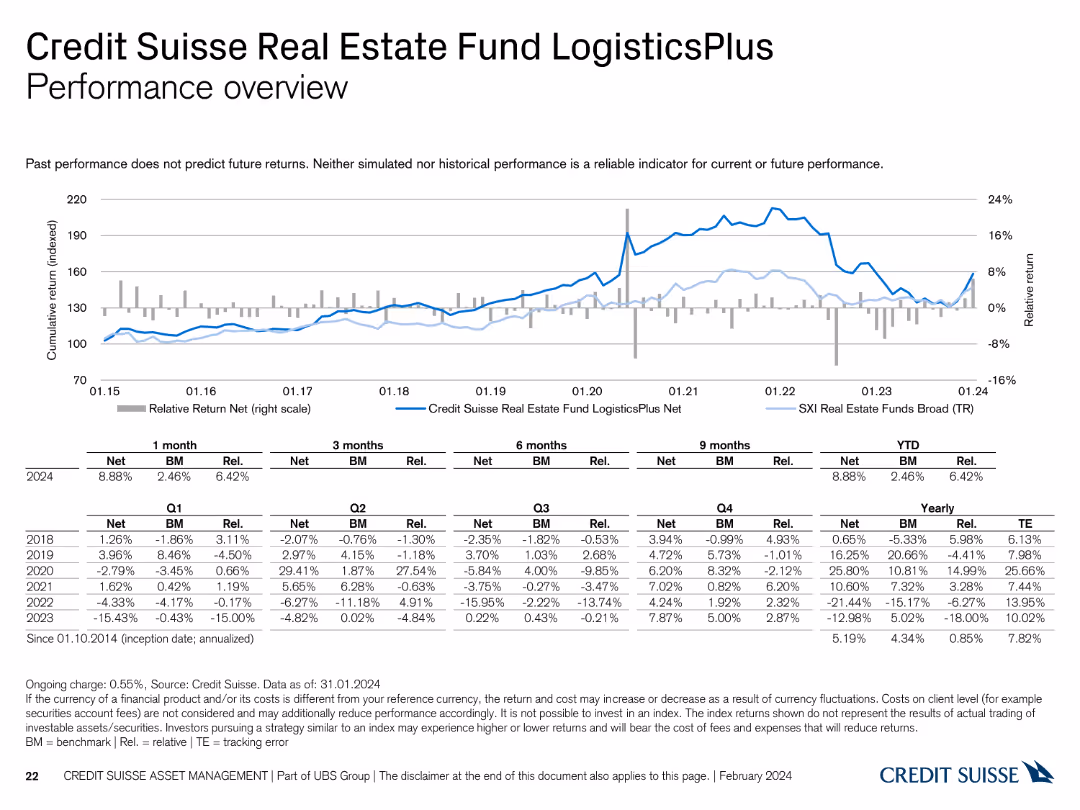
This slide features a line chart and a table summarizing the performance of the Credit Suisse Real Estate Fund LogisticsPlus.
Financial Performance
Financial Services
It reviews the performance of the LogisticsPlus fund, highlighting its returns and comparison with benchmarks and historical trends.
performance, Credit Suisse, Real Estate Fund, LogisticsPlus, benchmarks
Mixed Chart
Credit Suisse
Saved
This slide presents multiple bar charts depicting productivity improvements and cost savings in shared services. The layout balances text and graphical data effectively.
Operational Efficiency
Professional Services
Analyzes the annual productivity improvements and cost savings achieved through shared services, useful for evaluating operational efficiency and financial performance in organizational settings.
Shared services, productivity, cost savings, operational efficiency, financial performance
Multiple Chart
Deloitte
Saved
Compares AR and VR technologies, discussing current status and future requirements.
Technology and Digital Transformation
Technology & Software
Evaluates AR and VR's current technological capabilities and the significant advancements needed for widespread adoption.
augmented reality, virtual reality, technology development, immersive experience, industry application
Boxed
McKinsey
Saved
This slide contains column charts and infographics depicting the operational efficiencies achieved by investing in digitization and automation. The design is clean, with icons that help explain the concepts discussed, such as AI digital assistants and modernized operations platforms.
Operational Efficiency
Financial Services
Illustrates Barclays' efforts to improve operational efficiency through digital transformation and automation, detailing the impact on cost reduction and enhanced customer service.
operational efficiency, digitization, automation, cost reduction
Multiple Chart
Barclays
Saved
The slide includes a large image of the Chinese flag on the left, with text and a line graph on the right showing Chinese quarterly GDP growth rate. The layout is visually striking and data-focused.
Competitive Landscape
Industrial & Manufacturing
The slide outlines Ipsos' market strength in China, noting stability during COVID-19, the acquisition of Shanghai Focus RX, and the rebounding GDP growth in 2023.
China, market leader, GDP growth, acquisition, stability
Mixed Chart
IPSOS
Saved
Features a man with VR goggles next to a bar chart comparing the time taken by various banks to reach 1 million clients, and statistics on local vs. international expansion goals
Market Analysis and Trends
Financial Services
Discusses the impact of high valuations on startups' strategies, focusing on the aggressive expansion either locally or internationally
startups, valuations, expansion, VR, market
Mixed Chart
McKinsey
Saved
This slide includes a header, body text, and four circular percentage indicators. Each indicator represents reasons for switching to virtual consultations, such as prescription renewals, minor medical conditions, discussing test results, and saving time.
Technology and Digital Transformation
Healthcare & Pharmaceuticals
The slide highlights reasons why Irish consumers would switch to virtual consultations for minor medical matters. Key reasons include prescription renewals, convenience, discussing test results, and saving time on travel and waiting.
healthcare, virtual consultations, minor matters, Ireland, convenience
Mixed Chart
EY
Saved
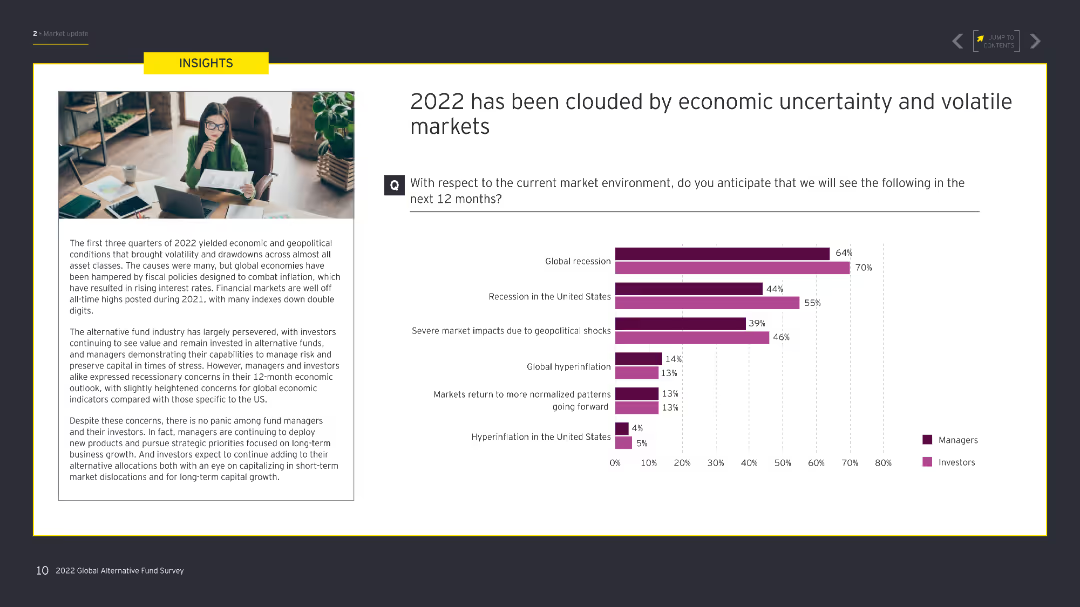
The slide contains a text box on the left detailing economic conditions, and on the right, a column chart with data comparing managers' and investors' expectations for various economic scenarios.
Risk Assessment and Management
Financial Services
This slide discusses the economic uncertainty and volatility in 2022, including expectations for recession, geopolitical shocks, and market normalization, segmented by managers and investors.
economic uncertainty, volatility, recession, market, managers, investors
Mixed Chart
EY
Saved
Slide contains multiple column charts comparing consumer valuation of autonomous vehicles before and after COVID-19 across several countries. Each country is represented with a flag and percentage changes are shown in blue and black columns.
Market Analysis and Trends
Technology & Software
This slide analyzes the shift in consumer values regarding autonomous vehicles due to the COVID-19 pandemic, highlighting significant regional differences and the impact on technology and transportation industries.
COVID-19, autonomous vehicles, consumer behavior, market analysis, technology, transportation
Single Chart
McKinsey
Saved
Previous
Next
If nothing, comes up, please save your slides first
Create a FREE account to continue browsing
Receive Instant Access to 1,000+ slides from companies like McKinsey, Google, and Goldman Sachs
First Name
Last Name
Email
Password
I agree to all
Terms & Privacy Policy
Thank you! Your submission has been received!
Oops! Something went wrong while submitting the form.
Have an account?
Sign in
Column Chart
Heatmap
Chevron
Org Chart
Infographic
Callouts
Timeline
List
Graphic
Picture
Process Flow
Diagram
Paragraph
Map
Table
Framework
Subtitle
Takeaway Box
Icon
Other Chart
Radar Chart
Waterfall Chart
Mekko Chart
Pie Chart
Scatter Plot
Line Chart
Bar chart
Bullet points