My Account
My Slides
Search by Category
Templates
View All Templates
Download Template Slides
✦ AI Search
Feedback
Login
Logout
Get Started
Browse all Slides
Browse all Slides
Create a FREE Account
Instant access to 1,000+ real slides from top companies like McKinsey, BCG, Goldman Sachs, Google and many more!
First Name
Last Name
Email
Password
I agree to all
Terms & Privacy Policy
Thank you! Your submission has been received!
Oops! Something went wrong while submitting the form.
Have an account?
Sign in
Saved Slides
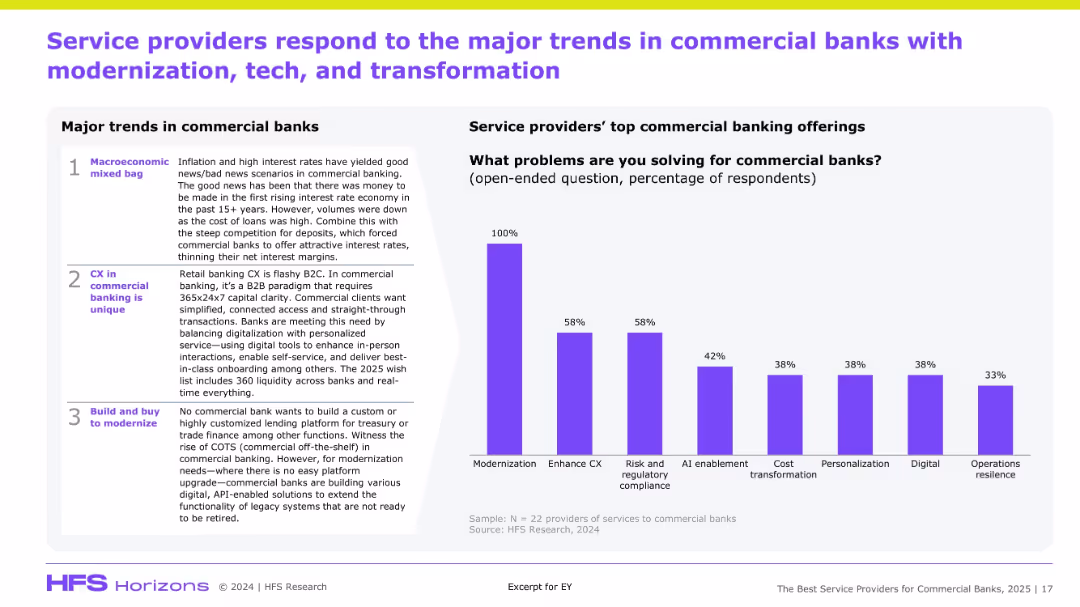
Two-column layout: left has major trends, right has a bar chart of service offerings; clean structured design with clear sectioning.
Market Analysis and Trends
Financial Services
This slide highlights the key commercial banking trends—macroeconomic conditions, unique CX needs, and modernization demands. The right-hand chart displays what banks expect from service providers, with modernization, CX enhancement, and regulatory compliance topping the list. The goal is to map demand signals from banks to vendor capabilities.
Commercial banks, modernization, CX, AI, compliance, vendor services
Mixed Chart
Accenture
Saved
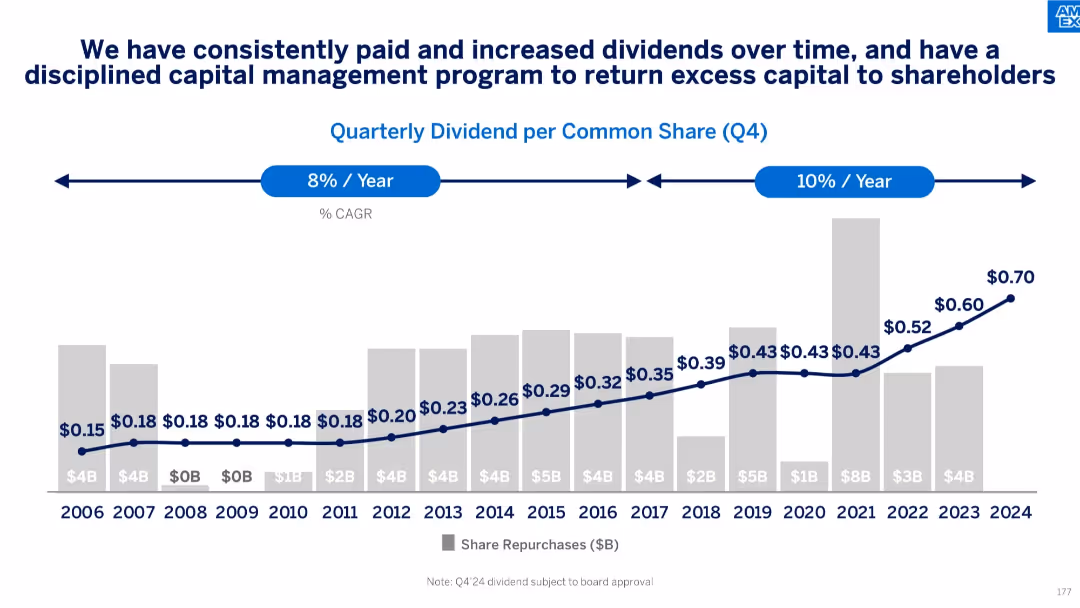
Bar and line chart showing quarterly dividend per share (Q4) and annual share repurchases from 2006–2024
Financial Performance
Financial Services
Depicts American Express’s long-term commitment to shareholder returns through growing dividends and consistent share repurchases. Shows CAGR trends for dividend growth, reflecting disciplined capital allocation.
dividends, capital return, shareholder value, share repurchases, dividend growth, financial strategy
Single Chart
McKinsey
Saved
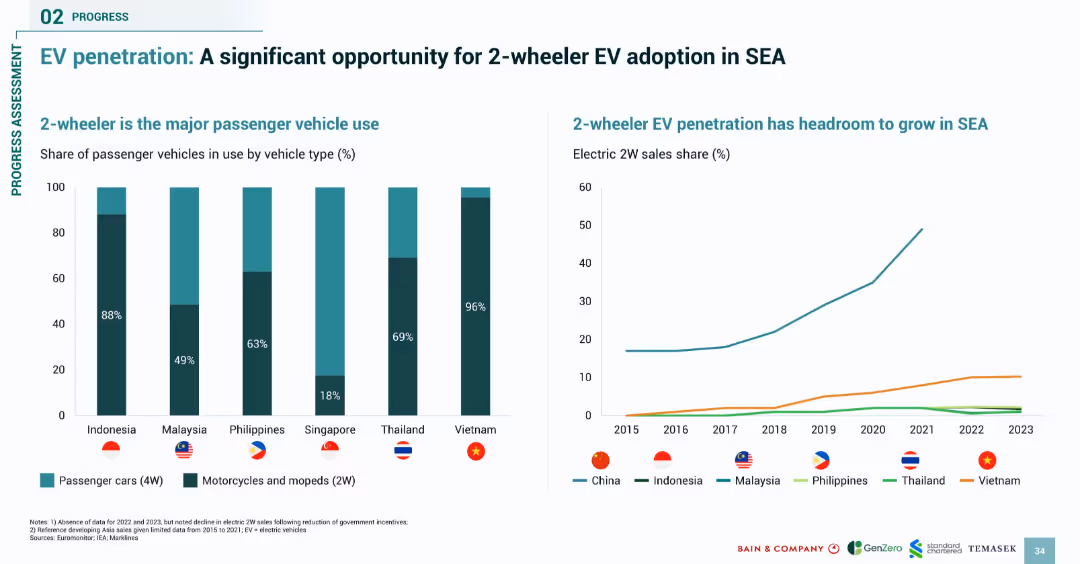
Dual-chart slide with a bar chart (vehicle type usage) and line chart (2W EV sales); clean modern layout
Market Analysis and Trends
Transportation & Logistics
This slide illustrates the dominance of 2-wheelers in Southeast Asia and the growth opportunity for 2W EVs. It compares current vehicle types in use and trends in 2W EV penetration, noting that countries like Vietnam have seen strong adoption compared to others.
2-wheeler, EV adoption, SEA, motorbikes, e-mobility, passenger vehicle use, electric scooters
Multiple Chart
Bain
Saved
This slide features a complex line graph tracing global CO2 emissions against time, with annotations indicating various future scenario projections. It uses shades of blue and red to distinguish the trajectories, with additional text boxes for context.
Industry Overview
Environmental Services & Sustainability
The slide provides an outlook on global CO2 emissions, juxtaposing historical data with projections based on different scenarios. It discusses the implications of current commitments on global warming and the disparities in achieving a 1.5°C pathway.
CO2 Emissions, Global Trends, Net-Zero, Climate Change, Scenarios, Historical Data, 2050 Outlook, 1.5°C Pathway
Mixed Chart
McKinsey
Saved
Bar chart compares the prevalence of CDO roles by digital maturity of the organization.
Organizational Structure and Change
Technology & Software
Examines the trend of appointing Chief Digital Officers in companies at different stages of digital maturity.
CDO, digital transformation, digital maturity, leadership roles, organizational change
Multiple Chart
BCG
Saved
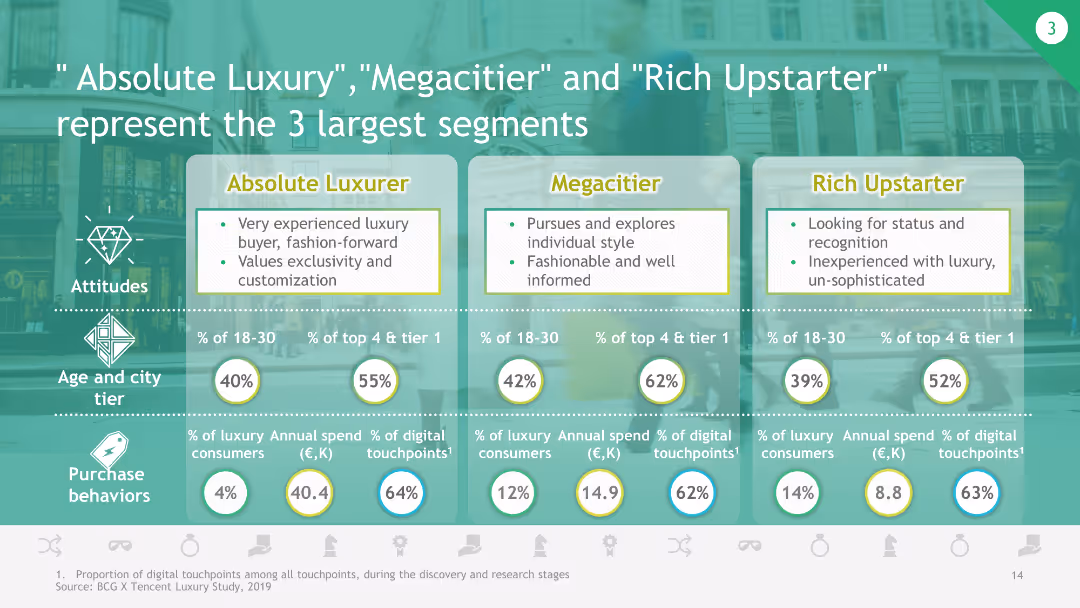
The slide uses a comparative layout to describe the attitudes, age and city tier distribution, and purchase behaviors of the three largest luxury consumer segments.
Customer and Market Segmentation
Consumer Goods
This slide highlights the three largest luxury consumer segments in China, detailing their characteristics, age distribution, city tier, and purchase behaviors.
luxury segments, consumer behavior, China market, age distribution, purchase behavior
Table
BCG
Saved
The slide includes a vertical column chart showing the number of apprentices organizations typically host per year, segmented into five categories. A separate horizontal bar chart shows the types of support services apprentices receive, with four categories.
Human Resources and Talent Management
Professional Services
The slide highlights that organizations leveraging apprenticeships typically host between 11 and 30 apprentices per year. It also shows the support services provided to apprentices, such as mentorship, employability training, career counseling, and mental health services.
apprenticeships, support services, mentorship, training, career counseling, mental health
Multiple Chart
Accenture
Saved
This slide features a series of column charts comparing the duration of purchase delays in various countries (US, UK, Germany, France, Italy, China, Japan). Each chart is segmented by months.
Market Analysis and Trends
Transportation & Logistics
This slide analyzes the stabilization of purchase delays in various international markets, highlighting trends and changes in consumer behavior over several months.
purchase delays, market analysis, column chart, international, consumer trends
Multiple Chart
McKinsey
Saved
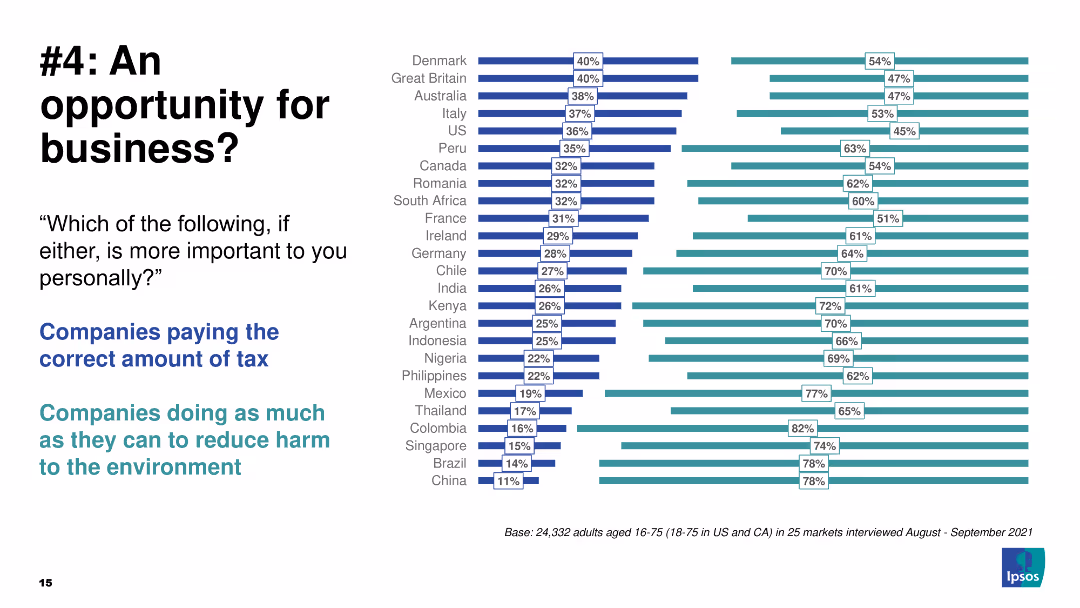
Comparative column chart highlighting the importance of tax payment vs environmental harm reduction.
Strategic Planning
Environmental Services & Sustainability
The slide compares the importance of companies paying taxes vs reducing environmental harm.
business, opportunity, taxes, environment, global
Multiple Chart
IPSOS
Saved
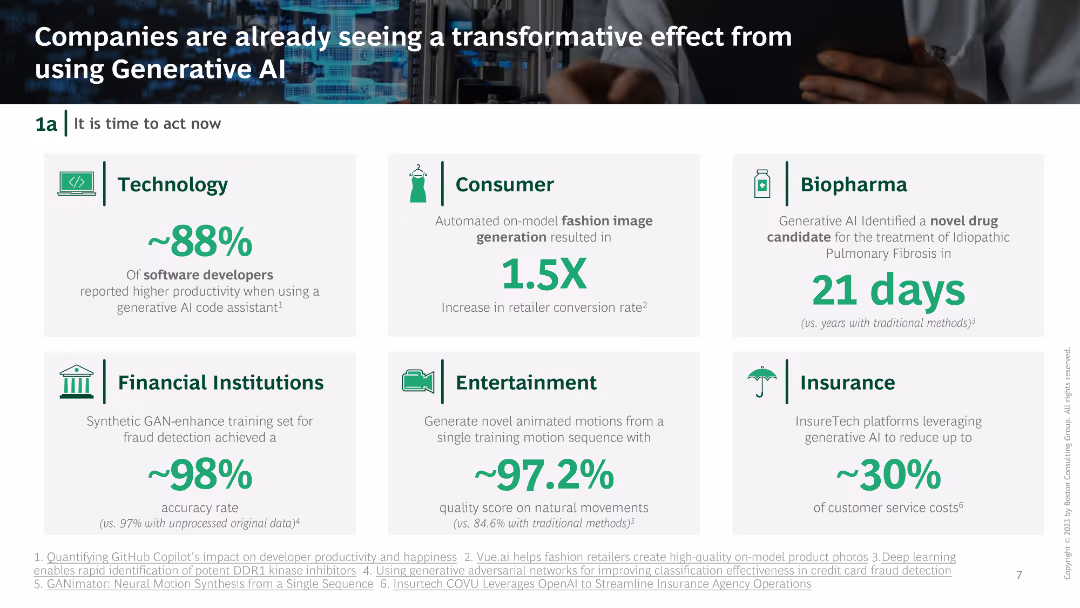
Grid layout with icons and statistics for different industries: Technology, Consumer, Biopharma, Financial Institutions, Entertainment, Insurance.
Performance Metrics and KPIs
Technology & Software
The slide highlights the transformative impact of Generative AI across various sectors, presenting key metrics and improvements reported by companies.
Generative AI, Transformation, Industry impact, Key metrics, Statistics
Table
BCG
Saved
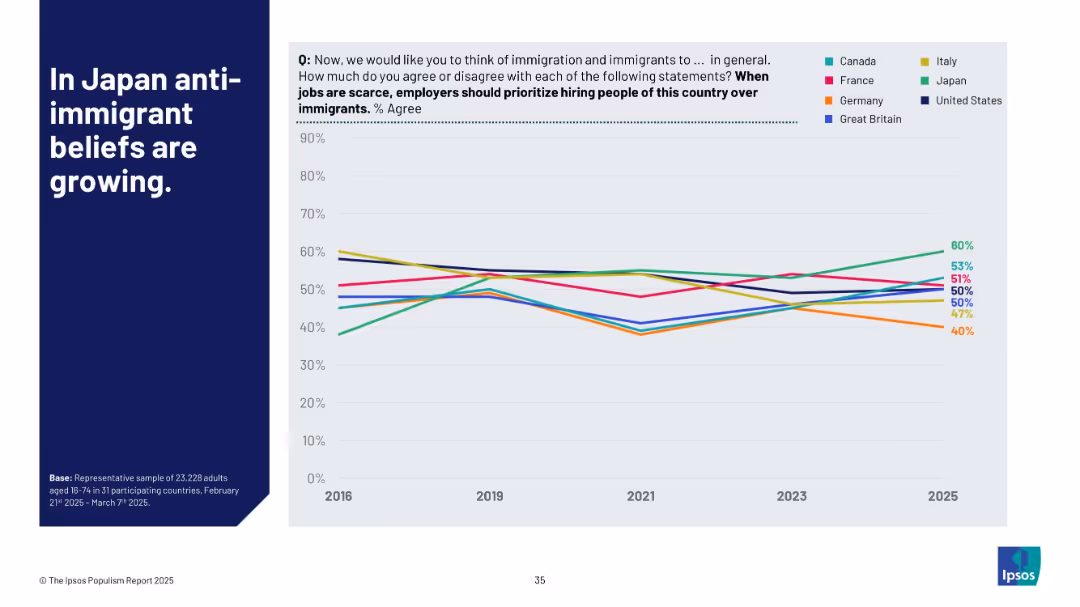
Line chart showing % agreement over time (2016–2025) by country; countries are color-coded; bold title on left in blue block
Market Analysis and Trends
Government & Public Sector
This slide highlights the increasing percentage of people in Japan who believe locals should be prioritized over immigrants during job shortages. It compares this belief across G7 countries from 2016 to 2025, showing Japan's notable upward trend while others remain steady or decline.
anti-immigrant, Japan, G7 countries, job scarcity, trends, Ipsos, belief tracking, nationalism, workforce, timeline analysis
Mixed Chart
IPSOS
Saved
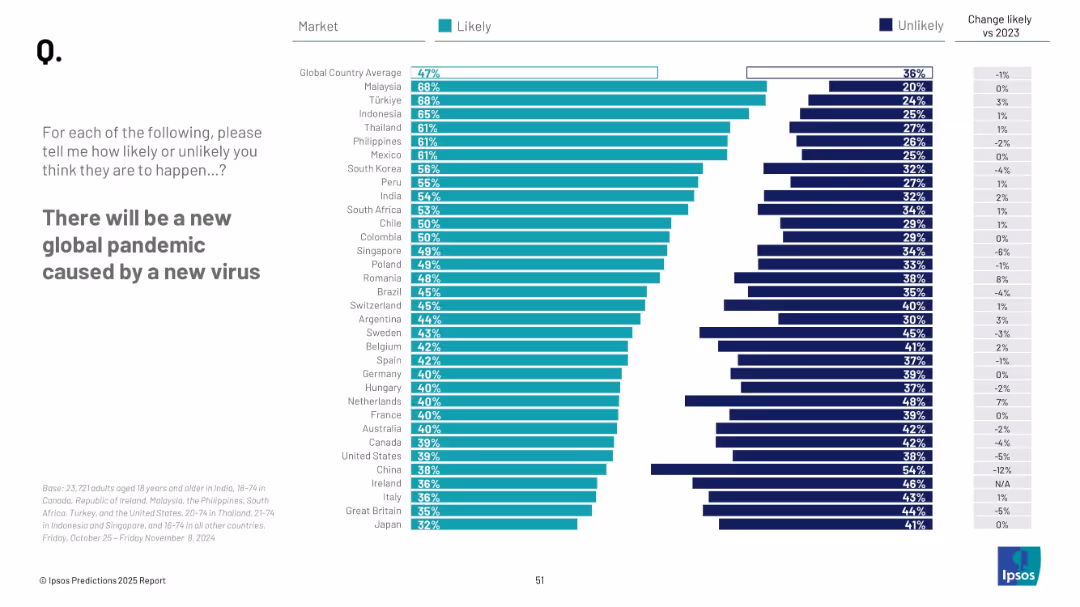
Horizontal bar chart with teal and navy bars; countries listed vertically with likelihood percentages; minimalistic layout
Market Analysis and Trends
Healthcare & Pharmaceuticals
The slide presents survey data on public perception of the likelihood of a new global pandemic. It ranks countries by the percentage of respondents who believe another pandemic is likely, and compares this to previous year data.
pandemic, global risk, public opinion, health crisis, virus, likelihood, survey, international, perception, 2025
Mixed Chart
IPSOS
Saved
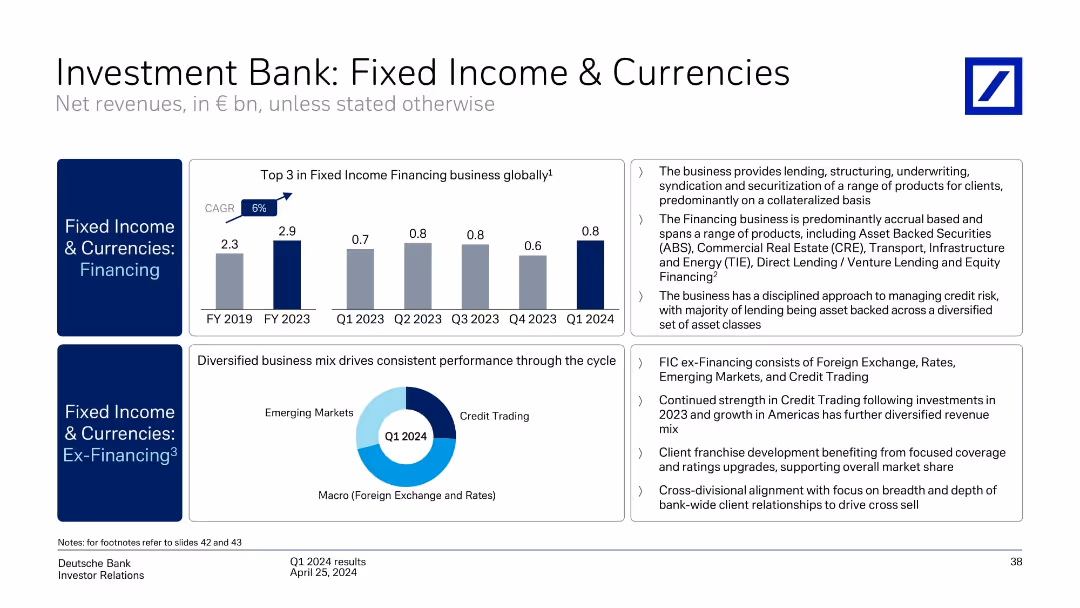
Split layout with two blue sidebar sections, bar chart on top left, donut chart on bottom center, text boxes on the right side.
Performance Metrics and KPIs
Financial Services
The slide presents financial performance for Deutsche Bank’s Fixed Income & Currencies division, showing growth in financing revenue (CAGR 6%) and diversified revenue in ex-Financing segments. Text explains business structure and strategic priorities.
Fixed Income, Currencies, Credit Trading, Revenue, Q1 2024, KPIs, Financing, Performance, Macro, Risk Management
Multiple Chart
Deutsche Bank
Saved
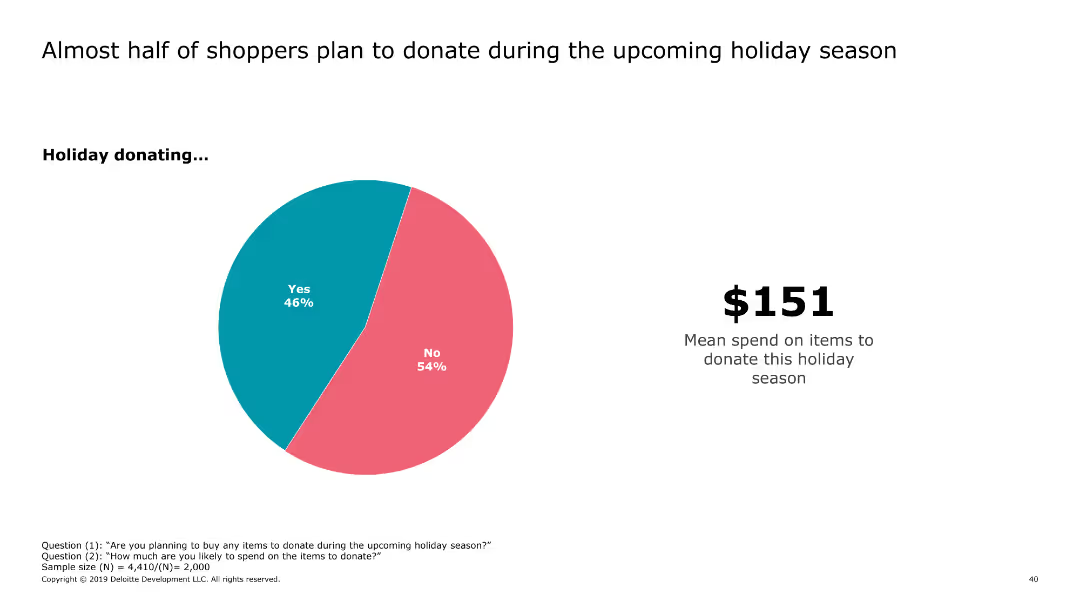
This slide includes a pie chart showing the percentage of shoppers planning to donate during the holiday season, accompanied by text indicating the mean spend on donations.
Market Analysis and Trends
Retail & E-commerce
It presents data on the proportion of shoppers intending to donate during the holiday season and the average amount they plan to spend on donations.
donations, holiday, shoppers, spend, mean
Mixed Chart
Deloitte
Saved
Bar chart showing division of tasks likely to be carried out remotely versus onsite. Colors used are yellow and gray, with a clear division between remote and onsite activities.
Strategic Planning
Real Estate & Construction
Analyzes which business tasks will remain onsite versus becoming remote, highlighting strategic and creative tasks staying onsite while routine tasks move remote.
Strategic Activities, Teamwork, Creative Tasks, Onsite, Remote, Business, Management, Delivery, Division
Linear Flow
EY
Saved
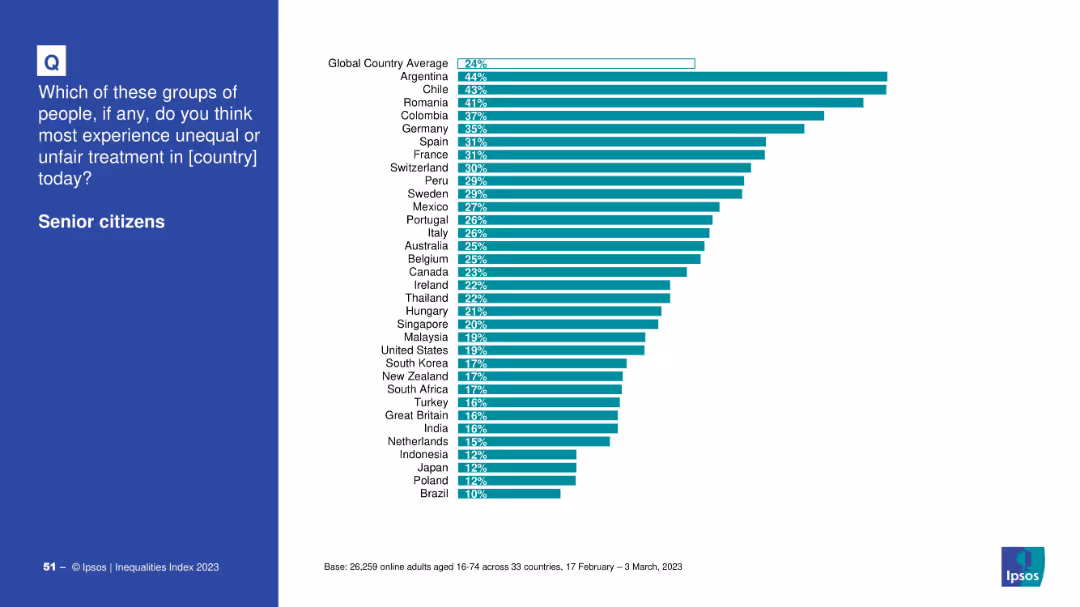
Country comparison bar chart on white background with global average line
Market Analysis and Trends
Government & Public Sector
This slide highlights the perceived inequality faced by senior citizens in various countries. Argentina, Chile, and Romania top the list, while Brazil and Poland are at the bottom. The global average perception is 24%.
aging, senior citizens, inequality, country ranking, Ipsos, discrimination, public perception, 2023
Mixed Chart
IPSOS
Saved
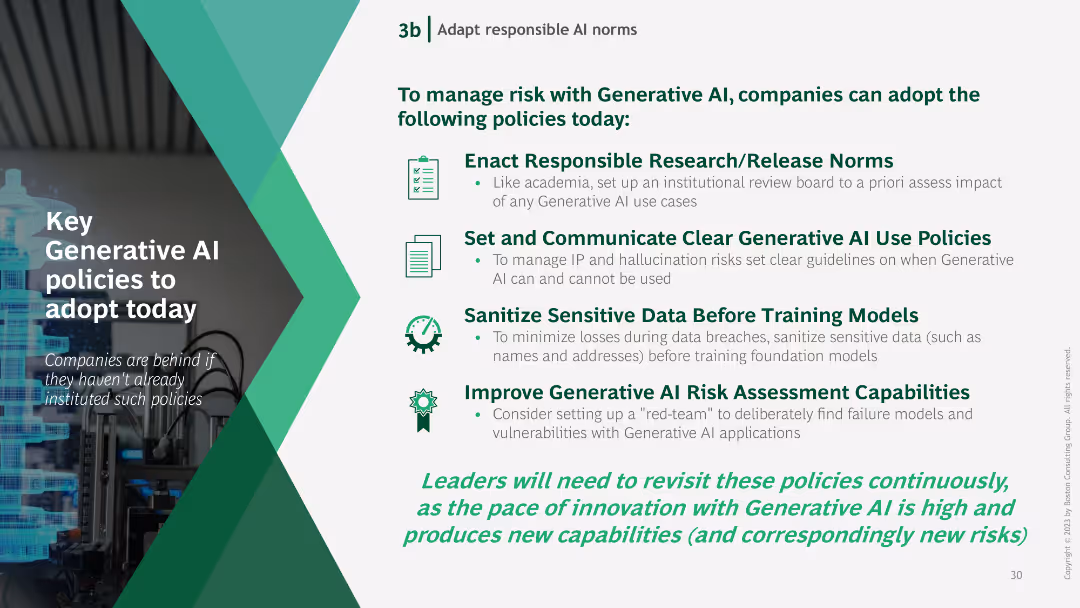
Text-based slide with bullet points outlining key policies for managing Generative AI risks, accompanied by icons representing each policy.
Regulatory and Compliance
Technology & Software
The slide lists essential policies for managing Generative AI risks, including responsible research norms, clear use policies, data sanitization, and risk assessment improvements.
Generative AI, policies, risk management, research norms, data sanitization
Vertical Flow
BCG
Saved
Slide features column charts comparing the revenue from fees and net interest income between 2017 and 2021, alongside strategic focus areas for the payments business.
Financial Performance
Financial Services
Details the growth of JP Morgan's payments business, focusing on revenue improvements from 2017 to 2021. It highlights strategic areas such as treasury services and technology investments that contribute to their position as a leading payments provider, demonstrating effective financial and operational management.
payments, revenue growth, strategy
Mixed Chart
JP Morgan
Saved
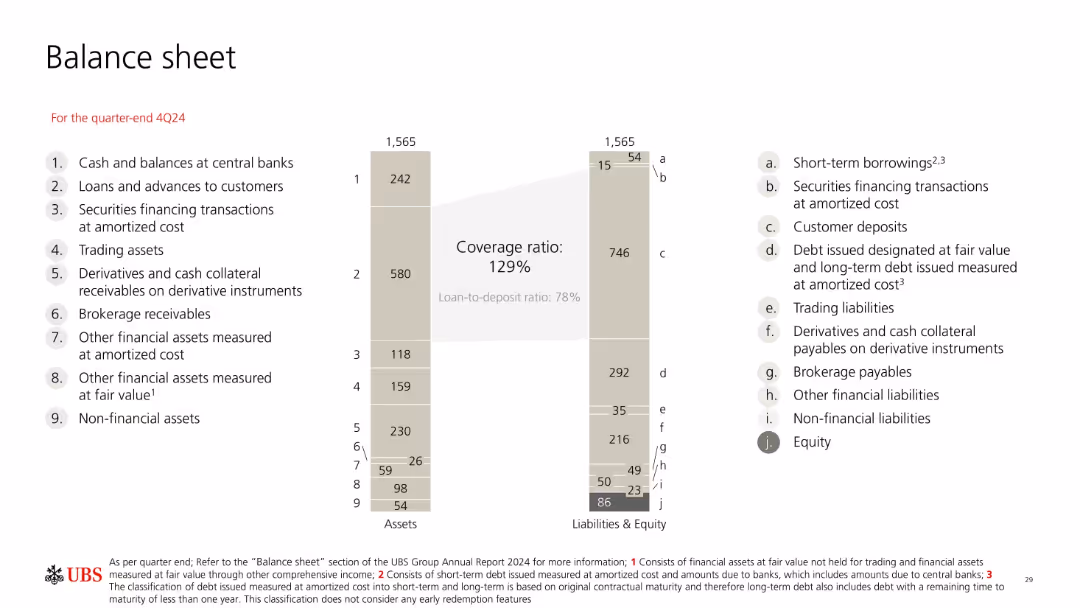
Mirror-style bar chart showing total assets vs. liabilities & equity at 4Q24. Each item is labeled numerically and alphabetically. Central emphasis on deposit-to-loan coverage ratio.
Financial Performance
Financial Services
Presents a balanced snapshot of UBS’s 4Q24 balance sheet totaling 1,565bn, with detailed breakdowns of both asset and liability categories. Emphasizes customer deposits, debt, and equity levels with associated ratios like coverage and loan-to-deposit.
assets, liabilities, balance sheet, equity, debt, deposits, UBS
Mixed Chart
UBS
Saved
The slide contains an explanatory text about the survey, a world map showing survey participant locations, and pie charts representing company sizes and sectors.
Market Analysis and Trends
Professional Services
Overview of the survey methodology, participant demographics, and data collection timeline.
Survey, methodology, demographics, data collection, participant locations
Mixed Chart
EY
Saved
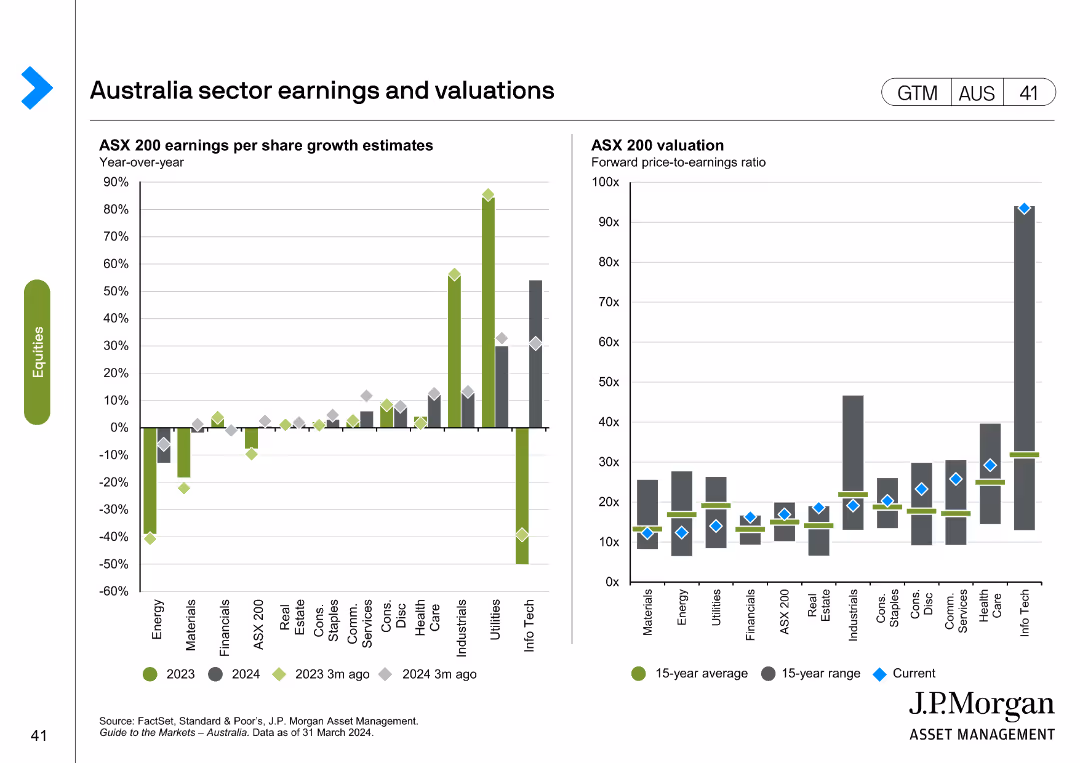
The slide contains two charts: a column chart on ASX 200 earnings per share growth estimates, and a line chart on ASX 200 valuation forward price-to-earnings ratio.
Financial Performance
Financial Services
Provides sector-specific earnings and valuation metrics for the Australian market, focusing on growth estimates and P/E ratios, useful for financial performance analysis.
Australia, sector earnings, valuations, ASX 200, growth estimates
Multiple Chart
JP Morgan
Saved
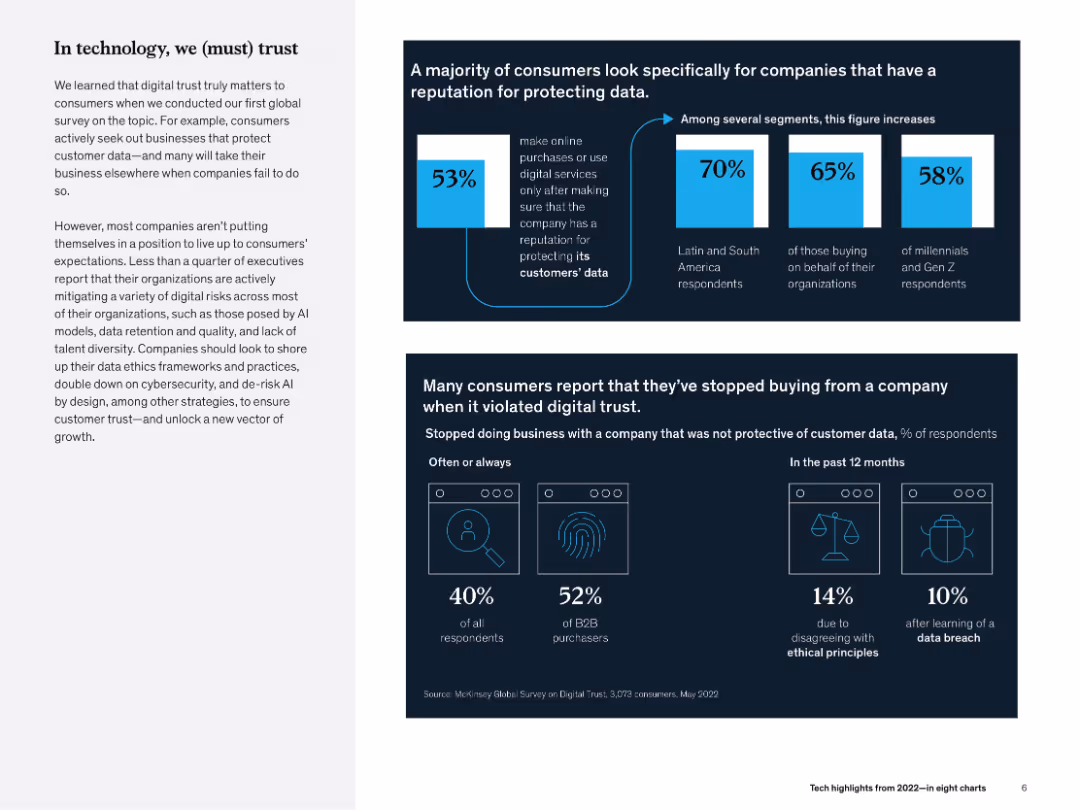
Dual-section layout: Top has a large stat box and bar comparisons; bottom has icons and text-based consumer behavior metrics.
Regulatory and Compliance
Technology & Software
The slide emphasizes the importance of digital trust, showing that many consumers stop buying from companies lacking data protection. Visuals display consumer responses across regions and behaviors linked to trust violations.
digital trust, consumer behavior, cybersecurity, ethics, McKinsey, data protection, customer loyalty
Mixed Chart
McKinsey
Saved
Multiple bubble charts and graphs with annotations, a large header, and a footnotes section, against a purple background.
Product and Service Analysis
Technology & Software
Illustrates how online entertainment has become a significant leisure activity, especially post-COVID-19, with an increase in time spent on streaming and gaming.
online entertainment, COVID-19 impact, leisure activities, streaming, gaming, social media, user trends, time allocation
Multiple Chart
Accenture
Saved
Similar to slide 3613, it has updated information in its tables of balance sheet data, visualizing book value distribution, in a clean blue and gray layout.
Financial Performance
Financial Services
Provides a current snapshot of the company's capital and balance sheet, useful for financial analysis sessions or presentations to investors concerning the company's capital structure and liquidity.
Capital Structure, Balance Sheet, Liquidity, Valuation
Table
Goldman Sachs
Saved
Contains two overlapping line graphs tracking the rate changes over time, complemented by a column chart for annual data. The layout is clean with a clear title.
Market Analysis and Trends
Financial Services
Evaluates insurance rate trends over an extended period, highlighting shifts in the market, with a focus on the direct Energy sector. Provides historical data to assess market conditions.
historical data, insurance rates, market analysis, energy sector, trends
Mixed Chart
PwC/Strategy&
Saved
Previous
Next
If nothing, comes up, please save your slides first
Create a FREE account to continue browsing
Receive Instant Access to 1,000+ slides from companies like McKinsey, Google, and Goldman Sachs
First Name
Last Name
Email
Password
I agree to all
Terms & Privacy Policy
Thank you! Your submission has been received!
Oops! Something went wrong while submitting the form.
Have an account?
Sign in
Column Chart
Heatmap
Chevron
Org Chart
Infographic
Callouts
Timeline
List
Graphic
Picture
Process Flow
Diagram
Paragraph
Map
Table
Framework
Subtitle
Takeaway Box
Icon
Other Chart
Radar Chart
Waterfall Chart
Mekko Chart
Pie Chart
Scatter Plot
Line Chart
Bar chart
Bullet points