My Account
My Slides
Search by Category
Templates
View All Templates
Download Template Slides
✦ AI Search
Feedback
Login
Logout
Get Started
Browse all Slides
Browse all Slides
Create a FREE Account
Instant access to 1,000+ real slides from top companies like McKinsey, BCG, Goldman Sachs, Google and many more!
First Name
Last Name
Email
Password
I agree to all
Terms & Privacy Policy
Thank you! Your submission has been received!
Oops! Something went wrong while submitting the form.
Have an account?
Sign in
Saved Slides
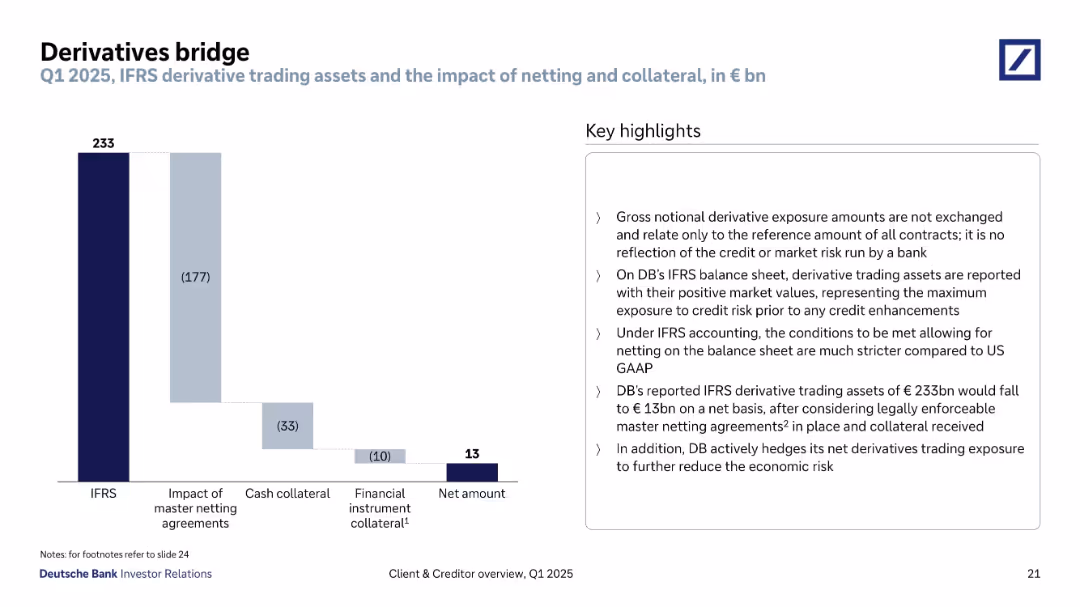
Waterfall chart showing IFRS gross to net amount reconciliation with right-aligned key highlights box. Clean layout with descending bars and annotations.
Risk Assessment and Management
Financial Services
Outlines Deutsche Bank’s derivative trading exposure under IFRS accounting rules. Highlights the effects of netting agreements and collateral on reducing the gross €233bn exposure to €13bn net, emphasizing reduced economic and credit risk.
derivatives, IFRS, netting, exposure, collateral, risk mitigation
Mixed Chart
Deutsche Bank
Saved
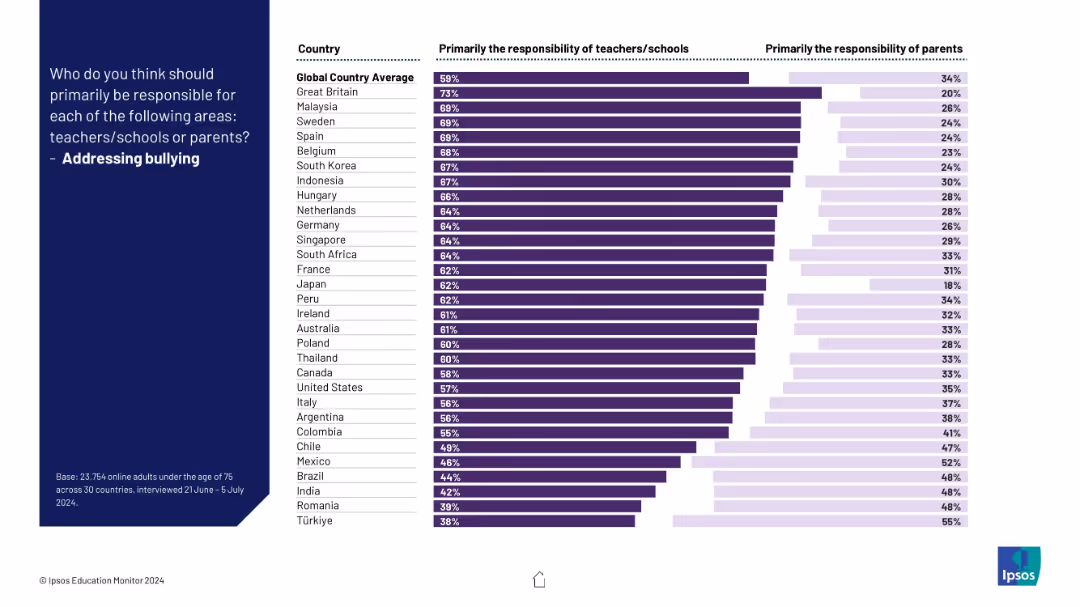
Bar chart contrasting opinions across countries on responsibility for tackling bullying; purple bars show division of roles.
Risk Assessment and Management
Education & Training
This slide assesses who is seen as responsible for addressing bullying in schools. Most countries favor institutional responsibility, though views differ significantly.
bullying, responsibility, schools, teachers, parents, children, survey, mental health, Ipsos, countries
Mixed Chart
IPSOS
Saved
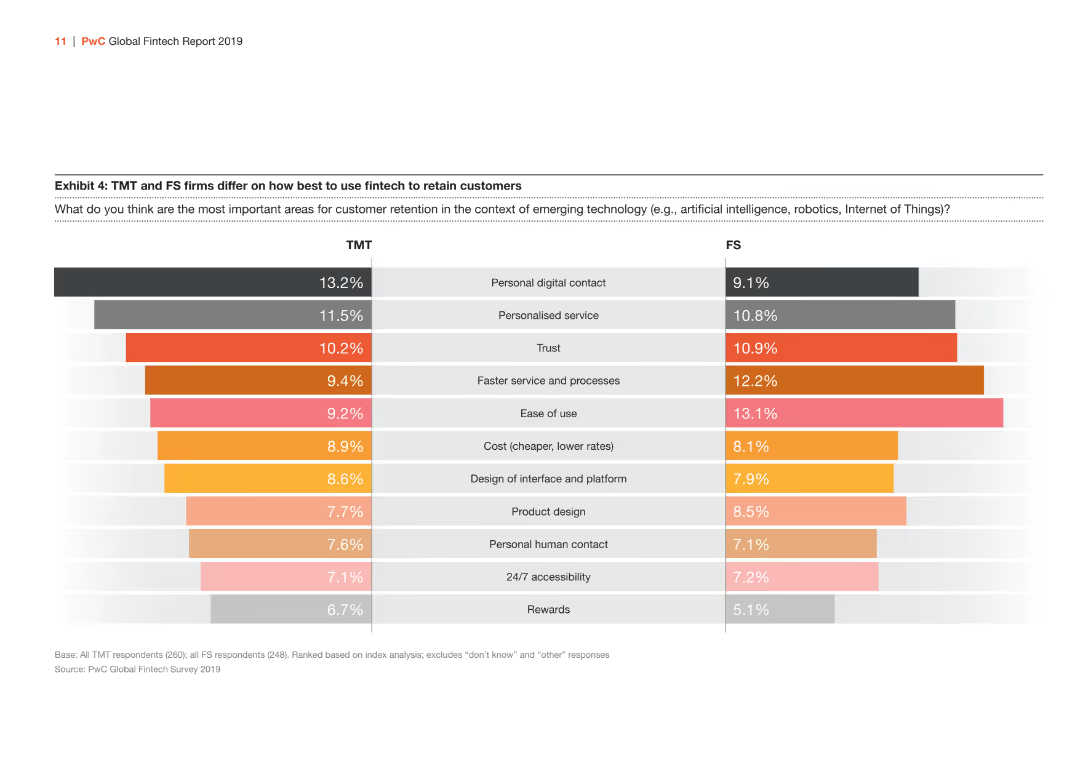
The slide features a bar chart comparing TMT and FS firms on important areas for customer retention through fintech. The bars are orange, red, and gray.
Market Analysis and Trends
Financial Services
Comparison of TMT and FS firms on the importance of various factors like personal digital contact, personalized service, and trust in retaining customers through fintech.
fintech, customer retention, TMT, FS, comparison
Multiple Chart
PwC/Strategy&
Saved
A single column chart depicts the increase in mobile gaming revenue per gamer from 2015 to 2025, with key growth drivers listed.
Market Analysis and Trends
Media & Entertainment
The slide centers on the revenue per mobile gamer in SEA, highlighting a 3.6x increase and mobile gaming's share of total gaming revenue.
mobile gaming, revenue, SEA, growth
Multiple Chart
Bain
Saved
The slide has three distinct sections with a pie chart, a stacked bar chart, and a bar chart. It details the distribution of survey participants by title, number of employees, and industry, using a color-coded scheme for easy distinction.
Industry Overview
Technology & Software
Aimed at providing demographic insights about the respondents of a survey, this slide breaks down the participant composition by job title, company size, and industry sectors, offering a clear visual representation for easier audience understanding.
survey demographics, participant distribution, job titles, company size, industry sectors, pie chart, bar chart, stacked bar chart
Multiple Chart
JP Morgan
Saved
Bar chart showing brand-switching percentages for non-essentials and essentials.
Customer and Market Segmentation
Retail & E-commerce
Provides a detailed look at brand-switching behavior, particularly in non-essential categories.
brand-switching, consumer behavior, essentials, non-essentials, retail
Single Chart
Bain
Saved
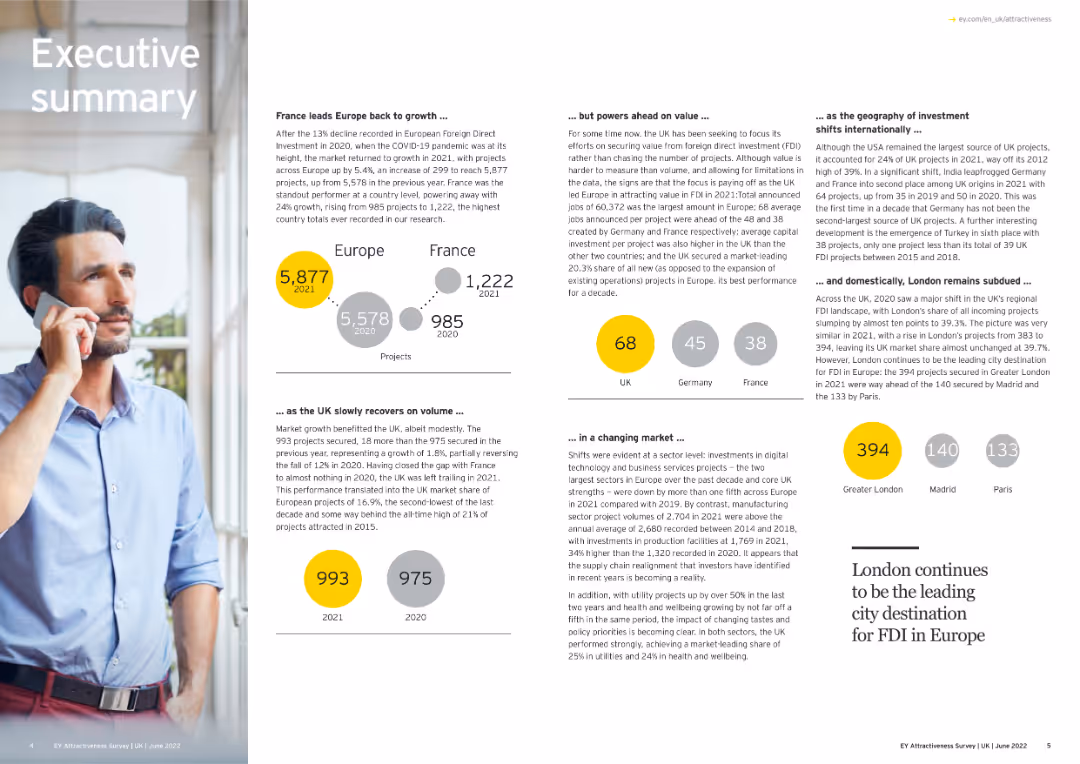
The slide combines text and visuals to summarize key points about Europe's FDI growth and shifts.
Strategic Planning
Financial Services
This executive summary slide provides an overview of FDI growth in Europe, highlighting France's lead, UK's recovery, and shifts in investor focus and market dynamics. It includes visual elements like project numbers and geographical investment distribution.
FDI, Europe, Investment Trends, Market Dynamics
Multiple Chart
EY
Saved
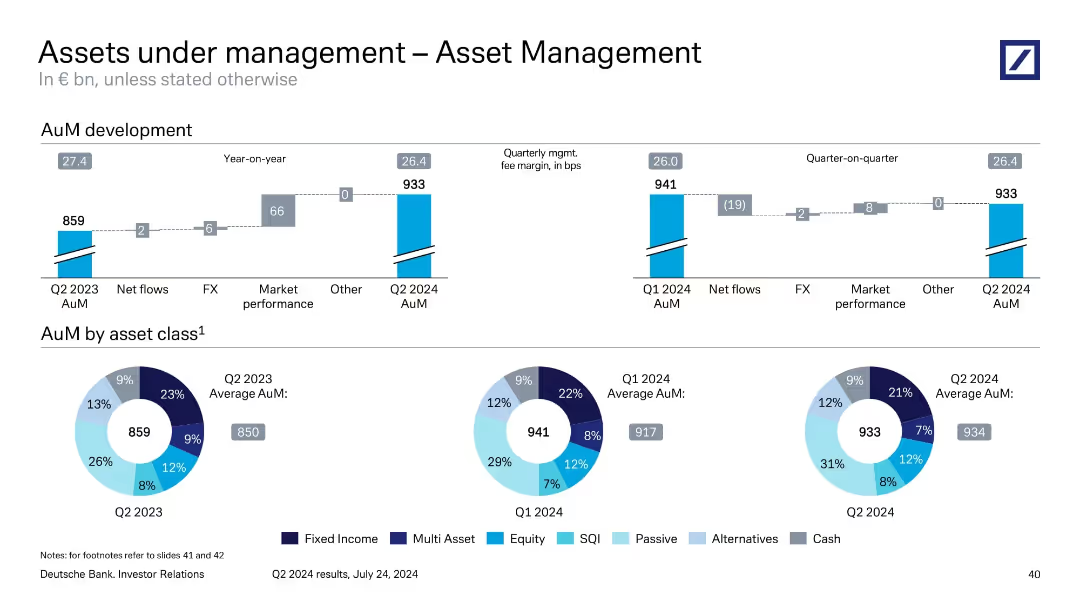
Mixed layout: stacked bar showing year-on-year AuM movement; pie charts show asset class composition across three periods.
Performance Metrics and KPIs
Financial Services
This slide shows the development of Asset Management’s AuM, which grew from €859bn in Q2 2023 to €933bn in Q2 2024. It identifies key drivers such as market performance and FX. The asset composition is visualized by class, with noticeable growth in passive and SQI categories, reflecting investor preference shifts.
asset management, AuM, asset classes, FX impact, market performance
Multiple Chart
Deutsche Bank
Saved
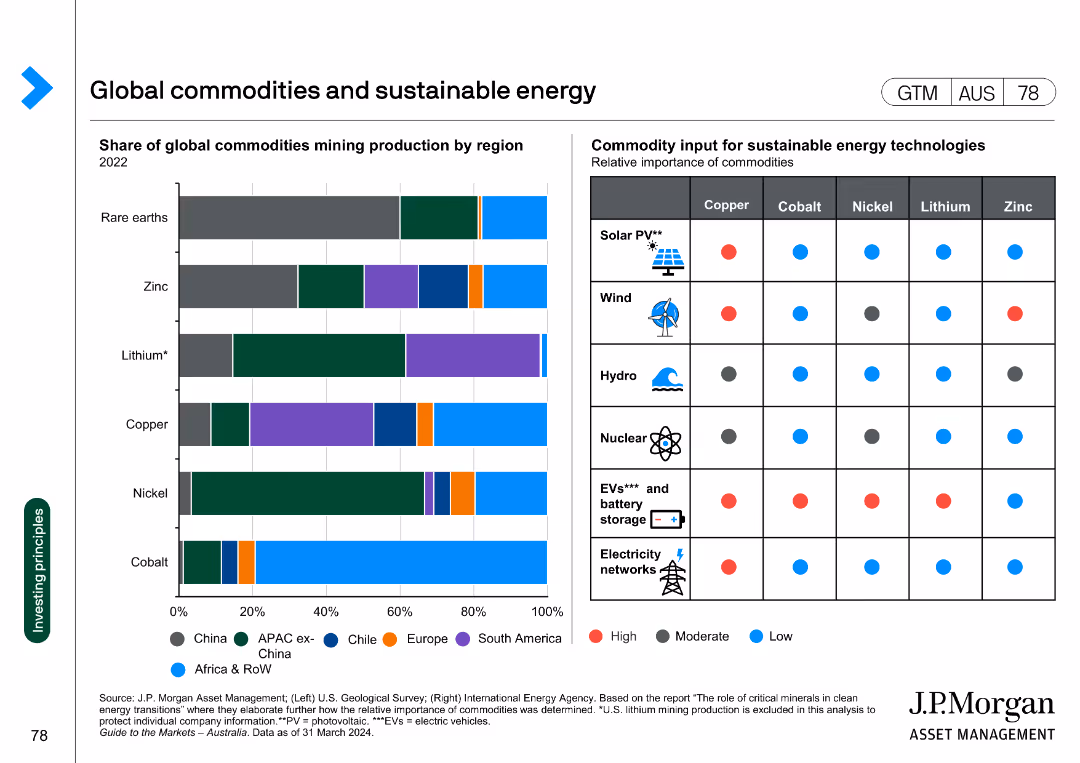
A combination of a bar chart and a matrix. The bar chart shows the share of global commodities mining production by region. The matrix indicates the relative importance of various commodities for sustainable energy technologies.
Market Analysis and Trends
Energy & Utilities
The slide displays the global production of key commodities and their importance in sustainable energy technologies, highlighting regions and specific uses like solar, wind, and EVs.
commodities, sustainable energy, mining, global production, renewable technologies
Mixed Chart
JP Morgan
Saved
A world map pinpointing locations with a legend indicating a $100bn alternatives net inflows target.
Investment Analysis
Financial Services
Outlines Goldman Sachs' aim to scale its alternative investment platform, with a global long-term target of $100 billion in net inflows.
Investment Platform, Global Targets, Net Inflows, Alternative Investments, Goldman Sachs
Graphic
Goldman Sachs
Saved
A table and bar chart combination highlighting important marketing metrics like engagement, viewability, and ROI. Each metric is presented with a percentage indicating its importance according to survey respondents.
Market Analysis and Trends
Media & Entertainment
This slide lists the most important marketing metrics as identified by survey respondents. It includes metrics such as engagement, viewability, marketing mix modeling, and full-funnel media ROI, showing their relative importance.
Metrics, Engagement, Viewability, ROI, Survey
Mixed Chart
Nielsen
Saved
The slide is laid out as a flowchart diagram known as the 'Innovation Flywheel', with descriptions accompanying each step. It includes side text elaborating on the process details.
Strategic Planning
Technology & Software
It suggests using agile methods to build, test, and launch innovations, tailored to different innovation focus areas. Suitable for process optimization discussions.
Agile, Innovation, Process, Flywheel, Prototyping, MVP, Customer Feedback, Experiments, Product Development
Linear Flow
BCG
Saved
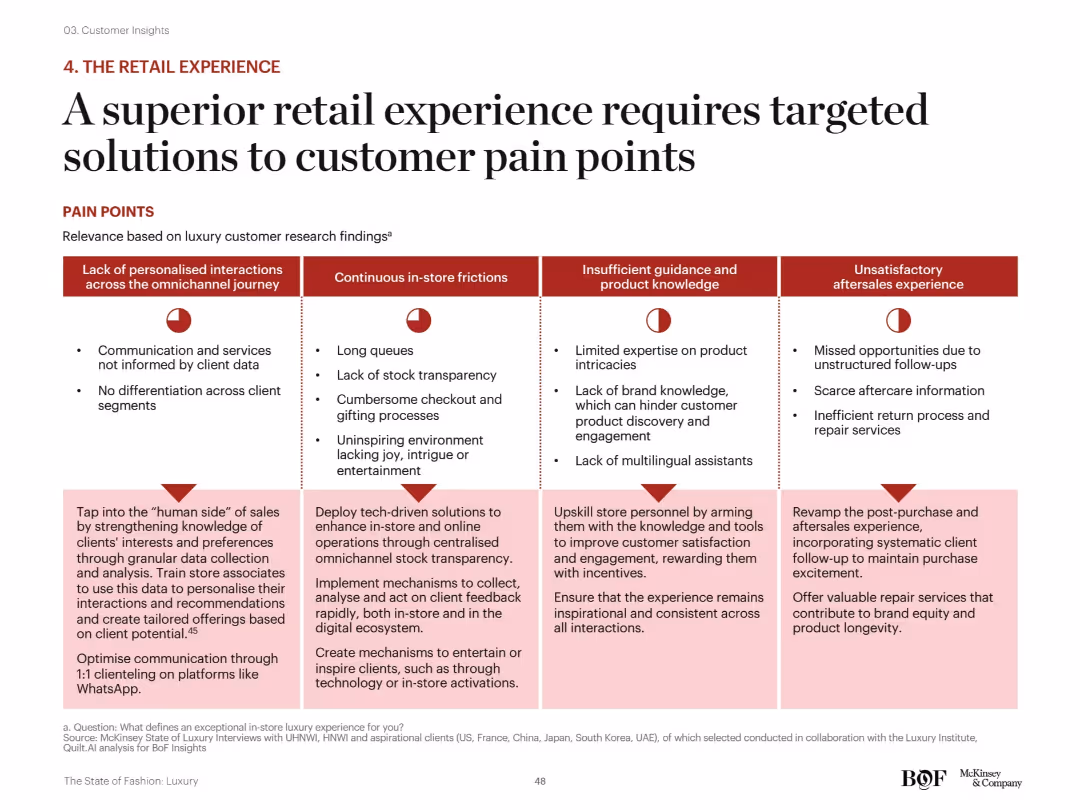
Matrix layout: four major pain point categories across top, each with corresponding red icons and bulleted descriptions below. Solutions for each category are outlined at the bottom of the slide in light pink boxes.
Customer and Market Segmentation
Consumer Goods
This slide offers a structured framework to address luxury retail pain points across personalization, in-store friction, staff expertise, and aftersales. Suggested solutions include tech integration, training, communication improvements, and enhanced service standards.
omnichannel, customer service, personalization, staff training, luxury retail, tech-driven solutions, aftersales
Mixed Chart
McKinsey
Saved
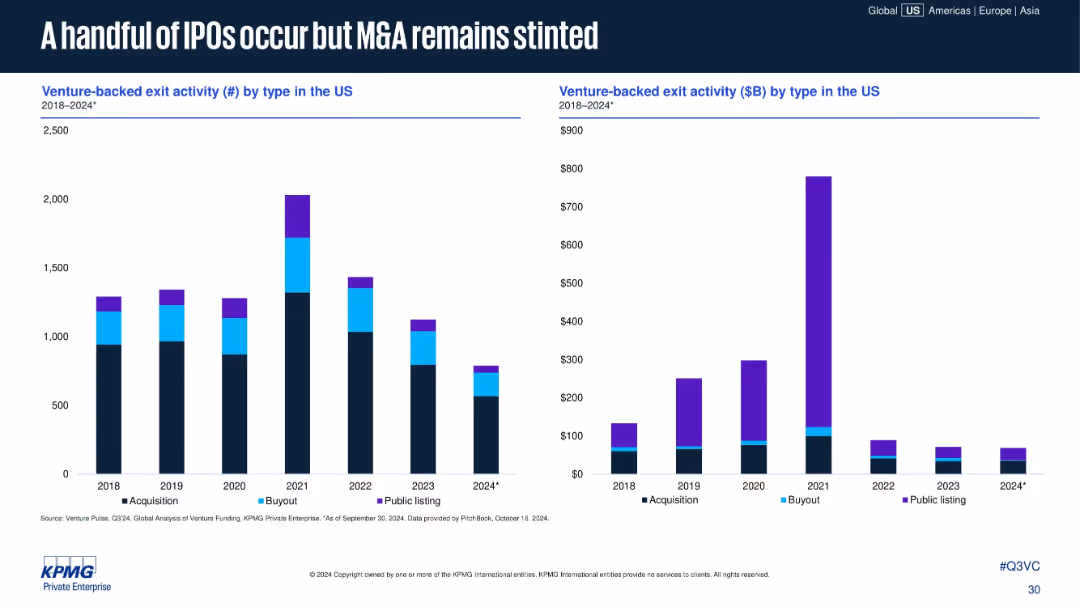
Two vertical bar charts: left shows number of exits by type; right shows exit value ($B) by type. Color-coded by acquisition, buyout, and public listing.
Mergers and Acquisitions
Financial Services
Public listings have dropped significantly since 2021, with M&A dominating exit types. Total exit values are down across the board, showing limited liquidity events and a slowdown in large-scale buyouts and IPOs.
IPOs, M&A, buyouts, exit activity, venture exits, liquidity events, public listing decline, 2024 exits
Multiple Chart
KPMG
Saved
Comprises column charts representing the percentage of respondents considering EVs before and during COVID-19.
Market Analysis and Trends
Transportation & Logistics
Discusses the stability of consumer interest in electric vehicles despite the disruptions caused by the pandemic.
electric vehicles, consumer preference, market stability, global trends
Multiple Chart
McKinsey
Saved
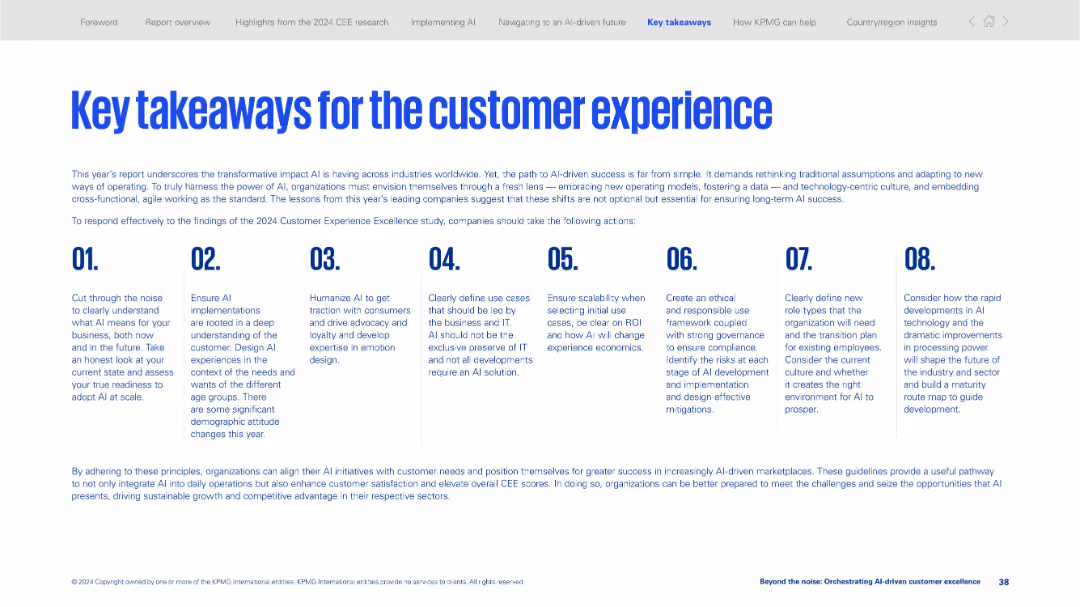
Numbered column layout (01–08) summarizing main recommendations for AI adoption and customer experience.
Strategic Planning
Professional Services
Offers eight key principles to guide organizations in adopting AI for customer experience improvements. Covers readiness assessment, ethical frameworks, clear use cases, role definitions, and scalability.
AI adoption, customer experience, strategy, takeaways, ethics, readiness, scalability, roles, organizational change
Linear Flow
KPMG
Saved
Two-side layout separating benefits and risks of connectivity, accompanied by relevant symbols.
Strategic Planning
Professional Services
Highlights the benefits and risks associated with advanced connectivity, giving leaders strategic insights.
Benefits, Risks, Connectivity, Strategy, Digital Transformation, IoT
Boxed
McKinsey
Saved
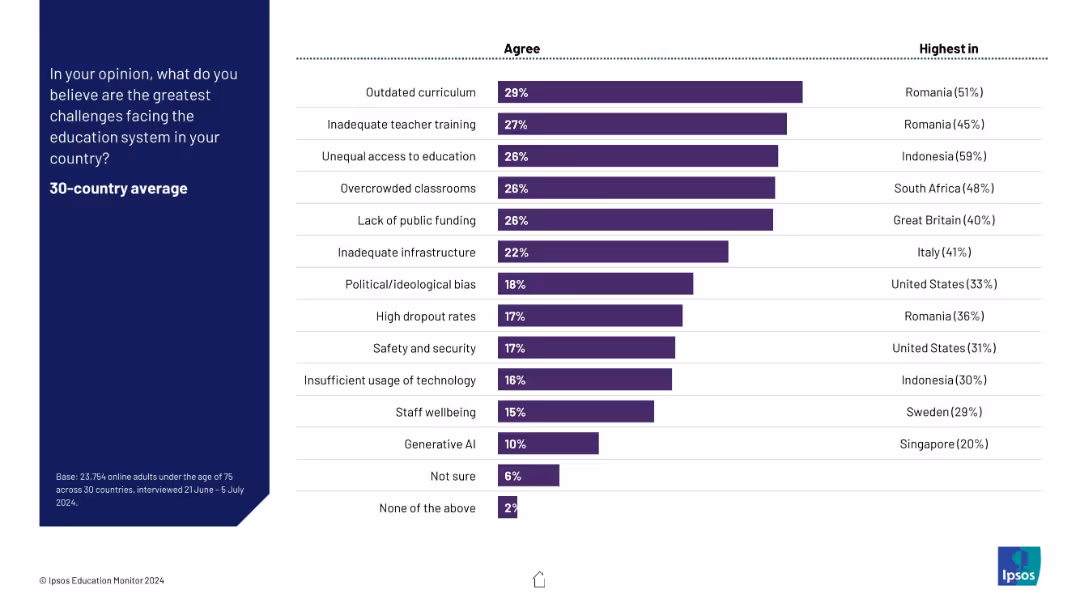
Vertical bar chart of 13 challenges, sorted by agreement level. Purple bars with “Highest in” country indicated per issue.
Risk Assessment and Management
Education & Training
This slide presents the most commonly cited educational challenges across 30 countries, with “outdated curriculum” and “inadequate teacher training” as top concerns. It also shows which countries report these issues most strongly.
educational challenges, risks, curriculum, teacher training, infrastructure, survey responses
Mixed Chart
IPSOS
Saved
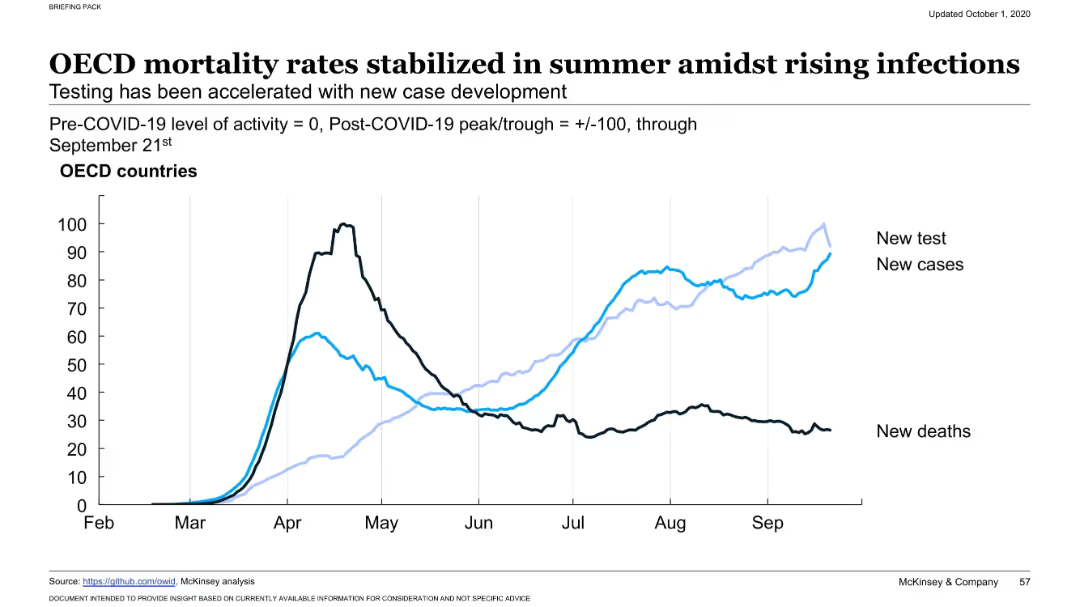
Dual-axis line chart with three data series (new tests, new cases, new deaths) over time. Labels distinguish the series. X-axis runs from February to September. Black and blue lines track different outcomes.
Risk Assessment and Management
Healthcare & Pharmaceuticals
Illustrates that while COVID-19 testing and cases were rising again by late summer, mortality rates in OECD countries had stabilized or declined, implying improved clinical management or treatment effectiveness despite case growth.
COVID-19, OECD, testing rates, new infections, mortality, stabilization, health impact, virus resurgence, summer trend, healthcare capacity
Single Chart
McKinsey
Saved
Slide contains four columns each with a green icon (dollar sign, building blocks, light bulb) and text blocks. It uses a clean and professional design with bullet points and minimalistic icons to present statistical data.
Industry Overview
Professional Services
This slide summarizes productivity strategies and expectations among companies over the next three years, focusing on investments in talent and technology to drive growth.
productivity, talent, technology, investments, growth
Pillar
Deloitte
Saved
Contains column charts comparing statutory RoTE across different bank divisions over several years.
Financial Performance
Financial Services
Demonstrates how different bank divisions contribute to overall growth and performance, emphasizing improvements and future targets.
RoTE, performance, divisions, growth, targets
Multiple Chart
Barclays
Saved
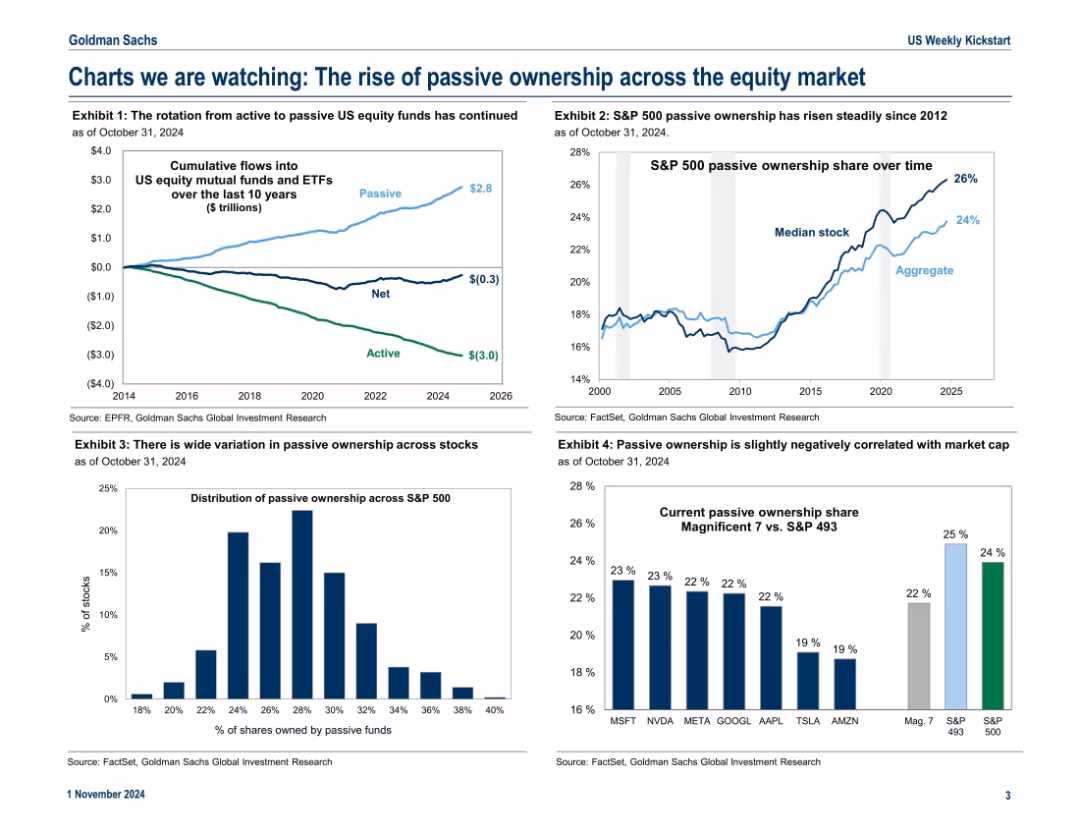
Dashboard layout with five graphs focused on passive vs. active fund trends; timeline and distribution visuals dominate.
Market Analysis and Trends
Financial Services
Analyzes the ongoing shift from active to passive equity fund management. Charts show passive inflows, rising passive ownership in the S&P 500, correlation with market cap, and concentration in large tech stocks. Reflects structural market transformation.
passive funds, S&P 500, ETF inflows, market cap, equity market, ownership trends, active vs. passive, investment strategy
Multiple Chart
Goldman Sachs
Saved
The slide compares two aspects: market trends and defense budgets across different regions, using a map and red text boxes. A red outline frames the slide's main message.
Market Analysis and Trends
Industrial & Manufacturing
Analyzes defense market trends and budget growth to identify commercial opportunities. It provides a global outlook on market potential and the company’s position in it. This slide is likely used in market analysis and strategic planning sessions.
Defense Market, Trends, Commercial Opportunities, Budget Growth, Strategic Planning
Boxed
Goldman Sachs
Saved
Column chart displaying the number of Hispanic investment partners across three years (2018, 2020, 2022). Data table to the right shows characteristics of Hispanic employees in investment firms.
Investment Analysis
Financial Services
The slide shows the percentage of firms with Hispanic investment partners and the roles of Hispanic employees in investment firms for 2022, 2020, and 2018. Useful for analyzing diversity in investment partnerships and roles.
Hispanic, investment, partners, diversity, analysis
Mixed Chart
Deloitte
Saved
The slide features a title with a prominent image of a scenic landscape and a number "1". It includes a column chart depicting GVA growth in UK regions.
Market Analysis and Trends
Government & Public Sector
The slide discusses UK and regional economic performance in 2022, highlighting GVA growth in various regions and sectors with comparative analysis.
GVA, economic growth, UK regions, 2022, column chart
Mixed Chart
EY
Saved
Previous
Next
If nothing, comes up, please save your slides first
Create a FREE account to continue browsing
Receive Instant Access to 1,000+ slides from companies like McKinsey, Google, and Goldman Sachs
First Name
Last Name
Email
Password
I agree to all
Terms & Privacy Policy
Thank you! Your submission has been received!
Oops! Something went wrong while submitting the form.
Have an account?
Sign in
Column Chart
Heatmap
Chevron
Org Chart
Infographic
Callouts
Timeline
List
Graphic
Picture
Process Flow
Diagram
Paragraph
Map
Table
Framework
Subtitle
Takeaway Box
Icon
Other Chart
Radar Chart
Waterfall Chart
Mekko Chart
Pie Chart
Scatter Plot
Line Chart
Bar chart
Bullet points