My Account
My Slides
Search by Category
Templates
View All Templates
Download Template Slides
✦ AI Search
Feedback
Login
Logout
Get Started
Browse all Slides
Browse all Slides
Create a FREE Account
Instant access to 1,000+ real slides from top companies like McKinsey, BCG, Goldman Sachs, Google and many more!
First Name
Last Name
Email
Password
I agree to all
Terms & Privacy Policy
Thank you! Your submission has been received!
Oops! Something went wrong while submitting the form.
Have an account?
Sign in
Saved Slides
Slide includes column chart showing revenue distribution over years and textual information organized in bullet points on the right side.
Financial Performance
Financial Services
This slide presents the evolution of revenue streams from 2020 to 2023, highlighting the financial growth in various banking sectors such as Investment, Corporate, and Private Banking. It emphasizes strategic investments and innovations that have propelled client engagement and financial growth.
Revenue, Banking, Strategic Growth, Client Engagement, Financial Trends
Mixed Chart
Deutsche Bank
Saved
Line and dashed line chart comparing past and predicted future changes in overall and digital marketing spending.
Market Analysis and Trends
Financial Services
Evaluates historical and projected marketing spending trends, highlighting a slowdown in growth. Useful for future budgeting and strategic planning in marketing investments.
marketing, spending, trends, prediction, budgets, digital, planning, growth
Single Chart
Deloitte
Saved
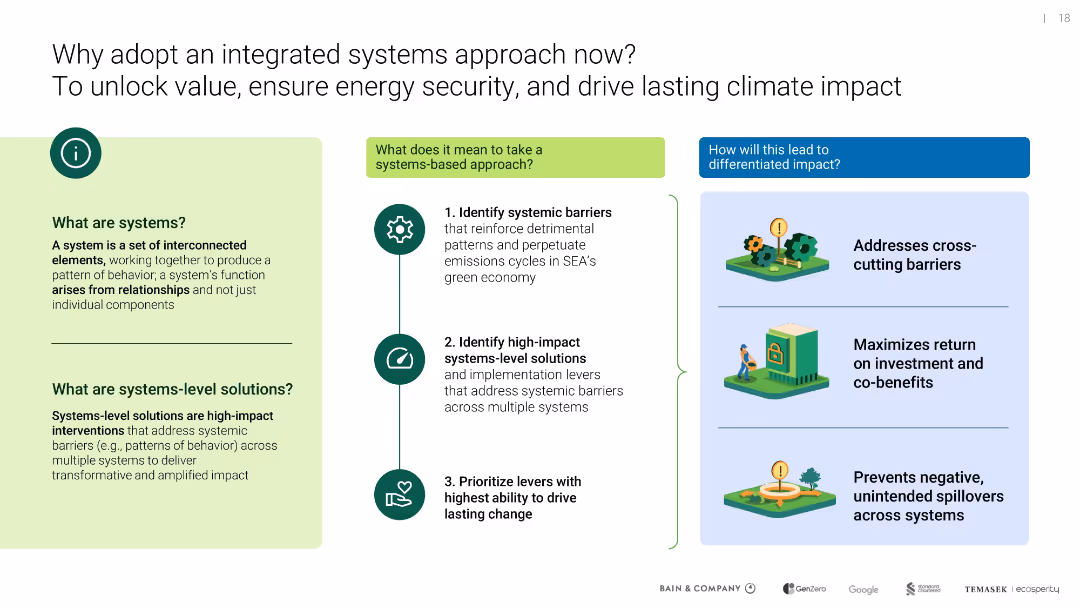
Split into explanatory sections; left defines systems-level thinking, center outlines approach steps, right shows impact benefits
Strategic Planning
Environmental Services & Sustainability
Introduces systems-level thinking as a superior method to overcome systemic barriers, enhance ROI, and prevent negative spillovers in SEA’s green transition. Emphasizes cross-system integration.
systems approach, SEA, energy security, ROI, decarbonization strategy
Vertical Flow
Bain
Saved
A text-heavy slide with a three-column layout presenting a pathway to profitability over different time horizons, complemented by performance drivers.
Operational Efficiency
Financial Services
It outlines the strategic approach to profitability in Platform Solutions, including progress markers and goals for upcoming years.
profitability, platform, strategy, efficiency
Table
Goldman Sachs
Saved
Line chart showing job satisfaction by number of job dimensions, labeled with percentages of respondents satisfied with their jobs.
Market Analysis and Trends
Professional Services
Analyzes job satisfaction levels related to the complexity of job roles, showing increased satisfaction with more cognitively demanding roles.
job satisfaction, cognitive dimensions, workforce analysis, professional growth, career development, creativity in work
Mixed Chart
Accenture
Saved
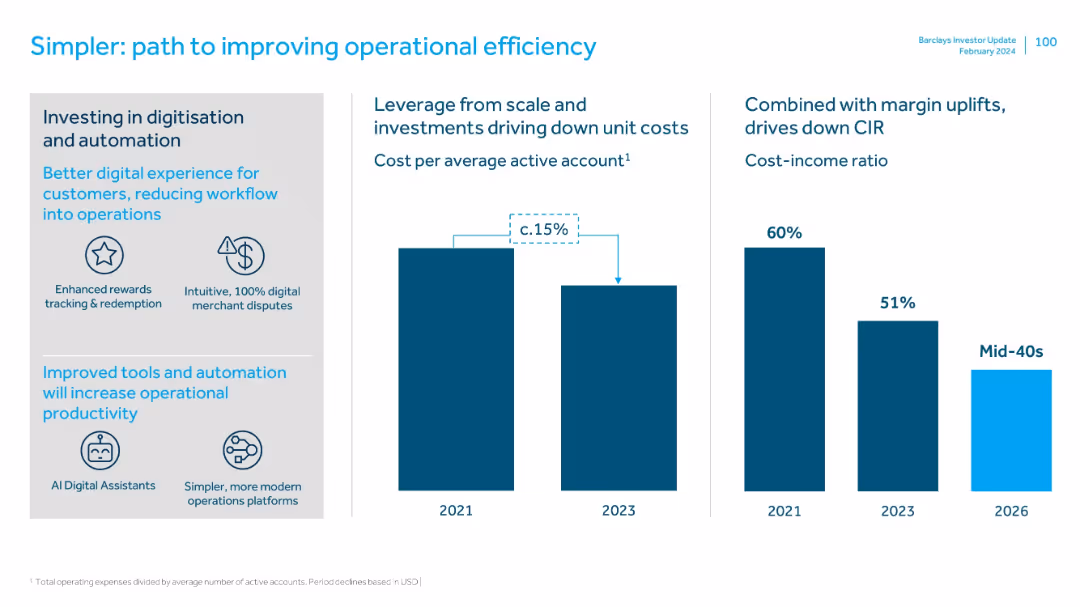
Three-panel layout: investment areas on left, cost impact in center, CIR reduction on right. Uses icons and bar charts.
Operational Efficiency
Financial Services
Describes investments in digitization and automation that are reducing unit costs and operational inefficiencies. Shows cost savings and CIR reduction from 2021 to a projected mid-40s% by 2026.
digitization, automation, cost savings, CIR, operational efficiency, AI tools, scaling
Multiple Chart
Barclays
Saved
It showcases a combination of column charts, star ratings, and graphical icons, using a color palette of blues, grays, and oranges. Each section provides data points and rankings.
Product and Service Analysis
Financial Services
Demonstrating asset management across various funds and strategies, this slide offers a comprehensive view on fund performance, AUM, and ranking, highlighting the franchise's cross-asset income strength.
Funds, Asset Management, Performance, AUM, Ranking, Franchise, Cross-Asset, Income Strategy, Infrastructure
Multiple Chart
JP Morgan
Saved
Featuring a straightforward layout with a bar chart, this slide examines the financial impact of delayed technology adoption on business agility and growth. It shows the percentage of revenue change against the backdrop of technology investment in different years, providing a stark comparison of business performance with and without adequate tech support.
Technology and Digital Transformation
Technology & Software
This slide illustrates the detrimental financial effects of postponing technological advancements within organizations. It compares revenue growth and tech debt levels, providing a clear argument for why timely technological updates are essential for maintaining competitiveness and fostering growth in today's digital economy.
technology transformation, delayed investment, financial impact, tech debt, competitiveness, column chart
Mixed Chart
Accenture
Saved
Light background with yellow title banner, text-heavy content, and two charts illustrating cross-border listings and their performance.
Market Analysis and Trends
Financial Services
This slide highlights the outperformance of small cross-border IPOs compared to larger offerings in after-market returns. It features charts showing the number of cross-border listings over years and the percentage of IPOs with current prices above their offer prices.
cross-border listings, IPO performance, after-market returns, 2023, financial trends
Multiple Chart
EY
Saved
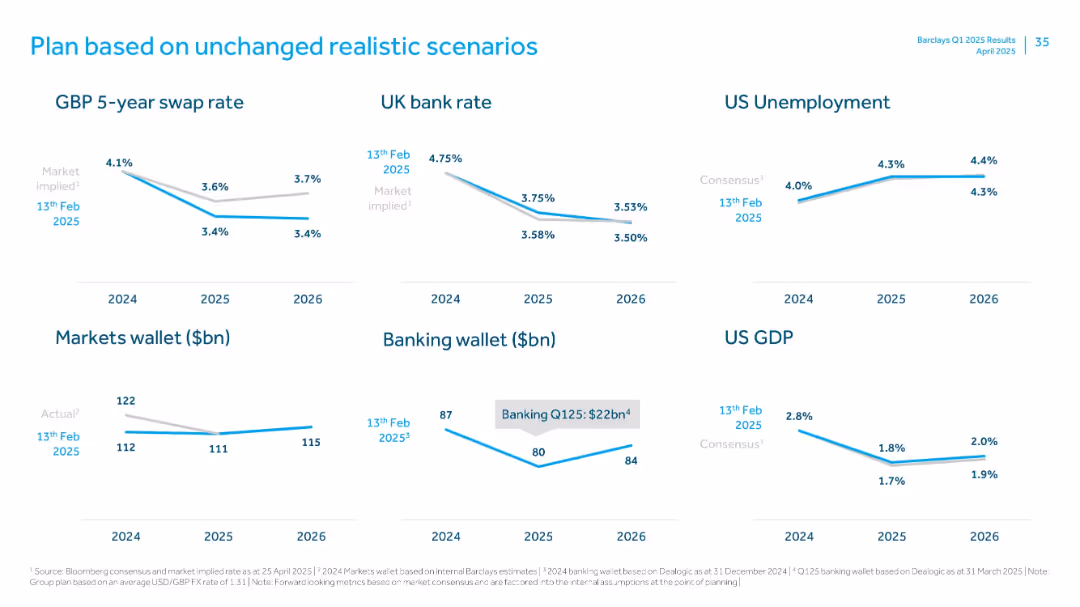
Six mini-line charts with macroeconomic forecasts and market estimates (2024–2026)
Strategic Planning
Financial Services
Displays economic assumptions behind Barclays' planning, including interest rates, unemployment, GDP, and market wallets. Emphasizes a stable outlook with moderate adjustments in macro indicators through 2026.
forecasts, interest rate, GDP, unemployment, wallet size
Single Chart
Barclays
Saved
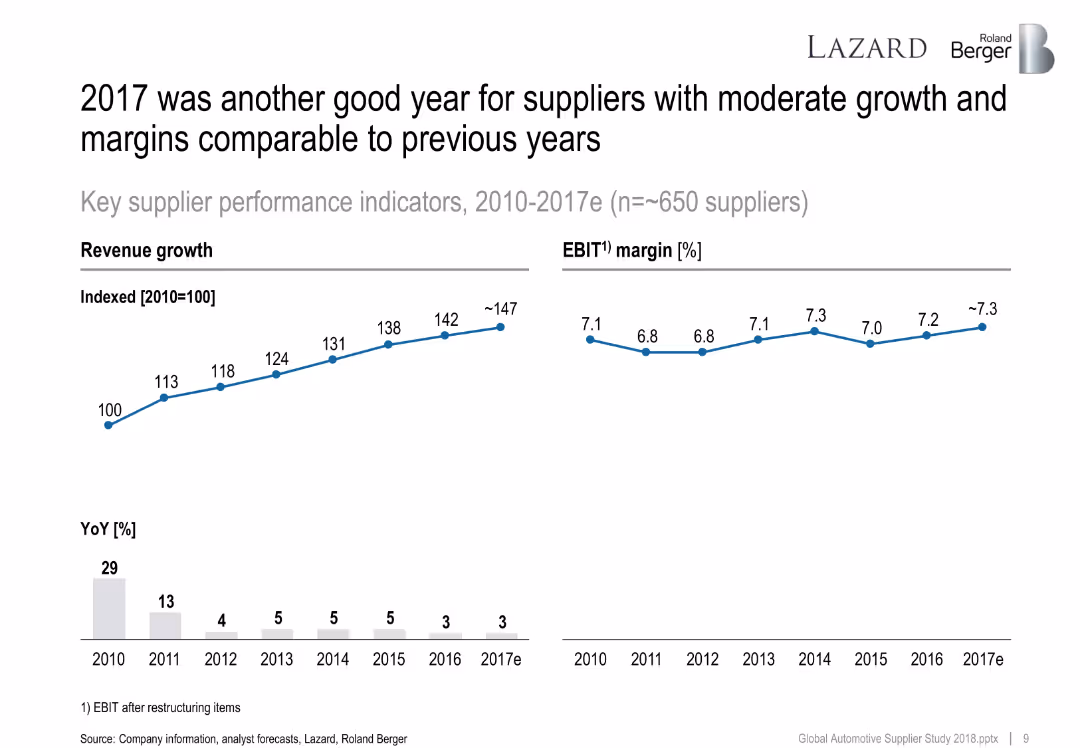
Line chart showing revenue growth index (2010–2017e) and EBIT margin. Below, a bar chart tracks year-over-year revenue growth percentages.
Financial Performance
Industrial & Manufacturing
The slide presents consistent revenue and margin performance for suppliers from 2010 to 2017e. EBIT margins remain stable while revenue index shows progressive growth, despite slight YoY slowdown.
revenue growth, EBIT, automotive suppliers, KPI, YoY, 2017, Roland Berger
Multiple Chart
Roland Berger
Saved
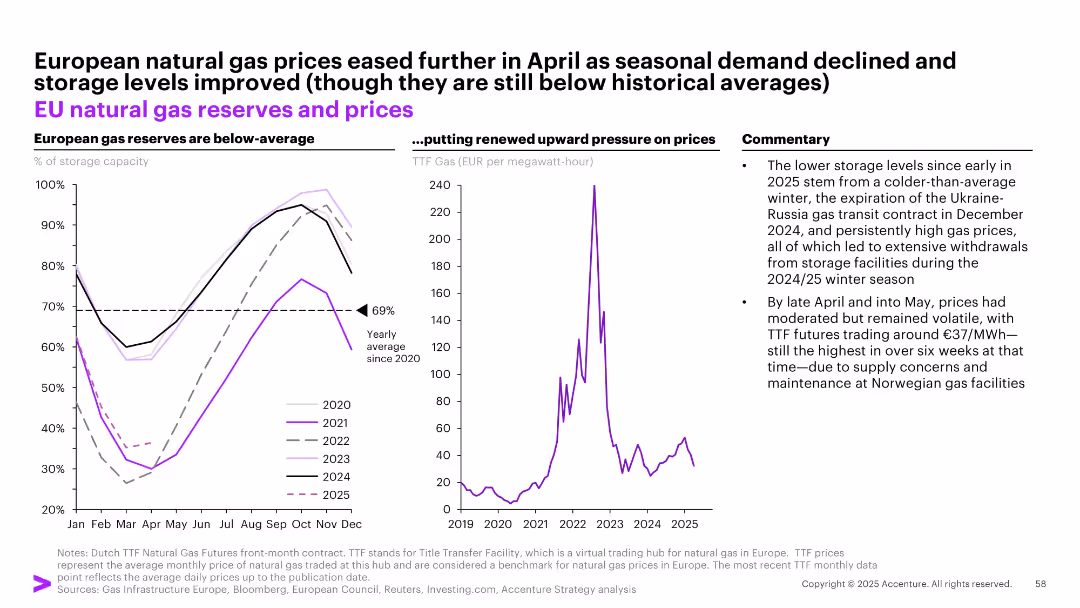
Split into three sections: left panel shows EU gas storage levels, middle panel shows gas prices (TTF), right panel has commentary.
Market Analysis and Trends
Energy & Utilities
Analyzes low EU gas reserves and price movements from 2020–2025. Points to cold winters, transit contract expirations, and storage withdrawals as key contributors. Despite easing in May, prices remain volatile due to supply concerns.
EU, natural gas, reserves, energy, TTF, storage, Ukraine-Russia, volatility, price pressure, winter
Multiple Chart
Accenture
Saved
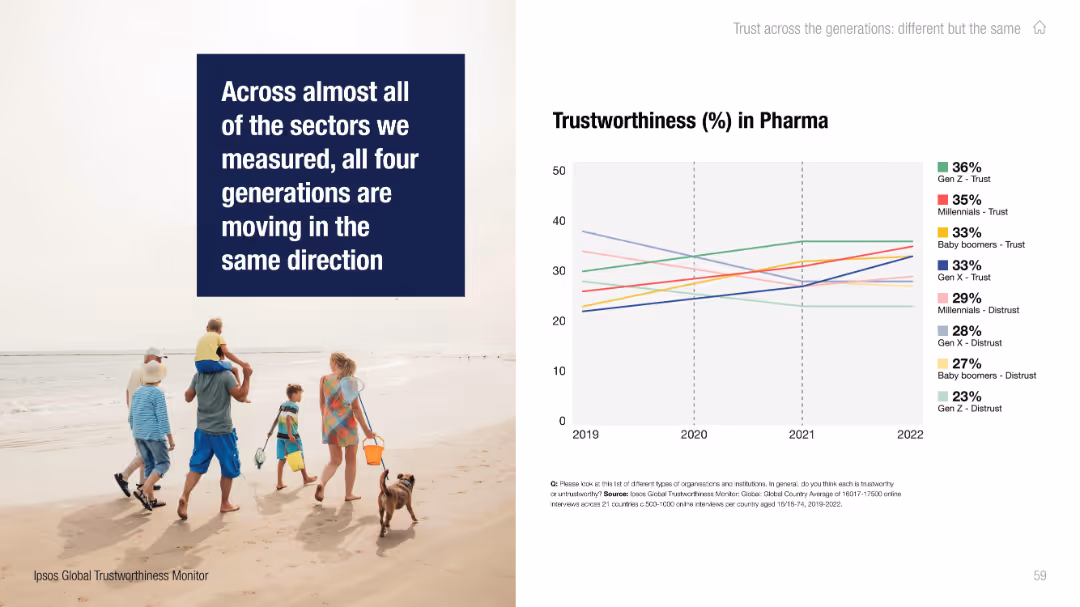
Split layout: photo of family walking on the beach with a bold quote on the left; line chart on the right.
Performance Metrics and KPIs
Healthcare & Pharmaceuticals
The slide highlights generational trends in trust toward the pharmaceutical sector, noting a general increase in trust across generations from 2019 to 2022.
pharma, trust, generational data, Ipsos, Millennials, Gen Z, Baby Boomers, Gen X, trend chart, trustworthiness
Mixed Chart
IPSOS
Saved
With moderate visual complexity, the slide uses two pie charts to present perceptions of gender role modeling in international assignments. The design is clean and professional, employing a red and grey color scheme to draw attention to the gender comparison data.
Human Resources and Talent Management
Professional Services
Discussing the shortage of female role models with international assignment experience, the slide highlights this gap's impact on wider talent and global mobility programs. It urges organizations to showcase positive experiences of successful female assignees to drive awareness and inspire women.
Role models, Gender gap, Leadership development, Talent retention
Multiple Chart
PwC/Strategy&
Saved
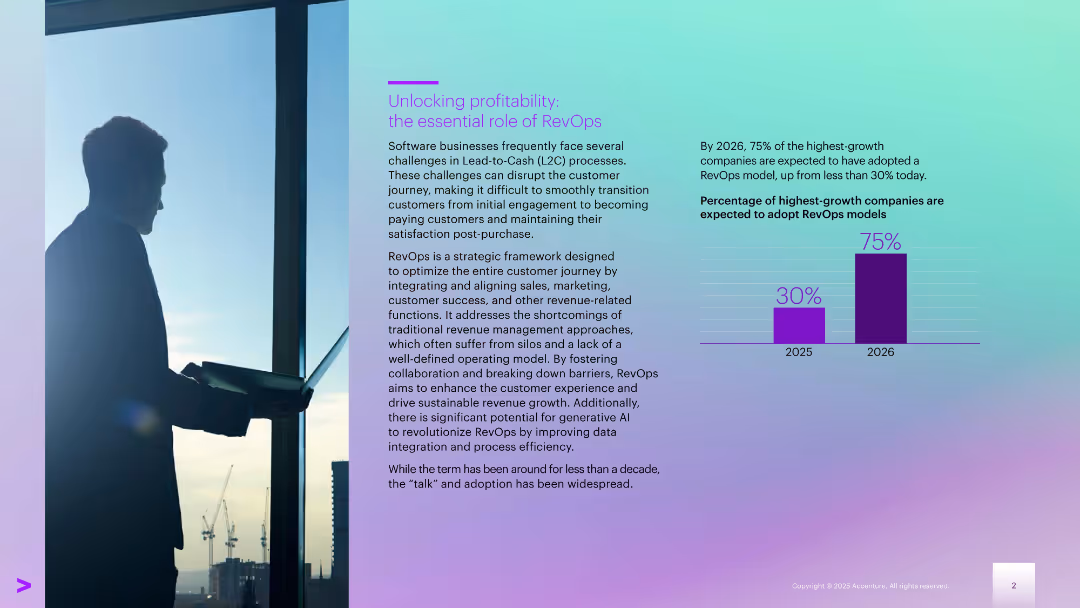
Left-aligned text with a city-view silhouette; right side includes a bar chart comparing 2025–2026 data
Technology and Digital Transformation
Technology & Software
Explains RevOps as a strategic model for optimizing the revenue journey. Notes the expected jump in adoption by high-growth companies (from 30% in 2025 to 75% in 2026). Focus is on aligning internal teams to improve customer success and revenue generation.
customer awareness, interest rates, banking satisfaction, pricing, savings, financial behavior
Mixed Chart
Accenture
Saved
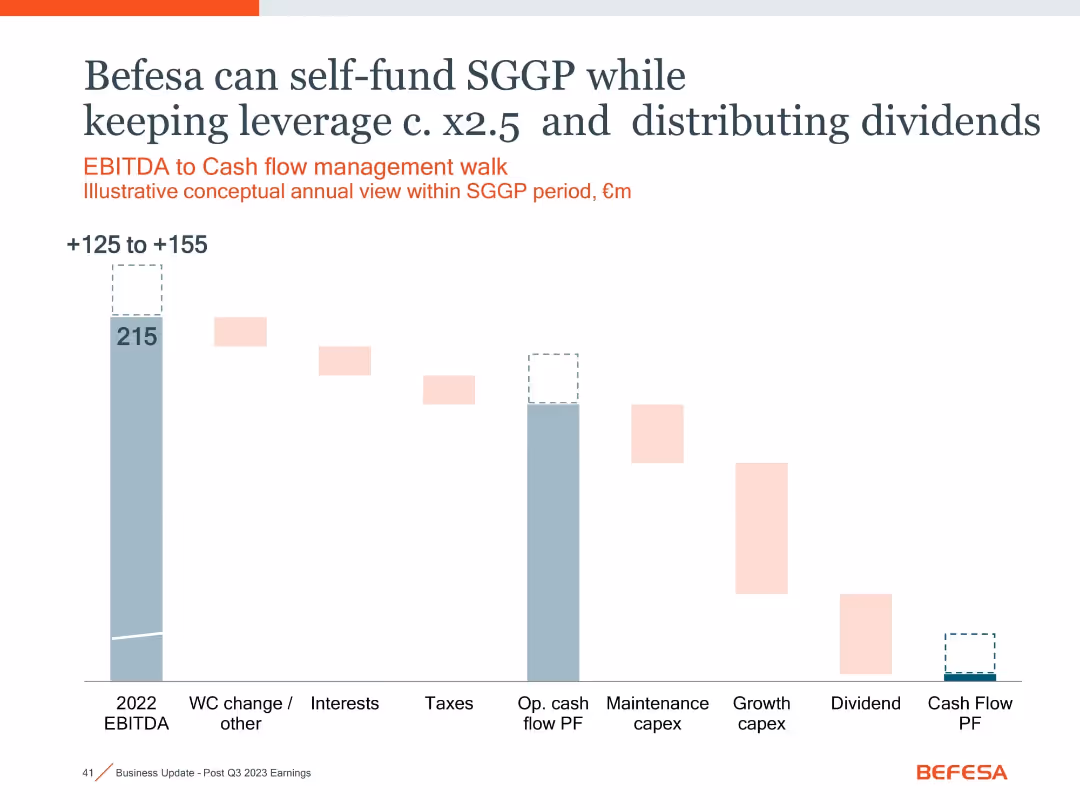
Waterfall chart showing EBITDA to cash flow use; pastel and gray blocks illustrate spending allocation
Financial Performance
Financial Services
Demonstrates Befesa's ability to self-fund SGGP investments with ~€125–155m from EBITDA while maintaining leverage and paying dividends. Covers operational and growth capex plus dividend flow.
EBITDA, cash flow, SGGP, dividends, leverage, capex, financial planning
Single Chart
Goldman Sachs
Saved
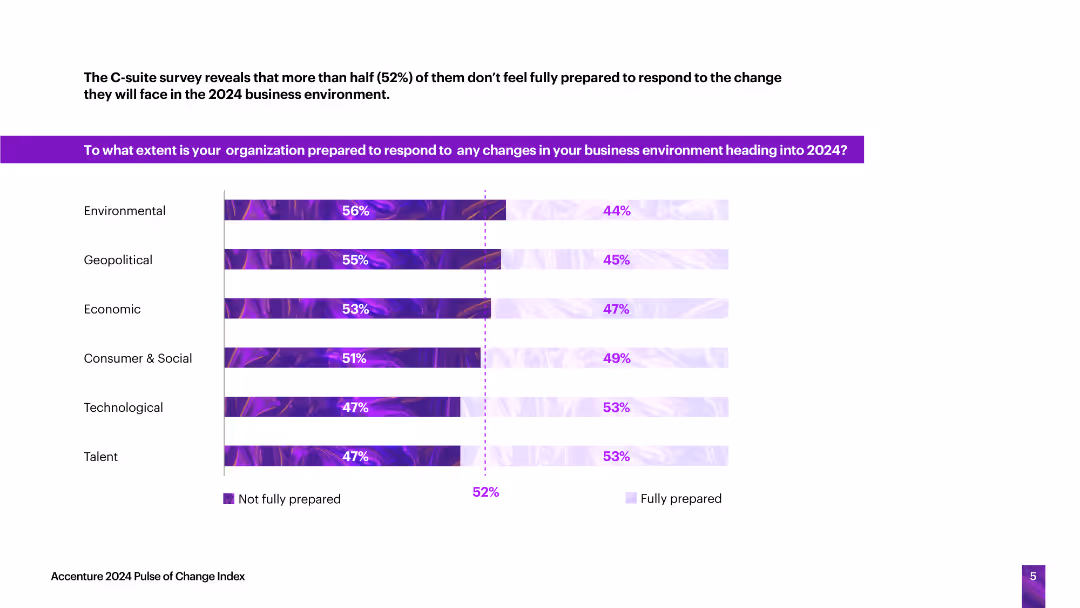
This slide includes a horizontal bar chart showing the preparedness of organizations to respond to various changes (environmental, geopolitical, economic, social, technological, talent) heading into 2024.
Technology and Digital Transformation
Technology & Software
The slide presents data on how prepared organizations feel about responding to changes in various areas, with more than half not feeling fully prepared for the upcoming business environment changes.
organizational preparedness, change, environmental, geopolitical, technological
Single Chart
Accenture
Saved
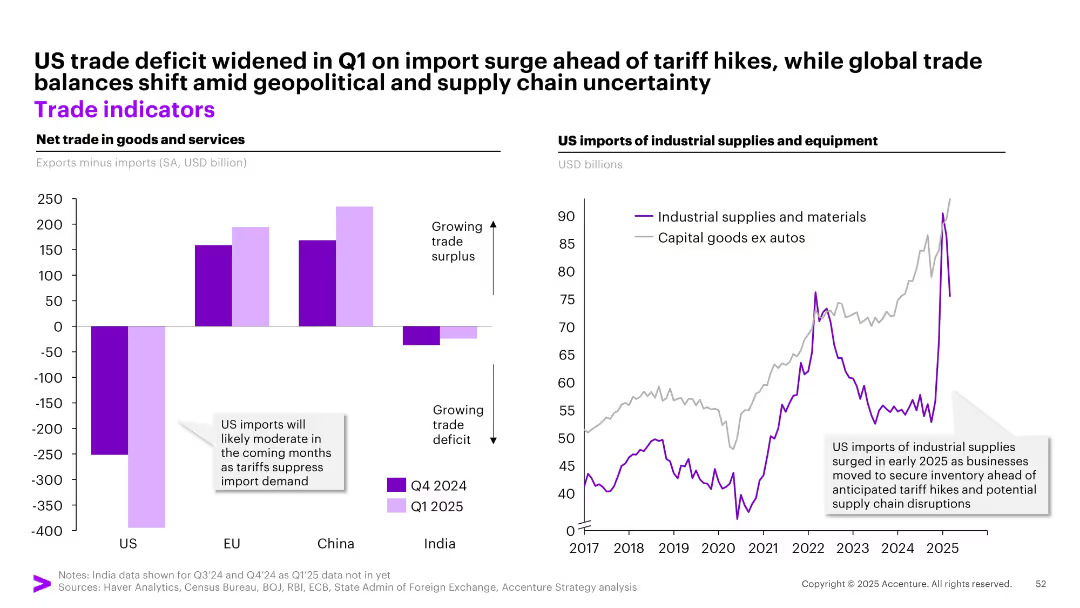
Dual-panel chart: left = net trade by region (bar chart), right = US imports of industrial supplies (line chart)
Market Analysis and Trends
Transportation & Logistics
This slide shows the widening US trade deficit in early 2025 due to an import surge ahead of tariff hikes, while other regions like China and EU maintain trade surpluses. It also depicts a rise in US industrial supply imports, driven by businesses stockpiling before anticipated tariff impacts.
trade deficit, US imports, industrial supplies, tariffs, supply chain, global trade
Multiple Chart
Accenture
Saved
The slide features a detailed flowchart showing the possible routes for converting various feedstocks (animal waste, agricultural residues, MSW, forestry residues, algae, energy crops) into energy through conditioning, pretreatment, intermediates, conversion, and final product stages.
Technology and Digital Transformation
Energy & Utilities
This slide outlines the complex pathways for converting different types of biomass feedstocks into energy, illustrating the various conditioning, pretreatment, and conversion processes involved.
feedstocks, energy pathways, biomass, conversion, conditioning, pretreatment, intermediates, final product
Diagram
Kearney
Saved
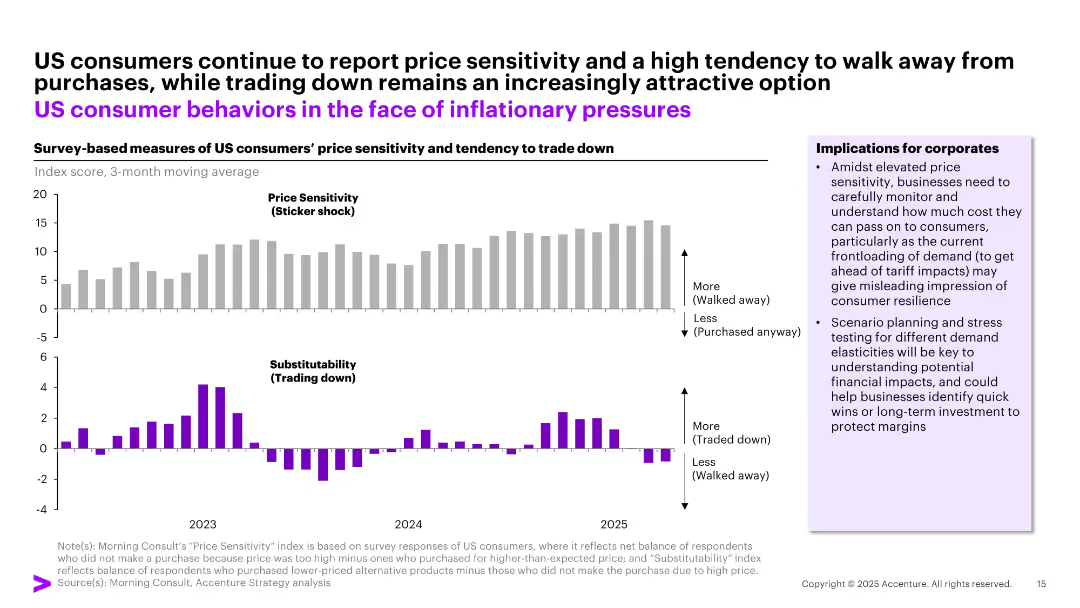
Bar chart layout with two horizontal panels showing survey-based indices for price sensitivity and product substitutability; key implications provided in a side box.
Market Analysis and Trends
Consumer Goods
The slide highlights increasing price sensitivity among US consumers, shown by a growing tendency to avoid purchases due to sticker shock and a shift toward lower-priced alternatives. Implications stress the importance of pricing strategy, demand forecasting, and margin protection amid uncertain inflationary trends.
price sensitivity, trading down, consumer behavior, inflation, elasticity, demand planning
Multiple Chart
Accenture
Saved
Multi-panel comparison, various aspects of CAI solutions
Strategic Planning
Professional Services
Guides decision-making in CAI implementation
CAI, platform, user experience, analytics
Table
Deloitte
Saved
This slide presents a line graph showing the U.S. market podcast ad revenue percentage share by quarter from 2017 to 2022. Each line is color-coded to represent a different quarter, illustrating trends and changes over time.
Market Analysis and Trends
Media & Entertainment
Analyzes the seasonal distribution of podcast advertising revenue in the U.S. market, noting a decrease in the fourth quarter share in 2022. Useful for understanding seasonal impacts on marketing and advertising budgets.
Quarterly Trends, Podcast Advertising, Revenue Share, Marketing Budgets
Single Chart
PwC/Strategy&
Saved
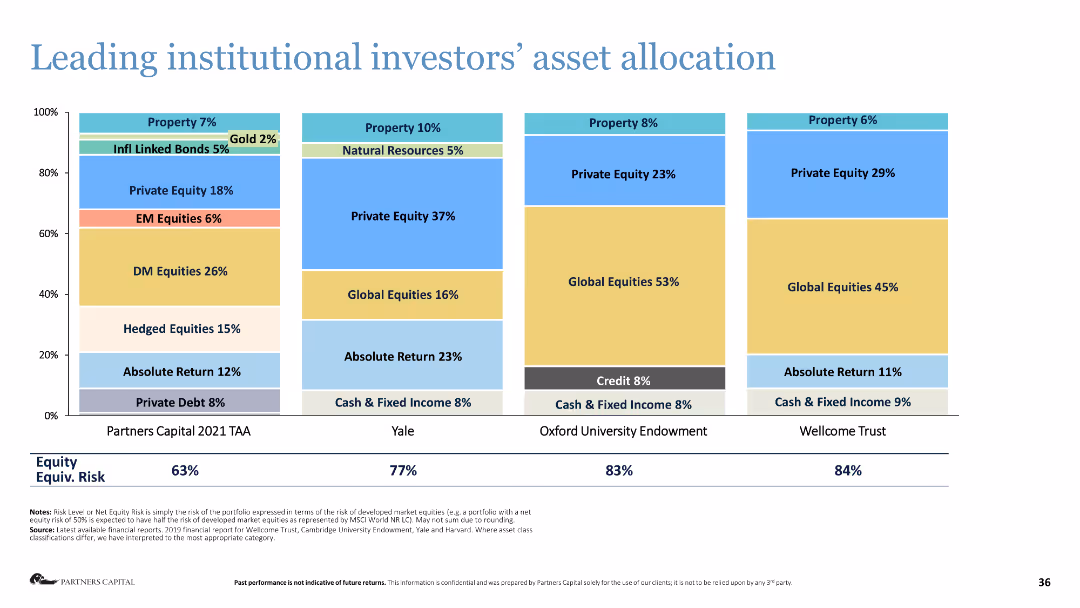
Stacked bar chart showing the asset allocation of leading institutional investors.
Investment Analysis
Financial Services
The slide presents the asset allocation strategies of major institutional investors, highlighting their investment preferences.
asset allocation, institutional investors, investment strategy, financial analysis, equities
Single Chart
Deloitte
Saved
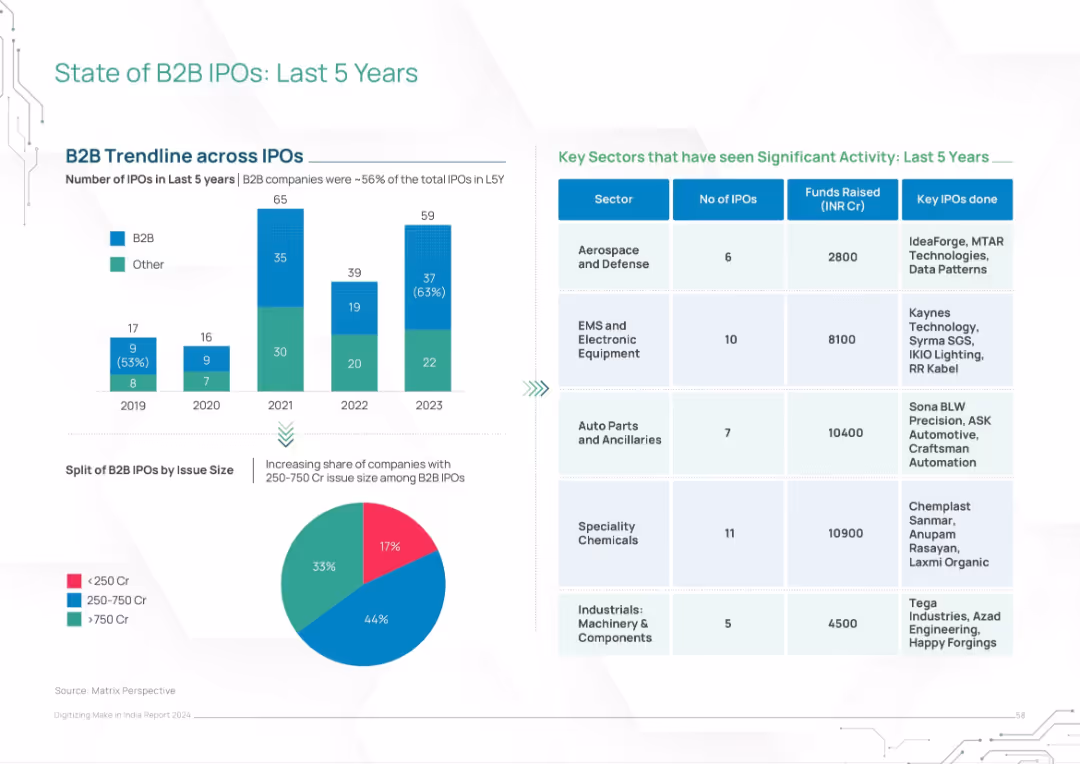
Split layout with bar chart (IPO trends), pie chart (issue size distribution), and table (key sectors)
Financial Performance
Financial Services
This slide reviews the state of B2B IPOs in India over the last five years, showing increasing activity and larger deal sizes. Key sectors and IPO examples are listed, along with funds raised. Visuals show a rising share of mid-to-large IPOs.
IPO, B2B, financial performance, India, sectors, funds raised, capital markets, growth, trends
Multiple Chart
BCG
Saved
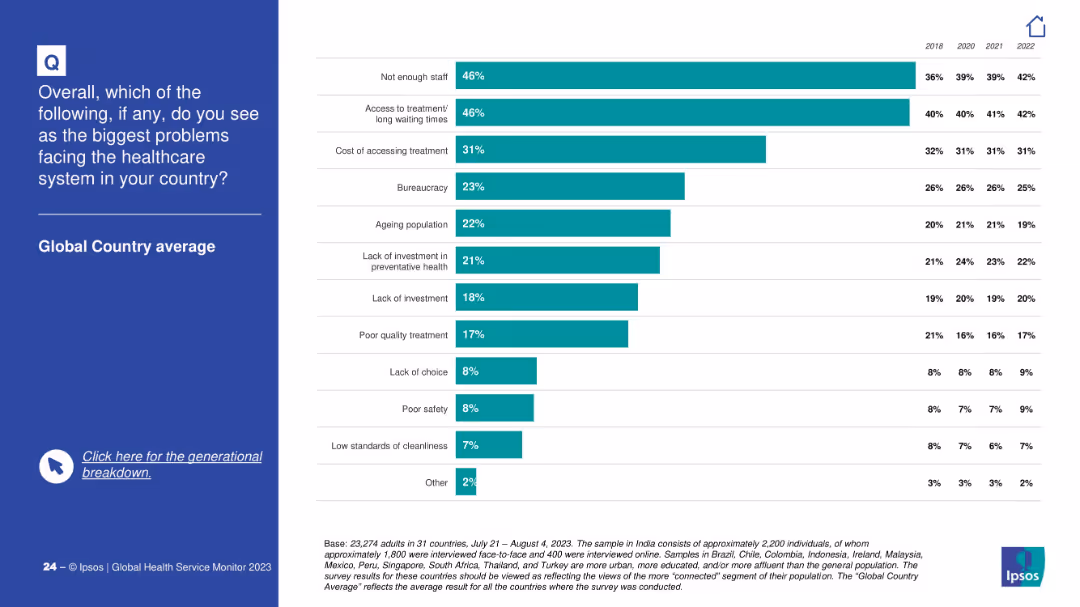
Split screen layout; left panel with question in white text on blue background; right panel has horizontal bar chart.
Market Analysis and Trends
Healthcare & Pharmaceuticals
This slide presents a global average ranking of the top perceived healthcare system problems, with "Not enough staff" and "Access to treatment/long waiting times" each cited by 46% of respondents. The chart tracks trends from 2018–2022.
healthcare, staffing, waiting times, costs, survey
Mixed Chart
IPSOS
Saved
Previous
Next
If nothing, comes up, please save your slides first
Create a FREE account to continue browsing
Receive Instant Access to 1,000+ slides from companies like McKinsey, Google, and Goldman Sachs
First Name
Last Name
Email
Password
I agree to all
Terms & Privacy Policy
Thank you! Your submission has been received!
Oops! Something went wrong while submitting the form.
Have an account?
Sign in
Column Chart
Heatmap
Chevron
Org Chart
Infographic
Callouts
Timeline
List
Graphic
Picture
Process Flow
Diagram
Paragraph
Map
Table
Framework
Subtitle
Takeaway Box
Icon
Other Chart
Radar Chart
Waterfall Chart
Mekko Chart
Pie Chart
Scatter Plot
Line Chart
Bar chart
Bullet points