My Account
My Slides
Search by Category
Templates
View All Templates
Download Template Slides
✦ AI Search
Feedback
Login
Logout
Get Started
Browse all Slides
Browse all Slides
Create a FREE Account
Instant access to 1,000+ real slides from top companies like McKinsey, BCG, Goldman Sachs, Google and many more!
First Name
Last Name
Email
Password
I agree to all
Terms & Privacy Policy
Thank you! Your submission has been received!
Oops! Something went wrong while submitting the form.
Have an account?
Sign in
Saved Slides
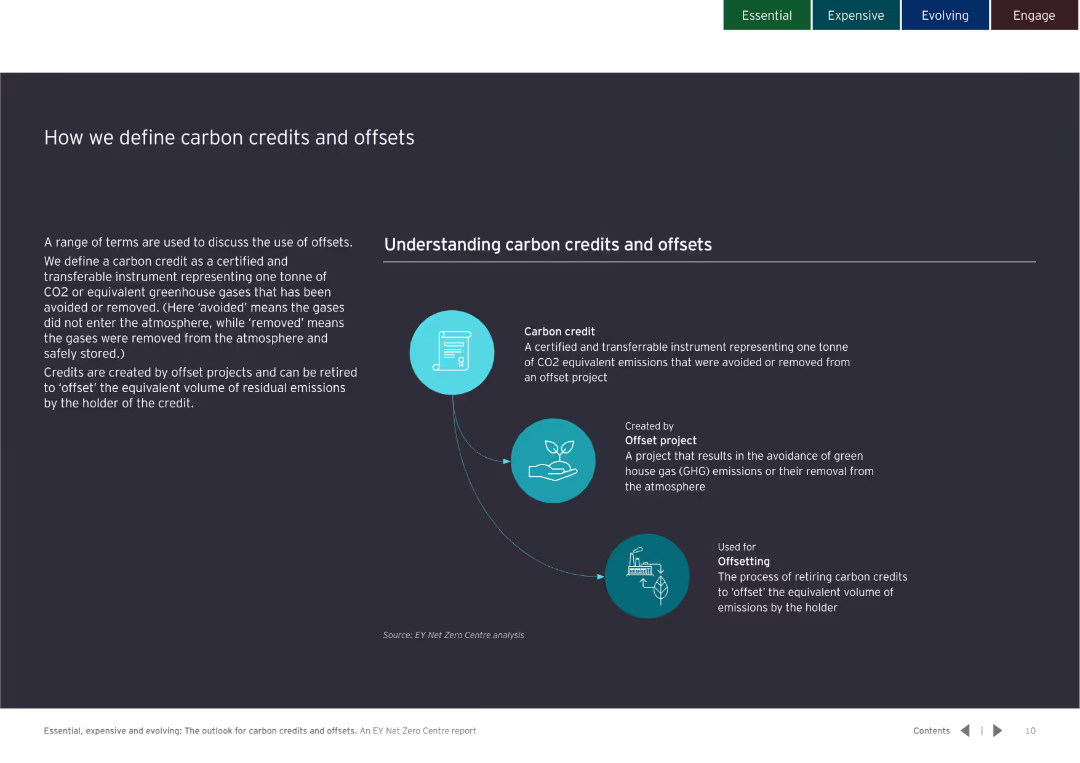
Contains detailed text definitions and an infographic explaining carbon credits and offsets, including creation and use.
Regulatory and Compliance
Environmental Services & Sustainability
Defines carbon credits as instruments for avoided or removed CO2 emissions, explaining their creation through offset projects and usage in emission reductions.
Carbon, credit, offset, definition, regulation, compliance, CO2, emissions, reduction
Diagram
EY
Saved
Three columns outlining global scale and market leadership, deep client franchise, and highly skilled talent.
Market Analysis and Trends
Financial Services
Highlights Credit Suisse’s position as a top wealth manager, focusing on market leadership and client engagement.
wealth management, global scale, client franchise, market leadership, skilled talent
Pillar
Credit Suisse
Saved
The slide shows a column chart for full-year revenue trend and detailed points for 2024 revenue drivers.
Strategic Planning
Financial Services
The slide outlines the revenue outlook for 2024, discussing expected revenue trends and key drivers influencing financial performance.
Revenue, Outlook, 2024, Drivers, Strategic, Planning, Financial, Trends, Forecast, Analysis
Mixed Chart
Citigroup
Saved
Pie chart illustrating the proportion of respondents saving for children's education pre-COVID-19, during, and the continuation post-pandemic. Dense text at the top explains the context.
Market Analysis and Trends
Financial Services
The slide shows the percentage of Canadian investors saving for their children's education before and during the COVID-19 pandemic. It indicates that a significant majority continued to save for this goal even during the pandemic.
Children's Education, Savings, COVID-19, Canadian, Pandemic
Multiple Chart
IPSOS
Saved
Multiple line charts display Y/Y growth in four hydraulic markets: Industrial Machinery, Construction Equipment, Farm Machinery, Truck & Bus from 2012 to 2019.
Market Analysis and Trends
Industrial & Manufacturing
Analyzes yearly growth rates across several hydraulic markets, showing trends over time, useful for market analysis and understanding sector health.
hydraulics, industrial, construction, machinery, growth
Single Chart
Deutsche Bank
Saved
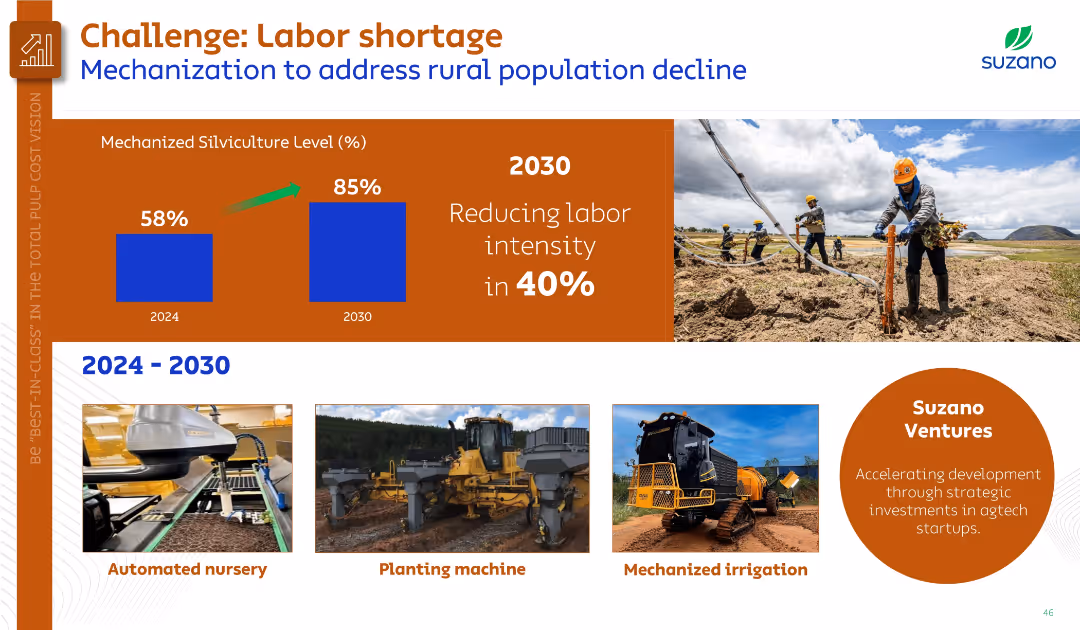
Combination of bar chart (mechanization levels), text, and images of mechanized equipment and planting.
Human Resources and Talent Management
Agriculture & Food Production
Addresses the impact of rural labor shortages on silviculture operations, proposing increased mechanization from 58% to 85% by 2030. Shows equipment like automated nurseries and planting machines along with Suzano Ventures’ agtech focus.
labor shortage, mechanization, silviculture, agtech, Suzano Ventures
Mixed Chart
Goldman Sachs
Saved
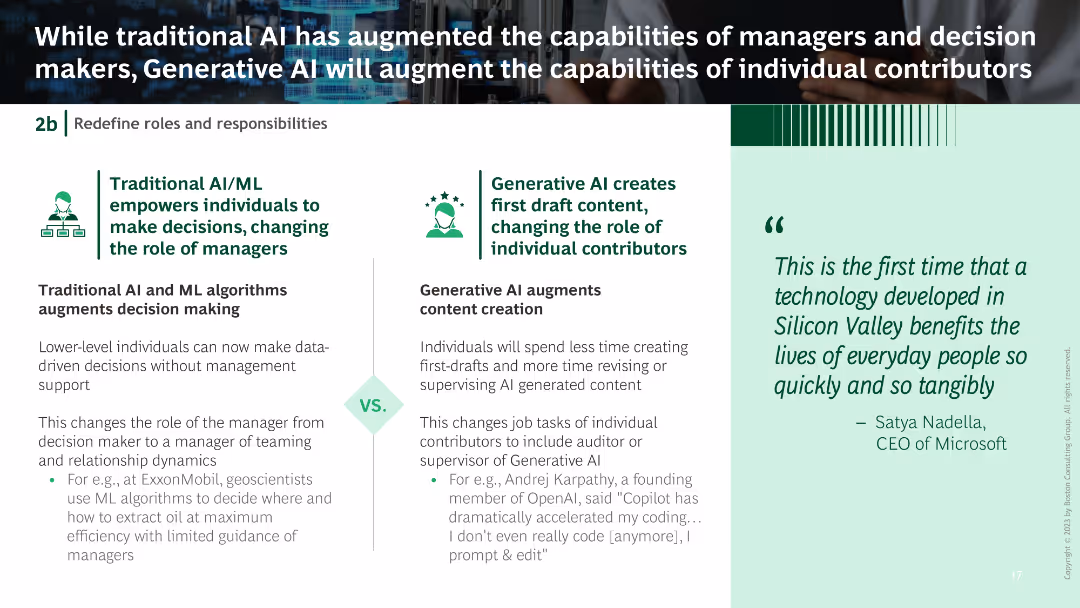
Split into two sections: Traditional AI/ML on the left with text and an icon, Generative AI on the right with text and an icon.
Operational Efficiency
Technology & Software
The slide contrasts traditional AI/ML roles with generative AI, highlighting changes in roles from decision-making to content creation.
traditional AI, generative AI, decision making, content creation, role changes
Boxed
BCG
Saved
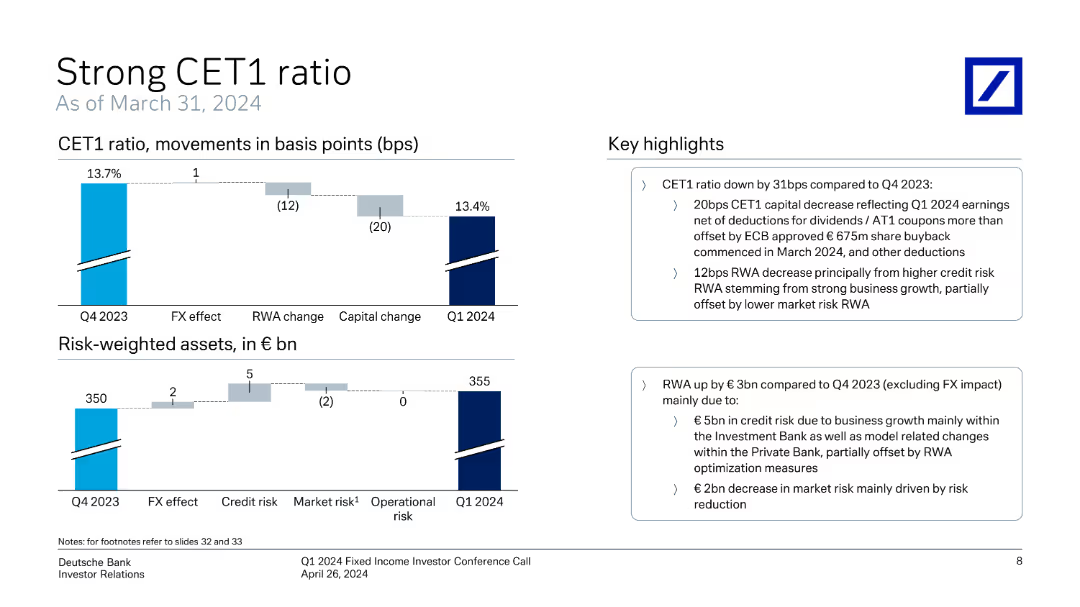
The slide includes vertical column charts displaying CET1 ratio movements and risk-weighted assets over time, accompanied by key highlights.
Financial Performance
Financial Services
The slide highlights Deutsche Bank's CET1 ratio and risk-weighted asset trends, showing changes and factors affecting these metrics from Q4 2023 to Q1 2024.
CET1 ratio, risk-weighted assets, financial metrics, Deutsche Bank, Q1 2024, investor relations, capital adequacy, regulatory requirements, financial health
Multiple Chart
Deutsche Bank
Saved
Consists of multiple line and column charts analyzing the seasonal variations in dry bulk freight rates and the factors influencing these rates.
Market Analysis and Trends
Transportation & Logistics
Evaluates the seasonal fluctuations in dry bulk freight rates, identifying external influences like maintenance schedules and new vessel deliveries.
freight rates, dry bulk, market trends, seasonal variations, economic impact
Multiple Chart
Deutsche Bank
Saved
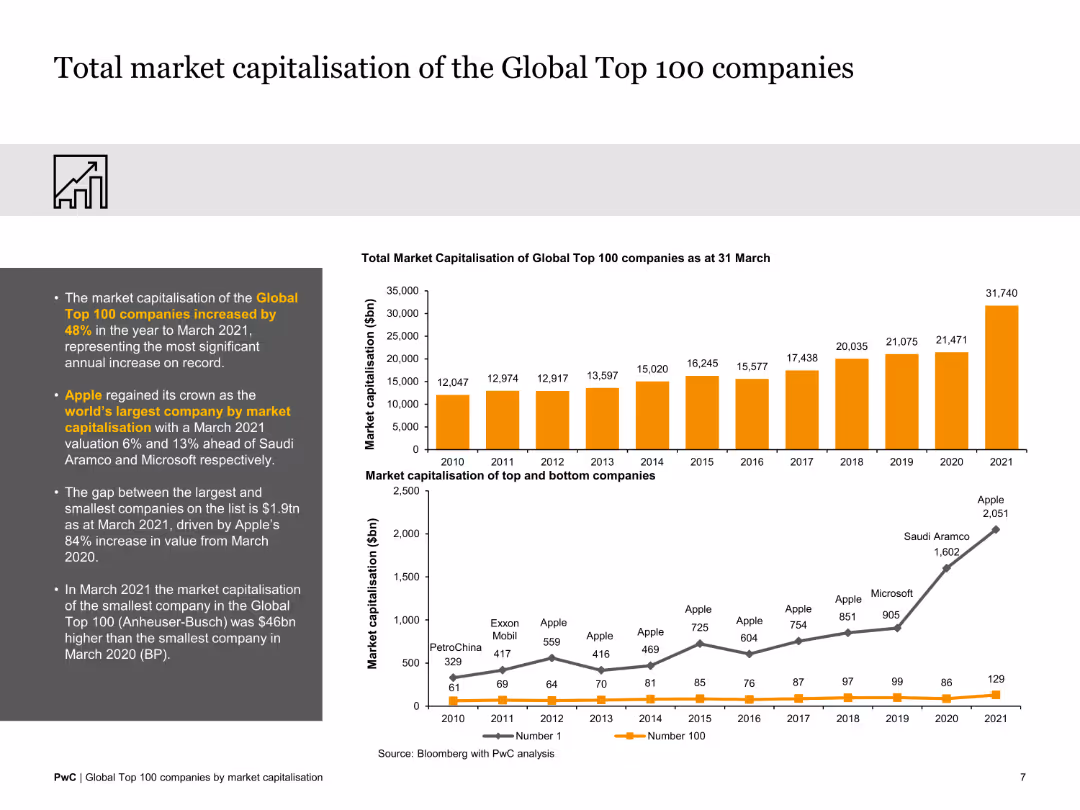
The slide contains two column charts showing total market capitalization data over the years, with text explanations on the side. The design is clear and data-centric.
Market Analysis and Trends
Financial Services
This slide highlights the market capitalization growth of the top 100 companies from 2010 to 2021, emphasizing the significant increase observed in the recent years.
market capitalization, growth, top companies, data analysis, 2010-2021, financial trends
Multiple Chart
PwC/Strategy&
Saved
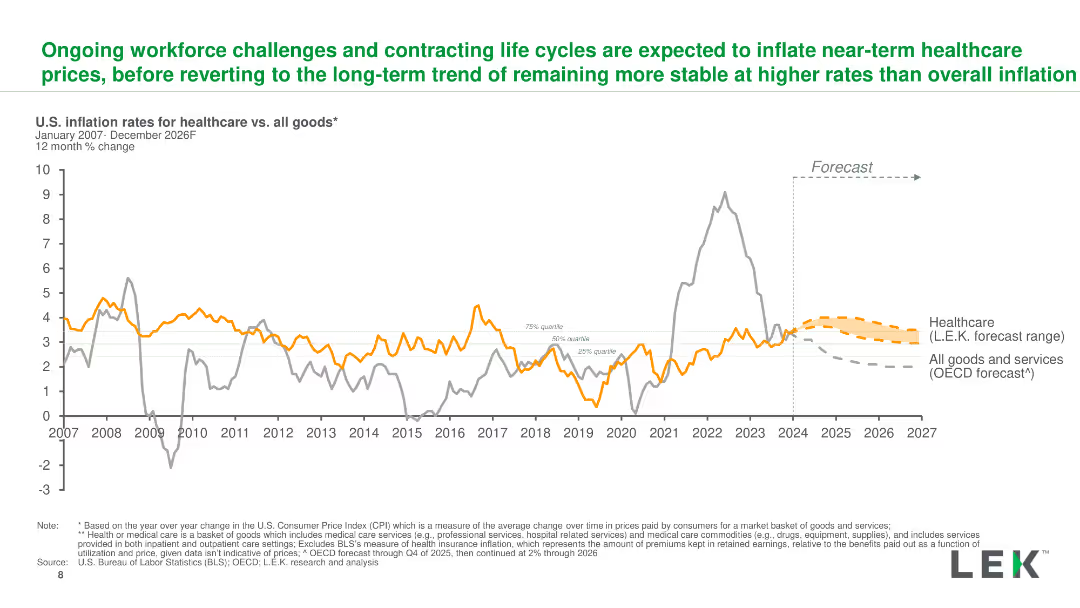
A line chart forecasting U.S. inflation rates for healthcare and all goods from 2024 to 2026, with historical data from 2007 and projections clearly marked.
Risk Assessment and Management
Healthcare & Pharmaceuticals
The slide forecasts healthcare inflation, highlighting the impact of workforce challenges and the expected stabilization of rates compared to overall inflation.
healthcare, inflation, forecast, workforce, trends
Single Chart
LEK
Saved
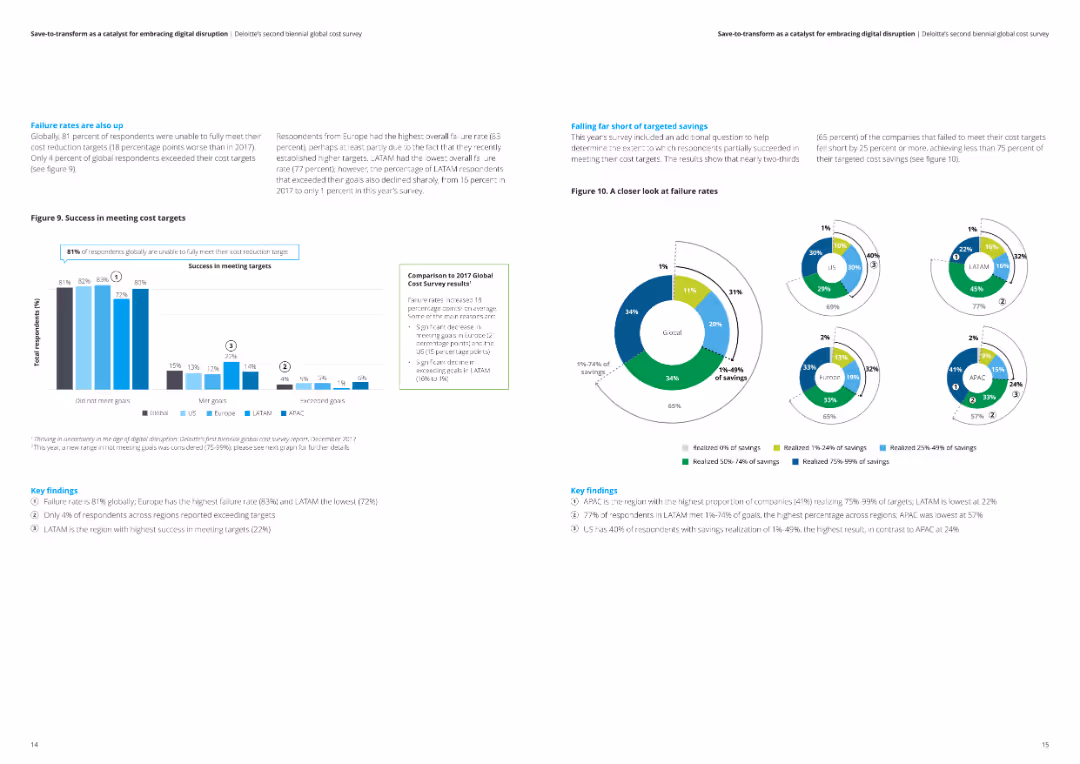
The slide features two column charts comparing past and expected future revenue performance. It includes detailed analysis and key findings on growth expectations across different regions, along with a summary of external risks impacting revenue.
Performance Metrics and KPIs
Professional Services
This slide compares past revenue performance with future expectations, highlighting growth trends and external risks. It includes data and key findings from Deloitte's survey, focusing on how different regions expect their revenue to change over the next 24 months.
revenue performance, expectations, growth, external risks, Deloitte
Multiple Chart
Deloitte
Saved
The slide is divided into sections detailing objectives, policy change propositions, and focuses on the European Union. Includes a map and objectives for decarbonizing various sectors.
Regulatory and Compliance
Government & Public Sector
Discusses the HyLaw initiative launched by Hydrogen Europe to identify and address legal barriers to hydrogen deployment, focusing on policy changes and integration in the EU.
Hydrogen Europe, HyLaw, legal barriers, policy changes, EU, decarbonization, integration, objectives
Table
Kearney
Saved
Contains multiple column charts comparing the market share of different retail channels for luxury goods from 2014 to 2025, with an emphasis on the growth of online sales.
Technology and Digital Transformation
Retail & E-commerce
Analyzes the trend towards online shopping for luxury goods, projecting significant growth and integration with physical retail channels by 2025. Discusses how technology will enhance shopping experiences.
Online Shopping, Luxury Goods, Market Trends, Growth
Mixed Chart
Bain
Saved
Features a column chart showing the trends in global M&A volumes from 2002-2018 and a circular diagram depicting the expectations of organizations regarding the number of deals in the next 12 months, split by 2018 and 2019 data.
Mergers and Acquisitions
Financial Services
Summarizes global M&A trends, highlighting the increase in transaction volumes over time and the anticipations for future deals. It provides a historical context to understand the growing significance of M&A activities.
M&A, Trends, Global, Future, Deals, Volumes, Growth, Expectations
Multiple Chart
Deloitte
Saved
Slide includes a detailed bar chart and breakdown of costs in a layered structure, using shades of blue to differentiate elements. It combines graphical data presentation with textual highlights to emphasize key points.
Operational Efficiency
Financial Services
Provides a detailed breakdown of Deutsche Bank's adjusted costs for Q2 2023, highlighting changes from the previous year and factors influencing cost trends, such as investments and efficiency initiatives.
adjusted costs, financial analysis, cost trends, Q2 2023
Mixed Chart
Deutsche Bank
Saved
Moderate visual complexity with a combination of text and infographic elements. The slide provides insights into common themes and strengths across leading companies in the process automation space.
Technology and Digital Transformation
Industrial & Manufacturing
This slide identifies the common strengths among leading companies in the process automation sector, highlighting key areas such as innovation, technology, product offerings, and market positions. It also discusses the role of process automation in addressing megatrends and the increasing demand for connected, software-enabled products in the global market.
Process automation, Industry analysis, Company strengths, Market trends
Boxed
LEK
Saved
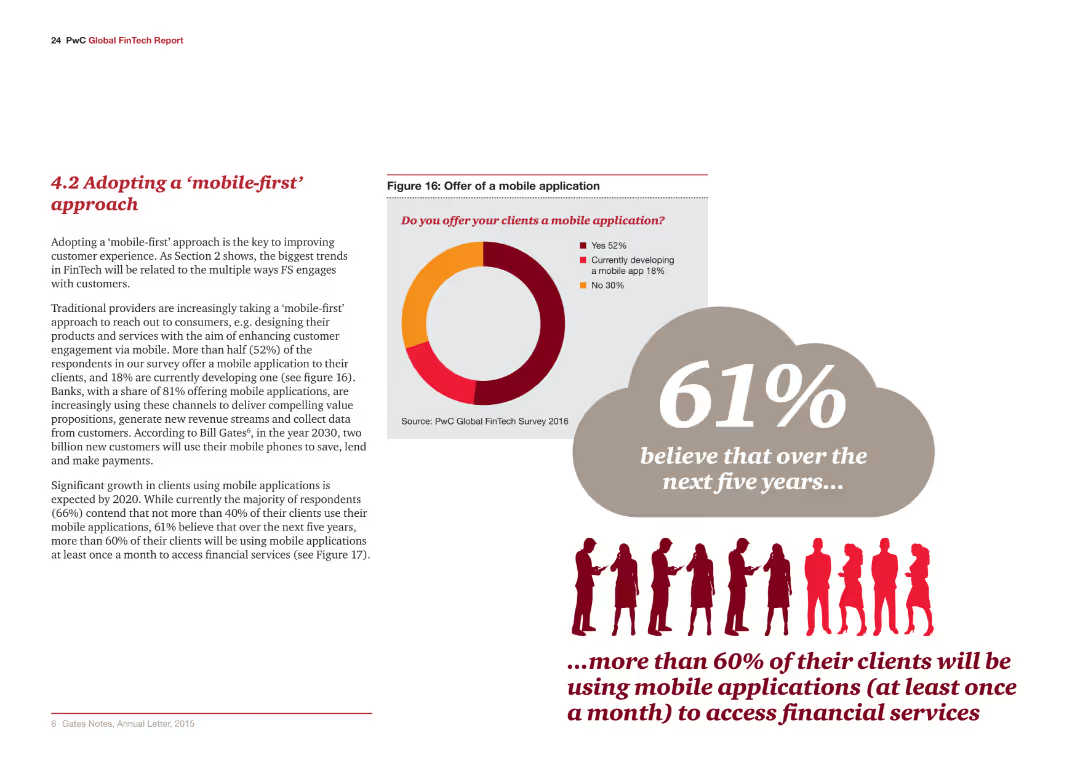
The slide includes a pie chart and text. The chart indicates trends and statistics on mobile application adoption among clients.
Technology and Digital Transformation
Financial Services
The slide discusses the anticipated growth in mobile application usage and its impact on financial services by 2020.
Mobile-first, trends, financial services, mobile applications, technology
Mixed Chart
PwC/Strategy&
Saved
The slide features a column chart and lists safety and performance issues related to hydrogen injection potential. It is moderately detailed with clear safety metrics.
Technology and Digital Transformation
Energy & Utilities
Addresses the limitations and potential of hydrogen injection into gas networks, focusing on safety, performance, and end-use applications.
hydrogen injection, safety, performance, gas networks, limitations, end applications, potential, transformation
Mixed Chart
Kearney
Saved
Slide presents three columns titled Environment, Social, Governance each with icons and associated initiatives, emphasizing Barclays' achievements and goals in ESG.
Strategic Planning
Financial Services
Highlights Barclays' ESG strategies and achievements, recognizing its status as the Best Bank for ESG in the UK by Euromoney, with detailed descriptions of initiatives across all ESG dimensions.
ESG, best practices, governance, social responsibility, environmental policy, awards
Pillar
Barclays
Saved
Consists of multiple bar charts comparing factors influencing employee turnover.
Human Resources and Talent Management
Professional Services
Offers insights into the drivers of employee turnover, valuable for developing effective retention strategies.
Employee Turnover, Retention Strategies, Job Satisfaction, HR Management, Workforce Analysis
Single Chart
PwC/Strategy&
Saved
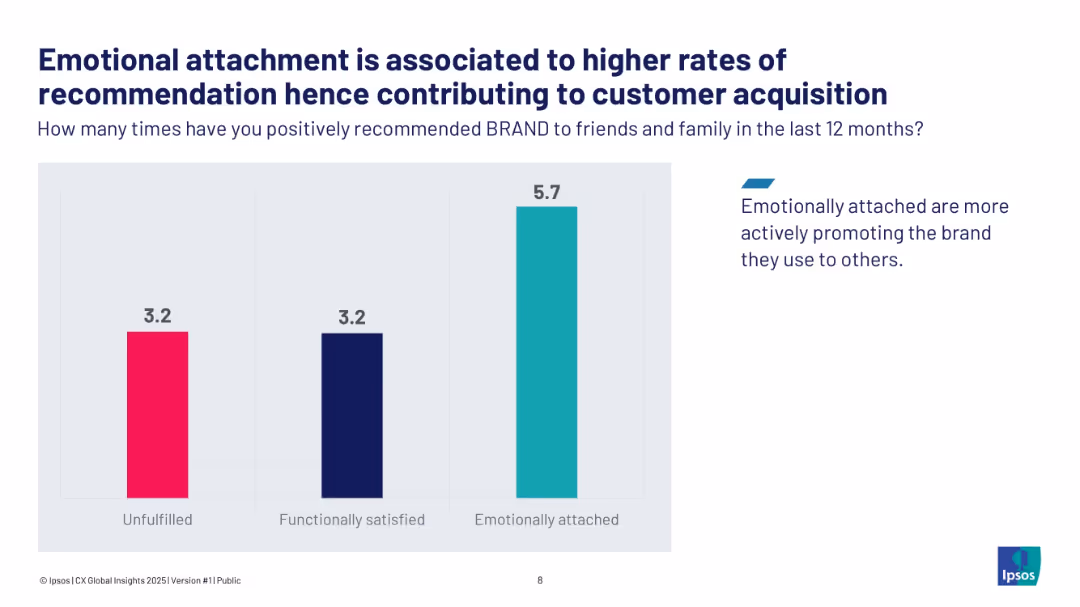
Vertical bar chart comparing unfulfilled, functionally satisfied, and emotionally attached brand recommend rates.
Customer and Market Segmentation
Consumer Goods
The slide illustrates how emotional brand attachment drives more positive customer recommendations, with emotionally attached customers recommending 5.7 times vs. 3.2 for others. This emotional engagement enhances acquisition through advocacy.
brand loyalty, emotional attachment, customer acquisition, advocacy
Single Chart
IPSOS
Saved
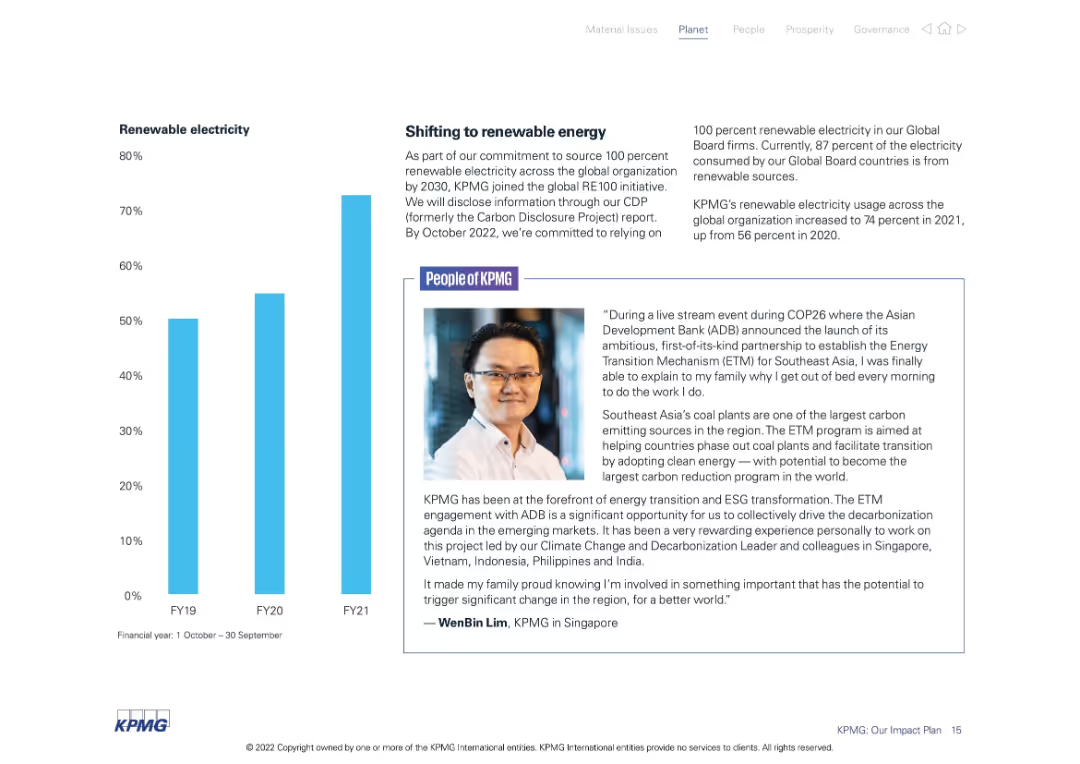
Dual-section layout with a bar chart on the left showing growth in renewable electricity usage (FY19–FY21) and a testimonial on the right. Visuals use clean white and blue tones.
Operational Efficiency
Environmental Services & Sustainability
Illustrates KPMG’s shift toward renewable electricity with a steady increase from 56% in 2020 to 74% in 2021. Also includes a personal account from a team member about the impact of ESG initiatives in Southeast Asia.
renewable electricity, ESG, sustainability, KPMG, energy transition, FY21, Southeast Asia
Mixed Chart
KPMG
Saved
A comparative slide with six pie charts representing different geographical regions and industries. Each pie chart shows the distribution of Champions, Leaders, Strivers, and Traditionalists.
Market Analysis and Trends
Professional Services
This slide presents the distribution of service player categories across different geographical regions and industries, highlighting the diversity in service management maturity.
geography, industry, Champions, Leaders, Strivers, Traditionalists
Multiple Chart
Accenture
Saved
This Text and Image Slide presents three sections titled 'PEOPLE', 'PROFIT', and 'PLANET' each with a dedicated icon and bullet points. It's well-organized, with a clear visual hierarchy that guides the viewer through each section. The use of icons and strategic spacing of content facilitates comprehension and provides an engaging visual experience.
Strategic Planning
Professional Services
The slide outlines Michelin's commitment to enhancing performance in three areas: people, profit, and the planet. It discusses career opportunities, engagement and safety in 'PEOPLE', revenue growth and financial metrics in 'PROFIT', and sustainability efforts in 'PLANET'. The slide effectively conveys Michelin's integrated approach to success, balancing human, financial, and environmental considerations.
performance, people, profit, planet, opportunities, growth, sustainability, R&D, materials, safety
Pillar
Morgan Stanley
Saved
Previous
Next
If nothing, comes up, please save your slides first
Create a FREE account to continue browsing
Receive Instant Access to 1,000+ slides from companies like McKinsey, Google, and Goldman Sachs
First Name
Last Name
Email
Password
I agree to all
Terms & Privacy Policy
Thank you! Your submission has been received!
Oops! Something went wrong while submitting the form.
Have an account?
Sign in
Column Chart
Heatmap
Chevron
Org Chart
Infographic
Callouts
Timeline
List
Graphic
Picture
Process Flow
Diagram
Paragraph
Map
Table
Framework
Subtitle
Takeaway Box
Icon
Other Chart
Radar Chart
Waterfall Chart
Mekko Chart
Pie Chart
Scatter Plot
Line Chart
Bar chart
Bullet points